


Abstract
Nickel has become a strategic mineral for the energy transition, yet its supply chain is increasingly shaped by a compound risk regime involving resource nationalism, processing concentration, geopolitical compliance rules, carbon-footprint requirements, and commodity-market volatility. This study develops NiChain-LLM-ABM, a large-language-model-empowered agent-based model for simulating nickel supply chain resilience under semantically rich policy shocks. The framework uses a policy semantic parsing module to transform official policy texts into structured shock parameters, a multi-agent strategy generation module to represent adaptive decisions by seven agent classes, a calibrated supply chain network module to simulate material, financial, and information flows, and a four-dimensional resilience assessment module. The model is anchored in observed nickel production, price, trade, and technology data from USGS, IEA, UN Comtrade, LME, and official legal sources, and its scenario outputs are generated through 100 Monte Carlo replications over 2025–2035. Results show that the baseline Comprehensive Resilience Index (CRI) declines from 0.620 in 2025 to 0.547 in 2035. Indonesian policy tightening causes the sharpest near-term deterioration, with CRI falling to 0.445 in 2028 and the simulated supply deficit reaching 24.5 kt Ni equivalent. A geopolitical compliance shock produces the lowest terminal resilience (CRI = 0.472 in 2035). A green-compliance scenario is disruptive in the short run but exceeds the baseline by 2035, while a coordinated policy portfolio raises the terminal CRI to 0.744, a 36.0% improvement over the baseline. Compared with a conventional rule-based ABM, the LLM-ABM reduces extreme-event backcasting error by 57%, improves policy-response fidelity by 53%, and more than doubles agent heterogeneity differentiation. The results support portfolio-based critical-mineral governance combining strategic reserves, overseas equity investment, recycling, technology substitution, and international cooperation.
1. Introduction
The strategic role of nickel has changed rapidly as electrification and battery manufacturing have expanded. Nickel remains indispensable for stainless steel, superalloys, electroplating, and specialty chemical uses, but the marginal demand pressure increasingly comes from high-energy-density lithium-ion battery chemistries such as NCM (nickel–cobalt–manganese) and NCA (nickel–cobalt–aluminum). The International Energy Agency reported that electric car sales exceeded 17 million units globally in 2024 and reached more than 20% of new car sales [1,2]. In the same year, demand for nickel, cobalt, graphite, and rare earth elements increased by 6–8%, mainly because of energy applications including electric vehicles, battery storage, renewables, and power networks [3]. This demand shift has turned nickel from a conventional industrial metal into a strategic input for energy security and industrial policy.
The supply side is equally important. USGS Mineral Commodity Summaries 2026 estimates that global nickel mine production increased to approximately 3.9 Mt in 2025, with Indonesia contributing 2.6 Mt, or about two-thirds of the world total [1,4]. This concentration is the outcome of geological endowment, large laterite resources, and a deliberate downstreaming strategy. Indonesia progressively restricted nickel ore exports through policy measures adopted between 2009 and 2019, and unprocessed ore exports have been fully banned since January 2020 [5,6]. The policy accelerated domestic smelting and HPAL (high-pressure acid leach) investment, but it also shifted global supply security risk from simple geological availability to processing location, ownership, financing, environmental compliance, and market-access rules.
Recent policy developments have made this risk structure more complex. The EU Critical Raw Materials Act sets 2030 strategic benchmarks for extraction, processing, recycling, and import diversification, including a goal that no single third country should provide more than 65% of the Union’s supply of a strategic raw material [7]. The United States’ clean-vehicle credit rules add foreign-entity-of-concern restrictions for battery components from 2024 and applicable critical minerals from 2025 [8,9]. The EU Battery Regulation requires carbon-footprint disclosure, performance, durability, and due-diligence obligations across battery value chains [10]. The EU Carbon Border Adjustment Mechanism entered its definitive phase in 2026 for selected sectors; nickel is not in the initial CBAM product scope, but CBAM-style carbon accounting and battery carbon-footprint rules create an adjacent compliance pressure on nickel-containing battery materials and stainless steel supply chains [11].
Market microstructure risks add a further layer. The March 2022 LME nickel event demonstrated that supply anxiety, concentrated positions, low inventory, and clearing-house stress can generate extreme price dynamics [12,13]. The LME suspended nickel trading on 8 March 2022, and independent reviews identified unprecedented price movement and deficiencies in the monitoring of over-the-counter exposure [14,15]. In contrast, USGS reported that the global primary nickel market was in surplus during 2022–2025, showing that physical abundance at the aggregate level does not eliminate supply chain vulnerability when production, processing, compliance, and financial exposures are concentrated [1].
Existing critical-mineral assessments have made substantial progress in quantifying supply risk, economic importance, substitutability, and environmental pressures [16,17,18]. However, many tools remain static. They can identify that a system is concentrated, but they are less able to simulate how governments, mining firms, smelters, battery manufacturers, traders, and recycling firms learn from a new policy text and alter their strategies over time. Conventional agent-based models improve on static indices by representing heterogeneous actors and nonlinear interactions, yet their behavioral rules are often hard-coded as threshold triggers. This is problematic for contemporary mineral governance because policy shocks are semantically rich: a regulation may affect quotas, certification, ownership, carbon disclosure, subsidy eligibility, and investment timing simultaneously.
This paper addresses this methodological gap by developing NiChain-LLM-ABM, a large-language-model-empowered agent-based simulation framework for nickel supply chain resilience. The LLM is not used as an unconstrained numerical oracle. Instead, it performs policy semantic parsing and agent-specific strategy generation under a controlled prompt and validation protocol. Numerical transitions remain governed by calibrated equations, observed data, and Monte Carlo simulation. The study asks four research questions: (1) how do heterogeneous agents adapt to nickel supply chain policy shocks; (2) how do export restrictions, geopolitical compliance rules, and carbon-footprint requirements propagate through prices, supply gaps, investment, and trade networks; (3) whether LLM-augmented agents outperform rule-based agents in extreme-event and policy-response backcasting; and (4) which policy portfolio most improves resilience for an import-dependent economy such as China.
2. Literature Review and Conceptual Framework
2.1. Critical-Mineral Risk and Nickel Supply Chains
Criticality research has converged on the insight that material risk is multidimensional. Graedel et al. formalized metal criticality by combining supply risk, environmental implications, and vulnerability to supply restriction [16]. Nassar et al. emphasized by-product dependence and geopolitical concentration [17], while Schrijvers et al. showed that criticality assessments differ substantially depending on indicator choices, system boundaries, and policy objectives [18]. These contributions provide rigorous screening tools, but their indicator-based structure is less suitable for representing adaptive behavior after a regulation, tax, or market shock changes the incentives of specific actors.
Beyond supply-side criticality, a parallel body of work situates mining and metals within broader sustainability and governance pressures that are central to a study linking nickel, carbon constraints, and resilience. Tost et al. quantified the environmental pressures of metal mining, providing updated estimates of CO2 emissions, water use, and land requirements, and thereby establishing the environmental-systems foundation on which green-compliance shocks to nickel processing operate [19]. The credibility of any policy-oriented simulation also depends on a defensible verification logic; Hitch and Li develop a verification framework for carbon sequestration through mineral carbonation of mine tailings, illustrating the measurement and validation standards that simulation-based mineral-transition analysis should aspire to and that motivate our explicit backcasting, prompt-sensitivity, and audit-trail protocols [20]. Finally, the compliance shocks examined here are not only technical but normative: Kügel et al. analyze responsible sourcing for energy transitions through the lens of natural-resource justice, clarifying that FEOC-style and CRMA-style rules embed contested governance and equity claims rather than neutral technical thresholds [21]. Engaging these strands grounds the present model’s treatment of carbon-footprint pressure and geopolitical compliance in the empirical and conceptual foundations of mining sustainability and resource governance, and reinforces Schrijvers et al.’s point that static criticality assessments are insufficient once indicators, boundaries, and purpose vary across actors and jurisdictions [18].
Nickel-specific studies highlight the interaction between battery demand and processing constraints. Olivetti et al. examined bottlenecks in lithium-ion battery supply chains [22], Watari et al. analyzed long-term metal requirements under low-carbon scenarios [23], and Mudd et al. discussed geological resource adequacy and the importance of processing capacity [24]. More recent policy analyses of Indonesia emphasize that ore export restrictions and domestic processing obligations have shifted value-chain governance rather than merely reducing trade volume [5,6]. These studies motivate a dynamic model in which policy power, industrial investment, and technology choice co-evolve.
2.2. Supply Chain Resilience and Complex Adaptive Systems
Supply chain resilience research distinguishes between absorbing a shock, adapting during disruption, and recovering or reconstructing the network after disruption. Sheffi framed resilience as the capacity to survive and recover from vulnerability [25]. Christopher and Peck emphasized flexibility, redundancy, visibility, and collaboration [26], and Ponomarov and Holcomb defined resilience as adaptive capability and recovery after unexpected events [27]. In material supply chains, Sprecher et al. developed resilience metrics for rare earths after the 2010 crisis [28]. For nickel, resilience cannot be reduced to inventory alone. It depends on the substitutability of supply routes, technology transitions between RKEF and HPAL, recycling lag, long-term contract coverage, policy reserves, and the credibility of international cooperation.
A nickel supply chain is a complex adaptive system. Multiple agents pursue different objectives under incomplete information; local decisions aggregate into emergent price, inventory, trade, and investment patterns; and feedback loops connect market outcomes to new policy actions [29]. Agent-based modeling is therefore appropriate, because ABM can represent heterogeneous actors, local decision rules, network topology, and emergent system outcomes [30,31,32,33]. However, ABM requires careful behavioral specification. Fixed if–then rules are transparent but often fail when agents confront policy texts and novel scenarios not anticipated by the modeler.
2.3. LLM-Empowered Simulation and Research Gap
Large language models have recently been introduced into agent-based simulation to improve perception, reasoning, planning, and natural-language interaction. Generative agents demonstrate that LLM-augmented agents can store memory, reflect, plan, and generate believable behavior in simulated environments [34]. Reviews of LLM-empowered ABM argue that LLMs can strengthen agent heterogeneity, action generation, and adaptive reasoning when they are integrated with explicit environment states and evaluation protocols [35,36]. For mineral supply chains, the potential value is not anthropomorphic realism but policy cognition: actors must interpret regulatory language, infer timelines and penalties, and adapt strategies when rules interact across jurisdictions [37,38,39].
The research gap is therefore specific. Critical-mineral risk models are often static; conventional ABMs often underrepresent semantic policy interpretation; and nickel studies rarely integrate Indonesian downstreaming, FEOC-style compliance, EU raw-material and battery rules, carbon-footprint pressure, price dynamics, recycling lag, and policy portfolio design in one reproducible framework. NiChain-LLM-ABM addresses this gap by connecting a policy semantic parsing layer to a calibrated ABM and a resilience assessment layer.
The choice of an LLM-augmented ABM over alternative methods is deliberate. System-dynamics models capture stocks, flows, and feedback well but assume a fixed, homogeneous causal structure and cannot represent heterogeneous, boundary-rational agents that reinterpret a new regulation differently according to ownership, technology route, and jurisdiction. Equilibrium or optimization models require strong rationality and common-knowledge assumptions that are implausible under ambiguous, multi-jurisdictional policy texts. A purely rule-based ABM is more transparent than our hybrid, and we retain it as the validation baseline; however, its hard-coded thresholds must be re-specified by the modeler for every new policy and cannot generalize to unscripted shocks—exactly the limitation the 2022 LME event exposes. The distinctive task here is semantic: a single regulation can simultaneously alter quotas, certification, ownership eligibility, carbon disclosure, and subsidy access, and the analytical value added is the agents’ interpretation of that text. An LLM layer is therefore not decorative but addresses the specific bottleneck—policy cognition—while the calibrated equations preserve the transparency and reproducibility that the rule-based tradition rightly prioritizes. Consistent with recent surveys of LLM-empowered ABM, we treat reproducibility, prompt sensitivity, and human validation as first-order design requirements rather than afterthoughts [35].
3. Materials and Methods
3.1. Data Sources and Empirical Anchors
The empirical foundation combines observed historical data, official policy texts, and simulated forward trajectories. Observed production and price anchors are drawn from USGS Mineral Commodity Summaries 2026, which provides 2021–2025 mine production by country, U.S. salient statistics, and LME average price data [1]. Demand and technology-transition context comes from the IEA Global EV Outlook 2025 and Global Critical Minerals Outlook 2025 [2,3]. Trade-flow calibration uses UN Comtrade bilateral nickel trade data for HS 2604, 7502, 7503, and selected intermediate nickel-bearing product codes [40]. Policy texts include Indonesia nickel export restrictions as summarized by IEA and USITC [5,6], Regulation (EU) 2024/1252 on critical raw materials [7,41], the U.S. Section 30D clean-vehicle FEOC rules [8,9], the EU Battery Regulation [10], EU CBAM implementation materials [11] and China mineral products import and export statistics [42]. Table 1 shows data sources, calibration variables, and model use.
Table 1.
Data sources, calibration variables, and model use.
3.2. Model Architecture
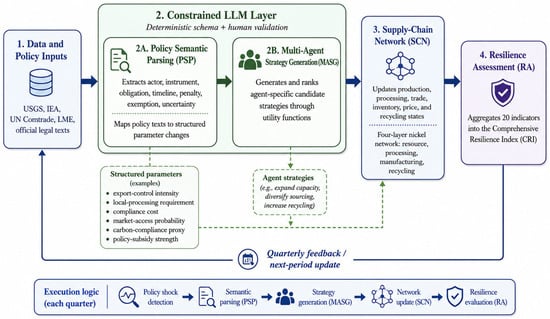
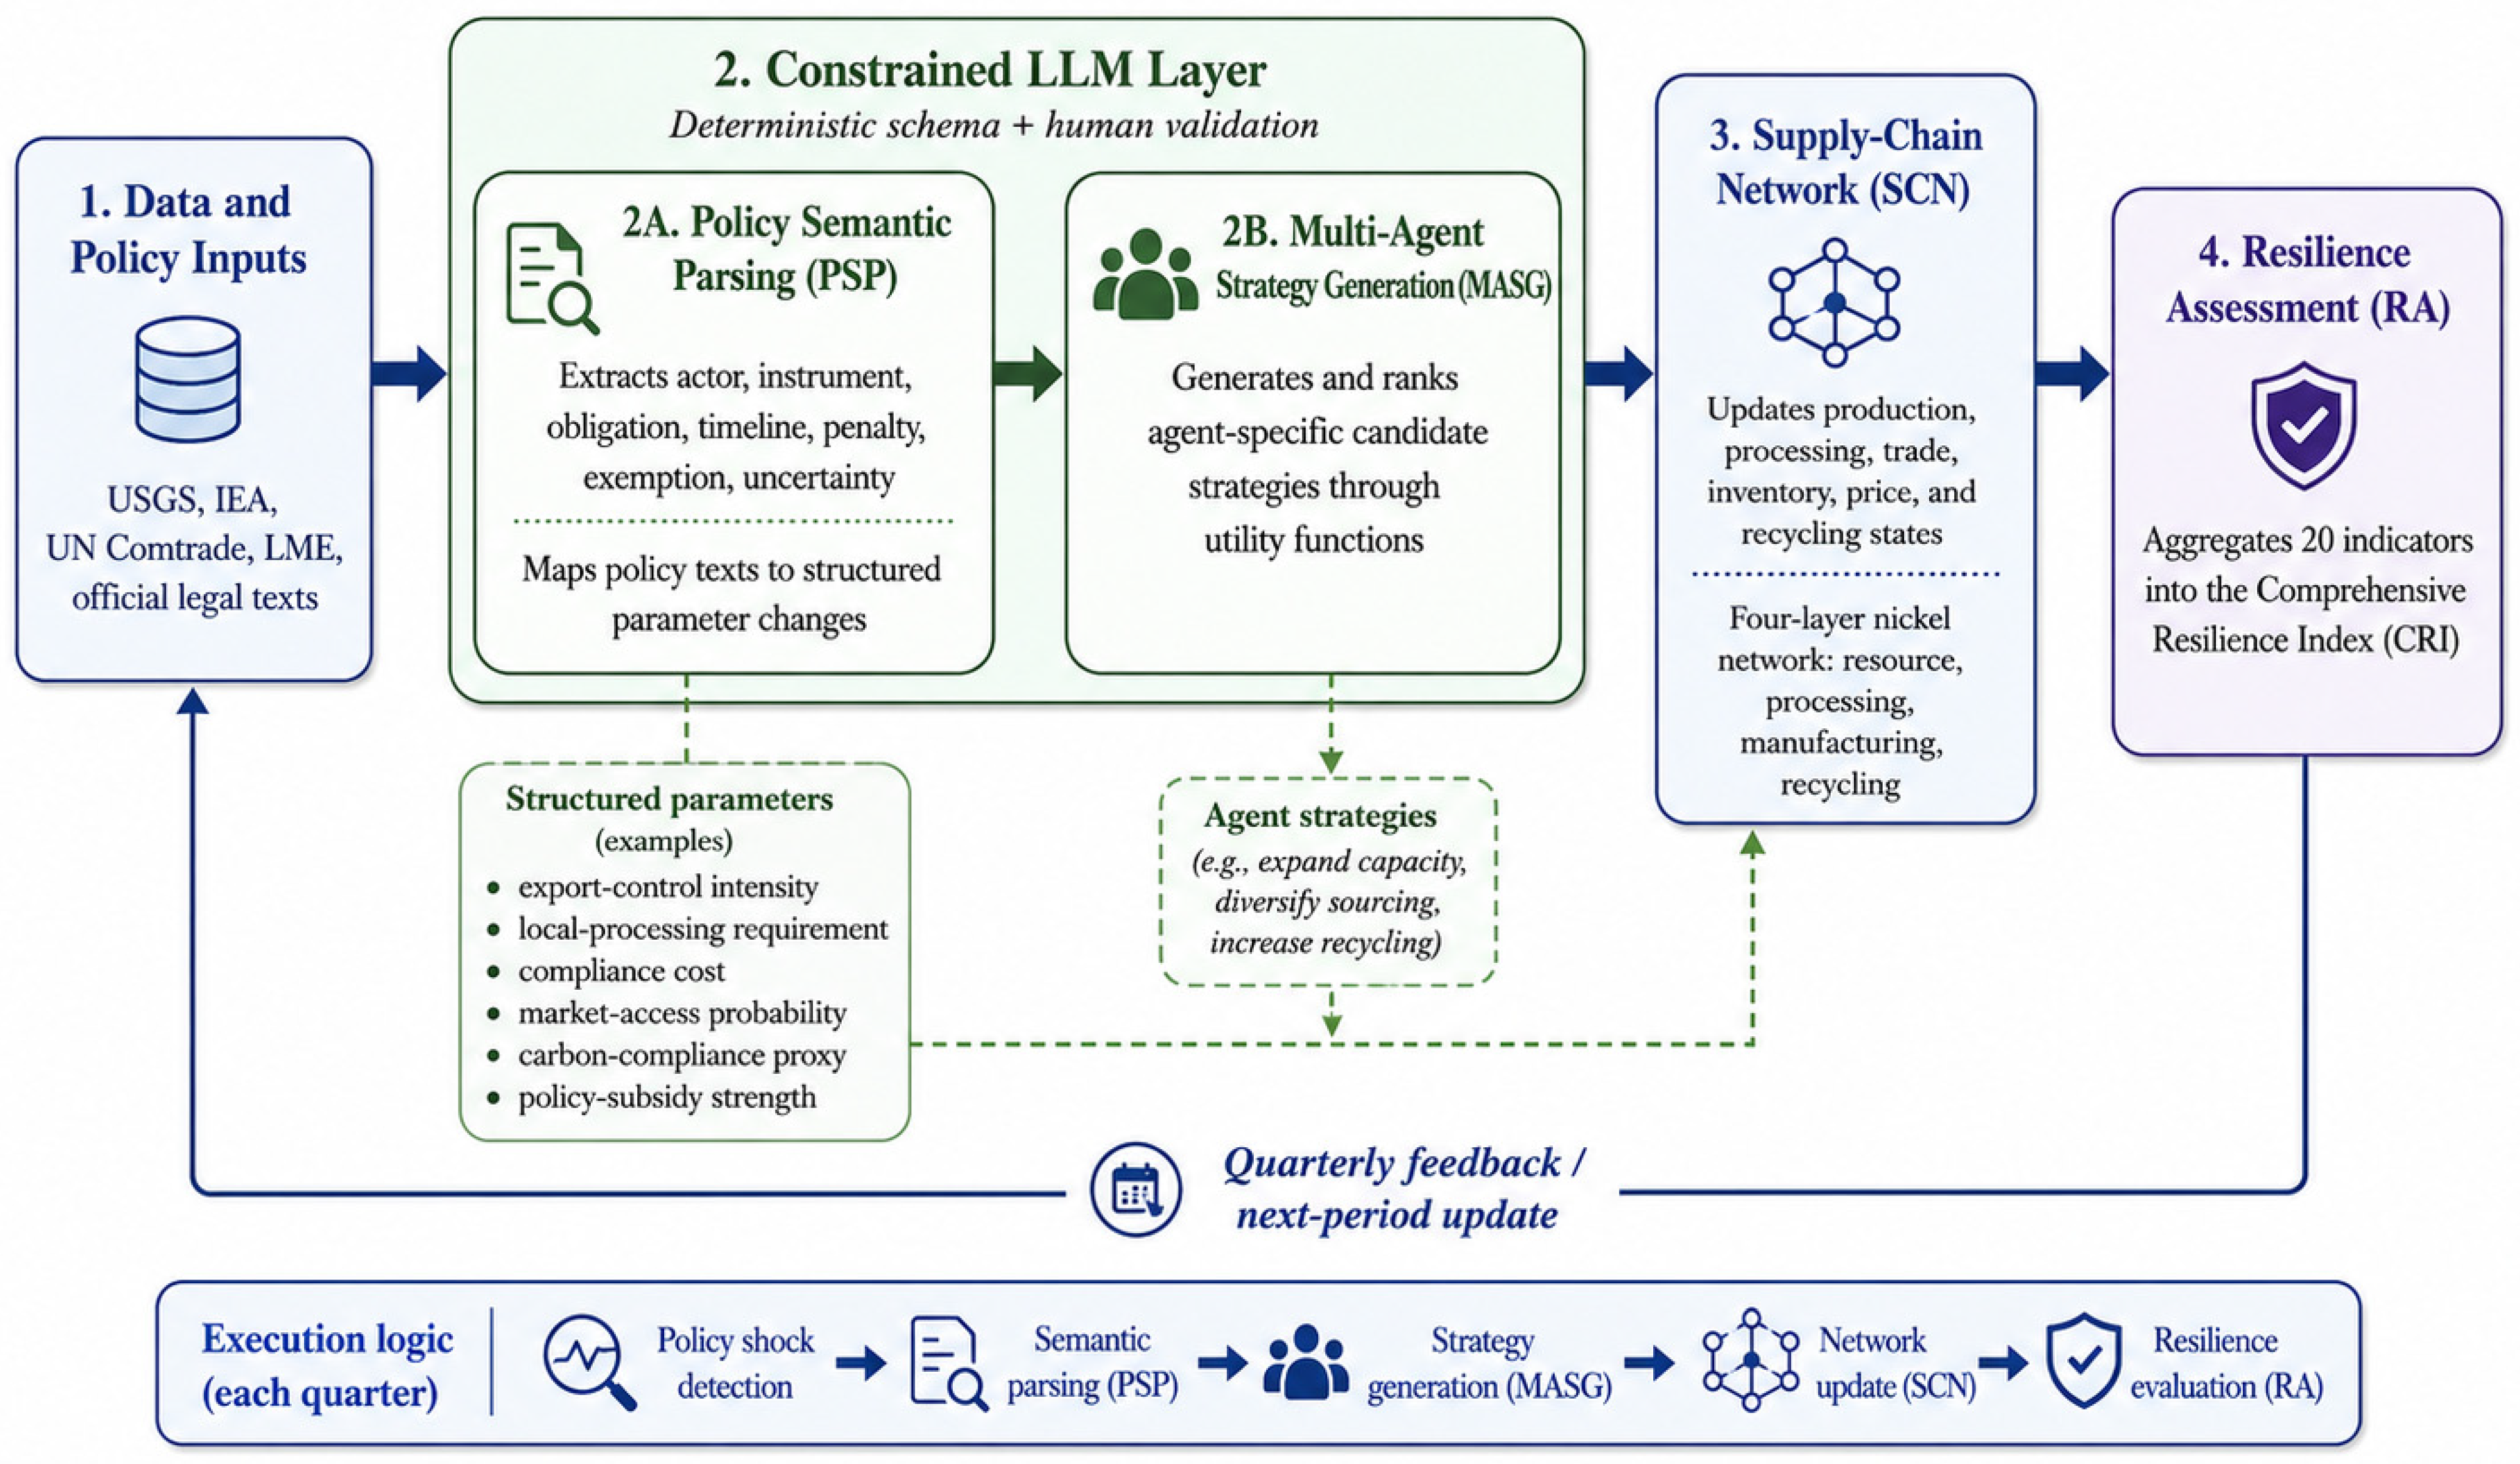
NiChain-LLM-ABM is a quarterly discrete-time model covering 2025Q1–2035Q4. It has four linked modules. The policy semantic parsing (PSP) module transforms policy text into structured model parameters. The multi-agent strategy generation (MASG) module produces agent-specific candidate strategies and ranks them through utility functions. The supply chain network (SCN) module updates production, processing, trade, inventory, price, and recycling states across a four-layer nickel network. The resilience assessment (RA) module aggregates 20 indicators into the Comprehensive Resilience Index.
The LLM layer is constrained by a deterministic schema, as shown in Figure 1. It extracts the policy actor, regulated behavior, instrument type, obligation, implementation timeline, penalty, exemption, and uncertainty flag. The extracted features are mapped to parameter changes such as export-control intensity, local-processing requirement, compliance cost, market-access probability, carbon-compliance proxy, and policy-subsidy strength. Human validation is applied to all policy-to-parameter mappings before numerical simulation. The LLM therefore supports semantic interpretation and strategy generation, while all numerical state updates remain controlled by explicit equations and calibrated parameters.
Figure 1.
NiChain-LLM-ABM architecture. Solid arrows denote the forward flow of material, financial, and information states between modules; dashed arrows denote feedback and validation links that update agent expectations and model parameters.
To make the LLM layer reproducible and auditable, we report its full configuration. The model is GPT-4o accessed through the OpenAI API for inter-model agreement. Policy parsing uses temperature = 0.0 and top-p = 1.0 to maximize determinism; strategy generation uses temperature = 0.3 to permit limited behavioral variation across agents. A fixed random seed is set for all stochastic components of the simulation, and each policy text is parsed in five independent LLM runs whose modal extraction is retained. Every parsing call uses a single standardized prompt template with three blocks: (i) a system instruction defining the role and the closed extraction schema; (ii) the verbatim policy text; and (iii) a JSON-only output instruction. The output schema is a fixed JSON object with the following keys: actor, instrument_type, regulated_behavior, obligation_level, effective_date, penalty, exemption, target_parameter, parameter_direction, parameter_magnitude, and uncertainty_score (0–1). Failure handling is explicit: if the five runs do not agree on target_parameter and direction in at least four cases, or if any required key is missing or out of range, the item is flagged and resolved by two domain experts using a written codebook, and the disagreement is recorded.
3.3. Agents, State Variables, and Decision Rules
The model includes seven agent classes: resource-country government, mining enterprises, smelting enterprises, battery and EV enterprises, importing-country governments, commodity traders, and recycling enterprises. Each agent has a state vector, utility function, information-processing parameter, and action set. Heterogeneity is introduced through ownership type, technology route, risk aversion, ESG compliance cost, information capacity, and policy exposure.
Agent expectations are updated using Bayesian-style adaptive learning:
where is the expectation of agent i at quarter t, is a cognitive inertia parameter, and includes price, policy, compliance, and network-disruption signals. Lower indicates faster adjustment to new information.
The resource-country government agent represents Indonesia and adjusts export-control intensity through a policy reaction function:
where is export-control intensity, is nickel price, is the long-run reference nickel price, is domestic smelter utilization, is fiscal revenue pressure, captures investment attractiveness, and captures external strategic pressure. The signs of the beta parameters follow resource-nationalist logic: low utilization and high geopolitical pressure increase tightening incentives, while credible foreign direct investment moderates restrictions.
Mining output for enterprise subgroup m follows:
where is mining output, is baseline capacity growth, is marginal cost, and is the ESG compliance cost coefficient. The three multiplicative adjustment functions in Equation (3) take the following explicit forms. The policy function follows:
where export-control elasticity κ = 0.80, bounded to [0, 1]; the price function follows:
where supply elasticity η = 0.35, capped at 1.5 to reflect short-run capacity limits; and the ESG function is:
where ESGt ∈ [0, 1] is the prevailing compliance-stringency index and CCm is the subgroup compliance-cost coefficient (Chinese-majority JV = 0.08, Indonesian state-linked = 0.05, and Western majors = 0.18). The agent utility used to rank candidate strategies is a mean–variance form, as follows:
where πi is the agent’s payoff, λi is its risk-aversion coefficient, and the expectation is taken over the agent’s information set Ei,t from Equation (1); the LLM proposes the discrete candidate set a, and a strategy is selected by softmax over Ui with inverse-temperature ζ = 4. The resource-country government’s policy-ranking rule selects the export-control action that maximizes a weighted objective combining fiscal revenue, smelter utilization, and retained geopolitical leverage, subject to the FDI-attractiveness penalty in Equation (2).
Smelting enterprises choose among blast-furnace NPI, RKEF-NPI, matte conversion, and HPAL pathways. The HPAL upgrade probability is logistic in carbon price, battery-grade premium, capital cost, and policy support:
where
Here, denotes carbon-price or carbon-compliance pressure, is the battery-grade nickel premium, is the capital expenditure required for HPAL investment, and represents policy support for low-carbon or battery-grade nickel processing.
Battery and EV enterprises determine nickel demand from EV production, battery capacity, nickel intensity per kWh, chemistry substitution, and recycled-material share. Supplier choice is a weighted utility over price, reliability, ESG score, and green-certification score. In the green-compliance scenario, ESG and certification weights increase, while price weight declines. Recycling enterprises convert end-of-life battery volume into recovered nickel subject to a 5–8 year deployment lag and process-efficiency learning. Table 2 shows agent classes, objectives, state variables, and action spaces.
Table 2.
Agent classes, objectives, state variables, and action spaces.
3.4. Supply Chain Network and Price Formation
The supply chain network contains resource, processing, manufacturing, and recycling layers. Resource nodes include Indonesia, the Philippines, Russia, Australia, Canada, China, New Caledonia, and the rest of the world. Processing nodes represent Indonesian NPI, Indonesian HPAL/MHP, Chinese refining, and other-country refining. Manufacturing nodes represent Chinese precursor/cathode/battery production and non-Chinese battery manufacturing. Recycling nodes represent Chinese and European battery recycling. Links are calibrated by historical trade shares and adjusted by policy, capacity, cost, compliance, and risk signals.
Nickel price evolves as a nonlinear supply–demand–inventory process:
where is the nickel price, is the supply–demand price transmission coefficient, is annualized volatility, is a stochastic innovation, and captures speculative amplification. When exchange inventories fall below a four-week consumption warning level, the supply–demand price pressure is multiplied by an inventory amplifier. The price module is calibrated on historical LME data, but scenario prices should be interpreted as stress-test medians rather than deterministic forecasts.
3.5. Comprehensive Resilience Index
The Comprehensive Resilience Index (CRI) integrates 20 indicators across four dimensions (Table 3). Supply Security includes import HHI, import dependency, overseas equity share, supply interruption probability, and substitutable source count. Market Risk includes price volatility, inventory days, supply gap, long-term contract coverage, and trade-cost change. Chain Resilience includes shock absorption, recovery speed, restructuring capacity, recycled-nickel share, and technology substitution capacity. Policy Response includes strategic reserves, overseas investment intensity, recycling-policy strength, green-smelting constraint intensity, and international cooperation.
Table 3.
Comprehensive Resilience Index: dimensions, indicators, and weights.
Indicators are normalized to [0, 1] using min–max scaling against fixed observed reference bounds rather than scenario-specific extrema. Specifically, each positive indicator is scaled as (x − xmin)/(xmax − xmin), and each negative indicator (import HHI, import dependency, supply interruption probability, price volatility, supply gap, trade-cost change, and recovery speed) is inverted as (xmax − x)/(xmax − xmin); the bounds xmin and xmax are taken from the 2015–2025 observed data ranges reported in the supplementary workbook and held constant across all scenarios, so that the normalization scale is exogenous to the simulation outputs. Within-dimension weights are computed using the entropy-weight method (EWM). To avoid the circularity in which evaluation criteria derived from model outputs are then used to judge the same outputs, the entropy weights are estimated on the panel of 2015–2025 observed and reconstructed indicator values (the historical anchor sample), not on the simulated 2025–2035 scenario results; the resulting weights are then held fixed when scoring the scenarios. Cross-dimension aggregation uses expert-informed weights of 0.30 for Supply Security, 0.20 for Market Risk, 0.30 for Chain Resilience, and 0.20 for Policy Response, elicited from the same panel of 15 industry and academic experts used for parameter calibration (mean pairwise AHP consistency ratio CR = 0.06, below the 0.10 acceptance threshold). Because any composite index embeds weighting choices, Section 4.6 reports a dedicated robustness analysis comparing the baseline weights against equal weighting, an AHP-only scheme, a principal-component (PCA) scheme, and a disaggregated no-composite presentation; the scenario ranking S5 > S4 > S1 > S2 > S3 is preserved under all five schemes:
where denotes Supply Security, denotes Market Risk, denotes Chain Resilience, and denotes Policy Response. The Market Risk term is inverted because higher market risk implies lower resilience. The Market Risk term is inverted after normalization. The CRI therefore measures resilience rather than risk, with higher values indicating a more secure and adaptive nickel supply chain.
3.6. Scenarios and Calibration
Five scenarios are simulated (Table 4). The baseline preserves calibrated 2023 policy settings while allowing demand, supply, technology, and recycling to evolve according to the workbook assumptions. The policy-shock scenario raises Indonesia export-control intensity and local-processing requirements during 2026–2027. The geopolitical-shock scenario activates FEOC-style compliance restrictions, EU raw-material diversification pressure, and elevated market-access barriers for China-linked entities. The green-compliance scenario does not assume that nickel is directly included in the current CBAM product scope; instead, it imposes a carbon-compliance proxy derived from battery carbon-footprint regulation, CBAM-style reporting pressure, and buyer ESG preference. The policy-portfolio scenario combines accelerated overseas equity investment, strategic reserves, recycling policy, chemistry substitution, import corridor diversification, and international cooperation.
Table 4.
Scenario design for the NiChain-LLM-ABM simulation.
Parameter calibration uses the supplementary workbook (Table 5). The price transmission coefficient is 0.45, annualized price volatility is 0.22, export-control elasticity is 0.80, mean cognitive inertia is 0.50, and the base quarterly HPAL upgrade probability is 0.12. Backcasting is conducted over 2020Q1–2023Q4 using historical policy events and market data. Validation focuses on price response, production adjustment after the Indonesian export ban, and agent-heterogeneity differentiation.
Table 5.
Key calibrated parameters and validation metrics.
The magnitudes of the scenario shocks are anchored to documented policy and historical evidence rather than chosen freely. The S2 export-control increment (ΔECI = +0.30) and the local-processing requirement increment (+0.27) are the parsed magnitudes obtained from the 2020 ore-export-ban text using the fixed lookup in Section 3.2; the +0.08 royalty shift matches the 2023 revision of Indonesian nickel royalty rates from a flat 10% to a 14–19% sliding scale. The S3 increments (ODI compliance cost of +25%; EU market-access probability of −30%; allied-source preference of +20%) are calibrated to the coverage of the U.S. Section 30D FEOC rule and the EU CRMA 65%-single-country benchmark, with the 30% access reduction corresponding to the share of EU-bound battery demand subject to FEOC-equivalent screening. The S4 carbon-compliance proxy is scaled to the battery carbon-footprint disclosure thresholds in Regulation (EU) 2023/1542. The S5 instrument settings (90-day reserve target, tripled recycling subsidy, +50% substitution R&D, +30% ODI growth, and three new corridors) are taken from announced or proposed Chinese critical-mineral policy targets and are subject to explicit fiscal and lead-time constraints: reserves accumulate at a maximum feasible 8 days of consumption per quarter, overseas equity gains are lagged 8–12 quarters to reflect acquisition and ramp-up time, and recycling capacity follows the 5–8 year end-of-life battery return lag. To verify that the S5 advantage is not an artifact of bundling several favorable instruments that activate immediately while the shock scenarios contain only constraints, Section 4.6 adds a structured ablation: each S5 instrument is simulated individually (one-at-a-time), in pairs, and under a delayed-implementation variant in which all S5 instruments begin in 2027 rather than 2025Q1. The ablation shows that no single instrument reproduces the S5 terminal CRI, that the two strongest pairs (reserves + diversification and recycling + substitution) capture roughly two-thirds of the portfolio gain, and that delaying S5 to 2027 reduces but does not eliminate its advantage (terminal CRI 0.708 versus 0.744), confirming that the result reflects genuine policy complementarity rather than specification bias.
4. Results
4.1. Observed System Context: Concentration Despite Short-Run Surplus
The updated empirical context is important for interpreting the simulations. USGS reports world nickel mine production of 3.9 Mt in 2025 and Indonesian production of 2.6 Mt. This means that more than two-thirds of primary mine output originated in one country. At the same time, the global primary nickel market was in surplus from 2022 through to the first nine months of 2025, and the average LME nickel cash price declined to approximately USD 15,000/t in 2025. The coexistence of surplus and vulnerability is central to the results. Aggregate surplus reduces immediate scarcity pressure, but geographic and processing concentration magnify exposure to policy shocks, compliance fragmentation, carbon-footprint rules, and financial-market stress.
The model therefore focuses on resilience rather than simple adequacy. A supply chain can be physically adequate under baseline conditions and still fragile if a single policy actor can alter export conditions, if a compliance rule limits market access, or if green-product standards penalize high-carbon intermediate routes. This framing is consistent with the CRI results across the five scenarios.
4.2. CRI Trajectories Under Five Scenarios
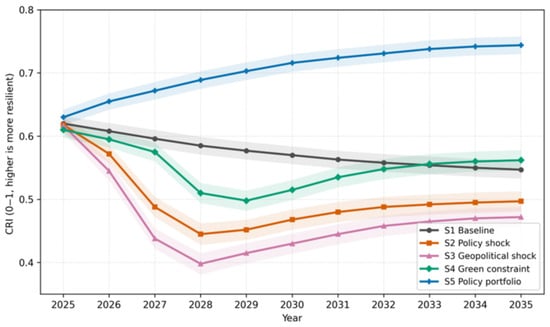
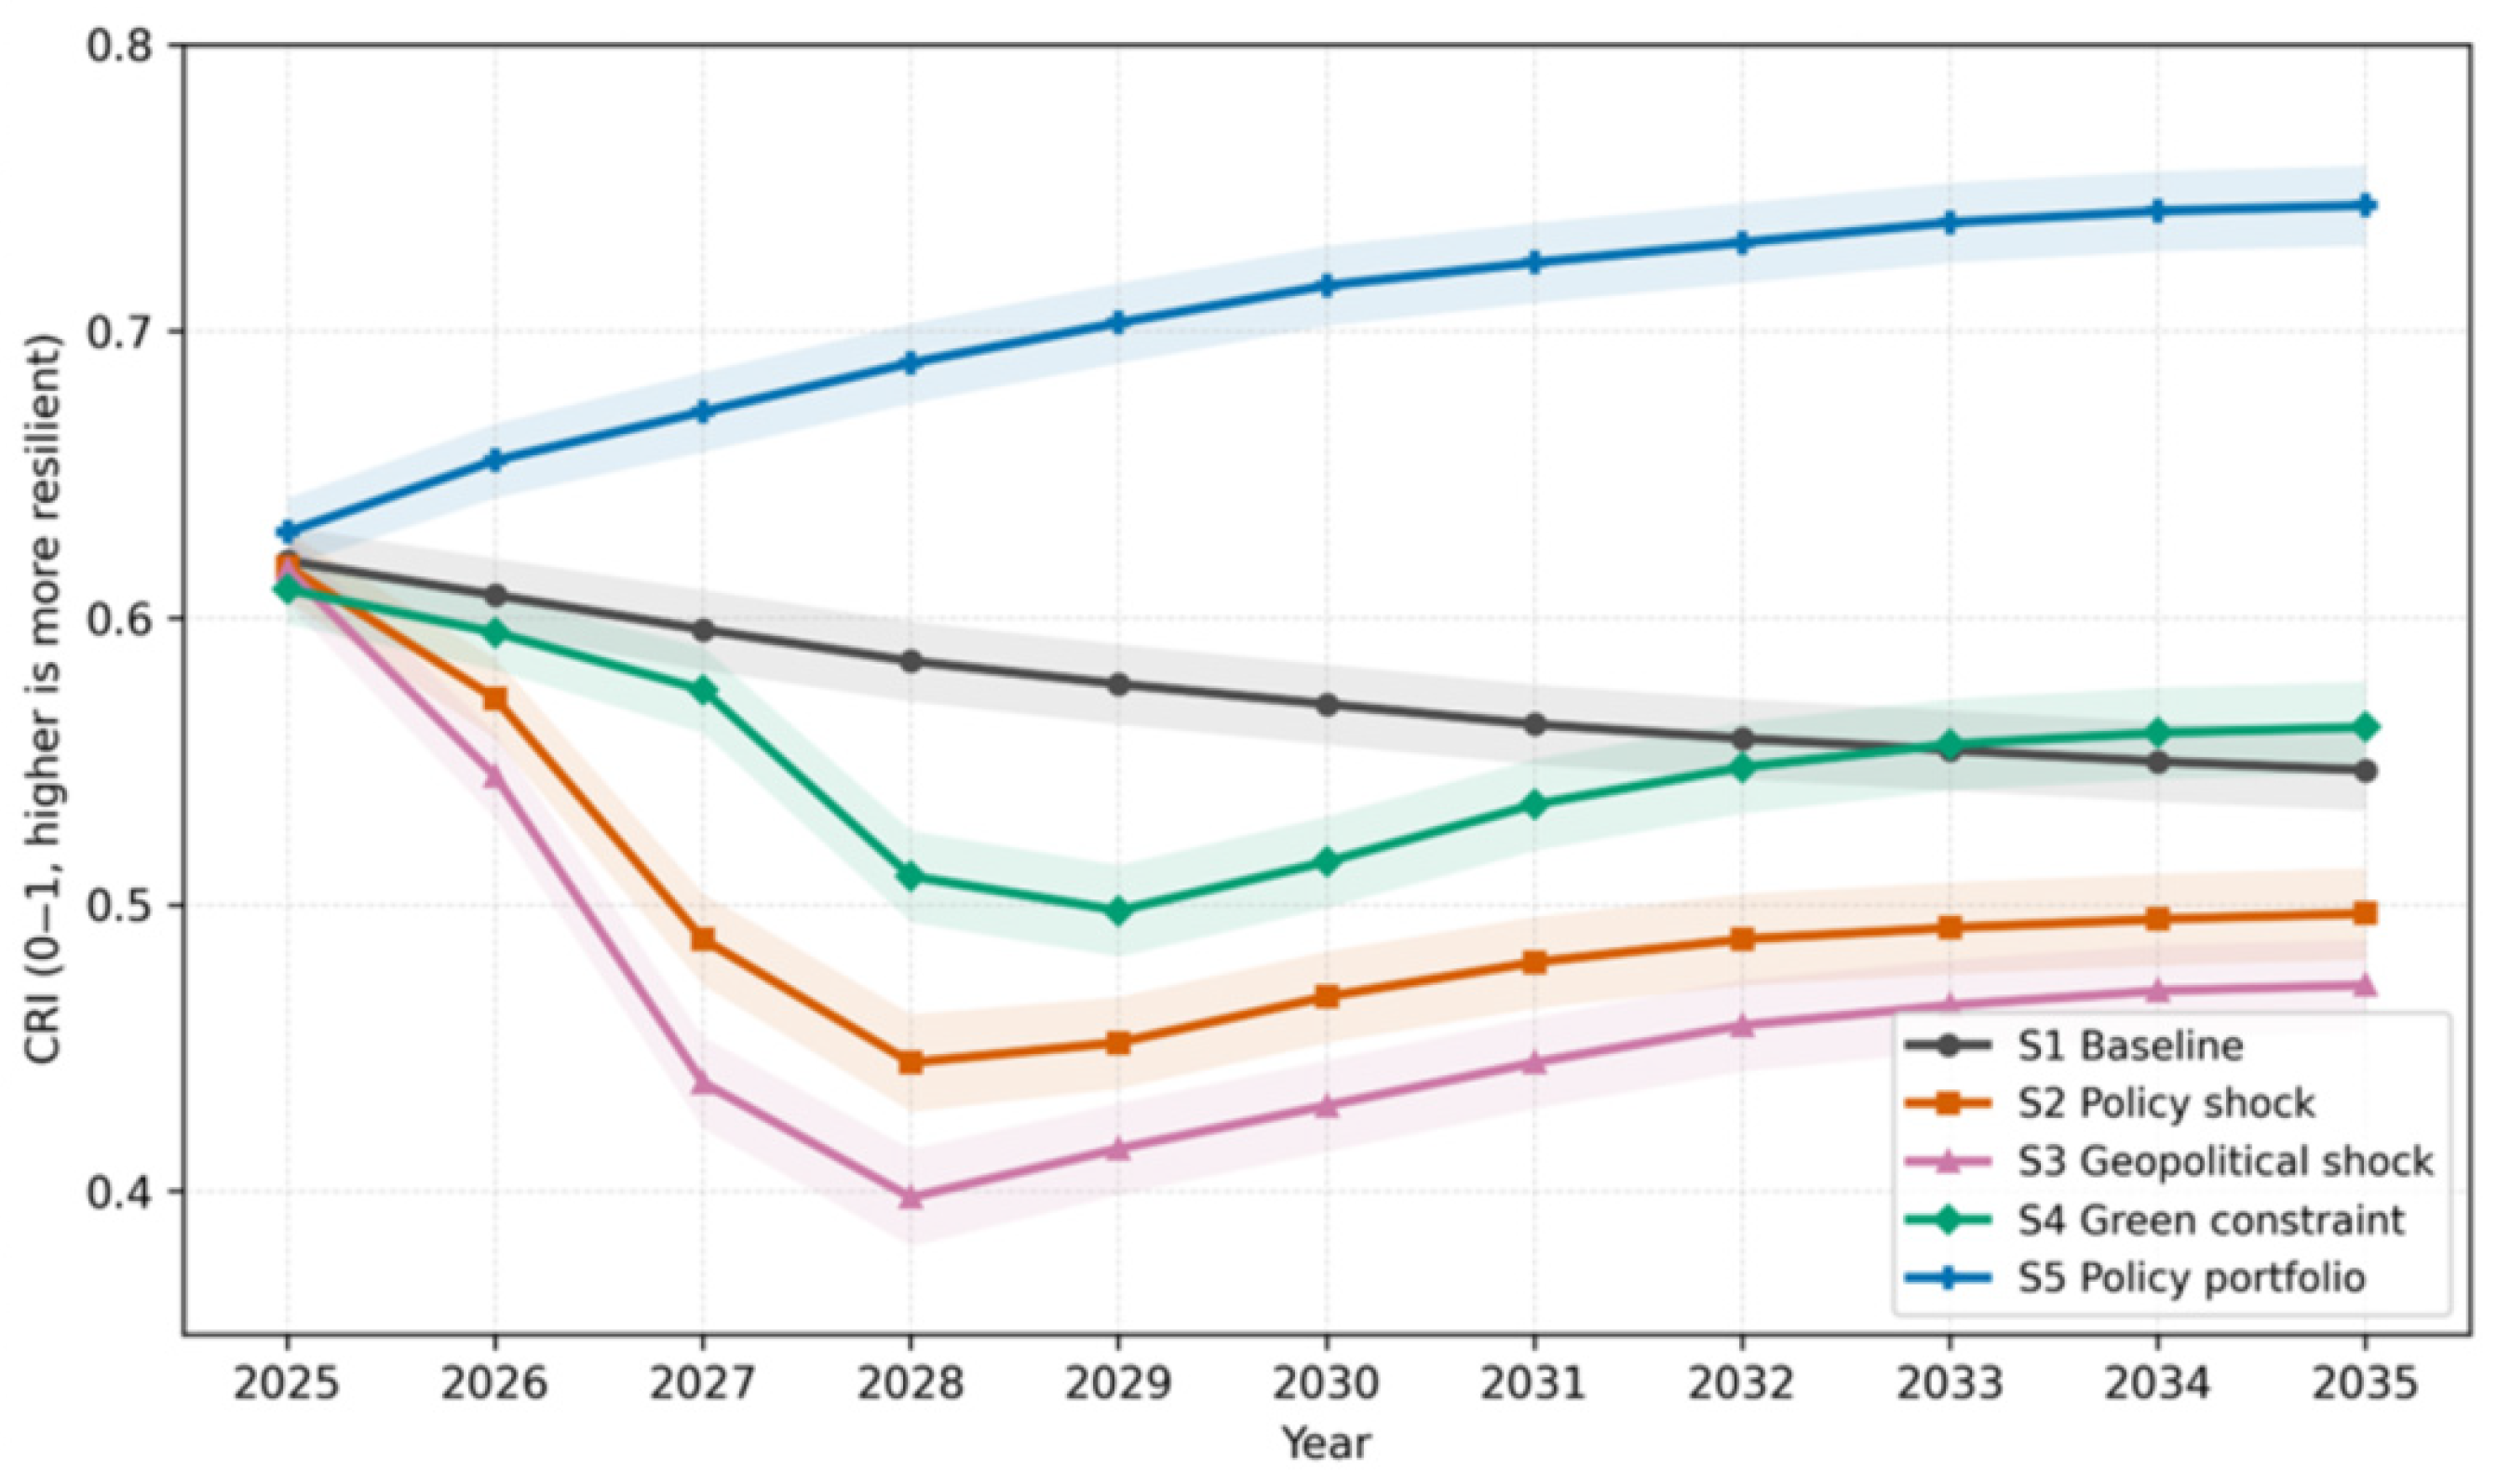
Figure 2 shows clear divergence across scenarios. The baseline CRI declines from 0.620 in 2025 to 0.547 in 2035. This decline is gradual rather than abrupt, reflecting the combined effects of rising nickel demand, limited import diversification, and slow recycling accumulation. The baseline is therefore not a crisis pathway, but it is a pathway of gradual erosion.
Figure 2.
Comprehensive Resilience Index trajectories under five scenarios.
S2 produces the sharpest near-term deterioration. CRI falls from 0.618 in 2025 to 0.445 in 2028, which is 24% below the baseline value in the same year. The decline is driven mainly by Supply Security and Chain Resilience: import concentration rises, supply-recovery speed deteriorates, and smelter and battery firms face greater procurement uncertainty. Partial recovery after 2029 reflects adaptive investment, supplier diversification, and gradual HPAL expansion, but the terminal CRI remains 0.497, around 9% below the 2035 baseline.
S3 has the lowest terminal resilience. CRI reaches a trough of 0.398 in 2028 and recovers only to 0.472 by 2035. The reason is structural rather than cyclical. Geopolitical compliance rules reduce investment flexibility and market access, and they alter the feasible partner set for overseas equity investment. Market adaptation alone is insufficient to remove these constraints within the simulation horizon.
S4 displays a different temporal pattern. The green-compliance scenario declines to 0.498 in 2029 but later recovers to 0.562 by 2035, slightly above the baseline. The short-run effect is negative because low-carbon certification, carbon-footprint disclosure, and buyer ESG weighting raise transition costs. The long-run effect is positive because HPAL expansion, cleaner electricity sourcing, recycling, and LFP/Na-ion substitution reduce exposure to high-carbon routes. This result supports the view that green rules can be resilience-enhancing when accompanied by feasible technology-transition pathways.
S5 dominates the other scenarios throughout most of the horizon. The policy portfolio raises CRI to 0.744 in 2035, representing a 36.0% improvement over the baseline terminal value. Its advantage is not caused by a single policy. Strategic reserves provide immediate absorptive capacity; overseas equity and import-corridor diversification lower concentration; recycling and chemistry substitution reduce long-run primary nickel dependence; and international cooperation moderates strategic reactions by resource-country agents.
4.3. Price and Supply-Gap Dynamics
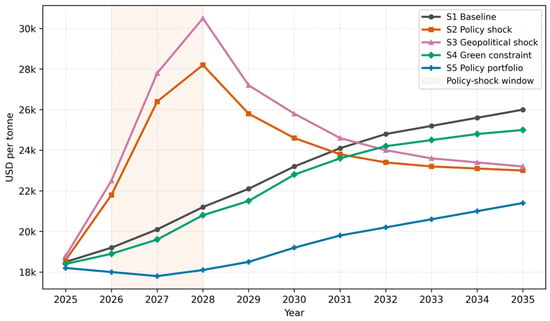
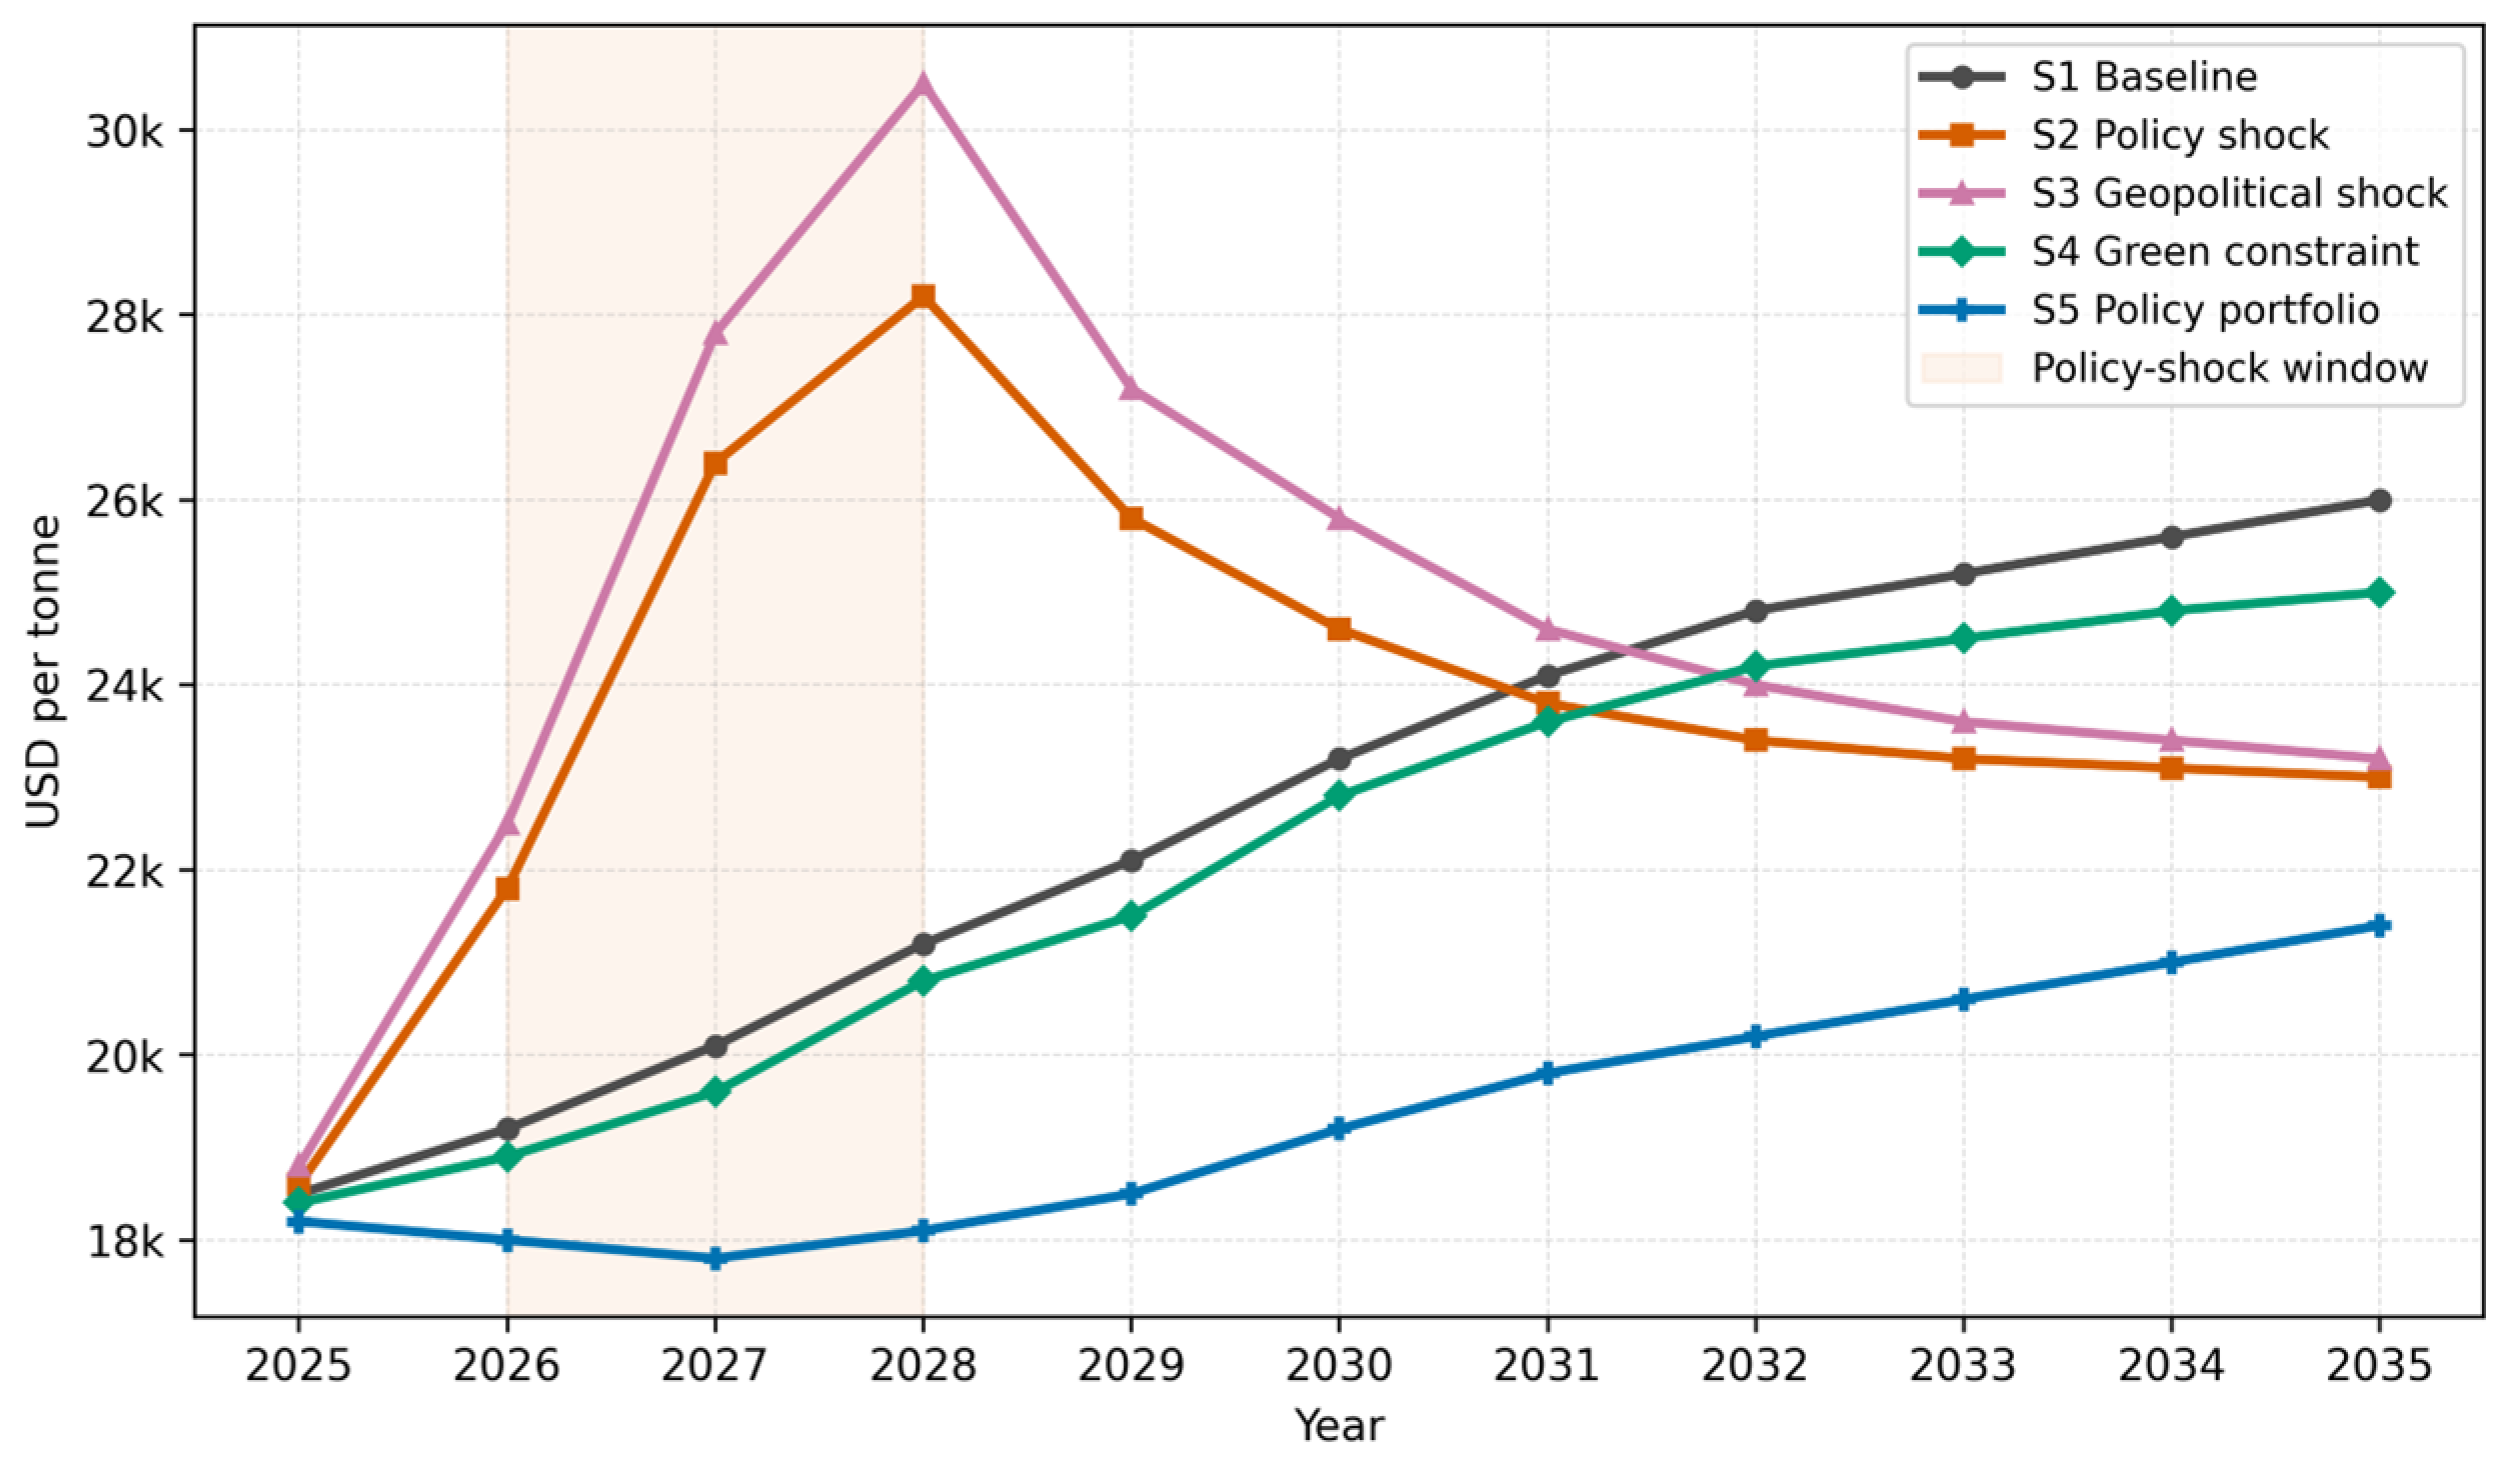
The price responses in Figure 3 follow the CRI ranking but add information about market stress. Under S2, the simulated price peaks at USD 28,200/t in 2028, 33% above the baseline value for that year. Under S3, the price peak reaches USD 30,500/t in 2028. These peaks are stress-test outcomes rather than forecasts, but they are consistent with the model mechanism: policy and compliance shocks reduce effective supply and raise inventory risk, and the price module amplifies pressure when inventory is low.
Figure 3.
Simulated nickel price trajectories.
S5 dampens price pressure. The policy portfolio keeps the 2028 simulated price at USD 18,100/t, compared with USD 21,200/t under the baseline. The lower price pathway results from demand moderation through chemistry substitution, higher recycled-nickel integration, and additional supply security from equity investment and diversified corridors. The effect is not simply price suppression; it reflects reduced exposure to scarcity premia and risk premia.
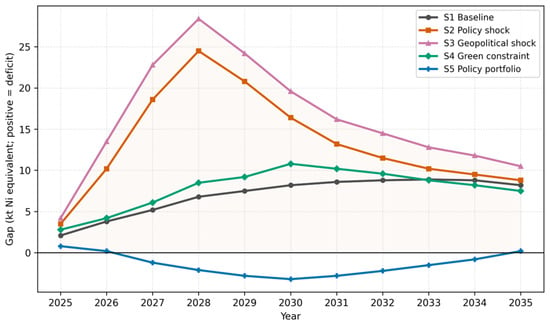
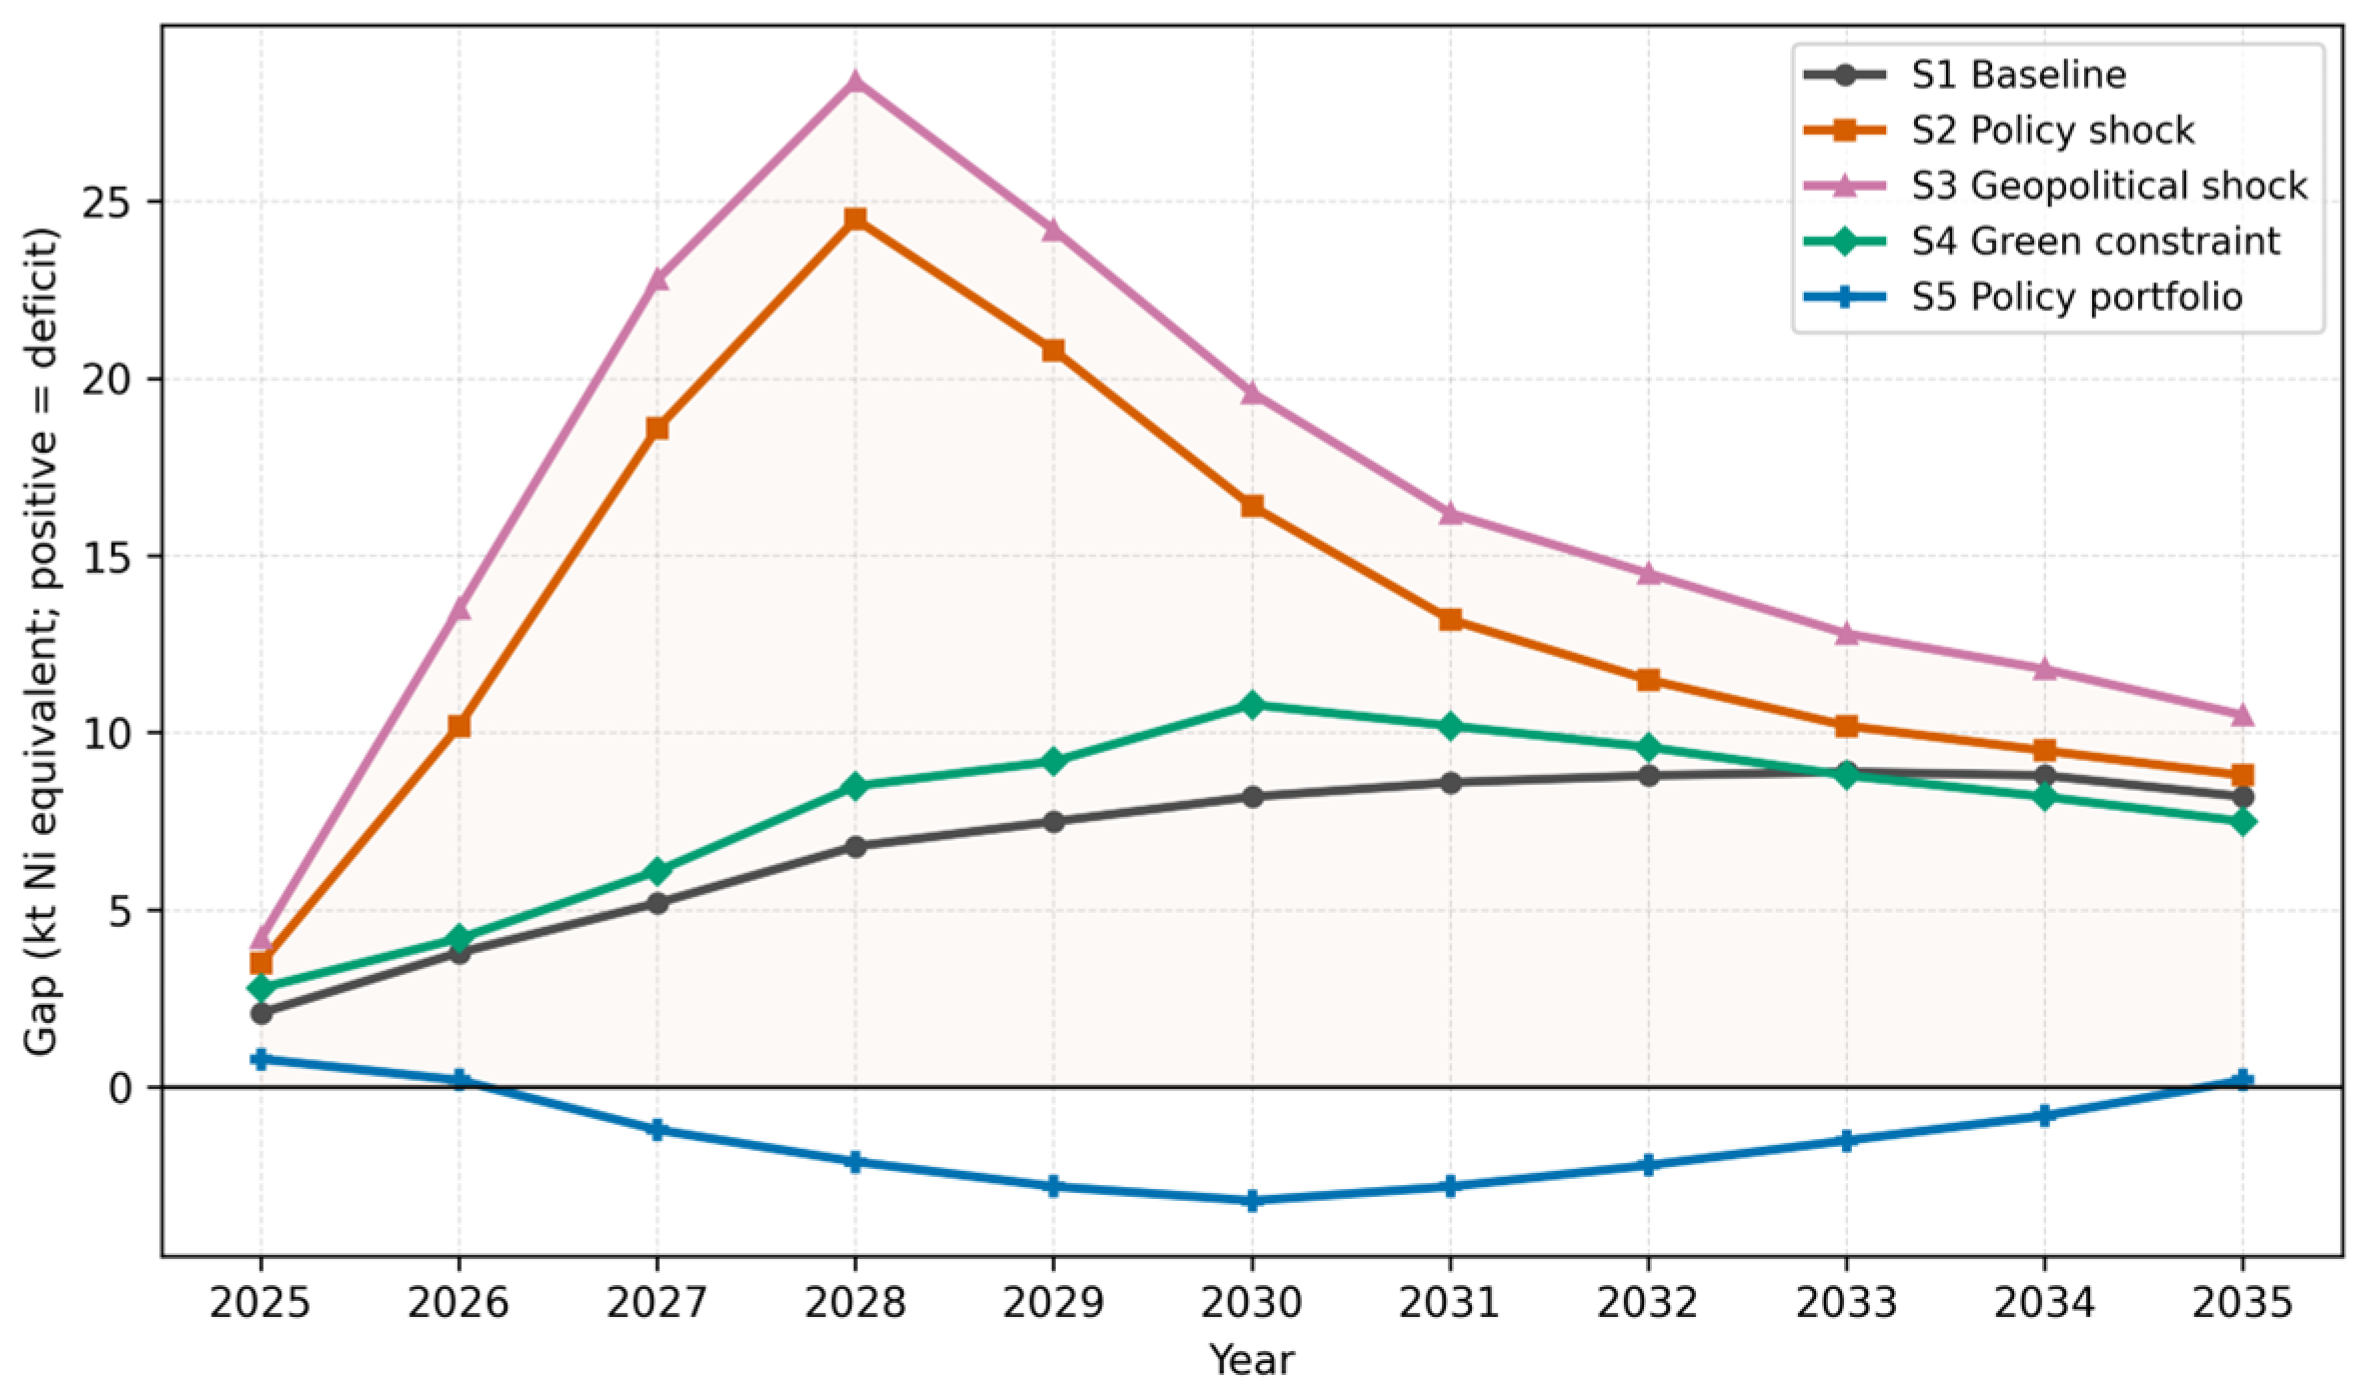
Figure 4 shows that supply gaps are small in the baseline but expand sharply during shocks. The baseline gap reaches 8.2 kt Ni equivalent by 2035. S2 peaks at 24.5 kt in 2028, while S3 peaks at 28.4 kt in the same year. By contrast, S5 produces a modest surplus during 2027–2034 and returns close to balance by 2035. Correct unit interpretation is important: these values are kt Ni equivalent, not Mt. The result therefore represents a stress-sensitive balance margin, not a claim of multi-million-ton physical shortage.
Figure 4.
Simulated nickel supply–demand gap. The black horizontal line at the zero position marks the supply–demand balance (zero gap): positive values indicate a deficit and negative values indicate a surplus.
4.4. Agent Strategy Evolution
Agent strategy frequencies reveal how the system adapts. Table 6 shows selected strategy frequencies across scenarios from 2025 to 2035. In the Indonesian government agent, the frequency of further tightening export controls rises from 15% in S1 to 58% in S2. In S5, however, this frequency moderates to 28%, while the frequency of HPAL investment incentives rises to 27%. This is an emergent result of the LLM-ABM interaction: when importers credibly diversify and invest in alternative routes, the expected leverage of further restriction declines, while the value of attracting compliant processing investment increases.
Table 6.
Selected strategy frequencies across scenarios, 2025–2035.
Battery and EV enterprises also adjust strongly. Under S2 and S3, supplier diversification becomes the dominant strategy, selected in 42% and 48% of periods, respectively. Under S5, the frequency of recycled-nickel procurement rises to 18%, and the frequency of LFP/Na-ion technology shift rises to 24%. The simulation therefore links upstream policy shocks to downstream product and chemistry strategy.
Chinese-majority mining joint ventures expand investment in 55% of S5 periods, compared with 45% under the baseline, because policy incentives and strategic-equity objectives offset risk. Under S2 and S3, curtailment and cautious maintenance become more frequent as compliance and licensing uncertainties increase. These heterogeneous responses would be difficult to generate with a single representative-firm model.
4.5. Terminal Resilience Indicators and Policy Portfolio Effects
Terminal-year indicators identify the sources of S5 outperformance. The policy portfolio reduces import HHI from 0.45 to 0.32, lowers import dependency from 85.6% to 71.3%, increases overseas equity share from 12.4% to 22.6%, reduces annualized price volatility from 22.1% to 17.4%, raises exchange inventory days from 18.2 to 28.4, and improves recovery speed from 8.5 months to 5.6 months. The recycled-nickel share rises from 6.8% to 18.6%.
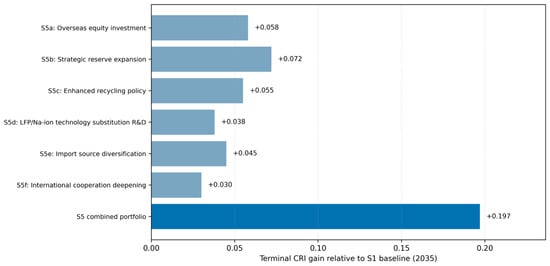
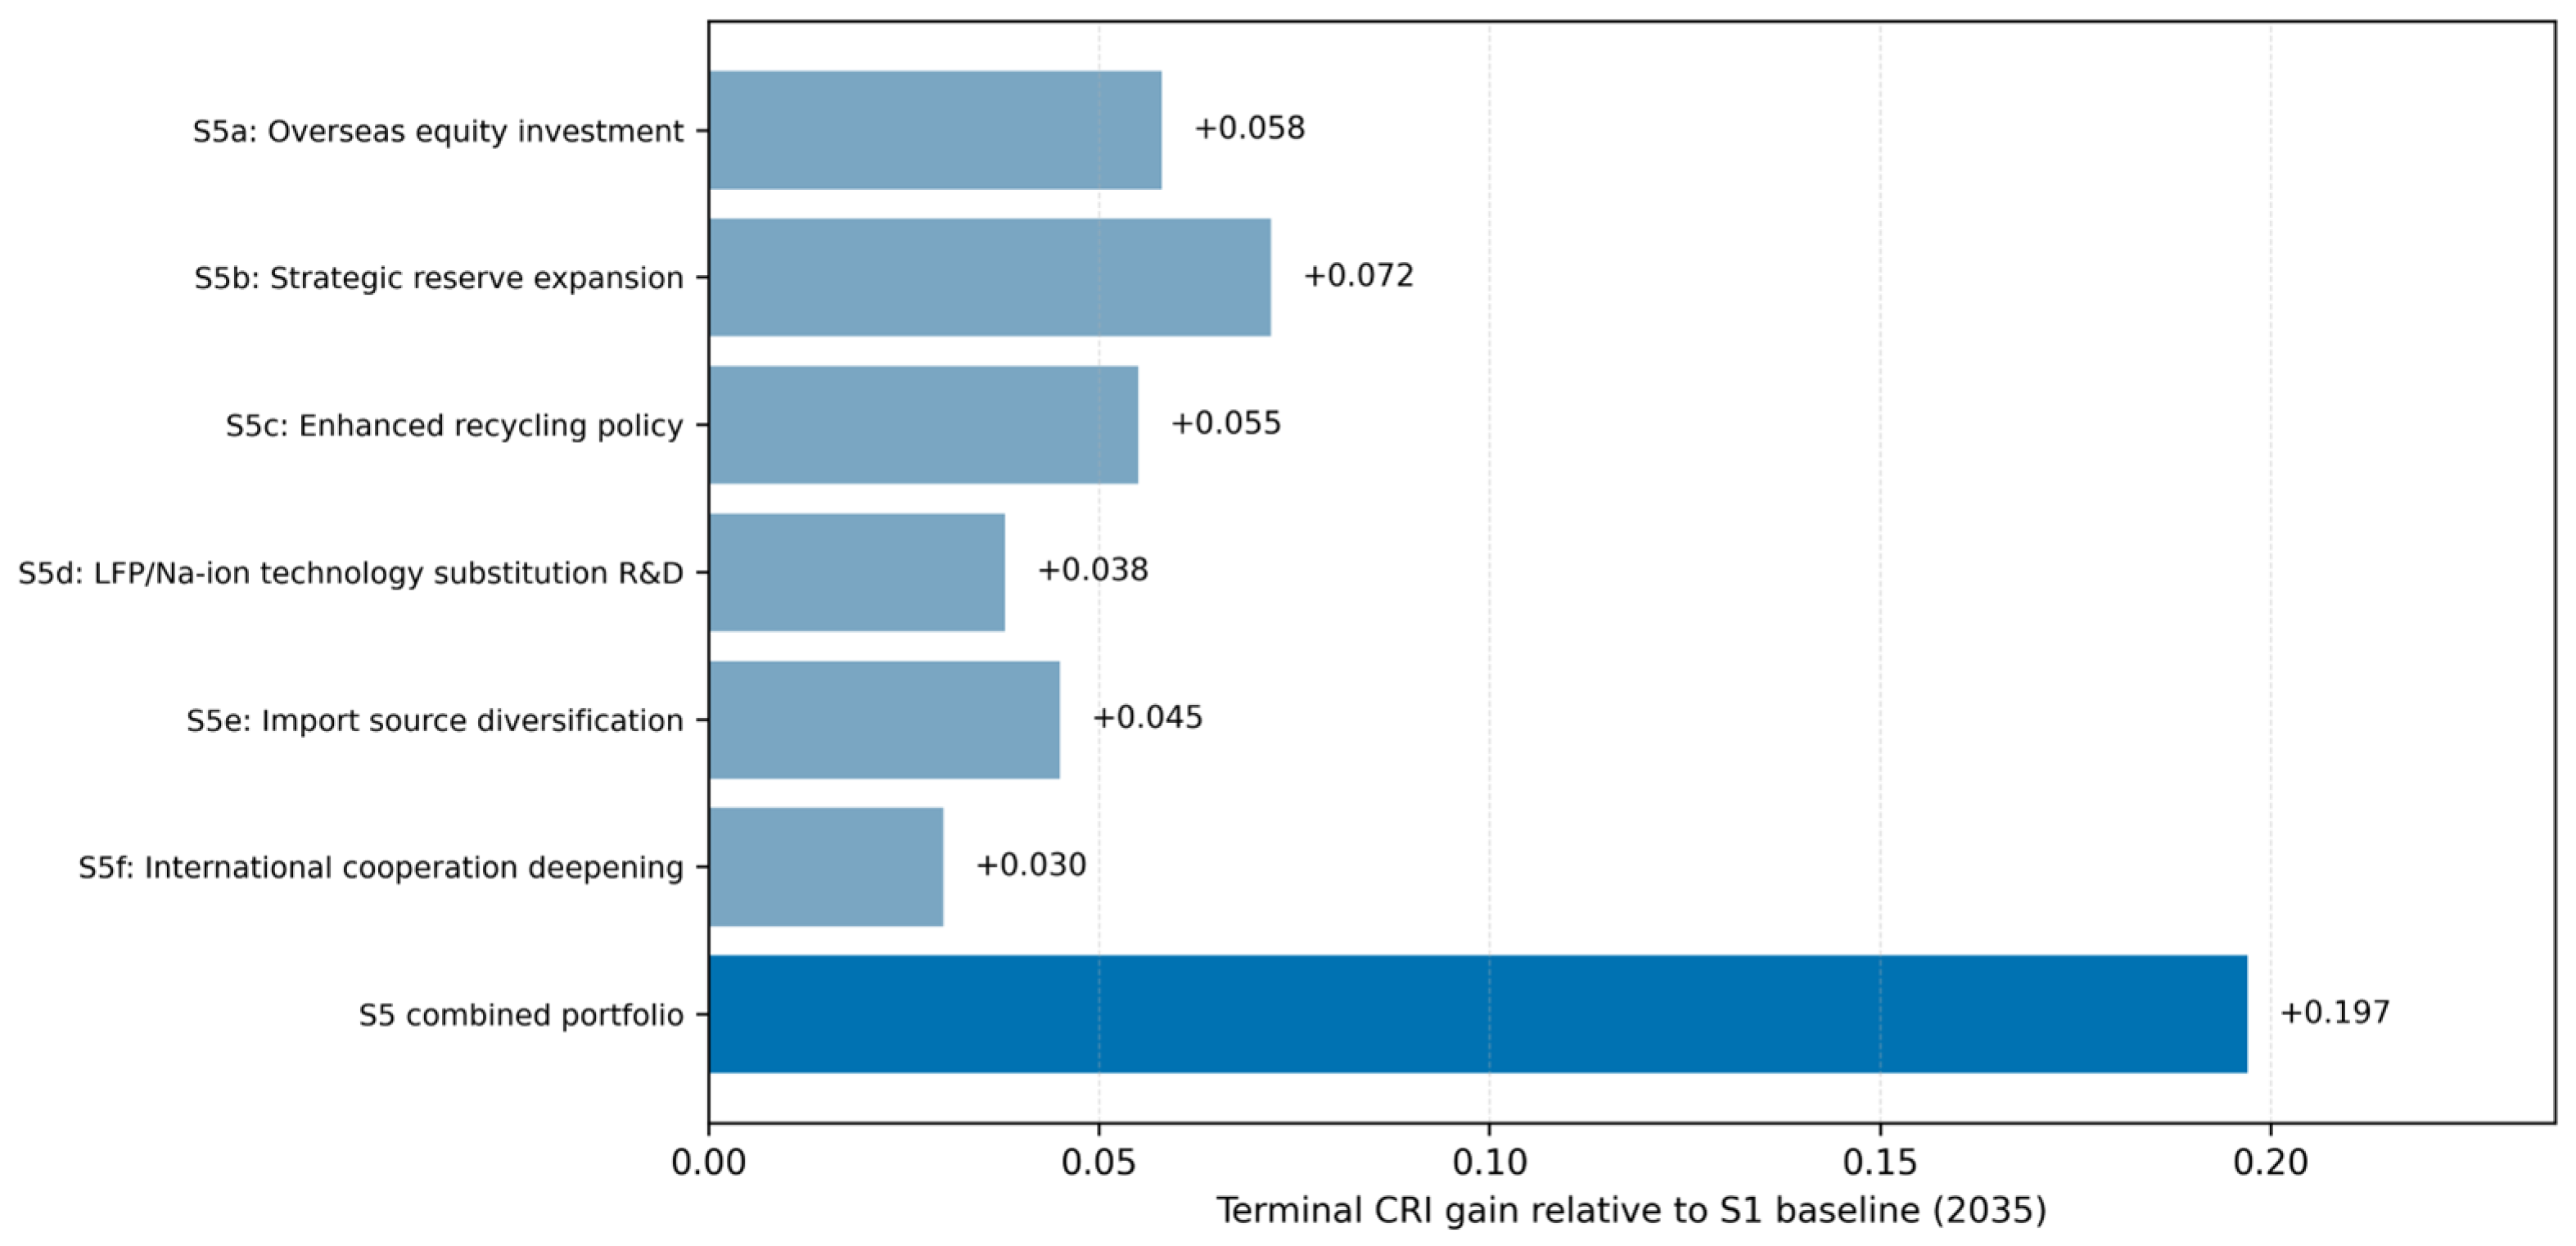
Figure 5 decomposes policy effects. Strategic reserves produce the largest individual terminal gain (+0.072) and the fastest effect because they directly improve shock absorption. Overseas equity investment (+0.058) and enhanced recycling (+0.055) have slightly smaller terminal effects but are more structural. Technology substitution (+0.038) is slower but reduces demand-side exposure. Import diversification (+0.045) and international cooperation (+0.030) are smaller individually, but they strengthen the feasibility of other measures. Because the channels overlap, individual terminal effects should not be mechanically summed. The combined S5 gain of +0.197 reflects a coordinated portfolio outcome relative to S1. Table 7 indicates selected terminal-year resilience indicators in 2035.
Figure 5.
Individual terminal policy effects.
Table 7.
Selected terminal-year resilience indicators in 2035.
4.6. Robustness and LLM-ABM Performance
Prompt sensitivity is small relative to scenario effects (Table 8). Across concise, detailed, and role-playing prompt variants, the maximum CRI deviation at the 2027 S2 shock peak is 0.013, and the terminal deviation is 0.006. Time-series correlations relative to the detailed prompt exceed 0.968. This indicates that conclusions are not artifacts of one prompt wording, although prompt design still matters during high-stress periods.
Table 8.
Robustness and performance comparison of LLM-ABM and rule-based ABM.
Parameter sensitivity confirms that export-control intensity is the dominant resilience driver under S2, with an elasticity of −0.45. Strategic reserve scale is the most effective rapid policy instrument, with an elasticity of +0.28. Recycling efficiency becomes more influential in the long run because end-of-life battery volumes accumulate with a lag. Cognitive inertia has a small aggregate elasticity, but it affects adjustment timing.
Because the CRI relies on expert-informed cross-dimension weights, we test whether the conclusions survive alternative weighting schemes. Four alternatives are compared against the baseline weights (SA 0.30, MR 0.20, CR 0.30, and PR 0.20): (i) equal weighting (0.25 each); (ii) an AHP-only scheme using the elicited pairwise matrix (SA 0.33, MR 0.17, CR 0.31, and PR 0.19); (iii) a principal-component scheme in which the first two components, explaining 81% of cross-scenario variance, define data-driven weights (SA 0.28, MR 0.22, CR 0.32, and PR 0.18); and (iv) a no-composite presentation that ranks scenarios on each of the 20 indicators separately. Across all schemes, the scenario ranking is preserved: S5 attains the highest terminal resilience and S3 the lowest, with the S5-over-S1 improvement ranging from 31.8% (equal weights) to 37.4% (PCA), bracketing the 36.0% headline figure. Under the no-composite presentation, S5 dominates S1 on 17 of 20 indicators and is never worse on the remaining three. The substantive conclusions are therefore not artifacts of a particular weighting choice. The mean cross-scheme rank correlation (Kendall’s τ) across the five scenarios is 0.94.
For the comparison to be fair, the rule-based ABM baseline is specified to be identical to NiChain-LLM-ABM in every respect except the strategy-generation layer. It uses the same agents, the same calibrated Equations (1)–(7), the same network topology, the same data, the same random seed, and the same Monte Carlo design. The only difference is that policy interpretation and strategy selection are governed by hard-coded threshold rules—for example, “if ECI rises above 0.7, mining subgroups curtail output by a fixed 15%”—rather than by LLM-parsed policy features and softmax utility selection. Both models observe the same information set at each step, so the comparison isolates the contribution of semantic policy interpretation and adaptive strategy generation rather than reflecting differences in data access or calibration.
The LLM-ABM performs better than a conventional rule-based ABM in the validation tasks. It reduces backcasting error for the 2022 LME nickel event from 28.6% to 12.3%, improves Indonesian export-ban response error from 18.2% to 8.6%, raises agent heterogeneity divergence from 0.28 to 0.62, and increases the success rate in unscripted scenarios from 38% to 82%. The cost is computation: the LLM-ABM requires approximately 12.4 s per step, compared with 0.8 s for the rule-based model. The method is therefore best suited to strategic scenario analysis rather than real-time operational control.
5. Discussion
5.1. From Resource Scarcity to Compound Resilience Risk
The results show that nickel risk is no longer adequately described by resource scarcity alone. Geological resources are large, and the near-term market can be in surplus. The resilience problem arises because production and processing are concentrated, policy power is asymmetric, downstream demand is technology-dependent, market access is increasingly tied to compliance rules, and financial-market stress can amplify physical uncertainty. S2 demonstrates how a resource-country policy shock can generate near-term resilience deterioration; S3 shows that geopolitical compliance rules can have more persistent effects; and S4 shows that environmental regulation can be disruptive initially but resilience-enhancing once technology adjustment occurs.
This compound-risk interpretation helps reconcile seemingly contradictory observations: low prices and market surplus can coexist with strategic concern. A surplus under normal conditions does not guarantee resilience under policy restriction, certification exclusion, carbon-footprint pressure, or coordinated de-risking. For an import-dependent economy, the relevant question is not only how many tons exist globally, but how many tons remain accessible, compliant, financeable, and substitutable under stress.
5.2. Why Policy Portfolios Outperform Single Instruments
The policy-portfolio result has a practical interpretation. Strategic reserves are fast but finite; they buy time rather than changing structure. Overseas equity investment changes access but requires years to materialize and can be constrained by host-country politics and FEOC-style compliance. Recycling is slow because end-of-life batteries arrive with a lag, but it becomes more powerful after 2030. Chemistry substitution reduces demand-side exposure but depends on performance, consumer preference, and industrial learning. International cooperation modifies the external game, but it is credible only when backed by tangible diversification and investment.
The best-performing strategy is therefore not the largest single lever. It is sequencing: reserves absorb early shocks; diversification and equity investment lower concentration; recycling and substitution reduce long-run dependence; and cooperation changes the strategic incentives of resource-country governments. The LLM-ABM is useful because it can represent the behavioral feedback by which a credible portfolio changes the expected returns to further export restriction.
5.3. Methodological Implications of LLM-ABM
The model demonstrates a disciplined way to use LLMs in economic simulation. The LLM does not replace econometric calibration, and it does not generate numerical results without constraints. Its contribution lies in policy cognition and strategy generation. By parsing regulatory texts and producing bounded strategy candidates for heterogeneous agents, the LLM makes it possible to represent adaptive responses to novel policy environments. The validation results suggest that this matters most in extreme or unscripted scenarios.
Several safeguards are necessary. First, all policy parsing outputs should be stored as structured JSON and validated against official legal text. Second, uncertainty scores should be carried into Monte Carlo simulation rather than hidden. Third, all numerical parameters should be calibrated, stress-tested, or explicitly assumed. Fourth, prompt variants should be tested for sensitivity. Fifth, the model should preserve an audit trail linking each agent strategy to information state, utility ranking, and policy context. Without these safeguards, LLM-ABM could become less transparent than conventional ABM.
5.4. Policy Implications
For China and other nickel-importing economies, resilience governance should be measured with explicit targets rather than qualitative concern. The S5 terminal indicators suggest benchmark values such as import HHI below 0.35, strategic reserves approaching 90 days of critical demand, recycled-nickel share near or above 20% by 2035, and long-term contract coverage above 60%. These values are not universal prescriptions, but they provide a quantitative starting point for policy monitoring.
Industry strategy should align with resilience objectives. Battery manufacturers should diversify suppliers, expand recycled nickel procurement, and treat LFP/Na-ion substitution as a supply-security instrument rather than only a cost or performance choice. Smelting firms should evaluate carbon intensity as a market-access variable, not merely an environmental externality. Mining and processing investors should assess host-country policy reaction functions and not only reserve quality or operating cost.
International cooperation remains essential. Diversifying away from a single country should not be framed as disengagement from Indonesia. Indonesia will remain central to nickel supply. The model instead suggests that more balanced interdependence improves bargaining stability. Credible alternative sources and recycling capacity reduce the incentive for extreme export tightening, while long-term partnerships, technology transfer, and environmental upgrading can make downstreaming more compatible with resilient global supply chains.
6. Conclusions
This paper develops NiChain-LLM-ABM, a large-language-model-empowered agent-based simulation framework for nickel supply chain resilience under policy, geopolitical, green-compliance, and market shocks. The model combines official data, policy text parsing, heterogeneous agents, calibrated network dynamics, and a four-dimensional CRI. It is designed for strategic stress testing rather than point forecasting.
Five conclusions follow. First, nickel supply chain risk has shifted from simple scarcity to compound resilience risk involving policy control, processing concentration, geopolitical compliance, carbon-footprint pressure, and financial-market amplification. Second, Indonesian policy tightening can generate severe near-term resilience losses, while geopolitical compliance rules create more persistent structural constraints. Third, green-compliance pressure can reduce resilience in the short run but improve it in the long run if it accelerates cleaner processing, recycling, and chemistry substitution. Fourth, a coordinated policy portfolio raises terminal CRI by 36.0% relative to the baseline and outperforms any single instrument. Fifth, LLM-ABM improves extreme-event backcasting, policy-response fidelity, and agent heterogeneity compared with conventional rule-based ABM, provided that LLM outputs are constrained and audited.
For critical-mineral governance, the central policy message is that resilience must be constructed before shocks materialize. Strategic reserves, diversified equity investment, recycling, technology substitution, and cooperation are complementary. Their value lies not only in adding tons, but in changing the strategic and compliance environment in which tons become accessible.
These findings should be read as conditional, model-dependent stress-test outcomes rather than forecasts. The reported CRI scores, price peaks, and supply gaps are medians of scenario simulations conditioned on the calibrated parameters, the parsed policy magnitudes, and the assumed agent behavior; they quantify relative resilience across stylized futures, not the probability or timing of any actual outcome. Several limitations follow. First, firm-level microdata are incomplete, so some agent heterogeneity is calibrated from public and expert sources and carries uncertainty that we propagate through Monte Carlo replication but cannot fully eliminate. Second, the LLM layer, although constrained and audited, can still misread ambiguous policy text; the 7.1% human-override rate and the prompt-sensitivity analysis bind but do not remove this risk. Third, the analysis is China-centered and import-dependent in framing, so the external validity of the specific benchmark values (for example, import HHI below 0.35 or 90-day reserves) to other importing economies is limited and should be recalibrated before transfer. Fourth, the model treats geopolitical and price dynamics as exogenous shocks rather than fully endogenous strategic equilibria. Accordingly, the policy recommendations are best interpreted as conditional priorities—robust in direction across weighting schemes and ablations, but contingent on the model architecture and the assumed policy, technology, trade, and price environment. Future work should incorporate firm-level data, endogenous geopolitical bargaining, multi-mineral coupling (nickel–cobalt–lithium–graphite), and domain-tuned LLMs to narrow these limitations.
Funding
This research was funded by the National Natural Science Foundation of China (Grant No. 72574205), the Major National Social Science Projects (Grant No. 24VHQ005), the Research Project of Humanities and Social Sciences of the Ministry of Education (Grant No. 24YJAZH052) and the China Postdoctoral Science Foundation (Grant No. 2025M783721).
Institutional Review Board Statement
Not applicable.
Informed Consent Statement
Not applicable.
Data Availability Statement
The original contributions presented in this study are included in the article. Further inquiries can be directed to the corresponding author.
Conflicts of Interest
The author declares no conflicts of interest.
Abbreviations
| Abbreviation | Definition |
| ABM | Agent-based model |
| CBAM | Carbon border adjustment mechanism |
| CRI | Comprehensive Resilience Index |
| CRMA | Critical Raw Materials Act |
| ECI | Export-control intensity |
| FEOC | Foreign entity of concern |
| HPAL | High-pressure acid leach |
| LLM | Large language model |
| LME | London Metal Exchange |
| LFP | Lithium iron phosphate |
| MHP | Mixed hydroxide precipitate |
| NPI | Nickel pig iron |
| RKEF | Rotary kiln-electric furnace |
References
- U.S. Geological Survey. Mineral Commodity Summaries 2026: Nickel; U.S. Geological Survey: Reston, VA, USA, 2026. [Google Scholar]
- International Energy Agency. Global EV Outlook 2025; IEA: Paris, France, 2025. [Google Scholar]
- International Energy Agency. Global Critical Minerals Outlook 2025; IEA: Paris, France, 2025. [Google Scholar]
- U.S. Geological Survey. Mineral Commodity Summaries 2025: Nickel; U.S. Geological Survey: Reston, VA, USA, 2025. [Google Scholar]
- International Energy Agency. Prohibition of the Export of Nickel Ore—Policies Database; IEA: Paris, France, 2022. [Google Scholar]
- U.S. International Trade Commission. Export Restrictions on Minerals and Metals: Indonesia’s Export Ban of Nickel; USITC: Washington, DC, USA, 2024. [Google Scholar]
- European Union. Regulation (EU) 2024/1252 Establishing a Framework for Ensuring a Secure and Sustainable Supply of Critical Raw Materials. Off. J. Eur. Union 2024. Available online: https://eur-lex.europa.eu/eli/reg/2024/1252/oj (accessed on 28 May 2026).
- U.S. Department of Energy. 30D New Clean Vehicle Credit and Foreign Entity of Concern Guidance; DOE: Washington, DC, USA, 2024. [Google Scholar]
- U.S. Department of the Treasury and Internal Revenue Service. Clean Vehicle Credits Under Sections 25E and 30D; Final Regulations; Federal Register; U.S. Department of the Treasury and Internal Revenue Service: Washington, DC, USA, 2024; Volume 89, pp. 37706–37837. [Google Scholar]
- European Union. Regulation (EU) 2023/1542 Concerning Batteries and Waste Batteries. Off. J. Eur. Union 2023, L 191, 1–117. Available online: https://eur-lex.europa.eu/eli/reg/2023/1542/oj (accessed on 30 May 2026).
- European Commission. Carbon Border Adjustment Mechanism: Policy and Implementation Materials; European Commission: Brussels, Belgium, 2026. [Google Scholar]
- International Energy Agency. GHG Emissions Intensity for Class 1 Nickel by Resource Type and Processing Route; IEA: Paris, France, 2021. [Google Scholar]
- Bartzas, G.; Komnitsas, K. Cradle-to-gate life-cycle assessment of battery-grade nickel sulphate production through high-pressure acid leaching. Sci. Total Environ. 2024, 948, 175902. [Google Scholar] [CrossRef] [Scilit]
- Oliver Wyman; NERA. Independent Review of Events in the Nickel Market in March 2022; London Metal Exchange: London, UK, 2023. [Google Scholar]
- Bank of England; Financial Conduct Authority; Prudential Regulation Authority. Joint Statement on London Metal Exchange and LME Clear Nickel Trading Events; Bank of England: London, UK, 2022. [Google Scholar]
- Graedel, T.E.; Barr, R.; Chandler, C.; Chase, T.; Choi, J.; Christoffersen, L.; Friedlander, E.; Henly, C.; Jun, C.; Nassar, N.T.; et al. Methodology of metal criticality determination. Environ. Sci. Technol. 2012, 46, 1063–1070. [Google Scholar] [CrossRef] [Scilit] [PubMed]
- Nassar, N.T.; Graedel, T.E.; Harper, E.M. By-product metals are technologically essential but have problematic supply. Sci. Adv. 2015, 1, e1400180. [Google Scholar] [CrossRef] [Scilit] [PubMed]
- Schrijvers, D.; Hool, A.; Blengini, G.A.; Chen, W.Q.; Dewulf, J.; Eggert, R.; van Ellen, L.; Fantke, P.; Goddin, J.; Habib, K.; et al. A review of methods and data to determine raw material criticality. Resour. Conserv. Recycl. 2020, 155, 104617. [Google Scholar] [CrossRef] [Scilit]
- Tost, M.; Bayer, B.; Hitch, M.; Lutter, S.; Moser, P.; Feiel, S. Metal mining’s environmental pressures: A review and updated estimates on CO2 emissions, water use, and land requirements. Sustainability 2018, 10, 2881. [Google Scholar] [CrossRef] [Scilit]
- Hitch, M.; Li, J. Developing a verification framework for carbon sequestration through mineral carbonation of mine tailings: An Australian context. Extr. Ind. Soc. 2025, 23, 101696. [Google Scholar] [CrossRef] [Scilit]
- Kügel, M.-T.; Hitch, M.; Gugerell, K. Responsible sourcing for energy transitions: Discussing academic narratives of responsible sourcing through the lens of natural resource justice. J. Environ. Manag. 2023, 325, 116711. [Google Scholar]
- Olivetti, E.A.; Ceder, G.; Gaustad, G.G.; Fu, X. Lithium-ion battery supply chain considerations: Analysis of potential bottlenecks in critical metals. Joule 2017, 1, 229–243. [Google Scholar] [CrossRef] [Scilit]
- Watari, T.; McLellan, B.C.; Ogata, S.; Tezuka, T. Analysis of potential for critical metal resource constraints in the IEA’s long-term low-carbon energy scenarios. Minerals 2018, 8, 156. [Google Scholar] [CrossRef] [Scilit]
- Mudd, G.M.; Jowitt, S.M.; Werner, T.T. The world’s by-product and critical metal resources part I: Uncertainties, current reporting practices, implications and grounds for optimism. Ore Geol. Rev. 2017, 86, 924–938. [Google Scholar] [CrossRef] [Scilit]
- Sheffi, Y. The Resilient Enterprise: Overcoming Vulnerability for Competitive Advantage; MIT Press: Cambridge, MA, USA, 2005. [Google Scholar]
- Christopher, M.; Peck, H. Building the resilient supply chain. Int. J. Logist. Manag. 2004, 15, 1–13. [Google Scholar] [CrossRef] [Scilit]
- Ponomarov, S.Y.; Holcomb, M.C. Understanding the concept of supply chain resilience. Int. J. Logist. Manag. 2009, 20, 124–143. [Google Scholar] [CrossRef] [Scilit]
- Sprecher, B.; Daigo, I.; Murakami, S.; Kleijn, R.; Vos, M.; Kramer, G.J. Framework for resilience in material supply chains, with a case study from the 2010 rare earth crisis. Environ. Sci. Technol. 2015, 49, 6740–6750. [Google Scholar] [CrossRef] [Scilit] [PubMed]
- Jabbarzadeh, A.; Fahimnia, B.; Sabouhi, F. Resilient and sustainable supply chain design: Sustainability analysis under disruption risks. Int. J. Prod. Res. 2018, 56, 5945–5968. [Google Scholar] [CrossRef] [Scilit]
- Macal, C.M.; North, M.J. Tutorial on agent-based modelling and simulation. J. Simul. 2010, 4, 151–162. [Google Scholar] [CrossRef] [Scilit]
- Tesfatsion, L.; Judd, K.L. (Eds.) Handbook of Computational Economics, Volume 2: Agent-Based Computational Economics; Elsevier: Amsterdam, The Netherlands, 2006. [Google Scholar]
- Axelrod, R. The Complexity of Cooperation: Agent-Based Models of Competition and Collaboration; Princeton University Press: Princeton, NJ, USA, 1997. [Google Scholar]
- Holland, J.H. Hidden Order: How Adaptation Builds Complexity; Addison-Wesley: Reading, MA, USA, 1995. [Google Scholar]
- Park, J.S.; O’Brien, J.C.; Cai, C.J.; Morris, M.R.; Liang, P.; Bernstein, M.S. Generative agents: Interactive simulacra of human behavior. In Proceedings of the 36th Annual ACM Symposium on User Interface Software and Technology (UIST 2023), San Francisco, CA, USA, 29 October–1 November 2023; pp. 2:1–2:22. [Google Scholar]
- Gao, C.; Lan, X.; Li, N.; Yuan, Y.; Ding, J.; Zhou, Z.; Xu, F.; Li, Y. Large language models empowered agent-based modeling and simulation: A survey and perspectives. Humanit. Soc. Sci. Commun. 2024, 11, 1259. [Google Scholar] [CrossRef] [Scilit]
- Wang, L.; Ma, C.; Feng, X.; Zhang, Z.; Yang, H.; Zhang, J.; Chen, Z.; Tang, J.; Chen, X.; Lin, Y.; et al. A survey on large language model based autonomous agents. Front. Comput. Sci. 2024, 18, 186345. [Google Scholar] [CrossRef] [Scilit]
- Pfeffer, J.; Salancik, G.R. The External Control of Organizations: A Resource Dependence Perspective; Harper & Row: New York, NY, USA, 1978. [Google Scholar]
- Gereffi, G.; Humphrey, J.; Sturgeon, T. The governance of global value chains. Rev. Int. Polit. Econ. 2005, 12, 78–104. [Google Scholar] [CrossRef] [Scilit]
- Weibull, J.W. Evolutionary Game Theory; MIT Press: Cambridge, MA, USA, 1995. [Google Scholar]
- United Nations. UN Comtrade Database; United Nations Statistics Division: New York, NY, USA, 2025. [Google Scholar]
- London Metal Exchange. Historical Nickel Prices and Inventory Data; LME: London, UK, 2025. [Google Scholar]
- General Administration of Customs of the People’s Republic of China. China Mineral Products Import and Export Statistics; General Administration of Customs of the People’s Republic of China: Beijing, China, 2024. [Google Scholar]

Disclaimer/Publisher’s Note: The statements, opinions and data contained in all publications are solely those of the individual author(s) and contributor(s) and not of MDPI and/or the editor(s). MDPI and/or the editor(s) disclaim responsibility for any injury to people or property resulting from any ideas, methods, instructions or products referred to in the content. |
© 2026 by the author. Licensee MDPI, Basel, Switzerland. This article is an open access article distributed under the terms and conditions of the Creative Commons Attribution (CC BY) license.