


Abstract
Promoting the coordinated development of urban resilience (Ur) and urban land use efficiency (Ulue) is key to solving regional sustainable development challenges. Based on panel data of relevant indicators from the Yangtze River Economic Belt (YREB) for the period 2011–2024, this study employs the coupling coordination degree model, kernel density estimation, and exploratory spatial analysis tools to analyze the spatiotemporal differentiation characteristics and spatial correlation of the coupling coordination degree between Ur and Ulue (Uucc). And the spatial patterns of Uucc driving factors are investigated using the Geographically Weighted Regression (GWR) method. The results indicate: (1) In terms of the temporal dimension, the Uucc in the YREB shows an upward trend, with its level continuously improving. The number of cities with higher Uucc levels gradually increases, exhibiting multi-center and multi-layered characteristics. (2) In the dimension of space, Uucc exhibits strong spatial correlation. LISA high-value clusters are concentrated in the downstream region of the YREB, while low-value clusters are found in the upstream and midstream regions. The spatial clustering presents a pattern of “large dispersion, small agglomeration”. (3) The driving factors of Uucc display significant spatial heterogeneity. Urbanization, government regulation capacity and technological innovation are the dominant drivers in the downstream region. Urbanization has a significantly positive effect on Uucc, while its impact gradually weakens from the downstream to the midstream and upstream regions. Urbanization and openness level are the dominant drivers in the midstream region. This study provides references for governments to formulate differentiated policy for different regions.
1. Introduction
As complex social ecosystems, cities play a crucial role in ecological governance and sustainable development. With the acceleration of urbanization, challenges such as aging urban infrastructure, shortages in public service facilities, difficulties in responding to sudden disasters, inefficient land use, and ecological environmental degradation have become increasingly prominent. These challenges hinder the enhancement of Ur, rational spatial utilization, and high-quality urban development. High-resilience cities can withstand risks, respond flexibly, recover and continue to develop when confronted with external shocks and internal disturbances [1,2,3]. With the rapid expansion of urban scale, the Ulue has also become a significant topic of academic interest. Improving Ulue can promote sustainable economic growth [4,5,6], optimize spatial layout and achieve intensive transformation, while also facilitating environmental protection and improving people’s livelihoods [7,8]. Therefore, achieving the synergy between and Ulue has become the core path for enhancing the overall competitiveness of cities [9,10,11].
Scholars’ research on Ur and Ulue focuses on evaluation framework, spatial analysis, driving factors, and improvement strategies, among other aspects. The socioeconomic conditions, infrastructure, and ecological environment of Ur were measured using models such as the entropy-weighted TOPSIS model and network big data analysis [12,13,14,15]. The research focuses on examining the spatio-temporal evolution characteristics of resilience levels, the urban resilience factors, as well as its relationship with economic development and urbanization level. Mainly, regression analysis and big data methods are used to quantify the extent of the influence of factors such as economic development and urbanization.
Ulue evaluation indicators encompass both inputs and outputs [16,17]. The evaluation index system for land, capital, and labor was measured using methods such as the Super-SBM, SFA, DEA, and the Malmquist index [18,19,20]. Research content usually uses spatial correlation analysis, the Gini coefficient, and gravity center models to interpret the spatiotemporal differentiation distinctions of Ulue [21]. Studies on driving factors mainly utilize Tobit models [22,23], GMM models [24], and gray correlation degree models to measure the influence of socioeconomic factors, such as regional GDP [25], industrial structure, fixed capital formation, public service facilities, land marketization level, foreign direct investment (FDI), urban spatial compactness, urbanization, land revenue distribution systems, and regional integration on Ulue. Scholars hold that the Uucc shows distinct spatial differentiation characteristics, which are shaped by variables including urbanization, regional GDP, ecological pressure, technological level, infrastructure, and government regulatory capacity [26,27].
Furthermore, studies on the relationship between Ur and mostly employ coupling coordination models, spatial analysis methods, etc., They conduct empirical investigations on the coordination level and spatio-temporal evolution characteristics of the two. They often use spatial Durbin models, Tobit models, etc. to measure the influence degree of factors such as government fiscal expenditure, environmental governance, scientific and technological innovation, and opening up to the outside world on Uucc [28,29]. Ulue determines the urban spatial structure and resource allocation level, aiming to enhance the ability of the city to withstand shocks and recover quickly; Ur reduces risks and ensures stable operation, thereby promoting long-term efficient land utilization. Uucc is the key support for achieving efficient urban economy, resource conservation, social equity and ecological security, and is an inherent requirement for sustainable urban development. These studies expand the conceptual boundaries of Ur multidimensionality and Ulue, establish a multidimensional indicator system to measure resilience and efficiency, reveal their spatiotemporal evolution and influencing factors, and provide theoretical guidance and empirical references for subsequent research.
Previous work has yielded fruitful results, but research gaps remain. First, the interplay between Ur and Ulue lacks a robust theoretical foundation; second, few studies have empirically traced the spatio-temporal dynamics of the coupled and coordinated development on both; third, scholars have paid insufficient attention to the processes and drivers that enable the synergistic coupling of both. Therefore, scientifically measuring the development level of Uucc and its influencing factors is a critical issue in the process of urban development. The primary objectives of this research are to delineate the spatiotemporal patterns of Ur and to identify its key driving factors, and the relationship between Ur and economic development and urbanization. Methods like quantitative techniques, notably regression modeling are mainly applied to measure the influence of factors such as economic development, urbanization, government support, openness level, transportation convenience, and environmental regulations.
The YREB is China’s most economically powerful belt with enormous development potential and the broadest influence. In 2025, the economic output will account for 47% of the national total. However, the YREB, which covers 21% of the country’s land, is home to over 40% of the population. It is an extremely intensive and densely developed area, facing issues such as tight land resources, the need for continuous improvement in utilization efficiency, significant pressure on urban systems when responding to risks, prominent contradictions between people and land, and uncoordinated regional development. Enhancing the overall Ur and Ulue has become more complex and urgent [30]. Against this backdrop, this research focuses on 108 cities within the YREB. The entropy method and the SBM model are applied to evaluate Ur and Ulue from 2011 to 2024, respectively. Kernel density estimation and ArcGIS 10.5 are employed to elucidate the spatiotemporal dynamics and spatial correlation of Uucc from a spatiotemporal interaction perspective. Finally, the GWR model is applied to quantify the spatial differentiation characteristics of Uucc driving factors. The research results provide directional guidance and decision-making basis for rational land use planning, improving urban form and boosting resilience capacities.
2. Coupling Coordination Mechanism
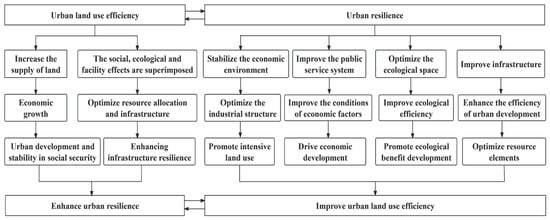
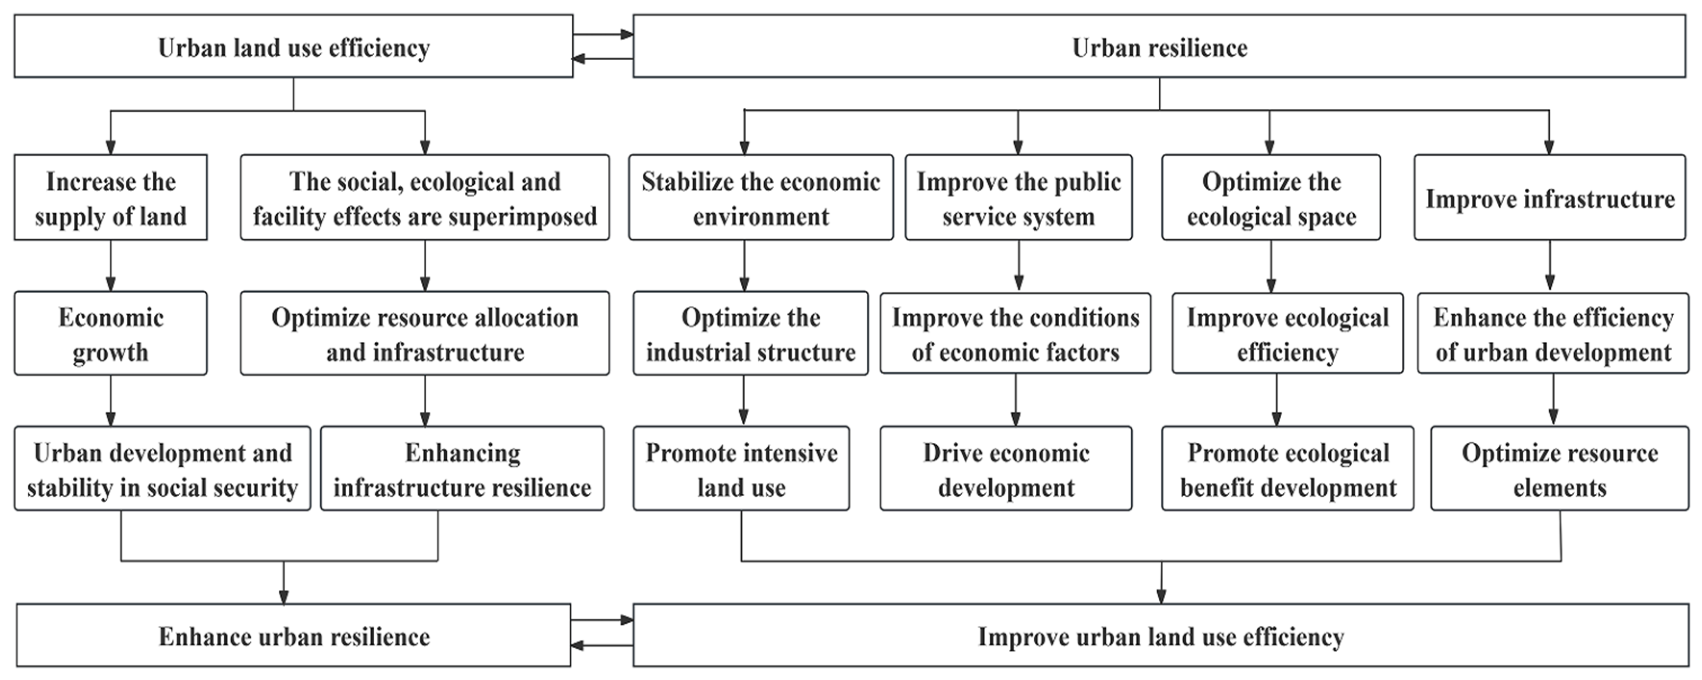
Scholarly discourse on Ur centers on the enduring capability of metropolitan systems to absorb, adapt, and evolve when confronted with internal and external pressures. Ulue emphasizes the intensiveness of land resource allocation and the synergy of multiple benefits. They are core dimensions supporting sustainable urban development. The essence of their coupling and coordination mechanism is to achieve complementarity of resources and elements, enhance the overall efficiency of the urban system through positive feedback loops, and promote development of new urbanization, as shown in Figure 1.
Figure 1.
Analysis of the Coordination Mechanism between Ur and Ulue.
The improvement of Ulue provides multi-dimensional support for enhancing Ur. First, enhancing the efficiency of land use unlocks the potential for capital, technological innovation, and labor to substitute for scarce land, expand the economic supply capacity of land, and leverage the advantages of industrial agglomeration and economies of scale, thereby a more sustainable and resilient economic structure. Consequently, the enhancement of Ulue contributes to strengthening urban economic resilience. Second, vigorous economic development can prompt the government to increase fiscal investment in social public services, Building systemic resilience for urban risk management. Therefore, efficiency gains in land utilization can drive social resilience through economic development. Third, the higher level of Ulue can maintain an appropriate ecological capacity by adopting a compact layout, optimizing the spatial configuration of green spaces, water systems and ecological corridors, and reasonably controlling the development intensity. This can enhance environmental sustainability, ecosystem services and ecological capacity, and jointly support a stable, highly resistant to interference and highly efficient urban system. Therefore, enhancing the efficiency of land utilization is a critical driver for strengthening urban ecological resilience. Fourth, the efficient use of land can effectively aggregate various factors, promote the urban resource allocation and infrastructure layout, and promote the resilience and carrying capacity of urban facilities. The optimization of Ulue helps to enhance urban facility resilience.
The social, economic, ecological, and infrastructural dimensions of Ur collectively contribute to higher Ulue. High-level economic resilience accelerates the concentration of factors by creating a stable environment, promotes the optimization and upgrading of the industrial structure and specialized division of labor. It facilitates the growth of economies of scale and the increase in industrial added value, thereby enhancing the degree of land utilization intensification and the yield per unit area, and improving Ulue. Therefore, economic resilience is the core driving force for enhancing Ulue. Cities with high social resilience have a sound public service. Through the welfare economic suction effect, they can improve the conditions of labor, investment, and other factors, drive high-quality urban economic development, and impose higher requirements on resource allocation and utilization efficiency, thereby forcing the improvement of Ulue. Strong ecological resilience enables urban ecosystems to have excellent resistance and recovery capabilities, stable and sustainable functions, and can coordinate the relationships among production, living, and ecological spaces, reaching higher economic and ecological outcomes at a lower resource and environmental cost [31], establishing the groundwork for promoting the optimal use of land. As the “lifeline” of urban development, a sound urban infrastructure configuration can optimize urban resource allocation and improve development efficiency [32], providing key support for the efficient use of land. Through the interaction of spatial intensification, functional diversity, and system connectivity, Ur and Ulue form a positive cycle of efficient utilization, resource conservation, risk reduction, enhanced adaptability, and further optimized utilization.
3. Materials and Methods
3.1. Research Methods
3.1.1. Entropy Method
The entropy method is an objective weighting method, reflecting the degree of dispersion of each indicator [33,34]. It is used in multi-indicator decision analysis to determine indicator weights, reducing bias from subjective judgment.
where and represent the standardized values of the indicator for the city; is the original data of the indicator for the city; and are the maximum and minimum values of the indicator, respectively; is the proportion of the indicator for the city; is the entropy value of the indicator; is the information utility value of the indicator; is the weight of the indicator; is the comprehensive resilience score for the city.
3.1.2. Super-Efficiency SBM Model
The Super-SBM model is used to measure Ulue [35,36,37]. This model is a comprehensive evaluation method considering multiple inputs and outputs, addressing slack issues, capable of measuring undesired outputs, and solving the problem of multiple decision-making units having efficiency scores of 1, overcoming limitations of other methods.
Assume there are n each type of inputs , types of desirable outputs , and types of undesirable outputs .
- The model is:
3.1.3. Coupling Coordination Degree Model
Drawing on relevant research [38,39], The coupling degree model reflects the interaction and mutual influence between two variables.
where is the coupling degree between Ur and Ulue; is the Ur level; is the Ulue level.
The can determine the strength of the interaction between Ur and Ulue in the YREB, but it cannot evaluate the Uucc development and evolution. Therefore, the formulasare as follows [40,41].
where represents the Uucc; represents the comprehensive evaluation index of Ur and Ulue. Based on existing research results [42,43], this study considers and equally important, so both and are assigned a value of 0.5. Referring to relevant literature, is classified into six levels: Advanced coordination (1 ≥ > 0.8), Intermediate coordination (0.8 ≥ > 0.6), Primary coordination (0.6 ≥ > 0.4), Mild dissonance (0.4 ≥ > 0.3), Moderate dissonance (0.3 ≥ > 0.2), and Severe dissonance (0.2 ≥ > 0).
3.1.4. Kernel Density Estimation
KDE uses a smooth continuous density curve to describe the overall trend. effectively revealing the potential distribution characteristics of data [44,45,46].
where represents the number of cities; represents the bandwidth; is the kernel function; is the Uucc of the city; is the average Uucc of all cities in the study region. This study selects the Gaussian kernel function to calculate the kernel density curve of Uucc.
3.1.5. Spatial Correlation Analysis Method
The Global Moran’s I index is used to identify the spatial agglomeration and dispersion effects of Uucc and test its spatial correlation [47,48]. Its value ranges from [−1, 1]. The greater the absolute value of the Uucc among cities, the higher the spatial correlation.
where represents the number of cities = 108; and represent the Uucc for cities and , respectively; is the average Uucc for the 108 cities; is the spatial adjacency matrix.
To further explore the spatial autocorrelation and its significance of Uucc in local areas, the Local Indicator of Spatial Association (LISA) index is introduced to reflect the agglomeration of Uucc in each city [49].
3.1.6. Geographically Weighted Regression Model
The GWR model can reveal the characteristics of parameters changing with spatial location and detect spatial non-stationarity [50]. It can quantitatively reflect the heterogeneous influence of explanatory variables at different sample points and visually express the local spatial relationships between explanatory variables [51].
where X and Y are the explanatory and explained variables; are the longitude and latitude coordinates of variable ; is the number of research variables; is the regression constant; is the regression parameter; represents the residual. This paper adopts the AICc criterion and adaptive bandwidth.
3.2. Construction of Indicator Systems
3.2.1. Ur
A city is a highly complex giant system composed of multiple elements such as society, ecology, and infrastructure, facing numerous external shocks and internal disturbances. Conceptualized as a systemic property, Ur enables a city to persist and evolve sustainably through disturbances that impact its economic, social, ecological, and infrastructure subsystems [52,53,54,55,56]. Specific indicators are shown in Table 1.
Table 1.
Comprehensive Evaluation Indicator System for Ur.
3.2.2. Ulue
Ulue is a comprehensive concept used to measure the utilization degree and output effect of urban land resources in socio-economic activities. It includes the input-output ratio of all factors, reflecting the intensive and rational of land resources. Considering that urban land use not only generates economic, social, and ecological benefits but also causes ecological losses, guided by concepts such as green development and sustainable development, and drawing on the green development efficiency evaluation model and existing research, Build the system from three aspects [57,58]. Specific indicators are shown in Table 2. The environmental pollution index (without units) is composed of the per capita emissions of industrial smoke dust (kg/person·year), sulfur dioxide (t/person·year) and wastewater (m3/person·year). First, the three indicators are standardized, then the weighted sum is calculated to obtain the comprehensive environmental pollution index.
Table 2.
Comprehensive Evaluation Indicator System of Ulue.
3.3. Data Sources
This study takes 108 prefecture-level and above cities of the YREB from 2011 to 2024 as the research objects. The data are sourced from the statistical yearbooks and social development statistical bulletins of each city, interpolation is used to fill in some missing data.
4. Results Analysis
4.1. Spatiotemporal Changes in Ur and Ulue
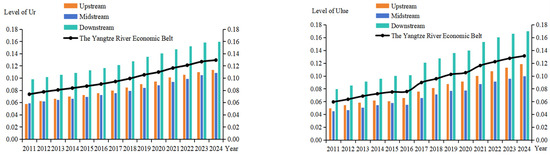
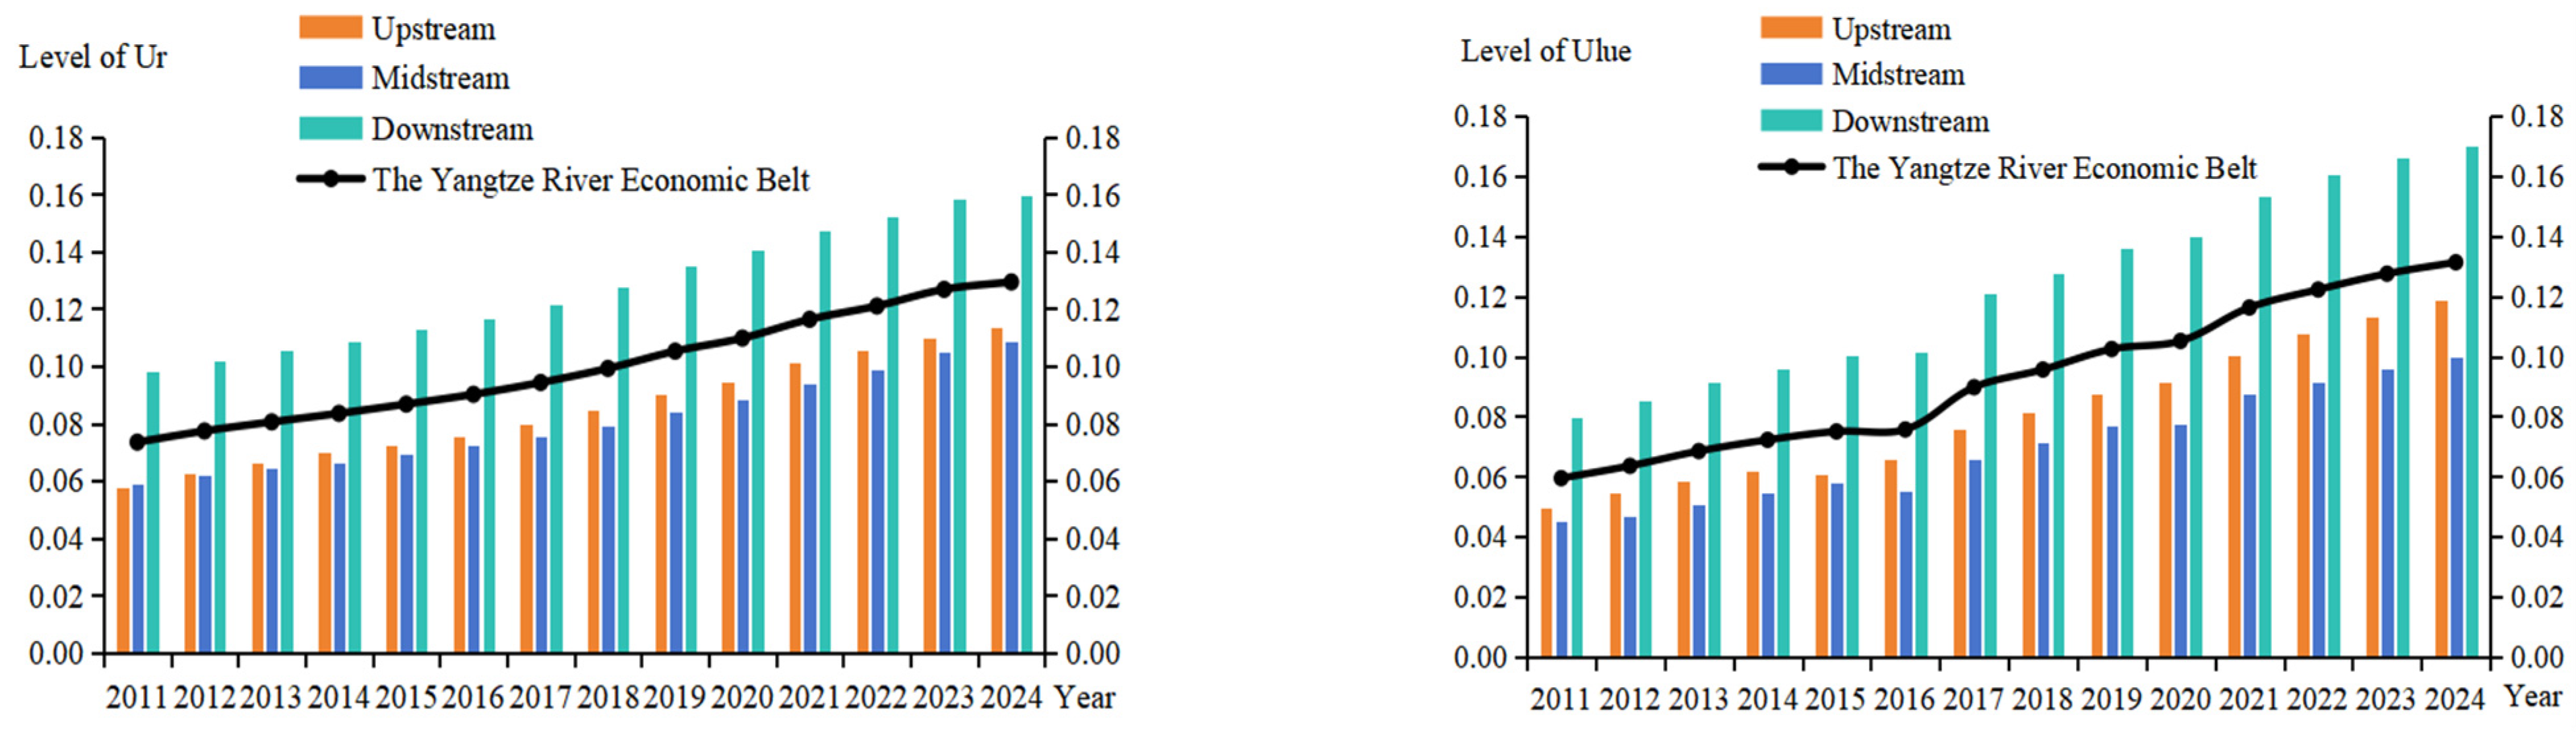
Using the entropy method to calculate the comprehensive Ur score and the super-efficiency SBM model to evaluate Ulue, the results are presented in Figure 2. From the temporal evolution perspective, Ur and Ulue in the YREB showed an overall growth trend from 2011 to 2024. Ur in the upstream region increased from 0.0576 in 2011 to 0.1133 in 2024, with an average annual growth rate of 0.4281%. Ulue increased from 0.0497 to 0.1187, with an average annual growth rate of 0.5311%. In the midstream region, Ur increased from 0.0590 to 0.1088, with an average annual growth rate of 0.3829%. Ulue increased from 0.0450 to 0.0998, with an average annual growth rate of 0.4213%. Although both showed a growth trend, the growth rate was relatively moderate, indicating significant development potential in the future. In the downstream region, Ur increased from 0.0980 to 0.1593, with an average annual growth rate of 0.4716%. Ulue increased from 0.0794 to 0.1702, with an average annual growth rate of 0.6983%, showing a clear accelerating development trend. The level and growth rate of both Ur and Ulue show the development trend of downstream region > upstream region > midstream region.
Figure 2.
Temporal Evolution of Ur and Ulue in the YREB.
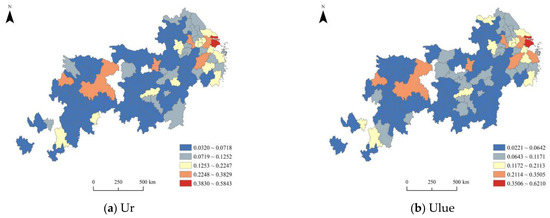
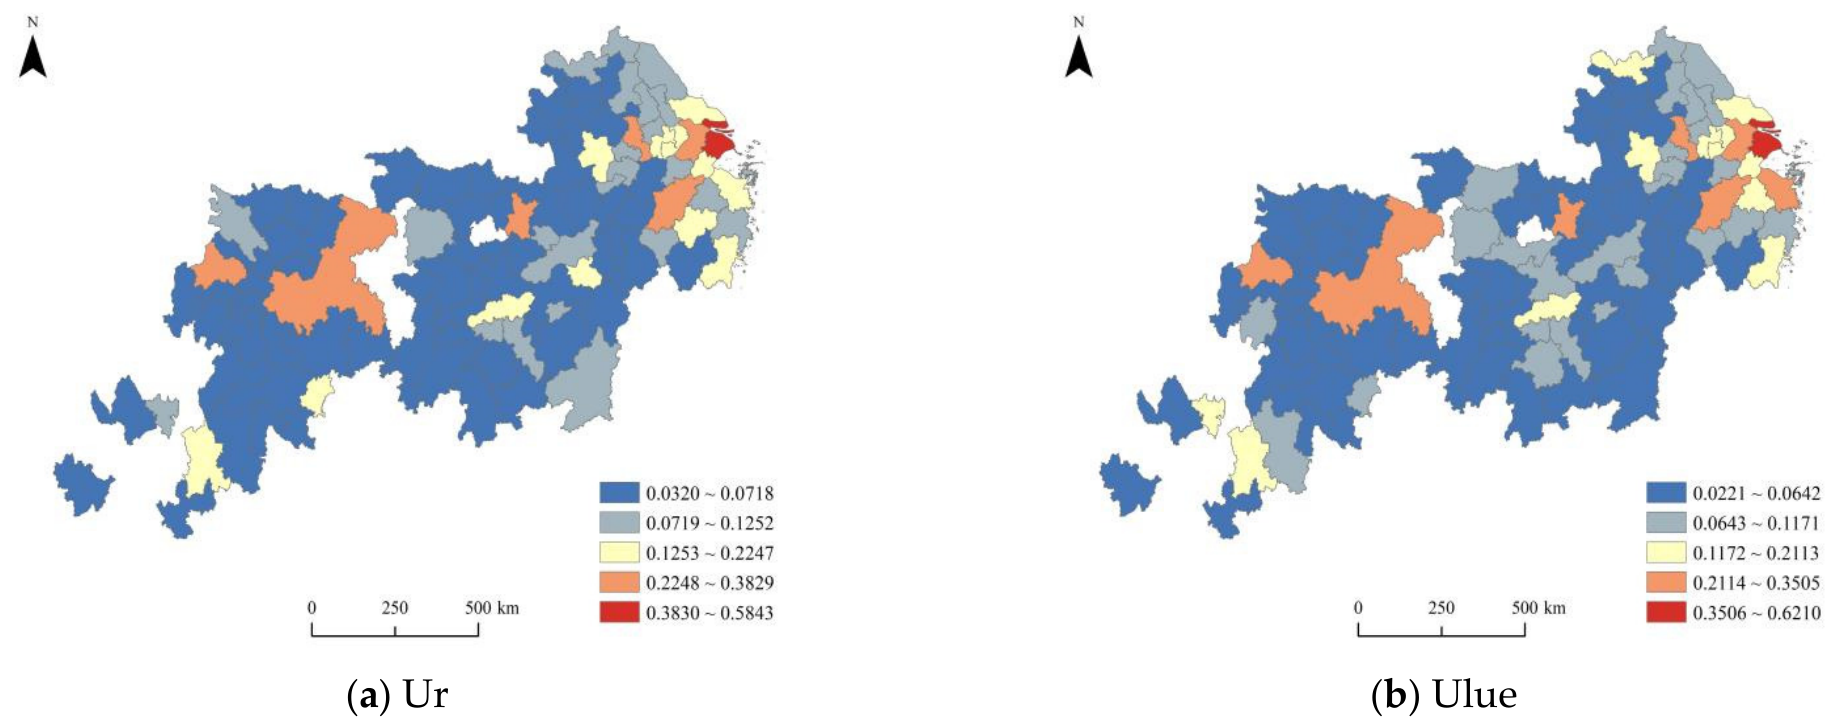
Using the natural breaks method, Ur and Ulue are divided into five levels (Figure 3). Red represents the first grade, indicating the highest Ur and Ulue, while blue represents the fifth grade, indicating the lowest Ur and Ulue. From the spatial pattern perspective, the first level of Ur and Ulue is mainly Shanghai. The second level is more scattered, showing a sporadic distribution. The third and fourth levels are concentrated in the downstream region, showing a block-like distribution. The fifth level is concentrated in the midstream and upstream regions, showing a flake-like distribution. Overall, regional differences are significant. Both Ur and Ulue show a spatial pattern of “high in downstream region, low in midstream and upstream regions”. The reason is that the higher degree of openness to the outside world and the diversified industrial layout in the downstream regions are conducive to enhancing the urban innovation capacity and the ability to deal with complex challenges. Advanced urban planning and management levels, along with the agglomeration effect of industries, can optimize land use. Therefore, Ur and the level of Ulue in the downstream regions are relatively high.
Figure 3.
Spatial Pattern of Ur and Ulue in the YREB (2011–2024).
In the upstream region, Ur and Ulue of Chongqing and Chengdu are at the second level, while most cities are at the fifth level, but have great development potential. Due to the abundant resources in the upstream regions, the well-developed transportation infrastructure has facilitated the connection between the middle and upstream regions, promoting continuous rapid economic development and continuous optimization of the industrial structure, enhancing the city’s emergency response and resource allocation capabilities. Meanwhile, scientific land planning and control have optimized land resource allocation, driving the city’s transformation toward high-quality development.
By calculating the average values of Ur and Ulue levels of 108 cities in the YREB from 2011 to 2024, the Ur and Ulue levels of cities in the midstream region are at the fourth and fifth grades respectively. This is because the development of emerging industries and service industries in the midstream region is relatively insufficient, and the industrial structure is not optimized enough. Therefore, the economic stability and risk resistance capacity are relatively weak. Moreover, the urban development concepts and land planning levels in the midstream region need to be improved. The industrial development level and agglomeration degree are not as good as those in the downstream region. The implementation and supervision of policies on land resource management and conservation and intensive utilization need to be further strengthened.
4.2. Spatiotemporal Evolution Characteristics of Uucc
4.2.1. Temporal Evolution Characteristics of Uucc
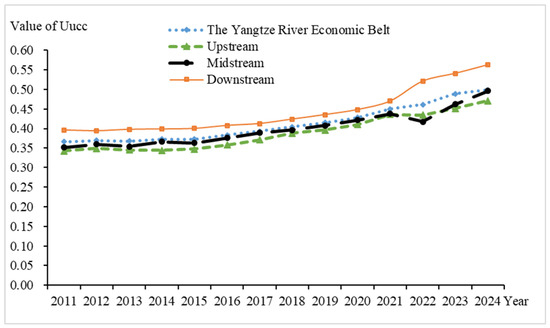
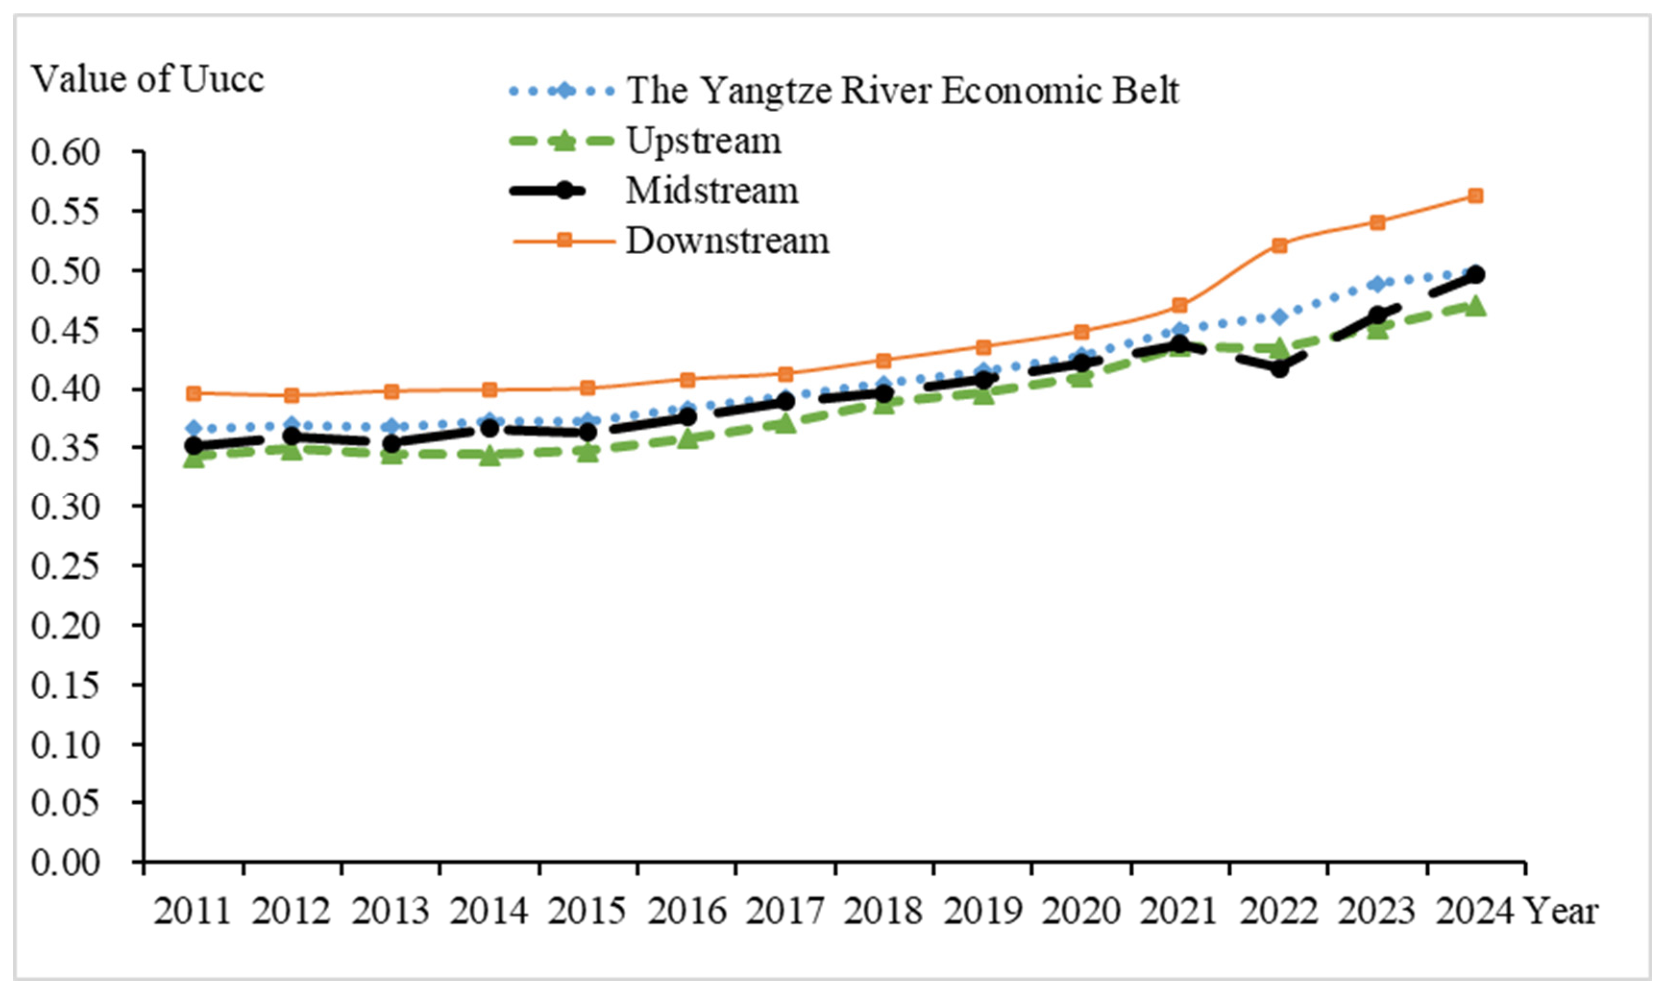
Figure 4 illustrates the temporal evolution of Uucc in the YREB. Overall, Uucc exhibited a positive development trajectory throughout the study period. The mean Uucc for the YREB was 0.4441, increasing from 0.3661 in 2011 to 0.4987 in 2024, with an average annual growth rate of 1.0202%. The mean Uucc for the downstream region was 0.4777, increasing from 0.3962 in the base year to 0.5622 in the final year, with an average annual growth rate of 1.2763%. The mean Uucc for the midstream region was 0.4308, increasing from 0.3520 to 0.4963, with an average annual growth rate of 1.1100%. The mean Uucc for the upstream region was 0.4191, increasing from 0.3426 to 0.4713, with an average annual growth rate of 0.9900%. Specifically, Uucc in the YREB and the downstream region showed a consistent upward trend. Uucc in the midstream and upstream region showed a trend of rising–falling–rising. High-value regions are mainly distributed in economically developed cities in the downstream region, while low-value regions are distributed in cities in the upstream region. The coupling coordination degree in the downstream region is higher than the level of the YREB, while the coupling coordination degrees in the midstream and upstream region are lower than that level.
Figure 4.
The variation of Uucc over time.
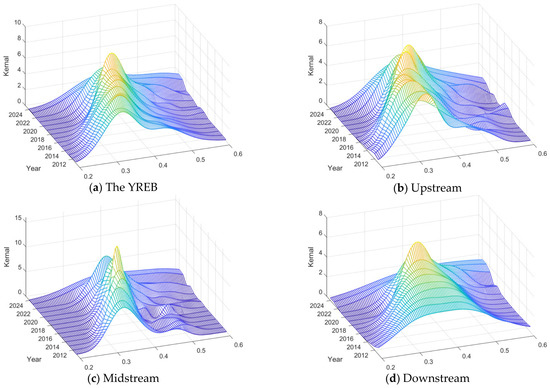
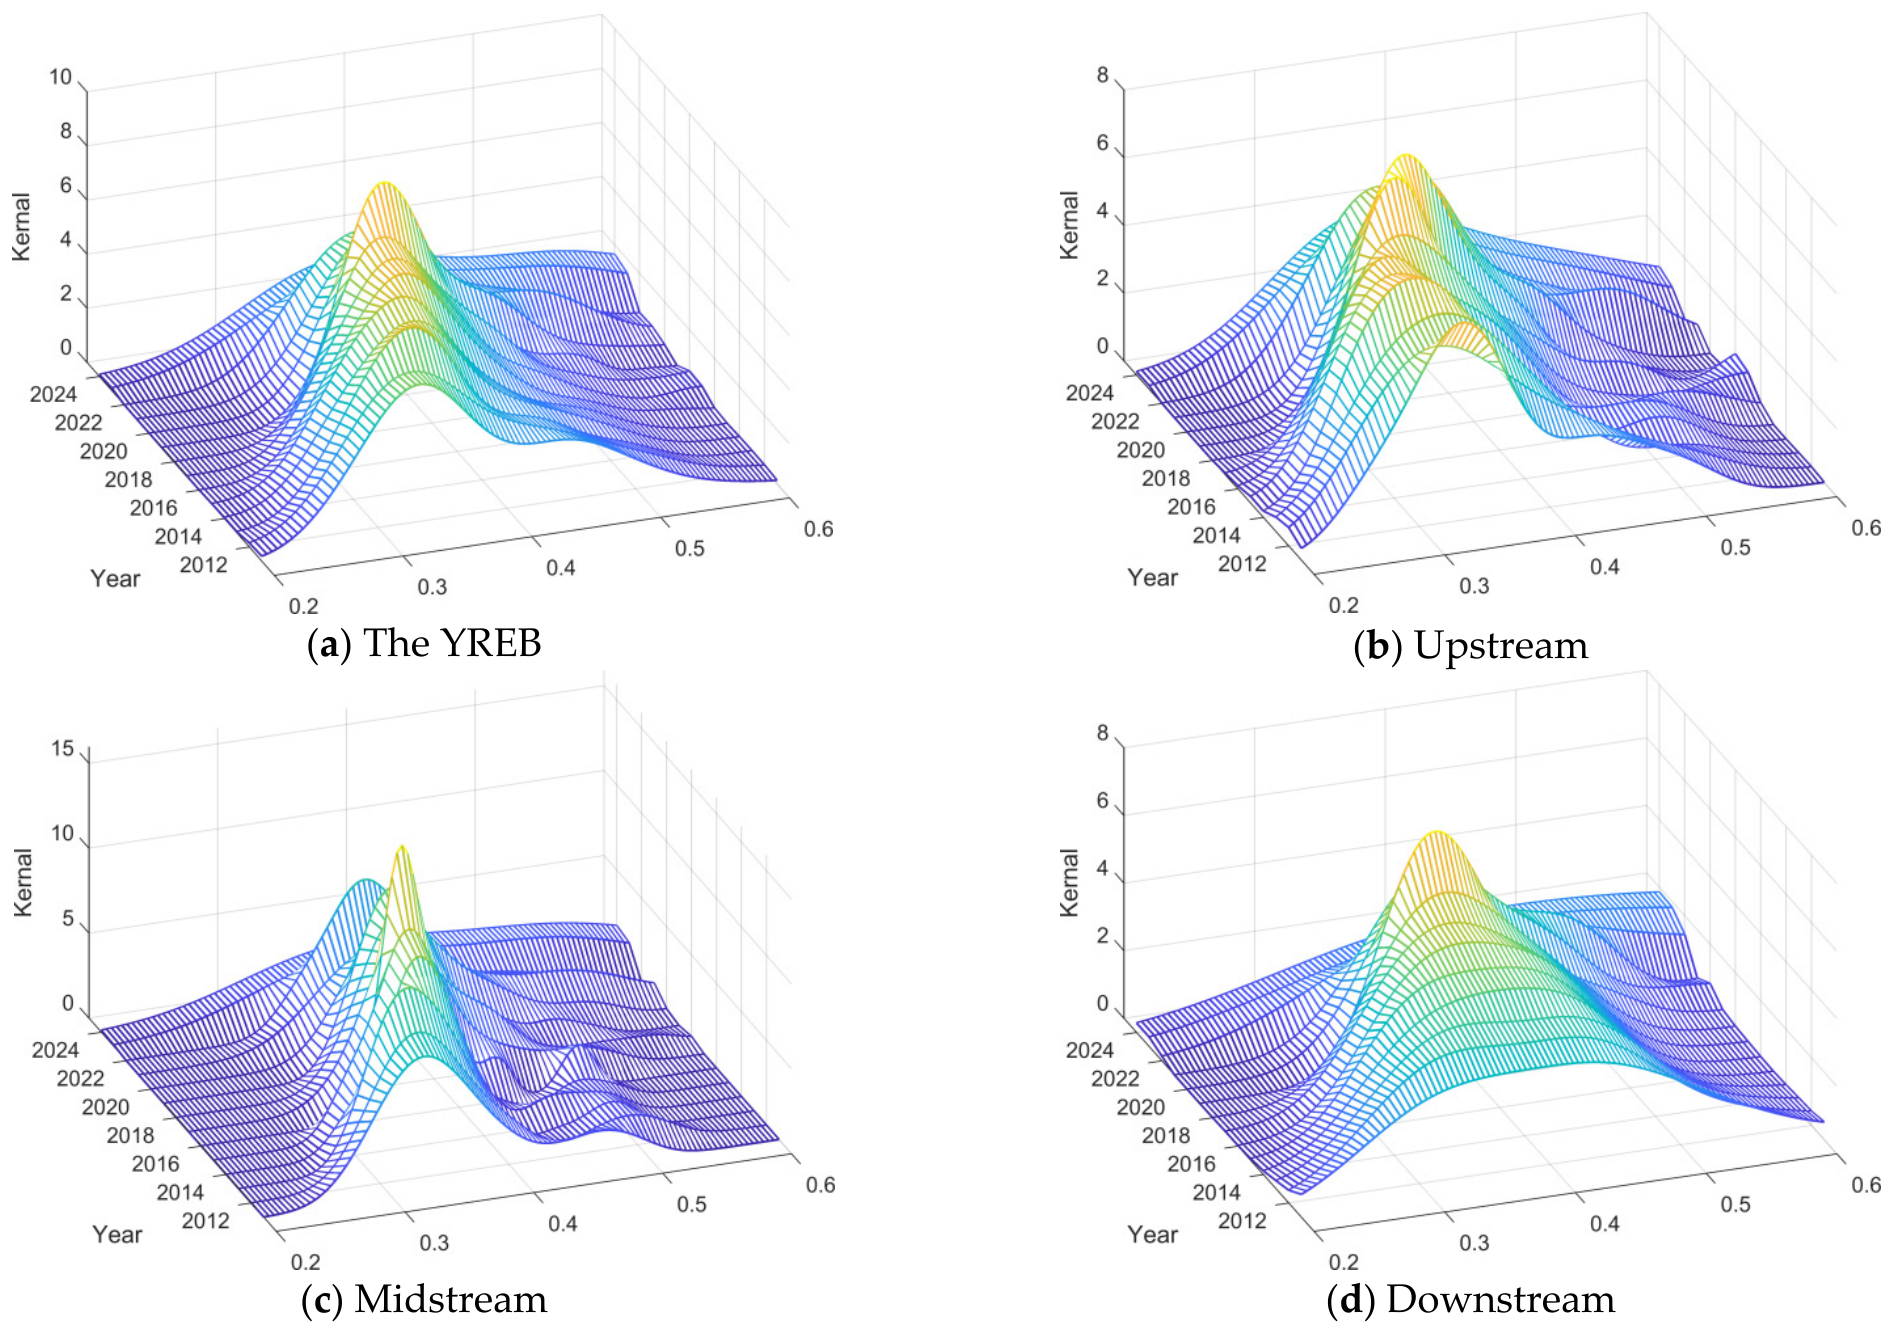
Using the Matlab R2023b software, we plotted the three-dimensional Gaussian kernel function distribution map of Uucc from 2011 to 2024. By comparing the kernel density curves across different times and regions, the dynamic trajectory of Uucc differences is revealed, the results are shown in Figure 5.
Figure 5.
Dynamic Evolution of Uucc.
From the perspective of distribution position and shape, the kernel density curves of Uucc across all regions exhibit an overall rightward shift, indicating a general improvement in Uucc levels. The main peak heights of the kernel density curves for the YREB, upstream, midstream, and downstream regions rise annually, evolving from broad peaks to sharper peaks. The peaks on the x-axis for the YREB, upstream, and midstream regions are concentrated between 0.3 and 0.4, while the downstream region’s peaks are concentrated between 0.3 and 0.5. This indicates regional convergence of Uucc within the peak range, revealing that the dispersion of Uucc in the downstream region decreases, and the multi-polarization trend weakens. Particularly in the downstream region, the change is more pronounced: the curves evolve from low peaks with large widths to higher peaks with smaller widths. This demonstrates that cities within each region can fully utilize their own advantages, leading to relatively balanced Uucc development within each region.
From the perspective of polarization characteristics, the kernel density curves of Uucc for the YREB, upstream, midstream, and downstream regions all show a unimodal distribution pattern. This indicates a gradual weakening of the multi-polarization phenomenon in Uucc, suggesting that during the process of improving Uucc levels, these regions utilize their own economic, social, and ecological capacities to mitigate the impact of external uncertainties.
From the perspective of distribution extensibility, the kernel density curve of Uucc across the entire YREB displays a right-skewed tail accompanied by several irregular bulges. This indicates that a few individual cities within the economic belt have relatively high Uucc levels. The kernel density curves for the upstream and midstream regions show significant right-skewed tails with numerous irregular protrusions. This reflects the existence of multi-polarization among individual cities in the processes of Uucc development. In contrast, the downstream region shows fewer tailing phenomena, indicating that the Uucc among cities in this region are relatively balanced, exhibiting no polarization characteristics.
4.2.2. Spatial Evolution Pattern of Uucc
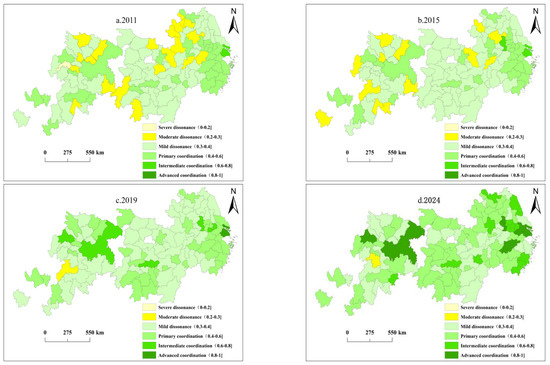
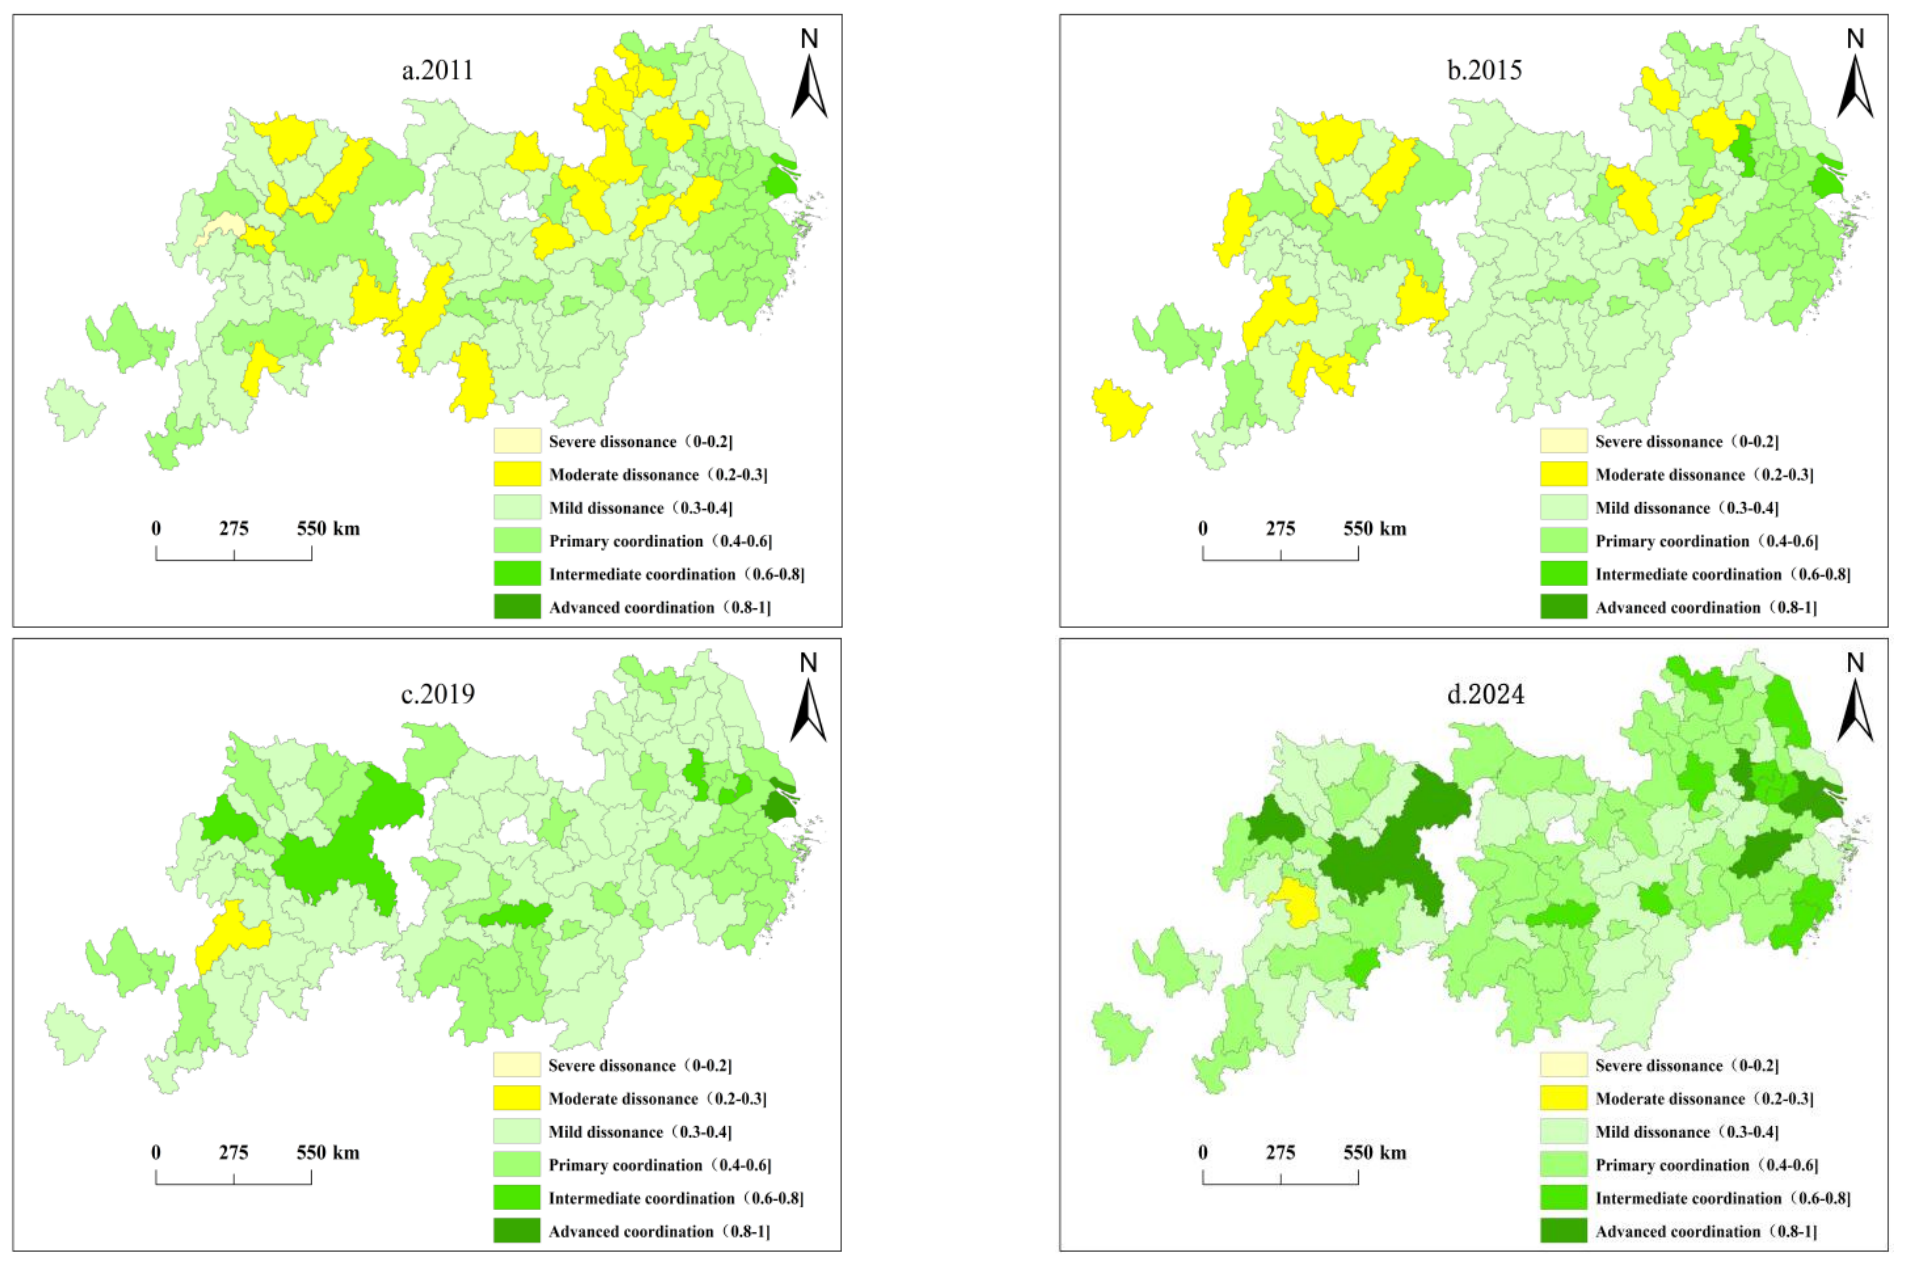
The spatial evolution trend of Uucc in the YREB is shown in Figure 6. In 2011, the coupling coordination degree of the YREB was relatively low. There were 32 cities at the primary coordination level, concentrated in Zhejiang Province, southern Jiangsu Province in the downstream region, and areas like Chongqing and Chengdu in the upstream region. moderate dissonance was distributed in the northwest of the downstream region and the northeast and southwest of the midstream region. In 2015, the range of moderate dissonance continued to shrink, while mild dissonance was distributed in the midstream region and its range expanded significantly, indicating the initial effectiveness of the Yangtze River Midstream Urban Agglomeration Development Plan. In 2019, the coupling coordination degree of the YREB overall improved. Shanghai’s coupling coordination degree rose to advanced coordination. Intermediate coordination was clustered in Nanjing (downstream), Changsha (midstream), Chengdu and Chongqing (upstream). The number of primary coordination cities increased to 37, mainly concentrated in the downstream and midstream regions. In 2024, the overall Uucc of the YREB further improved overall, and the number of cities with higher Uucc gradually increased. The number of advanced coordination cities increased to 6, concentrated in downstream (Shanghai, Nanjing, Hangzhou, Suzhou) and upstream (Chongqing, Chengdu). The number of intermediate coordination cities increased to 11, concentrated in the downstream region. The number of Primary coordination cities increased to 51, mainly in the downstream and midstream regions.
Figure 6.
Spatial Evolution and Distribution of Uucc.
Overall, from 2011 to 2024, the Uucc in the YREB gradually improved. Most cities evolved from moderate dissonance and mild dissonance to primary coordination and intermediate coordination. The number of primary coordination, intermediate coordination, and advanced coordination cities gradually increased. The Uucc in the downstream region was significantly higher than that of the midstream and upstream regions. The downstream region was the first to upgrade to advanced coordination. The areas at primary coordination, intermediate coordination, and advanced coordination gradually expanded towards the midstream and upstream regions, indicating significant spatial differences in the Uucc, presenting a spatial pattern of “high downstream and upstream, low midstream”.
The underlying reason lies in the robust economic foundations of downstream cities like Shanghai and Nanjing, enabling them to allocate greater resources toward urban development. Scientific government urban planning can promote the optimal allocation of land resources and enhance Ur and Ulue. The midstream region has a certain gap with the downstream region in terms of economic development level and industrial diversification. Its economic radiation scope and intensity are relatively limited, and its driving effect on surrounding cities is not strong enough, leading to room for improvement in Uucc development among cities within the region. Policy support intensity and implementation effectiveness are relatively weak, and support in terms of funds and technology for enhancing Ur and Ulue is relatively limited, affecting the overall improvement of Uucc. Chongqing in the upstream region is an important support for the YREB, with obvious industrial cluster effects. Its industrial layout fully considers factors such as topography and transportation, aligning industrial layout with regional coordinated development. Chengdu is one of the technology, culture, and financial centers in the southwest region. Its diversified industrial structure enables the city to cope with different shocks and improve Ur, while its innovation-driven development model also promotes efficient land use.
4.3. Analysis of Spatial Correlation in Uucc
To further examine the spatiotemporal evolution characteristics of Uucc in the YREB, an adjacency matrix was employed to calculate the Global Moran’s I index for Uucc, thereby enabling an assessment of the overall spatial agglomeration pattern. The results are shown in Table 3. Moran’s I values are all significantly positive, and all results are significant at the 5% level, indicating that there is a significant positive spatial correlation in Uucc within the YREB. Cities with similar coupling coordination degree levels show a certain degree of spatial agglomeration, meaning there are low-value or high-value agglomeration areas.
Table 3.
Moran’s I Statistics of Uucc.
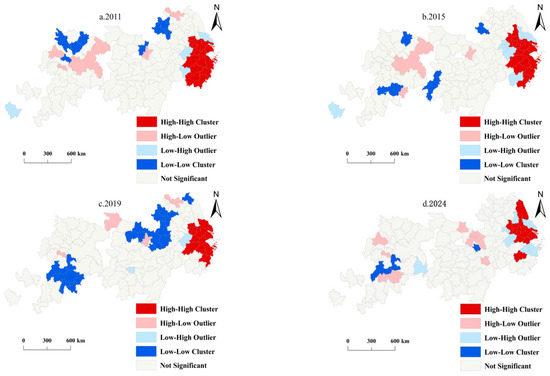
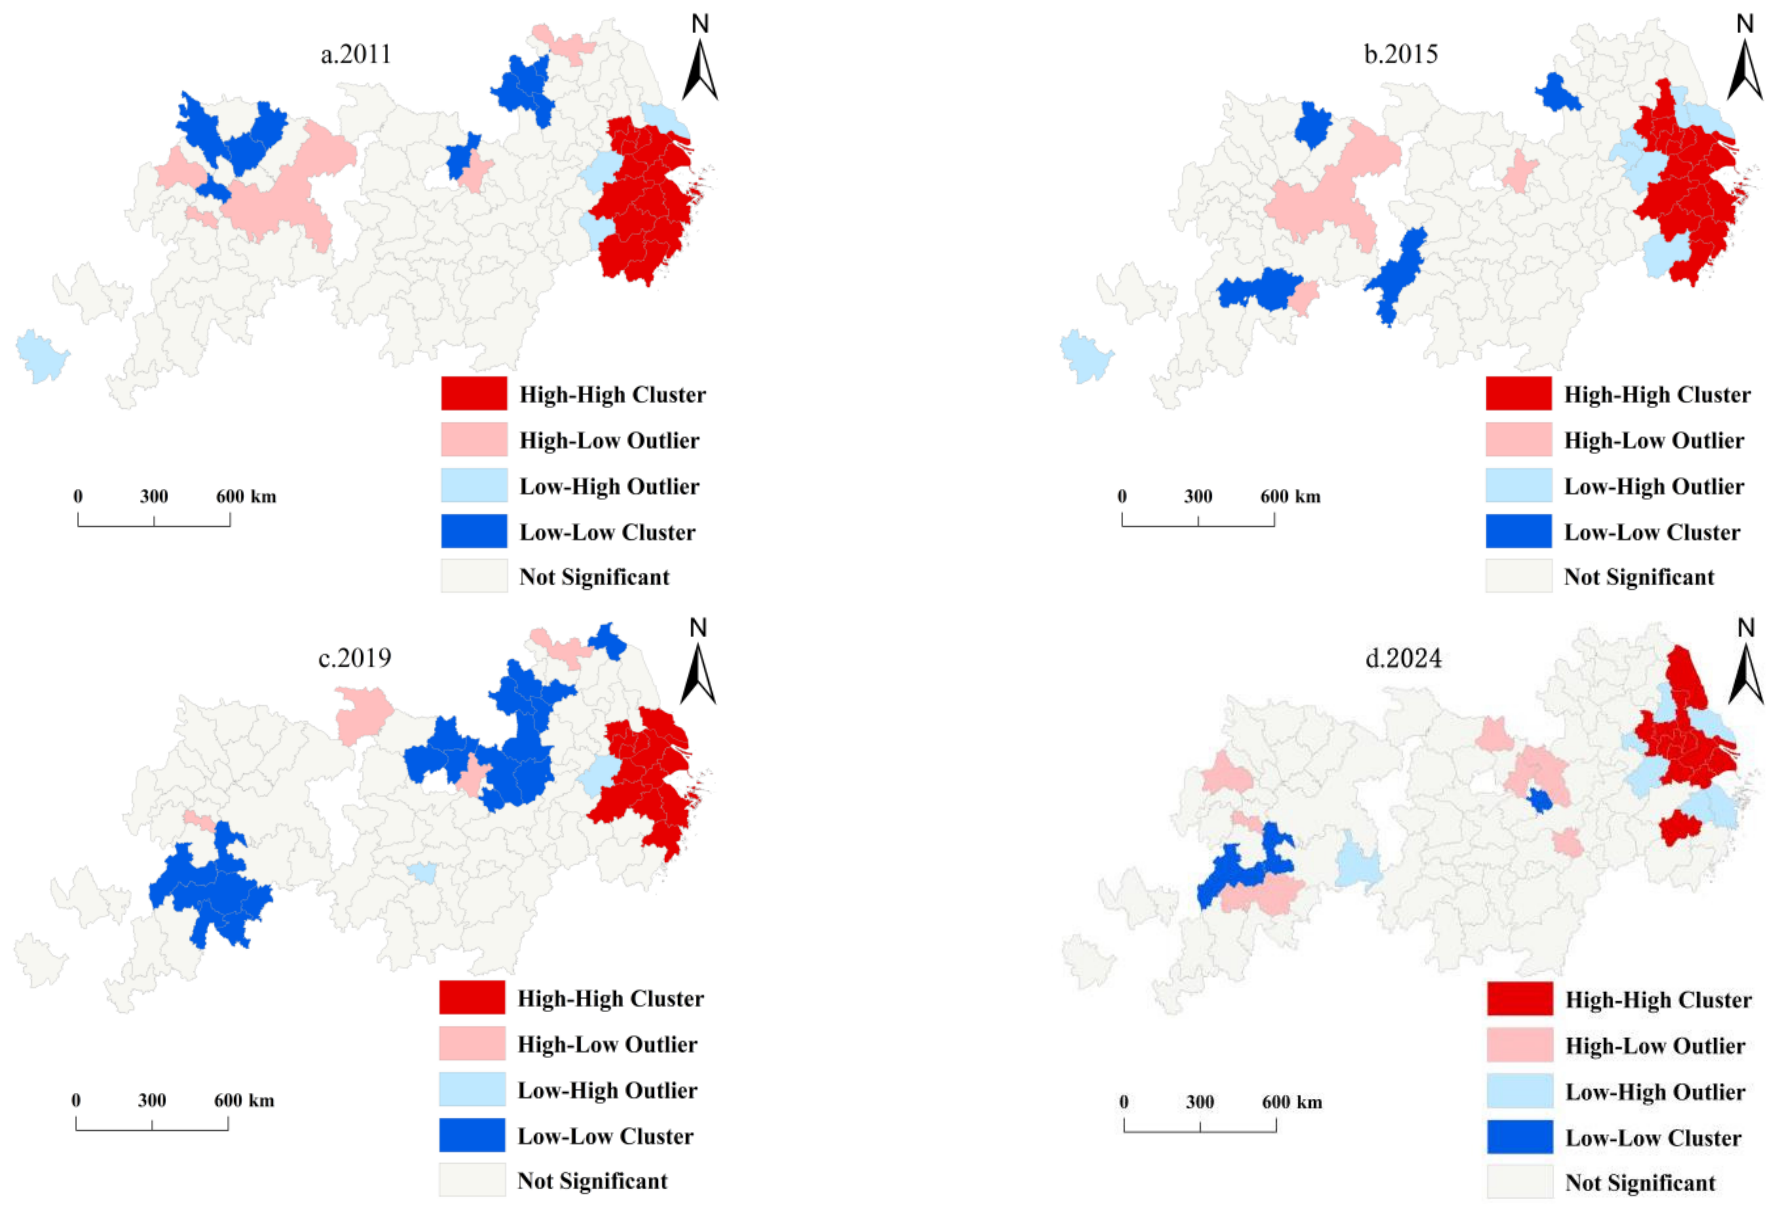
To analyze the local agglomeration distribution of Uucc in the YREB, this study selects four time nodes (2011, 2015, 2019 and 2024) to create LISA spatial clustering maps at the 5% significance level (Figure 7). From 2011 to 2024, Uucc in the YREB exhibits various clustering characteristics that are relatively significant. In 2011, high-value agglomeration (H-H) was distributed in the southeast of the downstream region. High-Low agglomeration (H-L) was distributed in patches in the upstream region. Low-High agglomeration (L-H) had the smallest distribution range, scattered in the downstream region. Low-value agglomeration (L-L) was distributed in patches in the northwest of the downstream region and the northern part of the upstream region. In 2015, the distribution positions of H-H and L-H were relatively stable. The range of L-H expanded slightly. The range of H-L changed slightly. L-L shifted to the upstream region and was more scattered. In 2019, H-H and L-H were still concentrated in the downstream region but their ranges were shrinking. The range of H-L shrank significantly and was scattered. The range of L-L showed an expanding trend, exhibiting low-value agglomeration characteristics in the northwest of the downstream region, the northeast of the midstream region, and the south of the upstream region. In 2024, the range of H-H further shrank. The range of L-H expanded and was distributed around H-H. The range of H-L expanded slightly but was scattered in the midstream and upstream regions. The range of L-L shrank rapidly and was scattered.
Figure 7.
LISA Spatial Patterns of Uucc.
In summary, H-H is mainly distributed in the downstream region, its range is continuously shrinking and showing a concentrated distribution trend. The downstream region has a strong economic foundation and good infrastructure, with balanced development of resource elements among cities. The range of H-L gradually became fragmented, distributed in the upstream and midstream regions from Chongqing and Chengdu. Abundant energy in this region can promote local economic development, but due to infrastructure and geographical location, its driving effect and attractiveness to surrounding cities are generally limited. L-H is mainly distributed around H-H, concentrated in the downstream region. Affected by the siphon effect of H-H, resource allocation and flow between systems are poor. L-L is mainly distributed in the midstream and upstream regions of the YREB and is located in marginal cities. This region has complex natural geographical conditions, a fragile ecological environment, industrialization mainly based on extensive expansion, insufficient coordination within urban agglomerations, and faces contradictions between ecological protection and development, resulting in the inability of Ur and Ulue to develop synergistically.
4.4. Analysis of Driving Factors of Uucc
4.4.1. Selection of Driving Factor Indicators
Affected by comprehensive factors, the spatial differences in each driving factor were explored using the geographically weighted regression model. The selected influencing factor indicators are as follows: (1) Urbanization: Measure it by the proportion of urban population. (2) Urban-rural income gap: Measured by the ratio of urban resident income to rural resident income. (3) Government regulation capacity: Measured by the proportion of regional fiscal expenditure to GDP. (4) Technological innovation: Measured by the number of patents granted. (5) Openness level: Measured by the amount of actually utilized foreign capital. (6) City size: Measure by the proportion of urban construction area utilized. Specific indicators are shown in Table 4. Logarithms are taken to eliminate heteroscedasticity between data and improve data robustness and accuracy.
Table 4.
Influencing Factor Indicators of Uucc.
4.4.2. Spatial Heterogeneity Analysis of Driving Factors
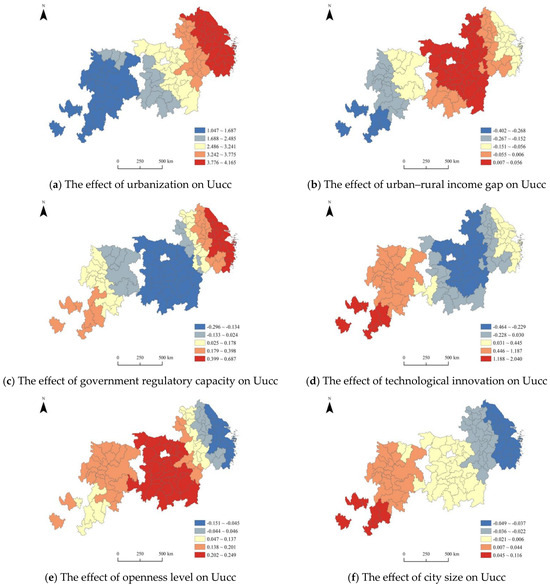
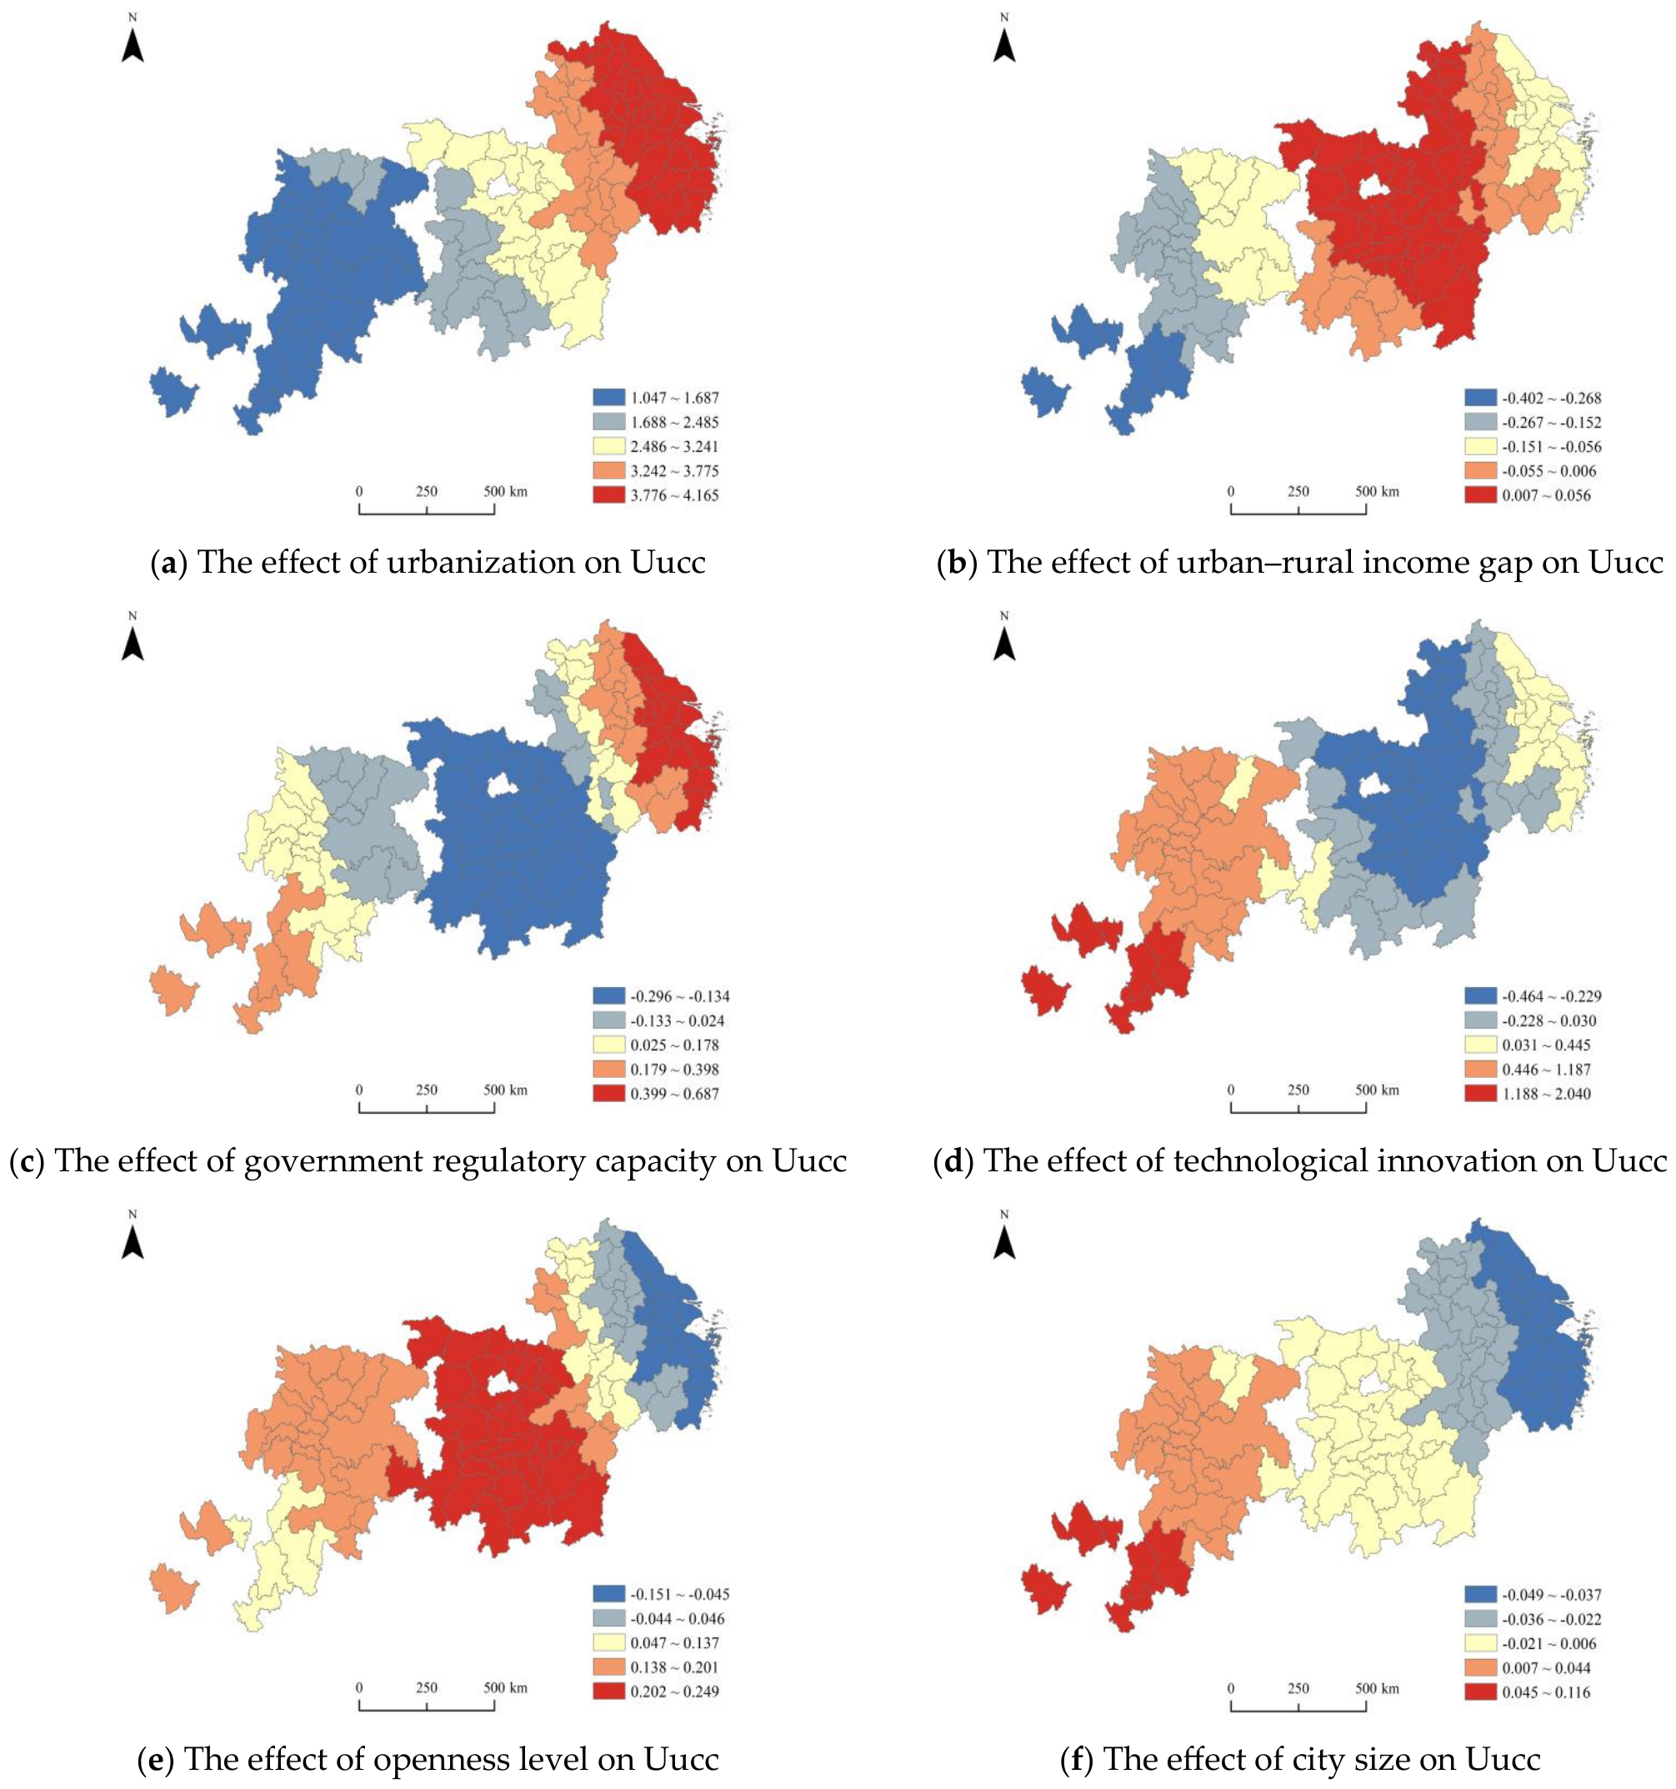
The spatial distribution of the mean regression coefficients for each driving factor was visualized using ArcGIS. Figure 8a–f respectively illustrate the spatial influence of urbanization, the urban–rural income gap, government regulatory capacity, technological innovation, openness level, and city size on Uucc. The positive effect of urbanization on Uucc is significant and has the largest impact coefficient. The impact coefficient is largest in the downstream region and smallest in the upstream region, showing a trend of gradual weakening from downstream to midstream and upstream regions spatially (Figure 8a). This is because the Yangtze River Delta integration policy promotes cross-regional collaboration. The downstream region is economically developed, with an industrial structure dominated by high-value-added services and advanced manufacturing. It possesses stronger financial strength, achieving efficient resource allocation such as intensive land use and green infrastructure investment through high-quality urbanization, thereby achieving rapid synergistic improvement of Ur and Ulue. The upstream region is constrained by ecological protection policies and insufficient funds and technology. Limited by scale-expansion urbanization and natural conditions, Uucc growth is relatively slow.
Figure 8.
Spatial Distribution Maps of Regression Coefficients of Influencing Factors.
The impact of the urban-rural income gap on Uucc shows spatial differentiation: negative effects in the upstream region, the southwest of the midstream region, and the central and eastern parts of the downstream region; positive effects in the central and eastern parts of the midstream region and the western part of the downstream region (Figure 8b). The reason lies in the distinctly different mechanisms through which the urban-rural income gap affects the development stage, factor flow patterns, and governance capacity of different regions. The midstream region is in a critical period of urban-rural relationship restructuring. A moderate income gap in the middle stage of industrialization can accelerate labor transfer to cities and promote intensive urban land use. Widening income gaps in the upstream and downstream regions exacerbate resource mismatch between rural and urban areas, weakening rural support for cities. High income gaps in the downstream region solidify high-density urban patterns, leading to excessive land carrying capacity. In the upstream region, the income gap forces local governments to prioritize livelihood security, squeezing investment in resilience construction. Excessive land resource development causes soil erosion, which is detrimental to coupling coordination development.
The impact of government regulation capacity on Uucc has differentiation: positive effects in the central and western parts of the upstream region and the eastern and central parts of the downstream region; negative effects in the midstream region (Figure 8c). The underlying reason lies in the dynamic matching relationship between development stages, market maturity, and policy intervention methods in different regions. Downstream governments place emphasis on combining bottom-line control with innovation guidance. They not only enforce rigid constraints on ecological red lines through territorial spatial planning but also steer capital investment into the field of green infrastructure by means of industrial policies, so as to strengthen the degree of coupling coordination. Upstream industries are highly dependent on resources. Government economic regulation and policy support are conducive to economic recovery and Ur improvement. Government-led cross-regional ecological compensation prioritizes ecological security, requiring strengthened control to safeguard development rights in protected areas. In the midstream region, administrative intervention mismatches market laws, resulting in high marginal effects of government regulation. Over-reliance on land finance leads to Ulue collapse. Short-term campaign-style environmental remediation disrupts the original industrial ecology, reducing coupling coordination.
The impact of technological innovation on Uucc exists spatial differentiation: positive effects in the eastern downstream region and upstream region; negative effects in the midstream region and western downstream region (Figure 8d). The reason resides in differences in the dynamic adaptability of technological innovation to regional development stages, industrial structures, and institutional environments. Technological innovation in the eastern downstream region is supply-creation type, with high conversion rates for original innovation and deep empowerment by digital technologies. Technological innovation synchronously improves Ulue and urban emergency evacuation capabilities. The positive and significant effect of technological innovation on Uucc further extends to the upstream region, which achieves a simultaneous leap in enhancing Ur and land digital management by directly introducing mature technologies from downstream. In the midstream region, innovation resources are mismatched. Technology is mainly concentrated in automobile manufacturing, creating a “siphon effect” and decoupling from urban governance needs. Innovation space in small and medium-sized cities is limited, leading to imbalance in coupling coordination.
The positive effect of openness on Uucc is greatest in the midstream region, followed by the upstream region, while the negative effect is most significant in the downstream region (Figure 8e). This stems mainly from differences in regional development gradients, industrial structures, policy orientations, and resource and environmental carrying capacities. The midstream and upstream regions are rich in resources but lack key elements such as capital and technology. Openness introduces foreign investment, injecting new vitality into regional development. Undertaking industrial transfer can effectively promote industrial structure adjustment. Ecological protection, open policies, and intensive land use form a synergy to enhance coupling coordination. The downstream region has an extremely high level of openness and dense foreign investment, dominated by finance and high-end manufacturing. High land costs and fierce competition force inefficient expansion of industrial land due to soaring commercial land prices, reducing coupling coordination.
The city size has a positive impact on the Uucc in the upstream region and a negative impact on the midstream and downstream regions (Figure 8f). The reason lies in differences in urban development stages, resource and environmental constraints, and scale effect thresholds in different regions. Upstream cities are still in the rising stage of agglomeration economies. Expanding city size can better agglomerate factors like capital, technology, and talent, enabling large-scale and efficient development of local abundant natural resources, transforming resource advantages into economic advantages. Upstream cities pay more attention to ecological protection during development, actively taking measures to protect the ecological environment, achieving coordinated development of Ur and Ulue. For instance, the “Central Budgetary Investment Special Management Measures for Major Regional Development Strategies (Green Development Direction of the YREB)” (2021) supports green infrastructure projects such as wetland restoration in the upper reaches of the Yangtze River and river improvement in the Chishui River Basin. In the midstream and downstream regions, excessive population concentration increases pressure on urban resources and the environment, increases pollutant emissions, and damages ecosystems. Moreover, continuous adjustment and transformation of industrial structures may lead to unreasonable industrial layouts, all of which affect the Uucc.
5. Discussion
During the research period, the overall level of Uucc in YREB continued to rise. The number of high-level cities increased, and the new urbanization strategy proposed by the Chinese government in 2014, along with the relevant policies and market mechanisms, have achieved positive results in promoting the positive interaction between Ur and Ulue. This effectively refutes the zero-sum thinking that efficiency improvement is accompanied by spatial expansion and ecological pressure, and that efficiency and resilience are difficult to achieve simultaneously. Compared with the early characteristics of the Beijing “siphon effect” and large regional internal gaps in the Beijing-Tianjin-Hebei urban agglomeration [59], YREB presents a more complex integrated river basin and differentiated block combination collaborative model. This is related to the continuous improvement of the overall economic development level of the YREB, government fiscal expenditure, technological innovation and the level of opening up to the outside world. Various regions have actively promoted the redevelopment and green utilization of inefficient land. These factors jointly promote the coordinated development of Ur and Ulue, helping the cities achieve synchronous optimization in responding to external shocks and efficient and intensive land utilization [60]. High-level cities, through the connection of industries, technologies and infrastructure, drive the coordinated development of surrounding areas, enabling more cities to enter the high-coordination category.
The spatial pattern of Uucc in the YREB is rather complex. Uucc shows a significant spatial agglomeration feature. Cities with high and low coordination degrees have obvious spatial proximity. LISA high-value agglomerations are concentrated in the developed cities of the Yangtze River Delta, reflecting a high level of coordinated development and forming a positive spatial spillover effect. This is attributed to the in-depth advancement of the Yangtze River Delta integration strategy, which enables core cities like Shanghai, Hangzhou, and Nanjing to effectively radiate to their surroundings. LISA has the characteristic of “large dispersion and small agglomeration”, indicating the non-equilibrium in natural conditions, development stages, and policy focuses within the YREB. These results support the existing research conclusions with high values were concentrated in economically developed areas and low values were found in the periphery [61,62]. However, this study does not support their conclusion of “increased polarization”, but rather shows no significant polarization. Xie (2022) quantified Ur development using TOPSIS-PSO-ELM and revealed a spatial distribution imbalance phenomenon of “peaks” and “valleys” [63]. The levels of Ulue and Ur both exhibit a spatial differentiation trend of “the stronger becomes stronger, the weaker becomes weaker” and “high in the east, low in the west”, which supports the conclusion of this study [64].
Urbanization, Urban-Rural Income Gap, Government Regulation Capacity, Technological Innovation, Openness Level, and City Size are all important factors influencing Uucc. Moreover, the degree of influence of different factors shows a spatial distribution with distinct characteristics, revealing the deep-seated differences in the internal development dynamic mechanisms of the basin. Urbanization as a common fundamental driving force throughout the upstream, midstream, and downstream regions. Government regulation and technological innovation are driving factors in the downstream regions. The Uucc of the Yangtze River Delta urban agglomeration not only benefits from government regulation but also has strong explanatory power from the economic development level, industrial structure, and labor force factors. The well-developed infrastructure, highly concentrated capital, technology, and economic diversity promote regional coordinated development. Luo supports the conclusion of this study [65]. Moreover, the current economic development and infrastructure construction levels failing to keep pace with the urban development process is the main reason for the relatively slower progress of Ur compared to Ulue. The level of openness has a significant impact on the midstream regions. The current research findings reflect that urbanization and openness can promote urban infrastructure construction, optimize the urban structure layout, and enhance Ur and Ulue [66]. Technological innovation has the greatest impact effect on the upstream regions, which is consistent with the existing research findings [67]. Enhancing regional innovation capabilities can promote industrial structure adjustment and upgrading, improve the efficiency of resource-based industries, optimize urban spatial layout, drive the coordinated progress of Ur and Ulue, thereby enhancing the internal competitiveness and adaptability of the city. At the same time, he believes that the terrain in the upstream regions is steep and the ecological environment is fragile. The government supports collaborative promotion of UUCC development in terms of efficient resource utilization, ecological environment protection, and urban security [68].
6. Conclusions and Recommendations
6.1. Conclusions
This study utilized data from 108 prefecture-level cities in the YREB spanning 2011–2024 to examine the spatiotemporal evolution characteristics of Uucc through a multidimensional approach and explore its influencing factors. The conclusions are as follows:
Uucc shows an upward trend. The Uucc development trend is good, and its level is continuously improving. The number of cities with higher levels is gradually increasing. The Uucc levels in some cities are uneven and exhibit certain polarization characteristics. The upstream, midstream, and downstream regions radiate outward centered on cities such as Chongqing, Changsha, and Shanghai, respectively, showing a multi-center, multi-layered feature. The Moran’s I statistic of Uucc has always been positive, and all results are significant at the 5% level. indicating an agglomeration trend of Uucc in the study area. The local aggregation distribution characteristics of Uucc indicate. LISA high-value agglomeration is in the downstream region, while low-value agglomeration is in marginal cities of the midstream and upstream regions. Spatial clustering of Uucc presents a “large dispersion, small agglomeration” spatial distribution pattern. The impact degree of Uucc driving factors shows significant spatial heterogeneity. The dominant driving factors in the downstream region are urbanization, government regulation capacity, and technological innovation. The dominant driving factors in the midstream region are urbanization and openness level. The dominant driving factors in the upstream region are urbanization, technological innovation, government regulation capacity, openness level, and city size.
6.2. Recommendations
(1) Optimize the multi-center networked development pattern to promote the overall improvement of regional Uucc level.
Based on the feature of Uucc showing multi-center, multi-layered radiation, the radiating and driving role of multiple provincial capital core cities should be leveraged to promote coordinated development within layers. Improve cross-regional transportation networks and factor flow mechanisms for urban agglomerations such as the Yangtze River Delta, the Midstream region, and Chengdu-Chongqing to promote the diffusion and driving effects of industries, resources, and public services to surrounding cities, facilitating regional coordinated development. Meanwhile, given the relatively balanced Uucc of most cities, secondary central cities should be cultivated to build a multi-level, networked urban system, forming a coordinated development pattern of “core leadership, multi-point support”, consolidating the non-polarized balanced development trend.
(2) Implement differentiated spatial development strategies to break the “large dispersion, small agglomeration” spatial pattern.
Given that the spatial distribution of Uucc presents the characteristic of simultaneous agglomeration and dispersion, it is necessary to strengthen agglomeration effects and promote regional linkages. For high-value agglomeration areas like the Yangtze River Delta, integrated layouts in fields such as technological innovation, industrial division, and ecological protection should be promoted to consolidate and expand the positive spillover effects of high-value agglomeration. For low-value agglomeration areas such as marginal cities in the midstream and upstream regions, development capacity should be enhanced by strengthening the cultivation of advantageous industrial clusters and infrastructure construction based on local resource endowments and industrial foundations. At the same time, relying on national regional development strategies, cross-regional cooperation platforms should be established to promote the flow of elements such as talent, technology, and capital between different agglomeration regions, forming a spatial development pattern of “promoting linkage with agglomeration, promoting balance with linkage”, and driving the overall improvement of regional coupling coordination degree.
(3) Formulate driving strategies based on local conditions to address regional development heterogeneity challenges.
Given the spatial heterogeneity in the impact degree of driving factors, it is necessary to develop differentiated regional development policies. The downstream region should focus on strengthening the leading role of technological innovation, improving the innovation ecosystem, while optimizing government regulation methods to improve resource allocation efficiency, and promoting deep integration of various systems based on high-quality urbanization. The midstream region needs to expand openness, actively undertake high-quality industrial transfers, expand cooperation platforms, and simultaneously promote integrated urban-rural development, striving to narrow the urban-rural income gap. The upstream region should implement a multi-dimensional coordinated promotion strategy, reasonably advance urbanization and city size expansion, strengthen the government’s integration and allocation of basic resources, and make up for development shortcomings by introducing technological innovation resources and establishing openness windows. Additionally, establish a river basin coordinated development mechanism to promote the linked development of upstream, midstream, and downstream regions, forming a new pattern of regional development with complementary advantages.
6.3. Limitations
There are still some limitations. Many cities in upstream regions have partial data gaps, preventing their inclusion in the study scope. Future work will refine the research area, expand relevant indicator data, and supplement spatial correlation studies. This study examined factors influencing Uucc. However, the drivers of spatial variation in Uucc are complex. Future research can further explore the impacts of industrial structure and geographical environment on Uucc. Transport accessibility, population density, environmental quality, ecological resources and industrial structure may also be influencing factors. In the future, these factors should be taken into consideration, and the impact effects of the interaction of multiple factors on Uucc should be explored. Additionally, this study analyzed Ur and Ulue while describing Uucc characteristics, but did not predict their future developmental relationship. Subsequent research should focus on analyzing Uucc’s internal operational mechanisms and future trends to provide practical value for urban development.
Author Contributions
Conceptualization, D.H.; Methodology, Z.X.; Software, D.M.; Data curation, B.P.; Writing—original draft, D.M.; Writing—review and editing, J.H.; Supervision, D.H. All authors have read and agreed to the published version of the manuscript.
Funding
This work was supported by the National Funds of Social Science of China (No. 20CMZ033); Anhui Province Higher Education Middle-aged and Young Teachers Cultivation Action Program (No. YQYB2024087); Anhui Province Colleges and Universities Humanities and Social Sciences Key Projects (Nos. 2022AH052401, 2023AH052256, 2023AH052262); Anhui Provincial Department of Education Quality Project (No. 2023jyxm0862); First-class Discipline Project of Business Administration at Bozhou University (BYXKC202201).
Institutional Review Board Statement
Not applicable.
Informed Consent Statement
Not applicable.
Data Availability Statement
The original contributions presented in this study are included in the article. Further inquiries can be directed to the corresponding author or the first author.
Acknowledgments
The authors are very grateful to the editor and the anonymous referees for their insightful and constructive comments and suggestions.
Conflicts of Interest
The authors declare no conflicts of interest.
References
- Zhang, Y.; Kasimu, A.; Zhang, X.; Song, N.; Shayiti, B.; An, X. Spatiotemporal Decoupling of Urban Expansion Intensity and Land Use Efficiency in Arid Oasis Agglomerations. Land 2025, 14, 2143. [Google Scholar] [CrossRef] [Scilit]
- Zeng, X.; Yu, Y.; Yang, S.; Lv, Y.; Sarker, M.N.I. Urban resilience for urban sustainability: Concepts, dimensions, and perspectives. Sustainability 2022, 14, 2481. [Google Scholar] [CrossRef] [Scilit]
- Xu, J.; Yang, B.; Yuan, C. The impact of supply chain digitalization on urban resilience: Do industrial chain resilience, green total factor productivity and innovation matter? Energy Econ. 2025, 145, 108443. [Google Scholar] [CrossRef] [Scilit]
- Tang, D.; Li, J.; Zhao, Z.; Boamah, V.; Lansana, D.D. The Influence of Industrial Structure Transformation on Urban Resilience Based on 110 Prefecture-Level Cities in the Yangtze River. Sustain. Cities Soc. 2023, 96, 104621. [Google Scholar] [CrossRef] [Scilit]
- Qu, Y.; Zhan, L.; Zhang, Q.; Si, H.; Jiang, G. Towards Sustainability: The Impact of the Multidimensional Morphological Evolution of Urban Land on Carbon Emissions. J. Clean. Prod. 2023, 424, 138888. [Google Scholar] [CrossRef] [Scilit]
- Hou, S.; Song, L.; Wang, J.; Ali, S. How Land Finance Affects Green Economic Growth in Chinese Cities. Land 2021, 10, 819. [Google Scholar] [CrossRef] [Scilit]
- Qian, H.; Sun, Q.; Li, M.; Liu, Y.; Li, F. An Empirical Study on the Promotion of City Economic Growth by the Healthy Development of Real Estate and Land Finance. Front. Sustain. Cities 2024, 6, 1481687. [Google Scholar] [CrossRef] [Scilit]
- Mbelebele, Z.; Mdoda, L.; Ntlanga, S.S.; Nontu, Y.; Gidi, L.S. Harmonizing traditional knowledge with environmental preservation: Sustainable strategies for the conservation of indigenous medicinal plants (IMPs) and their implications for economic well-being. Sustainability 2024, 16, 5841. [Google Scholar] [CrossRef] [Scilit]
- Fu, J.; Bu, Z.; Jiang, D.; Lin, G.; Li, X. Sustainable land use diagnosis based on the perspective of production–living–ecological spaces in China. Land Use Policy 2022, 122, 106386. [Google Scholar] [CrossRef] [Scilit]
- Meng, X.; Ding, T.; Wang, H. Urban resilience under local government competition: A new perspective on industrial resilience. Cities 2024, 155, 105409. [Google Scholar] [CrossRef] [Scilit]
- Lv, Y.; Sarker, M.N.I. Integrative approaches to urban resilience: Evaluating the efficacy of resilience strategies in mitigating climate change vulnerabilities. Heliyon 2024, 10, e28191. [Google Scholar] [CrossRef] [Scilit] [PubMed]
- Zhou, C.; Li, X. Impact of Smart Cities on Urban Resilience: The Roles of Land Green Utilization Efficiency and Industrial Structure Transformation. Land 2025, 14, 1373. [Google Scholar] [CrossRef] [Scilit]
- Saptono, Y.; Rustiadi, E.; Barus, B.; Pravitasari, A.E. Systematic Literature Review: Research Development of Urban Resilience in Metropolitan Areas. Sustainability 2025, 17, 7380. [Google Scholar] [CrossRef] [Scilit]
- Chaube, S.; Pant, S.; Kumar, A.; Uniyal, S.; Singh, M.K.; Kotecha, K.; Kumar, A. An overview of multi-criteria decision analysis and the applications of AHP and TOPSIS methods. Int. J. Math. Eng. Manag. Sci. 2024, 9, 581. [Google Scholar] [CrossRef] [Scilit]
- Zhang, X.; Chen, M.; Guo, K.; Liu, Y.; Liu, Y.; Cai, W.; Wu, H.; Chen, Z.; Chen, Y.; Zhang, J. Regional land eco-security evaluation for the mining city of Daye in China using the GIS-based grey TOPSIS method. Land 2021, 10, 118. [Google Scholar] [CrossRef] [Scilit]
- Ye, C.; Hu, M.; Lu, L.; Dong, Q.; Gu, M. Spatio-temporal evolution and factor explanatory power analysis of urban resilience in the Yangtze River Economic Belt. Geogr. Sustain. 2022, 3, 299–311. [Google Scholar] [CrossRef] [Scilit]
- Zhang, R.; Zhou, J.; Sun, F.; Xu, H.; Xing, H. Spatiotemporal Evolution and Driving Factors of Urban Resilience Against Disasters: A Dual Perspective of Urban Systems and Resilience Capacities. Land 2025, 14, 741. [Google Scholar] [CrossRef] [Scilit]
- Liu, S. Evaluation of urban land use efficiency in southern Hebei based on data envelopment analysis. GeoJournal 2025, 90, 40. [Google Scholar] [CrossRef] [Scilit]
- Zhang, H.; Song, Y.; Zhang, M.; Duan, Y. Land use efficiency and energy transition in Chinese cities: A cluster-frontier super-efficiency SBM-based analytical approach. Energy 2024, 304, 132049. [Google Scholar] [CrossRef] [Scilit]
- Liu, S.C.; Lin, Y.B.; Ye, Y.M.; Xiao, W. Spatial-temporal characteristics of industrial land use efficiency in provincial China based on a stochastic frontier production function approach. J. Clean. Prod. 2021, 295, 126432. [Google Scholar] [CrossRef] [Scilit]
- Wang, A. A general diagnostic of the normal approximation in GMM models. Econom. J. 2025, 28, 261–275. [Google Scholar] [CrossRef] [Scilit]
- Wang, Y.; Wu, X.; Zhu, H. Spatio-temporal pattern and spatial disequilibrium of cultivated land use efficiency in China: An empirical study based on 342 prefecture-level cities. Land 2022, 11, 1763. [Google Scholar] [CrossRef] [Scilit]
- Yu, J.; Zhou, K.; Yang, S. Land use efficiency and influencing factors of urban agglomerations in China. Land Use Policy 2019, 88, 104143. [Google Scholar] [CrossRef] [Scilit]
- Xue, D.; Yue, L.; Ahmad, F.; Draz, M.U.; Chandio, A.A.; Ahmad, M.; Amin, W. Empirical investigation of urban land use efficiency and influencing factors of the Yellow River basin Chinese cities. Land Use Policy 2022, 117, 106117. [Google Scholar] [CrossRef] [Scilit]
- Ke, H.; Yang, B.; Dai, S. Does Intensive Land Use Contribute to Energy Efficiency?—Evidence Based on a Spatial Durbin Model. Int. J. Environ. Res. Public Health 2022, 19, 5130. [Google Scholar] [CrossRef] [Scilit] [PubMed]
- An, J.; Su, Q.; Yuan, X. The Impact of New Urbanization on Urban Land Green Use Efficiency in the Middle and Lower Yellow River, China: An Analysis Based on Spatial Correlation Networks. Land 2025, 14, 625. [Google Scholar] [CrossRef] [Scilit]
- Zhang, W.; Wang, Z.; Wang, S. The Impact of Land-Use Carbon Efficiency on Ecological Resilience—The Moderating Role of Heterogeneous Environmental Regulations. Sustainability 2024, 16, 9842. [Google Scholar] [CrossRef] [Scilit]
- Sharifi, A. Urban Resilience Assessment: Mapping Knowledge Structure and Trends. Sustainability 2020, 12, 5918. [Google Scholar] [CrossRef] [Scilit]
- Li, H.; Wang, Y.; Zhang, H.; Yin, R.; Liu, C.; Wang, Z.; Fu, F.; Zhao, J. The Spatial-Temporal Evolution and Driving Mechanism of Urban Resilience in the Yellow River Basin Cities. J. Clean. Prod. 2024, 447, 141614. [Google Scholar] [CrossRef] [Scilit]
- Guo, L.; Liu, K. Spatiotemporal patterns and drivers of coupling coordination between digital technological innovation and economic resilience in the Yangtze river economic belt. Sci. Rep. 2025, 15, 30975. [Google Scholar] [CrossRef] [Scilit] [PubMed]
- Meng, Z.; He, M.; Li, X.; Li, H.; Tan, Y.; Li, Z.; Wei, Y. Spatio-temporal analysis and driving forces of urban ecosystem resilience based on land use: A case study in the Great Bay Area. Ecol. Indic. 2024, 159, 111769. [Google Scholar] [CrossRef] [Scilit]
- Tang, L.; Chen, S.; Li, Q. Optimizing Maintenance Resource Scheduling and Site Selection for Urban Metro Systems: A Multi-Objective Approach to Enhance System Resilience. Systems 2024, 12, 262. [Google Scholar] [CrossRef] [Scilit]
- Yin, Y.; Song, C.; Jing, Y.; Zhang, S.; Ye, S.; Wang, Y.; Gao, P. EWMS: A software tool for interactively using entropy weight coefficient method for aggregating sustainability indicators. Environ. Model. Softw. 2025, 191, 106500. [Google Scholar] [CrossRef] [Scilit]
- Libório, M.P.; Karagiannis, R.; Diniz, A.M.A.; Ekel, P.I.; Vieira, D.A.G.; Ribeiro, L.C. The use of information entropy and expert opinion in maximizing the discriminating power of composite indicators. Entropy 2024, 26, 143. [Google Scholar] [CrossRef] [Scilit] [PubMed]
- Ali, S.I.; Lalji, S.M.; Haider, S.A.; Haneef, J.; Syed, A.U.H.; Husain, N.; Yahya, A.; Rashid, Z.; Arfeen, Z.A. Risk Prioritization in a Core Preparation Experiment Using Fuzzy VIKOR Integrated with Shannon Entropy Method. Ain Shams Eng. J. 2024, 15, 102421. [Google Scholar] [CrossRef] [Scilit]
- Shu, T.; Liao, X.; Yang, S.; Yu, T. Towards Sustainability: Evaluating Energy Efficiency with a Super-Efficiency SBM-DEA Model across 168 Economies. Appl. Energy 2024, 376, 124254. [Google Scholar] [CrossRef] [Scilit]
- He, W.; Fu, J.; Luo, Y. A study of well-being-based eco-efficiency based on Super-SBM and Tobit Regression Model: The case of China. Soc. Indic. Res. 2023, 167, 289–317. [Google Scholar] [CrossRef] [Scilit]
- Wang, W.; Zhang, J. Measuring the coupling coordination of land use functions and influencing factors: A case study in Beijing. Front. Ecol. Evol. 2023, 11, 1159152. [Google Scholar] [CrossRef] [Scilit]
- Han, Y.; Jiang, Z.; Zhao, M.; Li, J. Analysis of coupling coordination development and obstacle factors in the water-energy-carbon-ecological environment nexus across China’s Yellow River basin. Sci. Rep. 2025, 15, 24106. [Google Scholar] [CrossRef] [Scilit] [PubMed]
- Dong, Q.; Zhong, K.; Liao, Y.; Xiong, R.; Wang, F.; Pang, M. Coupling coordination degree of environment, energy, and economic growth in resource-based provinces of China. Resour. Policy 2023, 81, 103308. [Google Scholar] [CrossRef] [Scilit]
- Sun, X.; Zhang, C.; Tan, Q. Factors influencing the coordinated development of urbanization and its spatial effects: A case study of Beijing-Tianjin-Hebei region. Sustainability 2023, 15, 4137. [Google Scholar] [CrossRef] [Scilit]
- Zhang, H.; Li, S.; Chang, J. Spatiotemporal evolution and driving factors of coupling coordination degree between new urbanization and urban resilience: A case of Huaihai Economic Zone. ISPRS Int. J. Geo-Inf. 2025, 14, 271. [Google Scholar] [CrossRef] [Scilit]
- Cheng, M.; Li, Q.; Wen, Z. Coupling coordination degree analysis and driving factors of innovation network and eco-efficiency in China. Environ. Impact Assess. Rev. 2023, 99, 107008. [Google Scholar] [CrossRef] [Scilit]
- Yin, J.F.; Shi, P.J.; Huang, W.Z.; Shi, Z.H.; Li, Y.L. The Spatio-Temporal Differentiation Characteristics and Influencing Factors of the Coupled and Coordinated Development of Rural Revitalization and New Urbanization in County Areas of Gansu Province. J. Nat. Resour. 2023, 38, 2148–2168. [Google Scholar] [CrossRef] [Scilit]
- Zhou, Y.; Lu, H.; Wan, X.; Wen, D.; Xie, X. KDE-DE: A kernel density estimation-based differential entropy method for EEG feature extraction in spatial cognitive evaluation. Biomed. Signal Process. Control 2025, 110, 108209. [Google Scholar] [CrossRef] [Scilit]
- Graham, B.S.; Niu, F.; Powell, J.L. Kernel density estimation for undirected dyadic data. J. Econom. 2024, 240, 105336. [Google Scholar] [CrossRef] [Scilit]
- Zhang, W.; Wang, B.; Wang, J.; Wu, Q.; Wei, Y.D. How does industrial agglomeration affect urban land use efficiency? A spatial analysis of Chinese cities. Land Use Policy 2022, 119, 106178. [Google Scholar] [CrossRef] [Scilit]
- Yang, X.; Ran, G. Factors influencing the coupled and coordinated development of cities in the Yangtze River Economic Belt: A focus on carbon reduction, pollution control, greening, and growth. J. Environ. Manag. 2024, 370, 122499. [Google Scholar] [CrossRef] [Scilit] [PubMed]
- Tao, R.; Chen, Y. Applying local indicators of spatial association to analyze longitudinal data: The absolute perspective. Geogr. Anal. 2023, 55, 225–238. [Google Scholar] [CrossRef] [Scilit]
- Li, X.; Lu, Z.; Hou, Y.; Zhao, G.; Zhang, L. The coupling coordination degree between urbanization and air environment in the Beijing (Jing)-Tianjin (Jin)-Hebei (Ji) urban agglomeration. Ecol. Indic. 2022, 137, 108787. [Google Scholar] [CrossRef] [Scilit]
- Yang, W.; Deng, M.; Tang, J.; Luo, L. Geographically weighted regression with the integration of machine learning for spatial prediction. J. Geogr. Syst. 2023, 25, 213–236. [Google Scholar] [CrossRef] [Scilit]
- Amirzadeh, M.; Sobhaninia, S.; Sharifi, A. Urban resilience: A vague or an evolutionary concept? Sustain. Cities Soc. 2022, 81, 103853. [Google Scholar] [CrossRef] [Scilit]
- Wang, H.; Liu, Z.; Zhou, Y. Assessing urban resilience in China from the perspective of socioeconomic and ecological sustainability. Environ. Impact Assess. Rev. 2023, 102, 107163. [Google Scholar] [CrossRef] [Scilit]
- Han, S.; Wang, B.; Ao, Y.; Bahmani, H.; Chai, B. The coupling and coordination degree of urban resilience system: A case study of the Chengdu–Chongqing urban agglomeration. Environ. Impact Assess. Rev. 2023, 101, 107145. [Google Scholar] [CrossRef] [Scilit]
- Chen, Y.; Chang, J.; Li, Z.; Ming, L.; Li, C.; Li, C. Coupling Coordination and Spatiotemporal Analysis of Urban Compactness and Land-Use Efficiency in Resource-Based Areas: A Case Study of Shanxi Province, China. Land 2023, 12, 1658. [Google Scholar] [CrossRef] [Scilit]
- Pan, H.; Yang, Y.; Zhang, W.; Xu, M. Research on Coupling Coordination of China’s Urban Resilience and Tourism Economy—Taking Yangtze River Delta City Cluster as an Example. Sustainability 2024, 16, 1247. [Google Scholar] [CrossRef] [Scilit]
- Wang, Z.; Liu, W. A comparative study of urban ecological resilience in the Yangtze River Economic Belt and the Yellow River Basin. Humanit. Soc. Sci. Commun. 2024, 11, 1471. [Google Scholar] [CrossRef] [Scilit]
- Li, S.; Fu, M.; Tian, Y.; Xiong, Y.; Wei, C. Relationship between urban land use efficiency and economic development level in the Beijing–Tianjin–Hebei region. Land 2022, 11, 976. [Google Scholar] [CrossRef] [Scilit]
- Song, G.; Cai, J.; Fu, Y. Regional development study how to develop a small city affected by siphoning: A case of a Chinese city. Prosperitas 2023, 10, 1–13. [Google Scholar] [CrossRef] [Scilit]
- Zhao, S.; Qing, L.; Wang, C. Moving Towards Sustainable Development Exploring the Impact of Land-Use Policies on Land Green Utilization Efficiency. Front. Environ. Sci. 2026, 14, 1767889. [Google Scholar] [CrossRef] [Scilit]
- Guo, X.; Li, J.; Ma, Y.; Chen, X.; Li, Y. Study on the coupling and coordination between urban resilience and low-carbon development of central plains urban agglomeration. Sustainability 2023, 15, 16748. [Google Scholar] [CrossRef] [Scilit]
- Ning, L.; Sheng, S.; Meng, Y. The interplay and synergistic relationship between urban land expansion and urban resilience across the three principal metropolitan regions of the Yangtze River Basin. Sci. Rep. 2024, 14, 31868. [Google Scholar] [CrossRef] [Scilit] [PubMed]
- Chenhong, X.; Guofang, Z. The spatiotemporal evolution pattern of urban resilience in the Yangtze River Delta urban agglomeration based on TOPSIS-PSO-ELM. Sustain. Cities Soc. 2022, 87, 104223. [Google Scholar] [CrossRef] [Scilit]
- Pan, Y.; Liu, J.; Cheng, C. Research on urban resilience from the perspective of land intensive use: Indicator measurement, impact and policy implications. Buildings 2024, 14, 2564. [Google Scholar] [CrossRef] [Scilit]
- Luo, X.; Cheng, C.; Pan, Y.; Yang, T. Coupling coordination and influencing factors of land development intensity and urban resilience of the Yangtze River Delta urban agglomeration. Water 2022, 14, 1083. [Google Scholar] [CrossRef] [Scilit]
- Zhao, S.; Zeng, W.; Feng, D. Coupling Coordination of Urban Resilience and Urban Land Use Efficiency in Hunan Province, China. Sustainability 2024, 16, 10860. [Google Scholar] [CrossRef] [Scilit]
- Li, H.; Hu, C.; Zhu, M.; Hong, J.; Wang, Z.; Fu, F.; Zhao, J. Study on the coupled and coordinated development of urban resilience and urbanization level in the Yellow River Basin. Environ. Dev. Sustain. 2025, 27, 19675–19705. [Google Scholar] [CrossRef] [Scilit]
- Li, H.; Zhu, M.; Wang, Z.; Hong, J.; Wang, Y. Synergy level of urban resilience and urban land use efficiency in the Yellow River Basin: Spatial-temporal evolution characteristics and driving factors. Heliyon 2024, 10, e31456. [Google Scholar] [CrossRef] [Scilit] [PubMed]

Disclaimer/Publisher’s Note: The statements, opinions and data contained in all publications are solely those of the individual author(s) and contributor(s) and not of MDPI and/or the editor(s). MDPI and/or the editor(s) disclaim responsibility for any injury to people or property resulting from any ideas, methods, instructions or products referred to in the content. |
© 2026 by the authors. Licensee MDPI, Basel, Switzerland. This article is an open access article distributed under the terms and conditions of the Creative Commons Attribution (CC BY) license.