


Abstract
Wastewater treatment plants (WWTPs) face increasing climate-change-induced flooding, yet flood resilience is seldom integrated into design, operation, or investment decisions. This study presents a multidimensional framework to support climate-resilient, circular, and bankable wastewater infrastructure planning. The methodology combines spatial flood exposure mapping using QGIS and Aqueduct flood layers for 2030, 2050, and 2080 with a 142-indicator Circular Economy (CE) scoring framework. Applied to five WWTPs in Türkiye, we develop the Index for Climate Risk and Circularity (ICRC), linking facility-level circularity performance with physical flood exposure. The results show that some technically advanced facilities achieve relatively high CE scores while remaining exposed to partial or near-complete inundation under future 1000-year flood scenarios, particularly in coastal areas. By connecting flood exposure, circularity, and operational cost reduction potential, the framework translates technical sustainability improvements into investment-relevant metrics for utilities, engineers, and financiers. It shows that circularity investments (e.g., renewable energy, resource efficiency) strengthen bankability only when combined with physical climate adaptation. Robustness checks, including alternative weighting assumptions and a cross-facility comparison, suggest that the main investment-prioritization logic remains broadly stable. The framework provides a replicable decision-support tool for prioritizing investments that enhance circularity, climate resilience, and long-term financial viability, while supporting the Sustainable Development Goals (SDGs) 6, 9, 11, and 13.
1. Introduction
Changes in climate caused by human activities that directly or indirectly alter the composition of the atmosphere are considered climate change when combined with natural climate events observed over different time periods [1]. The climate is changing today, necessitating the construction of a more resilient future. Recognizing that temperature records are being broken and that people, the planet, and prosperity are vulnerable to climate change, we must prevent what cannot be adapted to and adapt to what is inevitable [2]. The frequency and intensity of extreme weather events are increasing, leading to a significant rise in disasters and related damages over the past 20 years [3,4]. The effects of climate change are being felt both within and outside the EU. Water scarcity is impacting economic activities across a wide range of sectors, from agriculture to aquaculture, power plant cooling to shipping operations. It is affecting not only the economy, but also health and well-being [2].
In urban environments, heavy or prolonged rainfall can cause urban flooding, overwhelming drainage systems and damaging water and sanitation infrastructure. Conversely, droughts lower the groundwater table, damaging underground pipeline infrastructure and potentially affecting water quality and quantity [5]. Compared to the past 20 years, the economic damage caused by drought has increased by 63%, and the economic damage caused by floods has increased by 23%. Therefore, it is necessary to be prepared for such extreme weather events [6]. Within this context, the impact of climate change on wastewater treatment plants (WWTPs) must be analyzed. Studies have proposed various mitigation strategies for emission reduction, including biomimicry-based methods (e.g., microalgal systems), nitrite-dependent anaerobic methane oxidation, and biochar application for carbon storage [7].
WWTP infrastructure is highly susceptible to sudden climate impacts such as sea-level rise and flooding, which lead to damaged discharge pipes and increased pumping costs [7,8,9]. According to analyses conducted at 18 different WWTPs, the potential impacts of sea-level rise on WWTPs located in coastal areas have been analyzed and a risk map has been created. Of the 18 WWTPs, three were found to be at the highest risk, while seven faced medium risk from sea-level rise [10].
Furthermore, climate change can disrupt sedimentation, aeration, chlorination, and sludge treatment processes. Changes in wastewater temperature alter sludge density, potentially increasing BOD requirements and causing odor issues or reduced disinfectant efficiency [11]. Despite these risks, the national Wastewater Treatment Plant Design Guide primarily addresses temperature-driven adjustments for cold or warm climates (e.g., ventilation types, sludge age, and retention times) but does not integrate extreme weather events into core design criteria [12]. Local studies, such as the flood risk analysis for the Konya region and the Çiğli WWTP, have confirmed that many facilities built after 2010 are located within flood boundaries or face significant submersion risks [13,14].
While existing literature has explored flood risk mapping and circular economy indicators separately, there is a notable research gap in integrated frameworks that link spatial climate hazards with facility-level circularity performance and financial bankability. Most studies focus on either high-level policy assessments or localized technical optimizations, often failing to provide actionable tools for utility managers and investors to prioritize adaptation efforts. This study addresses these gaps by developing an integrated assessment framework for WWTPs in Türkiye.
A growing body of peer-reviewed research has begun to address the individual components of this nexus. On the climate-hazard side, recent studies have moved away from static, single-scenario master planning toward decision-making under deep uncertainty, employing dynamic adaptive pathways and structured climate risk and vulnerability assessments to stress-test wastewater assets against flooding and sea-level rise [15,16,17]. In parallel, the circular-economy literature has reframed wastewater as a resource and has developed system- and product-level indicators to quantify water, energy and nutrient recovery in treatment plants [18,19,20].
On the policy and finance side, recent evidence on carbon pricing shows that carbon-cost pass-through and access to capital materially shape firms’ decarbonization strategies and investment feasibility [21], while emerging work on fintech-enabled sustainable finance [22] and on reinforcement-learning frameworks for aligning investment portfolios with the Sustainable Development Goals [23] demonstrates how data-driven decision-support tools can balance financial returns with sustainability objectives.
Despite these advances, these strands have largely evolved in isolation: spatial flood-hazard mapping, facility-level circularity scoring and financial bankability are rarely integrated within a single, operational decision-support framework for water utilities.
The paradigm of Sustainable Finance is defined as the process of taking environmental, social, and governance (ESG) considerations into account when making investment decisions, leading to increased longer-term investments into sustainable economic activities. Within this framework, investments related to the Circular Economy (CE)—such as on-site renewable energy integration and resource efficiency—are increasingly classified as ‘Green Investments’ under international taxonomies. These investments are pivotal for wastewater utilities to transition from cost-heavy operations to value-generating assets, thereby qualifying for Green Bonds and Sustainability-Linked Loans [24]. Furthermore, this paper demonstrates that improving the CE performance of a WWTP provides a substantial positive contribution to the Debt Service Coverage Ratio (DSCR). By reducing operational expenditures (OPEX) through renewable energy investment, these interventions enhance the facility’s bankability and long-term financial resilience. The integration of these strategies directly contributes to the achievement of the United Nations Sustainable Development Goals (SDGs), particularly SDG 6 (Clean Water and Sanitation), SDG 9 (Industry, Innovation and Infrastructure), SDG 11 (Sustainable Cities and Communities), and SDG 13 (Climate Action).
In the context of this study, ‘bankability’ is defined as the degree to which an asset generates sufficiently reliable and predictable net cash flows—or, in the case of cost-based public utilities, a sufficient operating surplus—to service its debt obligations and thereby attract financing on acceptable terms. For infrastructure assets, bankability is most directly captured by the Debt Service Coverage Ratio (DSCR), the ratio of net operating income available for debt service to scheduled debt service, which lenders and credit-rating agencies treat as the principal covenant metric when assessing creditworthiness [25]. DSCR is adopted as the primary bankability metric in this study because it is directly observable from utility financial statements, is explicitly embedded in lending covenants (commonly in the 1.20–1.25 range), and translates operational efficiency gains—such as the OPEX reductions delivered by circular-economy interventions—into a quantifiable improvement in creditworthiness.
The specific objectives and novel contributions of this research are: (1) to quantify the physical flood exposure of five WWTPs across Türkiye using the Aqueduct Flood hazard model for multiple future climate scenarios (2030, 2050, and 2080); (2) to apply a comprehensive CE scoring framework, comprising 142 indicators across four dimensions (Climate Risk Management, Circularity Performance, Environmental Performance, and ESG) to five representative WWTPs; (3) to propose a novel Index for Climate Risk and Circularity (ICRC) that identifies ‘high-circularity/high-risk’ facilities, providing a systematic basis for investment prioritization; and (4) to demonstrate the link between technical circularity interventions and financial bankability through a DSCR-based case study, offering practical insights for aligning utility management with sustainable finance requirements.
By bridging the gap between spatial risk analysis, circularity performance, and financial metrics, this research provides a scalable methodology for enhancing the climate resilience and bankability of critical water infrastructure in an era of increasing environmental uncertainty.
2. Materials and Methods
The study follows a multi-layered analytical framework integrating climate risk mapping and circular economy assessment for wastewater treatment plants (WWTPs). The methodology is structured into three interlinked components: (i) flood hazard modeling, (ii) circular economy performance scoring, and (iii) the development of an integrated Index for Climate Risk and Circularity (ICRC).
2.1. Data Sources and Case Study Selection
Five WWTPs in Türkiye were selected as case studies to represent diverse climatic, hydrological, and socio-economic conditions. These include an inland semi-arid location with high water stress, a coastal industrialized basin under urbanization pressure, and a Mediterranean region characterized by tourism-driven water demand and high flood exposure. Real operational data were obtained from three facilities, while publicly available datasets and official reports were utilized for the remaining two.
Climate and flood risk data were retrieved from the World Resources Institute Aqueduct Flood Tools (Aqueduct Floods Hazard Maps Version 2) Spatial datasets were integrated with the geographic coordinates of the WWTPs using QGIS 3.34 software to visualize exposure levels and assess vulnerability across multiple time horizons (2030, 2050, and 2080).
2.2. Circular Economy Scoring Framework
To assess the overall Circular Economy (CE) performance of the selected WWTPs, we developed a framework based on 142 thematic indicators. These indicators were categorized into 11 thematic groups (coded A–K), covering treatment technologies, sludge management, governance and carbon emissions (Table 1). To facilitate a strategic assessment, we synthesized these 11 categories into four main pillars:
Table 1.
Circular Economy Scoring Framework.
- Climate Risk Management (CRM): Evaluates physical risk assessments and adaptation strategies.
- Circularity Performance (CEP): Focuses on resource recovery, energy efficiency, and reuse.
- Environmental Performance (EP): Measures regulatory compliance and discharge quality.
- Environmental–Social–Governance (ESG): Assesses institutional transparency, social inclusion, and policy frameworks.
The overall Circular Economy Score (CES) was then calculated as the simple arithmetic average of these four pillars, providing a balanced view that accounts for both the operational efficiency and the climate resilience of each facility.
The 142 indicators were not selected arbitrarily but were derived through a structured, three-stage process. First, an initial pool of candidate indicators was compiled from established international frameworks and the peer-reviewed literature on circular economy and climate resilience in the water sector, including recent indicator systems developed specifically for assessing circularity in wastewater treatment plants [18,19]. Second, the candidate indicators were screened for relevance to the Turkish regulatory and operational context, for measurability from publicly available facility documentation, and for non-redundancy. Third, the retained indicators were grouped into the eleven thematic categories (A–K) and mapped onto the four assessment pillars (CRM, CEP, EP, ESG), ensuring that each pillar captured a conceptually distinct dimension of performance.
To enable comparison across categories containing different numbers of indicators and heterogeneous measurement units, each indicator was first converted into a binary or ordinal compliance score reflecting whether the facility satisfied the underlying criterion. Category scores were then computed as the percentage of satisfied indicators within each category, normalizing all categories onto a common 0–100 scale. Pillar scores (CRM, CEP, EP and ESG) were obtained by aggregating the normalized scores of their constituent categories, and the overall Circular Economy Score (CES) was calculated as the simple arithmetic average of the four pillars, also expressed on a 0–100 scale.
An equal-weighting scheme was adopted at both the indicator and the pillar level. This choice reflects three considerations. First, in the absence of a broad expert-elicitation exercise or a documented stakeholder consensus on the relative importance of the circularity, climate, environmental and governance dimensions, equal weighting avoids introducing unsubstantiated subjective preferences and is widely recommended as a transparent and reproducible default in composite-indicator construction. Second, the four pillars represent complementary rather than substitutable dimensions of resilience, so privileging one dimension over another is difficult to justify on theoretical grounds. Third, equal weighting facilitates replication by other Water and Sewerage Administrations that may lack the resources to conduct facility-specific weighting studies. We nonetheless acknowledge that alternative schemes, such as expert-derived weights, Analytic Hierarchy Process (AHP) weights, or entropy-based data-driven weights, could be applied where richer data or stakeholder input is available.
To verify that the relative ranking of the facilities is not an artefact of the equal-weighting assumption, a sensitivity analysis was performed. Each of the four pillars was perturbed in turn by assigning it an elevated weight (up to 40% of the composite, with the remaining weight distributed equally among the other three pillars), and the resulting CES values and facility rankings were recompared. Across all tested weighting configurations, the ordinal ranking of the leading facilities (WWTP-3, WWTP-4 and WWTP-5) and of the weakest performer (WWTP-2) remained stable, and the changes in CES were generally confined to a few points. This indicates that the conclusions drawn from the CES are robust to reasonable variations in the weighting scheme and are driven by genuine performance differences rather than by the specific aggregation choice.
Two principal sources of uncertainty affect the scoring framework: (i) data uncertainty, arising from reliance on publicly available facility documentation of varying completeness across the five plants, and (ii) methodological uncertainty, associated with indicator binarization and aggregation. The sensitivity analysis described above addresses the latter, whereas the limitations of public-data reliance and of cross-facility data consistency are discussed explicitly in Section 4.3.
2.3. Flood Risk Modeling and Spatial Analysis
Flood exposure was modeled using the GFDL-ESM2M (GFDL) global climate model, selected for its robust representation of hydrological extremes in Mediterranean and mid-latitude regions [26]. The analysis included:
Riverine and Coastal Flooding: Simulations for 2030, 2050, and 2080.
Return Periods: Four scenarios (100, 250, 500, and 1000 years) were analyzed to evaluate low-probability/high-impact events.
Overlay Analysis: WWTP footprints were intersected with flood hazard layers in QGIS to determine the percentage of facility area at risk of inundation and the potential impact on critical treatment units.
A single global climate model (GFDL-ESM2M) was used rather than a multi-model ensemble for two main reasons. First, the Aqueduct Floods tool provides pre-processed hazard layers for only a limited set of global climate models. A single global climate model (GFDL-ESM2M) was used rather than a multi-model ensemble to maintain methodological consistency across facilities and time horizons within the Aqueduct Floods framework. Although GFDL-ESM2M provides a consistent hazard signal for comparative screening, reliance on a single model introduces structural uncertainty. Therefore, the results should be interpreted as scenario-based exposure screening rather than deterministic flood-risk projections [26,27]. Second, the objective of this study is the relative prioritization of facilities under a consistent hazard signal rather than the absolute quantification of flood depths; using a single, internally consistent model therefore preserves comparability across the five sites. Nevertheless, reliance on a single model introduces structural and parametric uncertainty: different models can diverge substantially in projected precipitation extremes and surface runoff, so the use of one model may under- or over-estimate future flood exposure at specific sites. A multi-model ensemble would reduce individual-model bias and better characterize the uncertainty envelope of the projections [28]; its incorporation is identified as a priority for future work in Section 4.3.
2.4. Financial Bankability Analysis (DSCR)
To demonstrate the link between technical circularity and financial resilience, a Debt Service Coverage Ratio (DSCR) case study was conducted for WWTP-3. Given that Turkish WWTPs operate under a centralized tariff system managed by Water and Sewerage Administrations (WSAs), bankability was assessed through the impact of operational expenditure (OPEX) reductions on the utility’s consolidated debt service capacity.
The DSCR was calculated as follows:
DSCR = (Net tariff collection − Total WSA operating expenditures)/Annual debt service
Four investment scenarios for on-site solar PV (ranging from 100% loan to 100% grant) were modeled to quantify how renewable energy integration improves the DSCR and enhances eligibility for sustainable finance.
2.5. Index for Climate Risk and Circularity (ICRC)
To operationalize the joint assessment of circular economy performance and physical climate risk, we developed the Index for Climate Risk and Circularity (ICRC). The ICRC is structured as a two-dimensional decision-support framework that intersects a facility’s operational sustainability with its environmental vulnerability. The index utilizes two primary qualitative and quantitative inputs:
- Overall Circular Economy Score (CES): The quantitative performance metric derived from the 142 indicators across the CRM, CEP, EP, and ESG pillars, representing the technical and institutional maturity of the facility.
- Flood Exposure Level: A qualitative risk assessment derived from the spatial overlay of WWTP footprints with Aqueduct flood depth layers (1000-year return period) in QGIS. Facilities are categorized based on the modeled extent and severity of inundation across the 2030, 2050, and 2080 scenarios.
The ICRC framework categorizes facilities into four strategic quadrants by evaluating whether they meet specific performance and risk thresholds. A CES of 40 is established as the benchmark for technical maturity, while high flood exposure is defined as the risk of partial or complete submersion of core process units (e.g., aeration tanks, secondary settlers) in at least two of the three modeled time horizons. This categorization allows for a systematic prioritization of investments, distinguishing between facilities that require technological upgrading (Efficiency Gap), those needing urgent physical protection (Vulnerable Pioneers), and those representing the highest overall risk (Critical Priority).
The CES threshold of 40 used to separate ‘high’ from ‘low’ circularity was not selected arbitrarily. On the normalized 0–100 scale, a score of 40 corresponds approximately to the midpoint between the weakest and strongest performers in the sample and is consistent with the mean CES across the five facilities (approximately 43). Empirically, it produces a classification that aligns with the qualitative engineering assessment of the plants, separating facilities with only partial resource-recovery and governance systems from those with established circular-economy practices. Conceptually, a value of 40 also reflects a minimum threshold of technical maturity below which a facility satisfies fewer than half of the audited circularity, environmental and governance criteria.
To test the influence of this cut-off, alternative thresholds of 35 and 45 were examined. Lowering the threshold to 35 reclassifies no facility, while raising it to 45 moves only WWTP-5 (CES = 46) and WWTP-4 (CES = 48) closer to the boundary without altering their quadrant assignment, because their flood-exposure classification remains the decisive criterion. The quadrant structure therefore proves robust to reasonable variation in the CES threshold, and the final prioritization is not sensitive to the precise numerical cut-off.
Flood-exposure levels were classified using transparent, spatially explicit criteria rather than ad hoc judgement. A facility was assigned ‘high’ exposure where the overlay analysis indicated partial or complete submersion of core process units (e.g., aeration tanks, secondary settlers) under the 1000-year return-period hazard layer in at least two of the three modeled horizons (2030, 2050 and 2080); ‘low’ exposure was assigned where the core units remained outside the modeled inundation extent across the horizons. Anchoring the classification to the inundation of mission-critical units, rather than to the share of total site area affected, ensures that the metric reflects operational-failure risk, which is the variable most relevant to both service continuity and bankability.
During the initial conceptualisation and manuscript revision phases, the authors used generative AI tools, including ChatGPT 5.3 (OpenAI), Claude Haiku 4.5, (Anthropic), and Gemini 3.5 Flash (Google), in a limited and assistive capacity. ChatGPT was used to assist in exploring and structuring preliminary conceptual perspectives related to the integration of flood exposure, circular economy performance, and financial bankability in wastewater treatment infrastructure. Claude was used to support checks on whether the revised manuscript addressed journal and editorial requirements. Gemini was used for English language proofreading and clarity checks. These tools were not used for data collection, data generation, data analysis, indicator scoring, flood mapping, financial calculations, interpretation of results, or the formulation of final scientific conclusions. All AI-assisted outputs were critically reviewed, revised, and validated by the authors, who take full responsibility for the integrity, accuracy, and originality of the work.
3. Results
3.1. Technical Profiles and Operational Characteristics
The empirical data for this study were obtained from five operational wastewater treatment plants (WWTPs) in Türkiye. These plants were selected based on their diverse treatment technologies and varying levels of exposure to climate-related risks, providing a representative cross-section for the proposed ICRC framework. A comprehensive summary of the operational data retrieved for the five selected WWTPs is presented in Table 2.
Table 2.
Summary of Data Retrieved for Five Selected WWTPs.
3.1.1. WWTP-1
WWTP-1 operates a biological treatment system with anaerobic digesters for sludge stabilization, generating biogas as a byproduct. Approximately 80–85% of the plant’s electricity demand is met through on-site biogas-to-energy production, significantly reducing dependence on the external grid. However, the current treatment design focuses primarily on carbon removal, without total nitrogen (TN) and total phosphorus (TP) elimination. Consequently, the plant does not fully comply with the Communiqué on Receiving Environment Standards (KAAY) Table 1 and Table 2, and must be upgraded to an advanced biological system capable of TN and TP removal [29]. The facility plans to undertake this upgrade as part of its ‘Conversion to Advanced Biological Treatment Project,’ within which a carbon footprint assessment is also underway. Environmentally friendly initiatives include future plans to adopt energy-efficient equipment and to reuse treated wastewater for agricultural irrigation.
A Life Cycle Assessment (LCA) has not yet been conducted; thus, the impacts on biotic and abiotic resources, salinity, ecotoxicity, and eutrophication remain undetermined. Previous research has demonstrated that LCA is not merely a tool for pollution measurement, but a strategic guide for optimizing renewable energy integration and resource recovery scenarios. For instance, incorporating renewable energy utilization into WWTP designs has been shown to significantly reduce the operational carbon footprint and enhance the overall environmental profile of the facility [30]. Furthermore, testing circular economy strategies—such as water reclamation and reuse—through LCA methodology allows for the selection of the most sustainable engineering solutions against multi-dimensional challenges like water scarcity and resource management [31].
The female employment rate is approximately 9%. Gender diversity is a strategic lever for institutional resilience in the water sector. Research conclusively shows that companies with gender-diverse workforces disclose fewer time-loss injuries, fostering psychologically safe and inclusive workplaces [32]. According to the International Finance Corporation (IFC), gender-diverse leadership in water utilities leads to improved financial performance and more inclusive decision-making, which are critical for climate adaptation strategies. Integrating women into technical and managerial roles in WWTPs not only fulfills ESG mandates but also enhances the social license to operate, ensuring that community-wide water resilience programs are more effectively designed and implemented [33]. Globally, women represent approximately 20% of the workforce in water and wastewater industries, comprising about one-third of technicians and associate professionals, and 55–60% of clerical support workers in upper-middle and high-income countries [34].
No climate change training is currently provided to staff, though employees receive technical training on wastewater treatment operations, occupational safety, and chemical handling. There are no public information or awareness programs related to the plant’s environmental impacts. Additionally, no odor management system is in place.
3.1.2. WWTP-2
WWTP-2 operates based on an A2/O (Anaerobic–Anoxic–Oxic) process, classified as an advanced biological treatment system. Sludge is dewatered, temporarily stored in lagoons, and then transferred to regulated landfill sites. Carbon emissions are not calculated, and all electricity is sourced from the national grid. There is no methane recovery system. Screenings and grit residues are transferred to licensed disposal facilities. The plant maintains environmental, waste, water, occupational safety, and emergency response plans, yet lacks a climate change adaptation or extreme weather action plan. Climate risk assessments have been conducted only for urban runoff, lightning, and storm events, excluding critical hazards such as riverine and coastal flooding, hail, temperature extremes, drought, and prolonged precipitation. Environmentally friendly practices include rainwater collection and reuse for irrigation and drainage, with plans to reuse treated effluent for agricultural irrigation. However, a Life Cycle Assessment (LCA) has not been performed; thus, potential impacts on biotic/abiotic resource use, salinity, ecotoxicity, or eutrophication remain unknown. The female employment rate at the plant is 7%, indicating a need for improved gender balance in technical roles. In terms of governance, no climate change training is provided to employees. While staff receive training on wastewater treatment and health impacts, chemical management and public awareness programs are not implemented. Conventional odor management systems are in place.
3.1.3. WWTP-3
WWTP-3 is an advanced facility built to treat domestic wastewater and remove carbon, nitrogen, and phosphorus through biological nutrient removal. The process includes physical treatment units, biological treatment tanks, and a full sludge treatment line. The plant can be operated under A2/O, Bardenpho, Johannesburg, and similar configurations, offering high operational flexibility. The facility uses a multi-stage sludge management system: (1) Aerobic sludge digestion to biologically stabilize sludge; (2) Mechanical dewatering (decanter units) to increase dryness from ~3.5% to ~22%; (3) Thermal drying and final disposal of dry sludge. The dried sludge is fully disposed of through licensed waste disposal pathways.
A recovery unit produces approximately 1200 m3/day of reclaimed water through automatic sand filters, filtration, and UV disinfection. This treated water is reused inside the facility for washing and on-site operations, reducing freshwater demand. The facility does not currently monitor or calculate its carbon emissions. No renewable energy sources are in use; the plant relies entirely on grid electricity. Waste streams are segregated and transferred to licensed recycling companies.
One of the strongest aspects of WWTP-3 is its governance framework, with clear policies, procedures, mission, and vision prioritizing water and environmental protection. Flooding and drought risks are recognized and prioritized under the broader category of ‘natural disasters’; however, no dedicated analysis exists for short-term extreme weather events, such as hailstorms. The only applied eco-friendly measure beyond regulatory compliance is the onsite reuse of treated wastewater. No Life Cycle Assessment (LCA) studies are conducted for processes or outputs. All operational datasets are consistently monitored, recorded, and retrievable.
The plant demonstrates high technical treatment capability, particularly in nutrient removal and sludge management, and has strong governance and environmental compliance frameworks. However, key improvement opportunities include: carbon accounting and emission reduction planning; renewable energy integration (e.g., solar PV or biogas recovery); climate resilience planning for extreme weather variability; strategic environmental performance evaluation through LCA.
3.1.4. WWTP-4 and WWTP-5
WWTP-4 and WWTP-5 both employ advanced biological treatment processes. Main electricity usage is sourced from the grid, with partial renewable energy integration in both facilities. Climate adaptation plans are not specific to WWTP-4 and WWTP-5 at the facility level; available information is limited to municipal and Water and Sewerage Administration (WSA)-level assessments.
3.2. Circular Economy Score (CES) Analysis: Quantitative Performance
The quantitative assessment of the five WWTPs, synthesized from the 142-indicator framework, reveals distinct strategic profiles for each facility. The consolidated results, categorized into four performance pillars and an overall Circular Economy Score, are presented in Table 3.
Table 3.
Consolidated Scores of Five Different WWTPs.
The analysis indicates that WWTP-4 achieves the highest Climate Risk Management Score (57). This strong climate score is driven by: a detailed climate risk assessment covering long-term and short-term climate impacts; the presence of a carbon emission reduction target; defined environmental, water, and climate policies; exposure analysis for extreme weather events; strategic water resilience through the planned reuse of treated effluent for agricultural irrigation, which serves as a critical climate adaptation measure in water-stressed regions.
WWTP-5 demonstrates the highest performance in circularity performance score. Key factors contributing to this include: its advanced sludge treatment systems; a formal emission reduction commitment; renewable energy usage exceeding 30% of its total electricity demand; methane recovery/production, which supports resource efficiency and energy circularity.
While Environmental Performance Scores remain relatively consistent across the advanced biological plants (WWTP-1, 3, 4, and 5), WWTP-2 lags significantly (22) due to its lack of advanced nutrient removal and reliance on conventional treatment methods. Other plants’ performances indicate that regulatory compliance processes and operational environmental controls are being consistently and effectively managed.
When considering overall ESG performance, WWTP-3 is the leading facility with 66 points. Its leadership is driven by: superior wastewater and sludge treatment technologies; a strong waste management approach, prioritizing recycling through licensed recovery firms rather than landfilling; active environmental and social policy implementation; clear governance, with well-defined roles and responsibilities in site management; ongoing communication and awareness efforts targeting both employees and the local community.
The Overall Circular Economy Score identifies WWTP-3 as the highest-performing facility overall, followed by WWTP-4 and WWTP-5. WWTP-5, however, records the highest Circularity Performance Score, reflecting its stronger resource-recovery and energy-circularity profile. WWTP-2 (overall circular economy score is 28) represents a critical ‘resilience gap.’ These scores provide the quantitative baseline for the subsequent flood risk mapping and financial bankability analysis, highlighting that technical circularity must be balanced with physical climate resilience to ensure long-term infrastructure viability.
3.3. Flood Risk Mapping in Wastewater Treatment Plants
Climate-related risks can be evaluated across multiple dimensions and are generally classified into physical and transition risks. This study focuses primarily on physical risks, which constitute the core of the analysis. Physical risks arise from climate change–induced variations in weather patterns, potentially disrupting the operational stability and long-term resilience of infrastructure systems. Examples of these risks include extreme heat and cold events, hailstorms, hurricanes, typhoons, tsunamis, sea- and river-level rise, groundwater depletion, and flooding. Such events directly affect the design, performance, and service continuity of WWTPs.
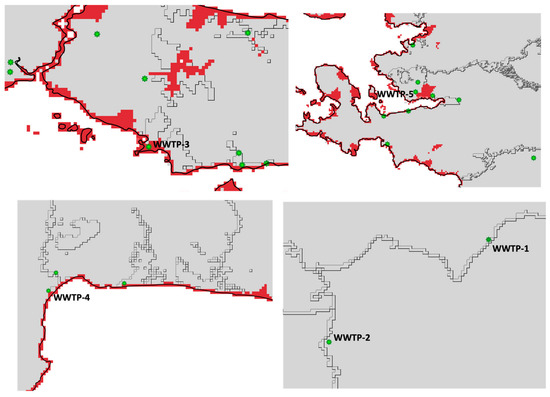
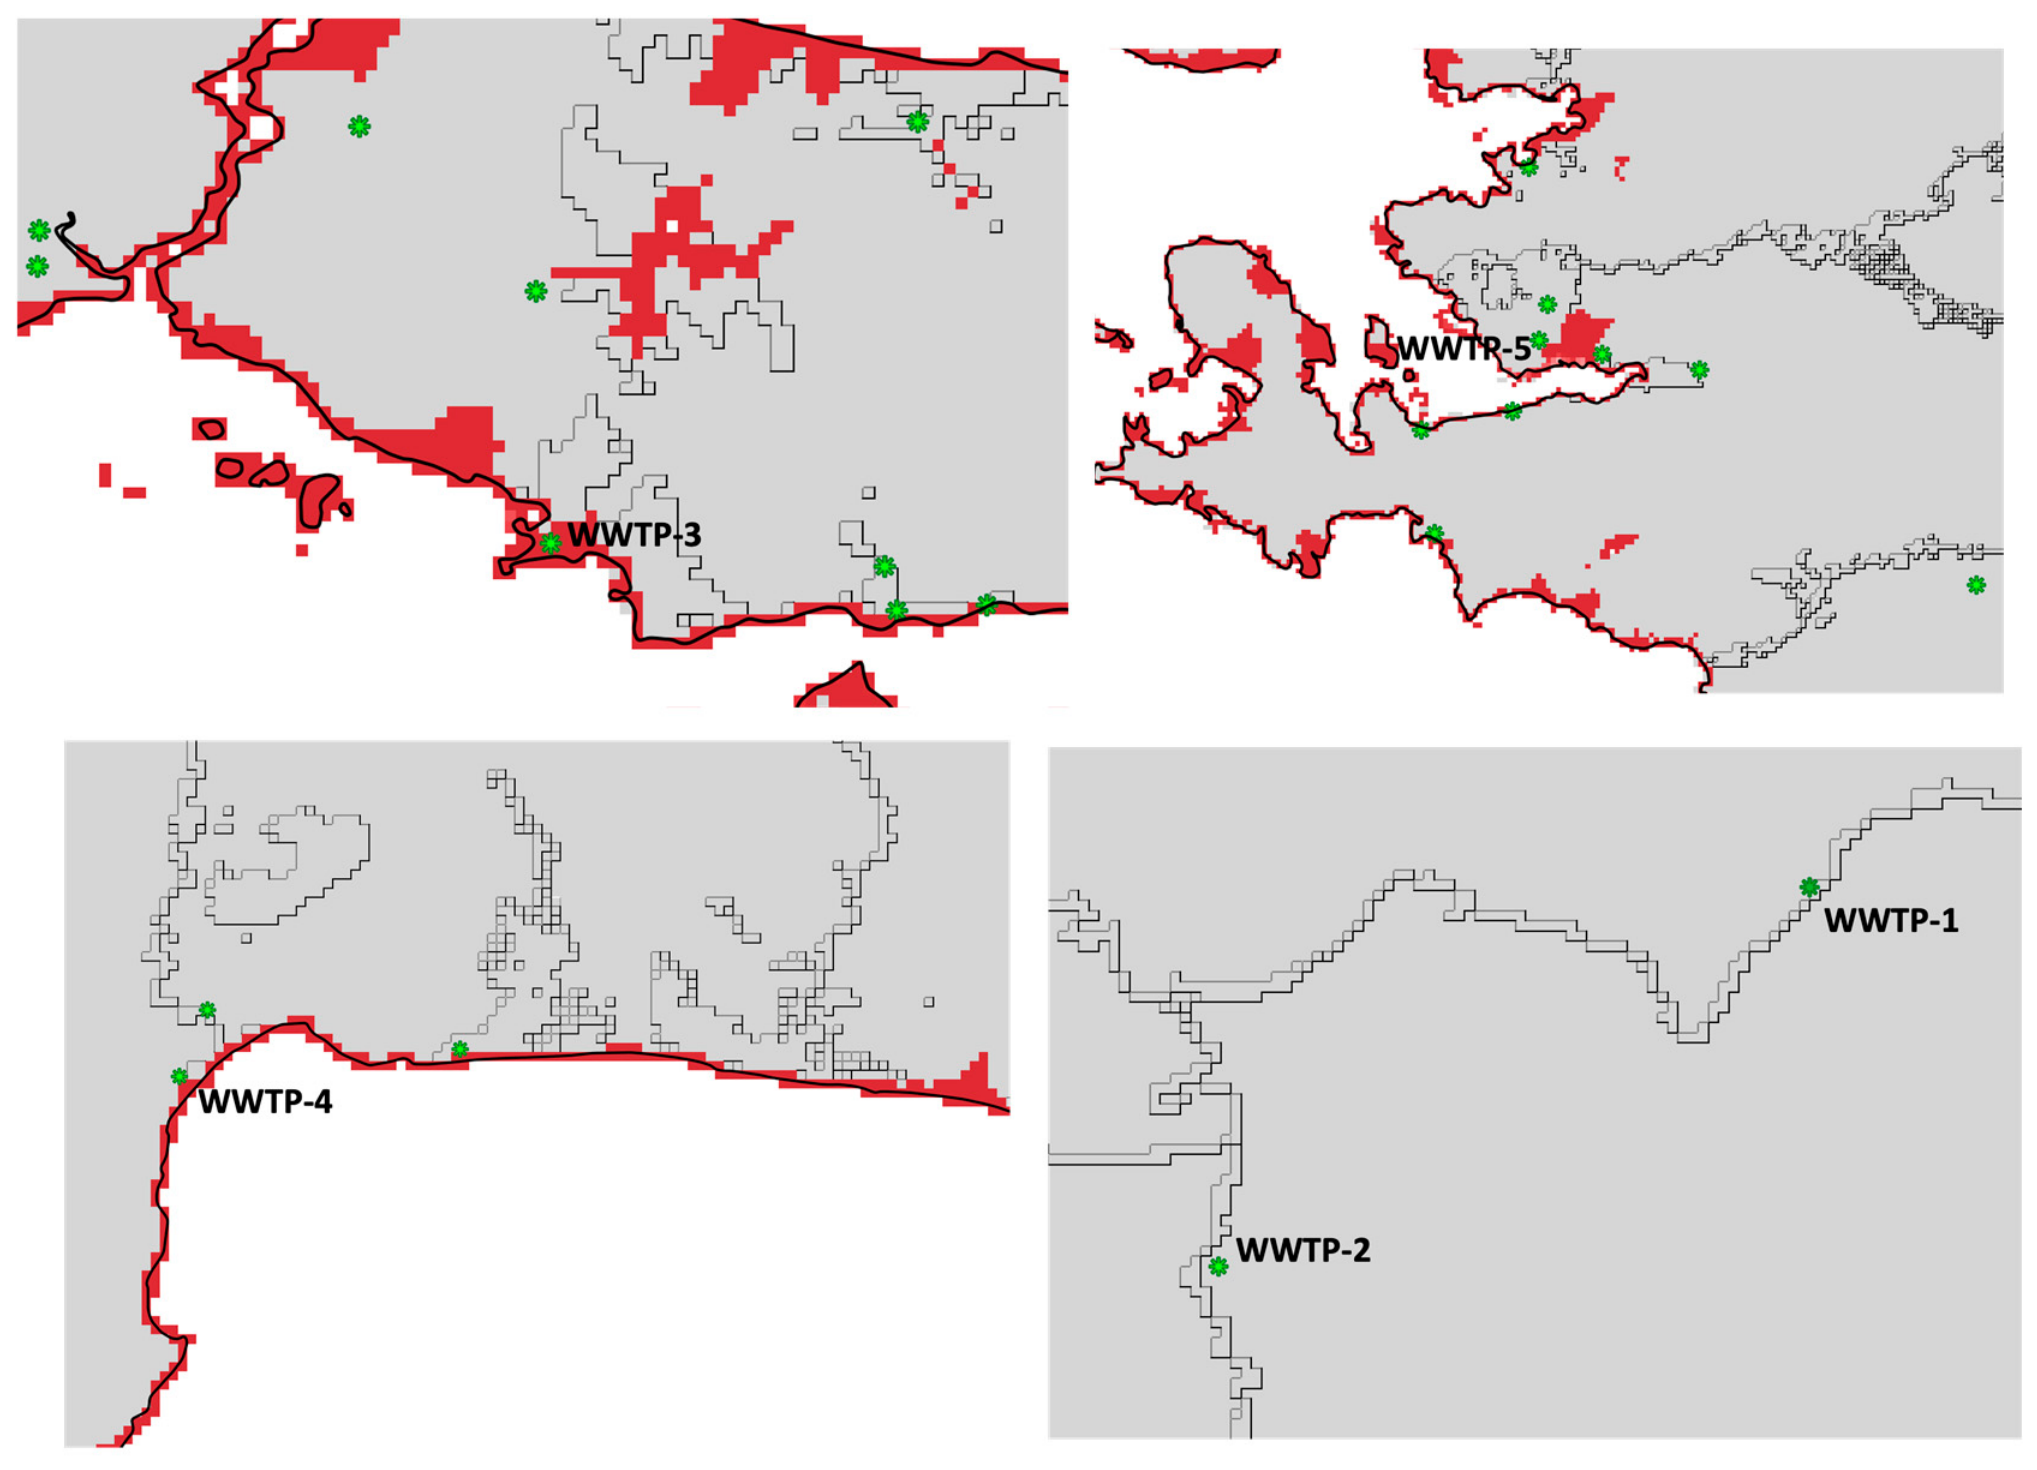
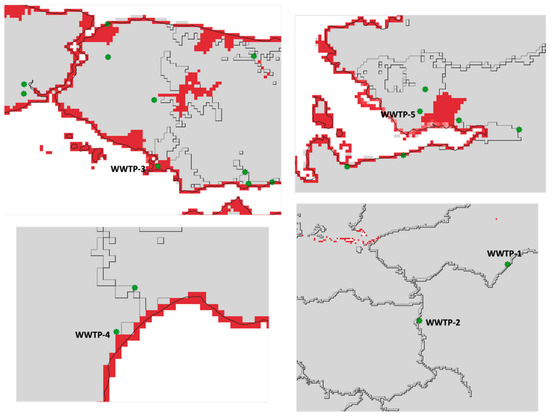
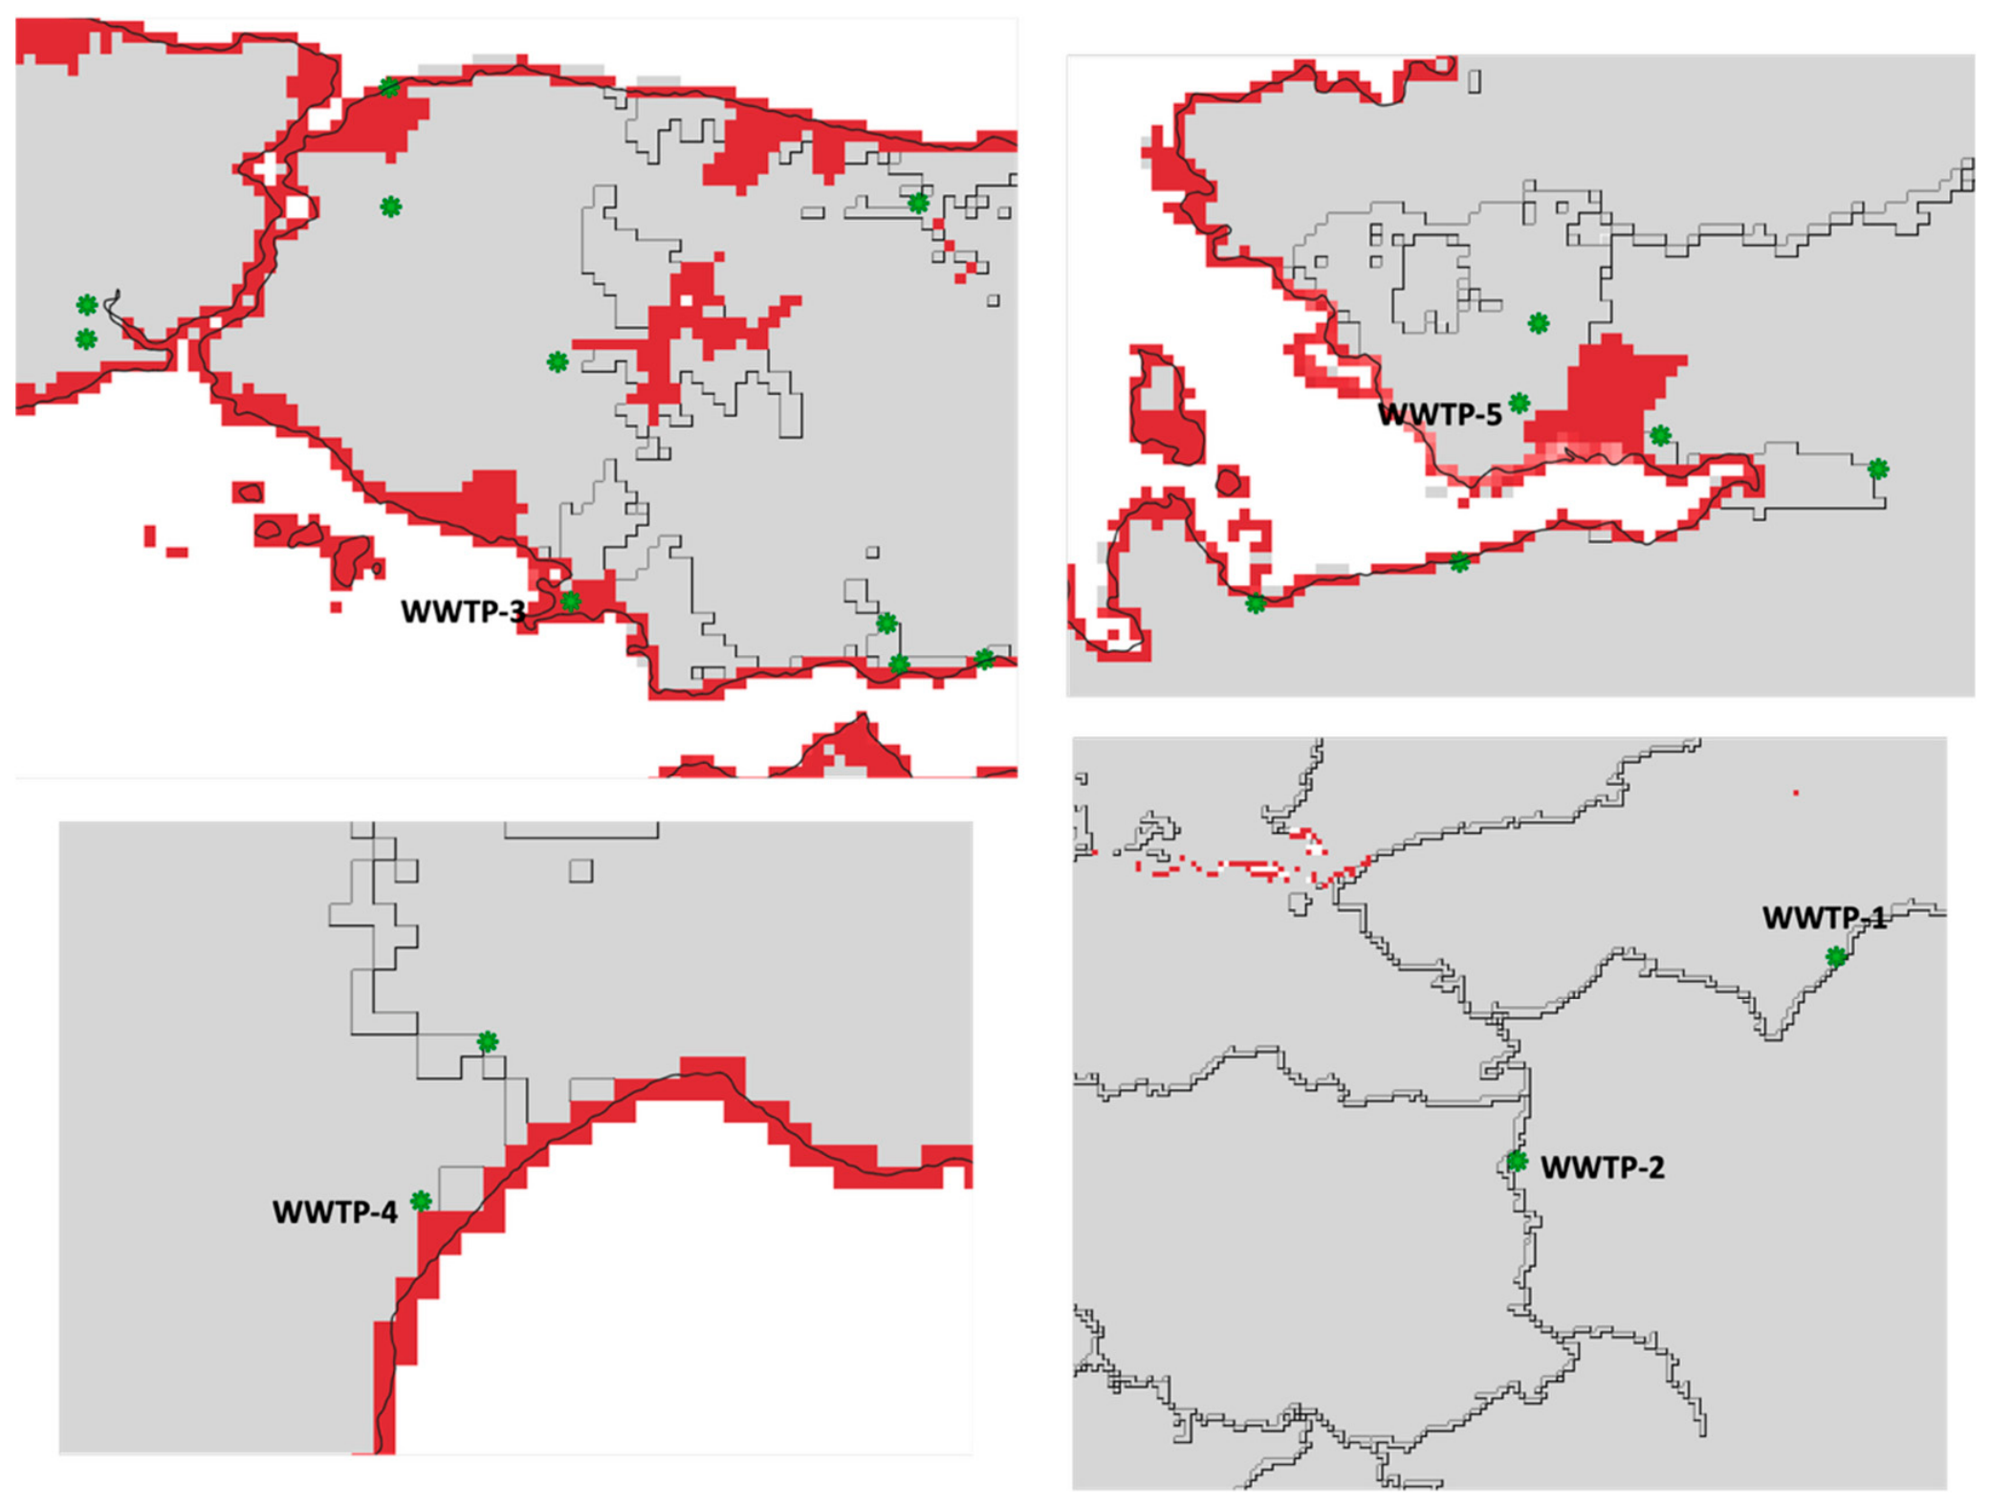
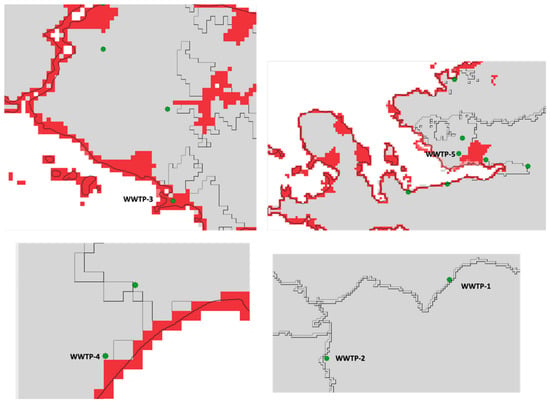
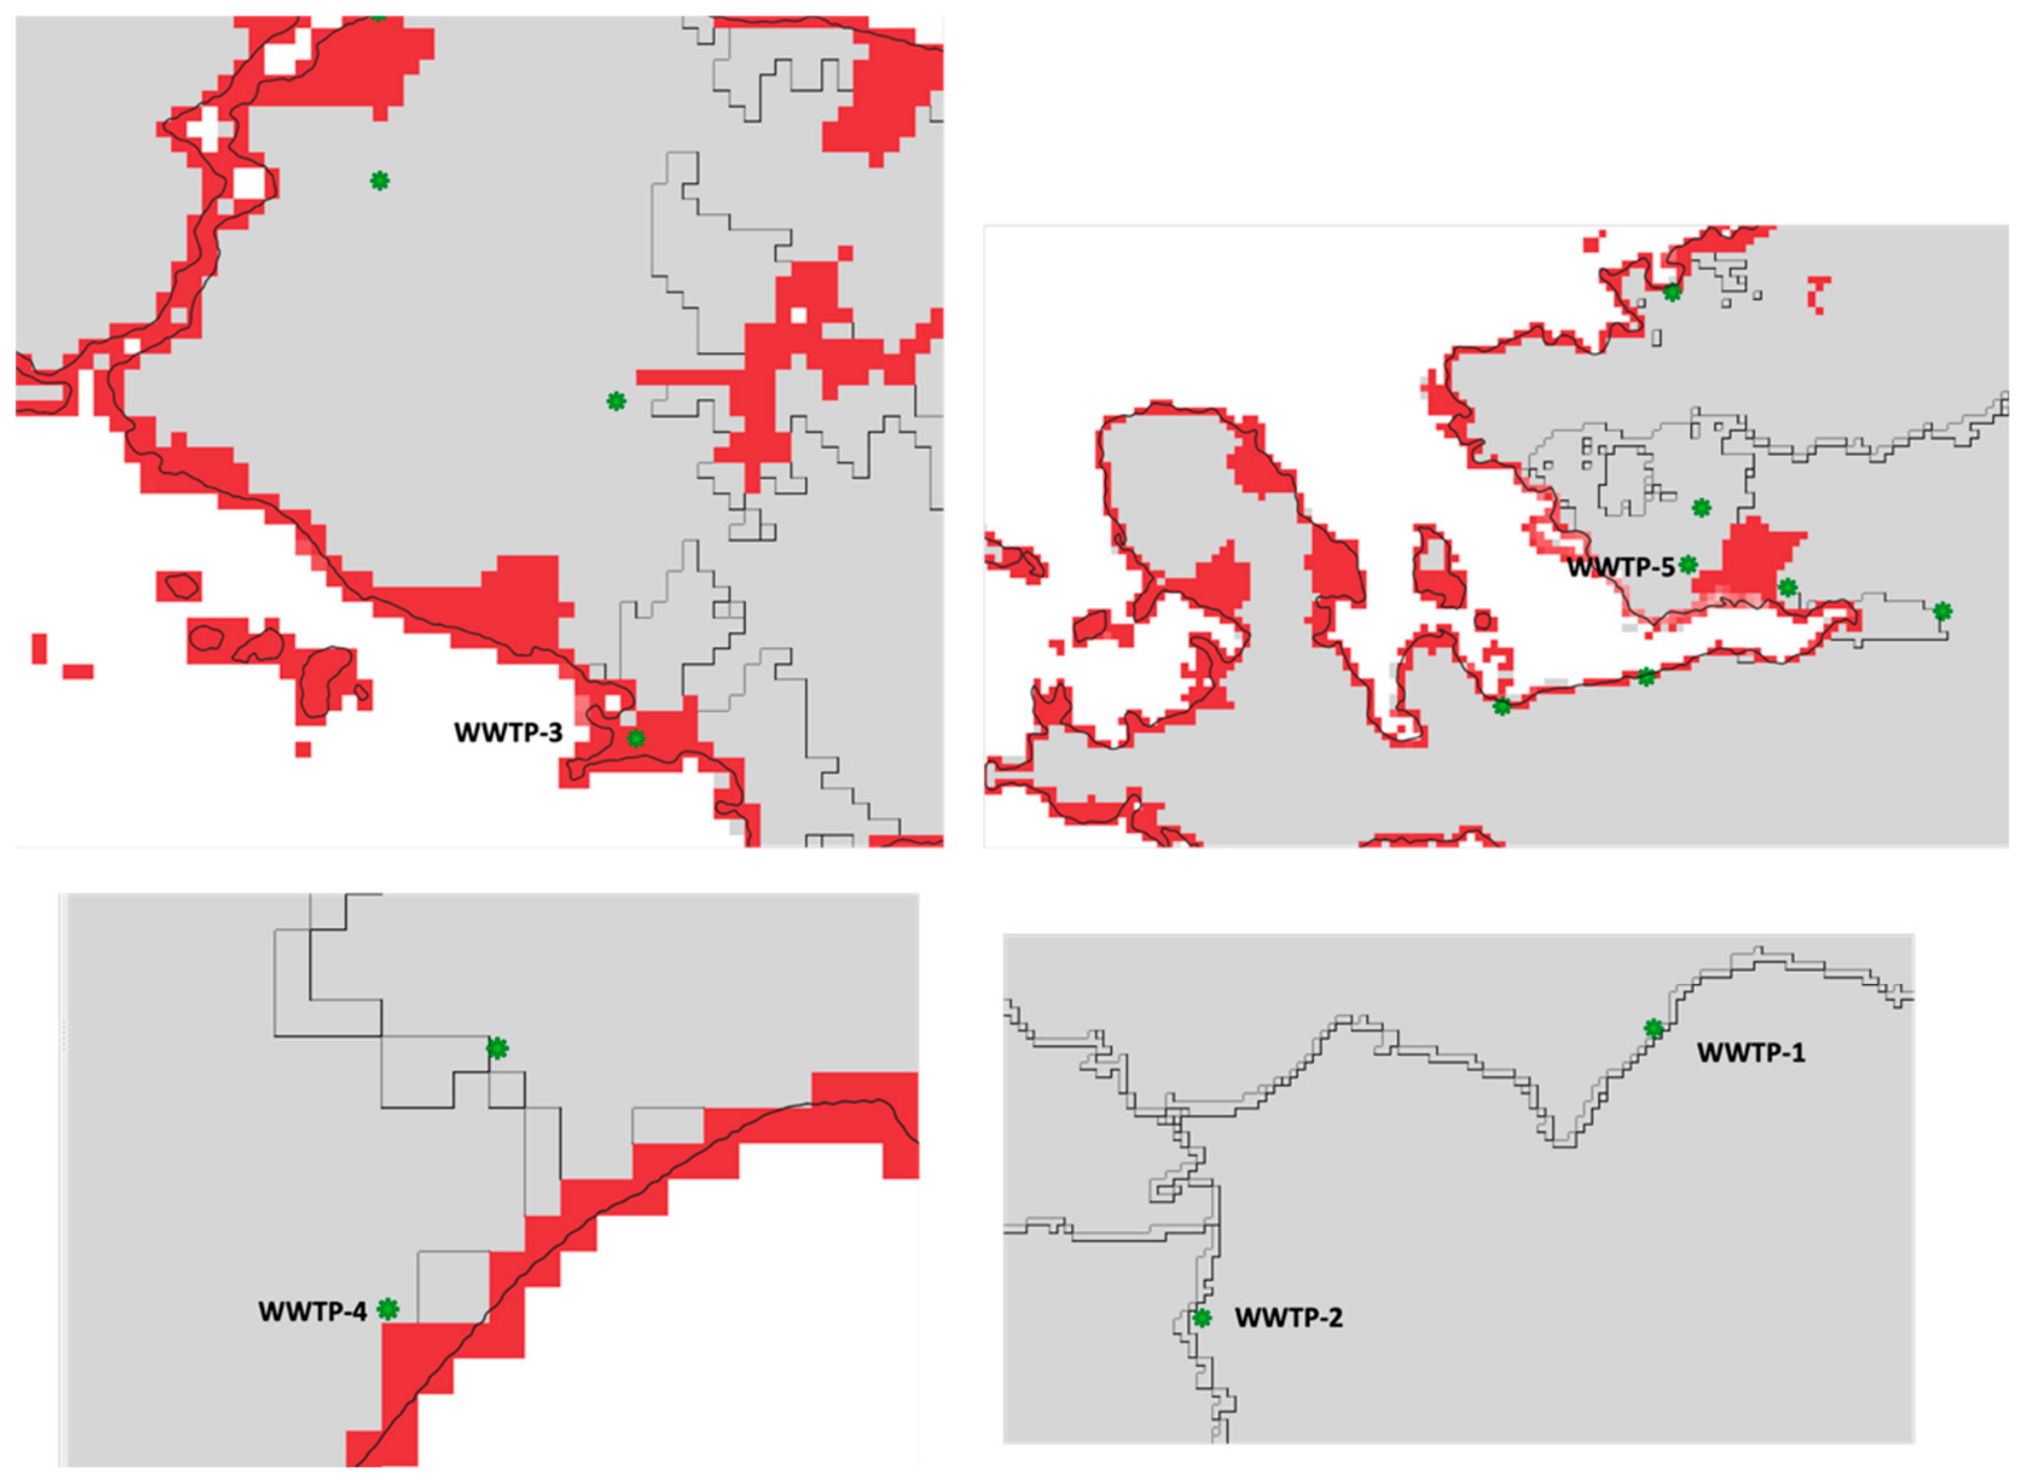
Flood risks for the selected facilities were modeled using the Aqueduct Flood Tool developed by the World Resources Institute (WRI) [35]. Separate models were generated for riverine and coastal floods, and scenarios were created for the years 2030, 2050, and 2080 (Figure 1, Figure 2 and Figure 3). All model outputs were exported and transferred into QGIS for spatial overlay with WWTP locations, enabling a visual and quantitative assessment of flood exposure. For riverine flooding, twelve simulations were completed based on return periods of 100, 250, 500, and 1000 years across the three time horizons. Similarly, for coastal flooding, another twelve simulations were conducted using the same return periods, yielding a total of 24 flood hazard maps that were imported into QGIS for spatial overlay and intersection analysis with WWTP footprints.
Figure 1.
2030 Riverine (red marks) and coastal flood (black dotted marks) analysis with Aqueduct for selected WWTPs.
Figure 2.
2050 Riverine (red marks) and coastal flood (black dotted marks) analysis with Aqueduct for selected WWTPs.
Figure 3.
2080 Riverine (red marks) and coastal flood (black dotted marks) with Aqueduct for selected WWTPs.
Among the five global climate model options offered by Aqueduct Flood, the GFDL-ESM2M (GFDL) model was selected because it provides a robust representation of hydrological processes, including precipitation extremes and surface runoff. Compared to models focusing on atmospheric chemistry (MIROC-ESM-CHEM), biogeochemical cycles (IPSL-CM5A-LR), or polar dynamics (NorESM1-M), GFDL offers a balanced performance for flood hazard assessment. For these reasons, it is also the reference model commonly used in global flood risk studies and the default choice in many Aqueduct-based analyses [26,27,36,37].
Key findings from the overlay analysis reveal that WWTP-1 faces a risk of complete submersion under riverine flooding across all three time horizons. While WWTP-2 shows lower risk in 2030 and 2050, its exposure increases substantially by 2080, indicating a high probability of full inundation. WWTP-3 appears completely submerged across all three scenarios, with a detailed facility-level polygon assessment suggesting that coastal flooding could fully inundate the Area-1 section hosting core biological treatment units, such as aeration and nutrient removal tanks. Furthermore, WWTP-4 exhibits increasing flood risk from 2050 onwards, and while WWTP-5 shows a rising exposure trend between 2050 and 2080, the model outputs do not indicate complete submersion for this facility.
These results demonstrate that several high-capacity WWTPs are located in zones where extreme flood events could fully or partially disable treatment operations, particularly by inundating biological and sludge processing units. This spatial diagnosis forms the physical risk dimension of the proposed ICRC framework and provides the basis for investment prioritization.
3.4. Access to Finance Performance Analysis: WWTP-3 Case Study
3.4.1. Spatial Vulnerability and Physical Risk Context
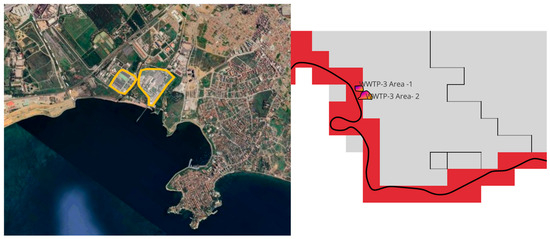
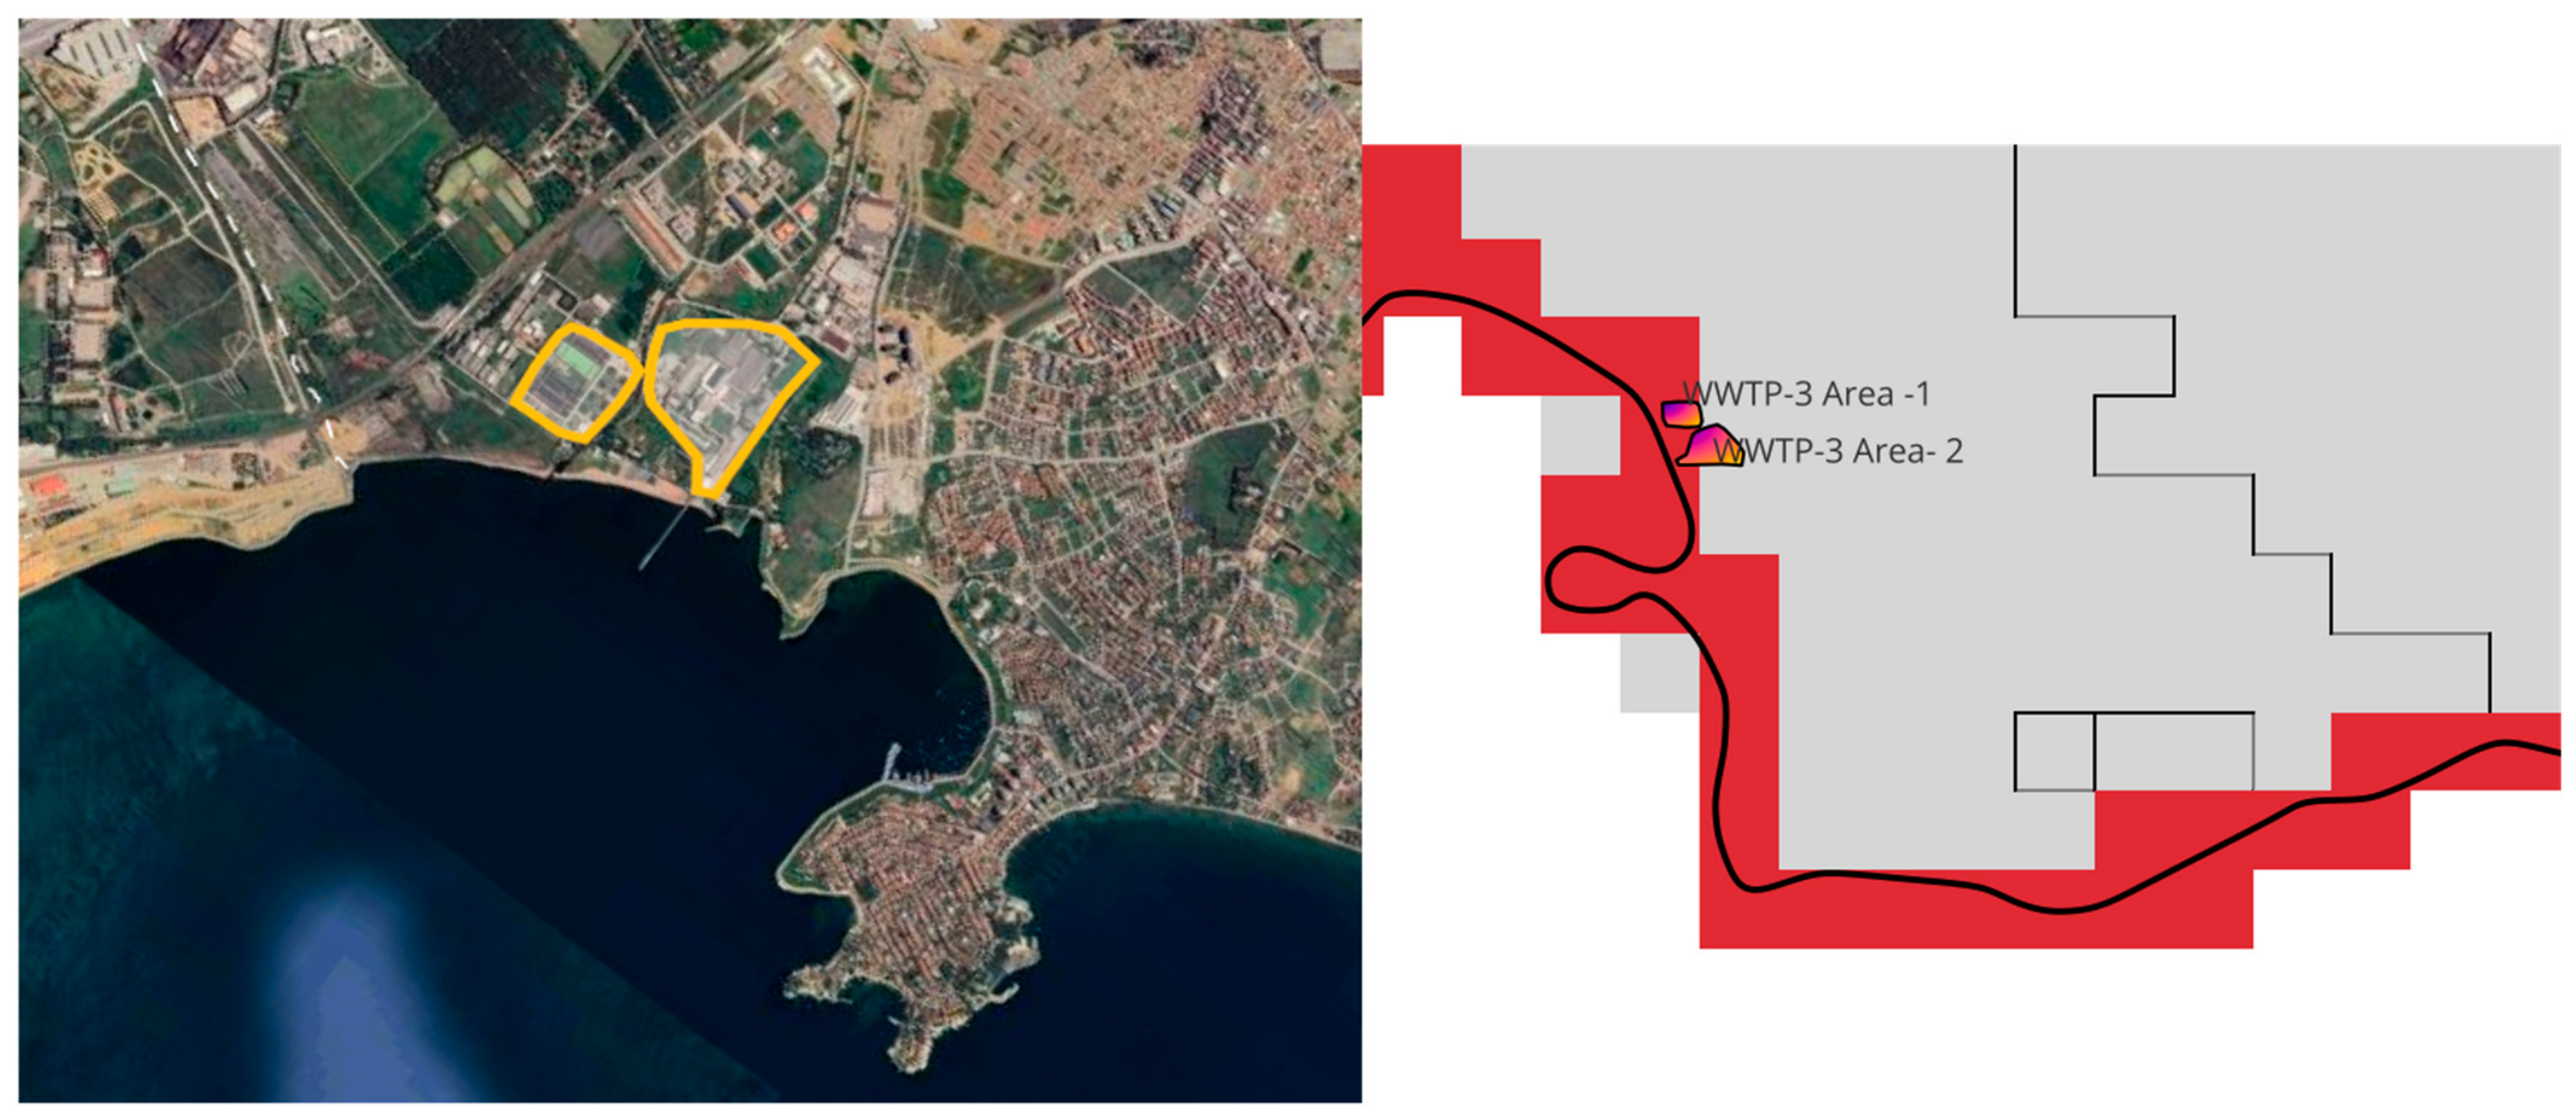
Before assessing financial metrics, the physical exposure of WWTP-3 must be established to understand the operational risks that underpin its bankability. Using Google Earth, the facility footprint was delineated with two polygons because a river runs through the site, effectively dividing the plant into Area-1 and Area-2 (Figure 4). In Figure 4, the yellow polygons delineate the WWTP-3 treatment plant areas, while the red outlined area indicates the riverine flood area.
Figure 4.
WWTP-3 footprint (Area-1 and Area-2) overlaid with riverine and coastal flood maps, illustrating potential submersion of core biological treatment units under coastal flooding scenarios.
Overlaying these polygons with Aqueduct riverine and coastal flood maps reveals that the facility is not significantly affected by riverine flooding; however, in the event of a coastal flood, the entire Area-1 section could be fully submerged, while Area-2 would be only partially inundated. Area-1 hosts the core process units, including aeration tanks, biological nitrogen and phosphorus removal tanks, and final settling tanks. Under such a scenario, the treatment systems would be fully compromised, and wastewater from the service area could not be treated until floodwaters recede. This spatial vulnerability reinforces the financial risk narrative: a single coastal flood event could render any technical investment and associated operating cost savings irrelevant if the facility itself is rendered non-operational.
3.4.2. Institutional Financing and Debt Service Capacity
Within this high-risk physical context, WWTP-3 influences bankability indirectly through its contribution to the WSA’s consolidated operating expenditures (OPEX) and operational risk profile. In a centrally managed tariff setting, measures that reduce WWTP-level OPEX—particularly electricity consumption and sludge management—can strengthen the WSA’s debt service capacity without requiring tariff increases, thereby improving the utility’s credit profile and its ability to mobilize debt for future infrastructure investments.
The plant’s bankability and creditworthiness (access to finance) cannot be assessed through standalone project finance metrics. Debt service capacity is determined at the institutional level, based on WSA net tariff collection after operational expenses across the entire water and sewerage network. In this structure, WWTP-3 influences bankability indirectly: its operational expenditure (OPEX), mainly driven by electricity consumption and sludge incineration and disposal costs, contributes to the overall expenditure burden of WSA. Efficiency measures such as on-site renewable energy generation and sludge valorization can therefore improve WSA’s debt service capacity by reducing OPEX and stabilizing long-term operating risk [38,39,40].
WWTP-3 was selected for the financial case study for several reasons. It is an energy-intensive advanced biological treatment plant with thermal sludge processing, so its controllable operating costs—and hence the potential bankability gains from circular-economy interventions—are representative of the most capital- and energy-demanding facilities in the sample. It also combines a comparatively high Circular Economy Score (CES = 53) with high physical flood exposure, placing it in the ‘Vulnerable Pioneers’ quadrant that most clearly illustrates the tension between circularity performance and climate risk motivating this study. Finally, WWTP-3 offered the most complete and internally consistent operational-cost data, which is a prerequisite for a credible DSCR projection. A full multi-facility financial comparison was constrained by the heterogeneity and incompleteness of publicly available cost data across the other plants; the single-facility focus is therefore acknowledged as a limitation, and the generalizability of the financial results to facilities with different operational and financing structures is discussed in Section 4.3.
To reflect this institutional structure, we use a utility-level Debt Service Coverage Ratio (DSCR) consistent with standard utility finance practice. Operationally, this can be expressed as shown in Equation (1): DSCR = (Net tariff collection − Total WSA operating expenditures)/Annual debt service. DSCR is widely used by lenders as a core credit indicator; minimum covenant thresholds commonly fall in the ~1.2–1.25 range, depending on the risk profile and financing structure.
3.4.3. Financial Scenarios: Solar PV Investment and DSCR Impact
WWTP-3 is an energy-intensive advanced biological treatment system with thermal sludge processing and regulated ash disposal—two components that heavily shape operating costs. Electricity is frequently among the largest controllable components of O&M budgets, with empirical studies reporting electricity expenditures in the 25–40% range of total operating budgets, where aeration alone can represent 50–70% of total plant energy consumption [39,40,41].
To demonstrate the link between Circular Economy (CE) interventions and bankability, a multi-step financial projection was conducted for WWTP-3. Using data from 2017, figures were adjusted to 2025 values using TÜİK inflation rates [42]. The analysis focuses on an investment in a 5–6 MW on-site solar PV system, which substitutes purchased grid electricity and reduces exposure to price volatility. Four financing scenarios were evaluated: Case 1 (Baseline): No solar PV investment; the current OPEX structure is maintained. Case 2 (100% Loan): Full debt financing of the PV system, resulting in a DSCR of 1.16, marginally below the typical 1.20–1.25 covenant threshold. Case 3 (10% Grant & 90% Loan): Blended finance structure; the partial grant improves the DSCR to 1.19. Case 4 (100% Grant): Full grant financing; maximum OPEX reduction with no new debt, resulting in a DSCR of 1.50.
The updated performance scores and corresponding DSCR values are presented in Table 4.
Table 4.
Updated Scores with Solar Panel Investment.
The financial projection rests on a set of explicit assumptions, which are reported here to support transparency and replication. Baseline 2017 operating costs were escalated to 2025 values using TUIK consumer-price indices [42]. Electricity was assumed to be the dominant controllable cost, priced at prevailing 2025 industrial grid tariffs, with the on-site solar PV system (5–6 MW) sized to offset a major share of purchased electricity. The analysis assumed a PV economic life of 25 years, an annual PV performance degradation of approximately 0.5–0.7% per year, annual operation-and-maintenance costs of roughly 1–2% of capital expenditure, and a debt structure with a tenor and indicative interest rate consistent with current development-bank lending to Turkish utilities. The discount rate was aligned with the utility’s weighted average cost of capital, and tariffs were held at their regulated real levels over the projection horizon. These parameters are subject to considerable uncertainty—particularly future electricity prices, interest and discount rates, and tariff policy—and the results should therefore be interpreted as indicative rather than definitive.
Two further caveats apply to the financial analysis. First, the study evaluates a single WWTP and a single type of circular-economy intervention (on-site solar PV); it does not capture the full techno-economic design space, which would include alternative renewable configurations, energy-storage options, sludge-to-energy valorization and varying system sizes. Second, the DSCR estimates are deterministic point values rather than the output of a probabilistic sensitivity or Monte-Carlo analysis. A more comprehensive techno-economic assessment—incorporating sensitivity analysis over electricity prices, discount and interest rates, capital costs and PV yield—would be required before the findings could underpin binding investment decisions, and is recommended as a direction for future work.
Given that WWTP-3 does not generate incremental revenue, the bankability channel is cost-based: OPEX reductions increase the consolidated operating surplus available for debt service. The results indicate that operational cost efficiency is a key determinant of indirect bankability in municipal wastewater treatment systems governed by centralized tariff. Overall, the WWTP-3 case study indicates that, under centralized tariff governance, indirect bankability is primarily a function of controllable operating cost efficiency and operational risk management rather than plant-level revenue enhancement. Consequently, interventions that reduce electricity and sludge management costs provide a dual dividend: (i) improved environmental and circularity performance (lower indirect emissions and improved resource efficiency) and (ii) strengthened financial resilience at the utility level, which is a prerequisite for sustained infrastructure investment and the mobilization of sustainable finance.
3.4.4. Comparative Perspective: Generalizability of the Financial Assessment
To assess how far the WWTP-3 findings generalize to facilities with different operational and risk profiles, we contrast WWTP-3 with WWTP-5, which occupies the opposite corner of the ICRC space as a ‘Resilient Leader’ (high circularity, low flood exposure). A full, like-for-like DSCR projection for WWTP-5 was constrained by the same limitations in publicly available operational-cost data noted in Section 3.4.2 and Section 4.3; the comparison presented here is therefore directional and indicative rather than a second fully parameterized financial model, and it is intended to test the transferability of the bankability mechanism rather than to report precise second-facility coverage ratios. The two facilities are summarized in Table 5.
Table 5.
Comparative financial-resilience profile of WWTP-3 and WWTP-5.
This contrast clarifies two boundary conditions on the WWTP-3 result. First, the magnitude of the bankability gain from an equivalent on-site PV investment is expected to be smaller at WWTP-5, because a substantial share of its electricity is already met from renewable and methane-recovery sources, leaving less purchased grid energy to be offset and therefore a smaller controllable-OPEX headroom. Second, and conversely, whatever DSCR improvement WWTP-5 secures is structurally more durable: its low flood exposure means the resulting OPEX savings are not contingent on costly physical protection and are unlikely to be stranded by a single inundation event. The same solar-PV intervention thus yields a larger but more fragile bankability gain at a ‘Vulnerable Pioneer’ such as WWTP-3, and a more modest but robust gain at a ‘Resilient Leader’ such as WWTP-5. This is consistent with the central thesis of the study—that circular-economy investments strengthen bankability durably only when matched to the facility’s physical-risk profile—and indicates that the WWTP-3 mechanism generalizes in direction across the sample, even though its precise magnitude is facility-specific and sensitive to the baseline energy mix and financing structure.
4. Discussion
4.1. ICRC Synthesis and Investment Prioritization
The final stage of the analysis integrates the quantitative Circular Economy Scores (CES) with the spatial flood exposure data to form the Index for Climate Risk and Circularity (ICRC). This index serves as a two-dimensional decision-support tool, enabling policy-makers and utility managers to prioritize investments based on both resource efficiency and physical climate resilience. By evaluating the Overall Circular Economy Score (representing technical performance) against the assessed flood exposure level (representing physical hazard), the five WWTPs are categorized into four strategic quadrants within the ICRC framework based on their operational maturity and spatial vulnerability.
The synthesis reveals a diverse risk-performance landscape across the selected Turkish WWTPs. The classification of the facilities into the ICRC quadrants provides a clear roadmap for investment prioritization:
Quadrant 1 (High Circularity/Low Risk—‘Resilient Leaders’): WWTP-5 falls into this category. With the highest circularity performance (55) and relatively manageable flood exposure, this facility serves as a benchmark for the sector. Investment strategy here should focus on maintaining high operational standards and exploring advanced resource recovery (e.g., phosphorus recovery or high-grade water reuse).
Quadrant 2 (High Circularity/High Risk—‘Vulnerable Pioneers’): WWTP-3 and WWTP-4 are situated in this critical quadrant. While they exhibit strong technical performance and circularity, their high exposure to coastal and riverine flooding threatens their operational continuity. For these facilities, technical circularity alone is insufficient; investments must be urgently pivoted toward structural climate adaptation (e.g., flood barriers, elevated electrical systems) and nature-based solutions to protect their high-value assets.
Quadrant 3 (Low Circularity/High Risk—‘Critical Priority’): WWTP-1 represents the highest investment priority. It suffers from both low circularity scores and extreme flood exposure (complete submersion risk). This facility requires a comprehensive ‘resilience-led’ overhaul, where modernization of treatment processes must be integrated with radical site-protection measures.
Quadrant 4 (Low Circularity/Low Risk—‘Efficiency Gap’): WWTP-2 is characterized by low physical risk but also low circularity and environmental performance. The investment focus here should be on technological upgrading to meet modern nutrient removal and energy efficiency standards, as the facility has the ‘spatial safety’ to support long-term infrastructure expansion.
The ICRC synthesis directly informs the ‘bankability’ narrative established in the WWTP-3 case study. The analysis demonstrates that a high Circular Economy Score does not guarantee long-term financial viability if the facility is located in a high-risk flood zone. For ‘Vulnerable Pioneers’ like WWTP-3, the dual dividend of solar PV investment (improving both CES and DSCR) can only be realized if accompanied by climate adaptation measures. Without protecting the physical asset, the financial resilience gained through OPEX savings remains fragile.
Furthermore, the integration of the Turkish Green Taxonomy and the ‘Do No Significant Harm’ (DNSH) principle into this framework suggests that future financing from international development banks will increasingly require this type of integrated risk-performance assessment. Facilities that can demonstrate both high circularity and robust climate adaptation (moving toward Quadrant 1) will have preferential access to green bonds and concessional loans. More broadly, the wider climate-policy environment in which utilities plan and finance their assets is itself being reshaped by emerging market-based instruments. Computable general equilibrium analyses of the phased rollout of national carbon-emissions-trading schemes show how the gradual extension of carbon pricing alters relative costs across sectors and progressively strengthens the economic case for low-carbon, resource-efficient infrastructure [21]. As such instruments mature, facilities that have already embedded circularity and climate-adaptation measures—and can evidence them through an integrated screening tool such as the ICRC—will be better positioned to benefit from carbon-related revenue or cost advantages and from the green-finance flows that accompany them.
These findings also connect the ICRC framework to the broader sustainable-finance toolkit. Mechanisms such as fintech-enabled financial instruments can lower transaction costs and widen access to capital for resource-efficiency investments in the water sector, supporting the transition of utilities from cost-heavy operations toward value-generating, bankable assets [22]. Likewise, data-driven portfolio-optimization methods—including reinforcement-learning frameworks that explicitly balance financial returns against Sustainable Development Goal alignment—offer a promising means of allocating scarce adaptation capital across portfolios of facilities according to their ICRC quadrant, channeling investment first toward ‘Critical Priority’ and ‘Vulnerable Pioneer’ plants [23]. In this way, the ICRC output can serve as a structured input to emerging impact-investment decision-support systems.
In conclusion, the ICRC framework provides a standardized, replicable methodology for Turkish Water and Sewerage Administrations to align their infrastructure portfolios with global sustainability standards. By transitioning from standalone technical assessments to an integrated climate-circularity nexus, the sector can ensure that its transition to a circular economy is both environmentally ambitious and physically resilient. This framework directly supports the achievement of UN Sustainable Development Goals, particularly SDG 6 (Clean Water and Sanitation), SDG 9 (Industry, Innovation and Infrastructure), SDG 11 (Sustainable Cities and Communities), and SDG 13 (Climate Action), by providing decision-makers with the tools to invest in climate-resilient, financially viable, and socially inclusive water infrastructure.
4.2. Practical Implications and Implementation Pathways
For facility managers, the framework translates into concrete operational actions. Plants in high-exposure quadrants should commission site-specific flood-protection measures—such as elevating or sealing electrical and control rooms, deploying flood barriers around core process units, and securing back-up power—before, or in parallel with, efficiency investments, so that OPEX savings are not negated by a single inundation event. Managers should also prioritize the circular-economy interventions with the highest combined CES and DSCR impact (notably on-site renewable energy and sludge valorization) and begin systematically recording the operational and financial data required for bankability assessment, including disaggregated energy, sludge-handling and maintenance costs.
For municipal authorities and Water and Sewerage Administrations, the ICRC provides a portfolio-level prioritization tool. Officials can use the quadrant classification to sequence capital allocation across plants, to justify blended-finance applications (combining concessional grants with loans) for ‘Vulnerable Pioneer’ facilities, and to align project pipelines with the Turkish Green Taxonomy and the ‘Do No Significant Harm’ criteria so as to qualify for green bonds and development-bank lending. We recommend embedding the ICRC as a recurring screening step within municipal climate-adaptation and investment-planning cycles, with periodic re-scoring as new monitoring data and updated flood projections become available.
4.3. Limitations and Future Research Directions
Several limitations should be borne in mind when interpreting these results. The analysis relies predominantly on publicly available facility documentation, regulatory filings and institutional reports. Such sources vary in completeness, recency and level of detail and may not fully reflect undocumented operational practices; this introduces uncertainty into the indicator scoring and may favor facilities that publish more comprehensive disclosures. Moreover, the depth and consistency of the available data differed across the five plants, so the cross-facility comparison carries a degree of measurement uncertainty that the equal binarization of indicators can only partially mitigate.
The flood projections derive from a single global climate model and a single hazard tool; as discussed in Section 2.3, a multi-model ensemble would better bound the uncertainty in future flood exposure and is a priority for future work. Finally, the financial findings are based on one facility operating under a centralized tariff regime and a specific debt structure, and they should not be generalized uncritically to WWTPs with different ownership, revenue, cost and financing arrangements. Future research should extend the framework to a larger and more diverse sample of facilities, incorporate probabilistic techno-economic and multi-model climate analyses, and test the ICRC against additional climate hazards such as drought and heatwaves.
5. Conclusions
This study presents a novel, integrated framework for assessing the climate resilience and circularity of municipal wastewater infrastructure in Türkiye. By developing the Index for Climate Risk and Circularity (ICRC), we have moved beyond standalone technical evaluations to a multi-dimensional decision-support tool that intersects operational maturity with physical climate vulnerability. The application of this framework to five high-capacity wastewater treatment plants (WWTPs) reveals critical insights for the sustainable management of water infrastructure in the Mediterranean basin.
The quantitative assessment using 142 indicators shows that while several facilities (WWTP-4 and WWTP-5) have achieved high levels of technical circularity—particularly in energy recovery and sludge management—this operational success is increasingly threatened by physical climate hazards. The spatial analysis using the Aqueduct Flood Model demonstrates that even technically advanced facilities, such as WWTP-3, face a high risk of complete submersion of core biological process units under 1000-year coastal flood scenarios. This finding highlights a ‘resilience gap’ where technical circularity is not yet matched by structural climate adaptation, potentially rendering high-value green investments stranded in the face of extreme weather events.
The financial analysis of the WWTP-3 case study further clarifies the link between circularity and bankability. We demonstrate that investments in on-site renewable energy (e.g., solar PV) provide a dual dividend: they significantly improve Circular Economy Scores (CES) while simultaneously strengthening the utility’s Debt Service Coverage Ratio (DSCR) by reducing controllable operating expenditures (OPEX). However, the results also indicate that the financing structure is a critical determinant of success; only through concessional or blended finance (grants combined with loans) can municipal utilities maintain the financial resilience required to satisfy international lending covenants while investing in climate adaptation.
From a policy perspective, the ICRC framework aligns with the Turkish Green Taxonomy and the ‘Do No Significant Harm’ (DNSH) principle, providing a standardized methodology for Water and Sewerage Administrations (WSAs) to prioritize their infrastructure portfolios. The categorization of facilities into four strategic quadrants—ranging from ‘Resilient Leaders’ to ‘Critical Priorities’—offers a clear roadmap for investment. For ‘Vulnerable Pioneers’ like WWTP-3 and WWTP-4, the priority must shift from further process optimization to urgent structural protection. For ‘Critical Priority’ sites like WWTP-1, a comprehensive resilience-led modernization is required.
This research directly contributes to the achievement of the United Nations Sustainable Development Goals (SDGs). By integrating climate resilience with circular economy principles, the framework supports SDG 6 (Clean Water and Sanitation) through enhanced wastewater treatment infrastructure; SDG 9 (Industry, Innovation and Infrastructure) by promoting innovation in climate-resilient infrastructure; SDG 11 (Sustainable Cities and Communities) by ensuring urban water infrastructure can withstand climate impacts; and SDG 13 (Climate Action) by embedding climate adaptation into investment decision-making processes.
The framework is also well positioned to benefit from ongoing technological advances. Progress in sensing and monitoring technologies is expanding the volume and quality of facility-level operational data available for resilience assessment, while data-driven decision-support methods—such as reinforcement-learning frameworks for aligning investment portfolios with Sustainable Development Goal targets—offer a route to operationalizing ICRC-based prioritization at the level of utility and investor portfolios [23]. Coupling the ICRC framework with these tools could enable continuous, evidence-based prioritization of climate-adaptation and circular-economy investments across large infrastructure portfolios.
In conclusion, as the global water sector transitions toward a circular economy, physical climate risk must be integrated into every stage of the infrastructure lifecycle—from site selection and engineering design to financial modeling. The ICRC framework provides a replicable model for other emerging economies facing similar hydro-climatic challenges, ensuring that the transition to a circular water sector is both environmentally ambitious and physically resilient. Future research should expand this nexus approach to include other climate hazards, such as prolonged droughts and heatwaves, to provide a truly holistic assessment of urban water security.
Author Contributions
Conceptualization, M.B. and M.E.K.; Methodology, M.B.; Software, M.B.; Validation, M.B. and M.E.K.; Formal Analysis, M.B.; Investigation, M.B. and M.E.K.; Resources, M.B.; Data Curation, M.B.; Writing—Original Draft Preparation, M.B.; Writing—Review and Editing, M.E.K.; Visualization, M.B.; Supervision, M.E.K.; Project Administration, M.E.K.; Funding Acquisition, M.B. and M.E.K. All authors have read and agreed to the published version of the manuscript.
Funding
This research received no external funding.
Institutional Review Board Statement
Not applicable.
Informed Consent Statement
Not applicable.
Data Availability Statement
The data presented in this study are available on request from the corresponding author. The data are not publicly available due to privacy and confidentiality agreements with the participating wastewater treatment facilities.
Acknowledgments
During the preparation of this manuscript, the authors used Claude Haiku 4.5 (Anthropic), Gemini 3.5 Flash (Google), and ChatGPT 5.3 (OpenAI) for the purposes of refining linguistic quality, translating draft sections into English, supporting clarity checks, and exploring preliminary conceptual perspectives during the initial brainstorming phase. Claude was also used to support checks on whether the revised manuscript addressed journal and editorial requirements. Following the use of these tools, the authors critically reviewed, edited, and verified all AI-assisted content to ensure accuracy, originality, and scientific integrity. The core ideas, analysis, results, and conclusions presented in this manuscript remain the authentic and original contribution of the authors, who take full responsibility for the integrity of the published work.
Conflicts of Interest
The authors declare no conflicts of interest.
References
- United Nations. What Is Climate Change? Available online: https://www.un.org/en/climatechange/what-is-climate-change (accessed on 25 March 2025).
- European Commission. Forging a Climate-Resilient Europe—The New EU Strategy on Adaptation to Climate Change (COM(2021) 82 Final); European Commission: Brussels, Belgium, 2021. Available online: https://eur-lex.europa.eu/legal-content/EN/TXT/?uri=CELEX:52021DC0082 (accessed on 25 March 2026).
- European Environment Agency. The European Environment—State and Outlook 2020; European Environment Agency: Copenhagen, Denmark, 2020; Available online: https://www.eea.europa.eu/en/analysis/publications/soer-2020 (accessed on 25 March 2026).
- McClean, D. Human Cost of Disasters: An Overview of the Last 20 Years (2000-2019); United Nations Office for Disaster Risk Reduction: Geneva, Switzerland, 2020.
- Wols, B.A.; van Thienen, P. Modelling the Effect of Climate Change Induced Soil Settling on Drinking Water Distribution Pipes. Comput. Geotech. 2014, 55, 240–247. [Google Scholar] [CrossRef] [Scilit]
- World Meteorological Organization. State of the Climate in 2022; World Meteorological Organization: Geneva, Switzerland, 2022. [Google Scholar]
- Ma, R.; Hu, Z.; Zhang, J.; Ma, H.; Jiang, L.; Ru, D. Reduction of Greenhouse Gases Emissions during Anoxic Wastewater Treatment by Strengthening Nitrite-Dependent Anaerobic Methane Oxidation Process. Bioresour. Technol. 2017, 235, 211–218. [Google Scholar] [CrossRef] [Scilit] [PubMed]
- Qambrani, N.A.; Rahman, M.M.; Won, S.; Shim, S.; Ra, C. Biochar Properties and Eco-Friendly Applications for Climate Change Mitigation, Waste Management, and Wastewater Treatment: A Review. Renew. Sustain. Energy Rev. 2017, 79, 255–273. [Google Scholar] [CrossRef] [Scilit]
- Shrestha, S.; Anal, A.K.; Salam, P.A.; Van Der Valk, M. (Eds.) Managing Water Resources Under Climate Uncertainty: Examples from Asia, Europe, Latin America, and Australia; Springer International Publishing: Cham, Switzerland, 2015. [Google Scholar] [CrossRef] [Scilit]
- Blumenau, A.; Turner, A.L.; Brooks, C.P.; Finn, E. Effects of Sea Level Rise on Water Treatment & Wastewater Treatment Facilities. In Environmental Science and Engineering; Worcester Polytechnic Institute: Worcester, MA, USA, 2011. [Google Scholar]
- Cromwell, J.; Spry, J.; Raucher, R. Implications of Climate Change for Urban Water Utilities; American Water Works Association: Denver, CO, USA, 2007. [Google Scholar]
- Ministry of Forestry and Water Affairs. Wastewater Treatment Plant Design Guide; Republic of Türkiye Ministry of Forestry and Water Affairs: Ankara, Türkiye, 2013.
- Akpınar, Ö. Akarsu Kıyılarına Yapılan Atıksu Arıtma Tesislerinde Taşkın Risk Analizi: Konya Bölge Örneği; İller Bankası Uzmanlık Tezi; İller Bankası: Ankara, Türkiye, 2017. Available online: https://www.ilbank.gov.tr/userfiles/files/uzmanliktezleri/14450.pdf (accessed on 4 May 2025).
- Gündüz, O.; Kara, G.T. İklim Değişikliğinin Kritik Kentsel Altyapı Tesisleri Üzerindeki Etkisi: Örnek Saha Çiğli Atık Su Arıtma Tesisi. In Proceedings of the 3. Uluslararası Su Kongresi, İzmir, Türkiye, 22–24 October 2015. [Google Scholar]
- Allison, A.E.F.; Lawrence, J.H.; Stephens, S.A.; Kwakkel, J.H.; Singh, S.K.; Blackett, P.; Stroombergen, A. Planning for Wastewater Infrastructure Adaptation under Deep Uncertainty. Front. Clim. 2024, 6, 1355446. [Google Scholar] [CrossRef] [Scilit]
- Stamou, A.; Mitsopoulos, G.; Koutroulis, A. Proposed Methodology for Climate Change Adaptation of Water Infrastructures in the Mediterranean Region. Environ. Process. 2024, 11, 12. [Google Scholar] [CrossRef] [Scilit]
- Goh, K.C.; Kurniawan, T.A.; Goh, H.H.; Zhang, D.; Jiang, M.; Dai, W.; Khan, M.I.; Othman, M.H.D.; Aziz, F.; Anouzla, A.; et al. Strengthening Infrastructure Resilience for Climate Change Mitigation: Case Studies from the Southeast Asia Region with a Focus on Wastewater Treatment Plants in Addressing Flooding Challenges. ACS ES&T Water 2024, 4, 3725–3740. [Google Scholar] [CrossRef] [Scilit]
- Samberger, C.; Imen, S.; Messologitis, K.; Umble, A.; Jacangelo, J.G. Assessing Circularity of Wastewater Treatment Systems: A Critical Review of Indicators. J. Ind. Ecol. 2024, 28, 262–276. [Google Scholar] [CrossRef] [Scilit]
- Kruopiene, J.; Smol, M. Resource Recovery Monitoring and Circular Economy Model in Wastewater. Water 2024, 16, 2557. [Google Scholar] [CrossRef] [Scilit]
- Breitenmoser, L.; Rohrer, K.; Hooijmans, C.M.; Campling, P.; Kumar, M.D.; Anshuman; Kazner, C.; Hugi, C. Technology Evaluation and Impact Assessment of Innovative Wastewater Treatment and Resource Recovery Systems in Kanpur, India. Water Reuse 2025, 15, 72–89. [Google Scholar] [CrossRef] [Scilit]
- Ostrovnaya, A.; Ahrens, J.; Smart, J.; Theocharidou, A.; Buhr, B. Carbon Cost Pass-through and Access to Capital Shape Firms’ Carbon Strategies. Commun. Earth Environ. 2026, 7, 524. [Google Scholar] [CrossRef] [Scilit]
- Suri, S. Fintech as a Catalyst for Sustainable Development in Food Systems. FinTech and Sustainable Innovation. 2025. Available online: https://ojs.bonviewpress.com/index.php/FSI/article/view/6787 (accessed on 18 June 2026).
- Agal, S.; Raulji, K.; Shekokar, K.; Bhavsar, N. Optimizing Impact Investment Portfolios with Reinforcement Learning: A Data-Driven Framework for Balancing Financial Returns and SDG Alignment. FinTech and Sustainable Innovation. 2025. Available online: https://ojs.bonviewpress.com/index.php/FSI/article/view/7409 (accessed on 18 June 2026).
- International Capital Market Association (ICMA). Green Bond Principles; ICMA: Zurich, Switzerland, 2025; Available online: https://www.icmagroup.org/assets/documents/Sustainable-finance/2025-updates/Green-Bond-Principles-GBP-June-2025.pdf (accessed on 22 February 2026).
- Petagna, C.; Li, D.; Gorelick, D.E.; Gold, D.F.; Amestoy, T.; Lau, L.; Asefa, T.; Wang, H.; Svrdlin, S.; Reed, P.M.; et al. Balancing Supply and Financial Risks in Water Utility Decision Making under Uncertainty. J. Water Resour. Plan. Manag. 2026, 152, 04026006. [Google Scholar] [CrossRef] [Scilit]
- Paxian, A.; Hertig, E.; Seubert, S.; Vogt, G.; Jacobeit, J.; Paeth, H. Present-Day and Future Mediterranean Precipitation Extremes Assessed by Different Statistical Approaches. Clim. Dyn. 2015, 44, 845–860. [Google Scholar] [CrossRef] [Scilit]
- Ward, P.J.; Winsemius, H.C.; Kuzma, S.; Luo, T.; Bierkens, M.F.P.; Bouwman, A.; de Moel, H.; Díaz Loaiza, A.; Eilander, D.; Englhardt, J.; et al. Aqueduct Floods Methodology; World Resources Institute: Washington, DC, USA, 2020; Available online: https://www.wri.org/research/aqueduct-floods-methodology (accessed on 20 June 2026).
- Khan, S.; Khan, A.U.; Alodah, A.; Azeem, A.; Waqas, M.; Nahas, F.; Rebouh, N.Y.; Youssef, Y.M. Climate-Driven Flood Hazard Assessment in Data-Scarce Mountainous Basins Using a GIS-Based Machine Learning and Hydrodynamic Modelling under CMIP6 SSP Scenarios. Sci. Rep. 2026, 16, 1800. [Google Scholar] [CrossRef] [Scilit] [PubMed]
- Ministry of Environment, Urbanisation and Climate Change. Su Kirliliği Kontrol Yönetmeliği; Resmî Gazete Sayısı: 25687; Republic of Türkiye Ministry of Environment, Urbanisation and Climate Change: Ankara, Türkiye, 2004.
- Başkurt, M.; Kocababuc, I.; Binici, E.; Dulekgurgen, E.; Özgün, Ö.K.; Taşlı, R. Life Cycle Assessment as a Decision Support Tool in Wastewater Treatment Plant Design with Renewable Energy Utilization. Desalin. Water Treat. 2017, 93, 229–238. [Google Scholar] [CrossRef] [Scilit]
- Başkurt, M.; Kocababuç, I.; Binici, E.; Dülekgürgen, E.; Özgün, Ö.K.; Taşlı, R. Life Cycle Assessment as a Decision Support Tool in Wastewater Treatment Plant Design with Renewable Energy Utilization and Water Recycling-Reuse. In Proceedings of the 3rd International Conference on Recycling and Reuse, Istanbul, Türkiye, 15–17 June 2016. [Google Scholar]
- Shu, W.; Fan, D. Fostering Workplace Safety with a Gender-Diverse Workforce. Int. J. Oper. Prod. Manag. 2025, 46, 741–770. [Google Scholar] [CrossRef] [Scilit]
- International Finance Corporation (IFC). Integrating Gender in Water & Sanitation Projects; IFC: Washington, DC, USA, 2020; Available online: https://www.ifc.org/en/insights-reports/2020/integrating-gender-in-water-and-sanitation-projects (accessed on 25 February 2026).
- International Labour Organization. The Unseen Workforce Behind Wastewater Management; ILO: Geneva, Switzerland, 2023; Available online: https://ilostat.ilo.org/blog/the-unseen-workforce-behind-wastewater-management/ (accessed on 25 March 2026).
- World Resources Institute. Aqueduct Floods Hazard Maps; World Resources Institute: Washington, DC, USA, 2025; Available online: https://wri-projects.s3.amazonaws.com/AqueductFloodTool/download/v2/index.html (accessed on 25 March 2026).
- Marsh McLennan. Marsh McLennan Flood Risk Index: Methodology; Marsh McLennan: New York, NY, USA, 2021. [Google Scholar]
- Zhou, X.; Wang, S.; Yao, S.; Fang, L. Influence of Urban Flooding on the Spatial Equity of Access to Emergency Medical Services Among Nursing Homes in Shanghai. Land 2025, 14, 309. [Google Scholar] [CrossRef] [Scilit]
- Ministry of Agriculture and Forestry. Methodological Guide on Pricing Drinking Water Supply and Wastewater Management; General Directorate of Water Management: Ankara, Türkiye, 2021.
- Özgün, H.; Çiçekalan, B.; Öztürk, İ. Türkiye’de Mevcut Su ve Atıksu Yönetim Sektörü için Tarife Ödeme Gücü Oranlarının Karşılaştırılmalı Değerlendirilmesi. Sak. Univ. J. Sci. 2018, 22, 806–815. [Google Scholar] [CrossRef] [Scilit]
- Turkmenler, H.; Aslan, M. An Evaluation of Operation and Maintenance Costs of Wastewater Treatment Plants: Gebze Wastewater Treatment Plant Sample. Desalin. Water Treat. 2017, 76, 382–388. [Google Scholar] [CrossRef] [Scilit]
- Kütük, M.A.; Aksoy, M. A Case Study on Sewage Sludge Incineration Plant: GASKI. In Proceedings of the Second International Conference on Water, Energy and the Environment, Kuşadası, Türkiye, 21–24 September 2013; pp. 1–6. [Google Scholar]
- Turkish Statistical Institute (TÜİK). Consumer Price Index—December 2025—Data Portal; TÜİK: Ankara, Türkiye, 2026. Available online: https://veriportali.tuik.gov.tr/tr/press/58294 (accessed on 22 February 2026).

Disclaimer/Publisher’s Note: The statements, opinions and data contained in all publications are solely those of the individual author(s) and contributor(s) and not of MDPI and/or the editor(s). MDPI and/or the editor(s) disclaim responsibility for any injury to people or property resulting from any ideas, methods, instructions or products referred to in the content. |
© 2026 by the authors. Licensee MDPI, Basel, Switzerland. This article is an open access article distributed under the terms and conditions of the Creative Commons Attribution (CC BY) license.