


Abstract
Remote sensing parameters were used along with weather data to assess the large-scale sugarcane water balance in Northeast Brazil, using a dataset from 2007 to 2024. Rainfall (P) was spatially quantified from interpolated pluviometer data and actual evapotranspiration (ET) was estimated using the SAFER algorithm. Considering the sugarcane crop areas for each year, the mean annual P varied from 8555 million cubic meters in 2009 to 3172 million cubic meters in 2021. Regarding ET, it varied from 5869 million cubic meters in 2007 to 3375 million cubic meters in 2017. The assessments showed time lags of around two months between rainfall water supplies and root zone moisture levels and highlighted the use of evaporative fraction (Ef). Anomalies in P and ET were detected through their standardized indices by comparing the results for the years 2021 to 2024 with the long-term values from 2007 to each of these years, showing that the rainfall water supplies and water fluxes may vary along sugarcane phases and years. It can be concluded that large-scale water balance assessments can potentially serve as the basis for public policies aimed at sustainable crop management and rational expansion in areas with environmental suitability.
1. Introduction
Sugarcane (Saccharum officinarum) is a significant crop in several parts of the world, particularly in tropical and subtropical regions. Besides its use for producing sugar, it is also important for ethanol production, an alternative fuel source that is progressively becoming popular as a cleaner and more sustainable energy option. Ethanol from sugarcane is considered more environmentally friendly than fossil fuels and significantly reduces the carbon footprint. As countries seek to reduce their reliance on traditional fuels, sugarcane-derived ethanol is a viable solution [1,2,3,4,5]. However, it is crucial to manage water and soil resources wisely in sugarcane fields to prevent negative environmental impacts from their coexistence with natural ecosystems [6,7,8,9]. Under these global scenarios, Brazil stands out as one of the main sugarcane-producing countries, expanding its sugar and ethanol production, due to the environmental importance of renewable energy generation [10,11].
The search for sustainable sugarcane management to improve biomass growth is crucial for producing sugar and ethanol from sugarcane under climate and land-use change scenarios, which affect productivity [3,4,9,12]. Sugarcane meets the requirements for rapid growth and high biomass production for yielding bioenergy [5]; however, its cultivation increases regional water demand [1,13,14] impacting the environment [6,15,16,17,18,19], which are crucial issues for sustainable sugarcane production. The sustainability aspects connect directly to the Sustainable Development Goals (SDGs). Instead of focusing only on yield, sugarcane crops should try to balance sugar, ethanol and bioenergy production with climate protection, biodiversity conservation, and economic opportunities.
Regarding SDG 6, which is about clean water and sanitation, it includes efficient water use and protection of freshwater ecosystems, supporting rivers, wetlands, and groundwater because less water is wasted. Considering irrigation conditions, sustainable crops should invest in sustainable irrigation technologies, such as drip or sprinkler systems, and in monitoring soil moisture and evapotranspiration to avoid water deficit or water excess. These strategies reduce withdrawals from rivers and aquifers, lowering the risk of water pollution from runoff, and supporting healthier watersheds [13,14]. Another clear link between sugarcane and the SDGs is with clean energy, in SDG 7, as the crop can produce ethanol, which reduces greenhouse gas emissions and helps fight climate change, which is related to SDG 13. Techniques such as conservation tillage, cover cropping, and well-planned irrigation schedules can enhance soil organic matter, which captures carbon and improves water retention capacity. At the same time, climate-smart agriculture uses weather data and seasonal forecasts to adjust planting dates, crop varieties, and water use, making farms more resilient to heat waves, droughts, and floods [2,7,8,9].
Sugarcane is a crucial crop in Northeast Brazil and significantly contributes to the region’s economy. The climate in the cultivated area of this region is well-suited for the plants, due to warm conditions and seasonal rainfall, which favor yield. However, environmental impacts, such as deforestation caused by this monocultural production, demand research to reduce these externalities through more sustainable agricultural practices [7,20]. Remote sensing and Geographic Information Systems (GIS) are powerful tools for monitoring sugarcane growth patterns and optimizing water management, enhancing sustainability while meeting the rising demand for sugar and its derivatives [17,21,22,23]. By balancing economic interests with ecological concerns, the Northeast Brazil aims to maintain its position as one of the country’s leaders in the sugar and ethanol industry [9,19].
Sugarcane crops require a significant volume of water during their growing cycles. Nonetheless, rainfall water is not always available in the same amounts every year in the agricultural areas of Northeast Brazil [22,23,24]. In this context, assessing the long-term water balance in sugarcane fields is important to understand how water enters and leaves the system over time. The water balance accounts for water inputs, mainly through rainfall and irrigation, and water outputs, such as evapotranspiration, runoff, and deep percolation. When water input exceeds output, there is a positive water balance and a water surplus in the root zones. When output exceeds input, there is a negative water balance and a water deficit for the crop [17,22,25,26]. Analyses of many years of water balance data enable the identification of patterns of drought, excess rain, and normal years, helping producers plan planting dates, irrigation strategies, and even choose sugarcane varieties more tolerant to water stress.
The difficulties of measuring and analyzing long-term water balance components solely through local measurement points [27] add value to the need for the use of geotechnologies, which have been applied in Northeast Brazil [19,22,23]. They enable estimating actual evapotranspiration (ET) across sugarcane fields, which is fundamental for large-scale water balance [17]. ET represents the main water output, helping the detection of water stress and crop performance. Instead of measuring only a few experimental plots, geotechnologies make it possible to analyze entire regions of sugarcane production [17,21,22,23,26]. In the current paper, we used remote sensing parameters together with weather data to directly estimate ET, while precipitation (P) was obtained by pluviometers. Thus, it was not strictly necessary to measure or estimate runoff and deep percolation for our purpose.
Geotechnologies favor the construction of long-term series of water balance components and the evaluation of thermal and moisture conditions within the same sugarcane fields for several years. With these tools, it is easier to identify trends of increasing water deficit, shifts in rainy season onset, or more frequent extreme events [28,29,30,31]. This enables farmers to adjust the sugarcane crop cycles to avoid water stress during high-water-demanding periods and preserve yield and sugar content, helping to define more sustainable sugarcane water management, reduce waste and protect water resources [17,21,22,23]. This broader view improves regional planning and public policies related to agriculture and water security and is useful for adaptation to climate change in the sugarcane sector. It also supports practical decision making, such as defining priority areas for irrigation based on environmental conditions [7,9].
In terms of long-term series of water and vegetation parameters, standardized indices for detection of environmental anomalies have been used. The inclusion of water and vegetation parameters in these indices is important for environmental monitoring [32,33,34]. For these assessments, distinct remote-sensing algorithms can be used to obtain ET [35,36,37]. Considering its biophysical aspects, the SAFER (Simple Algorithm for Evapotranspiration Retrieving) algorithm was developed by using simultaneous field and remote sensing measurements in Northeast Brazil to estimate ET [37]. After that, the algorithm was validated under different thermal and moisture conditions in distinct agroecosystems [22,37]. These validations showed good agreement, with the regression analysis explaining 89% of the variance and a mean square error (RMSE) of 0.34 mm d−1 [37]. Another important advantage of choosing SAFER’s in the current research, compared to other algorithms, is that its newer version allows the use of only the red and near-infrared satellite bands [22].
Despite previous studies with SAFER applications, few studies have been carried out to monitor the water balance components over the years in sugarcane fields and to monitor anomalies for specific periods. These long-term assessments can add knowledge about the impact of sugarcane expansion on the environment. In the current study, SAFER was applied in Northeast Brazil to estimate ET in sugarcane fields within a Brazilian agricultural region called SEALBA, whereas pluviometer data were interpolated using geostatistical tools to quantify precipitation (P). SEALBA is being replaced by agricultural crops, mostly sugarcane under rainfed conditions, affecting the large-scale water balance [23,24].
Using land-use shapes to demark sugarcane fields within SEALBA for each year from 2007 to 2024 and cross-referencing them with information about producing counties, reflectance MODIS images and weather data were integrated for long-term water balance assessments aiming to monitor the components of this balance and their anomalies throughout the years. We used the standardized index (STD) based on P and ET values (PSTD and ETSTD) for specific periods during the last four years of this long-term dataset. The authors expect that, with successful applications in rainfed sugarcane fields of Northeast Brazil, the large-scale modeling could be carried out in other environments, probably requiring calibrations to infer distinct environmental and local sugarcane management conditions. The hypothesis is that long-term sugarcane water balance components can be monitored using reflective bands and weather data at good spatial and temporal resolutions, which are useful for supporting rational sugarcane management and generating rational criteria for its sustainable commercial expansion, helping to maintain sugar and ethanol yields.
2. Materials and Methods
2.1. Study Area, Weather Stations and Sugarcane Fields
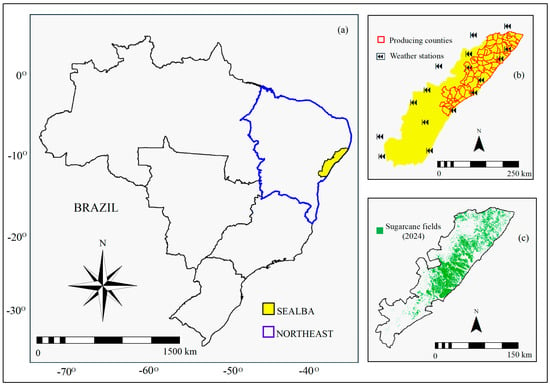
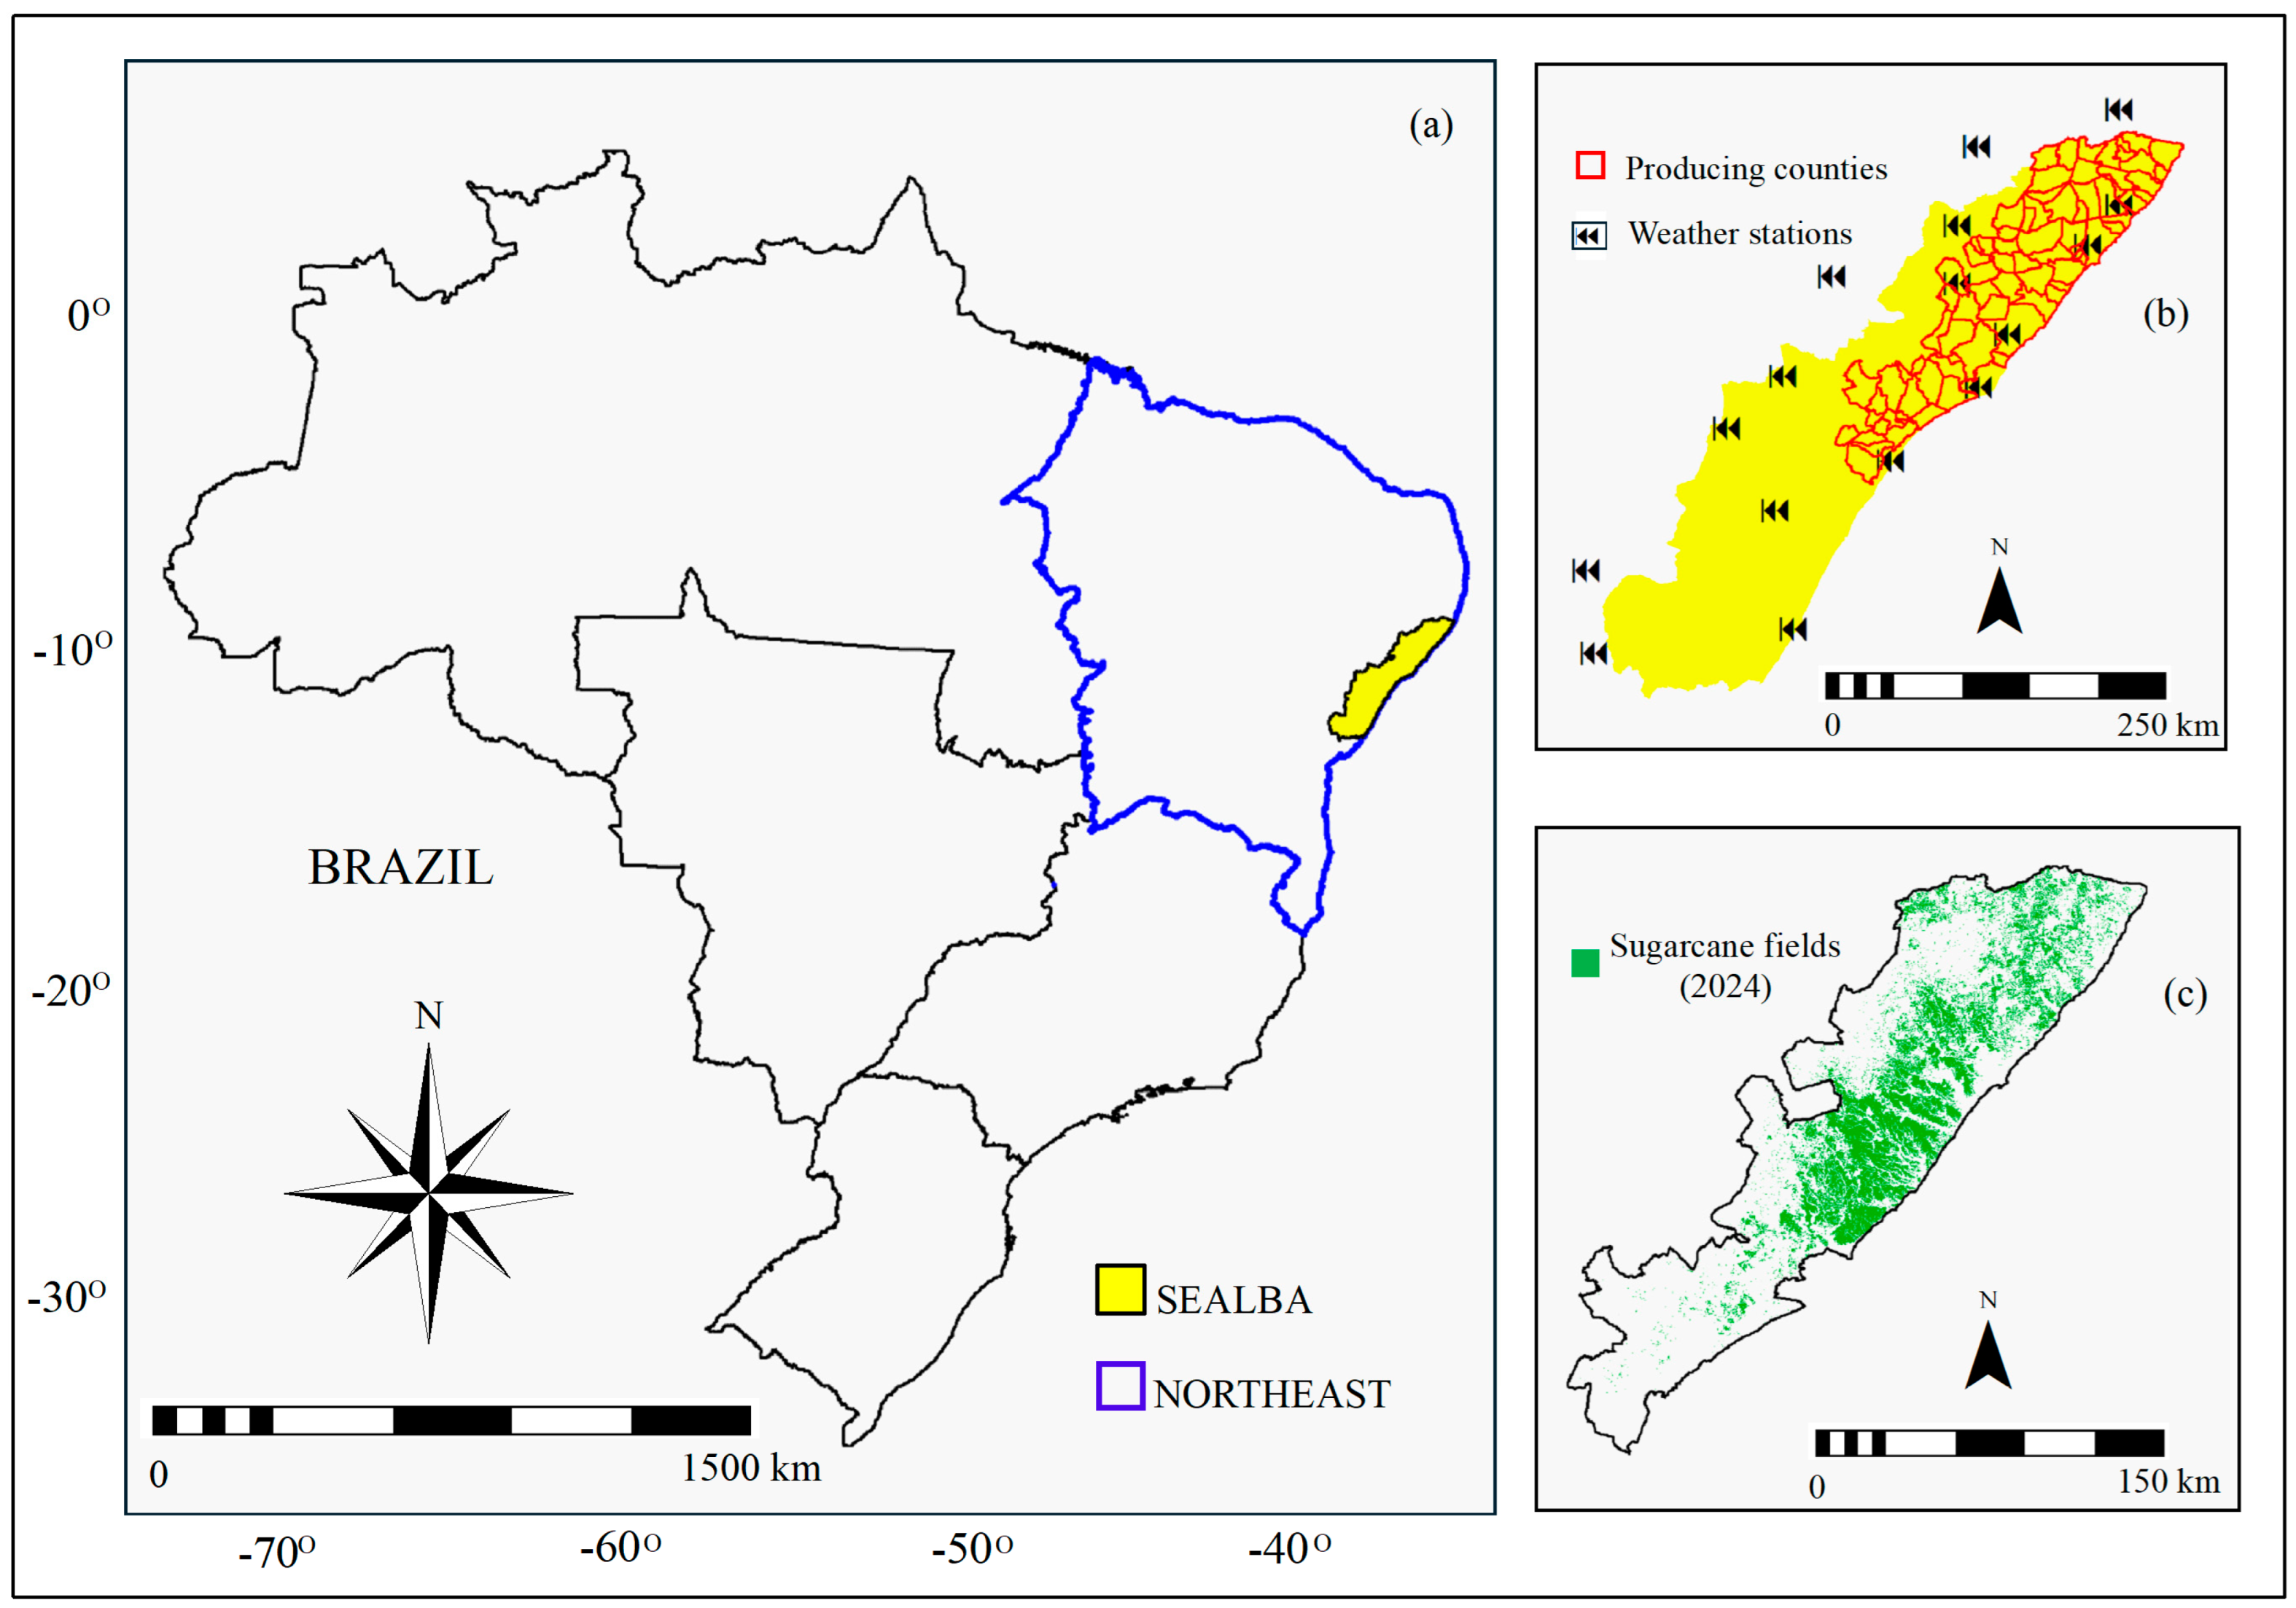
Figure 1 shows the location of the SEALBA region in Northeast Brazil (Figure 1a), its sugarcane-producing counties with the weather stations from the Brazilian National Meteorological Institute (INMET—https://www.gov.br/agricultura/pt-br/assuntos/inmet, accessed on 19 May 2026) (Figure 1b), and the extension of the sugarcane fields in 2024 obtained by cross-referencing the shapes from MapBiomas (https://brasil.mapbiomas.org) and sugarcane yield information from the Brazilian Institute of Geography and Statistics (IBGE—www.ibge.gov.br) (Figure 1c).
Figure 1.
Location of the SEALBA region in Northeast Brazil (a); sugarcane-producing counties together with the weather stations (b) and sugarcane fields within these counties in 2024 (c).
The climate in the SEALBA region is humid tropical [23]. Following [27], for a generalized sugarcane growing cycle of 12 months in Northeast Brazil, the crop phases can be divided into four: Phase 1—germination, lasting from day 0 to day 40; Phase 2—tillering, from day 40 to day 120; Phase 3—grand growth, from day 120 to day 270; and Phase 4—maturation, from day 270 to day 365.
During Phase 1, the crop is influenced by moisture, temperature and aeration of the soil; in Phase 2, the most important parameters are cultivar, solar radiation, air temperature, root zone moisture and fertilization; for Phase 3, the most important parameters are solar radiation and root-one moisture levels are highly required to favor stalk elongations; and during Phase 4, high solar radiation values are desirable but at low root zone moisture levels, since this last phase is characterized by low vegetative growth [38].
2.2. Long-Term Water Balance Modeling
The weather data obtained from the 16 weather stations were spatially interpolated using the Ordinary Kriging method, generating continuous surfaces in grid format (raster) to be coupled with MODIS remote sensing parameters at the 250 m spatial resolution. The theoretical semi variogram was adjusted to a spheric model, with nugget of 0, sill of 1 and maximum distance of 1000 m. The search for neighboring points was limited to 1000 m, considering a minimum of 1 point and a maximum of 16 points for estimations. Duplicated points were removed by averaging the matching values, with tolerance of 0.1 m. The output maps were generated at a precision of 0.001, without using the spherical distance and without error maps. These weather grids were matched with the sugarcane fields from the land-use shapes and with the producing counties within SEALBA from 2007 to 2024. To retrieve the water balance components from all MODIS images and gridded weather data, the SAFER’s equations were applied by using a script built in the Integrated Land and Water Information System (ILWIS), version 3.8.6, which is a geographic information system (GIS) and remote sensing software for both vector and raster processing (https://52north.org/news/new-ilwis-3-8-6-release/, accessed on 19 May 2026). For reference evapotranspiration (ET0), daily weather data were used [25]. Together with the reflectance MOD13Q1 product, these weather data were also used as input for ET modeling and using interpolated P data the large-scale water balance components were assessed [22].
The Normalized Difference Vegetation Index (NDVI) was calculated according to [28]:
where ρ1 e ρ2 are, respectively, the MODIS reflectance from bands 1 (red) and 2 (near-infrared).
The α0 values were calculated as:
where a, b and c are regression coefficients of 0.08, 0.41, and 0.14 for Northeast Brazil [22].
T0 was acquired by applying the Stefan–Boltzmann equation to the long wave energy balance components [17,23]:
where εA and εS are the atmospheric and surface emissivities, respectively; Rn is the net radiation; and σ = 5.67 10 −8 W m −2 K −4 is the Stefan–Boltzmann constant.
Following [39,40], Rn was estimated through the Slob equation:
where τsw is the short-wave atmospheric transmissivity, and aL is a regression coefficient upscaled through Ta pixel values:
The εA and εS values were calculated as:
where aa, ba, aS, and bS are regression coefficients, which were reported as 0.94, 0.11, 0.06, and 1.00, respectively, for the Northeast Brazil [37].
For water balance, ET is derived directly from remote sensing parameters, thus without the need for runoff and deep percolation. The daily values of evaporative fraction (Ef = ET/ET0) were modeled:
where asr and bsr are regression coefficients, respectively 1.9 and −0.008 for Northeast Brazil, which can be calibrated for other environmental conditions [41].
The ET daily values were calculated according to [37]:
For comparisons between the remote sensing sugarcane ET and the FAO approach [25], the equation for crop coefficient for mid-season (Kc_mid) stage under optimum sugarcane root zone moisture was used:
where Kc_TAB is the tabled crop coefficient for sugarcane, u2 is the average wind speed at 2 m height, RHmin is the average minimum value for relative humidity, and h is the mean crop height. The Kc_mid values were then multiplied by the corresponding ET0 ones to give ETFAO.
For quantification of the moisture degree in the vicinities of the sugarcane fields, the water balance (WB) indicators difference (subscript d) and ratio (subscript r) were used [22]:
Following [31,33], to detect anomalies, the standardized indices (STD) for the water balance (WB) components were calculated from 2021 to 2024:
where WBSTD is the standardized index for P or ET for the period (from 2021 to 2024); WB are their values for the specific year (2021, 2022, 2023, and 2024); WBmean are historical averages (2007–2021, 2007–2022, 2007–2023, and 2007–2024); and WBSD are standard deviations.
3. Results and Discussion
3.1. Thermal Conditions
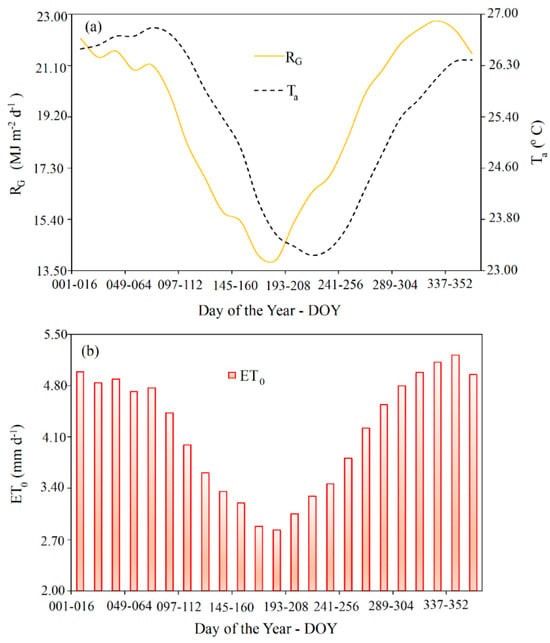
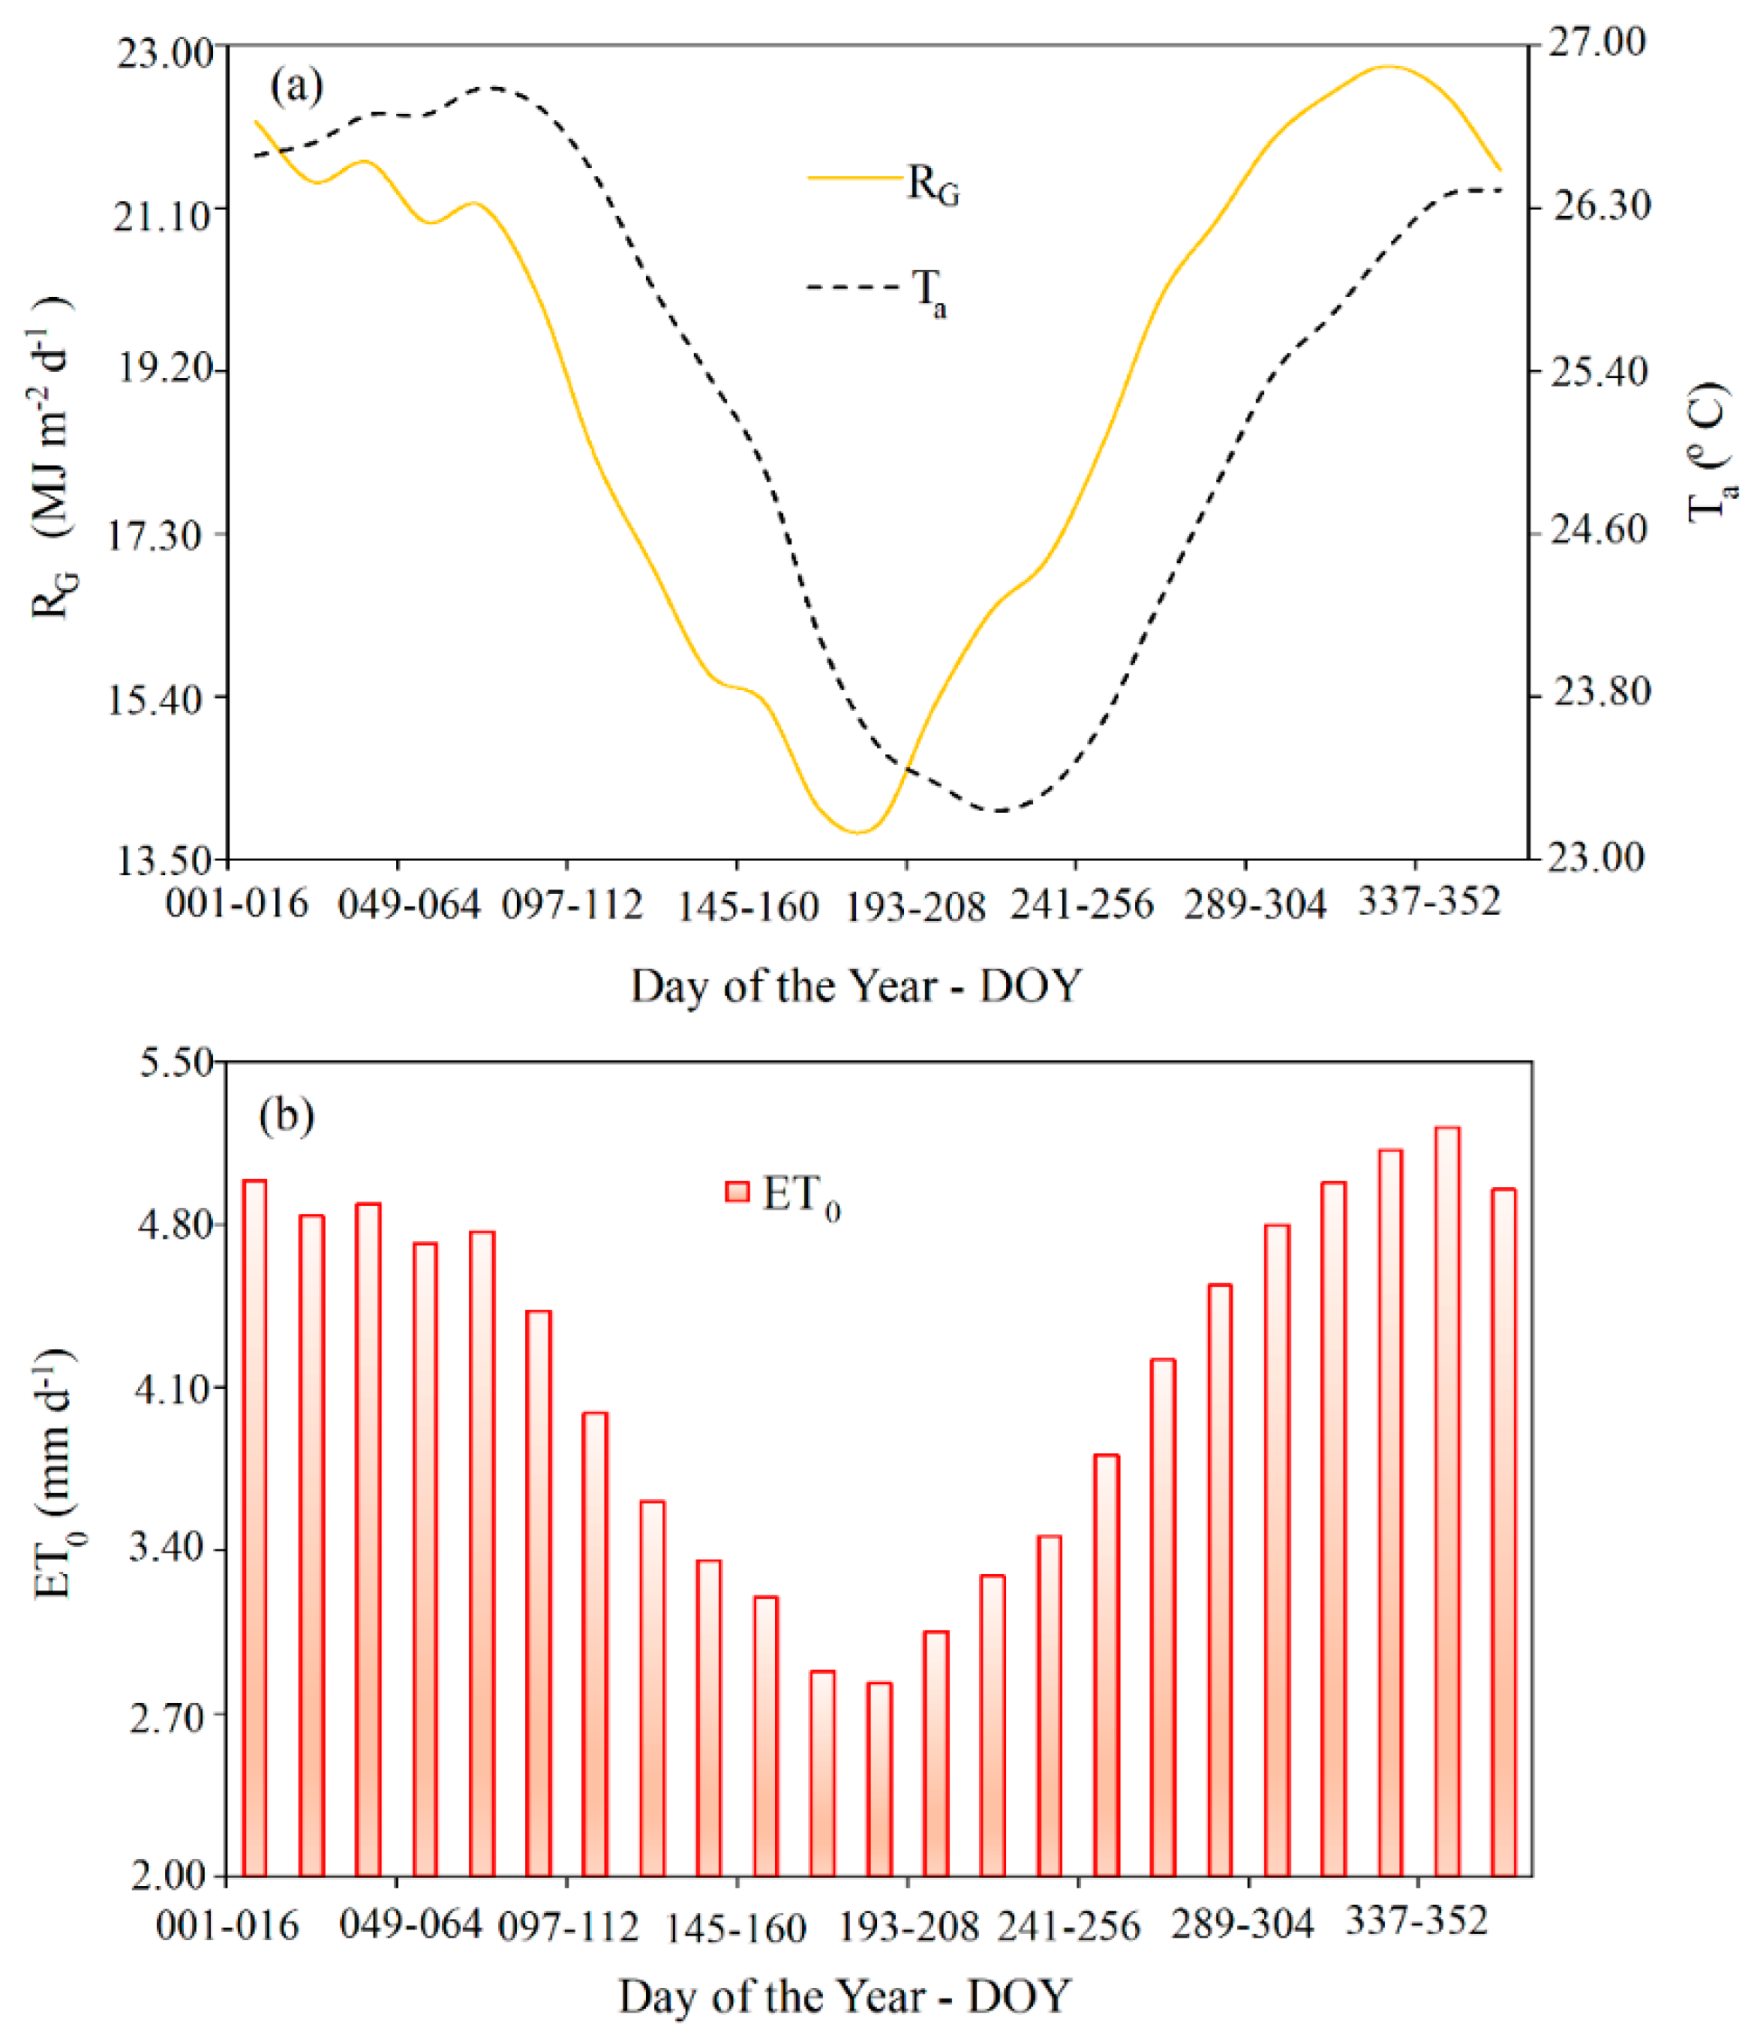
Figure 2 shows the daily average values, at the 16-day MODIS timescale, of the incident global solar radiation—RG—, air temperature—Ta—(Figure 2a) and reference evapotranspiration—ET0—(Figure 2b), for the sugarcane fields in the producing counties at SEALBA, from 2007 to 2024, in terms of day of the year (DOY).
Figure 2.
Average daily values, at the 16-day MODIS timescale of incident global solar radiation—RG and air temperature—Ta (a); and reference evapotranspiration—ET0 (b), for the sugarcane fields of the producing counties within SEALBA, from 2007 to 2024.
The thermal dynamics presented in Figure 2 may be considered historical averages for each 16-day MODIS period, because they represent interpolated mean pixel values for 18 years of data (2007 to 2024).
The hottest period under the highest solar radiation levels in the sugarcane fields occurs from September to April (DOY 257 to 096), with mean RG and Ta values over 20.00 MJ m−2 d−1 and 24.00 °C, respectively. This period portrays the zenith position of the Sun and the period outside the rainy season in SEALBA. The lower limits for both climatic parameters happen in the middle of the year, reaching the average RG of 14.00 MJ m−2 d−1 from June to July (DOY 161–192), while for Ta, it reaches 23.00 °C, between July and August, both corresponding to the winter solstice in the Southern hemisphere. The one-month gap in the magnitudes of RG and Ta shows the time differences between heating and cooling compared with the maximum and minimum solar radiation levels, respectively.
In terms of the atmospheric demand, ET0 follows solar energy and thermal tendencies throughout the year. However, since the climatic parameter that most affects this demand is RG, the upper and the lower limits for ET0 are over 4.00 mm d−1 from September to March and lower than 3.00 mm d−1 between June and July, respectively. The highest thermal conditions affecting the atmospheric demand happen at the start and at the end of the year, and involve the generalized Phases 1 and 4 of the sugarcane fields, respectively; however, since the region is close to the Equator (Figure 1), ET0 amplitudes are not so large, and somewhat limit their effects on the sugarcane water balance, even under high rainfall amounts.
3.2. Moisture Conditions
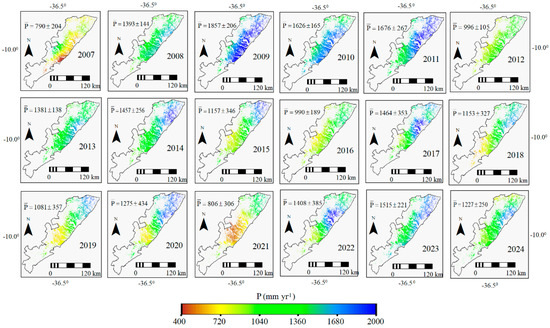
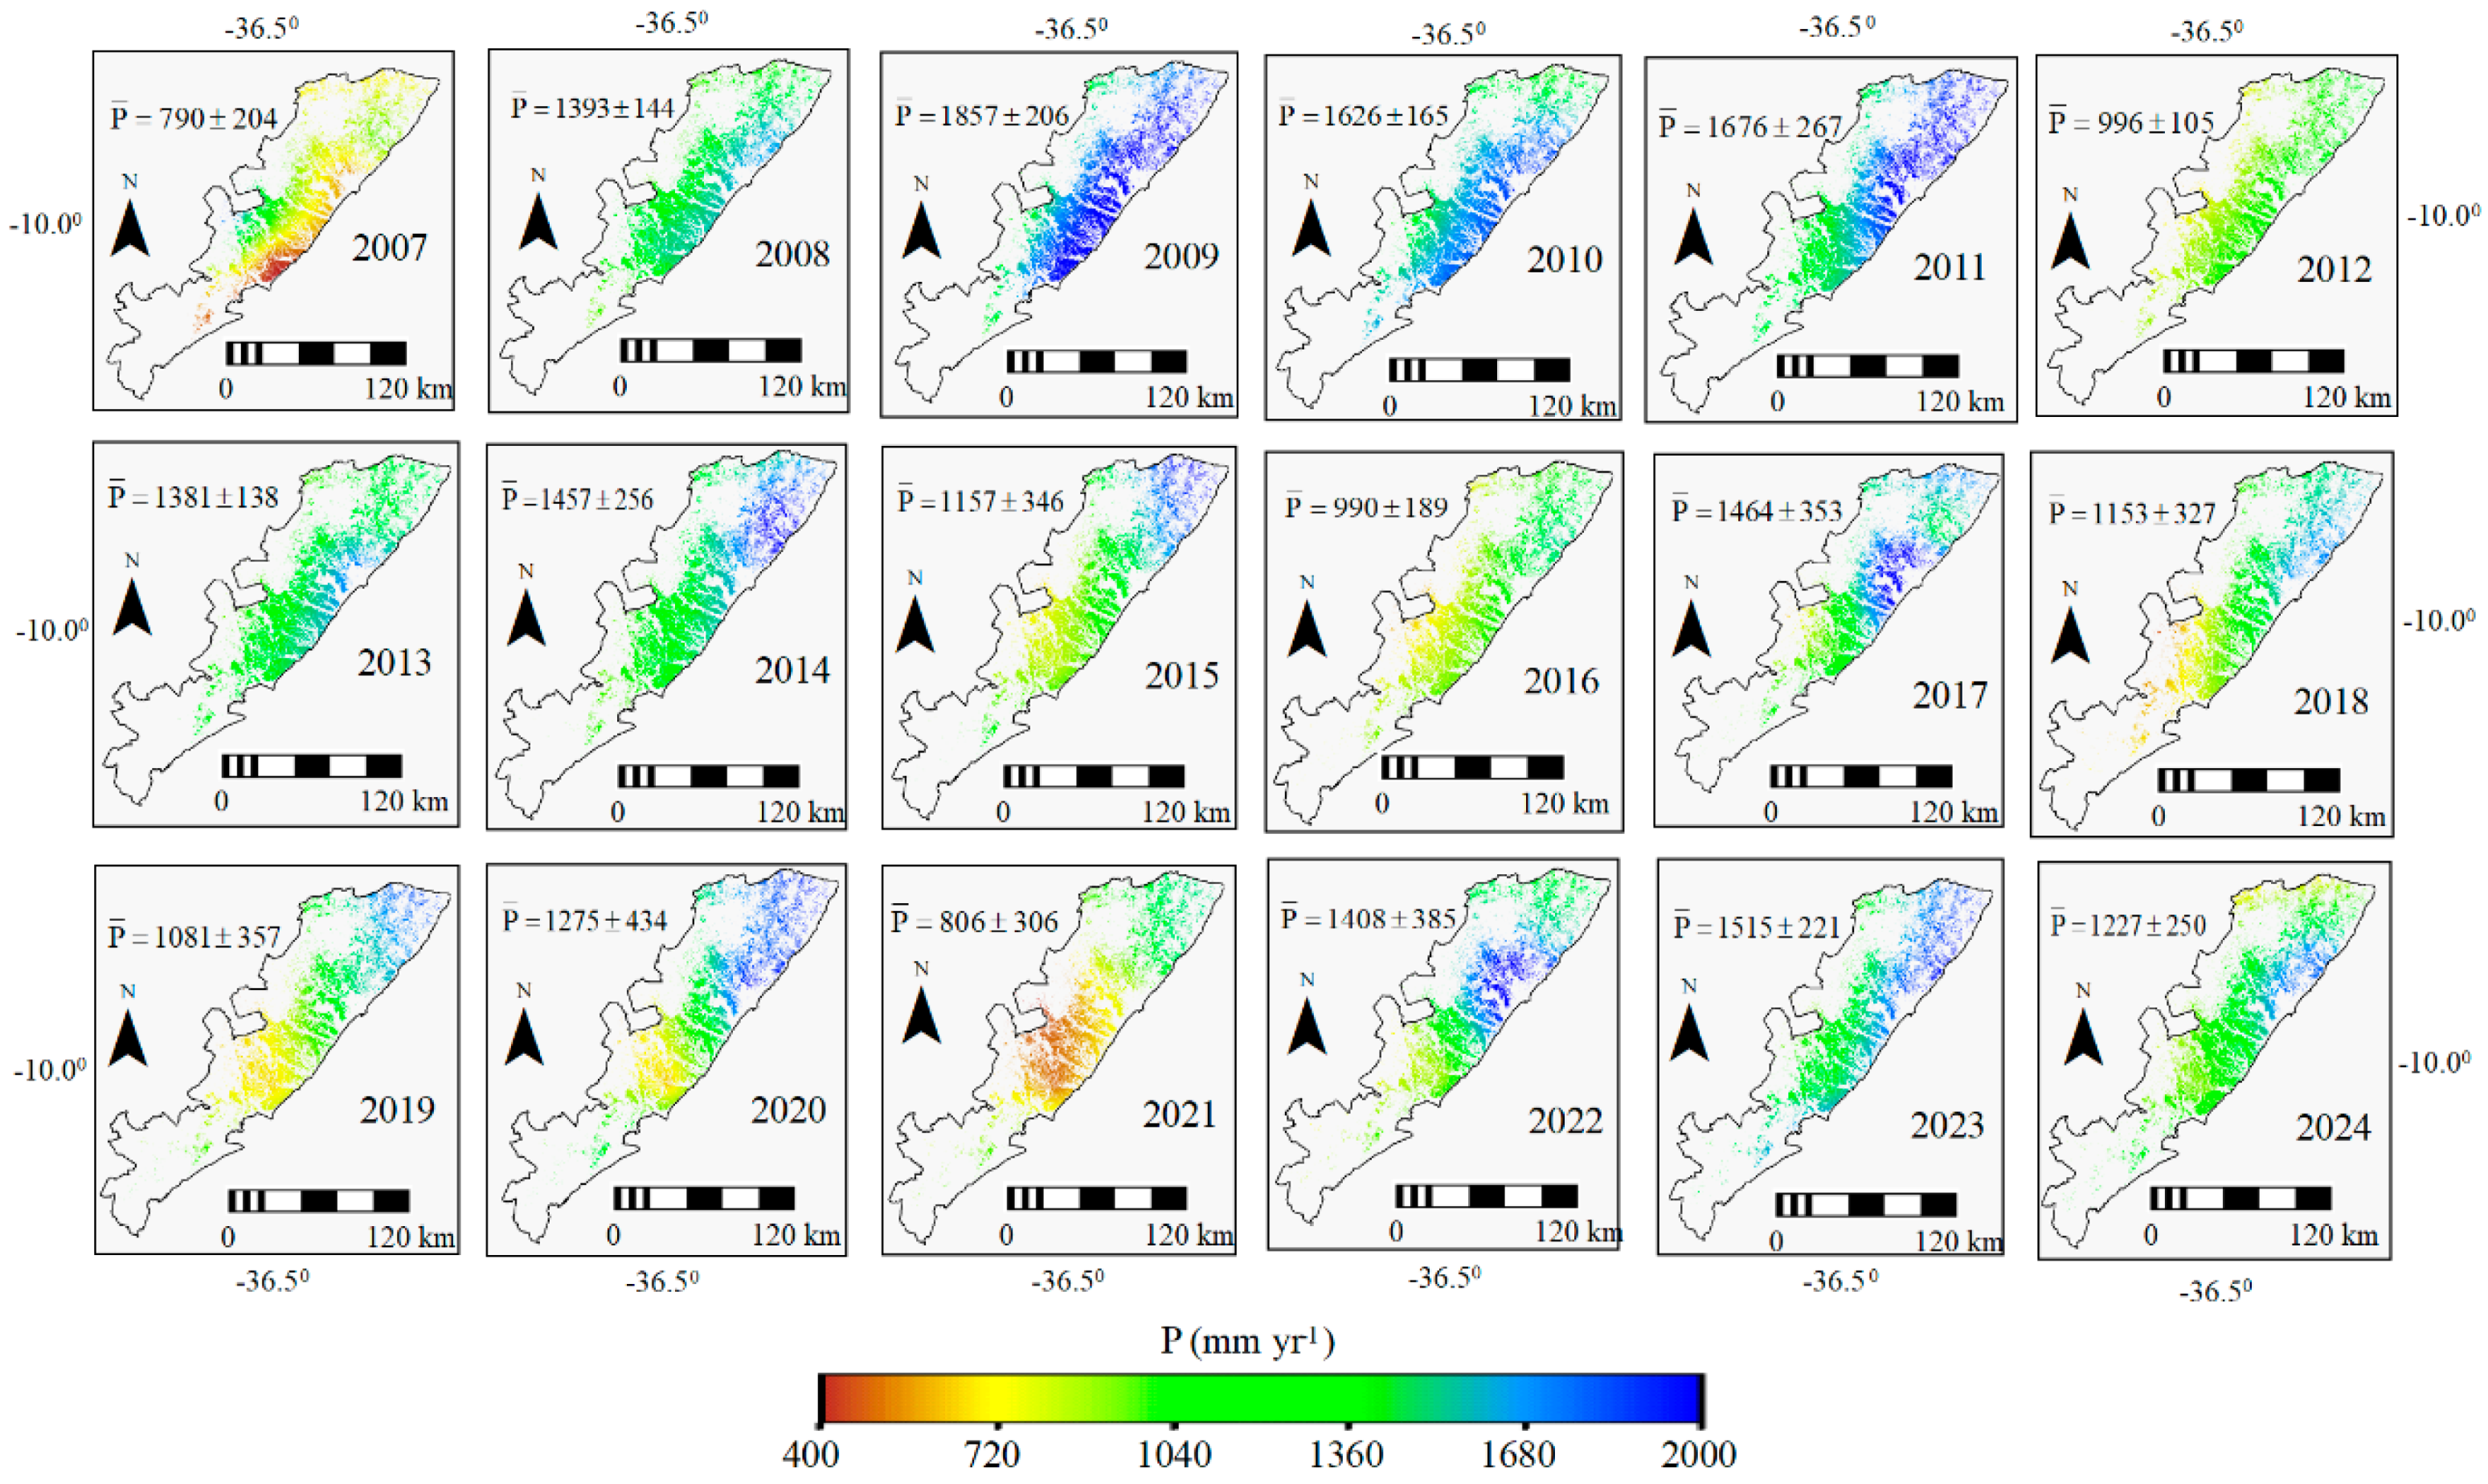
Figure 3 presents the spatial dynamics of the precipitation (P) values, pixel averages and standard deviations (SD) at the annual scale for sugarcane fields in SEALBA, from 2007 to 2024.
Figure 3.
Long-term dynamics of annual precipitation (P) values, pixel averages and standard deviations (SD) for sugarcane fields in SEALBA from 2007 to 2024.
Spatial and temporal variations in P pixels are noticeable within the sugarcane fields. The strongest contrast is observed comparing pixel values in 2007, with average below 800 mm yr−1, to those in 2009, when the average was above 1850 mm yr−1. Considering the values represented by the averages and SDs, P rates ranged between 500 mm yr−1 in 2021 and 2063 mm yr−1 in 2009. The largest spatial variations occurred in 2021, when SD represented 38% of the mean pixel value, while the lowest ones, 10%, happened in 2008, 2010 and 2013.
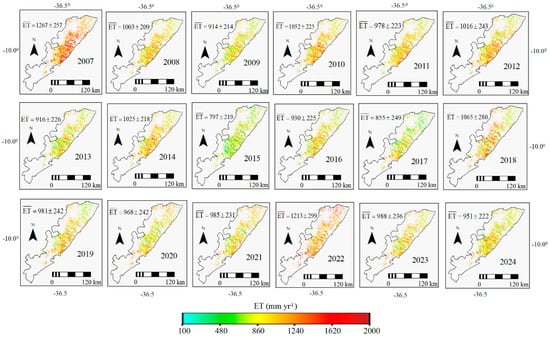
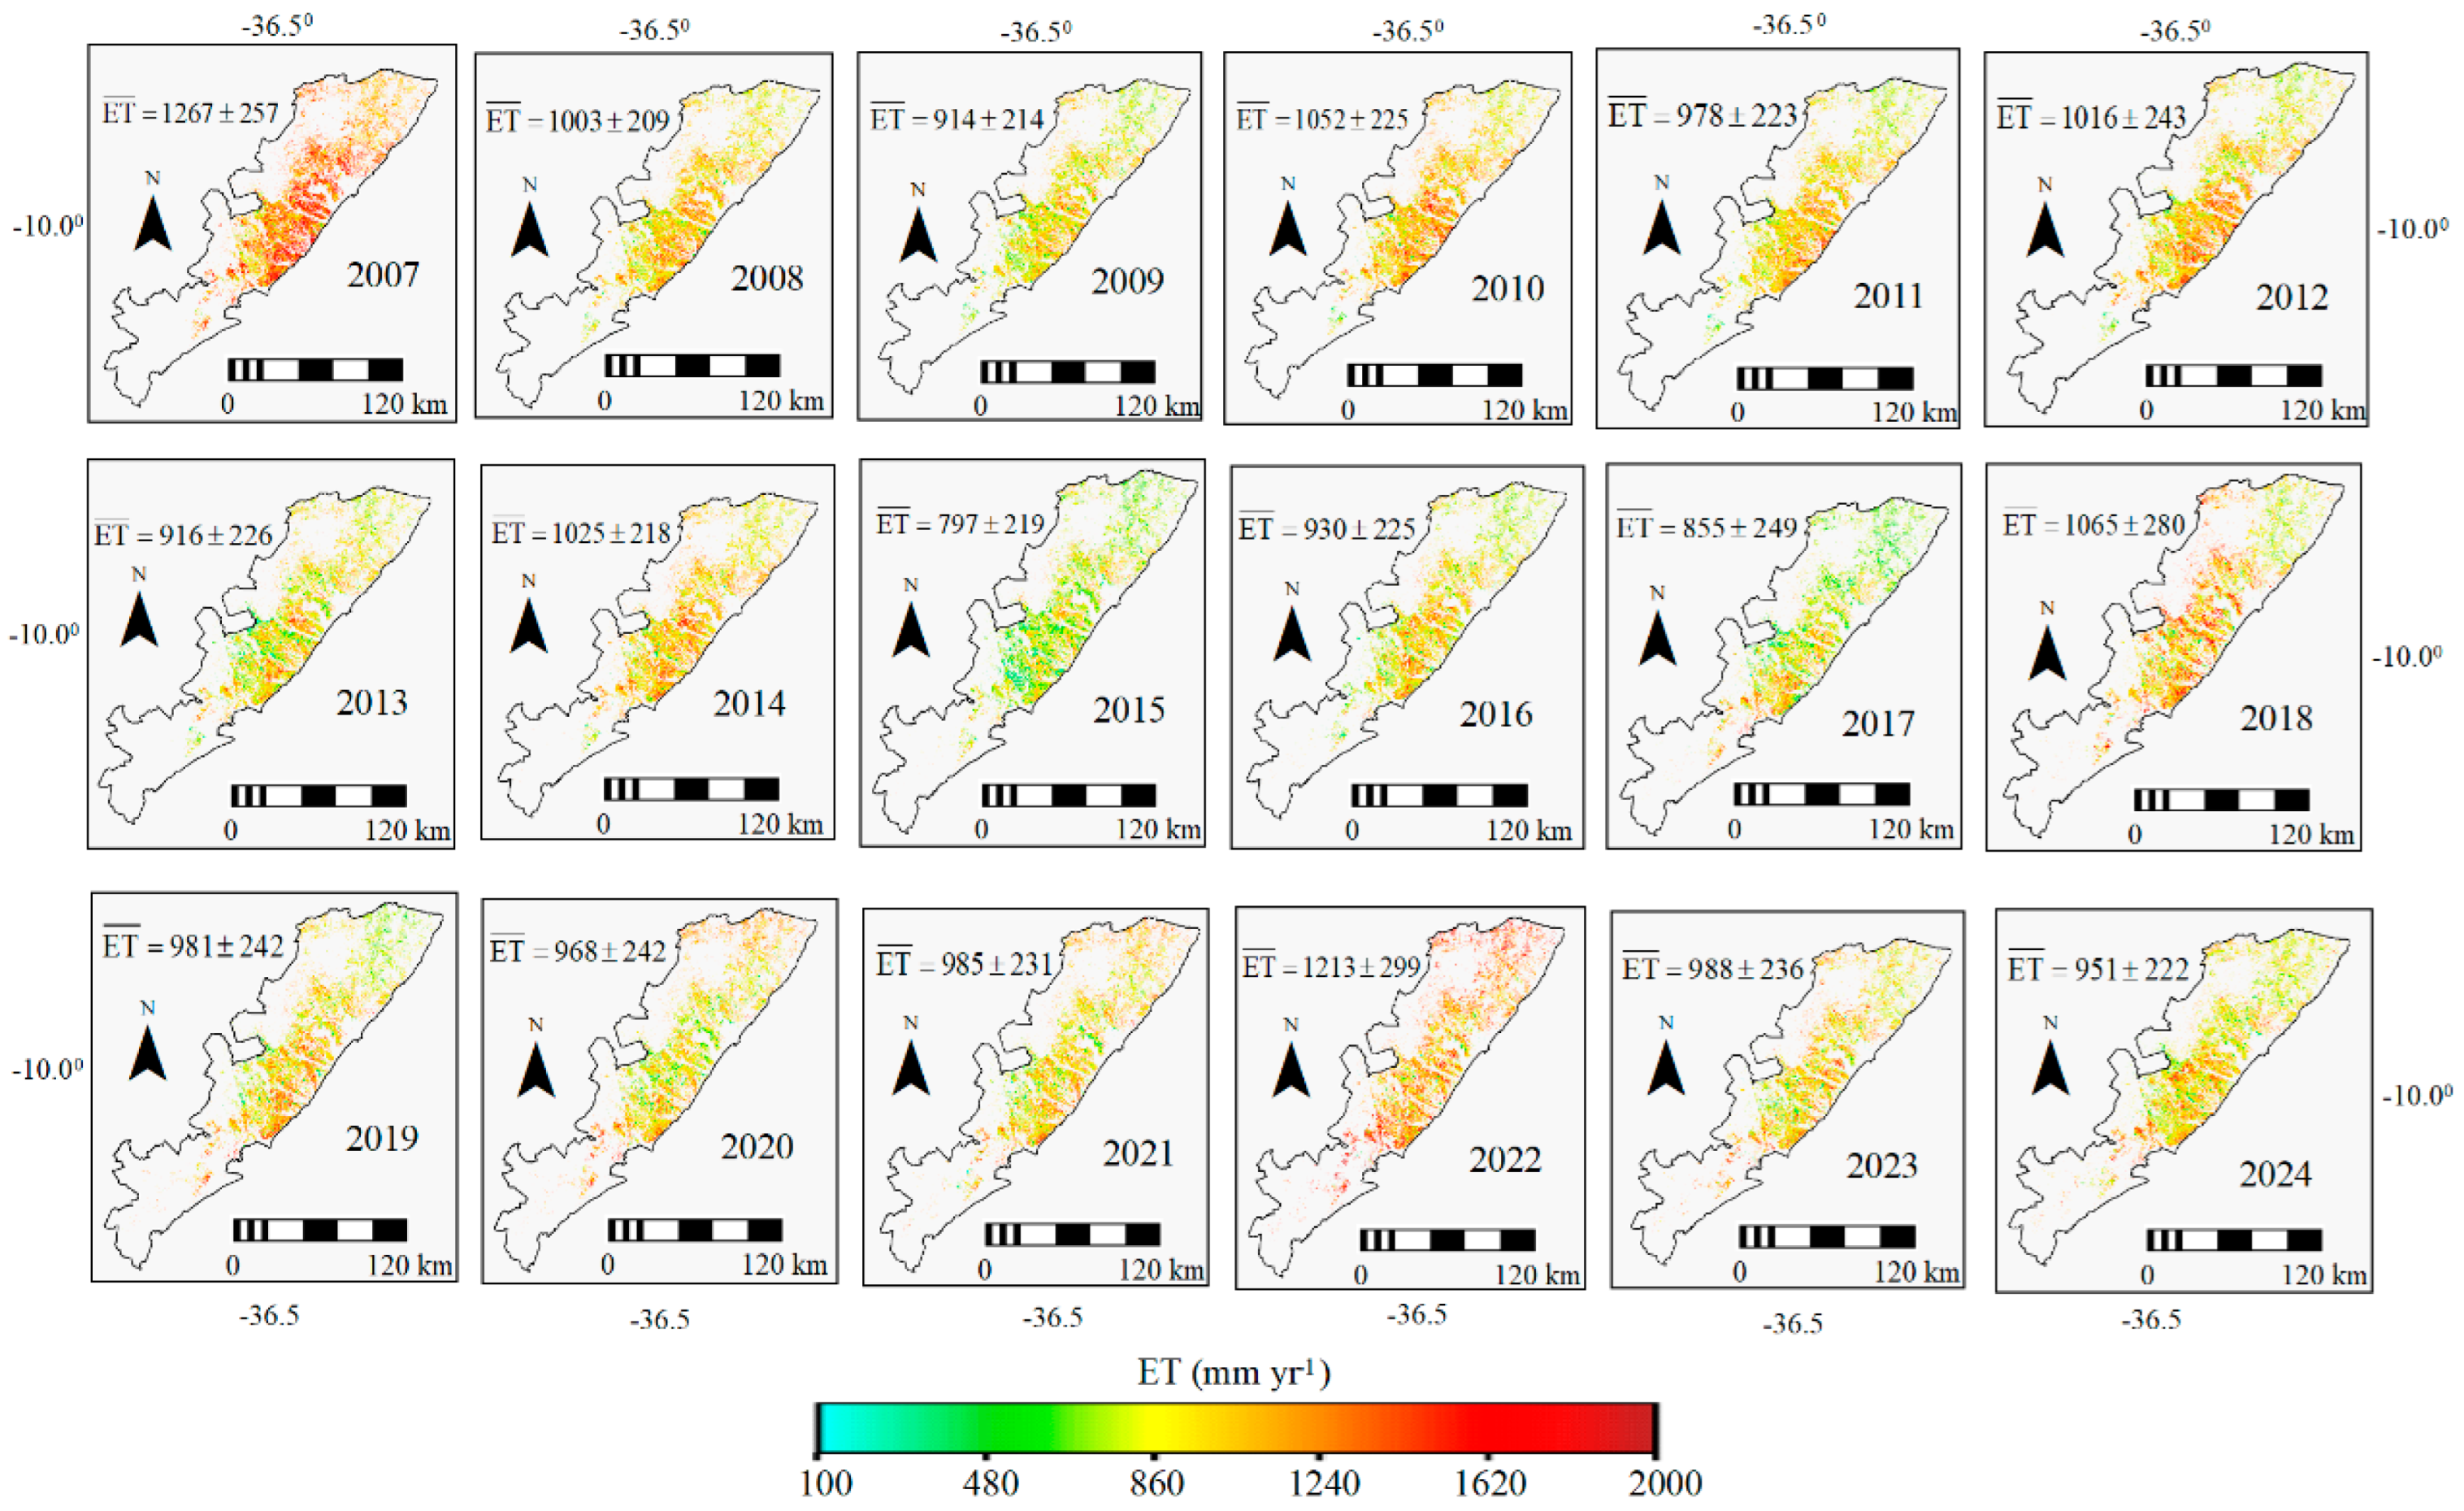
Figure 4 shows the spatial dynamics of the actual evapotranspiration (ET) values, pixel averages and standard deviations (SD) at the annual scale, for the sugarcane fields in SEALBA, from 2007 to 2024.
Figure 4.
Long-term dynamics of annual actual evapotranspiration (ET) values, pixel averages and standard deviations (SD) for sugarcane fields in SEALBA, from 2007 to 2024.
As for P, several spatial and temporal variations are also clear on ET throughout the years from 2007 to 2024 for the sugarcane fields within SEALBA. Rainfall is the main ET driving force in SEALBA [23]. However, the upper and lower limits of ET and P values for sugarcane fields throughout the years did not coincide. For ET, the maximum pixel values occurred in 2007, with annual average above 1260 mm yr−1, even during the lowest P for this year in the time series, while the minimum ET rates, below 900 mm yr−1, occurred in 2017. These differences between the maximums and the minimums in P and ET values are due to soil remaining wet after the high rainfall amounts, even with high RG and Ta levels [22,23].
Earlier studies using field measurements for irrigated sugarcane in Florida (USA) [42] resulted in a total ET of 1060 mm for one sugarcane growing cycle, within the ranges for the generalized 12-month growing cycle in SEALBA, under rainfed conditions. In more recent research in Ethiopia, using Landsat satellite measurements, an annual ET ranging from 1312 to 1682 mm was reported for irrigated sugarcane [26]. However, ref. [21] found lower growing cycle totals, between 690 and 829 mm using remote sensing measurements under rainfed conditions in Southeast Brazil. The ET differences can be related to soil cover by the canopies [43], and climate conditions [44].
3.3. Long-Term Water Balance Accounting
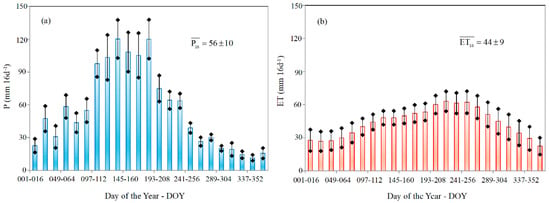
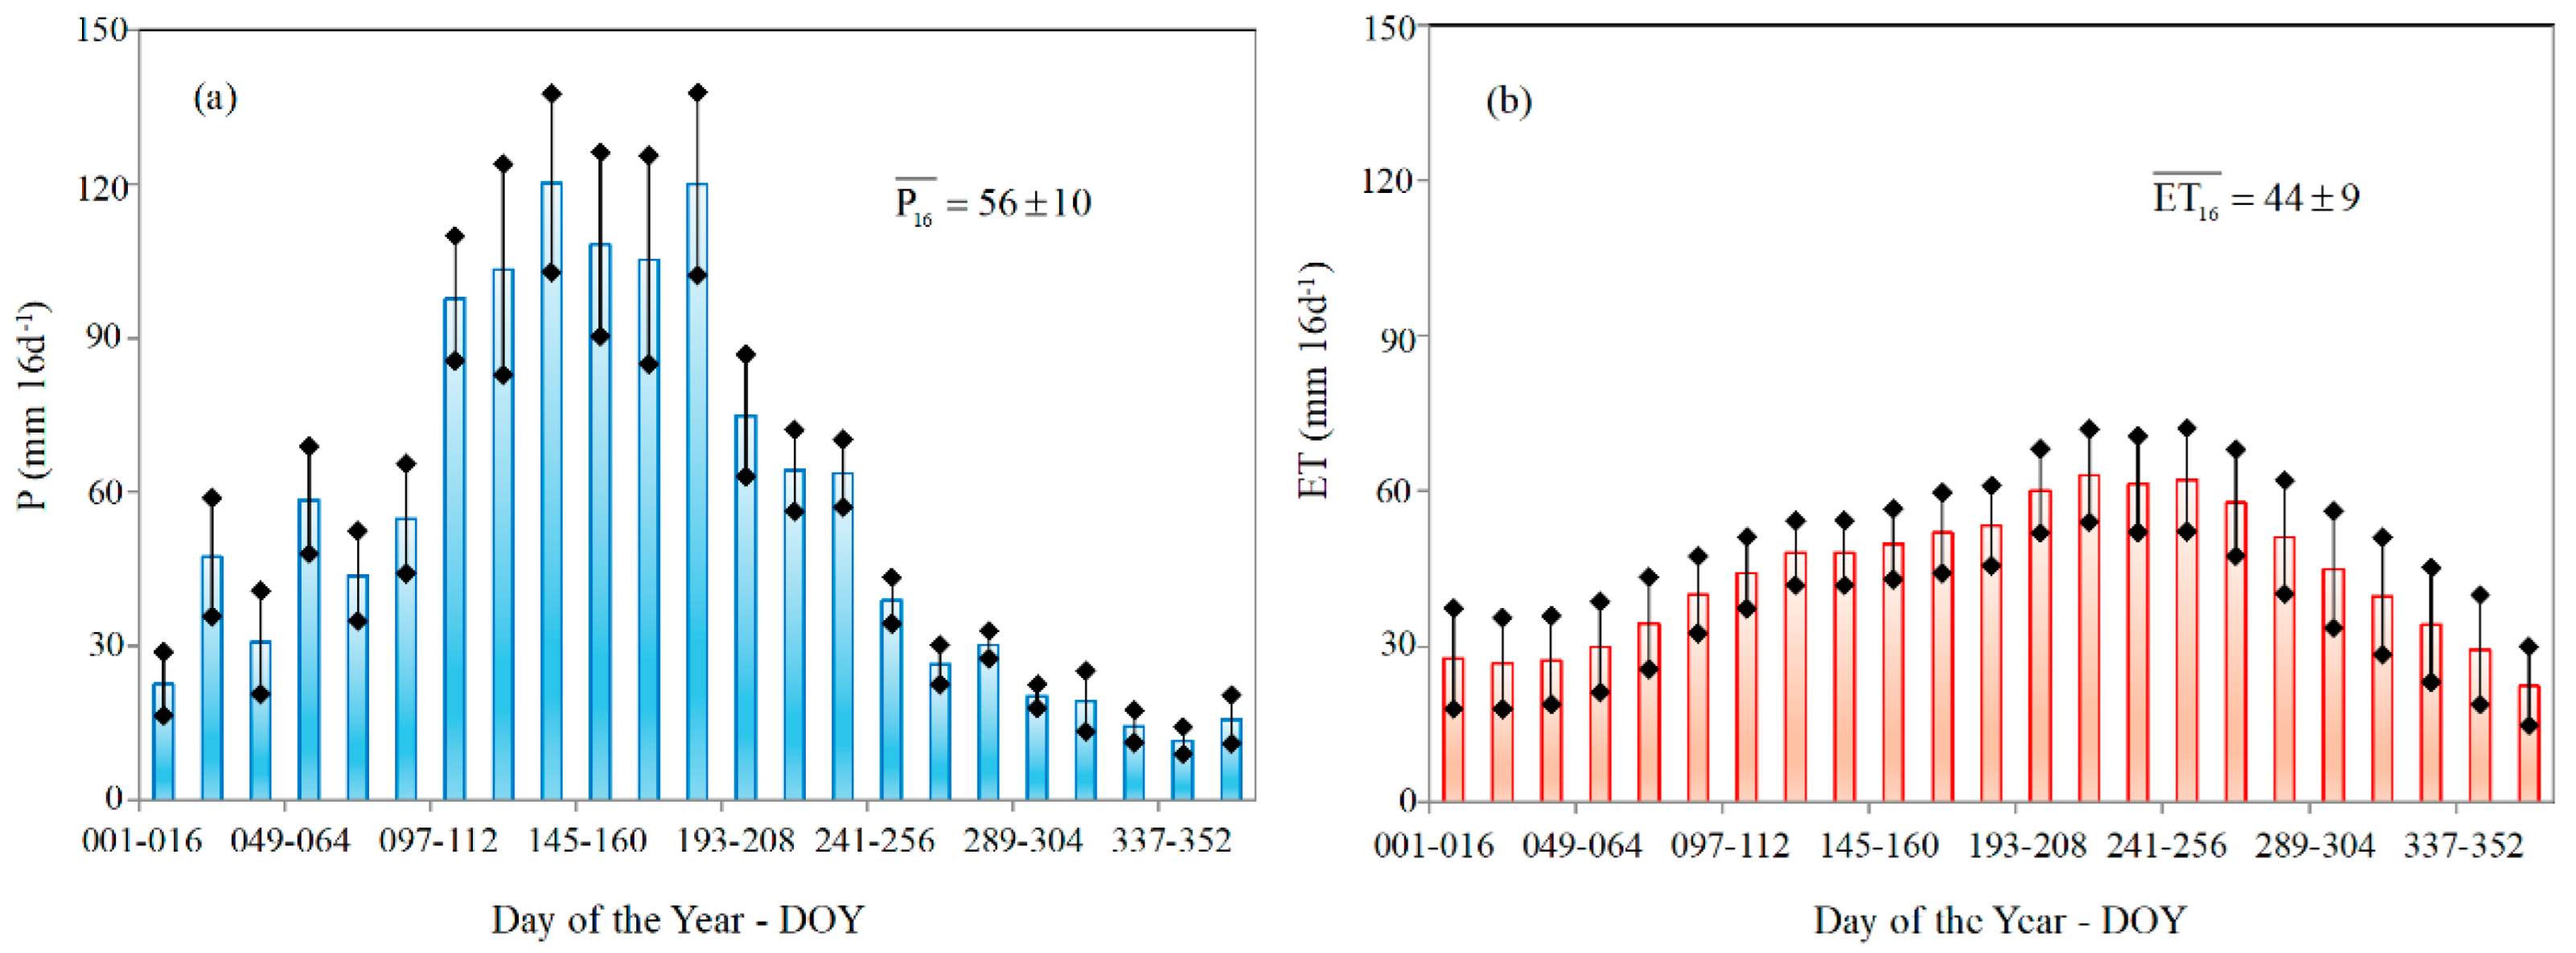
To assess water balance dynamics from 2007 to 2024, Figure 5 presents the average pixel values and SDs for P (Figure 5a) and for ET (Figure 5b) throughout the year, in the sugarcane fields within SEALBA.
Figure 5.
Pixel averages and standard deviations (SD) for precipitation—P—(a) and actual evapotranspiration—ET—(b), in the sugarcane fields within SEALBA.
Accounting for the water input in the long-term water balance, the highest mean P values (Figure 5a), with an average total over 100 mm 16d−1, occur from April to July (DOY 097 to 192), while the lowest ones, below 30 mm 16d−1, occur between September and January (DOY 257 to 016). Considering the water output from the sugarcane fields, the maximum ET rates (Figure 5b), with a total average higher than 50 mm 16 d−1, occur after the rainiest period, between June and October (DOY 161 to 288), under good levels of root zone moisture promoted by the previous rains, while the minimum ones, 30 mm 16 d−1, occur from DOY 305 (November) to 080 (March), off the rainy period.
Sugarcane daily mean ET values in SEALBA range between 1.10 mm d−1 (during the climatically driest period) and 4.50 mm d−1 (within the rainy season). These rates are slightly above those reported by [45], who found averages from 1.60 to 2.90 mm d−1 for distinct cultivars and root zone moisture conditions, a range involving drought stress and well-watered conditions in South Africa. However, our values are lower than those reported for irrigated sugarcane in Ethiopia, between 2.00 and 6.60 mm d−1, based on Landsat measurements [26]. For an irrigated sugarcane field in Florida (USA) in an earlier study, ref. [42] reported a minimum daily ET rate of 0.70 mm d−1 and a maximum of 4.60 mm d−1, while from Bowen ratio measurements in irrigated sugarcane located in Southeast Brazil, ET ranged from 3.70 to 4.40 mm d−1 [46]. Also in Southeast Brazil, from remote sensing measurements in rainfed sugarcane daily ET ranging between 0.30 and 5.80 mm d−1 was reported for the dry and rainy periods, respectively [21]. The similarity between daily ET values in the current study and in the literature conveys reliability to SAFER applications integrating MODIS images and weather data for large-scale estimations of sugarcane water consumptions.
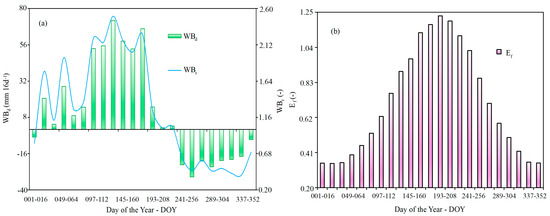
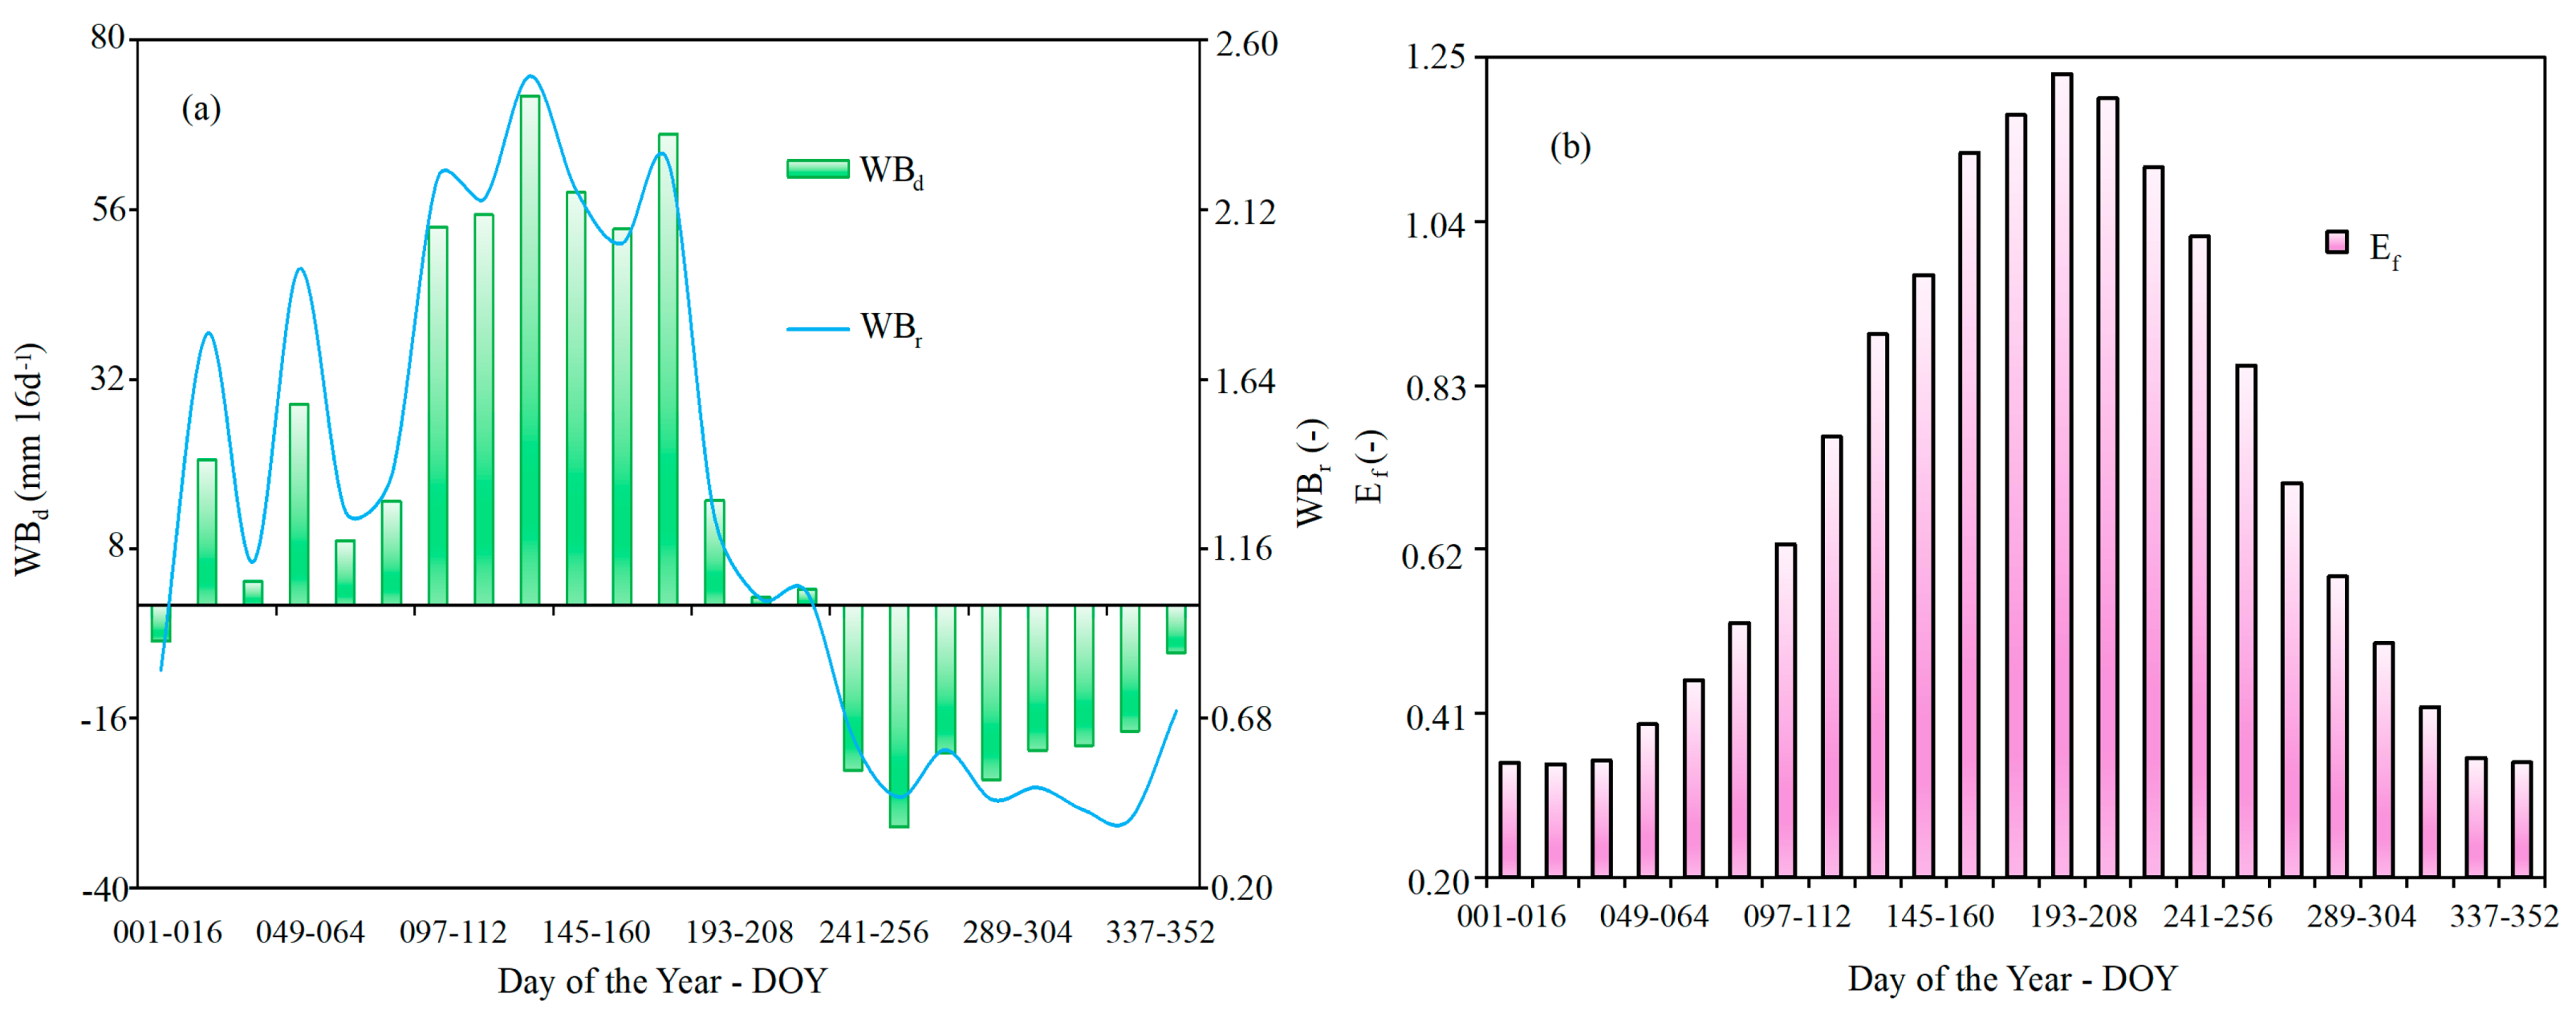
Figure 6 shows the average dynamics for the sugarcane moisture indicators WBd and WBr (Figure 6a) and Ef (Figure 6b) for the sugarcane fields in SEALBA.
Figure 6.
Dynamics of pixel averages for the water balance indicators difference—WBd and ratio—WBr (a) indicators, together with evaporative fraction—Ef (b) for the sugarcane fields in SEALBA.
According to WBr and WBd values (Figure 6a), the periods with the largest climatic water deficits occur between August and November (DOY 241 to 320), when WBd is below −20 mm 16 d−1. However, WBr only drops below 0.50 when P is less than half of ET, from October to the start of December (DOY 289 to 336), which is evidence that even under a reduction in rainfall amounts after the end of August, the sugarcane root zones still show good available moisture for crop growth until the end of September (DOY 273).
The temporal gaps, around two months of lag, between rainfall and sugarcane root zone moisture, are much clearer when assessing the Ef dynamics (Figure 6b). The highest Ef values, above 1.00, occur during the generalized sugarcane transition phases from grand growth to maturation, between June and September (DOY 161–257). The lowest ones, below 0.50, occur from November to March (DOY 321–080), involving the maturation phase and the transition from germination to tillering. The Ef values depict the conditions for high or low water fluxes [47,48]. Under optimum root zone moisture levels, Ef is taken as the crop coefficient (Kc), used in irrigation management [14,25,47] and agroclimatic zoning [22]. Although the Ef values in the current study refer to rainfed sugarcane, the range between 0.35 and 1.25, averaging 0.71, shows that, in general, the plants are under good root zone moisture, a little lower than those for the standard FAO Kc tabled values for Kc_ini and Kc_mid of irrigated sugarcane [25], and differed only for the Kc_end of 0.75 against 0.40 in SEALBA.
In the SEALBA agricultural region, considering the generalized sugarcane growing cycle of 12 months, it may be observed from the ET rates in Figure 5b and Ef values in Figure 6b that this cycle starts from February to March (DOY 049–065), indicating that the farmers strategically adjust the sugarcane phases with rainfall water availability and crop water requirements. WBd ranges from −31 mm 16 d−1 in September (DOY 257–272) to 72 mm 16 d−1 in May (DOY 129–144), while the range for WBr is between 0.39 in December and 2.50 in May (DOY 129–144). This last month is climatically characterized by rainfall equivalent to three times the water consumed by the crop and brings the possibility of negative effects of excess water on plants. This is also an opportunity for applying water storage techniques to be used under rainfall water scarcity periods [22,23].
Under these planting dates, the period with the highest rainfall water availability for the sugarcane-producing counties within SEALBA matches Phases 2 (tillering) and 3 (grand growth). The period with some water scarcity occurs in Phase 4 (maturation). During active growth, water deficit reduces biomass production [49]; however, rains are undesirable in phase 4, because they favor low-quality sugarcane products [38]. It may be concluded that rainfall in sugarcane-producing areas within SEALBA generally meets the crop’s water requirements for good yields. However, supplementary irrigation and rainfall water storage techniques are recommended in some areas facing rainfall water deficit periods.
Considering the WBd 16-day values (Figure 6a), a mean sugarcane crop area of 431,078 ha from 2007 to 2024, and environmental conditions throughout these years, there was a supplementary irrigation demand of 733 million cubic meters from 29 August to 16 January, and possibilities for rainfall water storage of 1957 million cubic meters from 17 January to 28 August, avoiding water loss by runoff and/or deep percolation.
3.4. Sources of Uncertainties and Limitations
One of the main difficulties of using satellite images to follow large-scale water balance dynamics throughout the years is cloudy conditions. The 1000 m spatial resolution of the MODIS thermal bands means that the images should cover more pixels that are not sugarcane fields. To minimize these problems, we used the reflectance MOD13Q1 product applying the residual method to estimate surface temperature (T0) [22]. The HDF file has reflectance bands 1 and 2 at 250 m spatial scale.
Another issue for modeling large-scale water balance is ET validation with simultaneous field and satellite measurements. In general, micrometeorological towers are used together with remote sensing parameters, these towers being equipped with very expensive sensors which are not always available and present several maintenance problems. In the current research, we did not have field measurements for our study region for the period 2007 to 2024, but previous studies had already validated the SAFER algorithm in distinct agroecosystems and environmental conditions of Northeast Brazil [22,37,40]. The algorithm was previously called PM2, and the satellite results showed good agreement with field measurements, with the regression analysis explaining 89% of the variance and a mean square error (RMSE) of 0.34 mm d−1. Field data used for SAFER development involved irrigated crops and natural vegetation from 2001 to 2007, being described in detail in [40]. After this, it was also calibrated and validated under distinct environmental conditions of several Brazilian agroecosystems [22].
However, to become more confident with ET values for our purposes in the current study, besides comparisons with literature, ET results under optimum root zone moisture conditions were checked with those from FAO crop coefficient (Kc) approach [25] by using Kc and ET0 values during the sugarcane mid-season stage. Thus, one can expect sufficient accuracy for sugarcane water balance evaluations in Northeast Brazil, making it not strictly necessary to perform new expensive validations with flux towers.
The FAO approach considers ET at potential rates under irrigation conditions (ETFAO). Thus, for comparisons with our values, we considered ET retrieved from SAFER during the period of mid-season stage (ETSF), corresponding to the sugarcane transition Phases 3 (grand growth) to 4 (maturation). Although our sugarcane fields are under rainfed conditions, according to Figure 6, it was assumed that during this period the conditions of good root zone moisture were satisfied for the superior limit of the standard deviations (SD).
FAO calculations start with tabled Kc values through Equation (9). Table 1 shows an overview of the parameters used for ETFAO calculations, and its comparisons with ETSF from 2007 to 2024 in the sugarcane fields within SEALBA.
Table 1.
Parameters used to calculate the mid-season FAO crop coefficient for sugarcane and comparisons of evapotranspiration from FAO approach and SAFER, during the FAO mid-season sugarcane phases from 2007 to 2024.
The Kc_TAB and mean sugarcane crop height (h) were kept constant for sugarcane, 1.25 and 3 m, respectively [25]. We used interpolated pixel values of ET0, minimum relative humidity (RHmin) and average wind speed at 2 m height (u2), within the sugarcane land-use shapes from 2007 to 2024. For the FAO mid-season stage, the average daily ET0 values did not vary too much throughout the years, between 3.00 and 4.00 mm d−1; however, the highest atmospheric demand was for 2007, while the lowest one was for 2008. Regarding the minimum relative humidity (RHmin) values, there were more variations, between 35% and 55%. The driest year was 2007, coinciding with the largest atmospheric demand (>ET0); and the moistest year was 2008, when the lowest atmospheric demand occurred (<ET0), respectively. The range for wind speed (u2) was narrow, with averages from 1.30 m s−1 to 1.70 m s−1, thus not affecting the ET0 and ETFAO significatively (Table 1).
Through the fixed Kc_TAB and h, RHmin and u2 pixels, the Kc_mid values were obtained (Equation (9), Table 1). Considering the averages and SDs, the range from 1.18 (2008) to 1.28 (2007) confirms the climate dependence of this coefficient. The average value of 1.22 was 98% of the tabled one (1.25) [25]. The product of KcFAO by ET0 gave ETFAO rates from 2007 to 2024. Considering averages and SDs for evapotranspiration, ETFAO was 16% higher than ETSF, but 6% lower in 2008 and 42% higher in 2015. However, spatial variations were much lower for ETFAO than for ETSF, with SD accounting for 6% and 24% of the mean pixel values, respectively.
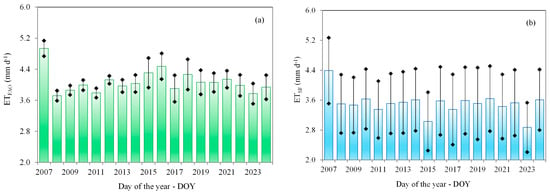
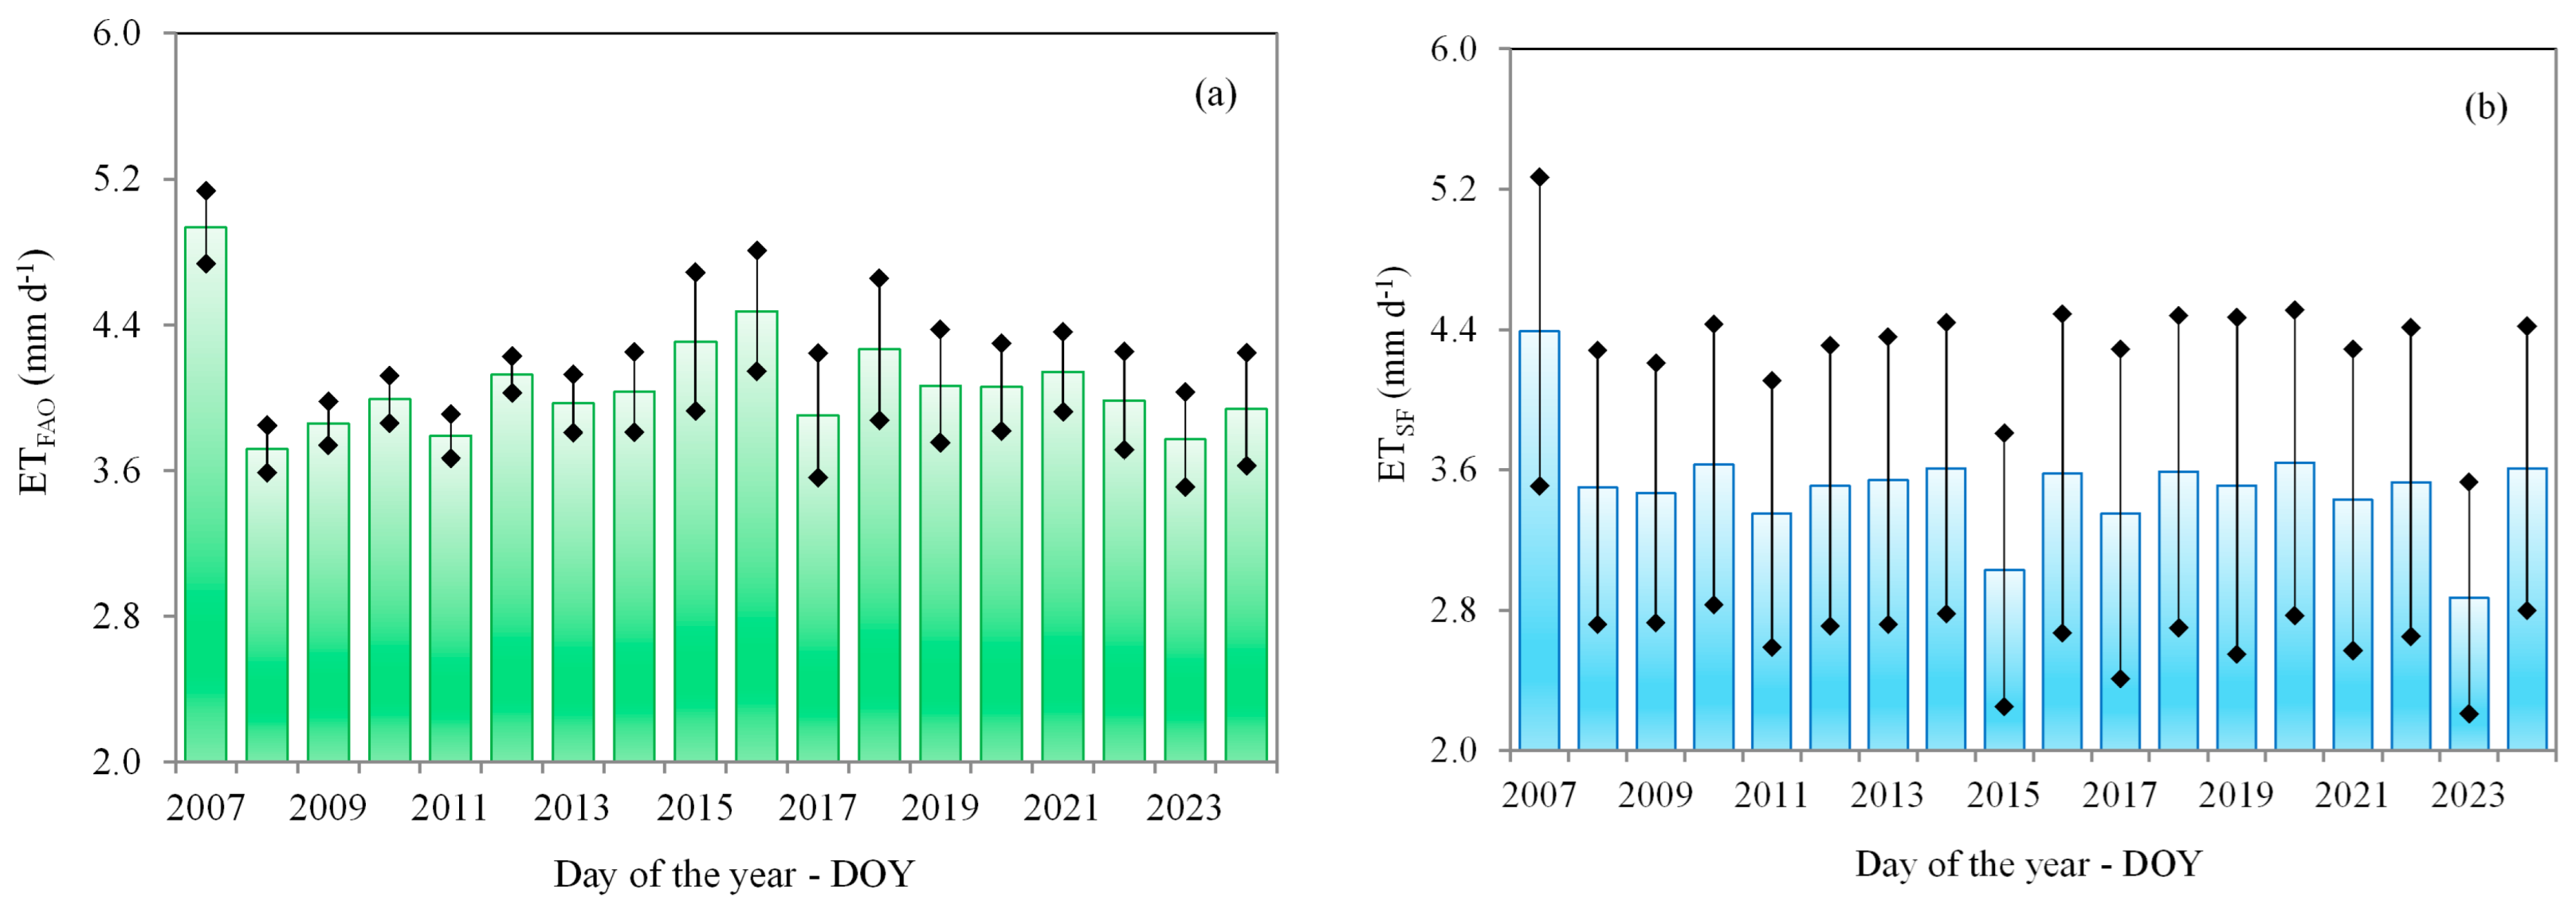
Figure 7 presents the daily evapotranspiration for the FAO mid-season phases at the annual scale and its standard deviations (SD). By FAO Kc approach (ETFAO) (Figure 7a) and by the SAFER algorithm (ETSF) (Figure 7b), in sugarcane fields within SEALBA from 2007 to 2024.
Figure 7.
Daily evapotranspiration and its standard deviations (SD) at the annual scale, for the FAO mid-season phases in sugarcane fields within SEALBA, from 2007 to 2024. (a) Calculated by the FAO Kc approach (ETFAO); (b) retrieved by the SAFER algorithm (ETSF).
When considering only the average pixel values, larger ETFAO than ETSF for all years are notable. For both methods, the highest rates, with a difference of 1.12 mm d−1 between them were in 2007 (see also Table 1). The lowest averages were in 2008 for ETFAO (below 3.75 mm d−1) and in 2023 for ETSF (below 2.90 mm d−1). However, considering the range of values represented the averages and SDs, it is from 3.51 mm d−1 (2023) to 5.14 mm d−1 (2007) for ETFAO and between 2.21 mm d−1 (2023) and 5.27 mm d−1 (2007) for ETSF. As both methods were applied under optimum root zone conditions, a possible explanation for the lower ETSF values could be due to different soil cover by the canopies. However, accounting for SDs, the upper limit for ETSF (Figure 7b) followed well the ETFAO values (Figure 7a), meaning that for some pixels of sugarcane fields the FAO optimum moisture conditions are satisfied while for others they are not.
Furthermore, the SAFER results compared with those from the standard FAO approach are acceptable for our purposes of long-term assessments, and these comparisons may be considered plausible when there are no field measurements available. Attention must be paid to the optimum root zone moisture conditions as prescribed by the Kc FAO approach [22,25]. In addition, in the absence of simultaneous ET satellite and field measurements to calibrate the regression coefficients of the main SAFER equation (Equation (7)) for specific crop and environmental conditions [41], one can use the Kc FAO approach, selecting pixels where the conditions of optimum root zone moisture are assured.
3.5. Standardized Index for the Water Balance Components
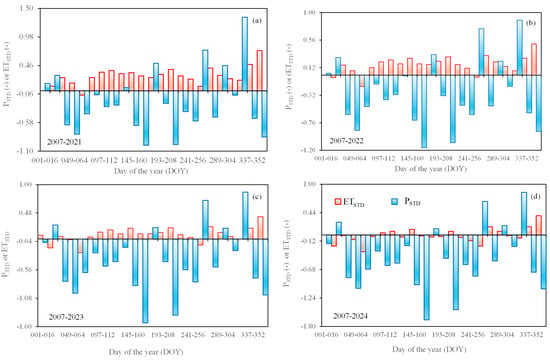
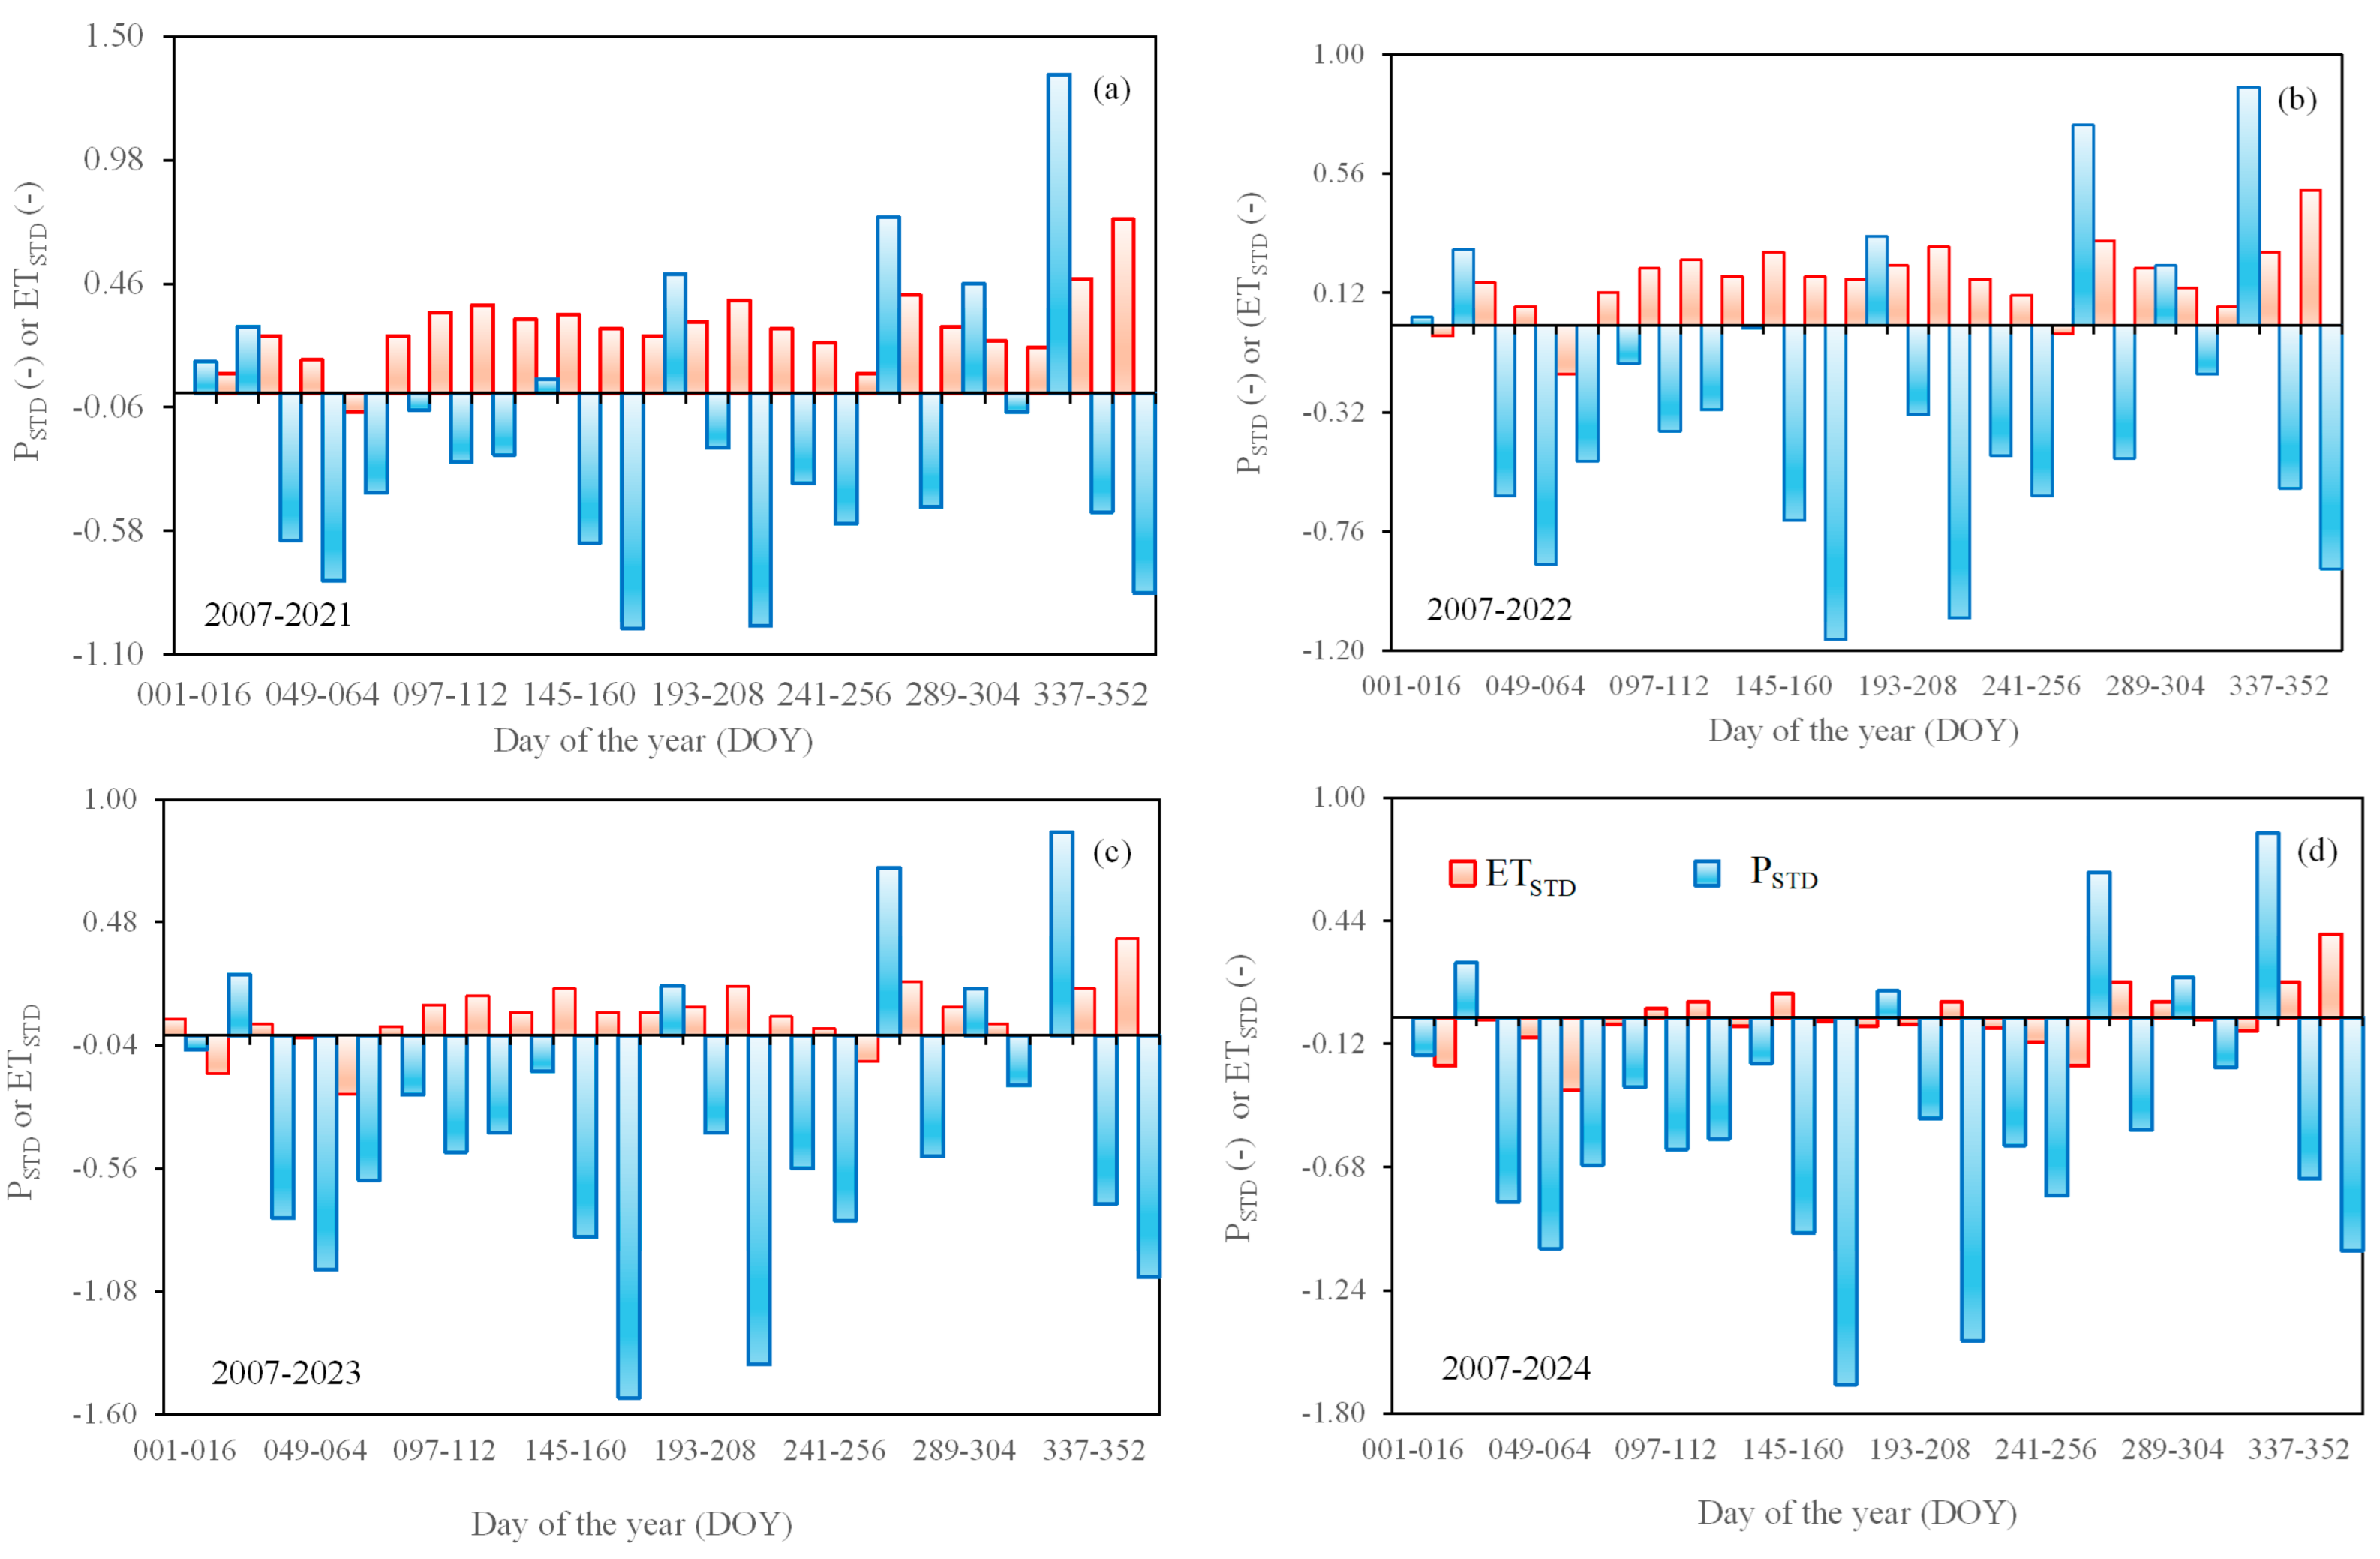
Figure 8 shows the standardized indices for precipitation (PSTD) and for actual evapotranspiration (ETSTD) values during 2021 (Figure 8a), 2022 (Figure 8b), 2023 (Figure 8c), and 2024 (Figure 8d), for sugarcane fields within SEALBA, regarding the respective long-term periods 2007–2021, 2007–2022, 2007–2023, and 2007–2024.
Figure 8.
Standardized index for precipitation (PSTD) and actual evapotranspiration (ETSTD) during 2021 (a), 2022 (b), 2023 (c), and 2024 (d), for sugarcane fields within SEALBA.
Considering P, most of the 16-day periods showed average negative PSTD, meaning lower rainfall for all the four last years analyzed in the dataset. Few occasions with positive PSTD values represented better moisture conditions for plant growth. In the case of ETSTD, although with lower values compared to PSTD, the opposite situation was observed. Most positive values indicated higher ET from the sugarcane fields.
During 2021 (Figure 8a), the most negative PSTD, lower than −0.95, occurred in June (DOY 161–176) and from July to August (DOY 209–224). The highest positive PSTD, over 1.30, occurred from September to the start of December (DOY 257–336). The ETSTD values were only slightly negative in March (DOY 065–080), around −0.08. The highest positive ETSTD, above 0.40, was between September and October (DOY 273–288).
In 2022 (Figure 8b), as for 2021, the most negative PSTD was also concentrated in June (DOY 161–176) and from July to August (DOY 209–224), below −1.00. The highest positive PSTD, over 0.70, occurred between September and October (DOY 257–272) and from November to December (DOY 321–226). Regarding ETSTD, only three 16-day periods showed negative values, but close to zero, being the most negative one of −0.18 in March (DOY 065–080), while the maximum of 0.55 occurred in December (DOY 353–366).
Analyzing PSTD in 2023 (Figure 8c), as for 2021 and 2022, the most negative average values also occurred between June (DOY 161–176) and July to August (DOY 209–224) but lower than −1.30, while the highest positive ones also occurred from September to October (DOY 257–272) and November to December (DOY 321–226), with PSTD over 0.70. There were few negative ETSTD in 2023, but with averages close to zero, being the lowest one of −0.25 in March (DOY 065–080). However, the positive ETSTD values were also low, the maximum being 0.41 in December (DOY 353–366).
For 2024 (Figure 8d), again the most negative PSTD occurred between June (DOY 161–176) and from July to August (DOY 209–224), even lower than −1.40, showing that this year was the driest among the analyzed ones. The highest positive PSTD average values were also from September to October (DOY 257–272) and November to December (DOY 321–226), over 0.65. The ETSTD was very low, with average values oscillating between positive to negative values around zero. The maximum of 0.38 was in December (DOY 353–366) and minimum of −0.33 occurred in March (DOY 065–080).
The average values of PSTD were −0.20, −0.30, −0.42, and −0.47 for 2021, 2022, 2023, and 2024, respectively. For ETSTD, this sequence was 0.27, 0.17, 0.08, and −0.01. These values show that the driest year was 2024 (<PSTD), but with ET rates close to the historical value (ETSTD~0), while during 2021 ET from the sugarcane fields was the highest (>ETSTD). It can be concluded that detections of WB anomalies are appropriate for sustainable sugarcane crop management because they represent the alterations of water availability for specific periods, showing suitable periods for crop cycles as well as the irrigation needs, while helping to minimize competition among other water users [31,32,33,50,51].
3.6. Overview of the Volumetric Water Balance
Considering the variation in sugarcane crop areas from 2007 to 2024 in producing counties of SEALBA, Table 2 offers an overview of the water balance components in million cubic meters of water for each year over this long-term period.
Table 2.
Overview of the water balance components, in million cubic meters of water, considering the total area for each year from 2007 to 2024 in producing counties within SEALBA.
According to Table 2, variations are observed in sugarcane crop areas (ASC) between 2007 and 2024. From 2007 to 2012, ASC was stable, around 462,744 ha, dropping until 2017, at a rate of 15%, stabilizing again with an average of 393,245 ha until 2021, and declining by 7% in 2022. Thereafter, ASC rose until 2024, when it reached its biggest size of over 493,000 ha, 7% larger than that of 2007. These changes in ASC, together with the differences between rainfall and atmospheric demand, affected total sugarcane water consumption at the regional scale. By making these considerations, water balance assessments were also done in cubic meters of water, incorporating crop expansion throughout the analyzed years.
The largest rainfall water input in the regional water balance occurred in 2009, with P higher than 8500 million cubic meters under an ASC of over 460,000 ha, and corresponded to the maximum WBd and WBr values, above 4300 million cubic meters and 2.00, respectively, although with a relatively low Ef of 0.60, given that the Ef maximum value of 0.80 was detected in 2007. The lowest rainfall amounts occurred in 2021, under an ASC below 400,000 ha, a total P of 3200 million cubic meters, WBd lower than −700 million cubic meters but WBr above 0.80 and Ef still higher than 0.65, indicating that even under low rainfall conditions, the root zone moisture was still at good levels for crop growth.
In terms of sugarcane water consumption, the highest water outlet occurred in 2007, with ET above 5800 million cubic meters and ASC over 463,000 ha, but with the largest water deficit, WBd below −2200 million cubic meters, although WBr was higher than 0.60. In this situation, the largest ET, even under a large water deficit, is justified by the highest Ef of 0.80, indicating that high soil moisture promoted large water fluxes. The lowest ET, below 3400 million cubic meters, was detected in 2017, under ASC smaller than 395,000 ha, with high WBd above 2400 million cubic meters and WBr larger than 1.70, but Ef below 0.60, evidence of poor root zone moisture conditions and a smaller ASC when compared with previous years.
Based on the long-term regional water balance, the temporal gap between rainfall water supplies and the root zone moisture levels also causes a delay regarding water consumption and rainfall.
4. Conclusions
The integration of MODIS remote sensing parameters together with weather data allowed assessments of the long-term regional rainfed sugarcane water balance, for producing areas within SEALBA. The evaporative fraction was a good root zone moisture indicator, evidencing that sugarcane rainfall water generally meets crop water requirements, and that farmers strategically adjust the crop cycles to rainfall water availability, mainly during the tillering and grand growth sugarcane phases. The period with some rainfall water scarcity occurs in the maturation phase, which favors sugar content. On the one hand, when rainfall is much higher than water consumption, the water balance showed possible negative effects on plants caused by water excess, but with opportunities for root zone water storage. On the other hand, during periods when water output is greater than water input, there is a negative water balance and a water deficit for the crop, showing benefits of supplementary irrigation.
The similarity between evapotranspiration values in the current study and those in the literature together with good agreement with kc FAO approach under optimum root zone moisture conditions, conveys reliability to SAFER applications integrating MODIS images and weather data, for large-scale estimations of sugarcane water consumption. The assessments allowed anomaly analyses on rainfall and water fluxes from sugarcane fields by using standardized indices for these water balance components. The modeling may be implemented for sustainable management of established sugarcane fields as well as for monitoring the environmental effects of their expansion under scenarios of climate and land-use change. By analyzing many years of data, it is possible to identify patterns of drought, excess rain, and normal years. These patterns can support producers in planning planting dates, irrigation strategies, and even choosing varieties that are more tolerant to water stress.
The success of the model applications in the reference Brazilian Northeast agricultural region highlighted possibilities for replication in other environmental conditions, with probable calibrations of regression coefficients of the modeling equations, which can be done using simultaneous remote sensing and field evapotranspiration measurements. However, it was demonstrated that in the absence of field measurements to calibrate the regression coefficients for specific crops and environmental conditions, one can use the well-known Kc FAO approach, selecting pixels where the optimum root zone moisture conditions are ensured.
Author Contributions
Conceptualization, A.T., I.S. and J.L.; methodology, A.T. and J.L.; software, A.T. and C.T.; formal analysis, A.T.; investigation, A.T., I.S. and T.S.; resources, A.T., I.S.; data curation, A.T. and C.T.; writing—original draft preparation, A.T.; writing—review and editing, A.T., I.S. and J.L.; visualization, A.T., C.T. and T.S.; supervision, A.T. and I.S.; project administration, A.T. and I.S.; funding acquisition, A.T. and I.S. All authors have read and agreed to the published version of the manuscript.
Funding
This research was funded by Foundation for Support of Research and Technological Innovation of the State of Sergipe (FAPITEC), grant number 019203.01252/2024-0 and by National Council for Scientific and Technological Development (CNPq), grant number 311532/2021-7. The APC will be free if approved, as the first author is guest editor of the Special Issue where the paper will be submitted.
Institutional Review Board Statement
Not applicable.
Informed Consent Statement
Not applicable.
Data Availability Statement
Dataset available on request from the authors.
Conflicts of Interest
The authors declare no conflicts of interest. The funders had no role in the design of the study; in the collection, analysis, or interpretation of data; in the writing of the manuscript; or in the decision to publish the results.
Abbreviations
The following abbreviations are used in this manuscript:
| FAO | Food Agricultural Organization of the United Nations |
| GIS | Geographic Information Systems |
| IBGE | Instituto Brasileiro de Geografia e Estatística (in portuguese) |
| INMET | Instituto Nacional de Meteorologia (in portuguese) |
| MODIS | Moderate Resolution Imaging Spectroradiometer |
| SDG | Sustainable Development Goals |
| SAFER | Simple Algorithm for Evapotranspiration Retrieving |
References
- Chooyok, P.; Pumijumnog, N.; Ussawarujikulchai, A.T. The water footprint assessment of ethanol production from molasses in Kanchanaburi and Supanburi province of Thailand. Procedia APCBEE 2013, 5, 283–287. [Google Scholar] [CrossRef] [Scilit]
- Cristóbal, J.; Matos, C.T.; Aurambout, J.-P.; Manfredi, S.; Kavalov, B. Environmental sustainability assessment of bioeconomy value chains. Biomass Bioenergy 2016, 89, 159–171. [Google Scholar] [CrossRef] [Scilit]
- Rosa, J.M.; Junior, I.M.F.; de Melo, M.L.A.; Marin, F.R. Remote Sensing–driven ensemble smoother assimilation of LAI for regional sugarcane yield estimation. Remote Sens. App. Soc. Environ. 2016, 41, 101952. [Google Scholar] [CrossRef] [Scilit]
- Rudorf, B.F.T.; de Aguiar, D.A.; da Silva, W.F.; Sugawara, L.M.; Adami, M.; Moreira, M.A. Studies on the rapid expansion of sugarcane for ethanol production in São Paulo State (Brazil) using Landsat Data. Remote Sens. 2010, 2, 1057–1076. [Google Scholar] [CrossRef] [Scilit]
- Waclawovsky, A.J.; Sato, P.M.; Lembke, C.G.; Moore, P.H.; Souza, G.M. Sugarcane for bioenergy production: An assessment of yield and regulation of sucrose content. Plant Biotechnol. J. 2010, 8, 263–276. [Google Scholar] [CrossRef] [Scilit] [PubMed]
- Cerri, C.C.; Galdos, M.V.; Maia, S.M.F.; Bernoux, M.; Feigl, B.J.; Powlson, D.; Cerri, C.E.P. Effect of sugarcane harvesting systems on soil carbon stocks in Brazil: An examination of existing data. Eur. J. Soil Sci. 2011, 62, 23–28. [Google Scholar] [CrossRef] [Scilit]
- Jesus, K.R.E.; Torquato, S.A.; Machado, P.G.; Zorzo, C.R.B.; Cardoso, B.O.; Leal, M.R.L.V.; Picoli, M.C.A.; Ramos, R.C.; Dalmago, G.A.; Capitani, D.; et al. Sustainability assessment of sugarcane production systems: SustenAgro Decision Support System. Environ. Dev. 2019, 32, 100444. [Google Scholar] [CrossRef] [Scilit]
- Loarie, S.; Lobell, D.; Asner, G.; Mu, Q.; Field, C. Direct impacts on local climate of sugarcane expansion in Brazil. Nat. Clim. Change 2011, 2, 105–109. [Google Scholar] [CrossRef] [Scilit]
- Oliveira, M.R.; Pasqualetto, A.; Vieira, J.d.C.; de Castro, S.D. Os Impactos ambientais do setor sucroenergético e uso de indicadores de sustentabilidade. RDE-Rev. Desenvolv. Econ. 2022, 2, 315–341. [Google Scholar] [CrossRef] [Scilit]
- Godoi Neto, A.H.; Silva, E.F.d.F.; de Morais, J.E.F.; de Andrade, L.G.L.; Cutrim, W.d.O.; de Lacerda, C.F. Water potential, biochemical indicators and yield of sugarcane irrigated with brackish water and leaching. Rev. Bras. Eng. Agr. Amb. 2020, 24, 312–318. [Google Scholar] [CrossRef] [Scilit]
- Goldemberg, J.; Mello, F.; Cerri, C.P.; Davies, C.; Cerri, C.C. Meeting the global demand for biofuels in 2021 through sustainable land use change policy. Energy Policy 2014, 69, 14–18. [Google Scholar] [CrossRef] [Scilit]
- Mello, C.O.; Esperancini, M.S.T. Análise econômica da eficiência da produção de cana-de-açúcar de fornecedores do Estado do Paraná. Rev. Energy Agr. 2012, 27, 48–60. [Google Scholar] [CrossRef] [Scilit]
- Scarpare, F.V.; Hernandes, T.A.D.; Ruiz-Correa, S.T.; Kolln, O.T.; Gava, G.J.C.; Santos, L.N.S.; Victoria, R.L. Sugarcane water footprint under different management practices in Brazil: Tietê/Jacaré watershed assessment. J. Clean. Prod. 2016, 112, 4576–4584. [Google Scholar] [CrossRef] [Scilit]
- Zhang, H.; Anderson, R.G.; Wang, D. Satellite-based crop coefficient and regional water use estimates for Hawaiian sugarcane. Field Crops Res. 2015, 180, 143–154. [Google Scholar] [CrossRef] [Scilit]
- Beringer, T.; Lucht, W.; Schaphoff, S. Bioenergy production potential of global biomass plantations under environmental and agricultural constraints. GCB Bioenergy 2011, 3, 299–312. [Google Scholar] [CrossRef] [Scilit]
- Pacca, S.; Moreira, J.R. Historical carbon budget of the Brazilian ethanol program. Energy Policy 2009, 37, 4863–4873. [Google Scholar] [CrossRef] [Scilit]
- Rampazo, N.A.M.; Picoli, M.C.A.; Teixeira, A.H.d.C.; Cavaliero, C.K.N. Water Consumption Modeling by Coupling MODIS Images and Agrometeorological Data for Sugarcane Crops. Sugar Tech. 2020, 23, 524–535. [Google Scholar] [CrossRef] [Scilit]
- Anderson-Teixeira, K.J.; Snyder, P.K.; Twine, T.E.; Cuadra, S.V.; Costa, M.H.; DeLucia, E.H. Climate-regulation services of natural and agricultural ecoregions of the Americas. Nat. Clim. Change 2012, 2, 177–181. [Google Scholar] [CrossRef] [Scilit]
- Gunkel, G.; Kosmol, J.; Sobral, M.; Rohn, H.; Montenegro, S.; Aureliano, J. Sugar cane industry as a source of water pollution-case study on the situation in Ipojuca River, Pernambuco, Brazil. Water Air Soil Pollut. 2007, 180, 261–269. [Google Scholar] [CrossRef] [Scilit]
- Meyer, M.A.; Priess, J.A. Indicators of bioenergy-related certification schemes—An analysis of the quality and comprehensiveness for assessing local/regional environmental impacts. Biomass Bioenergy 2014, 65, 151–169. [Google Scholar] [CrossRef] [Scilit]
- Oliveira, B.; Moraes, E.; Benavides, M.C.; Mataveli, G. Improved Albedo estimates implemented in the METRIC model for modeling energy balance fluxes and evapotranspiration over agricultural and natural areas in the Brazilian Cerrado. Remote Sens. 2018, 10, 1181. [Google Scholar] [CrossRef] [Scilit]
- Teixeira, A.H.d.C.; Leivas, J.F.; Takemura, C.M.; Pacheco, E.P.; Garçon, E.A.M.; Sousa, I.F.; Almeida, A.Q.; Thenkabail, P.S.; Azevedo, A.F.M.S. Modeling and Monitoring Water Productivity by Using Geotechnologies. In Remote Sensing Handbook, 2nd ed.; Thenkabail, P.S., Ed.; CRC Press—Taylor & Francis: Boca Raton, FL, USA, 2024; Volume 5, pp. 383–421. [Google Scholar] [CrossRef] [Scilit]
- Farias, F.; Teixeira, A.; Sousa, I.; Leivas, J.; Takemura, C.; Garçon, E. Large-scale water balance modeling using remote sensing and weather data: Application in an agricultural growing region of the coastal northeast Brazil. Remote Sens. Appl. Soc. Environ. 2023, 32, 101072. [Google Scholar] [CrossRef] [Scilit]
- Procopio, S.d.O.; Cruz, M.A.S.; de Almeida, M.R.M.; de Jesus Junior, L.A.; Nogueira Junior, L.R.; de Carvalho, H.W.L. SEALBA: Região de Alto Potencial Agrícola no Nordeste Brasileiro; Embrapa Tabuleiros Costeiros: Aracaju, Brazil, 2019; p. 62. [Google Scholar]
- Allen, R.G.; Pereira, L.S.; Raes, D.; Smith, M. Crop Evapotranspiration-Guidelines for Computing Crop Water Requirements-FAO Irrigation and Drainage Paper 56; FAO: Rome, Italy, 1998; Volume 300, p. D05109. [Google Scholar]
- Woldemarian, G.W.; Awoke, B.G.; Maretto, R.V. Satellite-based energy balance for estimating actual sugarcane evapotranspiration in the Ethiopian Rift Valley. ISPRS J. Photogramm. Remote Sens. 2025, 223, 109–130. [Google Scholar] [CrossRef] [Scilit]
- da Silva, T.G.F.; Moura, S.M.; de Zolnier, B.; Soares, S.; Vieira, J.M.; Júnior, V.J.d.S. Demanda hídrica e eficiência do uso da água da cana-de-açúcar irrigada no semiárido brasileiro. Rev. Bras. Eng. Agr. Amb. 2011, 15, 1257–1265. [Google Scholar] [CrossRef] [Scilit]
- Peters, A.J.; Walter-Shea, E.A.; Ji, L.; Vina, A.; Hayes, M.; Svoboda, M.D. Drought monitoring with NDVI-based standardized vegetation index. Photogramm. Eng. Remote Sens. 2002, 68, 71–75. [Google Scholar]
- Hao, Z.; AghaKouchak, A. Multivariate Standardized Drought Index: A parametric multi-index model. Adv. Water Resour. 2013, 57, 12–18. [Google Scholar] [CrossRef] [Scilit]
- Vicente-Serrano, S.M.; Miralles, D.G.; Dominguez-Castrom, F.; Azorin-Molina, C.; El Kenawy, A.; McVicar, T.R.; Tomas-Burguera, M.; Begueria, S.; Maneta, M.; Pena-Gallardo, M. Global assessment of the standardized evapotranspiration deficit index (SEDI) for drought analysis and monitoring. J. Clim. 2018, 31, 5371–5393. [Google Scholar] [CrossRef] [Scilit]
- Zhang, G.; Su, X.; Singh, V.P.; Ayantobo, O. Appraising standardized moisture anomaly index (SZI) in drought projection across China under CMIP6 forcing scenarios. J. Hydrol. Reg. Stud. 2021, 37, 100898. [Google Scholar] [CrossRef] [Scilit]
- Ford, T.W.; Labosier, C.F. Meteorological conditions associated with the onset of flah drought in the Eastern United States. Agric. For. Meteorol. 2017, 247, 414–423. [Google Scholar] [CrossRef] [Scilit]
- Zhang, L.; Qiao, N.; Huang, C.; Wang, S. Monitoring drought effects on vegetation productivity using satellite solar-induced chlorophyllfluorescence. Remote Sens. 2019, 11, 378. [Google Scholar] [CrossRef] [Scilit]
- Kim, D.; Rhee, J. A drought index based on actual evapotranspiration from the Bouchet hypothesis. Geophys. Res. Lett. 2016, 43, 10277–10285. [Google Scholar] [CrossRef] [Scilit]
- Bastiaansssen, W.G.M.; Menenti, M.; Feddes, R.A.; Roerink, G.J.; Holtslag, A.A.M. A remote sensing surface energy balance algorithm for land (SEBAL) 1. Formulation. J. Hydrol. 1998, 212–213, 198–212. [Google Scholar] [CrossRef] [Scilit]
- Allen, R.G.; Tasumi, M.; Morse, A.; Trezza, R.; Wright, J.L.; Bastiaanssen, W.G.M.; Kramber, W.; Lorite, I.; Robison, C.W. Satellite-based energy balance for mapping evapotranspiration with internalized calibration (METRIC)—Applications. J. Irrig. Drain. Eng. 2007, 133, 395–406. [Google Scholar] [CrossRef] [Scilit]
- Teixeira, A.H.d.C. Determining regional actual evapotranspiration of irrigated and natural vegetation in the São Francisco River basin (Brazil) using remote sensing and Penman-Monteith equation. Remote Sens. 2010, 2, 1287–1319. [Google Scholar] [CrossRef] [Scilit]
- Tejera, N.A.; Rodes, R.; Ortega, E.; Campos, R.; Lluch, C. Comparative analysis of physiological characteristics and yield components in sugarcane cultivars. Field Crops Res. 2007, 102, 64–72. [Google Scholar] [CrossRef] [Scilit]
- De Bruin, H.; Stricker, J. Evaporation of grass under non-restricted soil moisture conditions. Hydrol. Sci. J. 2000, 45, 391–406. [Google Scholar] [CrossRef] [Scilit]
- Teixeira, A.H.d.C.; Bastiaanssen, W.G.M.; Ahmad, M.D.; Bos, M.G. Analysis of energy fluxes and vegetation-atmosphere parameters in irrigated and natural ecosystems of semi-arid Brazil. J. Hydrol. 2008, 362, 110–127. [Google Scholar]
- Venancio, L.P.; Mantovani, E.C.; do Amaral, C.H.; Neale, C.M.U.; Filgueiras, R.; Goncalves, I.Z.; da Cunha, F.F. Evapotranspiration mapping of commercial corn fields in Brazil using SAFER algorithm. Sci. Agric. 2021, 78, e20190261. [Google Scholar] [CrossRef] [Scilit]
- Omary, M.; Izuno, F.T. Evaluation of sugar-cane evapotranspiration from water table data in the everglades agricultural area. Agric. Water Manag. 1995, 27, 309–319. [Google Scholar] [CrossRef] [Scilit]
- Villalobos, F.J.; Testi, L.; Orgaz, F.; Garcia-Tejera, O.; Lopez-Bernal, A.; Gonzalez-Dugo, M.V.; Ballester-Lurbe, C.; Castel, J.R.; Alarcon-Cabanero, J.J.; Nicolas-Nicolas, E. Modelling canopy conductance and transpiration of fruit trees in Mediterranean areas: A simplified approach. Agric. For. Meteorol. 2013, 171, 93–103. [Google Scholar] [CrossRef] [Scilit]
- Filho, W.L.F.C.; Santos, T.V.; dos Santiago, D.B.; de Oliveira-Junior, J.F.; Amorim, R.F.C. Influence of meteorological variables on reference evapotranspiration in the State of Alagoas, Brazil, based on multivariate analysis. Model. Earth Syst. Environ. 2021, 7, 2215–2224. [Google Scholar] [CrossRef] [Scilit]
- Eksteen, A.; Singels, A.; Ngxaliwe, S. Water relations of two contrasting sugarcane genotypes. Field Crops Res. 2014, 168, 86–100. [Google Scholar] [CrossRef] [Scilit]
- Nassif, D.S.P.; Marin, F.R.; Costa, L.G. Evapotranspiration and transpiration coupling to the atmosphere of sugarcane in Southern Brazil: Scaling up from leaf to field. Sugar Tech. 2014, 16, 250–254. [Google Scholar] [CrossRef] [Scilit]
- Inman-Bamber, N.G.; McGlinchey, M.G. Crop coefficients and water-use estimate for sugarcane based on long-term Bowen ratio energy balance measurements. Field Crops Res. 2003, 83, 125–138. [Google Scholar] [CrossRef] [Scilit]
- Lu, N.; Chen, S.; Wilske, B.; Sun, G.; Chen, J. Evapotranspiration and soil water relationships in a range of disturbed and undisturbed ecosystems in the semi-arid Inner Mongolia, China. J. Plant Ecol. 2011, 4, 49–60. [Google Scholar] [CrossRef] [Scilit]
- Inman-Bamber, N.G.; Smith, D.M. Water relations in sugarcane and response to water deficits. Field Crops Res. 2005, 92, 185–202. [Google Scholar] [CrossRef] [Scilit]
- Huang, J.; Yu, H.; Guan, X.; Wang, G.; Guo, R. Accelerated dry land expansion under climate change. Nat. Clim. Change 2016, 6, 166. [Google Scholar] [CrossRef] [Scilit]
- Yang, Y.; Zhang, S.; Mcvicar, T.R.; Beck, H.E.; Zhang, Y.; Liy, B. Disconnection between trends of atmospheric drying and continental runoff. Water Resour. Res. 2018, 54, 4700–4713. [Google Scholar] [CrossRef] [Scilit]

Disclaimer/Publisher’s Note: The statements, opinions and data contained in all publications are solely those of the individual author(s) and contributor(s) and not of MDPI and/or the editor(s). MDPI and/or the editor(s) disclaim responsibility for any injury to people or property resulting from any ideas, methods, instructions or products referred to in the content. |
© 2026 by the authors. Licensee MDPI, Basel, Switzerland. This article is an open access article distributed under the terms and conditions of the Creative Commons Attribution (CC BY) license.