


Abstract
Energy-efficient operation of industrial thermal systems is a key requirement for sustainable manufacturing and resource-aware process design, particularly under environmental constraints such as dew-point conditions. In this context, minimizing energy consumption while maintaining stable thermal regulation is essential to reduce operational costs and improve system sustainability. This work presents an energy-aware experimental comparison of three control strategies—classical PID, fractional-order PID (FOPID), and hysteresis control—applied to a real thermoelectric thermal regulation system operating under dynamic ambient conditions and dew-point constraints. Unlike conventional control studies focused primarily on tracking performance, this research adopts a sustainability-oriented multi-criteria evaluation framework that explicitly positions energy consumption as a first-order assessment dimension alongside thermal regulation quality and control effort. A set of physically consistent performance indicators is introduced, including total energy consumption, control effort, energy-per-regulation metrics, and a global energy efficiency index, enabling a comprehensive assessment of industrial thermal control strategies from a resource efficiency perspective. Experimental results demonstrate that controller evaluation strongly depends on the inclusion of energy-based metrics. While PID control achieves competitive tracking performance with low error, FOPID provides the best overall trade-off between thermal accuracy and energy consumption, resulting in the highest energy efficiency index. In contrast, hysteresis control, despite its structural simplicity and robustness, leads to higher energy usage due to frequent switching dynamics, reducing its suitability for energy-constrained sustainable applications. The results highlight that thermal regulation near dew-point constraints should be evaluated through an energy-aware multi-criteria framework rather than through pure tracking metrics, enabling a more complete characterization of controller performance for sustainable industrial applications. The proposed framework provides a scalable methodology for evaluating and designing energy-efficient control strategies, supporting sustainable industrial operation and contributing to resource optimization principles aligned with circular economy objectives.
1. Introduction
Thermoelectric systems have become increasingly important in industrial applications due to their ability to provide precise thermal control, scalability, and operation without moving parts [1,2]. Their application range extends from building climate control and heat exchangers to distillation systems and atmospheric water generation devices [3,4]. Despite these advantages, their overall efficiency remains limited by the low coefficient of performance and the high sensitivity of the modules to operating conditions [5,6]. Consequently, the development of energy-efficient control strategies is a fundamental aspect of improving the thermal and energy performance of these systems. Temperature control in thermoelectric modules has traditionally been implemented using proportional–integral–derivative (PID) controllers, primarily due to their simplicity of implementation and operational robustness [7,8]. Nevertheless, the nonlinear nature of thermoelectric systems and their dependence on the operating point limit the performance of conventional linear controllers, particularly under conditions of strict thermal regulation or complex transient dynamics [9]. To mitigate these limitations, variants such as fuzzy control and machine learning-based adaptive schemes have been proposed [10], although these methods increase computational and implementation complexity. In parallel, the fractional PID controller (FOPID) has emerged as a flexible alternative capable of improving the trade-off between robustness and dynamic performance by generalizing the integration and derivative operators [11,12]. Various studies have demonstrated its effectiveness in nonlinear thermal systems and industrial processes with significant delays [13]. Recently, hybrid strategies based on PSO-optimized FOPID control and adaptive supervision have been proposed for embedded thermoelectric thermal regulation, demonstrating improvements in dynamic stability and energy efficiency under complex thermal constraints [14]. However, the advantage of these strategies over classical schemes is not universal and depends heavily on the operating regime, environmental conditions, and the objective function under consideration. On the other hand, hysteresis control remains widely used in industrial applications due to its structural simplicity and robustness against model uncertainties, although with a significant trade-off in terms of energy consumption and thermal oscillations [15].
Despite advances in control strategies, most studies focus exclusively on thermal tracking metrics, without explicitly considering the energy cost associated with the system’s dynamic control. This limitation is particularly relevant in industrial applications where energy efficiency is a determining factor within current sustainability and circular economy frameworks. This article analyzes the thermal control problem in thermoelectric systems operating near the dew point, a physically meaningful constraint with dual operational interpretation. In industrial applications, the dew point represents an upper thermal limit that must not be violated, as surface temperatures below this threshold trigger condensation, potentially causing corrosion, electrical faults, or product contamination. Conversely, in atmospheric water generation (AWG) applications, operating below the dew point is precisely the control objective, as sustained condensation on the cold surface enables water extraction from humid ambient air. This duality makes the dew point a natural reference for evaluating thermal controllers under physically constrained conditions relevant to both domains. In both cases, the dew point is computed in real time from ambient temperature and relative humidity using the Magnus–Tetens formulation, ensuring that the control reference is physically consistent with instantaneous environmental conditions rather than a fixed laboratory setpoint.
The objective of this study is to compare three control strategies—hysteresis, classical PID, and fractional PID (FOPID)—using a multi-criteria evaluation framework that integrates thermal performance and energy efficiency. Unlike formal multi-objective optimization procedures, the proposed framework assesses the energy–accuracy trade-off space through systematic window-based analysis, as will be shown later in the results section, without assuming a predefined optimization criterion or search procedure. Metrics are proposed that allow the system to be characterized from an energy, dynamic, and stability perspective, including total energy consumption, control effort, tracking error, and energy per time in band. Different operating regimes are identified where each strategy presents relative advantages, demonstrating that system performance cannot be evaluated solely based on tracking error, but rather as a multi-objective optimization problem dependent on the energy-dynamic regime.
This work contributes to the understanding of thermal control in sustainable industrial systems through three specific novelties: (i) the introduction of a physically consistent energy-aware evaluation framework for thermoelectric controllers, incorporating metrics such as TEI, EPR, and a dynamic smoothness index not previously applied in this context; (ii) the experimental characterization of controller performance under a time-varying dew-point reference computed in real time from ambient conditions, representing a physically constrained tracking scenario absent from prior comparative studies; and (iii) the identification of distinct energy–accuracy operating regimes for hysteresis, PID, and FOPID controllers, providing application-specific selection criteria for sustainable thermal management systems. More advanced strategies, including adaptive and intelligent control approaches, have been explored by the authors in a companion study [14], where a PSO-optimized FOPID with rule-based adaptive supervision was shown to outperform static controllers in transient response and steady-state precision. The present work complements that study by establishing the energy-oriented baseline evaluation framework against which such advanced strategies can be systematically benchmarked under dew-point operating constraints.
2. Methodology
2.1. Experimental System
The experimental system developed in this work allows for the characterization of the thermal dynamics of a thermoelectric cell under different control strategies. The core of the system is based on an ETH-241-10-13-E-H1 Peltier module [16], which is coupled to an aluminum heat sink with active cooling on its hot side, while the cold side is connected to a thermal inertia block designed to stabilize heat exchange and improve the repeatability of measurements. This setup allows for the reproduction of controlled operating conditions in which the surface temperature can be regulated with high temporal resolution, facilitating the analysis of the dynamic behavior of the controllers under evaluation.
2.2. Instrumentation and Data Acquisition
Temperature measurement on the cold surface is performed using a 10 kΩ NTC thermistor, model USP16673 (Littelfuse Inc., Rosemont, IL, USA) [17], configured in a precision voltage divider. The acquired signal is digitized by an Arduino Nano 33 IoT microcontroller (Arduino S.r.l., Monza, Italy), which executes the control algorithm in real time and generates the PWM signal applied to the thermoelectric system. To reduce noise associated with actuator switching and electromagnetic interference from the ventilation system, the temperature signal is filtered using a 50-sample moving average implemented at the firmware level.
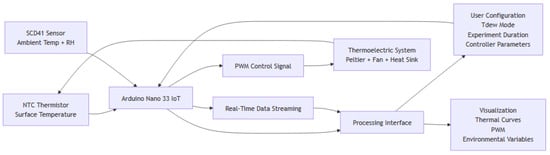
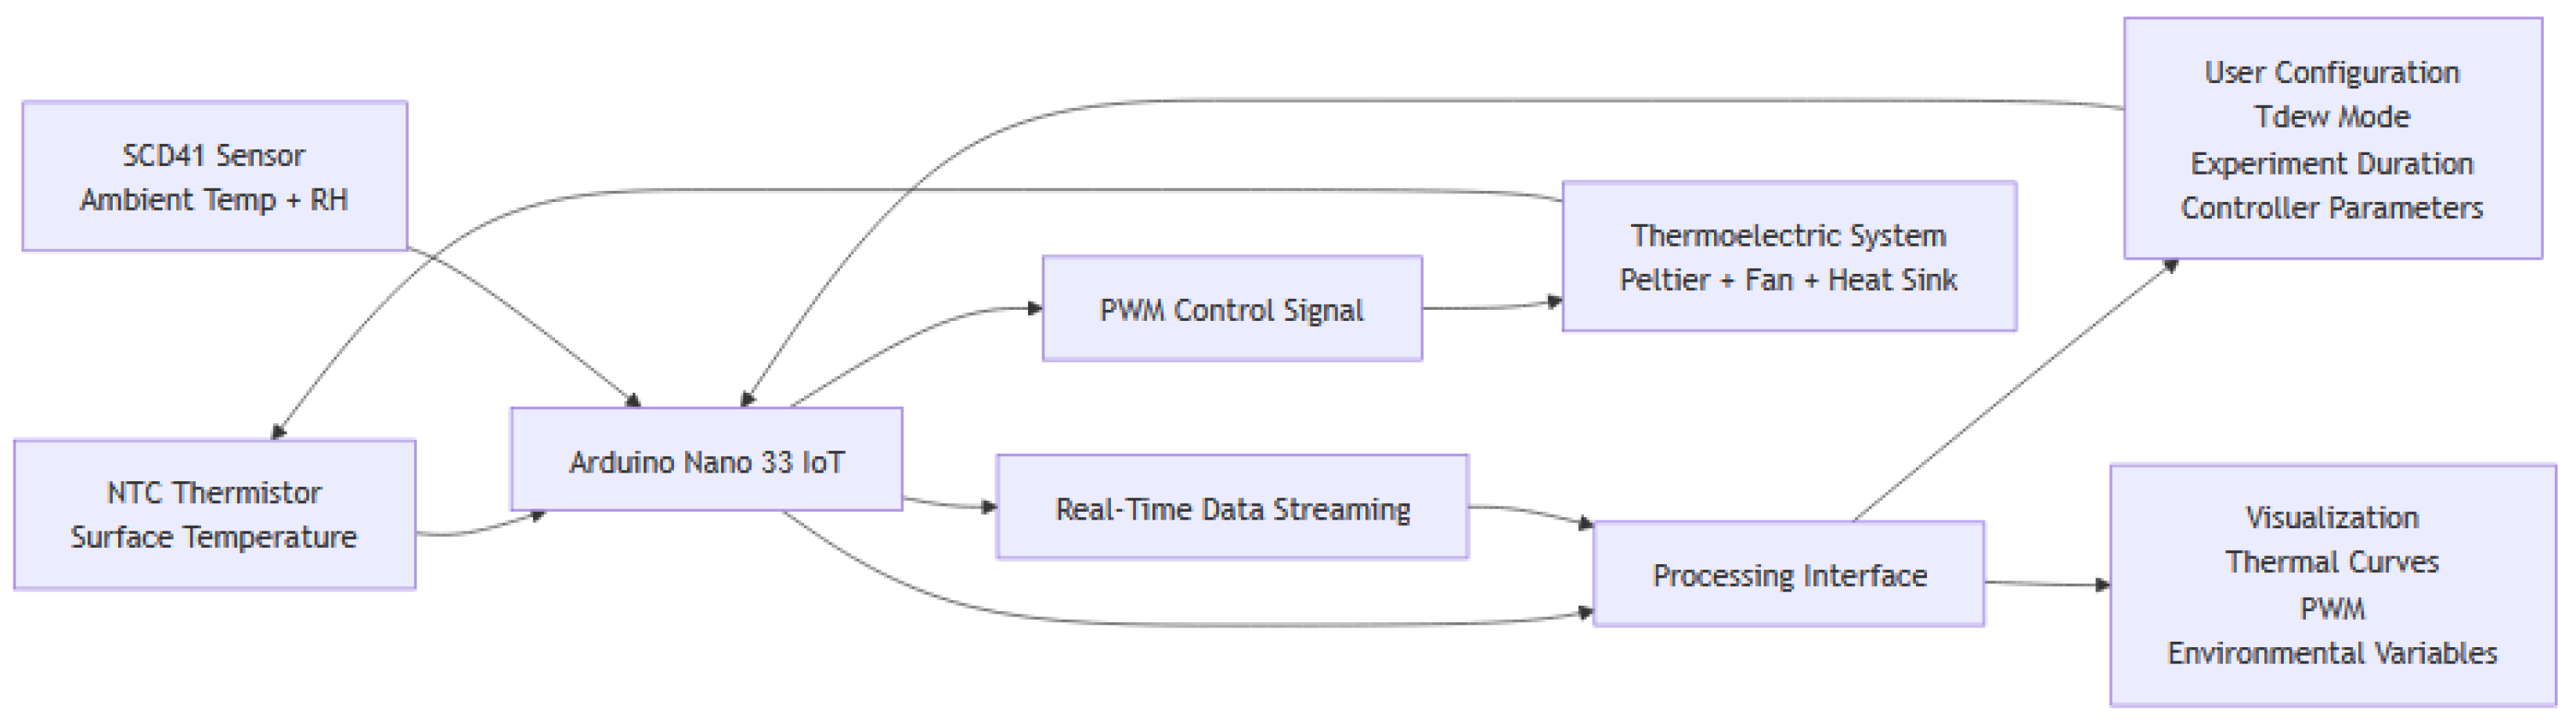
The system is connected to a monitoring interface developed in Processing, which enables two-way communication via a serial port. Controller parameters, the setpoint temperature, and the duration of each experiment are sent from this interface. At the same time, the system’s status variables are recorded in real time. Additionally, environmental and electrical variables are monitored, including ambient temperature and relative humidity via a Sensirion SCD41 sensor (Sensirion, Westlake Village, CA, USA) [18], as well as the voltage and current supplied to the system, which allows for the estimation of instantaneous power consumption. The SCD41 sensor provides temperature measurements with a typical accuracy of °C (15–35 °C range) and relative humidity accuracy of %RH, which propagate through the Magnus–Tetens formulation to an estimated dew-point uncertainty of approximately –1 °C, consistent with the error magnitudes observed experimentally. Figure 1 presents the general architecture of the experimental system, including the acquisition of thermal and environmental variables, communication with the monitoring interface, and the generation of the PWM signal applied to the thermoelectric module.
Figure 1.
General architecture of the experimental system used for thermal control of the thermoelectric module.
2.3. Implemented Control Strategies
Three control strategies were implemented for the thermoelectric system with the aim of regulating the surface temperature to a thermal reference associated with the dew point or to a target temperature .
2.3.1. Hysteresis Control
Hysteresis control is based on a binary switching logic applied to the thermal error signal:
defining two activation and deactivation thresholds and . The control action on the Peltier actuator is expressed as:
where directly modulates the system’s PWM signal.
2.3.2. PID Control
Classic PID control is defined by the combination of proportional, integral, and derivative actions:
In discrete implementation, this signal is saturated and mapped to PWM within the actuator’s allowed range.
2.3.3. FOPID Control
Fractional PID (FOPID) control extends the previous formulation using non-integer-order operators:
where and represent the fractional integration and differentiation operators, defined in the Caputo sense, and numerically approximated using finite memory.
The parameters of each control strategy are summarized in Table 1. The PID and FOPID controllers were tuned offline using Particle Swarm Optimization (PSO) in MATLAB R2025b, minimizing a composite criterion combining ITAE and energy consumption, consistent with the methodology described in [14]. The FOPID fractional operators were discretized using the Grünwald–Letnikov finite-memory approximation with memory length M = 30 and sampling period Ts = 0.1 s. The hysteresis thresholds were determined experimentally, yielding an effective switching band of approximately °C around the dew-point reference.
Table 1.
Controller parameters used in the experimental evaluation.
2.4. Variable Model and Metrics
The system is analyzed as a tracking problem of a thermal reference physically coupled to the environment. In particular, the controller’s setpoint temperature is defined as a time-dependent signal associated with the ambient dew point, such that:
Consequently, the control problem is formulated as a tracking problem of a time-varying thermal trajectory determined by environmental conditions. Consequently, the control error is expressed as:
where represents the surface temperature and the dew point temperature estimated from ambient conditions. This formulation ensures consistency between the tracking reference and the time-varying ambient conditions. The energy consumed by the system is calculated as:
where is the instantaneous electrical power. The energy boundary includes the total electrical power consumed by both the Peltier module and the cooling fan, such that encompasses all active control devices.
The mean absolute error and the mean squared error are defined as:
The control effort is defined in terms of energy based on the electrical power associated with the operation of the devices:
where represents the total electrical power consumed by the control actions applied to the thermoelectric module and the ventilation system. This formulation ensures physical consistency by expressing the control effort in terms of energy rather than in terms of PWM signal magnitude.
The settling time is calculated as the first instant at which the error enters and remains within a tolerance band of :
The energy per time in band (EPR) is defined as:
where E is the total energy consumed during the experiment, is the cumulative time during which the system satisfies the condition , and is a regularization constant that prevents numerical singularities as .
To evaluate the energetic effectiveness of the controllers, a window-based energy cost metric was introduced. For each controller, the accumulated electrical energy increase and the corresponding variation in thermal error were computed using sliding windows of 30 s duration. Only windows exhibiting a net reduction in thermal error ( °C) were retained. The energy cost of error reduction was defined as:
where represents the electrical energy required to reduce the thermal error by one degree Celsius over the observation window. This formulation avoids derivative-based singularities and provides a direct physical interpretation of controller effectiveness in terms of energy expenditure per unit of thermal improvement. To improve robustness against extreme operating conditions, values above the 99th percentile of the resulting distribution were excluded prior to statistical analysis and visualization.
The thermal-energy efficiency index (TEI) is defined as a dimensionless relative metric based on a reference controller. In this study, the PID controller is selected as the baseline, relative to which the total energy consumption and the mean absolute error are normalized:
where E represents the total energy consumed by the system and the mean absolute error. The TEI index quantifies the overall trade-off between energy efficiency and thermal accuracy relative to a baseline controller. The PID controller is selected as the baseline due to its widespread use as the industrial standard in thermoelectric thermal control systems [7,8]. A TEI value greater than 1 indicates a more favourable energy–accuracy balance than the baseline, achieved either through lower energy consumption, lower thermal error, or a combination of both. Importantly, TEI does not require simultaneous improvement in both dimensions; a controller may compensate marginally higher energy consumption with significantly lower thermal error and still obtain TEI > 1. To verify that the choice of baseline does not bias the conclusions, the TEI was computed using all three controllers as reference. The ordinal ranking FOPID > PID > Hysteresis was found invariant to the choice of baseline, as summarized in Table 2, confirming the robustness of the proposed index.
Table 2.
TEI sensitivity analysis: ordinal ranking is invariant to the choice of reference controller.
This formulation eliminates dimensional dependencies and allows for a direct comparison between control strategies under the same experimental conditions.
2.5. Experimental Procedure
Each control strategy was evaluated independently under uncontrolled laboratory ambient conditions, with ambient temperature and relative humidity allowed to vary naturally. To ensure consistency of results, each experiment was repeated three times. The ambient conditions recorded during each experiment are summarized in Table 3.
Table 3.
Ambient conditions recorded during each experimental campaign.
The dew-point temperature was computed in real time from and using the Magnus–Tetens formulation [19], implemented directly in the embedded firmware:
Although ambient conditions were not actively controlled, the variation across experiments was limited to °C in and % in , representing realistic indoor laboratory conditions. The dynamic formulation of implicitly incorporates ambient variability into the control reference, ensuring that each controller is evaluated against a physically consistent time-varying target. In each trial, the main system variables were recorded, including the cold surface temperature , the dew point temperature , and the ambient temperature . Additionally, relative humidity was measured, and the PWM control signals applied to the thermoelectric actuator and the fan were recorded. Finally, the instantaneous electrical power was calculated from the system’s electrical variables. Based on these signals, the energy, thermal, and dynamic performance metrics presented in the results section were calculated.
To evaluate the consistency of the tests, the three repetitions of each controller were analyzed. The mean standard deviation and coefficient of variation (CV) of the thermal error were used as indicators of repeatability, as shown in Table 4.
Table 4.
Experimental repeatability indicators for the evaluated controllers.
These results indicate that the hysteresis controller exhibits the highest repeatability, while the FOPID introduces greater variability in the thermal dynamics, consistent with its greater sensitivity to disturbances and initial conditions. To further assess the statistical significance of the observed differences, pairwise Welch t-tests and Cohen’s d effect sizes were computed across the three repetitions of each controller, as summarized in Table 5 and Table 6.
Table 5.
Statistical summary of MAE and RMSE across three repetitions (mean ± 95% CI, t-distribution, ).
Table 6.
Pairwise Welch t-test and Cohen’s d effect size ( per group).
Although limits statistical power for detecting small differences, the Cohen’s d effect sizes confirm that the observed differences between hysteresis and the continuous controllers are extremely large in practical magnitude ( for all metrics), supporting the validity of the comparative conclusions. The non-significant RMSE difference between PID and FOPID (, ) is consistent with the marginal numerical difference between their RMSE values (1.787 vs. 1.805 °C), while their MAE difference remains statistically significant (, ).
2.6. Data Processing
The acquired signals were temporally aligned by interpolation to a common time frame based on the PID controller signal. From this unified frame, the thermal error was defined as , from which its dynamics were obtained using discrete finite differences. The error dynamics were smoothed by applying a one-dimensional Gaussian filter to the discrete derivative, with the aim of reducing the amplification of numerical noise associated with the differentiation operation. Additionally, the settling time was estimated using a condition based on sliding time windows regarding compliance with a defined error band, while steady-state statistics were calculated over the final portion of the experiment’s time horizon. This processing ensures a consistent comparison between controllers on a common time basis, allowing for the evaluation of energy and thermal performance metrics.
3. Results
The experimental results obtained for the hysteresis, PID, and FOPID control strategies allow for an analysis of the thermal and energy behavior of the thermoelectric system under different control dynamics. The analysis includes metrics for accuracy, energy consumption, dynamic stability, and transient response, with an emphasis on the relationship between thermal performance and energy efficiency.
3.1. Overall Thermal and Energy Performance
Table 7 summarizes the fundamental metrics of thermal performance, energy consumption, and control efficiency for the three evaluated strategies: hysteresis control, PID, and FOPID. In terms of tracking accuracy, the FOPID controller exhibits the lowest mean absolute error (MAE = 0.84 °C), while the PID controller achieves a marginally lower RMSE (1.78 °C versus 1.80 °C for FOPID), indicating that both controllers perform comparably in terms of quadratic error, with FOPID showing a slight advantage in sustained small deviations, while the hysteresis controller shows the poorest performance in dew point tracking. However, this superior performance in terms of error does not necessarily imply an overall advantage when both energy and system dynamics metrics are considered simultaneously.
Table 7.
Overall energy and thermal performance metrics for the evaluated controllers.
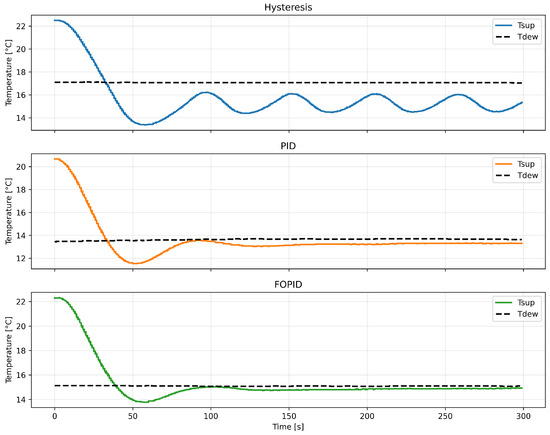
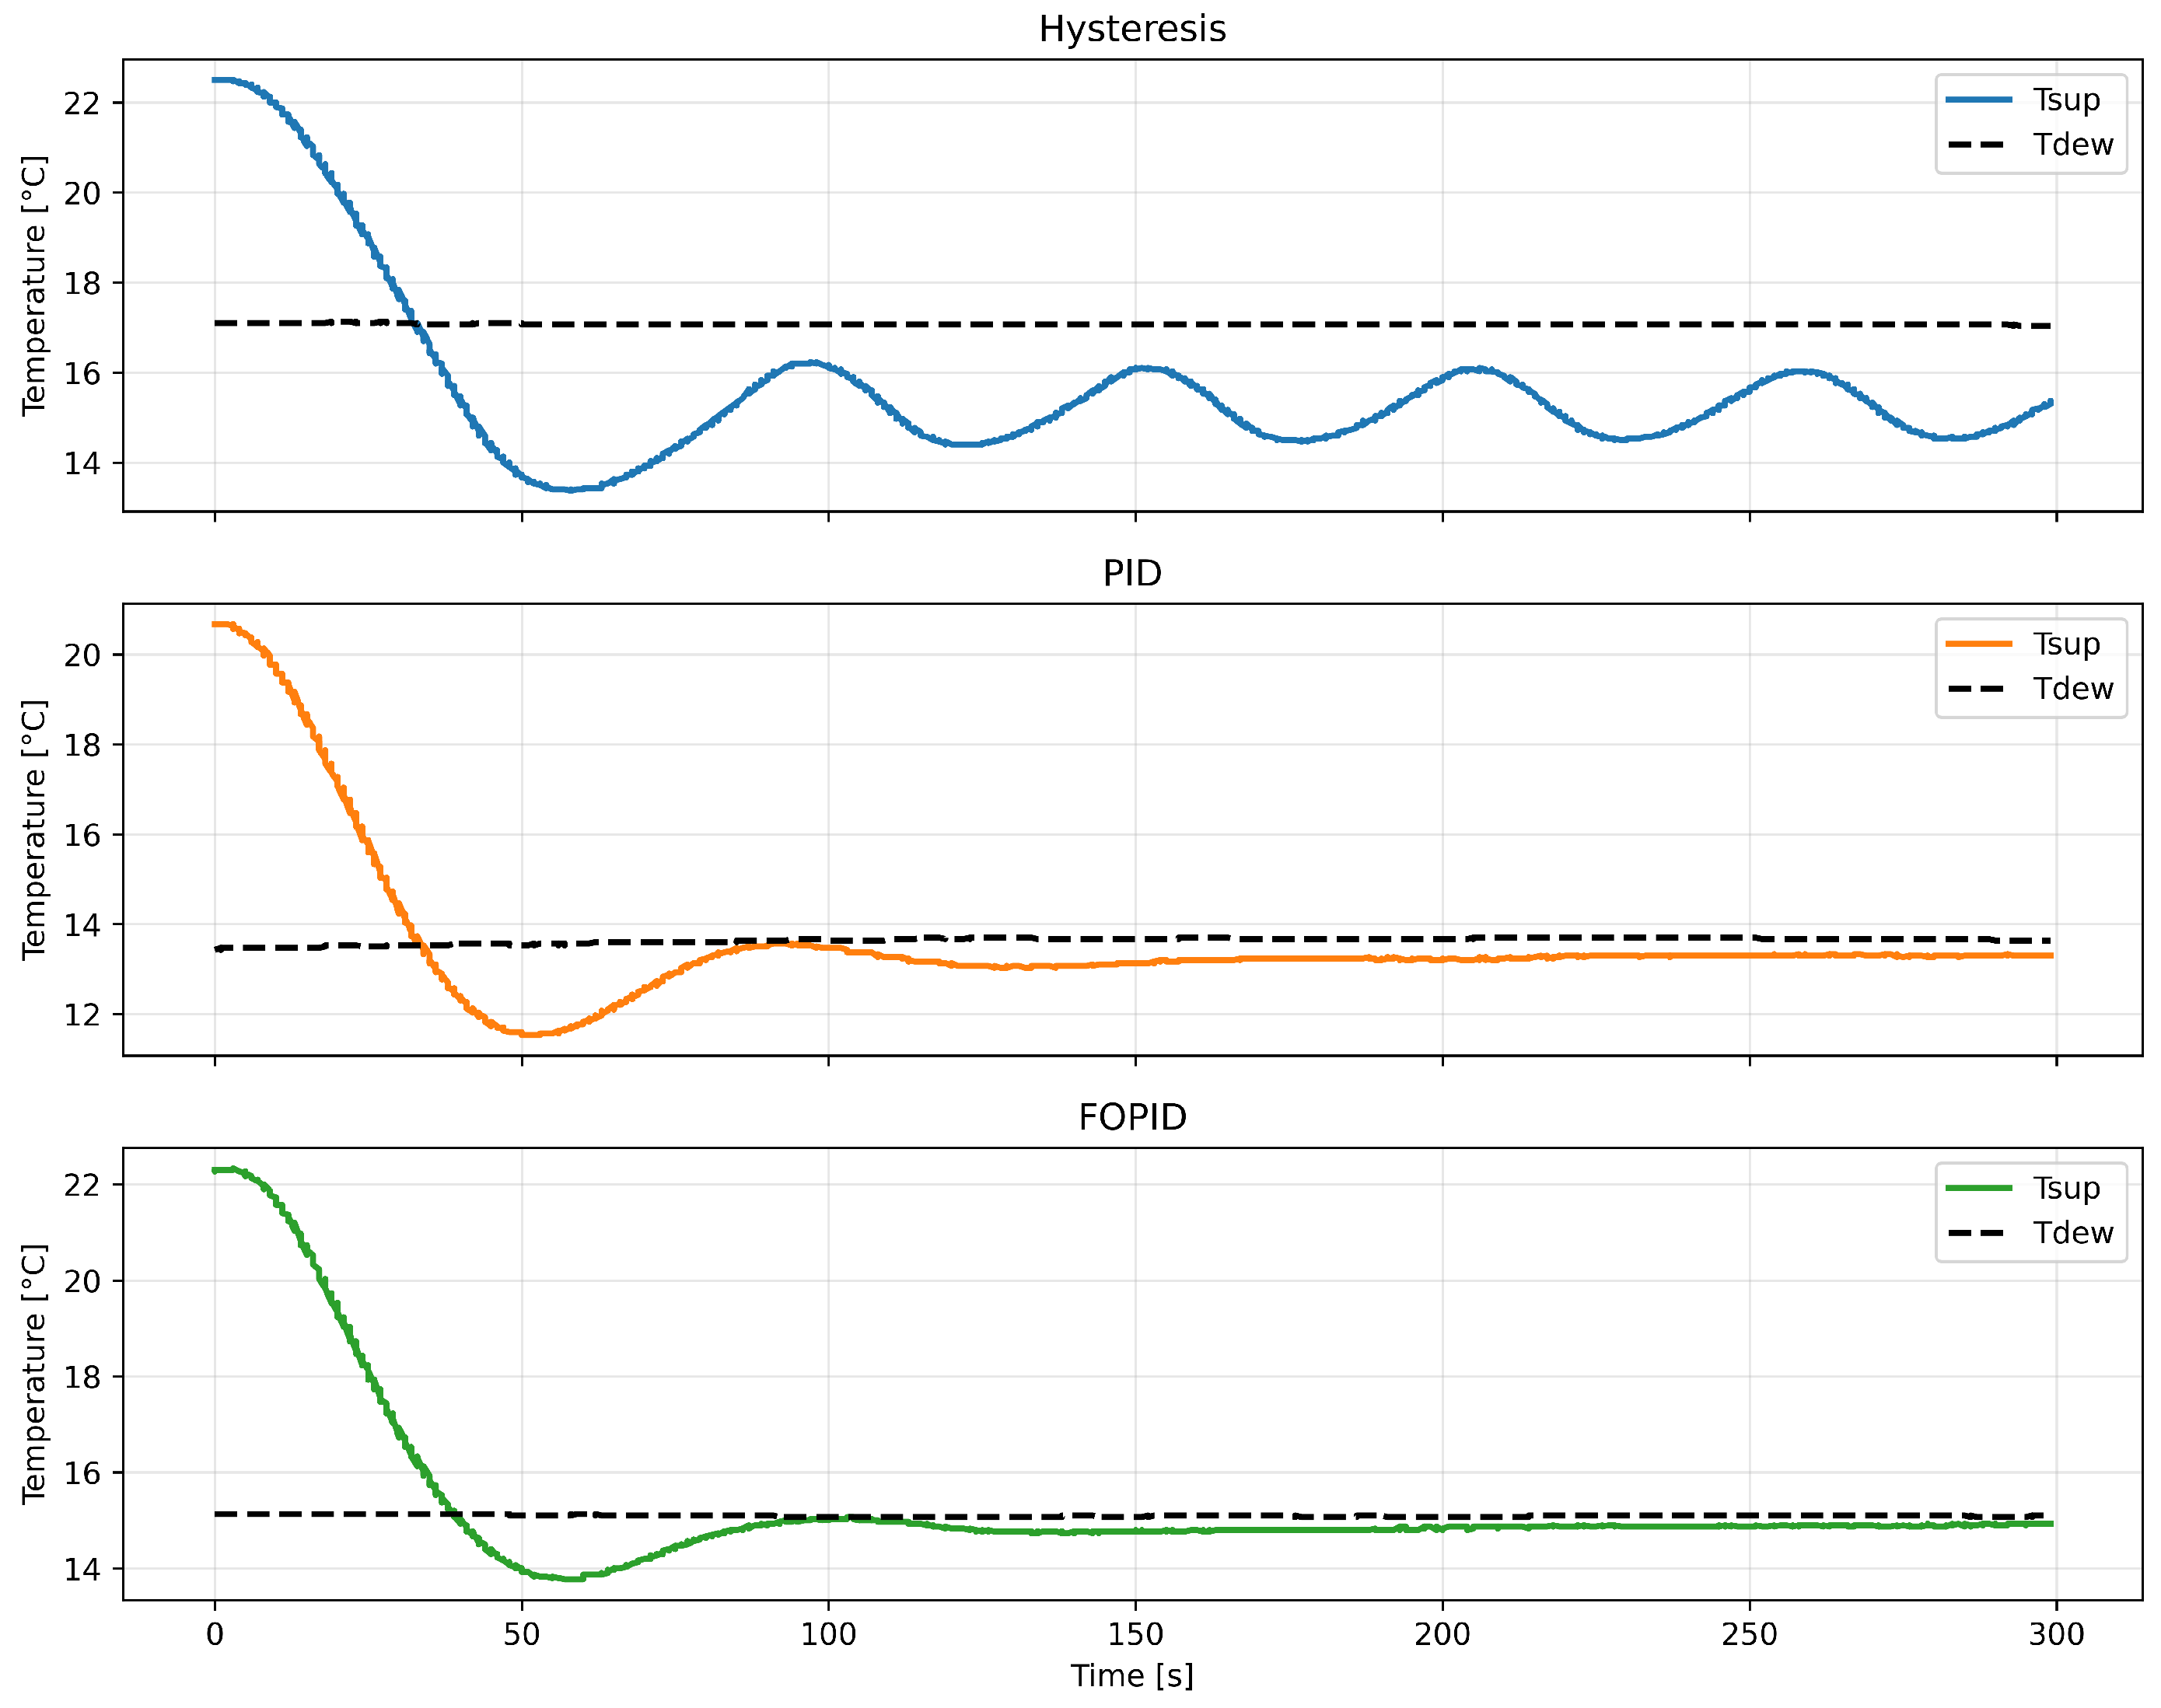
Total energy consumption is slightly lower for the PID controller, although very close to that of the FOPID controller, while the hysteresis strategy exhibits the highest energy consumption. In this regard, the TEI (total energy–error) indicator clearly favors the FOPID controller, followed by the PID controller, demonstrating a better trade-off between accuracy and energy consumption in the optimized fractional approach. Figure 2 shows the evolution of the surface temperature along with the dew point for each control strategy.
Figure 2.
Thermal tracking response of the system. The evolution of the surface temperature relative to the dew point is shown for the three controllers evaluated.
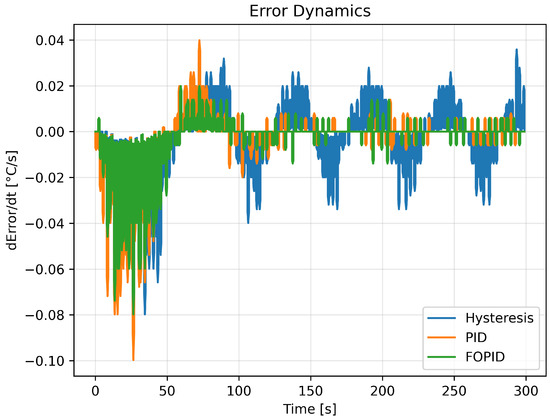
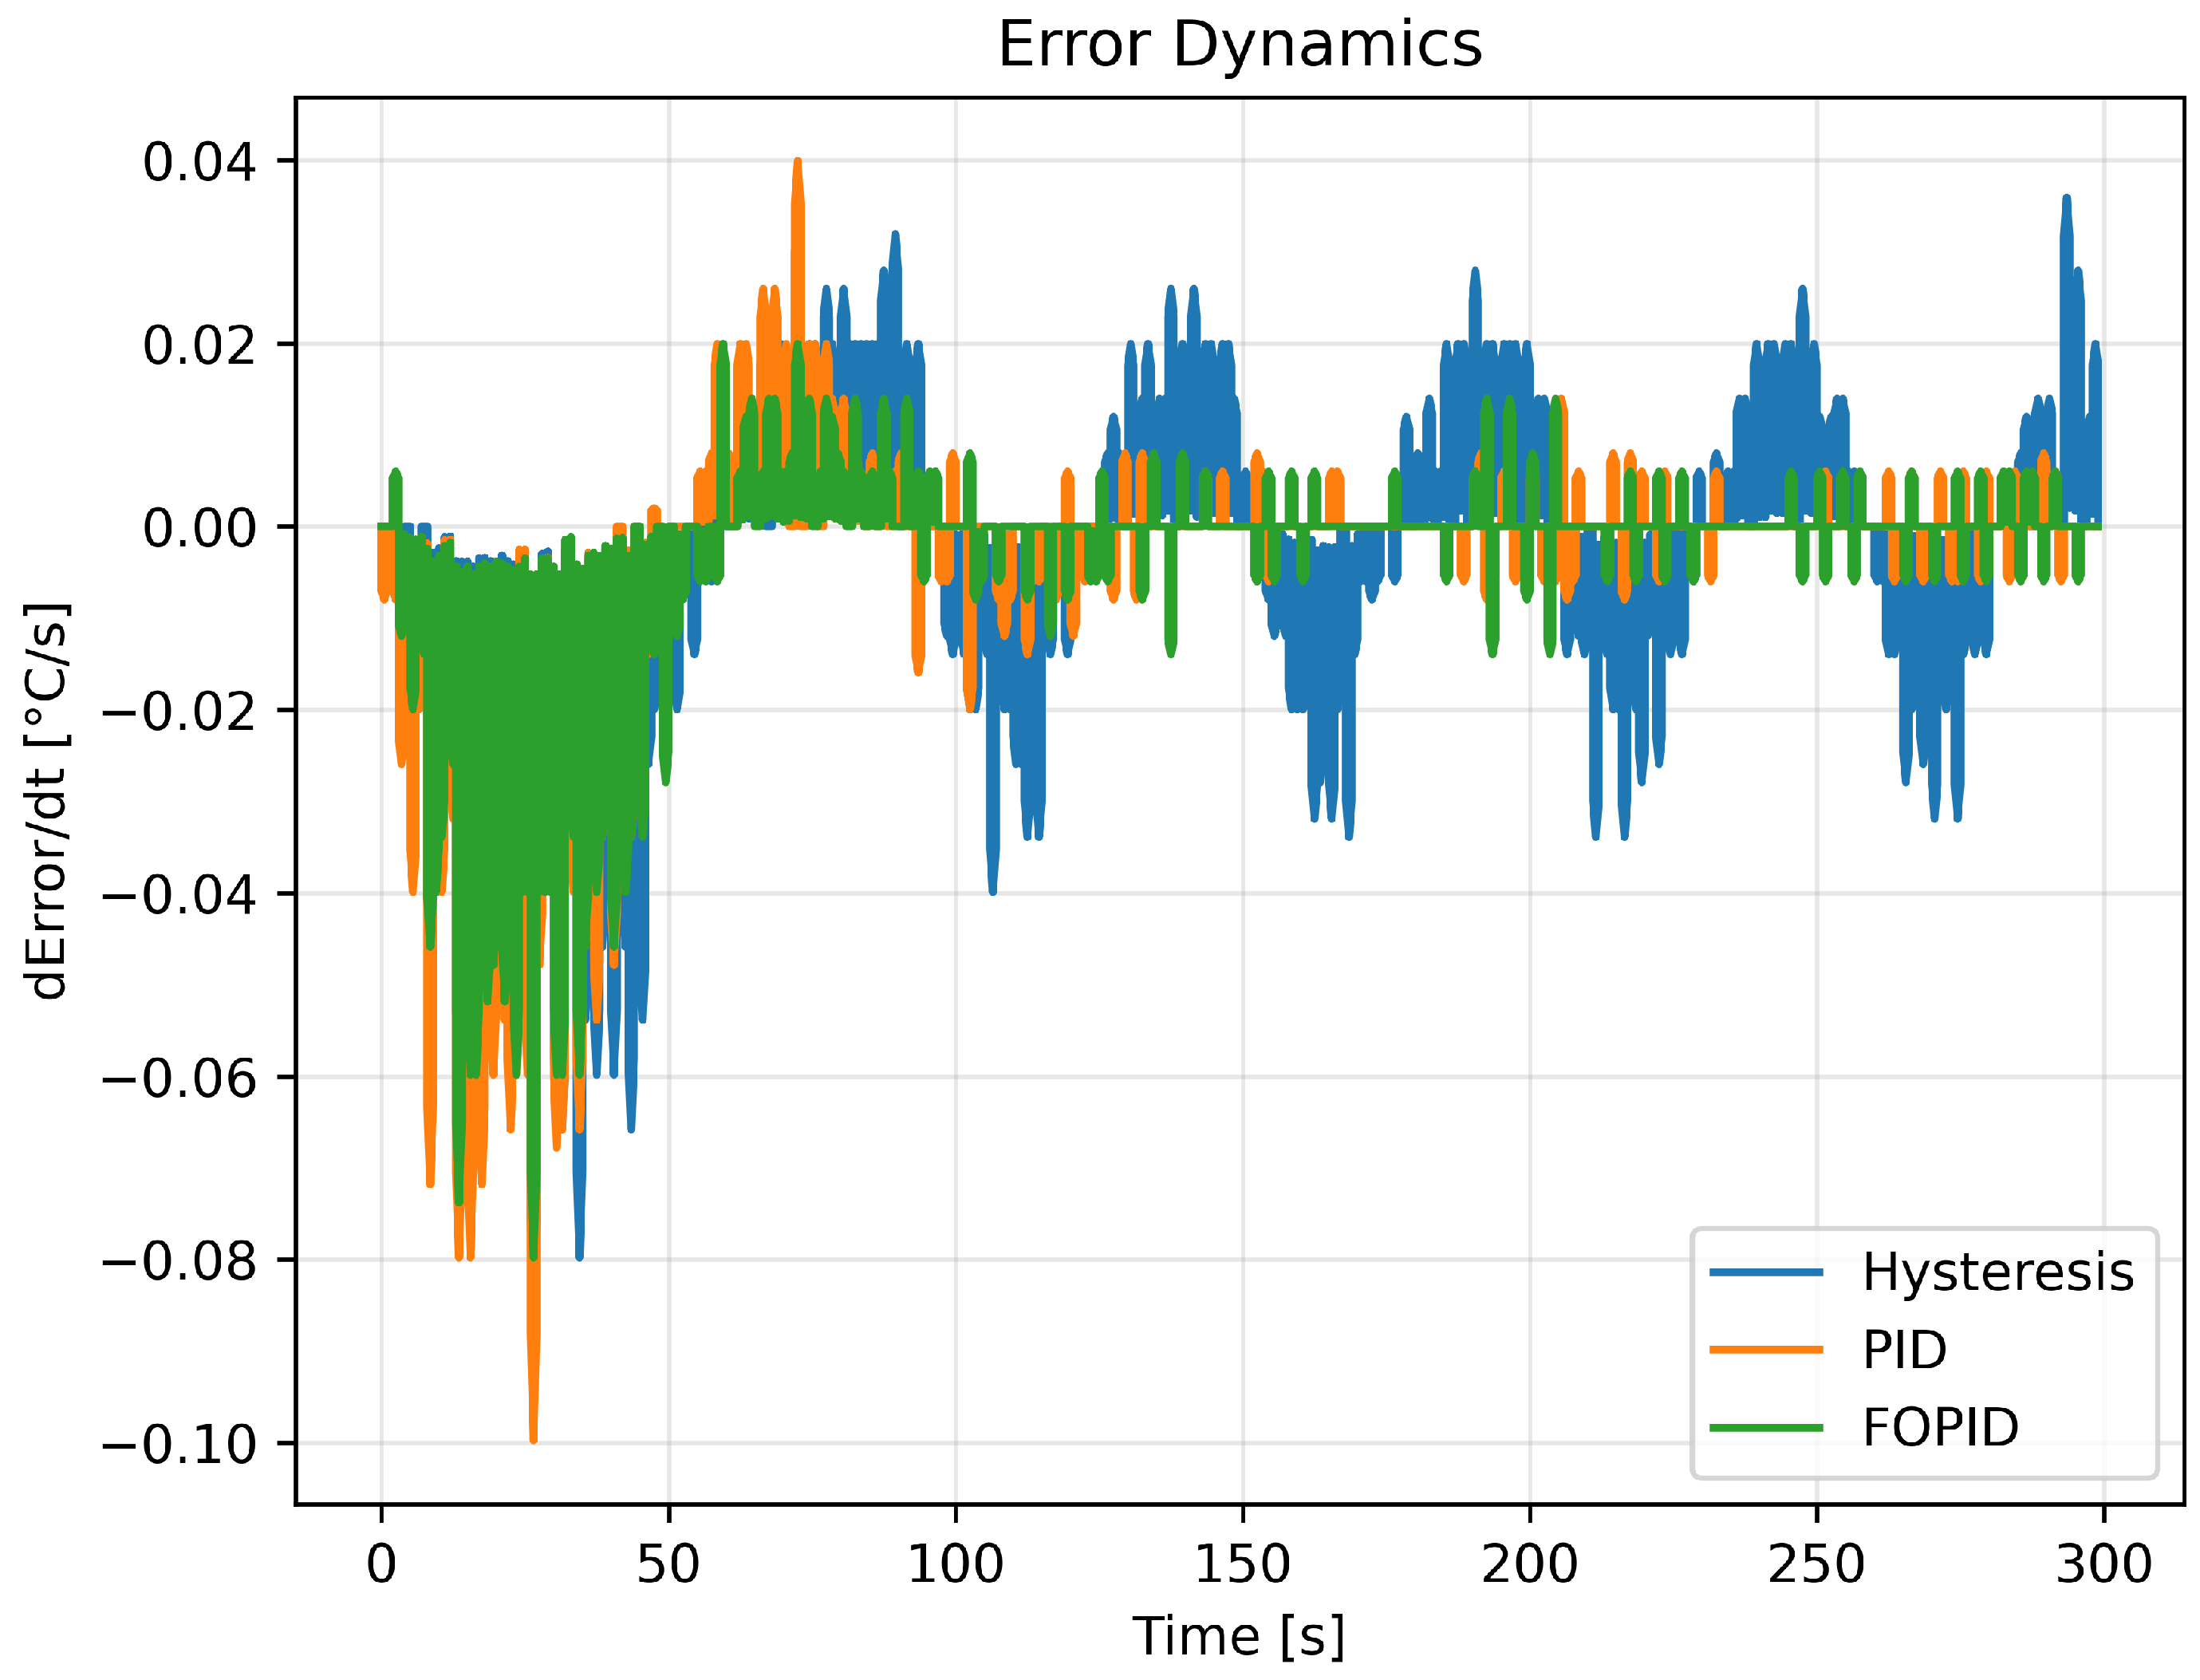
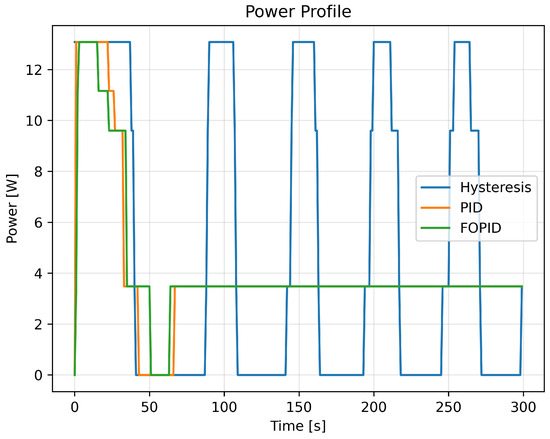
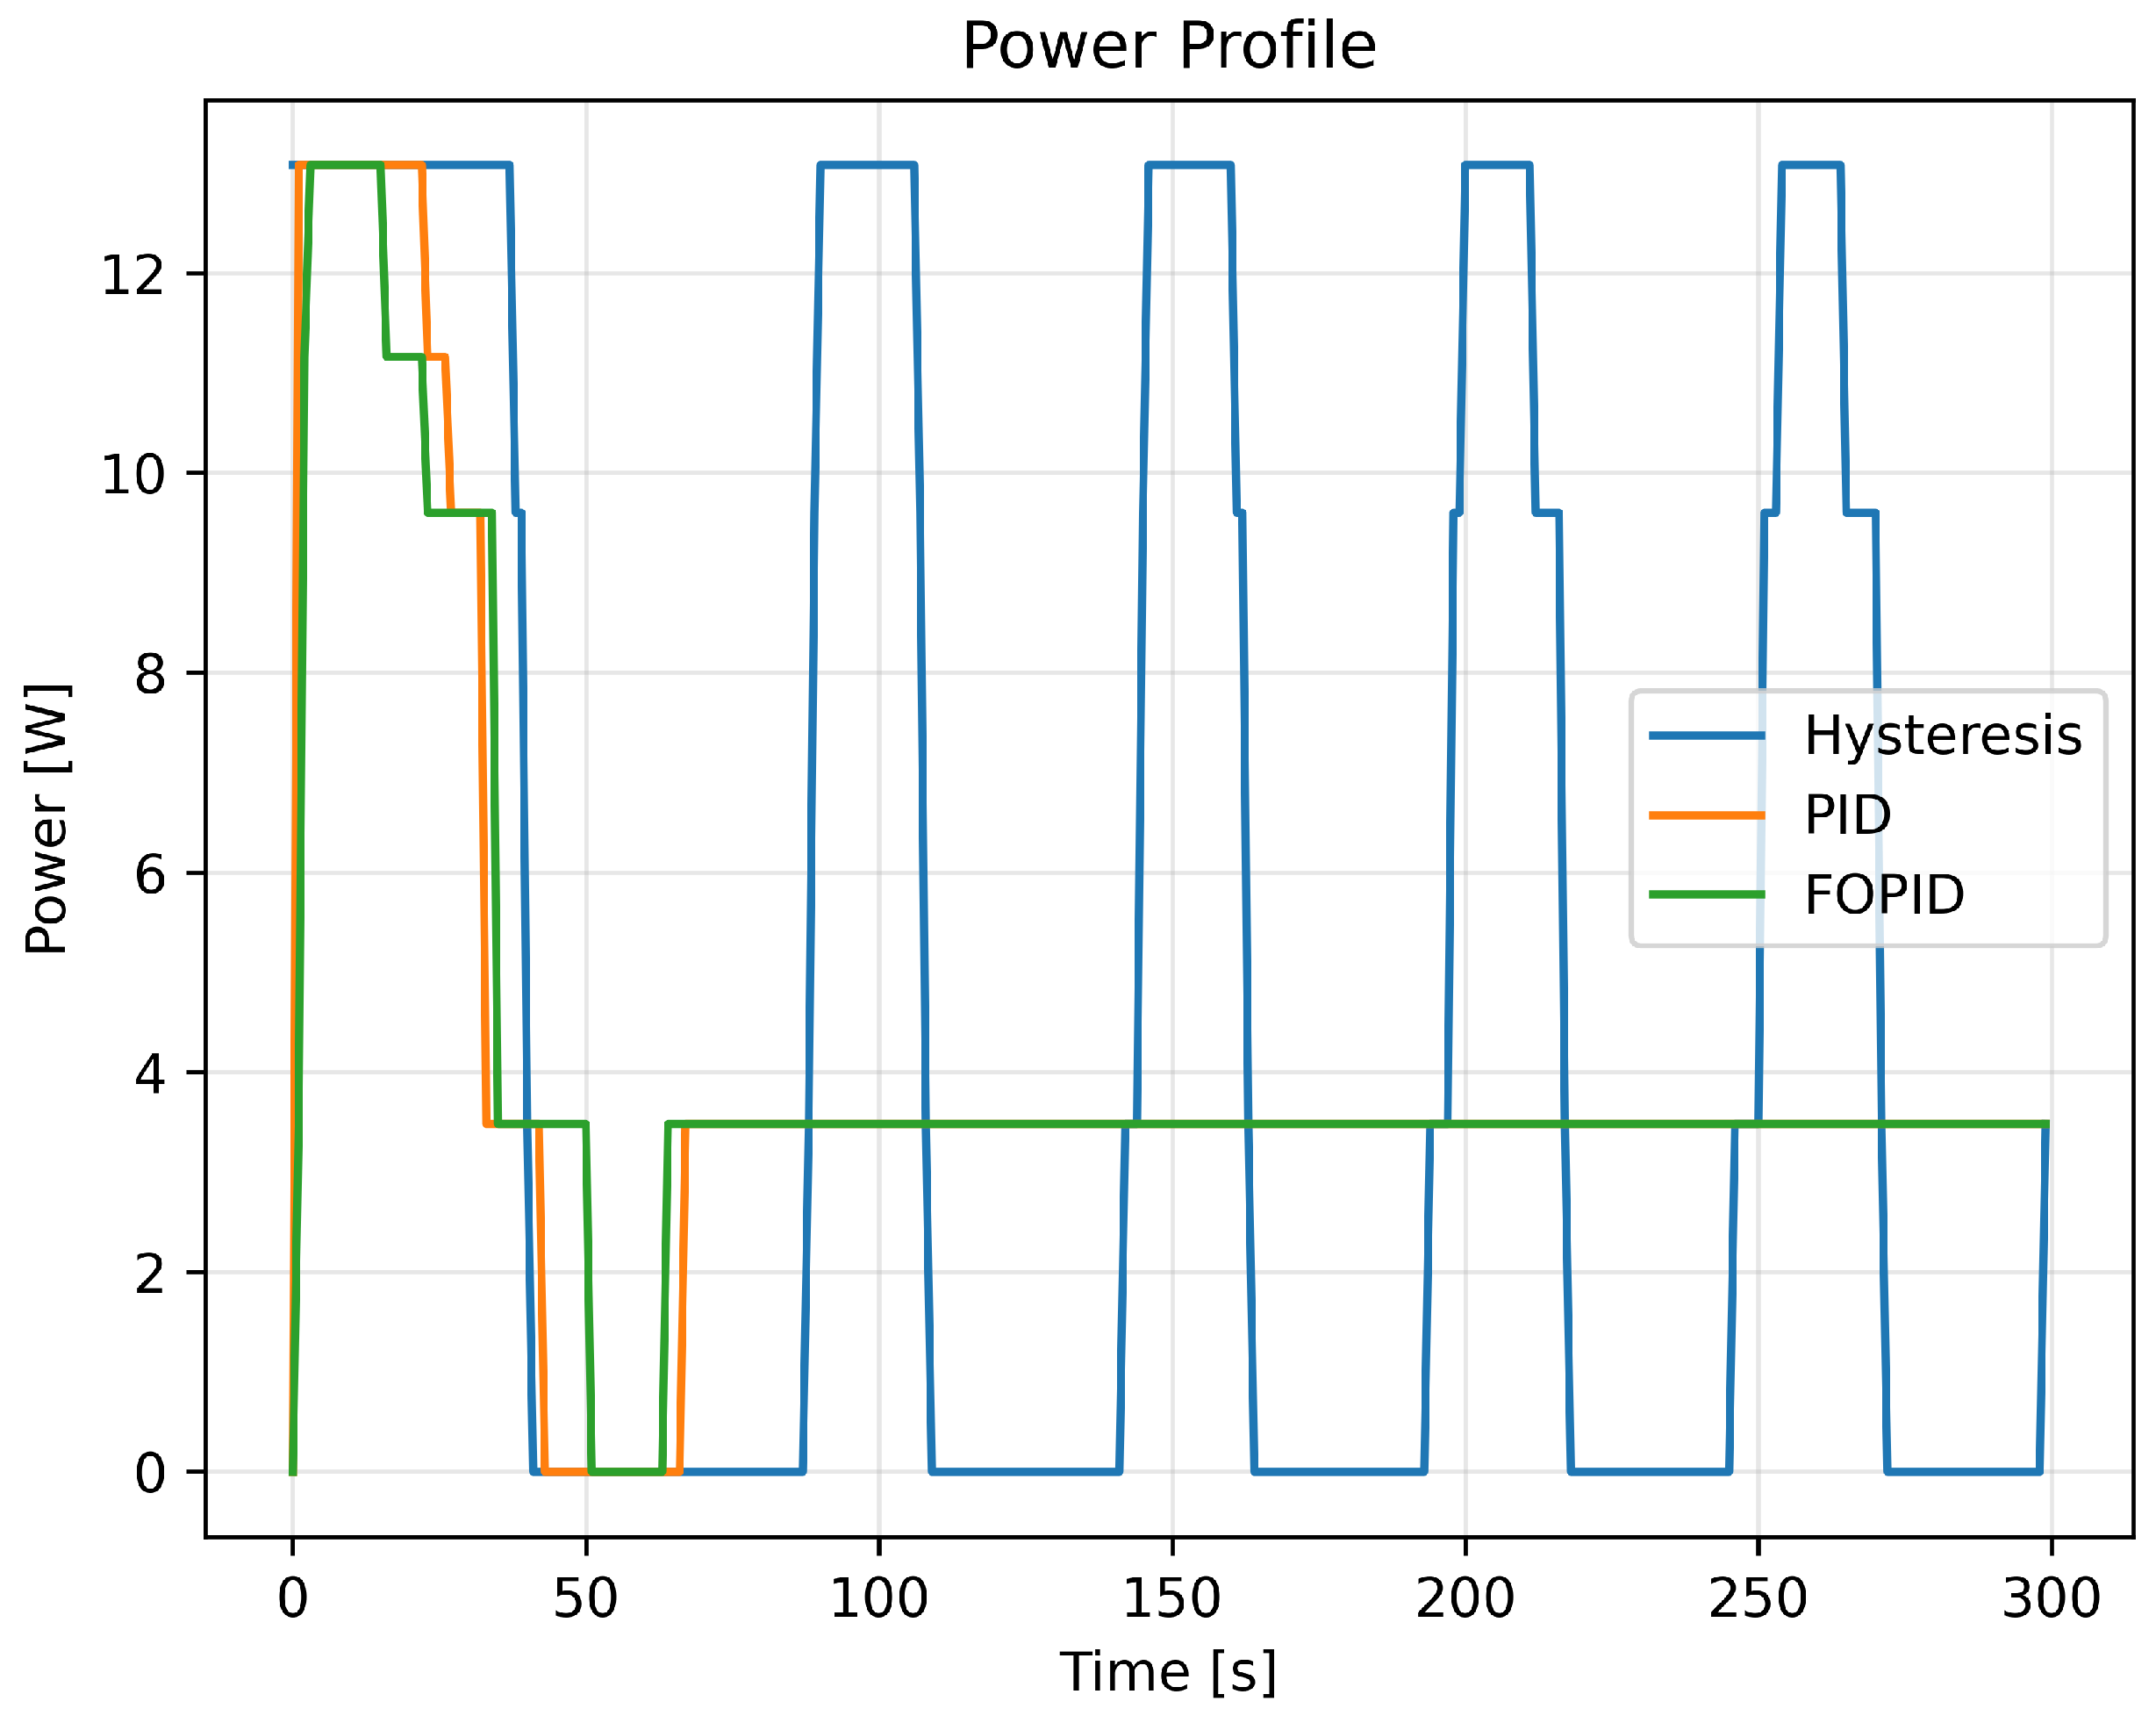
Figure 3 shows the temporal dynamics of the thermal error through its time derivative, allowing us to characterize the aggressiveness of the control action and the speed of correction in response to thermal disturbances. The derivative of the thermal error is obtained from the discrete error signal using finite differences, followed by one-dimensional Gaussian filtering. This processing reduces the noise amplification associated with the differentiation operation, ensuring a more stable representation of the system dynamics. Meanwhile, Figure 4 shows the instantaneous power profile consumed by each controller during the experiment.
Figure 3.
Thermal error dynamics (), used as an indicator of the system’s dynamic response under different control strategies.
Figure 4.
System power consumption profile for each control strategy.
The results show that controller performance cannot be evaluated in a one-dimensional manner. Although the FOPID controller exhibits the best performance in terms of mean absolute error and mean squared error, the PID controller maintains competitive performance in tracking but with lower overall efficiency in terms of the energy–accuracy trade-off. On the other hand, the hysteresis strategy acts as a robust benchmark in terms of stability, but is clearly less energy-efficient. Taken together, these results confirm the need for a multi-objective approach, where not only tracking error is evaluated, but also energy consumption and system stability in both dynamic and steady-state conditions.
3.2. Actuator Dynamics and Energy Modulation
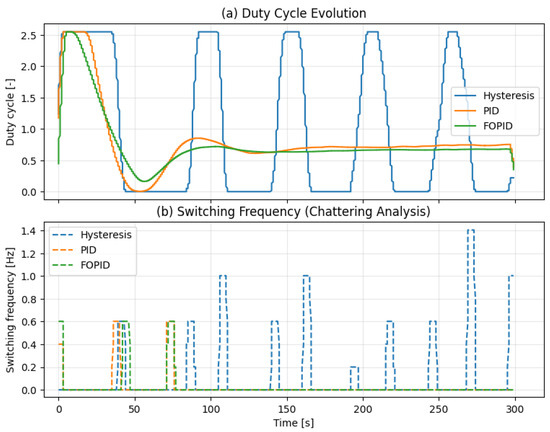
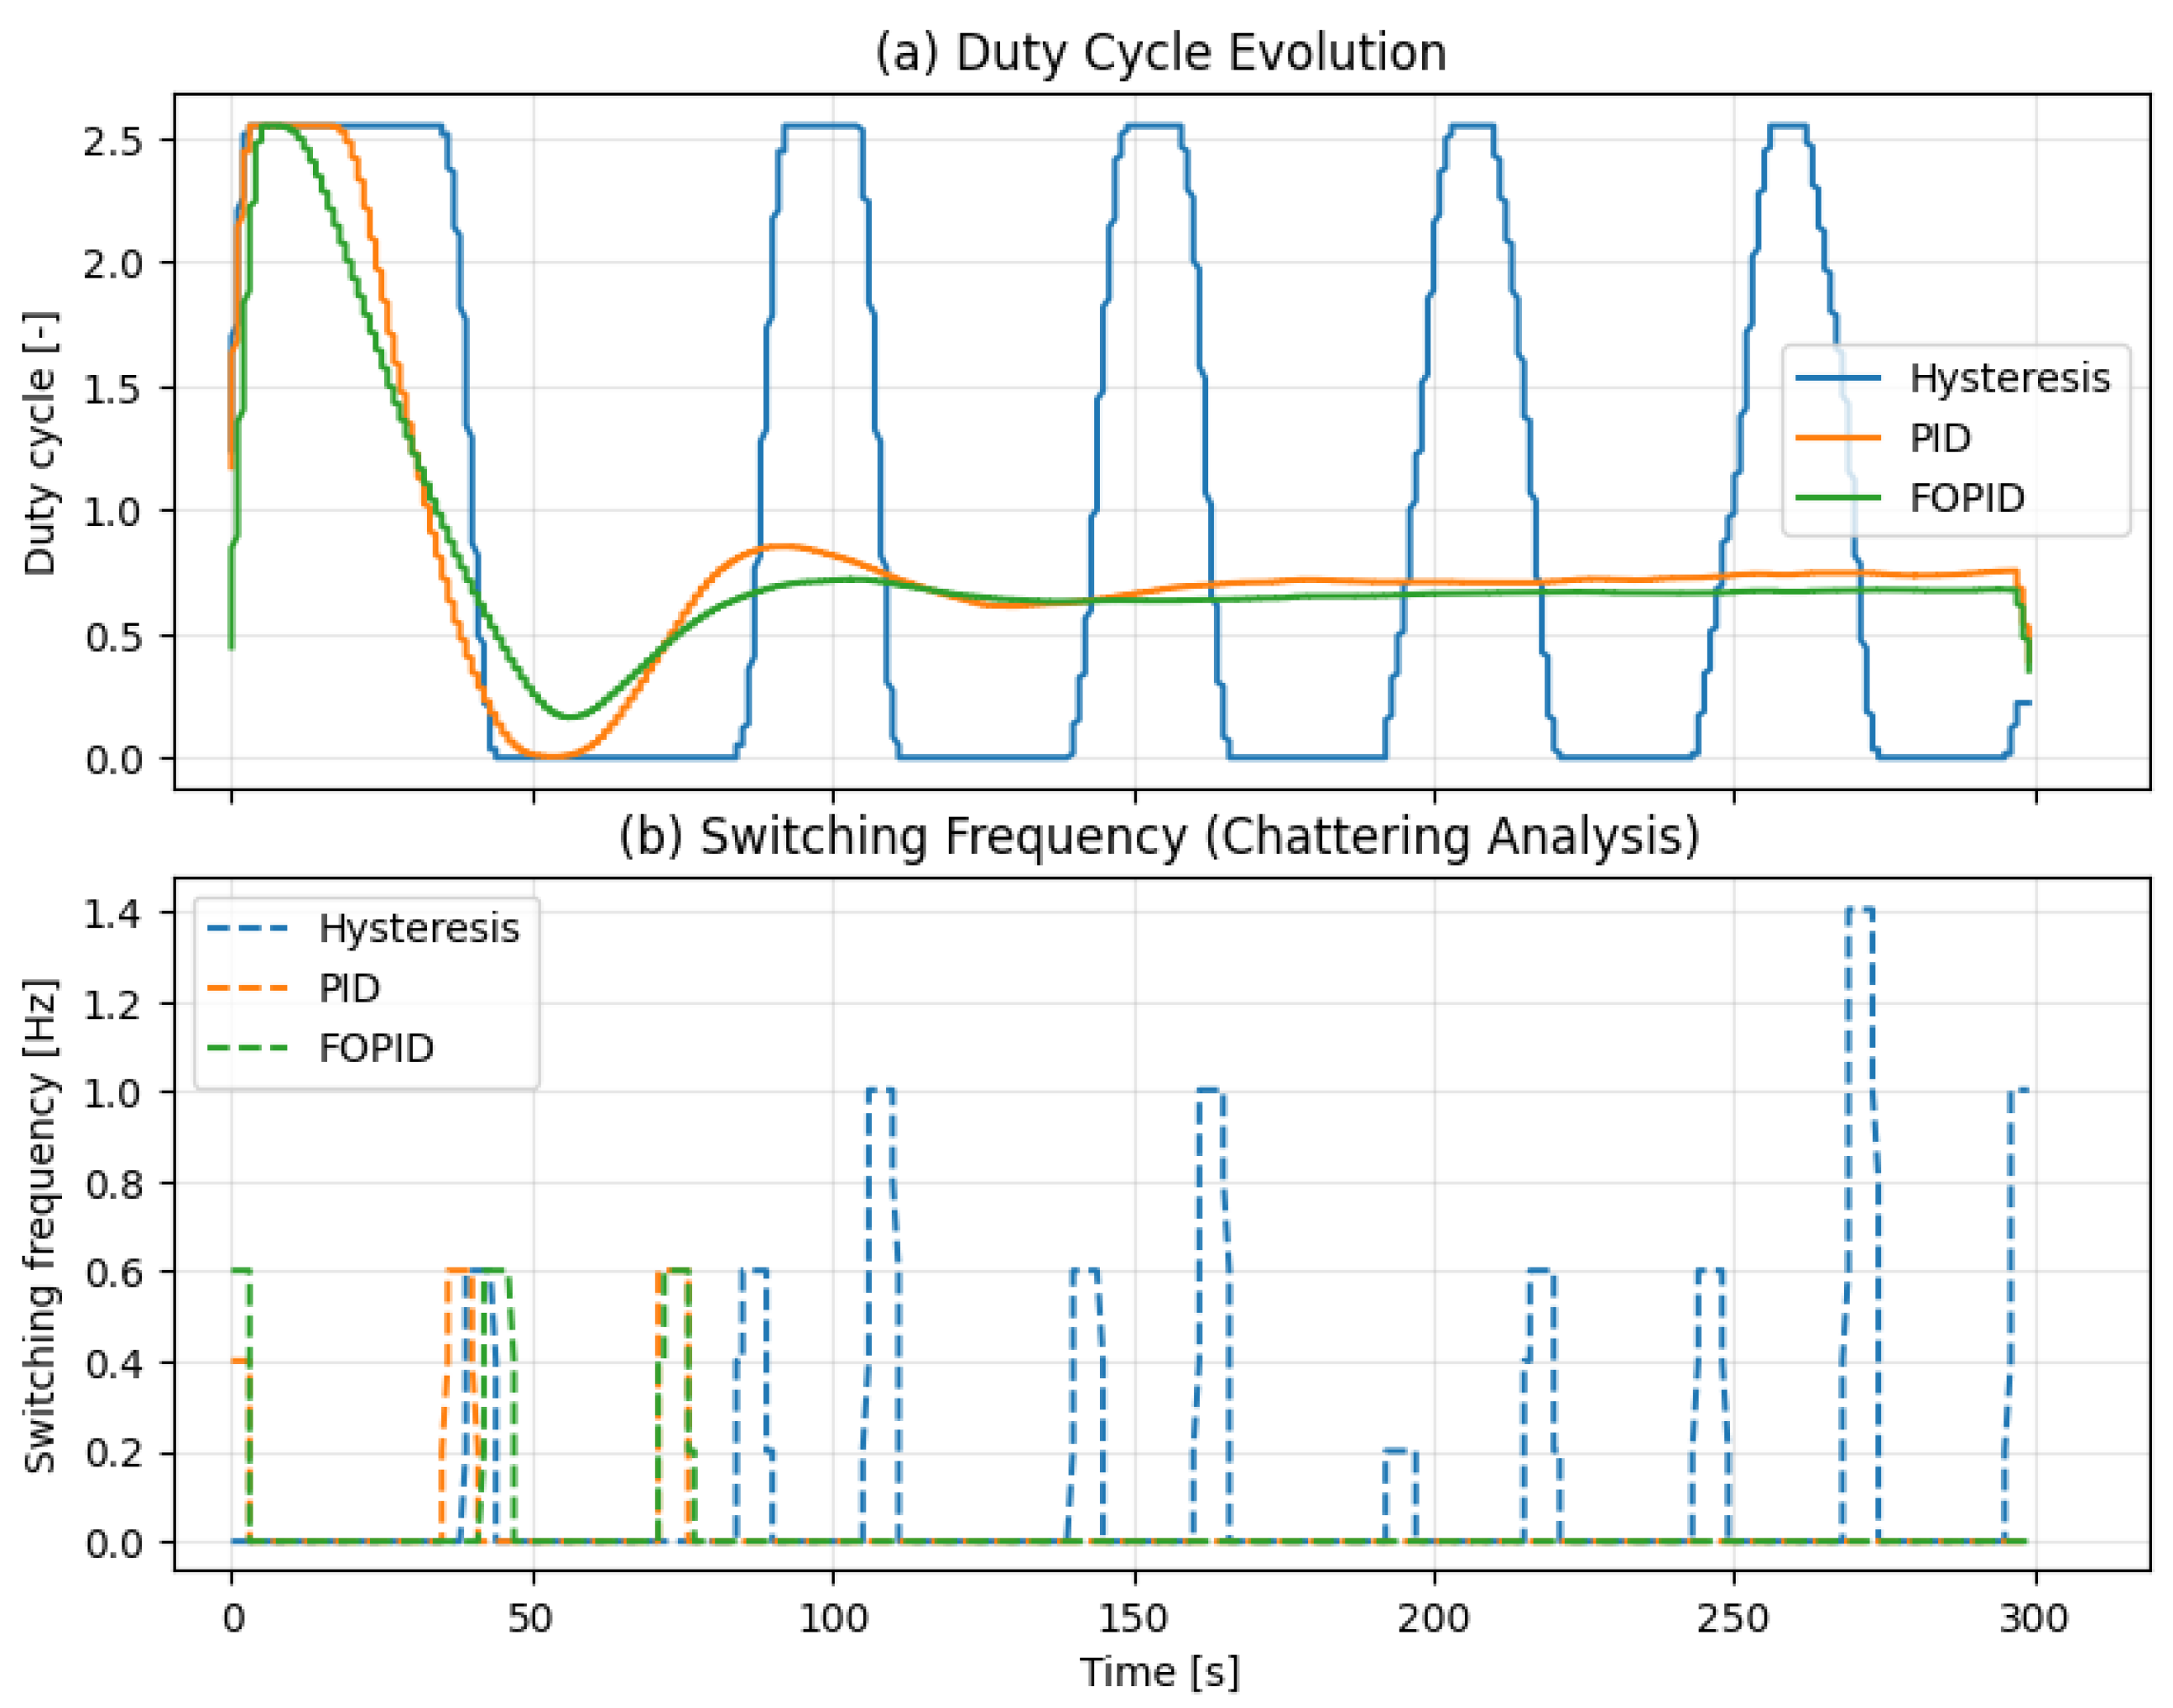
Analysis of the duty cycle and switching frequency of the actuator reveals fundamental differences in the energy characteristics of the controllers. The PID and FOPID schemes tend to generate a more continuous modulation of the PWM signal, reducing the switching frequency and, consequently, the losses associated with rapid changes in the actuator’s state. In contrast, hysteresis control induces binary dynamics with frequent switching, generating ON/OFF cycles that increase the effective energy consumption without proportionally translating into an improvement in thermal error (Figure 5).
Figure 5.
Analysis of the actuator’s duty cycle and switching frequency.
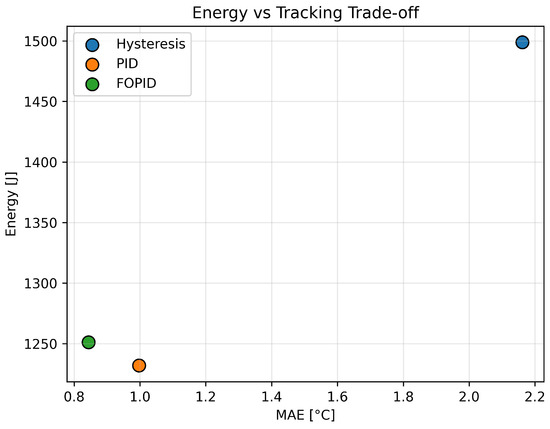
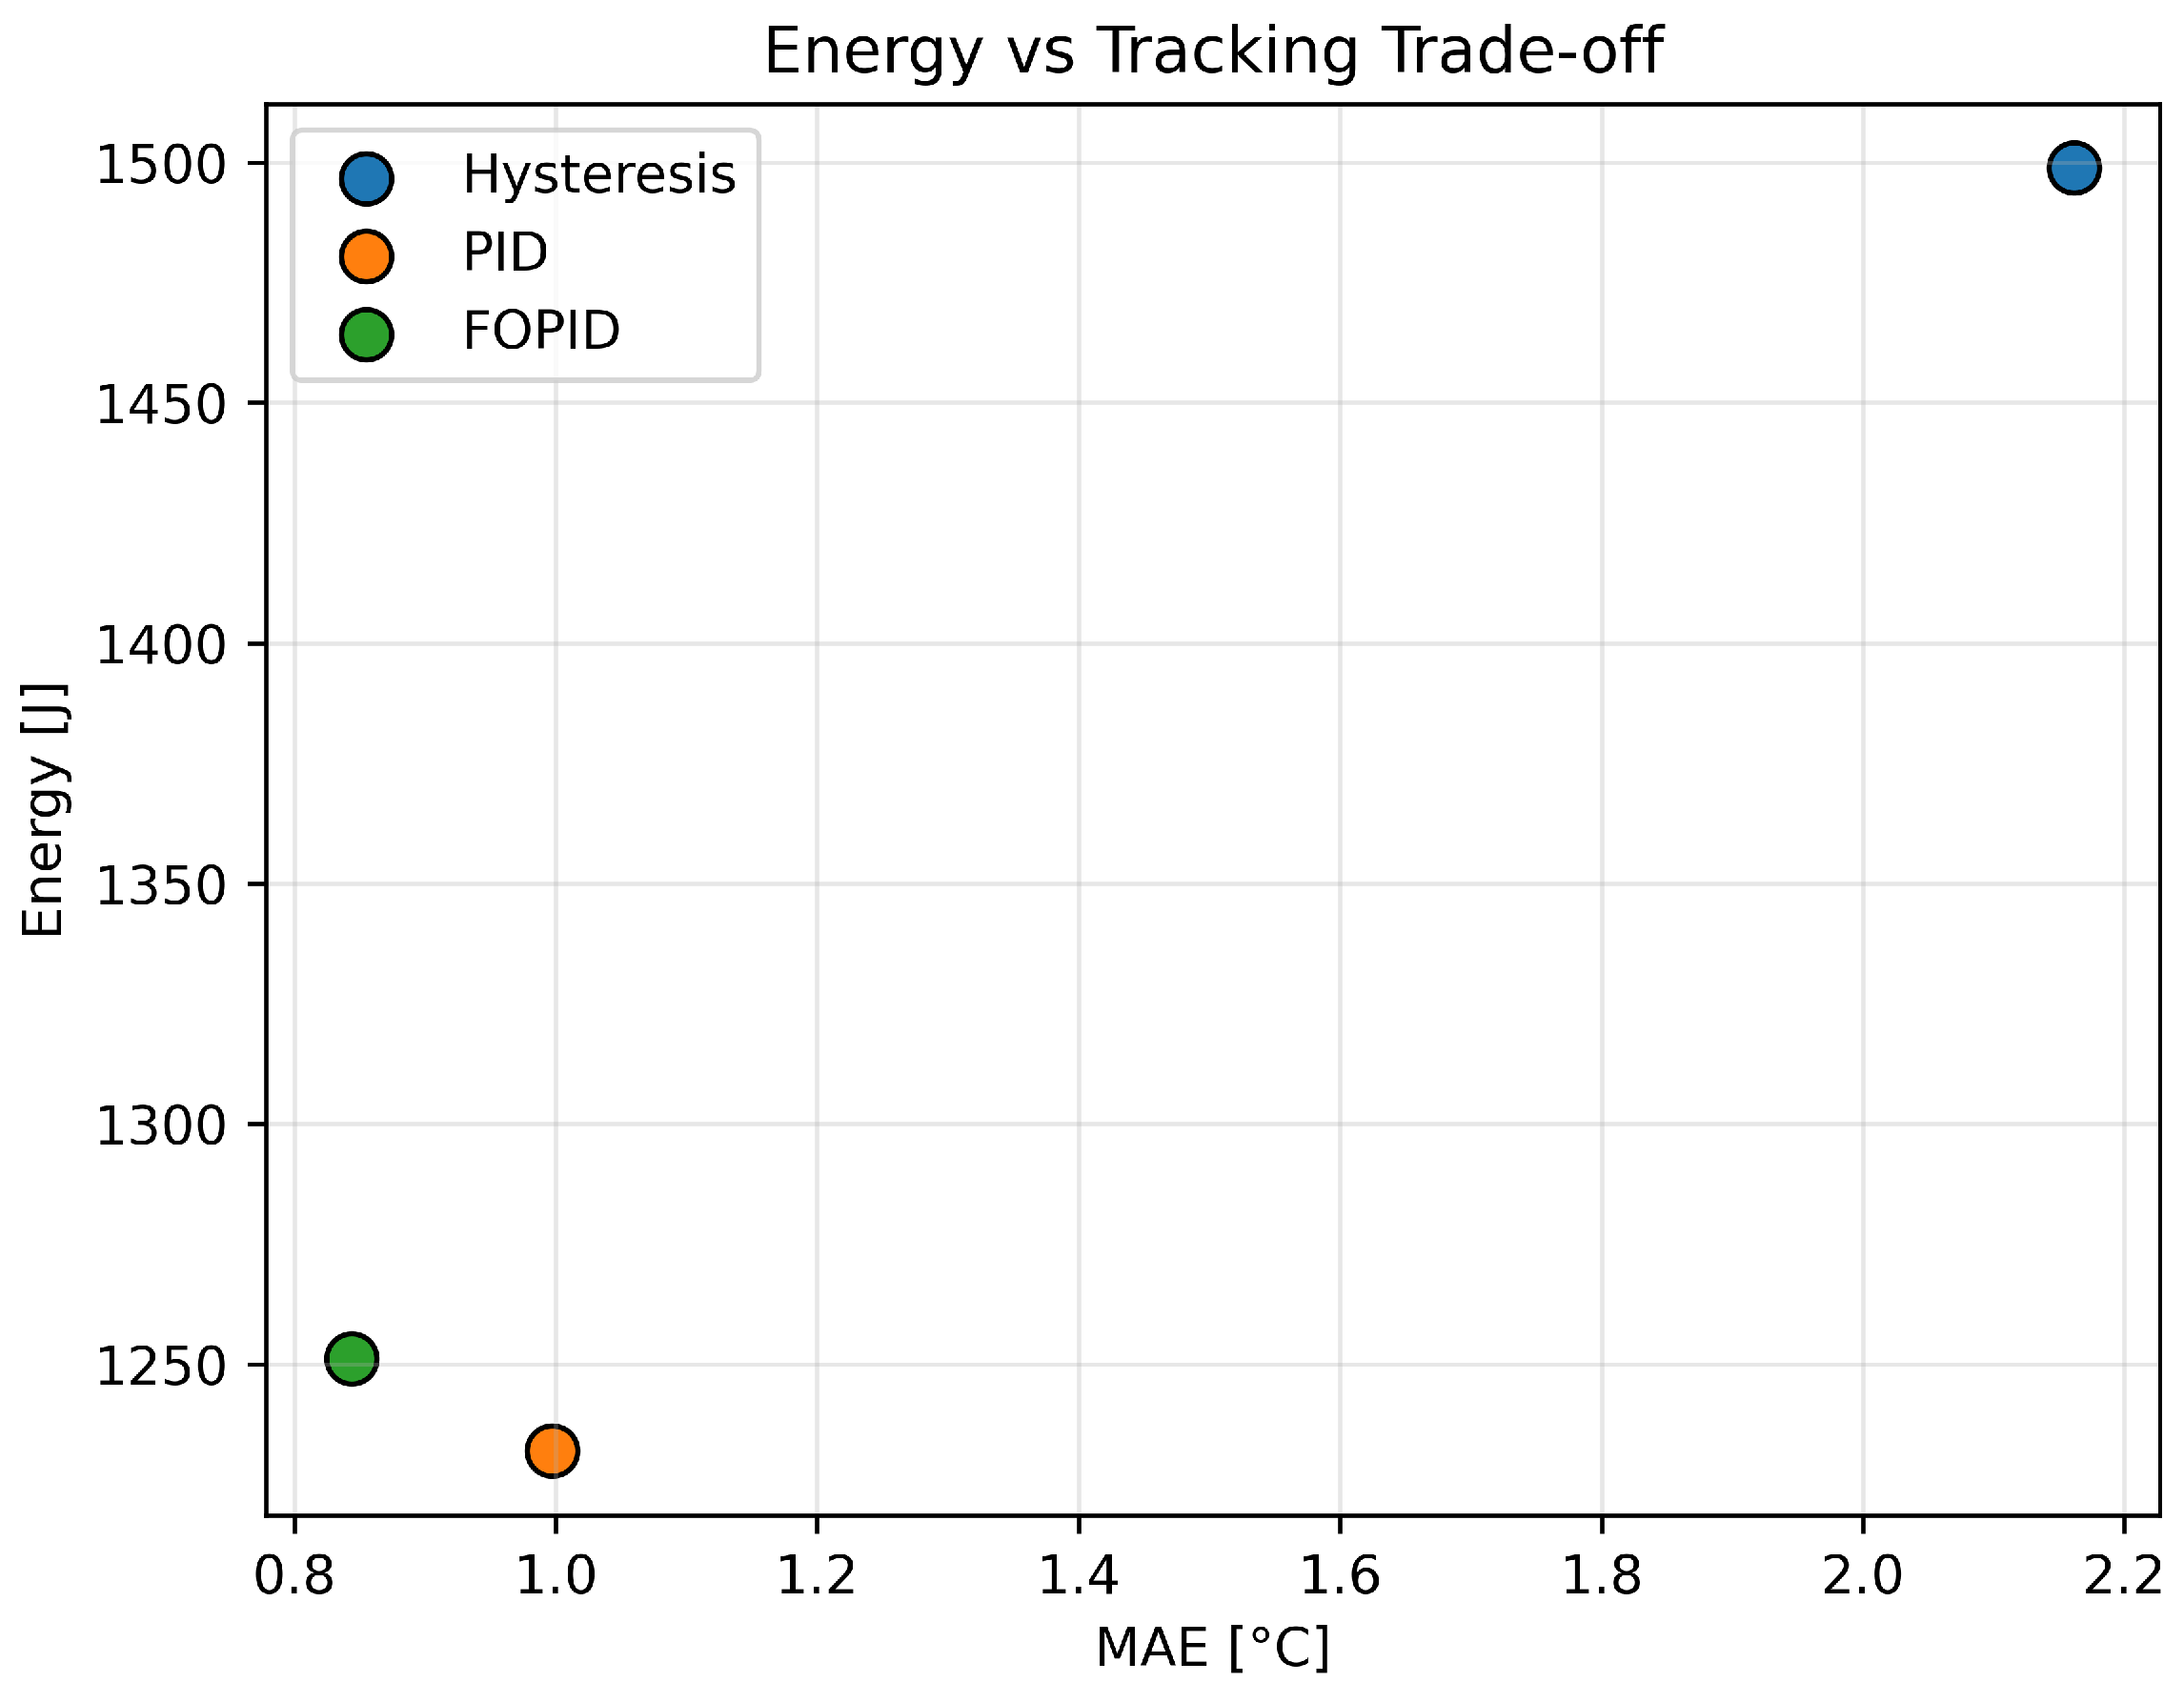
The overall relationship between accuracy and energy consumption is summarized in Figure 6, which explicitly illustrates the trade-off between the mean absolute error and total energy consumed.
Figure 6.
Energy–accuracy tradeoff among the evaluated control strategies.
3.3. Classification of Dynamic Regimes
The following analysis introduces a classification of the operating regimes based on the dynamic energy associated with the time derivative of the control error. To complement the statistical indicators presented in Table 4, this section introduces a dynamic smoothness index (DSI) based on the energy associated with the temporal variation in the thermal error. The DSI is defined as:
where is a regularization constant. This formulation is related to the total variation in the error signal and to the ITSE (Integral of Time-weighted Squared Error derivative) family of performance indices widely used in control engineering to penalize oscillatory responses. A higher DSI indicates a smoother error evolution with reduced high-frequency oscillations, reflecting less aggressive actuation dynamics. It should be noted that the DSI measures dynamic smoothness rather than stability in the classical control-theoretic sense (e.g., Lyapunov stability or BIBO stability); it quantifies the aggressiveness of the control action through the energy content of the error derivative. The FOPID controller exhibits the highest DSI, followed by PID and hysteresis. This indicates that the FOPID generates the smoothest error evolution, consistent with the fractional memory operator attenuating high-frequency error variations. The PID exhibits intermediate smoothness, balancing correction speed and dynamic regularity, while the hysteresis controller produces the most oscillatory response due to its discrete ON/OFF switching nature. These results are consistent with the error derivative dynamics shown in Figure 3 and in Table 8.
Table 8.
Dynamic Smoothness Index (DSI) for the evaluated controllers.
3.4. Window-Based Energy Cost of Error Reduction
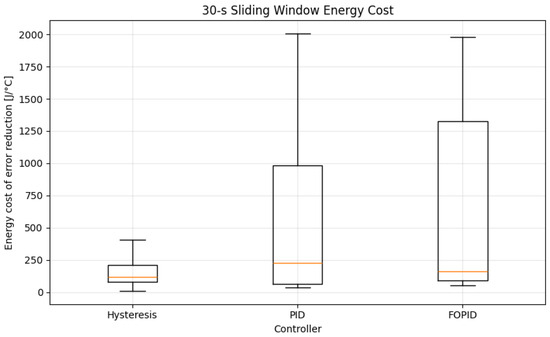
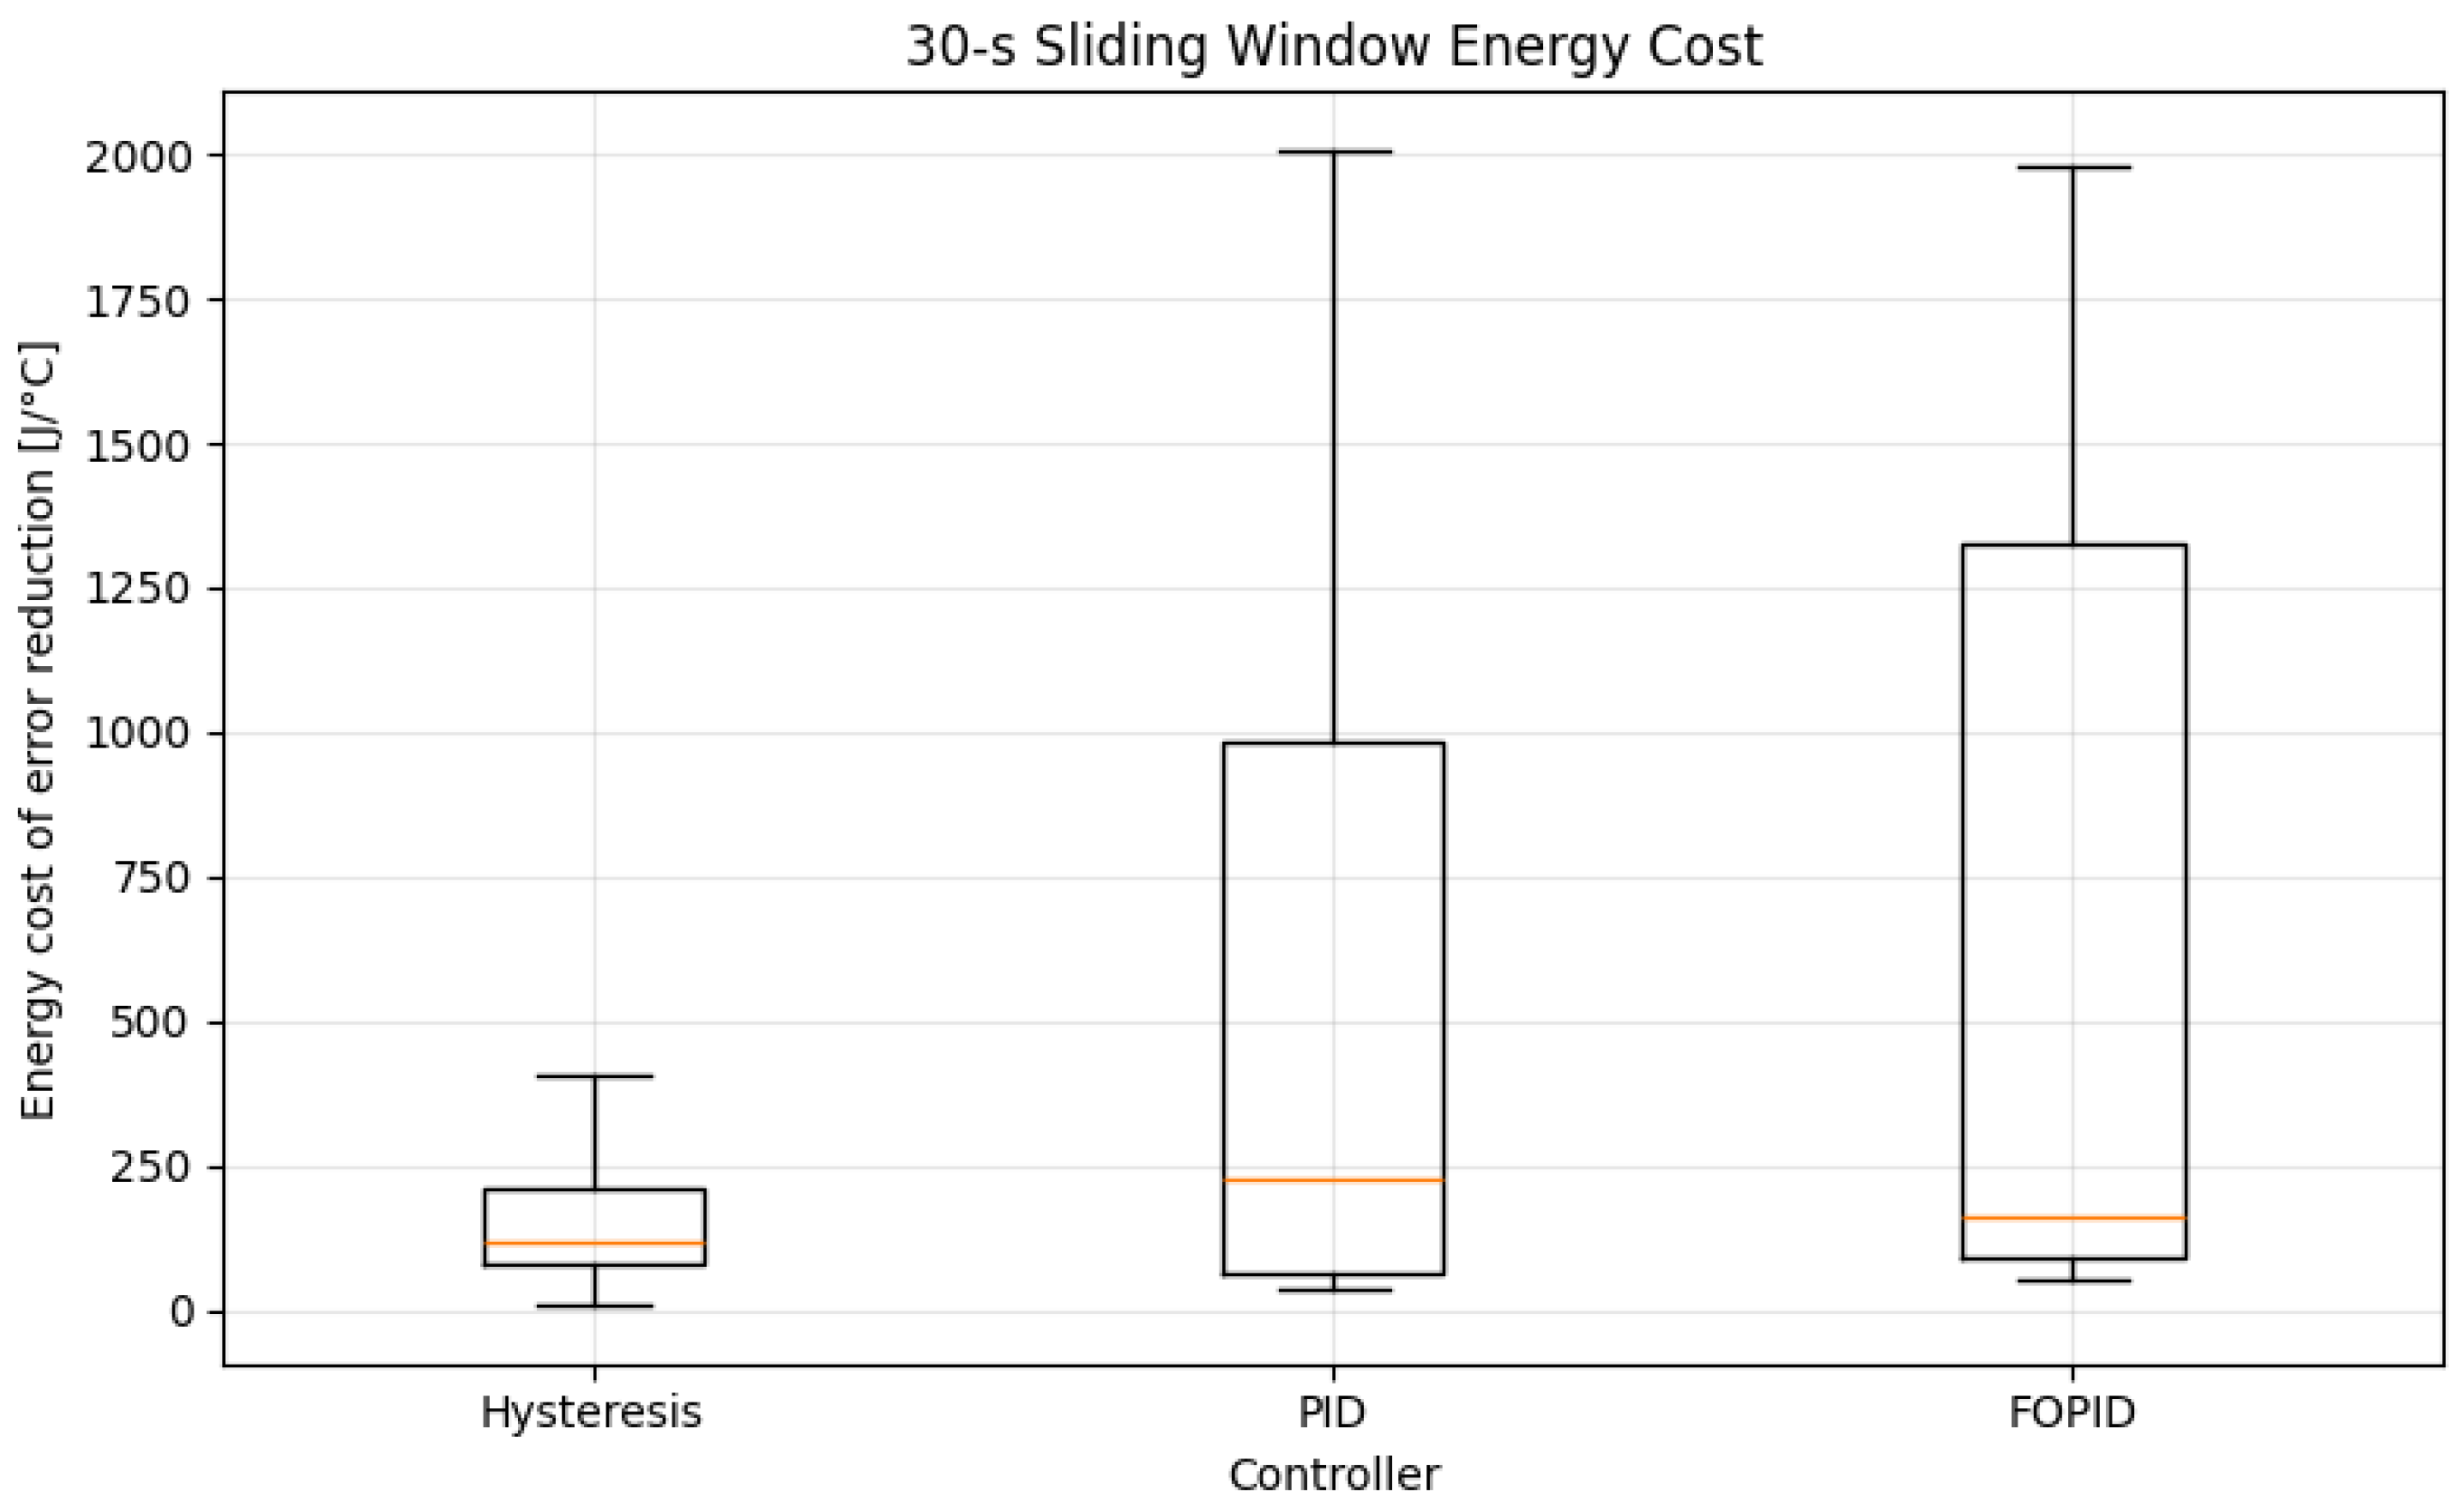
The energetic effectiveness of the control strategies is further analyzed using the window-based energy cost metric defined in Section 2.4. This metric evaluates the local ratio between electrical energy consumption and thermal error reduction over 30 s sliding windows, allowing the assessment of efficiency under varying dynamic operating conditions. Figure 7 summarizes the resulting distributions for the three controllers.
Figure 7.
Boxplot of the window-based energy cost of error reduction for the three control strategies. Each distribution is computed over 30 s sliding windows, showing the median, interquartile range, and variability of the energetic cost associated with reducing the thermal error. Lower values indicate higher local energetic efficiency.
The results reflect differences in the local efficiency of error correction rather than total energy consumption. The hysteresis controller exhibits a median cost of 116.47 J/°C, followed by the FOPID controller with 159.68 J/°C, while the PID controller presents the highest median value of 225.58 J/°C. This indicates that, on average, the PID strategy requires more energy per unit of instantaneous error reduction compared to the other controllers. In terms of variability, the interquartile ranges highlight stronger dependence on the operating regime for the PID and FOPID strategies (IQR = 915.90 and 1236.45, respectively), whereas hysteresis control shows lower dispersion (IQR = 130.19), indicating more consistent local energetic behavior across different thermal conditions.
3.5. Statistical Distribution of the Thermal Error
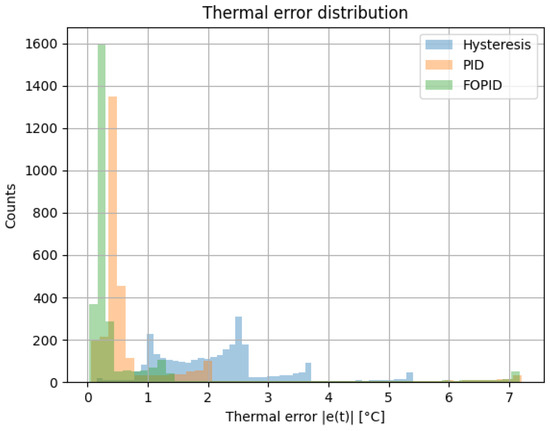
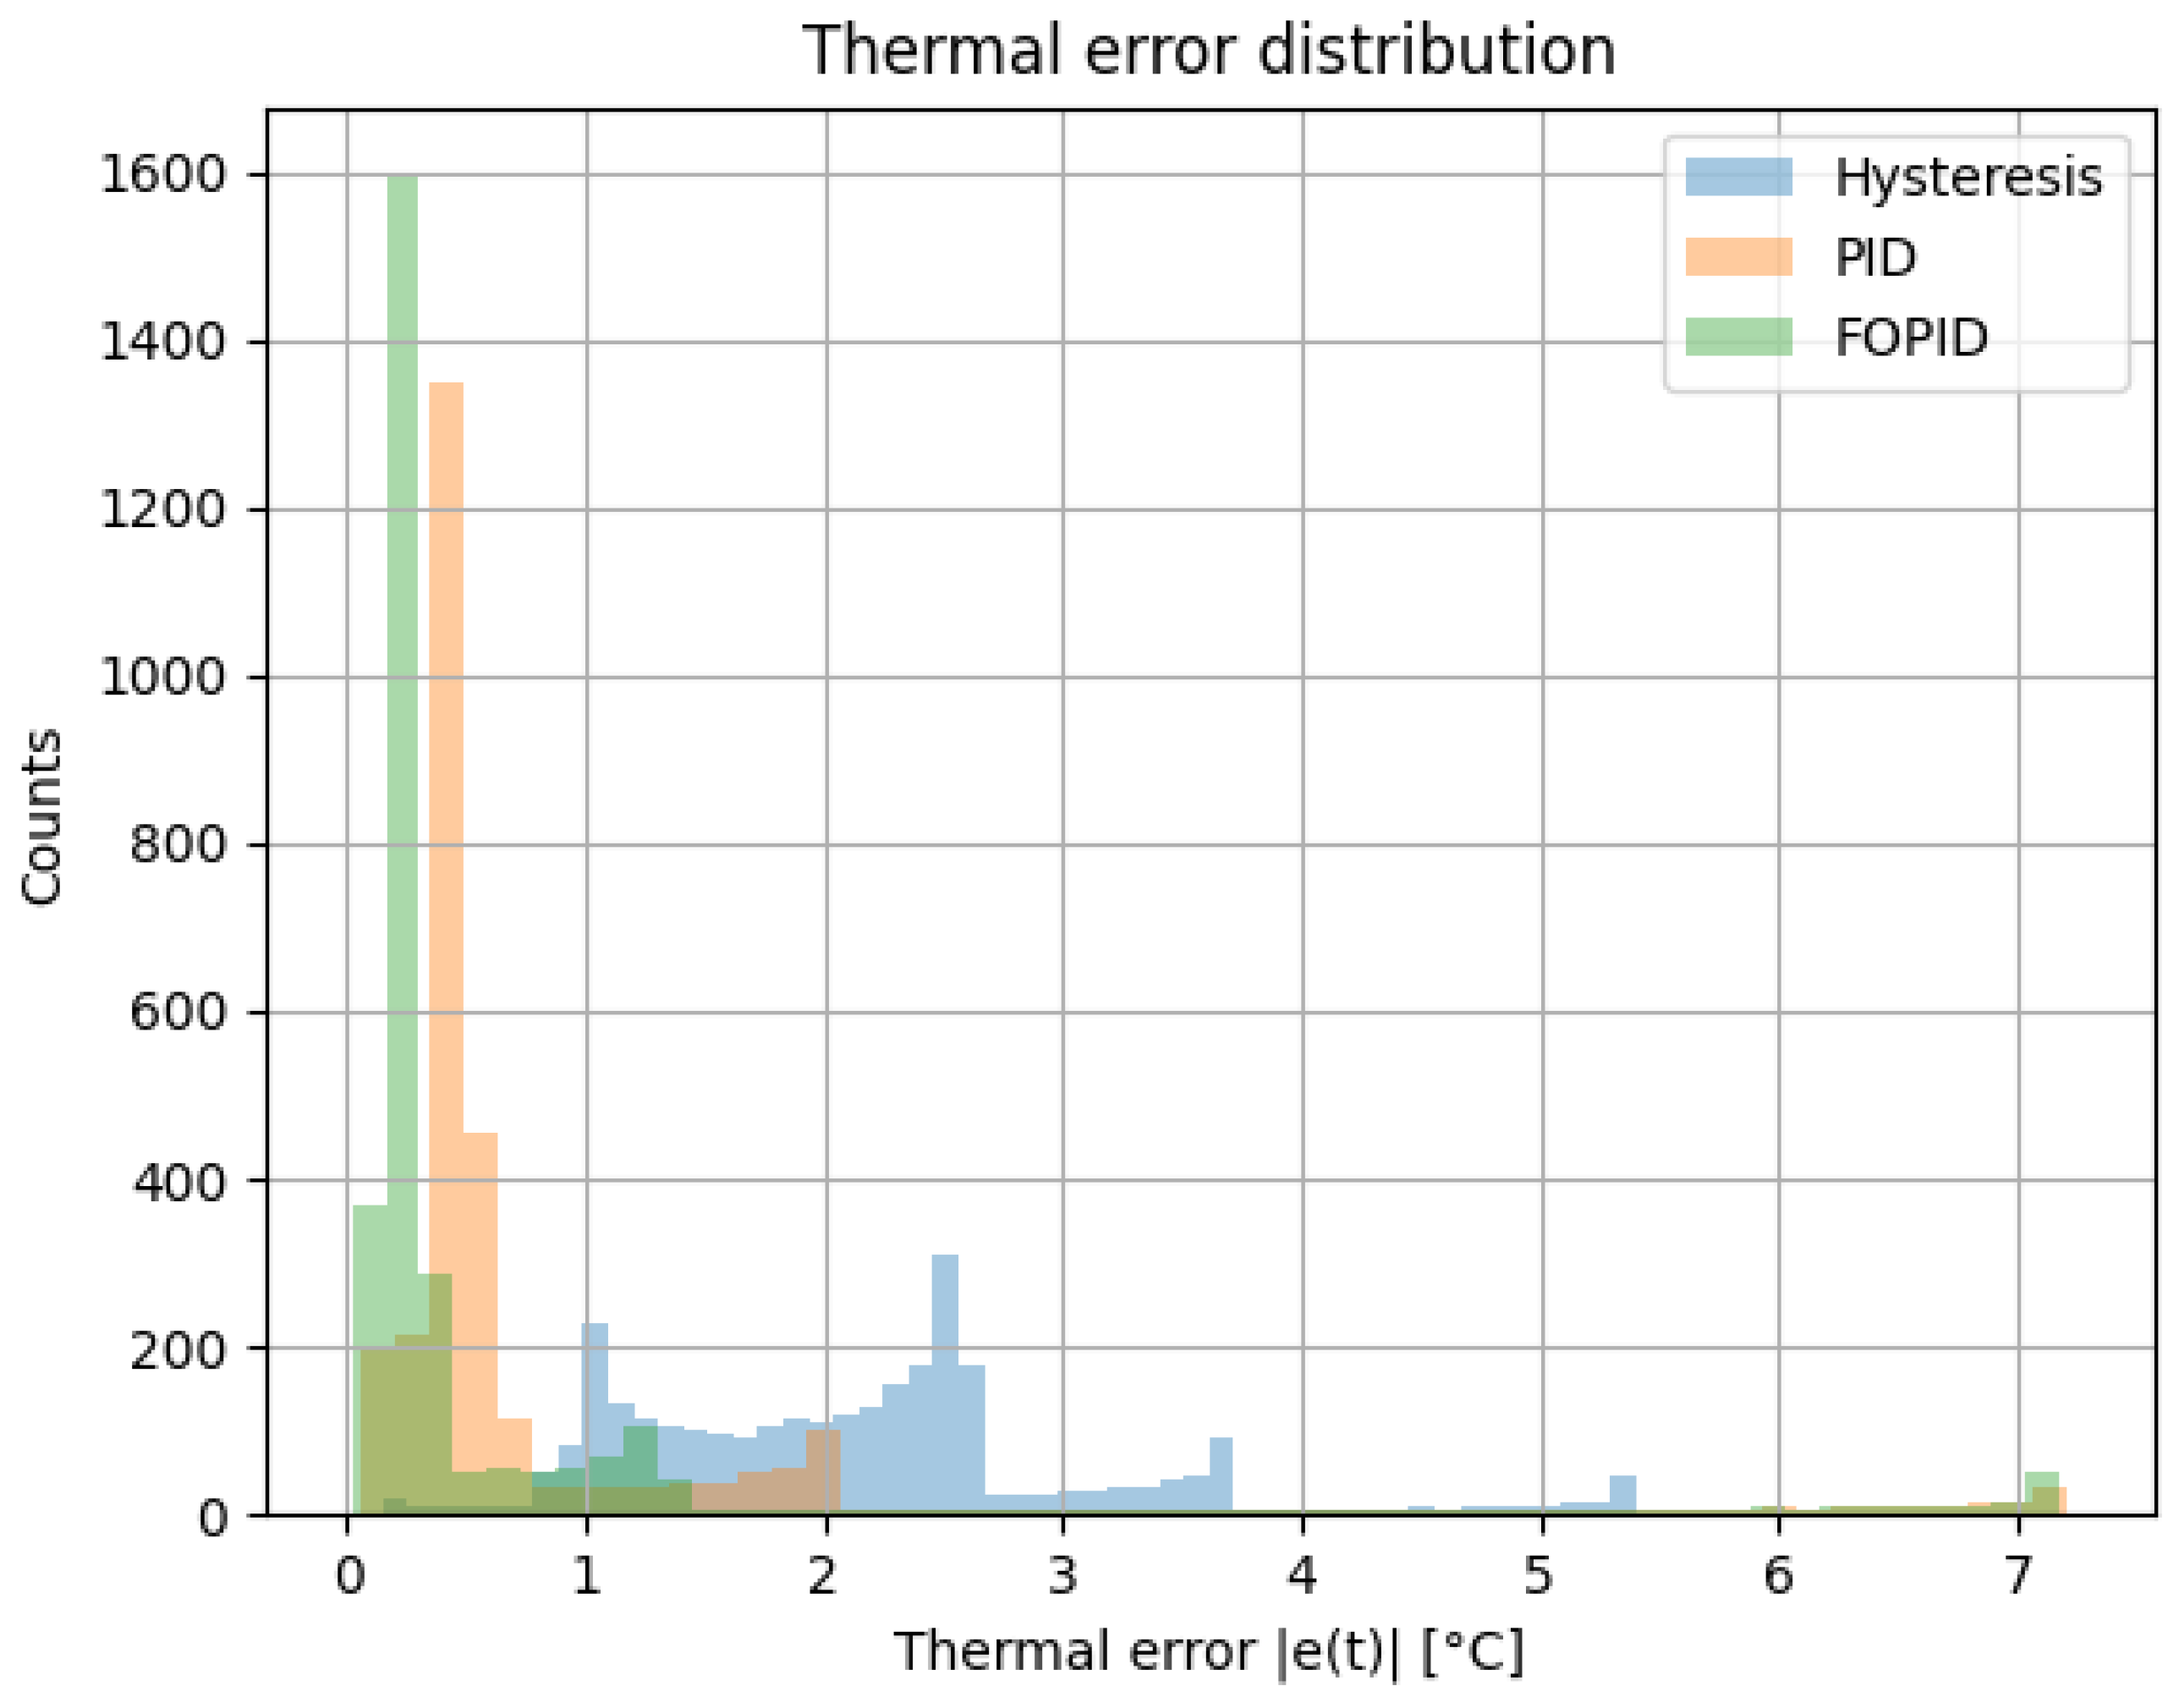
To further characterize the performance variability, the statistical distribution of the thermal error is analyzed. Figure 8 shows the distribution of the absolute error throughout the experiment using a frequency histogram. This analysis allows us to evaluate the variability in the performance of each control strategy and its ability to keep the system close to the desired operating point. It can be observed that the PID controller concentrates its distribution on lower error values, indicating greater steady-state accuracy. The FOPID exhibits a slightly more dispersed distribution, although it is still centered on low values. In contrast, hysteresis control exhibits a wider distribution, reflecting greater thermal variability around the setpoint.
Figure 8.
Distribution of the thermal error during the experiment for the three controllers evaluated.
3.6. Energy–Accuracy Relationship and Cumulative Behavior
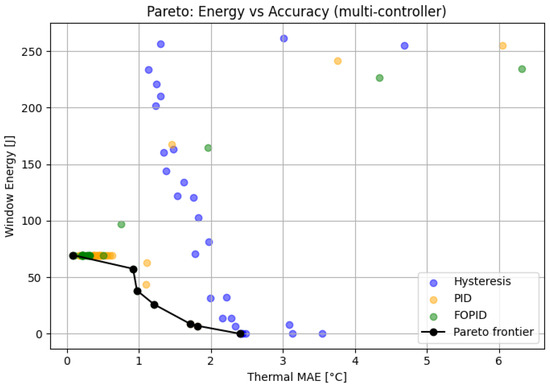
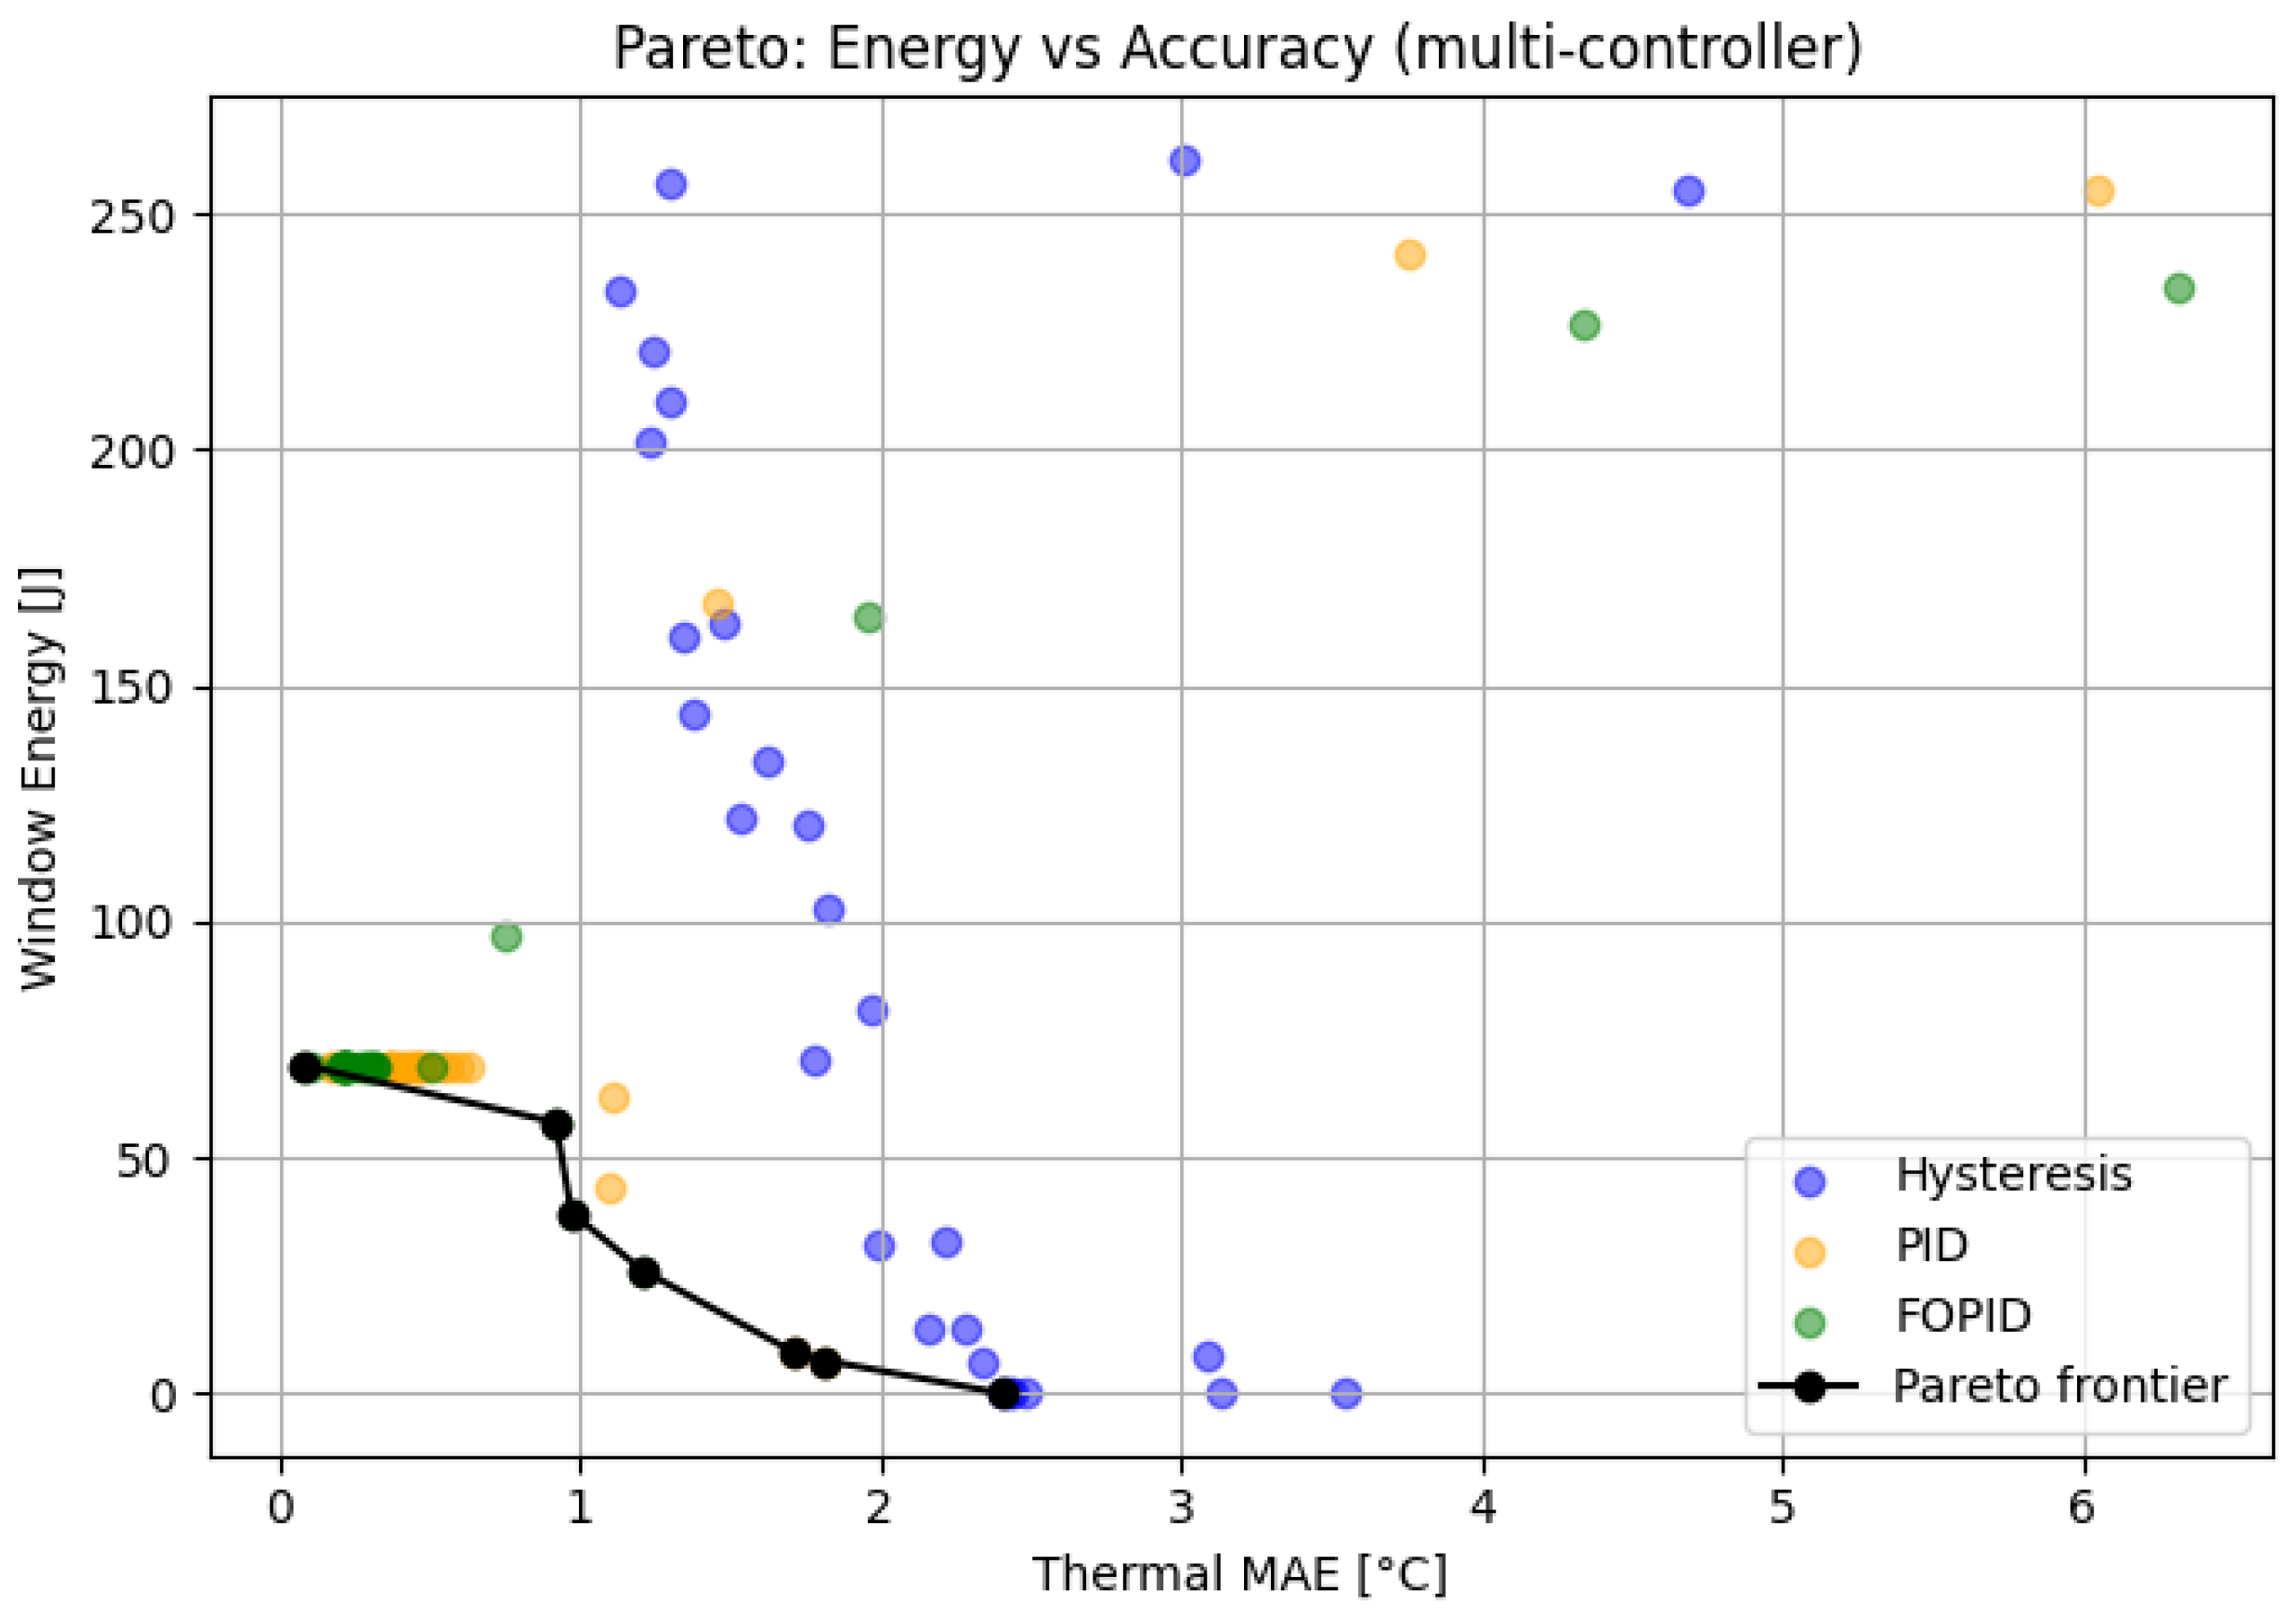
The trade-off between performance accuracy and energy consumption is first analyzed to assess the efficiency of each control strategy. Figure 9 shows the relationship between the mean absolute error and the energy consumed per operation window for the three controllers evaluated. It can be seen that each strategy occupies distinct regions of the energy–accuracy space, highlighting clear differences in the distribution of thermal and energy performance. The FOPID tends to concentrate in regions of lower error at the cost of increased energy consumption, while the hysteresis scheme exhibits lower thermal accuracy but lower dynamic control demands. The PID is situated in a more balanced intermediate region.
Figure 9.
Relationship between thermal error (MAE) and energy consumed per window for the evaluated controllers.
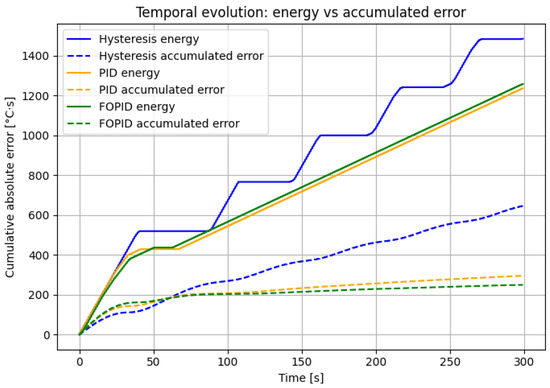
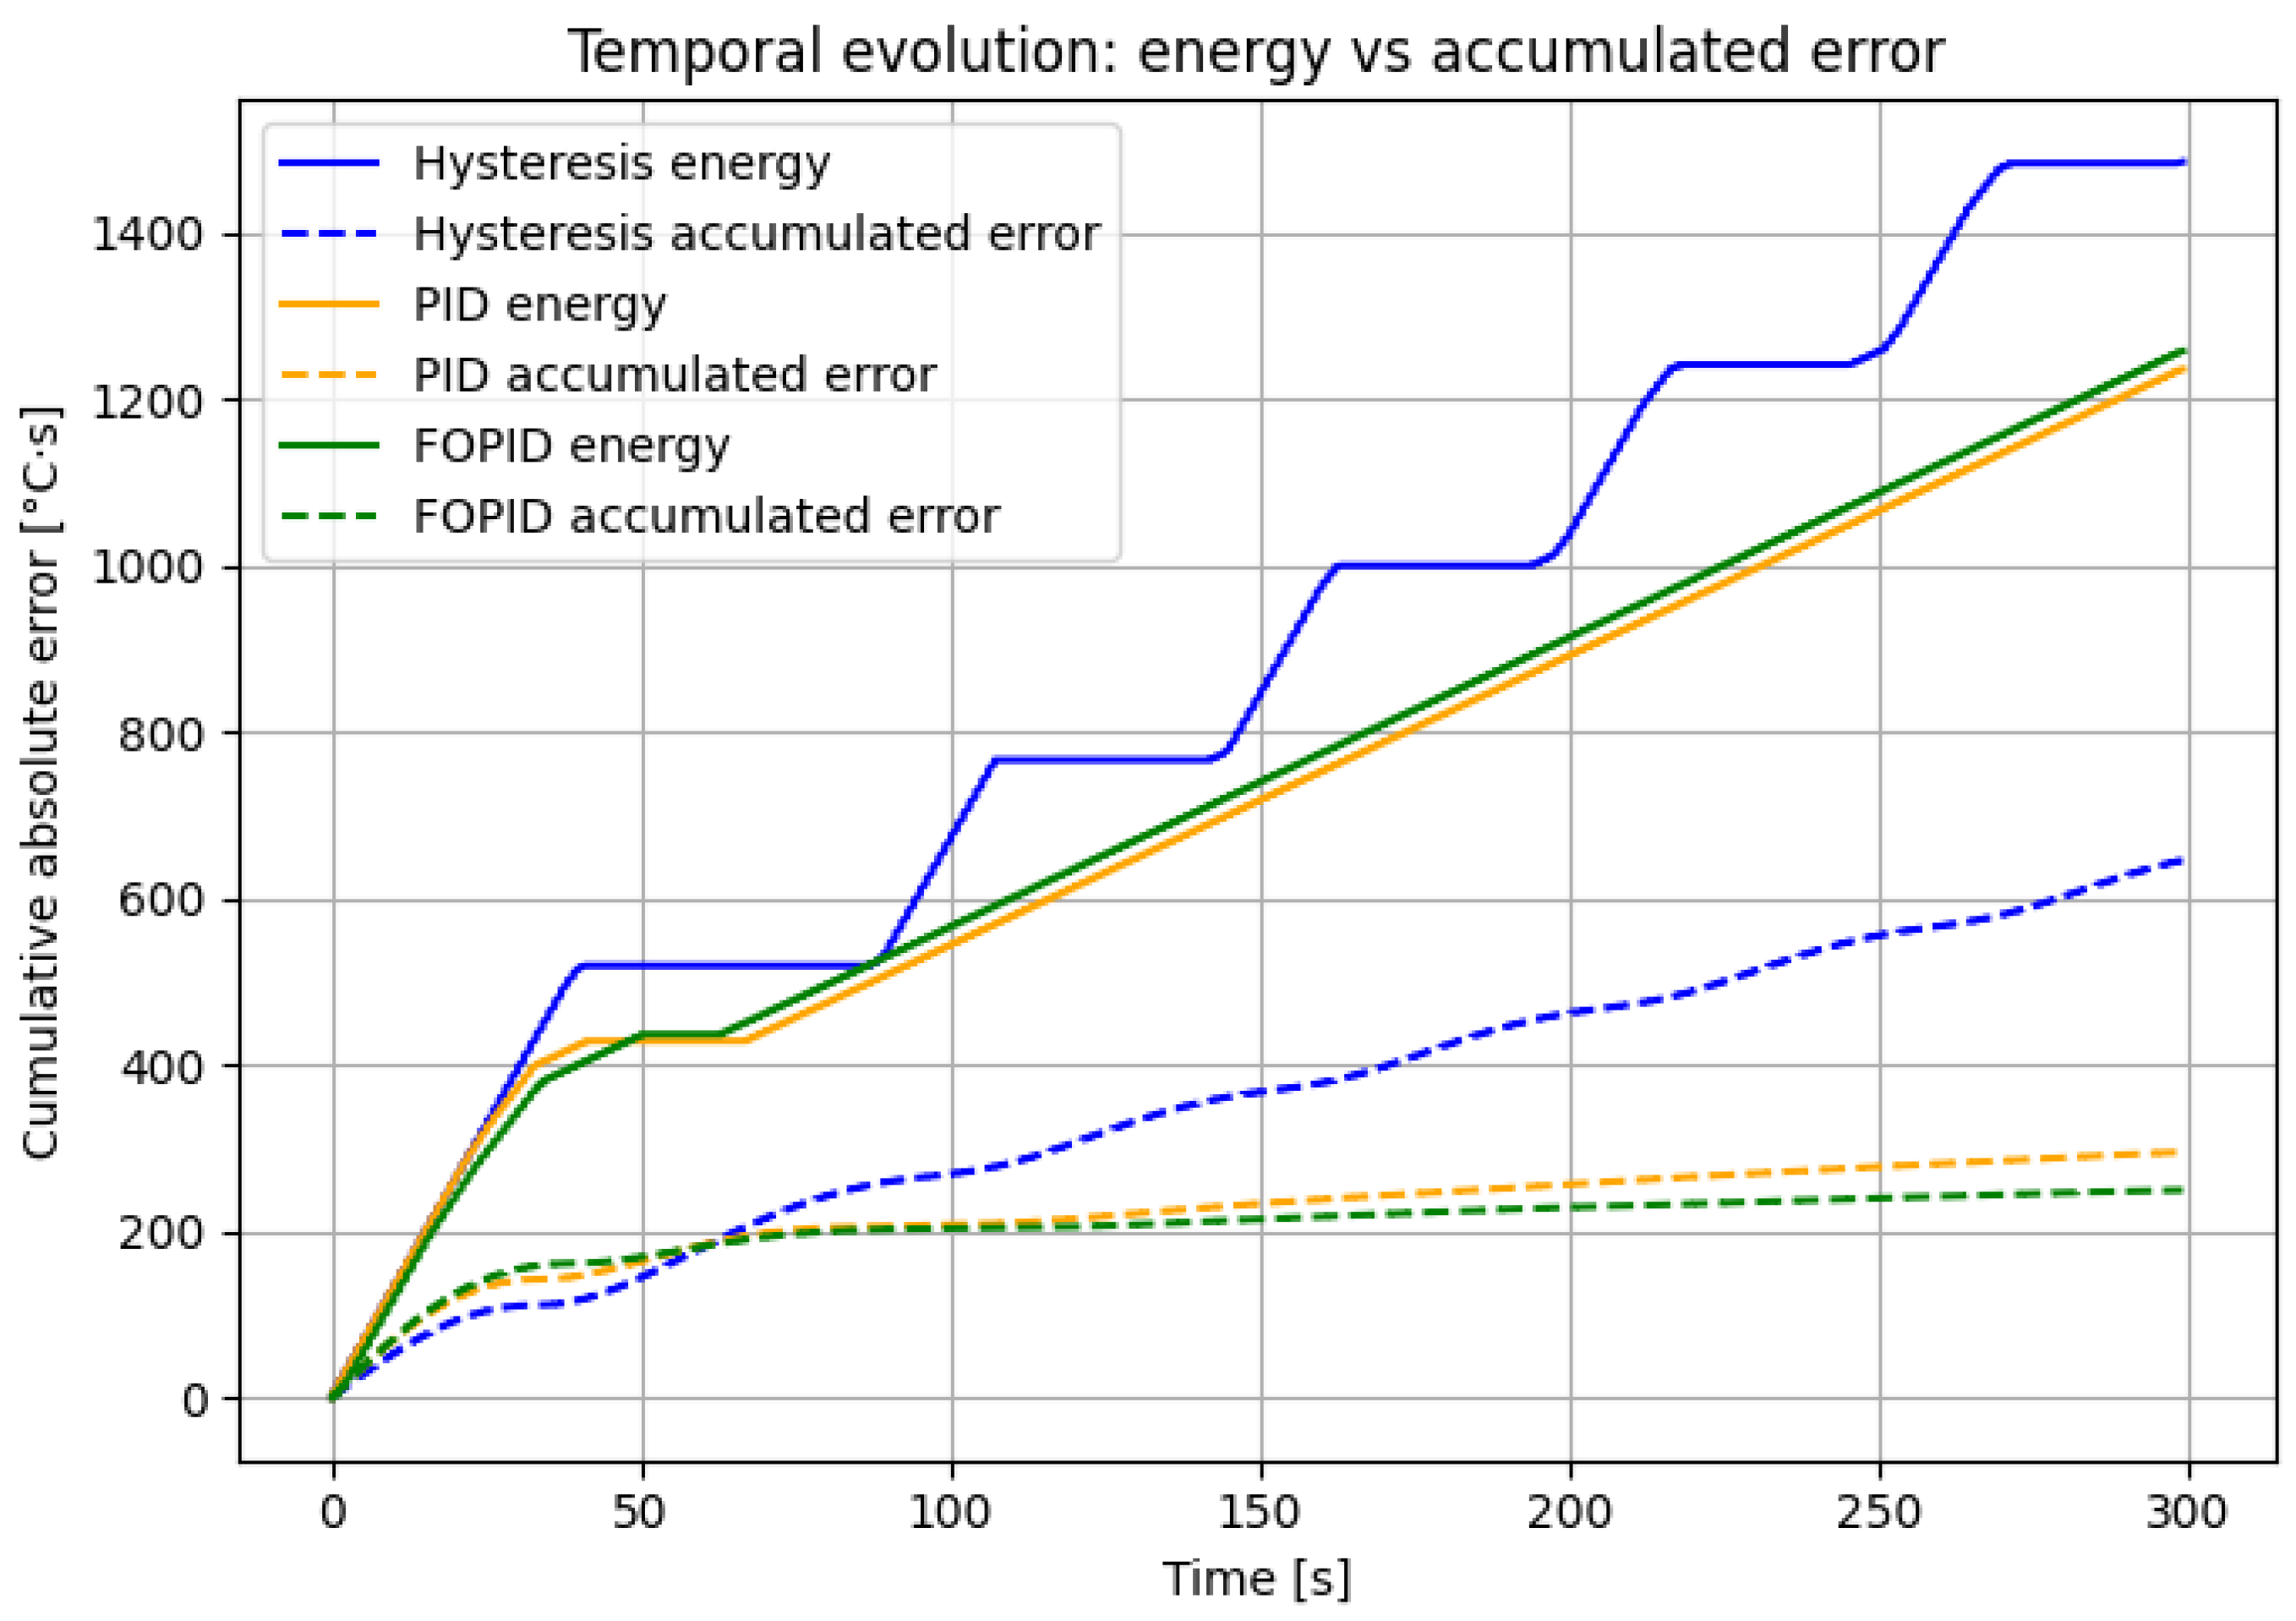
Figure 10 shows the time evolution of the accumulated energy and the accumulated error for each control strategy. It can be seen that both quantities exhibit increasing trends throughout the experiment, although at different rates of growth.
Figure 10.
Time evolution of the accumulated energy and accumulated error for the different controllers.
This indicates that the relationship between energy expenditure and error reduction does not remain constant over time, but rather depends on the system’s dynamic regime. The hysteresis controller exhibits the highest cumulative energy consumption throughout the entire experiment duration, followed by FOPID and PID respectively, a ranking that remains consistent across all time intervals (25%, 50%, 75%, and 100% of experiment duration). The FOPID exhibits marginally higher energy consumption than PID (1255.7 J versus 1237.9 J), compensated by a significantly lower MAE, which results in its superior TEI value. The results demonstrate that improvements in thermal performance must be analyzed simultaneously with the energy and dynamic behavior of the control system.
4. Discussion
The results show that the performance of the control strategies depends heavily on the evaluation criterion used, especially when the analysis incorporates both thermal and energy metrics simultaneously. Although the PID controller exhibits the lowest mean error, the differences between controllers cannot be interpreted solely in terms of tracking accuracy, since each strategy redistributes energy expenditure differently over time.
The FOPID controller exhibits a smoother response due to the incorporation of fractional memory in the control action, which partially reduces thermal oscillations and the aggressiveness of the PWM signal. Its TEI of 1.16 relative to PID reflects primarily its advantage in thermal accuracy (MAE = 0.84 °C versus 1.00 °C), which compensates its marginally higher energy consumption (1255.7 J versus 1237.9 J). This confirms that the TEI captures the global energy–accuracy balance rather than requiring simultaneous superiority in both dimensions. However, this behavior also leads to longer periods of energy actuation, increasing cumulative consumption under certain dynamic conditions. In contrast, the PID controller corrects thermal deviations more quickly, achieving lower mean error values at the cost of more intense control dynamics. On the other hand, hysteresis control induces boundary cycles associated with the repetitive activation and deactivation of the actuator, generating thermal oscillations and energy losses resulting from episodes of overcooling.
A particularly important aspect is the system’s operation near the dew point, where small temperature variations can require disproportionate increases in control effort, highlighting a nonlinear relationship between error reduction and energy consumption. The analysis suggests that there is no universally optimal strategy for all operating conditions. This conclusion is further reinforced by the dual operational interpretation of the dew-point constraint: in industrial protection scenarios, where surface temperature must remain above the dew point, the PID controller offers the most reliable margin with lowest energy cost; in AWG scenarios, where sustained operation below the dew point is the objective, the FOPID controller provides the most energy-efficient condensation regime due to its superior MAE and smoother actuation dynamics. The relative efficiency of each controller depends on the dynamic regime, the magnitude of thermal disturbances, and the desired balance between stability, accuracy, and energy consumption. In this sense, the system’s behavior should be interpreted as an energy–thermal trade-off problem rather than as an optimization based exclusively on tracking error.
5. Conclusions
This work presented a comparative analysis of thermal control strategies applied to a thermoelectric system operating near the dew point, considering both the dynamic performance and the energy behavior of the system.
The results show that there is no universally optimal control strategy across all evaluation criteria. The PID controller performed best in terms of tracking error, while the FOPID controller exhibited a more balanced performance between thermal accuracy and energy demand. Hysteresis control, although robust and simple to implement, resulted in higher losses associated with the actuator’s switching dynamics. It was observed that the incorporation of energy metrics leads to different interpretations of controller performance compared to classical metrics based solely on error. In particular, operation near the dew point revealed a nonlinear relationship between error reduction and energy consumption, highlighting the importance of efficiency-oriented approaches for sustainable thermal applications.
The study confirms the need to simultaneously consider dynamic stability, thermal accuracy, and energy consumption in the design of thermoelectric control systems. As future work, the incorporation of adaptive strategies and predictive models capable of improving energy performance under variable operating conditions is proposed.
Author Contributions
Conceptualization, M.F.F.P., C.S.M., F.L.Z. and A.R.M.; methodology, M.F.F.P. and A.R.M.; software, M.F.F.P. and C.S.M.; validation, M.F.F.P., F.L.Z. and A.R.M.; formal analysis, M.F.F.P., F.L.Z. and A.R.M.; investigation, M.F.F.P., C.S.M. and A.R.M.; resources, F.L.Z. and A.R.M.; data curation, M.F.F.P.; writing—original draft preparation, M.F.F.P., C.S.M. and A.R.M.; writing—review and editing, M.F.F.P., C.S.M., F.L.Z. and A.R.M.; visualization, M.F.F.P.; supervision, C.S.M., F.L.Z. and A.R.M.; project administration, C.S.M., F.L.Z. and A.R.M.; funding acquisition, C.S.M., F.L.Z. and A.R.M. All authors have read and agreed to the published version of the manuscript.
Funding
This research was co-funded by the INTERREG V-A Cooperation Spain–Portugal MAC (Madeira-Azores-Canarias) program via the MITIMAC project MAC2/1.1a/263. This research was co-funded by Project PIE 2023-60 CONVOCATORIA DE PROYECTOS DE INNOVACIÓN EDUCATIVA 2023 de la Universidad de Las Palmas de Gran Canaria. This research was co-funded by Project PIE-INT 2024-29 CONVOCATORIA DE PROYECTOS DE INNOVACIÓN EDUCATIVA 2024 de la Universidad de Las Palmas de Gran Canaria.
Data Availability Statement
The data presented in this study are available on request from the corresponding author.
Acknowledgments
The authors would like to acknowledge the availability of the technical resources in the laboratories of the University of Las Palmas de Gran Canaria, which were essential for the design and development of the instruments and devices necessary for the completion of this research project.
Conflicts of Interest
The authors declare no conflicts of interest.
References
- He, Z.; Zuazua-Ros, A.; Martín-Gómez, C. Thermoelectric system applications in buildings: A review of key factors and control methods. J. Build. Eng. 2023, 78, 107658. [Google Scholar] [CrossRef] [Scilit]
- Pastukhov, V.G.; Maydanik, Y.F. Temperature control of a heat source using a loop heat pipe integrated with a thermoelectric converter. Int. J. Therm. Sci. 2023, 184, 108012. [Google Scholar] [CrossRef] [Scilit]
- Nasir, M.T.; Afaneh, D.; Abdallah, S. Design Modifications for a Thermoelectric Distiller with Feedback Control. Energies 2022, 15, 9612. [Google Scholar] [CrossRef] [Scilit]
- Yan, Y.; Malen, J.A. Periodic heating amplifies the efficiency of thermoelectric energy conversion. Energy Environ. Sci. 2013, 6, 1267–1273. [Google Scholar] [CrossRef] [Scilit]
- Chen, W.-H.; Wu, P.-H.; Wang, X.-D.; Lin, Y.-L. Power output and efficiency of a thermoelectric generator under temperature control. Energy Convers. Manag. 2016, 127, 404–415. [Google Scholar] [CrossRef] [Scilit]
- Weera, S.; Lee, H.; Attar, A.M. Utilizing effective material properties to validate the performance of thermoelectric cooler and generator modules. Energy Convers. Manag. 2020, 205, 112427. [Google Scholar] [CrossRef] [Scilit]
- Kherkhar, A.; Chiba, Y.; Tlemçani, A.; Mamur, H. Thermal investigation of a thermoelectric cooler based on Arduino and PID control approach. Case Stud. Therm. Eng. 2022, 36, 102249. [Google Scholar] [CrossRef] [Scilit]
- Zhang, J.J. Automatic PID temperature control of thermoelectric cooler based on MSP430. Adv. Mater. Res. 2013, 709, 404–407. [Google Scholar] [CrossRef] [Scilit]
- Wang, N.; Liu, Z.X.; Ding, C.; Zhang, J.-N.; Sui, G.-R.; Jia, H.-Z.; Gao, X.-M. High-efficiency thermoelectric temperature control system with improved proportional-integral-derivative algorithm using energy feedback technique. IEEE Trans. Ind. Electron. 2022, 69, 5225–5234. [Google Scholar] [CrossRef] [Scilit]
- Chen, Z.; Xu, X.; Zhang, J.; Yuan, Y.; Shen, P.; Mou, X. High-efficiency adaptive temperature control for thermoelectric system based on the OBPPID strategy. Energy 2024, 308, 132932. [Google Scholar] [CrossRef] [Scilit]
- Podlubny, I. Fractional Differential Equations: An Introduction to Fractional Derivatives, Fractional Differential Equations, to Methods of Their Solution and Some of Their Applications; Academic Press: San Diego, CA, USA, 1999; Volume 198. [Google Scholar]
- Monje, C.A.; Chen, Y.; Vinagre, B.M.; Xue, D.; Feliu, V. Fractional-Order Systems and Controls: Fundamentals and Applications; Springer: London, UK, 2010; p. 323. [Google Scholar]
- Schiavo, M.; Satué, M.G.; Beschi, M.; Visioli, A.; Arahal, M.R. Robust FOPID control of an after-cooler heat exchanger with TES. IFAC-PapersOnLine 2024, 58, 281–286. [Google Scholar] [CrossRef] [Scilit]
- Ferrer Pareja, M.F.; Sánchez Morales, C.; León Zerpa, F.; Ramos Martín, A. Hybrid PSO-Tuned Fractional-Order Control with Rule-Based Adaptive Supervision for Embedded Thermoelectric Temperature Regulation. Fractal Fract. 2026, 10, 238. [Google Scholar] [CrossRef] [Scilit]
- Ulpiani, G.; Borgognoni, M.; Romagnoli, A.; Di Perna, C. Comparing the performance of on/off, PID and fuzzy controllers applied to the heating system of an energy-efficient building. Energy Build. 2016, 116, 1–17. [Google Scholar] [CrossRef] [Scilit]
- European Thermodynamics Ltd. Thermoelectric Cooler Module ETH-241-10-13-E-H1: Data Sheet. 2019. Available online: https://bit.ly/4tZZALY (accessed on 18 May 2026).
- Littelfuse Inc. USP16673 Thermistor Probe Data Sheet. 2020. Available online: https://bit.ly/4dcbpYe (accessed on 18 May 2026).
- Sensirion AG. SCD4x CO2 Sensor Datasheet. 2021. Available online: https://bit.ly/42kS5D3 (accessed on 18 May 2026).
- Ministry of Public Works (Ministerio de Fomento). “Reference Climate Description Document,” Spanish Building Technical Code (CTE), Madrid, Spain. 2017. Available online: https://bit.ly/3R17c20 (accessed on 18 May 2026).

Disclaimer/Publisher’s Note: The statements, opinions and data contained in all publications are solely those of the individual author(s) and contributor(s) and not of MDPI and/or the editor(s). MDPI and/or the editor(s) disclaim responsibility for any injury to people or property resulting from any ideas, methods, instructions or products referred to in the content. |
© 2026 by the authors. Licensee MDPI, Basel, Switzerland. This article is an open access article distributed under the terms and conditions of the Creative Commons Attribution (CC BY) license.