


Abstract
This study proposes a modification of the Weighted Sum Model (WSM) that formalizes the evaluation generation for alternatives. By integrating objective data with decision-makers’ (DMs’) subjective preferences, the modification addresses a gap in the classical WSM, where evaluations are traditionally assigned subjectively, despite the availability of measurable data describing the alternatives. The modification introduces a structured mechanism for handling heterogeneous data by distinguishing between numerically represented and matrix-represented criteria. The quantitative criteria are processed through normalization procedures aligned with individual DMs’ preferences. Meanwhile, the qualitative characteristics are decomposed into sets of options and structured as binary matrices. The applicability of the modified model is demonstrated through a case study on replacing photovoltaic modules in a public building. Results indicate that changes in DMs’ preferences lead to observable differences in the generated evaluations and in the ranking of the alternatives, even when identical objective data is used. Ultimately, these results demonstrate that the modified WSM improves the flexibility and transparency of the decision-making process, providing a more realistic representation of experts’ preferences. From a sustainability perspective, it facilitates more informed and balanced decisions in the management of energy systems and public infrastructure.
1. Introduction
Multi-Criteria Decision Making (MCDM) is a well-established branch of Operations Research. It aims to systematically support the selection of alternatives characterized by multiple, often conflicting, attributes/criteria [1]. These tasks are particularly relevant to sustainable development, where decision-makers must simultaneously consider economic, technical, and environmental indicators [2,3,4,5]. MacCrimmon [6] structured the decision-making process into three phases: pre-decision, the decision-making itself, and post-decision actions. This conceptual process emphasizes the broad scope of MCDM, ranging from problem formulation to consequence analysis. As the field evolved, Belton and Stewart [7] popularized the term Multiple-Criteria Decision Analysis (MCDA/MCA), which provided a structured framework for practical applications. Although MCDM and MCDA are often used interchangeably, MCDA narrows the scope by focusing on problem structuring, evaluation, and decision-making [8]. Depending on the nature of the tasks, MCDM methods are traditionally divided into Multi-Objective Decision Making (MODM) and Multi-Attribute Decision Making (MADM) [9]. While MODM addresses continuous decisions and optimization problems, MADM focuses on a discrete set of alternatives. Its primary goal is to facilitate a preference comparison, selection, prioritization, sorting, or ranking [10].
The development of MADM has led to theoretical frameworks like MAUT, which maximizes expected utility under uncertainty [11], and MAVT, which uses value functions in deterministic settings [12]. MADM encompasses a wide range of methods, each with its own mathematical models and algorithms. Among the most widely used are the WSM [13], WPM [14], AHP [15], ANP [16], VIKOR [17], TOPSIS [18], ELECTRE [19], PROMETHEE [20], and others. The wide variety of approaches has led to several different classifications described by [21,22]. Researchers classify MADM methods based on features such as the decision-making procedure [23], the theoretical school [24], the algorithmic and computational complexity [25], or the degree of compensation [26].
In this context, the Weighted Sum Model is established as a fundamental compensatory evaluation method within MCDA, MADM, and MAVT. The model aggregates evaluations using weighting coefficients that reflect the relative importance of each criterion [27]. The popularity of WSM stems from its simplicity, transparency, and wide applicability across business, engineering, social, and management problems [28,29,30,31]. These characteristics make it particularly suitable for public sector tasks, where decision-makers must justify choices using clearly defined criteria and a reproducible procedure. A notable example is its application in selecting renewable energy technologies, such as photovoltaic (PV) systems [32,33]. Historically, the model’s prototype dates back to the work of Churchman and Ackoff [34]. The approach quickly entered practical use and underwent testing across various problem areas [35]. Subsequently, researchers formalized the additive weighting concept into a specific algorithm and the mathematical model [6,36]. Triantaphyllou and Mann [13] then fully integrated into the MCDM framework. In the literature, the weighted sum method often appears under different, interchangeable names, without a clear distinction between them—WSM, SAW (Simple Additive Weighting) and WLC (Weighted Linear Combination). Although they share a mathematical foundation, differences arise from their specific algorithmic procedure and disciplinary context. For example, Malczewski [37] notes that WLC is essentially SAW/WSM, yet it serves as the established term in geographical sciences. In project management, authors typically refer to the method as WSM [38,39], while in engineering, the name SAW prevails, as studied by Taherdoost [40]. Over time, the literature has begun to distinguish between the WSM and the SAW [41]. The difference lies not in their mathematical formulation, but in their application algorithms. The SAW algorithm explicitly requires a step to normalize evaluations [42,43,44], alongside a strict constraint that the sum of the weights must equal 1. While in WSM, normalization can be implicitly set through constraints on the subjectively expressed input data. Additionally, the introduction of restrictions on multiplier values through input normalization has been proposed [9], as well as the use of various techniques for determining weight coefficients [45].
As one of the oldest and most fundamental methods in MCDM, WSM has undergone numerous modifications and adaptations with other methods. Most of these modifications aim to: (1) supplement or alter the set of attributes on which the methods are applied; (2) create hybrid models; and (3) incorporate methods for handling uncertainty and ambiguity. Furthermore, the model is increasingly applied to group decision-making MCGDM (Multi-Criteria Group Decision Making) situations [46,47]. Some of these modifications are specifically aimed at group decision-making, where decision-makers are assigned weights that reflect their competence with respect to individual criteria [48]. Other adaptations, such as those by Sorooshian and Parsia [49], allow the use of evaluations and weights from diverse sources and include additional normalization steps. Alanazi et al. [50] developed Dynamic WSM (DWSM), which updates weights over time to reflect changing priorities. Arman et al. [51] presented Homogeneous SAW (H-SAW), which limits the level of compensation between criteria and reduces the risk of overcompensation. The integration of WSM with WPM in methods like WASPAS (Weighted Aggregated Sum Product Assessment) [52] and WISP (Integrated Simple Weighted Sum Product) [53] aims to leverage the advantages of both approaches within a single hybrid method. Moreover, to adapt the WSM for tasks involving incomplete or inaccurate data, researchers have proposed modifications utilizing intuitionistic fuzzy sets (IFS) [54] or gray system theory [55]. The evolution of WSM demonstrates that it is not a forgotten static method, but rather a dynamic tool that adapts to new practical requirements [8].
In parallel, there is a growing trend towards integrating MCDM with data analysis, artificial intelligence, and machine learning [56]. This integration reflects a broader shift toward data-driven approaches across multiple fields, including economics [57], business, healthcare [58], and environmental management and protection [59]. Despite this trend, in classical WSM and its modifications, the evaluations of alternatives often remain subjective. To address this research gap, this paper investigates the following central question: How can available objective data be integrated with the subjective preferences of DMs during the decision-making process? This can be achieved by distinguishing between numerically and matrix-represented criteria to handle quantitative and qualitative data. The mechanism underlying this approach aligns with the concept of decomposing attributes into more elementary components (indicator variables), a practice discussed in the MAVT and multi-attribute decision analysis literature [60]. Therefore, this study contributes to a more precise ranking of alternatives by mandatory inclusion of objective data that is combined with DMs’ subjective preferences. The proposed WSM modification is demonstrated through a case study for ranking of photovoltaic modules for the replacement of an existing rooftop solar installation in a public building.
2. Methodology
This section presents the proposed modification of the Weighted Sum Model. First, the classical WSM formulation is briefly presented. Next, the proposed modified mathematical model based on objective data and DMs’ subjective preferences is introduced. Finally, the algorithmic procedure for applying the modified model is described.
2.1. Classic WSM Model
As a well-established MCDM method, the classical WSM formulation for individual decision-making is expressed as follows [13]:
where expresses the aggregated evaluation score of the -th alternative among a total of alternatives. This score is calculated as the weighted sum of the alternative’s performances, where denotes the weight coefficient for importance for the -th criterion (out of a total of criteria), and is the evaluation assigned to the -th alternative with respect to the -th criterion.
By introducing restrictions on the multiplier values through input data normalization [9] and extending the problem to the general case of group decision-making, the WSM model can be represented in the following form [61]:
subject to constraints, which ensure normalized input values:
where expresses the aggregated group score of the -th alternative. The iterator denotes the DMs, the total number of which is . For proper normalization, the evaluation scores assigned by each DM to each alternative , as well as the weight coefficients for criteria importance , must fall within the interval [0, 1]. Additionally, to maintain relative weighting, the sum of must equal 1 for each DM.
The normalized data are organized into a decision matrix. Although this term includes the word “matrix”, applying WSM does not involve linear algebra operations. Instead, it relies on arithmetic transformations such as weighting and aggregation. The term has been historically established as a convenient way to denote tabular data. This structure provides a clear, compact organization of information and serves as a starting point for applying the aggregation model. In the context of group decision-making, the typical structure of the decision matrix is illustrated in Table 1.
Table 1.
Decision matrix for the classical WSM model.
2.2. Modified WSM Model
In the classical WSM, decision-makers have to assign evaluations to alternatives across various criteria, yet the method lacks a concrete mechanism for forming these scores. Consequently, these evaluations are typically considered subjective, as they rely entirely on the DMs’ individual judgments. However, in the era of data abundance, methods for data collection, structuring, and analysis have advanced rapidly [62,63]. This progress enables the integration of data into classical decision-making models, which were originally developed when the information availability was limited.
Building on this premise, the study proposes a modified WSM that replaces subjectively assigned evaluations with scores generated from objective data combined with the DMs’ preferences. This approach is particularly relevant for sustainable development tasks, where decisions depend on a large volume of objective technical, economic, and environmental indicators. A typical example is the assessment of renewable energy technologies, such as photovoltaic systems. To achieve this, the model processes heterogeneous data based on its qualitative or quantitative nature, categorizing the criteria into two distinct types:
- Matrix-represented criteria;
- Numerically represented criteria.
Matrix-represented criteria handle qualitative data by decomposing the criterion into a set of options available for the alternatives. For each criterion of this type, a binary matrix is constructed where the rows correspond to the alternatives, the columns to the options, and the values indicate the presence or absence of a specific option within the alternative. Such representation is conceptually similar to additive value models used in MAVT, where qualitative attributes may be represented by indicator variables [26]. For instance, when selecting photovoltaic modules, a criterion like “Silicon Technology Type” can be decomposed into options such as monocrystalline or polycrystalline technology. In turn, the DMs express their preferences regarding these options by assigning a preference score from a predefined scale.
Numerically represented criteria handle quantitative data, expressing each alternative directly through a numerical value. In this case, the role of the DMs is to express their preferences on whether the values have to be interpreted as cost or benefit. For example, the “Nominal power” criterion of a photovoltaic module can feature direct numerical values, such as 400 W, 450 W, etc., which are subsequently normalized based on the DM’s preferences. Alternatively, the same criterion can be represented in a matrix form by treating the distinct numerical values as separate qualitative options. This allows the DM to express a direct preference for a highly specific quantitative value rather than a general maximization or minimization trend.
The main novelty of this approach lies in the formalized generation of alternatives’ evaluations by combining objective data with DMs’ subjective preferences. Based on this concept, the modified WSM model in the general case of group decision-making is represented as follows:
where represents the aggregated group score of the -th alternative derived from the modified model, while denotes the generated evaluation of the -th alternative with respect to the -th criterion, considering the preferences of the -th DM. The remaining parameters () retain their definitions from the classical WSM described above. Depending on the criterion type (numerically or matrix-represented), two types of generated scores are distinguished:
where is the evaluation generated for a criterion of numerically represented type, and is the evaluation generated for a criterion of matrix-represented type. Depending on the preferences of the DM, the evaluation takes one of two values after applying an appropriate normalization technique for the particular problem [64]:
where stands for the raw objective numerical value of the -th alternative against the -th criterion. It is subsequently normalized as either a benefit (maximize) or cost (minimize) attribute depending on the -th decision-maker’s preference. To prevent redundant calculations, the normalization technique is applied after the DM specifies a preference direction (benefit or cost).
The evaluation of an alternative against matrix-represented criteria, denoted as , is calculated using the following formula:
subject to:
where signifies the total number of defined options extracted for the -th matrix-represented criterion, while represents the explicit preference score assigned to the -th option by the -th DM. Additionally, denotes the maximum possible score on the predefined evaluation scale used by the decision-makers, and is the binary matrix element indicating the presence (1) or absence (0) of the -th option in the -th alternative. The denominator represents the maximum theoretical score of an ideal alternative that possesses all available options. This ensures that the generated evaluation is strictly normalized within the [0, 1] interval. While this approach may result in lower absolute values for alternatives possessing fewer options, it preserves the exact proportional differences between them. Maintaining these proportions is essential for an accurate relative ranking within the WSM. Similar to binary attribute representation [26], matrix-represented criteria are decomposed into options and represented as binary matrices. The resulting matrices, together with the preference vectors used to calculate the generated evaluations, are presented in Table 2.
Table 2.
Binary option matrix and DM preference vectors used for evaluation generation.
After generating the evaluations for alternatives, the data for applying the modified WSM mathematical model can be structured into a decision matrix, as shown in Table 3.
Table 3.
Decision matrix for the modified WSM model.
The proposed modification reduces subjectivity in the evaluation of alternatives by replacing the direct assignment of evaluations with the specification of DMs’ preferences. Furthermore, this approach allows the actual alternatives to remain hidden from the DMs, making it suitable for decision-making situations, where impartiality and confidentiality are important. Ultimately, this approach enables a more transparent and objective decision-making process—a critical requirement for tasks involving the sustainable management of public resources and the implementation of sustainable technologies.
2.3. Modified WSM Algorithm
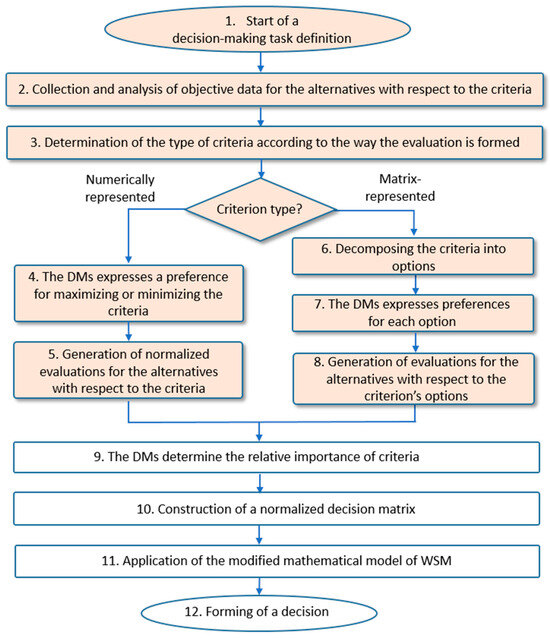
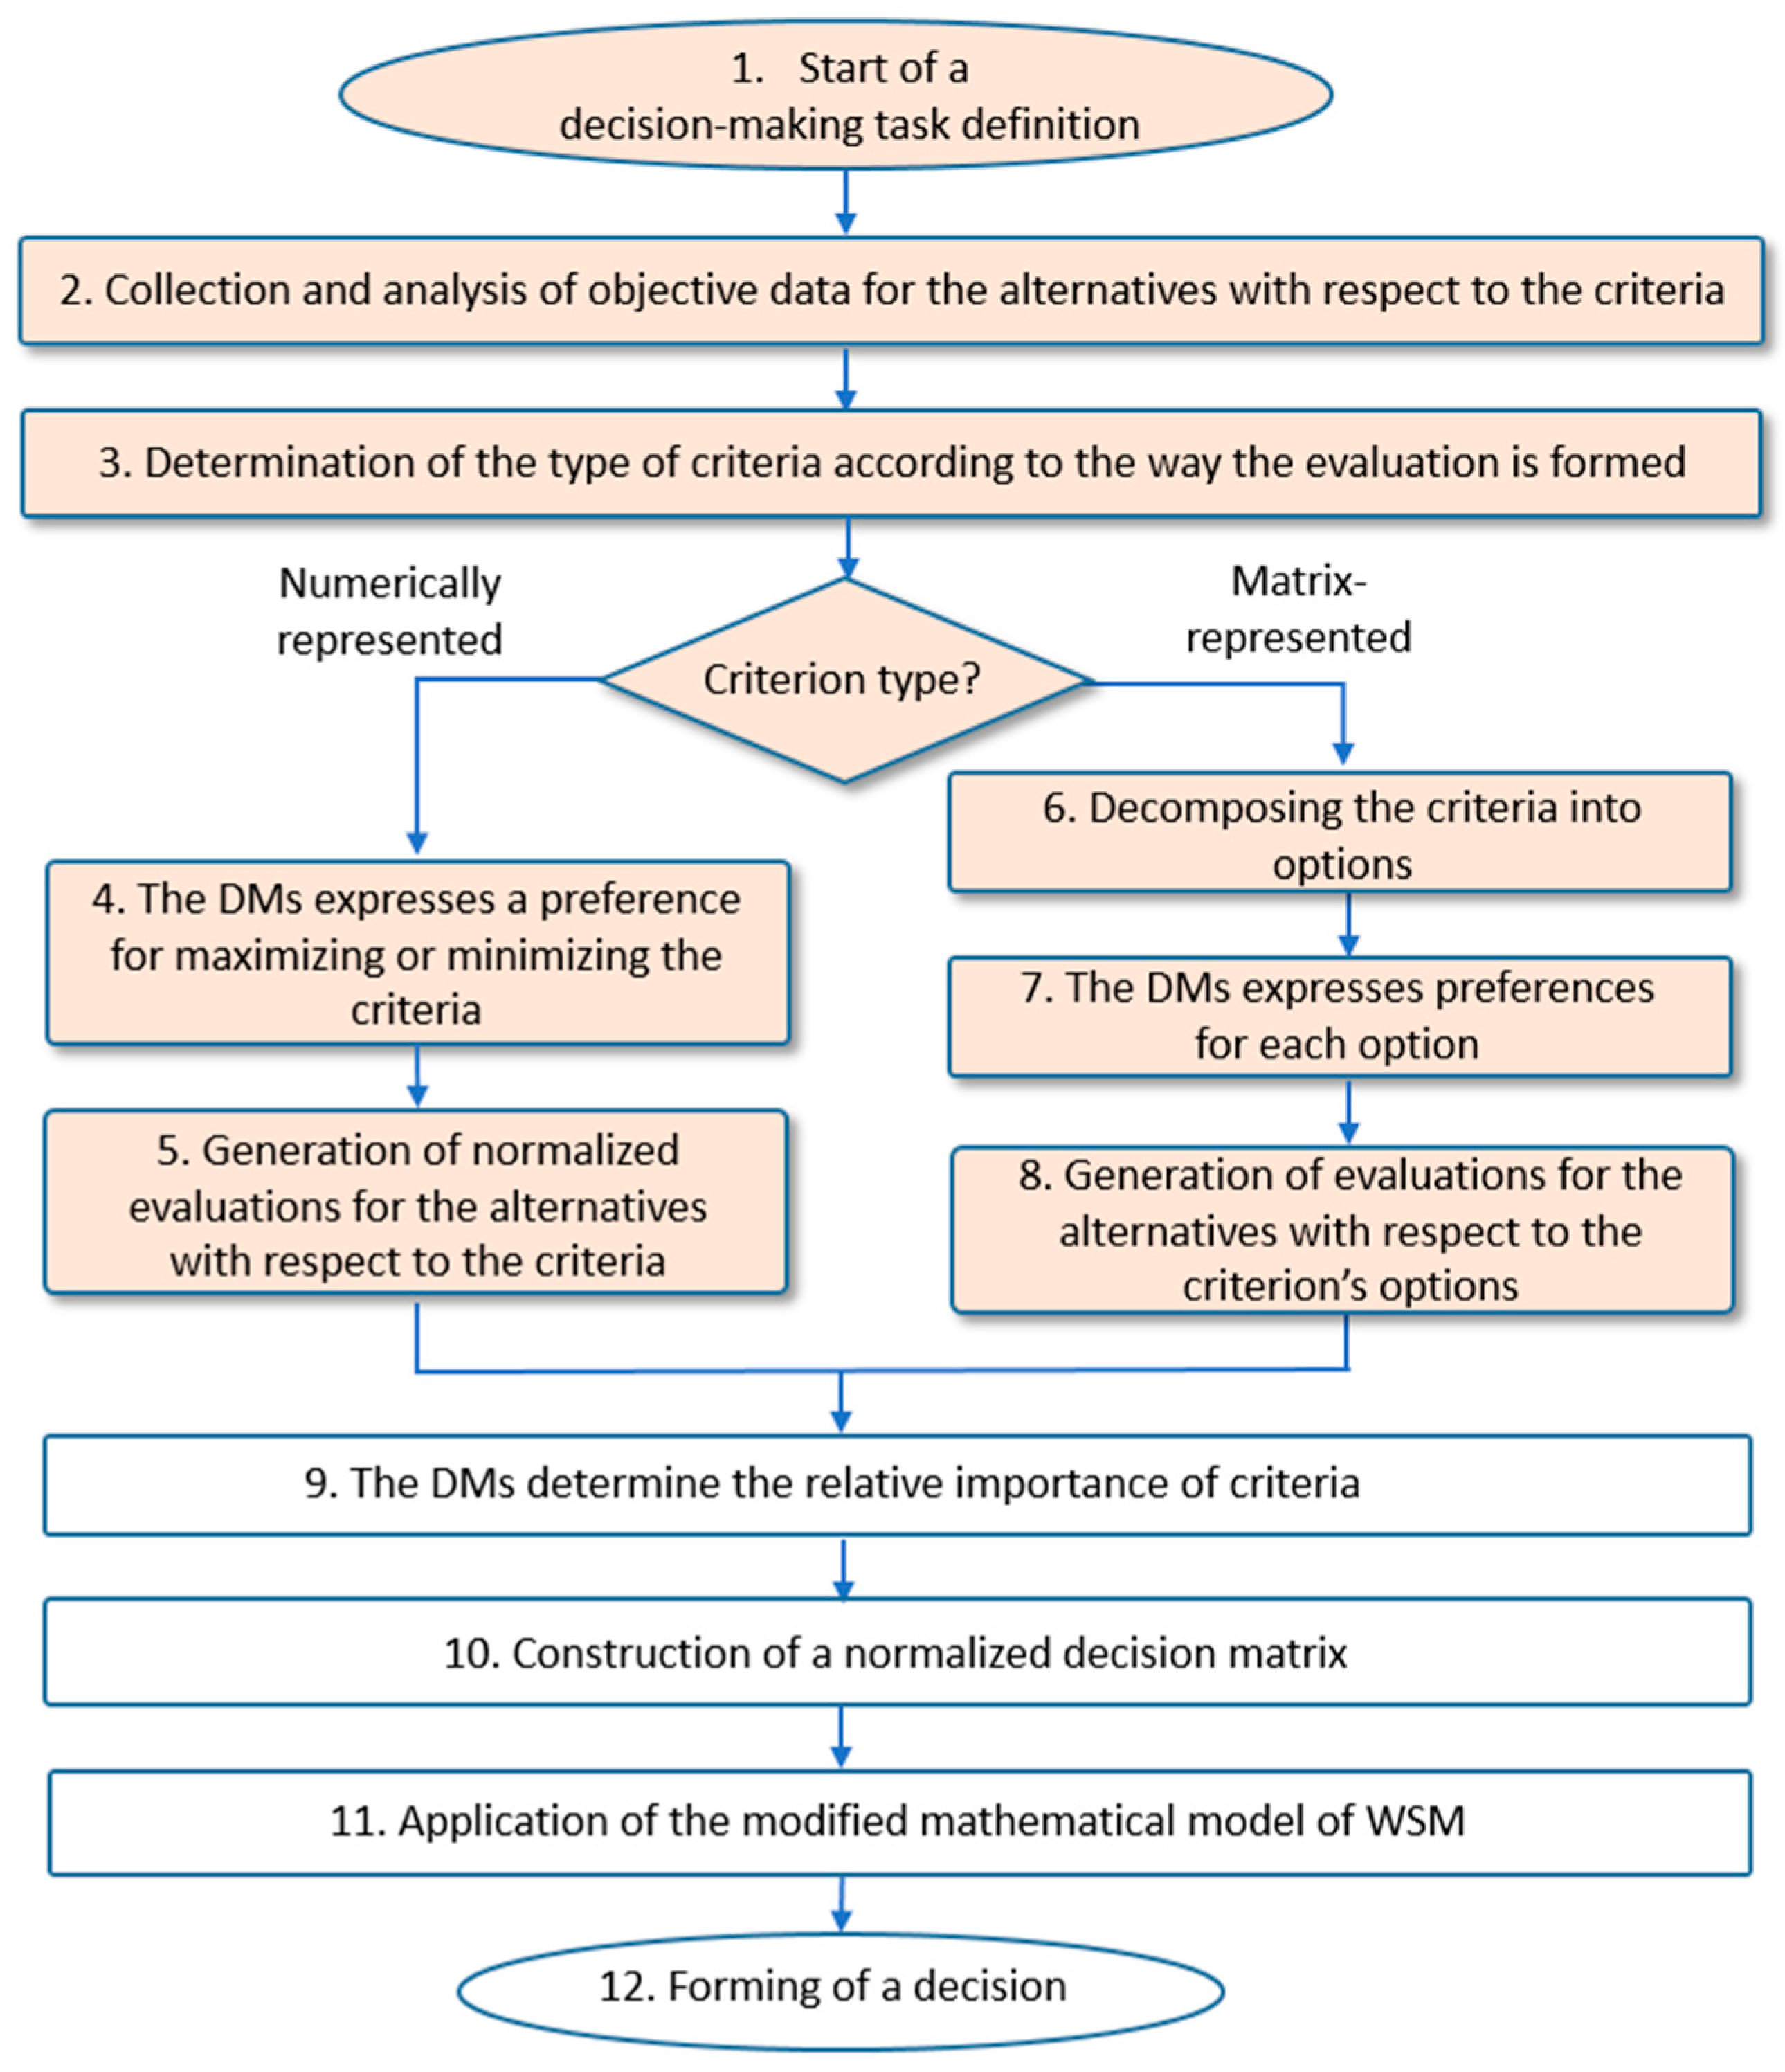
The proposed modification can be applied to practical problems by following the steps of the algorithm illustrated schematically in Figure 1.
Figure 1.
Algorithm of the proposed WSM modification for generating alternative evaluations.
Step 1. Define the main parameters of the decision-making problem, including the complete sets of alternatives, criteria, and decision-makers.
Step 2. Collect and analyze objective data regarding the alternatives across the defined criteria. This stage aims to transform the raw data into a form suitable for subsequent use in the model. In addition, an appropriate normalization technique should be selected, and criteria should be filtered, ensuring that dependent and mutually exclusive attributes are properly addressed. Standard data collection and analysis methods from statistics and data science can be applied in this phase.
Step 3. Determine the type of each criterion. The criteria can be either numerically represented or matrix-represented.
In case the criterion is numerically represented, proceed to Step 4:
Step 4. The decision-maker determines whether the quantitative data for the given criterion should be processed as benefit or cost during normalization.
Step 5. Generate an evaluation for the alternatives for the numerically represented criterion. Apply an appropriate normalization technique based on the selected benefit or cost preference.
In case the criterion is matrix-represented, proceed to Step 6:
Step 6. Decompose each matrix-represented criterion into a set of options extracted from all alternatives. Ensure that every defined option is present in at least one alternative to prevent unnecessary expansion of the option list. Next, construct a binary matrix that maps the presence of an option within an alternative to a value of 1, and its absence to a value of 0.
Step 7. The DM evaluates the importance of each extracted option by assigning preference scores from a predefined linear scale. It should be noted that any appropriate linear scale can be utilized.
Step 8. Generate an evaluation for the alternatives for the matrix-represented criterion by combining the binary matrix with the DM’s preference vector.
The preceding steps replace the subjective evaluation phase from the classical algorithm. The process resumes following the steps from the classical WSM algorithm:
Step 9. The decision-maker determines the relative weighting coefficients for the criteria importance.
Step 10. Populate the decision matrix using the generated alternatives’ evaluations.
Step 11. Aggregate the evaluations for the alternatives by applying the modified WSM mathematical model.
Step 12. Rank the alternatives based on their final aggregated evaluation scores to obtain the final decision result.
It should be noted that the selection of a specific normalization technique and identifying the methods for data collection, data analysis, criteria selection and filtering depend on the context of the particular task and remain beyond the scope of this study.
3. Case Study of Photovoltaic Module Replacement in a Public Building
Recent studies emphasize the importance of sustainable and resource-efficient approaches in environmental management and urban energy planning [65,66]. This is driven by the ongoing transition to low-carbon energy systems, which is a key priority for climate policy and sustainable urban development. Public buildings often implement photovoltaic (PV) systems as part of sustainable energy strategies aimed at reducing greenhouse gas emissions [67]. These PV systems can also lower electricity costs in residential buildings through local production, thereby reducing reliance on the electricity grid [68].
3.1. Problem Description
This case study addresses the ranking of photovoltaic modules for replacing an existing rooftop photovoltaic installation on a public building. Because the current mounting structure, wiring, and inverter configuration remain functional, the project team decided to retain them. To ensure the sustainable use of existing resources and minimize the generated waste, the replacement approach targets only the components that are most significantly degraded: the PV modules. The building provides municipal administrative services, and its peak daily electricity consumption coincides directly with daylight hours, making it suitable for solar energy utilization. The rooftop installation covers an area of approximately 200 m2 and features a southern orientation, creating favorable conditions for solar electricity production.
The decision-making process considers five alternative rooftop PV modules in a residential format (1722–1762 × 1134 × 30 mm) from leading manufacturers. These modules are widely used in rooftop installations and have publicly available technical specifications. To avoid excessive shipping costs, the selection was strictly limited to the local market. These options were then pre-screened for electrical and structural compatibility with the existing infrastructure. Ultimately, the following five verified alternatives successfully satisfied all economic and technical constraints: —JinkoSolar Tiger Neo 54HL4R-(V) 435 W, Jinko Solar Co., Ltd., Shanghai, China; —CanadianSolar HiHero CS6R-435H-AG, CSI Solar Co., Ltd., Suzhou, China; —SunTech UltraV STP405S-C54/Umhm, Wuxi Suntech Power Co., Ltd., Wuxi, China; —JA Solar Deep Blue 3.0 Light JAM54S31-390/MR, JA Technology Co.,Ltd., Beijing, China; and —LeaptonSolar LP182*182-M-54-NB, Leapton Energy Co., Ltd., Kobe, Japan. A group of three decision-makers, all relevant to the implementation and operation of PV systems, conducts the evaluation: —energy efficiency expert, —photovoltaic systems engineer and —representative of the municipal administration responsible for the management of the building stock.
Solving this task requires the simultaneous consideration of various technical, economic and operational factors, alongside stakeholder requirements. The available information for each alternative includes both quantitative indicators and qualitative characteristics of the modules. This diversity in data types makes the problem highly suitable for applying the proposed WSM modification, which generates evaluations for alternatives by combining objective data with the subjective preferences of the decision-makers. Ultimately, this case study demonstrates the applicability of the proposed model in sustainable energy management in public infrastructure.
3.2. Evaluation Criteria
To evaluate the alternatives, a set of criteria was defined to reflect the main characteristics of the PV modules, tailored strictly to the constraints of replacing an existing rooftop installation. In accordance with Step 3 of the proposed algorithm, each criterion was classified based on its data representation type. The criteria types, alongside the weighting coefficients assigned by the decision-makers in accordance with the constraints of Equations (3) and (4), are presented in Table 4.
Table 4.
Evaluation criteria: criteria types and importance weight coefficients.
The numerically represented criteria evaluate the quantitative performance and physical constraints of the modules. The nominal maximum power (Pmax) () is a key indicator of the energy potential of the module. Module efficiency () reflects its ability to convert solar energy into electricity and serves as an indicator of the effective use of the available area. The temperature coefficient of power () measures output variation relative to temperature changes, representing real-world operating performance. Module weight () is evaluated to account for the mechanical load imposed on the rooftop structure. Finally, annual degradation () and linear power performance warranty () jointly assess long-term reliability and operational sustainability. The former measures the yearly reduction in output power, while the latter guarantees the minimum retained power over a specified operational lifespan.
In addition to quantitative indicators, the model incorporates matrix-represented criteria to evaluate technological and structural characteristics. The photovoltaic cell technology () defines the underlying manufacturing approach, directly impacting both efficiency and degradation rates. The module encapsulation structure () refers to the outer layer of the module, defining the mechanical resistance and durability of the panel. Additionally, the light absorption faces () criterion distinguishes between monofacial and bifacial modules, indicating whether the panel absorbs solar irradiance from only the front or from both sides.
Certain electrical parameters, like Voc, Isc, and Vmpp, serve strictly as compatibility constraints for the existing inverter, wiring, and mounting infrastructure, rather than as comparative evaluation criteria. Furthermore, attributes that fail to distinguish between alternatives were excluded from the evaluation set to prevent redundancy. This includes parameters with identical values across all considered modules (such as Half-Cut cell architecture) and highly correlated dependencies (for instance, P-type cells inherently implying PERC technology, whereas N-type correlates with TOPCon or HJT). Excluding these redundant parameters ensures a more concise and statistically robust decision matrix.
3.3. Test Scenarios, Objective Data and Preferences
To demonstrate the effect of the proposed WSM modification, the investigated case study is analyzed through two test scenarios. Both scenarios use the same set of objective data for the alternatives. This approach ensures result comparability, as any differences between the scenarios arise solely from how the decision-makers’ preferences are incorporated.
Scenario 1 applies a traditional approach, where the task administrator centrally defines the normalization direction (benefit or cost) for the numerically represented criteria, and this uniform direction is applied for all decision-makers. Conversely, Scenario 2 demonstrates the capability of the proposed evaluation-generation mechanism by directly incorporating the individual DMs’ preferences into the evaluation process. This direct incorporation applies both to the processing of numerically represented criteria and to the assessment of options in matrix-represented criteria. Together, these two scenarios establish an experimental framework that enables comparison of outcomes and allows for discussion on how the proposed modification impacts the evaluation and aggregation process.
The numerically represented criteria are listed in Table 5. Objective data for the considered PV modules were obtained from the official distributors and publicly available technical datasheets provided by the manufacturers. These values reflect Standard Test Conditions (STC): irradiance of 1000 W/m2, spectrum AM 1.5 and a cell temperature of 25 °C. In accordance with Step 4 of the proposed algorithm, the same table also presents the individual DMs’ preferences for normalization direction.
Table 5.
Numerically represented criteria: measurement units, objective data for alternative, and DMs’ preferences under Scenario 1 and Scenario 2.
The decomposition of matrix-represented criteria into discrete options is illustrated in Table 6. The binary values for each alternative are defined in accordance with Steps 6–7 of the proposed algorithm, strictly satisfying the constraints specified in Equations (9) and (10). The table also outlines the DMs’ expressed option preferences for both scenarios. For this case study, the evaluation utilizes a scale from 1 to 5, where 1 indicates the lowest level of importance and 5 indicates the highest.
Table 6.
Matrix-represented criteria: binary options matrix and DMs’ preference vectors under Scenario 1 and Scenario 2.
This proposed mechanism effectively formalizes criteria that lack direct numerical values into discrete options, capturing the primary differences among the alternatives. For example, regarding power tolerance (), the options differentiate the manufacturing tolerance ranges where the actual output power exceeds Pmax. This characteristic is important in systems comprising a large number of modules, as the accumulation of small power deviations can significantly impact the total energy yield.
4. Results and Discussion
4.1. Results Under Scenario 1
In Scenario 1, evaluations rely on a centrally set normalization direction for the numerically represented criteria, applied uniformly across all DMs. The resulting group decision-making matrix, populated with the generated scores, is provided in Table 7.
Table 7.
Decision matrix with generated evaluations for Scenario 1.
Following Equation (7), the generated evaluations for the numerically represented criteria, , are computed based on the objective data and preferences presented in Table 5. In this case study, a linear normalization using Max-Min [64] is applied, as illustrated by the following calculations for alternative against the criterion , where the raw value is 435 W:
The presence of negative values in criterion requires specific handling when using the selected normalization technique. To ensure the normalized values remain within the interval [0, 1] without distorting the relative order of the alternatives, the normalization interval is shifted by a constant of −1.
Conversely, evaluations for the matrix-represented criteria, are calculated using Equation (8), drawing on the data and preferences outlined in Table 6. The following example illustrates this computation for alternative under the criterion by decision-maker :
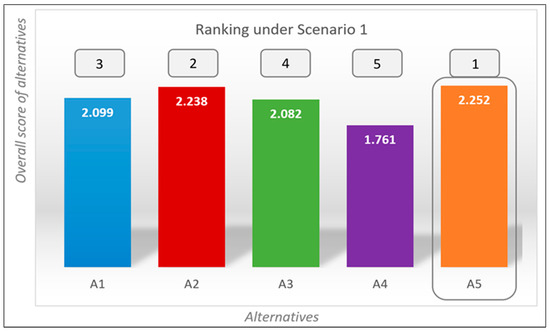
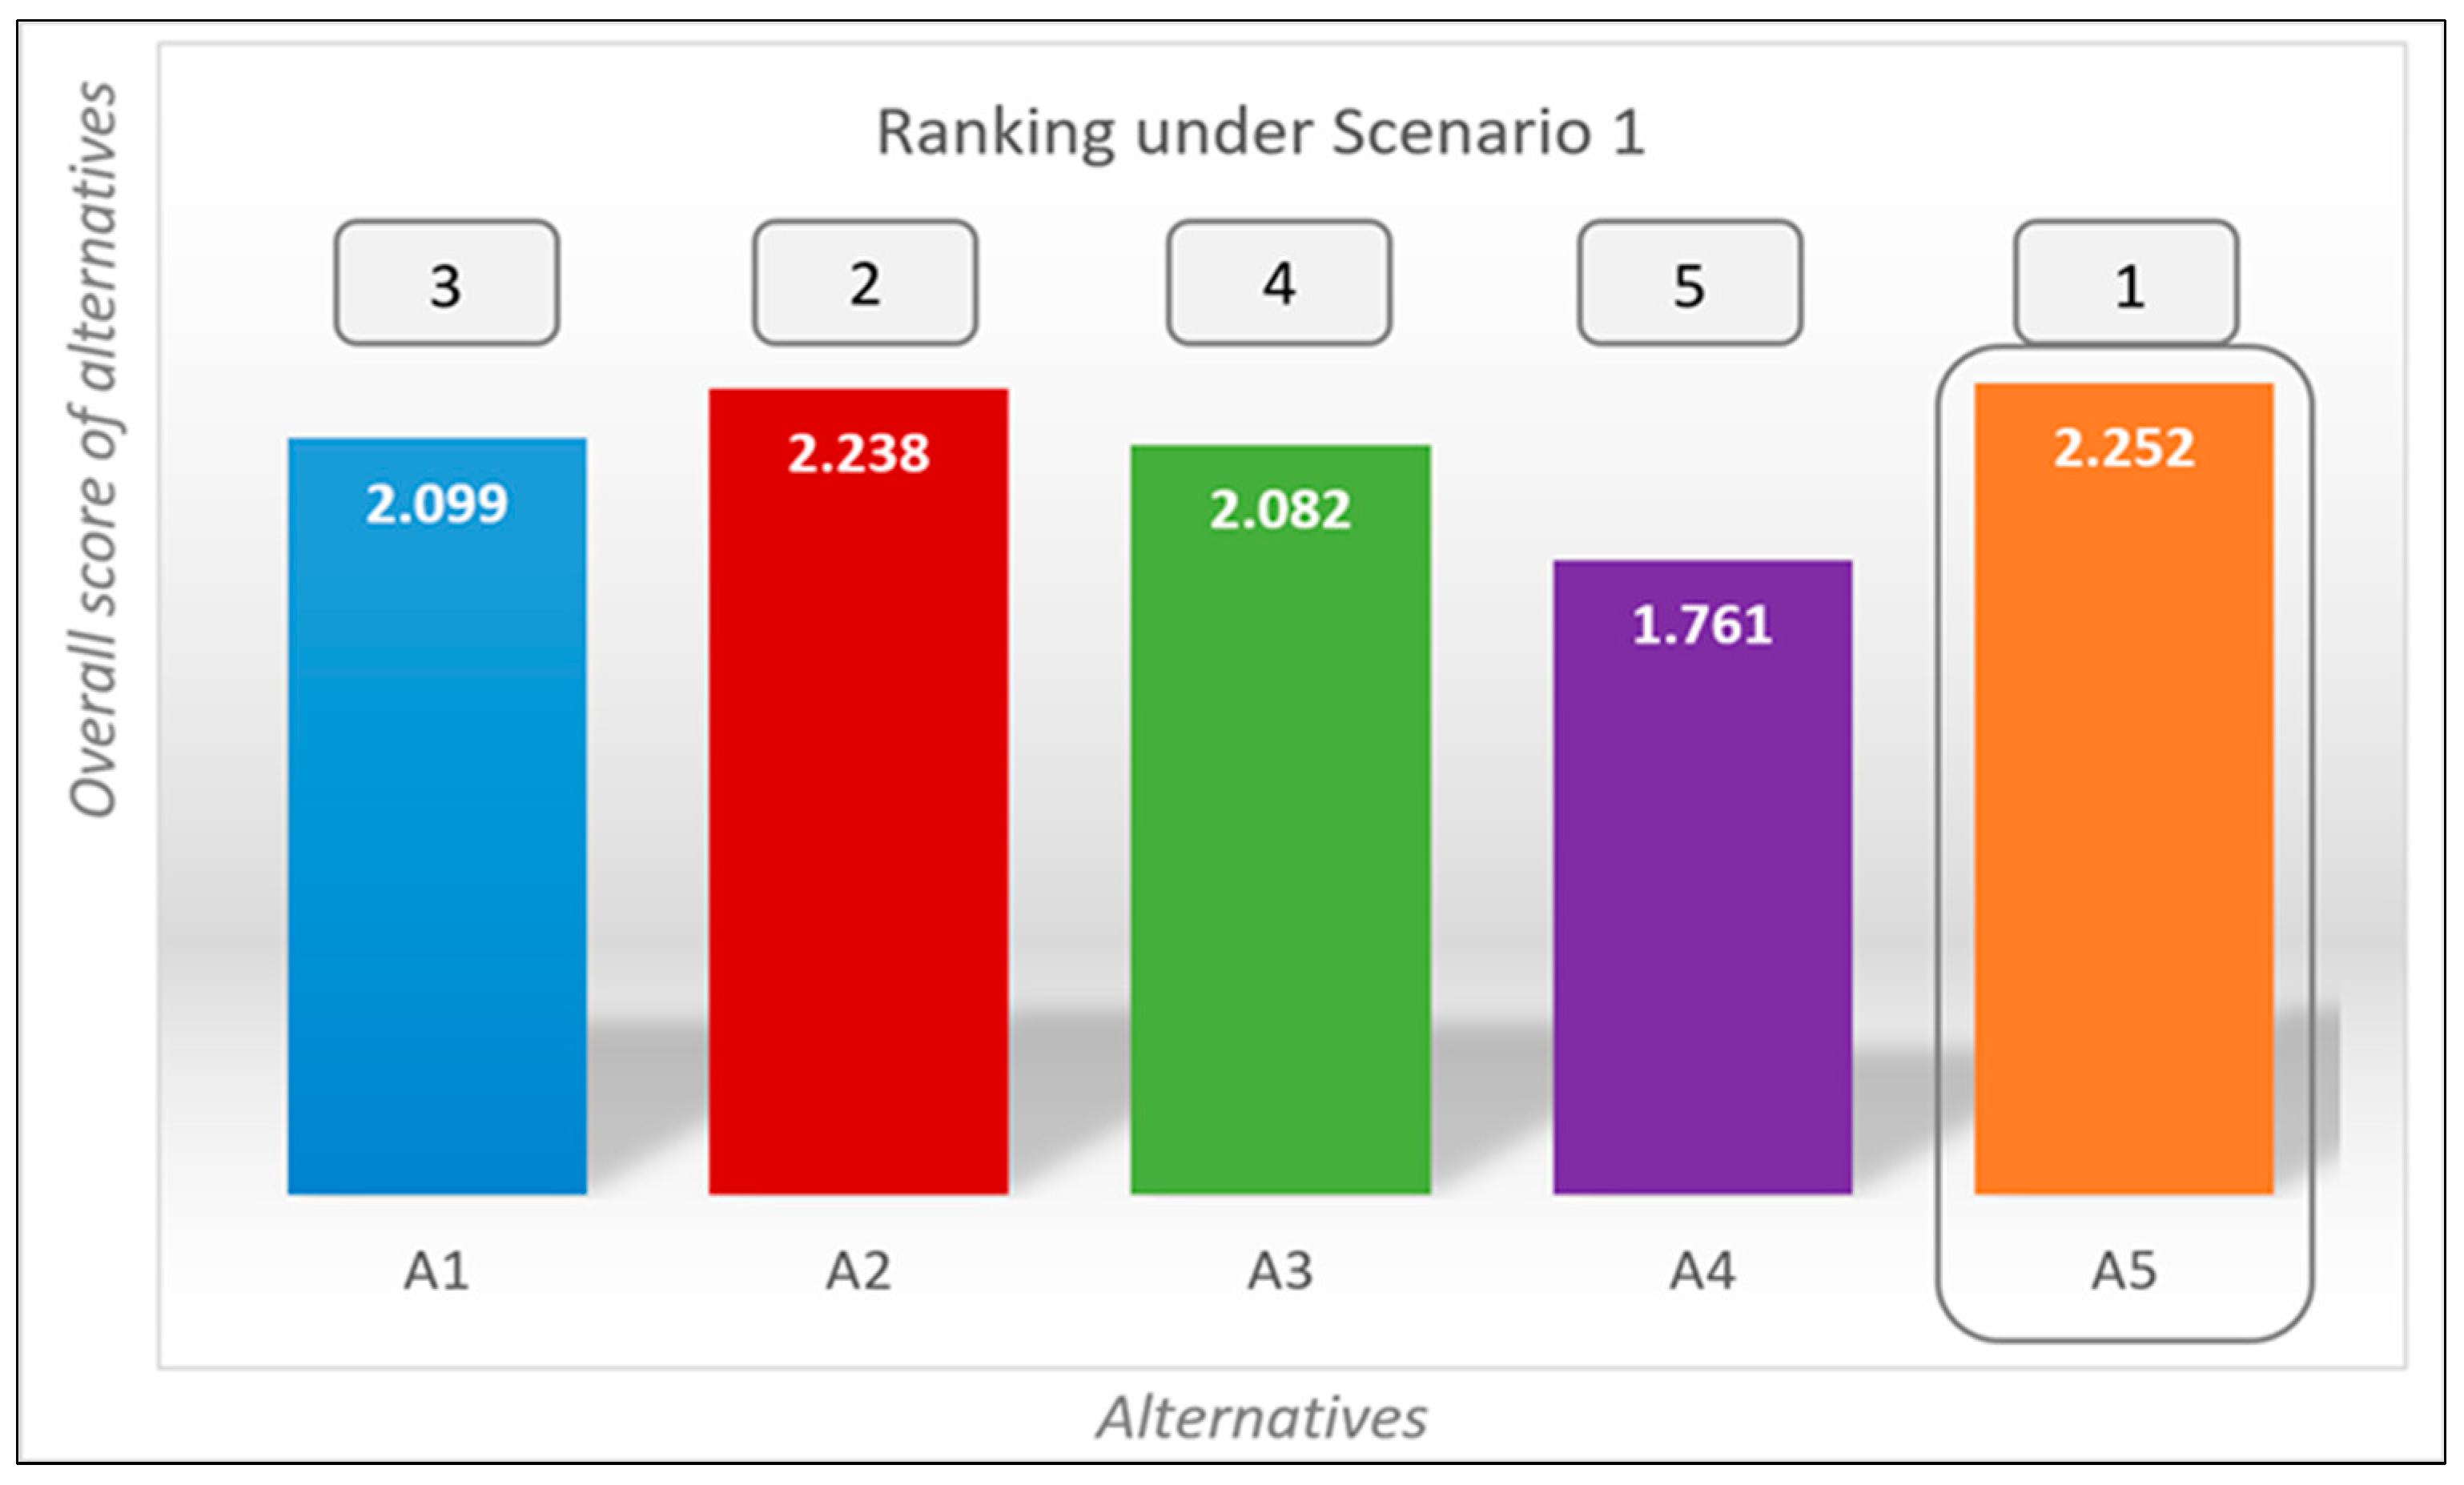
Using the evaluations from Table 7, the modified WSM calculates the aggregated evaluation score for each alternative. The final results and the ranking of the alternatives are presented in Figure 2, revealing a clear distinction between the leading and lower-performing alternatives.
Figure 2.
Aggregated scores and ranking of the alternatives under Scenario 1.
The most preferred alternative is , with following closely behind. With a significant lag, alternative remains last.
4.2. Results Under Scenario 2
In contrast, Scenario 2 generates alternative evaluations using completely individualized preference settings for each decision-maker. Table 8 presents the group decision-making matrix with the generated evaluations filled in.
Table 8.
Decision matrix with generated evaluations for Scenario 2.
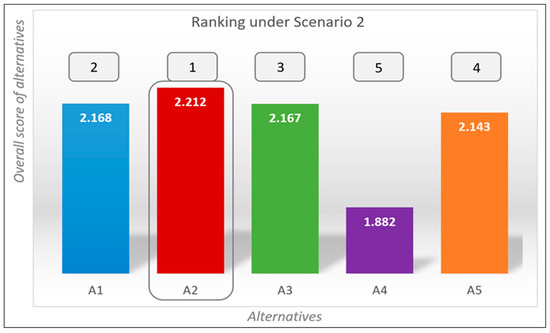
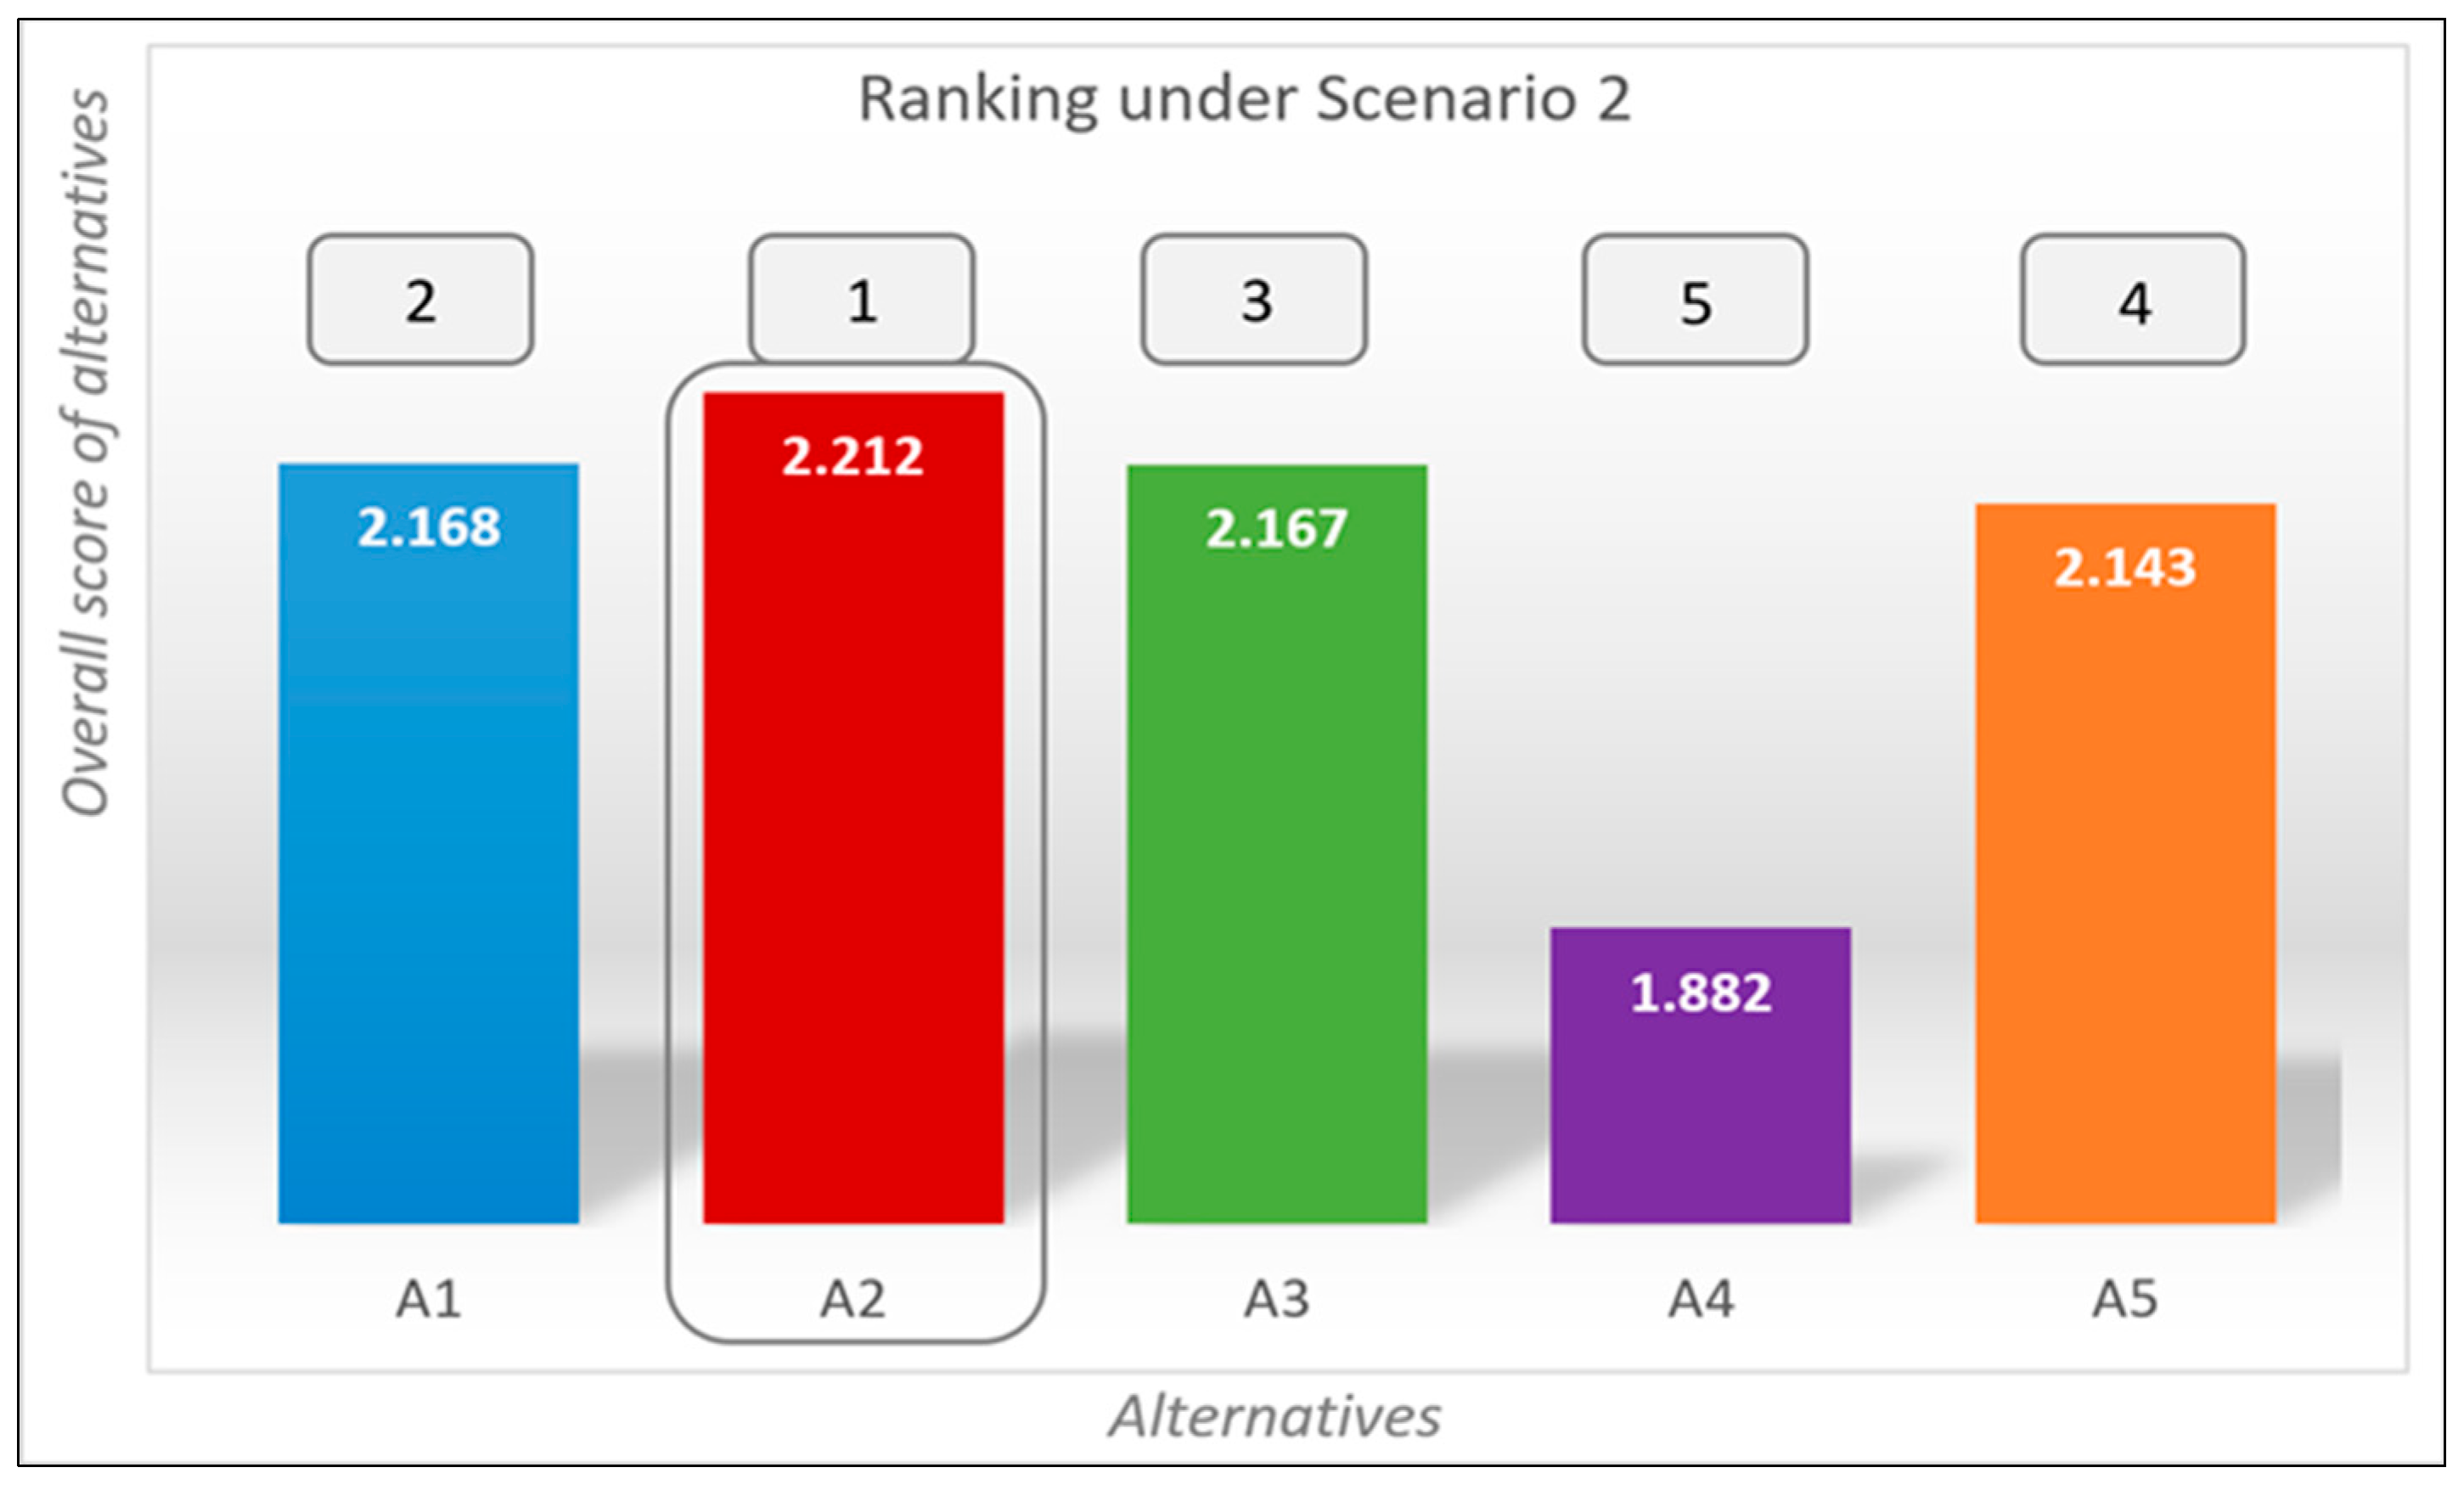
Figure 3 illustrates the aggregated results for the second scenario. Despite using the same objective data, modifying the preferences leads to a change in the relative positioning of the alternatives. Compared to Scenario 1, noticeable differences emerge in both the final aggregated scores and the definitive ranking, confirming the substantial influence of individual preference integration on the overall evaluation process.
Figure 3.
Aggregated scores and ranking of the alternatives under Scenario 2.
Specifically, alternative surpasses the initially most preferred alternative . Alternatives and achieve closely matched results, and although alternative improves its score, it remains ranked last.
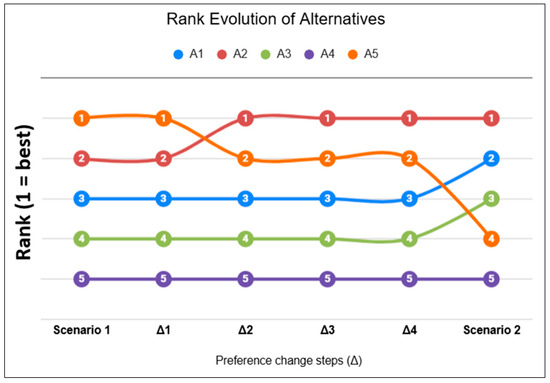
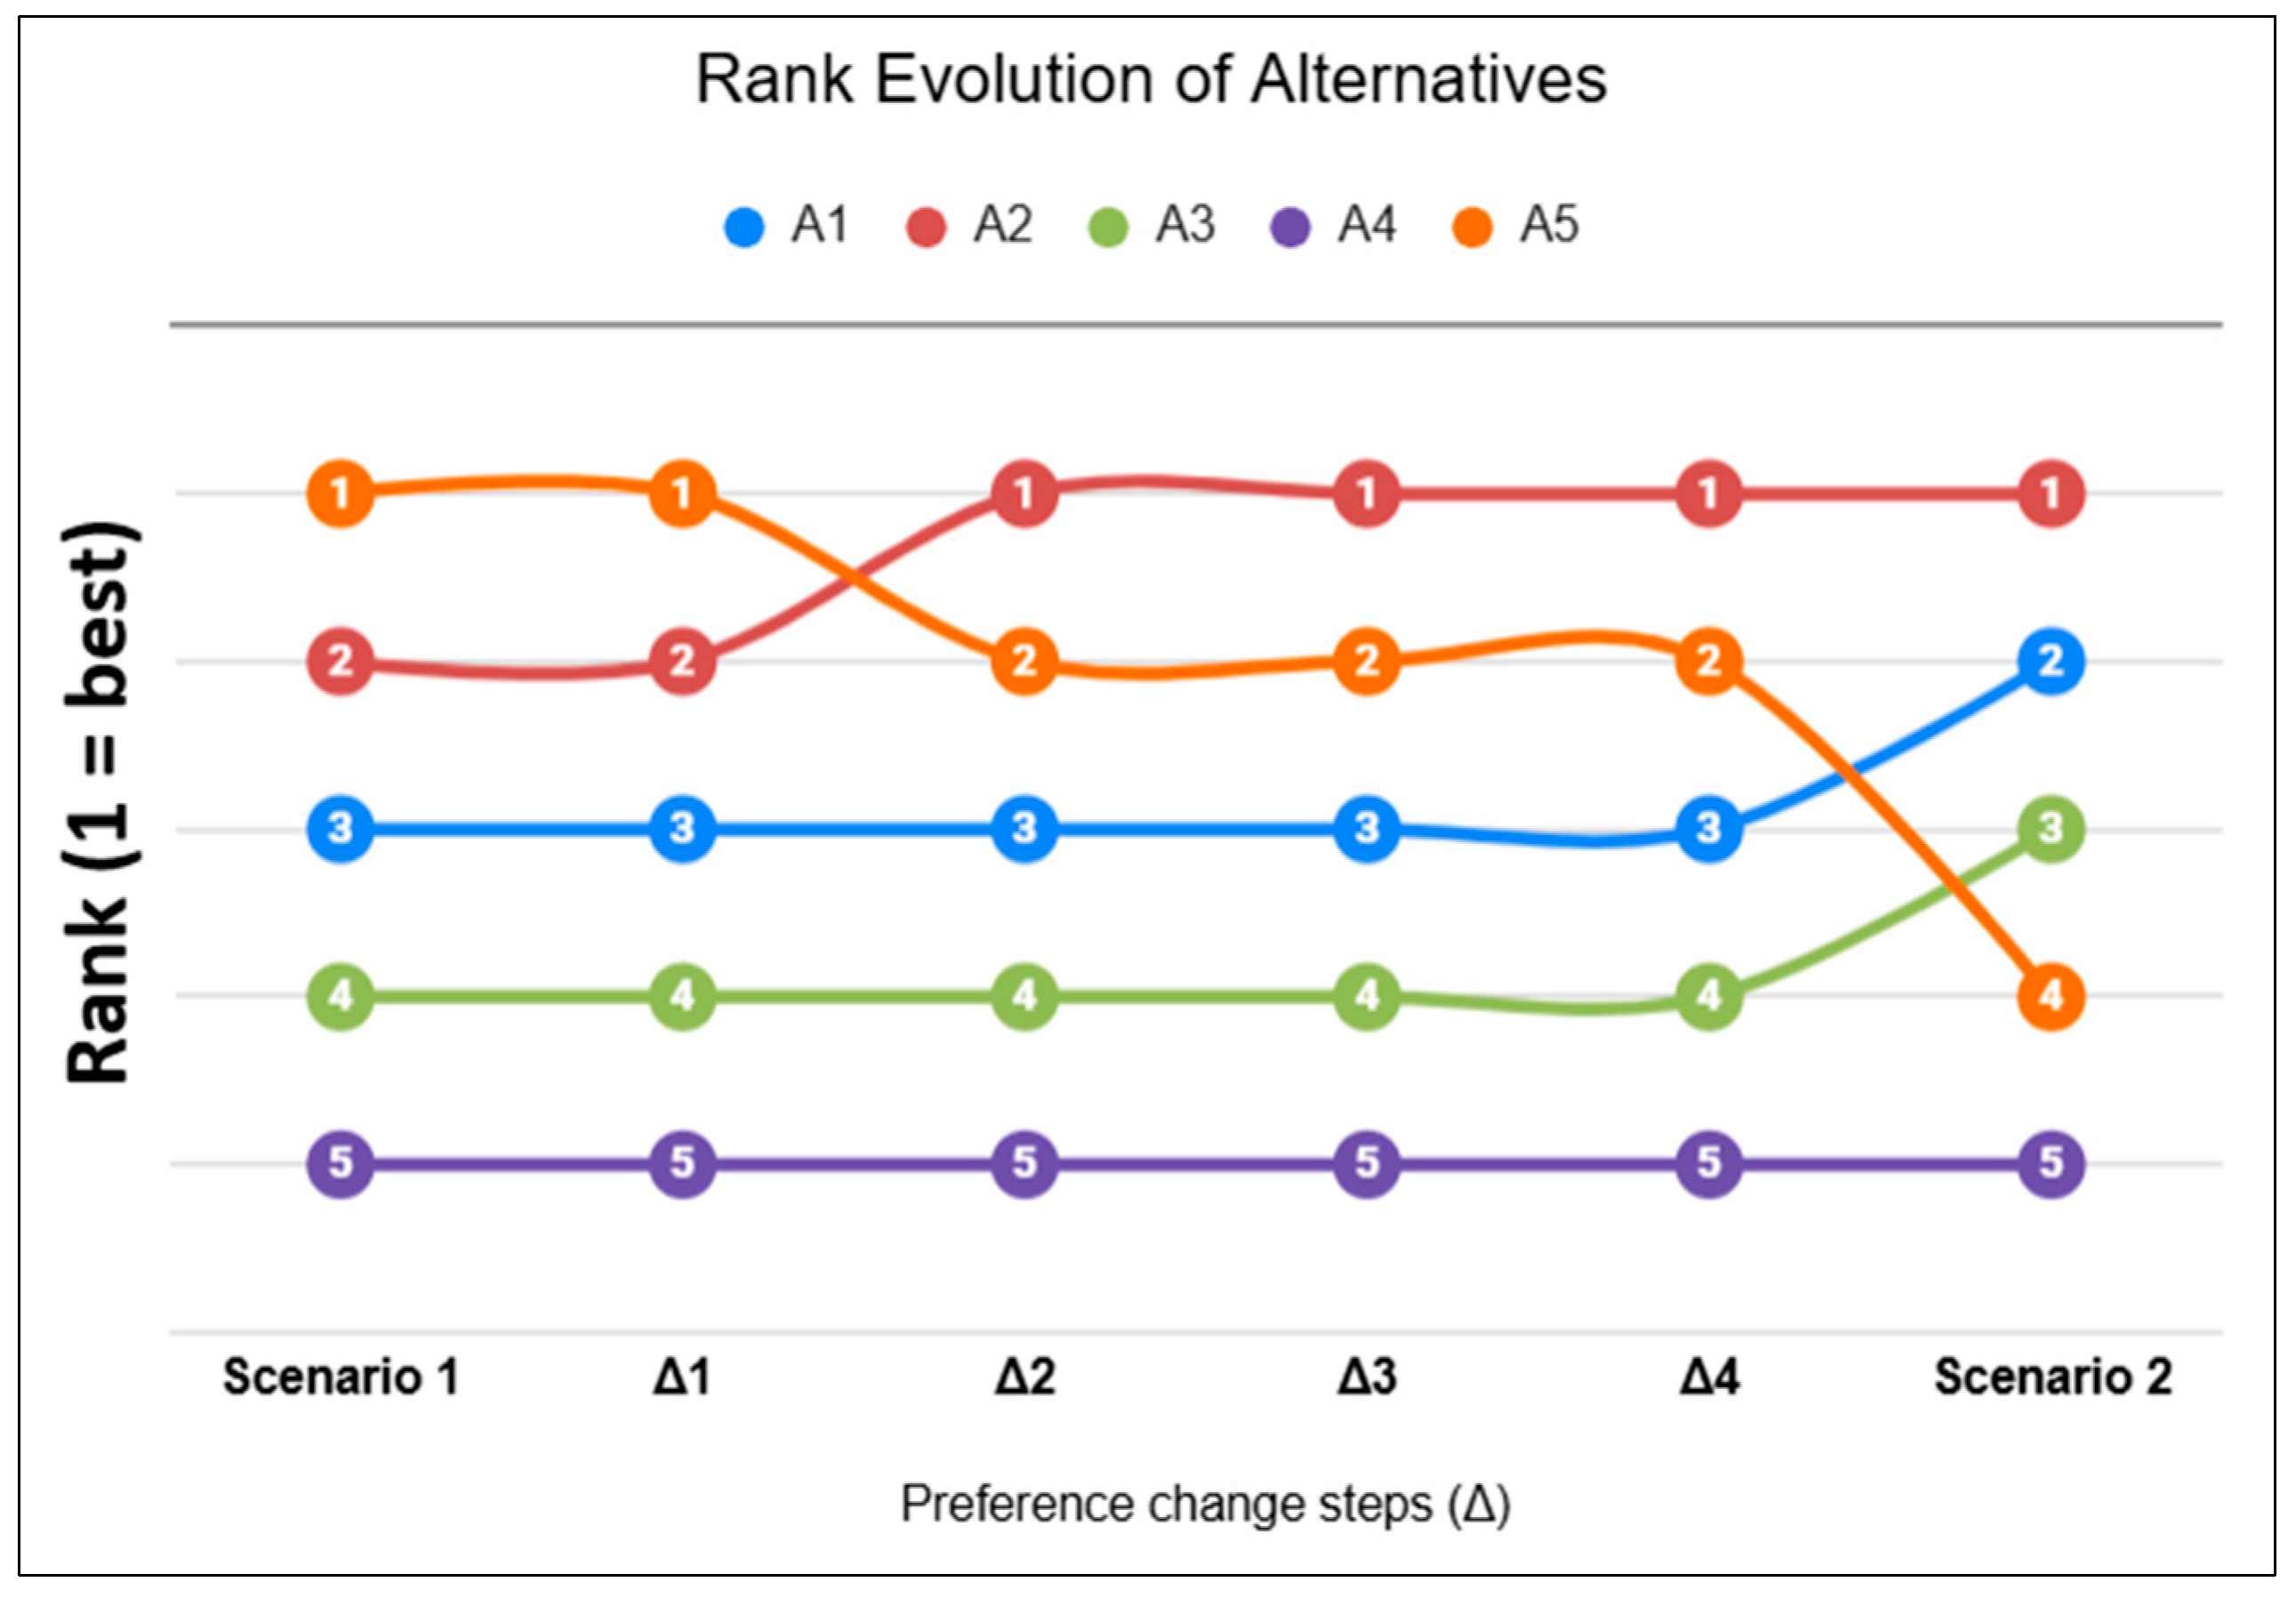
Finally, Figure 4 illustrates the evolution of alternatives’ rankings resulting from successive and cumulative preference adjustments from Scenario 1 to Scenario 2.
Figure 4.
Evolution of alternative rankings across successive preference changes in Scenario 2.
The preference adjustment steps shown in Figure 4, based on the preference changes presented in Table 5 and Table 6, are as follows:
- : The normalization direction of criterion was changed from benefit to cost for ;
- : The normalization direction of criterion was changed from benefit to cost for ;
- : The normalization direction of criterion was changed from benefit to cost for ;
- : The preference scores assigned by to the options of criterion were changed from ( = 2, = 4) to ( = 5, = 1);
- Scenario 2: The preference scores assigned by to the options of criterion were changed from ( = 3, = 2) to ( = 1, = 5).
4.3. Discussion
The results from both scenarios indicate that the modified WSM significantly impacts the evaluation process, enabling a more flexible representation of the DMs’ preferences. The primary differences appear in the values of the generated evaluations and in the final ranking of the alternatives. Because the underlying objective data remain unchanged, these variations stem entirely from how the model interprets and combines the information with the decision-makers’ preferences.
As shown in Figure 4, even relatively small preference adjustments can lead to substantial variations in the ranking of the alternatives. While some alternatives demonstrate stability across different preference configurations, others are highly sensitive to these shifts and alter their ranking positions.
A representative example is the change in the interpretation of the nominal power criterion (Pmax, ) at preference change step 1 in Figure 4. Although higher nominal power is usually advantageous, it may not improve performance when replacing modules in an existing system. All candidates satisfy the inverter’s safety limits. However, a fixed inverter capacity causes energy clipping with higher-power modules. Consequently, within this safe operating range, (an energy efficiency expert) interprets this criterion as a cost. This specific perspective reflects economic and operational inefficiency rather than a hardware violation, ultimately altering the alternative scores and the final aggregated results.
The preference adjustments made by (PV systems engineer) and (municipal administration representative) regarding module weight explain the shifts in the ranking observed at preference change steps 2 and 3 in Figure 4. These adjustments directly address structural constraints associated with the current condition of the roof. As a result, alternative , featuring the lowest weight (19 kg), maintains its rank while significantly improving its aggregated score. Conversely, alternative , which has the highest weight (24 kg), loses its leading position from Scenario 1.
The subsequent preference update of align with the requirement for a lighter rooftop photovoltaic structure. An increased preference for the glass–foil option under criterion and the monofacial option under criterion elevates the scores of most alternatives. The notable exception is the heaviest alternative , which drops to the penultimate position. Furthermore, these findings demonstrate that the modified WSM enhances process transparency by explicitly revealing the relationship between the criteria module encapsulation structure (), light absorption faces (), and module weight ().
To quantitatively interpret the results, Spearman’s rank correlation coefficient can be used to measure the degree of variation between the two scenario rankings. The Spearman rank correlation coefficient, denoted as , in case there are no tied ranks between the random variables and , can be calculated as follows [69]:
where is the total number of alternatives. The iterator denotes the elements of the ranked sets, while represents the difference between the ranks of the sets, denoted as and :
where and define the exact rank positions of the -th alternative in the first and second scenarios. The ranking of the set of alternatives across the two scenarios studied is shown in Table 9.
Table 9.
Rankings of the alternatives and their rank differences.
The calculated Spearman rank correlation coefficient is 0.4 (). This moderate positive correlation statistically demonstrates that the changes in the DMs’ preferences have a substantial and meaningful impact on the evaluation process, leading to noticeable rank adjustments. Concurrently, the positive value of the coefficient indicates that the model maintains a logical connection to the underlying objective data without completely distorting it.
The final result under Scenario 2 is logically consistent, as it reflects both the interrelationships between the criteria and the expressed preferences. This confirms that the modification of the WSM expands the capacity to integrate objective data and expert preferences into a unified scoring model. Its primary advantage lies in enabling a flexible representation of diverse perspectives without altering the input data.
From a practical perspective, the modified method has the potential to reduce the cognitive burden placed on decision-makers. In the presented case study, each decision-maker specifies preferences for nine numerically represented criteria instead of providing 45 direct evaluations (9 criteria × 5 alternatives). Similarly, for the matrix-represented criteria, each decision-maker evaluates 10 options distributed across four criteria, instead of assigning 20 evaluations (4 criteria × 5 alternatives). Consequently, the number of required assessments is reduced from 65 to 19 per decision-maker, representing a reduction of approximately 71%. However, this effect depends on the size and structure of the decision problem. In cases involving a large number of options within matrix-represented criteria, the proposed approach may instead increase the number of required preference assessments.
Another practical advantage is that alternatives may remain hidden from decision-makers during the evaluation process. As a result, participants are not required to individually examine all alternatives, while the method can also support impartial decision-making in situations where alternatives must remain confidential. Finally, the proposed modification is particularly suitable for implementation within a web-based decision support system. An intuitive user interface and a workflow aligned with the proposed algorithm could further reduce the effort required from decision-makers and minimize the need for specialized training.
5. Conclusions
This study proposes a modification of the Weighted Sum Model that formalizes the process of generating evaluations of alternatives by combining objective data with decision-maker preferences. This addresses a major limitation of the classical WSM: the reliance on direct, subjective scoring even when measurable data is available. A key contribution of this study is the introduction of a structured mechanism for representing and integrating objective data by distinguishing between numerically and matrix-represented criteria. Within the proposed approach, matrix-represented criteria are decomposed into sets of options that capture the elementary attributes of the alternatives, while numerically represented criteria are processed through normalization. This distinction enables the flexible integration of heterogeneous data into a unified evaluation model. Furthermore, the results show that different participants can interpret the exact same criterion in opposing ways, highlighting the need for models that accommodate flexible and individualized representation of expert perspectives in group decision-making.
The case study results confirm that the introduced modification alters the way evaluations are generated. The comparison of the two scenarios demonstrates that despite utilizing identical objective data, differences in the preferences of the decision-makers can lead to significant changes in the results and in the ranking of the alternatives. By explicitly integrating objective data with individual preferences, the proposed approach enables a structured and transparent evaluation process. These characteristics make the model particularly applicable to decision-making contexts demanding strict traceability and robust stakeholder participation, such as public-sector energy and infrastructure management.
Despite these contributions, several limitations should be acknowledged. First, the validation of the proposed modification is limited to a case study and does not include verification against real-world outcomes. Second, although the analysis demonstrates the effects of preference changes on the ranking of alternatives, a comprehensive sensitivity analysis is missing. Third, the selection of an appropriate normalization technique, as well as the methods used for criteria selection and filtering, depends on the specifics of the decision problem and remains beyond the scope of this study. Finally, although the proposed modification may reduce the number of required assessments in some decision problems, the cognitive burden on decision-makers may increase when matrix-represented criteria contain a large number of options.
Future research will focus on expanding the precision and practical implementation of the proposed modified WSM method. First, to further test the model’s sorting resolution, it will be applied to decision-making problems with a higher degree of complexity, encompassing a significantly larger set of alternatives and criteria. Second, the method will be enhanced by introducing decision-makers’ competence weights. The technical challenge is to develop an objective weighting mechanism for the decision-makers based on their domain expertise. By utilizing methods such as entropy weights or consistency ratios, the model will overcome the limitation of assuming equal importance for all group members. Finally, the practical implementation path involves the development of a web-based group decision support system. This will require overcoming the technical difficulty of integrating the mathematical algorithms into a scalable cloud architecture, which will allow real-time, remote collaboration, automated data normalization, and visual result interpretation.
Author Contributions
Conceptualization, Z.D., V.D. and D.B.; methodology, Z.D. and V.D.; validation, V.D.; formal analysis, Z.D.; investigation, D.B.; resources, D.B.; data curation, V.D.; writing—original draft preparation, Z.D.; writing—review and editing, Z.D., V.D. and D.B.; visualization, D.B. All authors have read and agreed to the published version of the manuscript.
Funding
This research received no external funding.
Institutional Review Board Statement
Ethical review and approval were waived for this study as the research complies with the General Data Protection Regulation, and it does not involve any personally identifiable information.
Informed Consent Statement
Informed consent was obtained from all subjects involved in the study.
Data Availability Statement
The objective data for the considered photovoltaic modules were obtained from publicly available technical datasheets and are available from the corresponding author upon request.
Conflicts of Interest
The authors declare no conflicts of interest.
References
- Alvarez, P.A.; Ishizaka, A.; Martínez, L. Multiple-criteria decision-making sorting methods: A survey. Expert Syst. Appl. 2021, 183, 115368. [Google Scholar] [CrossRef] [Scilit]
- Sahoo, S.K.; Choudhury, B.B.; Dhal, P.R.; Hanspal, M.S. A Comprehensive Review of Multi-criteria Decision-making (MCDM) Toward Sustainable Renewable Energy Development. Spectr. Oper. Res. 2025, 2, 268–284. [Google Scholar] [CrossRef] [Scilit]
- Mandal, N.; Sarkar, P.; Petrović, N. Multi-Criteria Decision-Making for Ranking Renewable Energy Sources: A Case Study from the Republic of Serbia. J. Eng. Manag. Syst. Eng. 2025, 4, 109–121. [Google Scholar] [CrossRef] [Scilit]
- Wang, J.J.; Jing, Y.Y.; Zhang, C.F.; Zhao, J.H. Review on multi-criteria decision analysis aid in sustainable energy decision-making. Renew. Sustain. Energy Rev. 2009, 13, 2263–2278. [Google Scholar] [CrossRef] [Scilit]
- Pohekar, S.D.; Ramachandran, M. Application of multi-criteria decision making to sustainable energy planning—A review. Renew. Sustain. Energy Rev. 2004, 8, 365–381. [Google Scholar] [CrossRef] [Scilit]
- MacCrimmon, K.R. Decisionmaking Among Multiple-Attribute Alternatives: A Survey and Consolidated Approach; ARPA, The RAND Corporation: Santa Monica, CA, USA, 1968; Available online: https://www.rand.org/content/dam/rand/pubs/research_memoranda/2009/RM4823.pdf (accessed on 10 June 2026).
- Belton, V.; Stewart, T.J. Multiple Criteria Decision Analysis: An Integrated Approach; Springer: Boston, MA, USA; New York, NY, USA, 2002. [Google Scholar] [CrossRef] [Scilit]
- Greco, S.; Słowiński, R.; Wallenius, J. Fifty years of multiple criteria decision analysis: From classical methods to robust ordinal regression. Eur. J. Oper. Res. 2025, 323, 351–377. [Google Scholar] [CrossRef] [Scilit]
- Hwang, C.L.; Yoon, K. Multiple Attribute Decision Making: Methods and Applications. A State-of-the-Art Survey, 1st ed.; Springer: Berlin/Heidelberg, Germany, 1981. [Google Scholar] [CrossRef] [Scilit]
- Triantaphyllou, E. Multi-Criteria Decision Making Methods. In Multi-Criteria Decision Making Methods: A Comparative Study; Springer: Boston, MA, USA, 2000; Volume 44, pp. 5–21. [Google Scholar] [CrossRef] [Scilit]
- Dyer, J. MAUT—Multiattribute Utility Theory. In Multiple Criteria Decision Analysis: State of the Art Surveys; Springer: New York, NY, USA, 2005; Volume 78, pp. 265–292. [Google Scholar] [CrossRef] [Scilit]
- Keeney, R.L. Value-focused thinking: Identifying decision opportunities and creating alternatives. Eur. J. Oper. Res. 1996, 92, 537–549. [Google Scholar] [CrossRef] [Scilit]
- Triantaphyllou, E.; Mann, S.H. An examination of the effectiveness of multi-dimensional decision-making methods: A decision-making paradox. Decis. Support Syst. 1989, 5, 303–312. [Google Scholar] [CrossRef] [Scilit]
- Goswami, S.S.; Behera, D.K.; Mitra, D.S. A comprehensive study of weighted product model for selecting the best product in our daily life. Braz. J. Oper. Prod. Manag. 2020, 17, 1–18. [Google Scholar] [CrossRef] [Scilit]
- Saaty, R.W. The analytic hierarchy process—What it is and how it is used. Math. Model. 1987, 9, 161–176. [Google Scholar] [CrossRef] [Scilit]
- Chen, Y.; Jin, Q.; Fang, H.; Lei, H.; Hu, J.; Wu, Y.; Chen, J.; Wang, C.; Wan, Y. Analytic network process: Academic insights and perspectives analysis. J. Clean. Prod. 2019, 235, 1276–1294. [Google Scholar] [CrossRef] [Scilit]
- Opricovic, S.; Tzeng, G.-H. Compromise solution by MCDM methods: A comparative analysis of VIKOR and TOPSIS. Eur. J. Oper. Res. 2004, 156, 445–455. [Google Scholar] [CrossRef] [Scilit]
- Salih, M.M.; Zaidan, B.B.; Zaidan, A.A.; Ahmed, M.A. Survey on fuzzy TOPSIS state-of-the-art between 2007 and 2017. Comput. Oper. Res. 2019, 104, 207–227. [Google Scholar] [CrossRef] [Scilit]
- Roy, B. The outranking approach and the foundations of electre methods. Theory Decis. 1991, 31, 49–73. [Google Scholar] [CrossRef] [Scilit]
- De Keyser, W.; Peeters, P. A note on the use of PROMETHEE multicriteria methods. Eur. J. Oper. Res. 1996, 89, 457–461. [Google Scholar] [CrossRef] [Scilit]
- Taherdoost, H.; Madanchian, M. Multi-Criteria Decision Making (MCDM) Methods and Concepts. Encyclopedia 2023, 3, 77–87. [Google Scholar] [CrossRef] [Scilit]
- Cinelli, M.; Kadzinski, M.; Gonzalez, M.; Słowiński, R. How to Support the Application of Multiple Criteria Decision Analysis? Let Us Start with a Comprehensive Taxonomy. Omega 2020, 96, 102261. [Google Scholar] [CrossRef] [Scilit]
- Ribeiro, R.A.; Moreira, A.M.; Van Den Broek, P.M.; Pimentel, A. Hybrid Assessment Method for Software Engineering Decisions. Decis. Support Syst. 2011, 51, 208–219. [Google Scholar] [CrossRef] [Scilit]
- Bączkiewicz, A.; Wątróbski, J.; Kizielewicz, B.; Sałabun, W. Towards Objectification of Multi-Criteria Assessments: A Comparative Study on MCDA Methods. Ann. Comput. Sci. Int. Sys. 2021, 25, 417–425. [Google Scholar] [CrossRef] [Scilit]
- Dean, M. A Practical Guide to Multi-Criteria Analysis; Bartlett School of Planning, University College London: London, UK, 2022. [Google Scholar] [CrossRef]
- Keeney, R.L.; Raiffa, H. Decisions with Multiple Objectives: Preferences and Value Trade-Offs; Cambridge University Presss: Cambridge, MA, USA, 1993. [Google Scholar] [CrossRef] [Scilit]
- Bozorg-Haddad, O.; Loáiciga, H.; Zolghadr-Asli, B. Simple Weighting Methods: Weighted Sum and Weighted Product Methods. In A Handbook on Multi-Attribute Decision-Making Methods; Wiley & Sons Publication Inc.: Hoboken, NJ, USA, 2021; pp. 17–24. [Google Scholar] [CrossRef] [Scilit]
- Mardani, A.; Jusoh, A.; MD Nor, K.; Khalifah, Z.; Zakwan, N.; Valipour, A. Multiple criteria decision-making techniques and their applications—A review of the literature from 2000 to 2014. Econ. Res.-Ekon. Istraž. 2015, 28, 516–571. [Google Scholar] [CrossRef] [Scilit]
- Sotoudeh-Anvari, A. The applications of MCDM methods in COVID-19 pandemic: A state of the art review. Appl. Soft Comput. 2022, 126, 109238. [Google Scholar] [CrossRef] [Scilit]
- Tan, T.; Mills, G.; Papadonikolaki, E.; Liu, Z. Combining multi-criteria decision making (MCDM) methods with building information modelling (BIM): A review. Autom. Constr. 2021, 121, 103451. [Google Scholar] [CrossRef] [Scilit]
- Chourabi, Z.; Khedher, F.; Dhouib, A.; Cheikhrouhou, M. Multi-criteria decision making in workforce choice using AHP, WSM and WPM. J. Text. Inst. 2019, 110, 1092–1101. [Google Scholar] [CrossRef] [Scilit]
- Saravanan, V.; Ramachandran, M.; Mani, M. Selection of Photovoltaic Devices Using Weighted Sum Method. Renew. Nonrenew. Energy 2022, 1, 67–73. [Google Scholar] [CrossRef] [Scilit]
- Cucchiella, F.; D’Adamo, I. A Multicriteria Analysis of Photovoltaic Systems: Energetic, Environmental, and Economic Assessments. Int. J. Photoenergy 2015, 1, 627454. [Google Scholar] [CrossRef] [Scilit]
- Churchman, C.W.; Ackoff, R.L. An approximate measure of value. J. Oper. Res. Soc. Am. 1954, 2, 172–187. [Google Scholar] [CrossRef] [Scilit]
- Eckenrode, R.T. Weighting Multiple Criteria. Manag. Sci. 1965, 12, 180–192. [Google Scholar] [CrossRef] [Scilit]
- Fishburn, P.C. Additive Utilities with Incomplete Product Set: Applications to Priorities and Assignments. Oper. Res. 1967, 15, 537–542. [Google Scholar] [CrossRef] [Scilit]
- Malczewski, J. GIS and Multicriteria Decision Analysis; J. Wiley & Sons: New York, NY, USA, 1999; Available online: https://www.wiley.com/en-us/shop/general-introductory-geography/gis-and-multicriteria-decision-analysis-p-9780471329442 (accessed on 10 June 2026).
- Ahmad, K.; Naimi, S. Developing WSM-AHP method for adaptive construction project management. Int. J. Tech. Phys. Probl. Eng. 2023, 15, 160–170. Available online: https://www.researchgate.net/publication/380030301_DEVELOPING_WSM-AHP_METHOD_FOR_ADAPTIVE_CONSTRUCTION_PROJECT_MANAGEMENT (accessed on 10 June 2026).
- Malefaki, S.; Markatos, D.; Filippatos, A.; Pantelakis, S. A Comparative Analysis of Multi-Criteria Decision-Making Methods and Normalization Techniques in Holistic Sustainability Assessment for Engineering Applications. Aerospace 2025, 12, 100. [Google Scholar] [CrossRef] [Scilit]
- Taherdoost, H. Analysis of Simple Additive Weighting Method (SAW) as a MultiAttribute Decision-Making Technique: A Step-by-Step Guide. J. Manag. Sci. Eng. Res. 2023, 1, 21–24. [Google Scholar] [CrossRef] [Scilit]
- Zaidan, A.; Muzammil, H.; Ahmed, A.-H.; Kiah, M.; Laiha, M.; Mohamed, A. Multi-Criteria Analysis for OS-EMR Software Selection Problem: A Comparative Study. Decis. Support Syst. 2015, 78, 15–27. [Google Scholar] [CrossRef] [Scilit]
- Gardziejczyk, W.; Zabicki, P. Normalization and variant assessment methods in selection of road alignment variants—Case study. J. Civ. Eng. Manag. 2017, 23, 510–523. [Google Scholar] [CrossRef] [Scilit]
- Jafaryeganeh, H.; Ventura, M.; Soares, C.G. Effect of normalization techniques in multi-criteria decision making methods for the design of ship internal layout from a Pareto optimal set. Struct. Multidiscip. Optim. 2020, 62, 1849–1863. [Google Scholar] [CrossRef] [Scilit]
- Vafaei, N.; Ribeiro, R.; Camarinha-Matos, L. Assessing Normalization Techniques for Simple Additive Weighting Method. Procedia Comput. Sci. 2022, 199, 1229–1236. [Google Scholar] [CrossRef] [Scilit]
- Williams, A.; Cai, Y. Insights into Weighted Sum Sampling Approaches for Multi-Criteria Decision Making Problems. WSEAS Trans. Math. 2025, 24, 327–346. [Google Scholar] [CrossRef] [Scilit]
- Hwang, C.L.; Lin, M.J. Group Decision Making Under Multiple Criteria: Methods and Applications; Springer: Berlin/Heidelberg, Germany, 1987. [Google Scholar] [CrossRef] [Scilit]
- Kabak, Ö.; Ervural, K. Multiple attribute group decision making: A generic conceptual framework and a classification scheme. Knowl.-Based Syst. 2017, 123, 13–30. [Google Scholar] [CrossRef] [Scilit]
- Dimitrova, Z.; Dimitrov, V.; Borissova, D. Modification of WSM and WPM for Group Decision-Making Considering DMs’ Different Competence Domains. IEEE Int. Conf. Commun. Inf. Electr. Energy Syst. 2025, 1, 1–6. [Google Scholar] [CrossRef] [Scilit]
- Sorooshian, S.; Parsia, Y. Modified Weighted Sum Method for Decisions with Altered Sources of Information. Math. Stat. 2019, 7, 57–60. [Google Scholar] [CrossRef] [Scilit]
- Alanazi, H.O.; Abdullah, A.H.; Larbani, M. Dynamic Weighted Sum Multi-Criteria Decision Making: Mathematical Model. Int. J. Math. Stat. Invent. 2013, 1, 16–18. Available online: https://ijmsi.org/Papers/Volume.1.Issue.2/B012016018.pdf (accessed on 10 June 2026).
- Arman, A.; Arman, H.; Hadi-Vencheh, A. The Homogeneous MADM Methods: Is Trade-Off between Attributes Important? Comput. Intell. Neurosci. 2022, 3, 8629986. [Google Scholar] [CrossRef] [Scilit]
- Zavadskas, E.K.; Turskis, Z.; Antucheviciene, J.; Zakarevicius, A. Optimization of weighted aggregated sum product assessment. Elektron. Elektrotech. 2012, 122, 3–6. [Google Scholar] [CrossRef] [Scilit]
- Stanujkic, D.; Popovic, G.; Karabasevic, D.; Meidute-Kavaliauskiene, I.; Ulutas, A. An Integrated Simple Weighted Sum Product Method—WISP. IEEE Trans. Eng. Manag. 2021, 70, 1933–1944. [Google Scholar] [CrossRef] [Scilit]
- Kaur, P.; Kumar, S. An intuitionistic fuzzy simple additive weighting (IFSAW) method for selection of vendor. IOSR J. Bus. Manag. 2013, 15, 78–81. Available online: https://scispace.com/pdf/an-intuitionistic-fuzzy-simple-additive-weighting-ifsaw-1xwcsoraqn.pdf (accessed on 10 June 2026). [CrossRef] [Scilit]
- Esangbedo, M.O.; Che, A. Grey Weighted Sum Model for Evaluating Business Environment in West Africa. Math. Probl. Eng. 2016, 2016, 3824350. [Google Scholar] [CrossRef] [Scilit]
- Amini, A.; Abdollahi, A.; Hariri-Ardebili, M.A. An automated machine-learning-assisted stochastic-fuzzy multi-criteria decision making tool: Addressing record-to-record variability in seismic design. Appl. Soft Comput. 2024, 154, 111354. [Google Scholar] [CrossRef] [Scilit]
- Zayat, W.; Kilic, H.S.; Yalcin, A.S.; Zaim, S.; Delen, D. Application of MADM methods in Industry 4.0: A literature review. Comput. Ind. Eng. 2023, 177, 109075. [Google Scholar] [CrossRef] [Scilit]
- Chakraborty, S.; Raut, R.D.; Rofin, T.M.; Chakraborty, S. A comprehensive and systematic review of multi-criteria decision-making methods and applications in healthcare. Healthc. Anal. 2023, 4, 100232. [Google Scholar] [CrossRef] [Scilit]
- Adu, T.F.; Mensah, L.D.; Rockson, M.A.D.; Kemausuor, F. Decision support systems for waste-to-energy technologies: A systematic literature review of methods and future directions for sustainable implementation in Ghana. Heliyon 2025, 11, 42353. [Google Scholar] [CrossRef] [Scilit]
- Koelling, C.P.; Cho, Y.J. Attribute decomposition in multattribute decision analysis: An important issue in DSS design. Comput. Ind. Eng. 1991, 21, 107–110. [Google Scholar] [CrossRef] [Scilit]
- Borissova, D. Group decision making for selection of k-best alternatives. C. R. Acad. Bulg. Sci. 2016, 69, 183–190. Available online: https://www.iict.bas.bg/ipdss/DBorissova/2016-Compt-Rendus-69-2-83-190.pdf (accessed on 10 June 2026).
- Chen, M.; Mao, S.; Liu, Y. Big Data: A Survey. Mob. Netw. Appl. 2014, 19, 171–209. [Google Scholar] [CrossRef] [Scilit]
- Wu, X.; Zhu, X.; Wu, G.Q.; Ding, W. Data mining with big data. IEEE Trans. Knowl. Data Eng. 2014, 26, 97–107. [Google Scholar] [CrossRef] [Scilit]
- Aytekin, A. Comparative Analysis of the Normalization Techniques in the Context of MCDM Problems. Decis. Mak. Appl. Manag. Eng. 2021, 4, 1–25. [Google Scholar] [CrossRef] [Scilit]
- Tabatabaei, M.; Saber, A. Equity- and Heritage-Informed Rooftop PV Screening for the Sustainable Development of Renewable Energy Communities in Bologna, Italy. Sustainability 2026, 18, 4774. [Google Scholar] [CrossRef] [Scilit]
- Dayananda, B. Nature-Based Solutions for Environmental Management: A Comprehensive Review of Effectiveness, Co-Benefits, and Monitoring. Sustainability 2026, 18, 4815. [Google Scholar] [CrossRef] [Scilit]
- Alhazmi, M.; Alfadda, A.; Alfakhri, A. Economic Viability and Environmental Benefits of Integrating Solar Photovoltaics in Public Community Buildings. Energies 2025, 18, 705. [Google Scholar] [CrossRef] [Scilit]
- Jurasz, J.; Campana, P.E. The potential of photovoltaic systems to reduce energy costs for office buildings in time-dependent and peak-load-dependent tariffs. Sustain. Cities Soc. 2019, 44, 871–879. [Google Scholar] [CrossRef] [Scilit]
- Jiang, J.; Zhang, X.; Yuan, Z. Feature selection for classification with Spearman’s rank correlation coefficient-based self-information in divergence-based fuzzy rough sets. Expert Syst. Appl. 2024, 249, 123633. [Google Scholar] [CrossRef] [Scilit]

Disclaimer/Publisher’s Note: The statements, opinions and data contained in all publications are solely those of the individual author(s) and contributor(s) and not of MDPI and/or the editor(s). MDPI and/or the editor(s) disclaim responsibility for any injury to people or property resulting from any ideas, methods, instructions or products referred to in the content. |
© 2026 by the authors. Licensee MDPI, Basel, Switzerland. This article is an open access article distributed under the terms and conditions of the Creative Commons Attribution (CC BY) license.