


Abstract
This study proposes an integrated Kano–QFD–MCDM decision-support framework for sustainable fiber selection in sportswear by combining user-oriented evaluation with environmental and technical performance criteria. User requirements are classified using the Kano model and translated into technical criteria through Quality Function Deployment (QFD), enabling criterion weights that reflect both user priorities and product performance. Six fiber alternatives—soy, bamboo, Tencel, modal, cotton, and polyester—are evaluated based on nine criteria covering mechanical properties, comfort-related attributes, environmental impact, and economic factors, with emphasis on carbon footprint and biodegradability. The evaluation is performed using three multi-criteria decision-making (MCDM) methods—TOPSIS, EDAS, and VIKOR—supported by statistical analyses including Spearman correlation and the Friedman test to assess ranking consistency. Results indicate that soy fiber achieved the highest aggregated ranking under the proposed weighting and aggregation framework, followed by bamboo and Tencel, while polyester ranks lowest due to its environmental disadvantages. Overall, the proposed framework provides a transparent and statistically validated approach that integrates sustainability considerations into fiber selection, supporting more informed and responsible decision-making in sportswear design.
1. Introduction
Traditional material selection approaches have largely relied on technical test results and single-criterion evaluations. However, contemporary design problems require the simultaneous assessment of multiple and often conflicting criteria, including performance, cost, environmental impact, and user expectations. Multi-Criteria Decision-Making (MCDM) methods have therefore become widely adopted analytical tools in engineering and textile-related applications due to their ability to provide structured and quantitative decision support [1,2]. In the textile field, MCDM techniques have been applied to various decision problems such as fabric evaluation, sustainable material prioritization, supplier selection, and product development [3,4].
Sportswear products require a careful balance between functional performance and sustainability objectives. Fiber selection directly affects moisture management, breathability, durability, comfort, UV protection, environmental impact, and overall user satisfaction. Conventional fibers such as cotton and polyester continue to dominate the market due to their established performance characteristics and economic advantages. However, regenerated and bio-based fibers including bamboo, modal, Tencel, and soy have attracted increasing attention because of their environmental benefits and favorable comfort-related properties. Since these fiber alternatives exhibit different strengths and weaknesses with respect to technical, environmental, economic, and user-oriented criteria, selecting the most appropriate fiber represents a complex multi-criteria decision problem.
Despite these developments, decision-making processes based solely on technical performance data may fail to adequately reflect user expectations, which play a key role in product acceptance and satisfaction. Therefore, customer-oriented approaches have gained increasing importance. The Kano model provides a structured way to classify user requirements into different quality dimensions and to better understand their impact on customer satisfaction [5]. Quality Function Deployment (QFD), on the other hand, enables the systematic transformation of these user requirements into measurable technical criteria and relative importance weights [6]. The integration of Kano and QFD offers a powerful mechanism for linking qualitative user expectations with quantitative engineering parameters and has been applied in various product design and service quality studies [7,8].
The integration of Kano and QFD has been widely investigated in product development and quality improvement studies. Shen et al. demonstrated that the integration of Kano and QFD improves innovative product development by more effectively incorporating customer requirements into design decisions [9]. Lai et al. proposed a Kano-QFD-based product design approach emphasizing attractive and must-be quality attributes in optimization processes [10]. Li et al. applied an integrated Kano–QFD–PUGH framework in protective clothing design, demonstrating the practical applicability of Kano–QFD-based approaches in textile and apparel product development [11], while Chaudha et al. improved traditional QFD by incorporating Kano-based satisfaction relationships into prioritization procedures [12]. Ji et al. developed a quantitative integration framework that mathematically incorporated Kano classifications into QFD and demonstrated its effectiveness in customer-oriented product design optimization [13]. More recently, Zhao et al. proposed a Kano-QFD-based product configuration approach, while Wu et al. combined Kano’s model with Importance–Performance Analysis to identify key success factors from a customer-oriented perspective, and Li et al. combined Kano, AHP, and QFD methods for customer-oriented product development [14,15,16]. Furthermore, Kirgizov et al. proposed a quantitative Kano-QFD integration approach that enhanced the representation of customer satisfaction within QFD-based evaluation systems [17]. Collectively, these studies confirm the effectiveness of Kano-QFD integration for translating customer expectations into engineering decisions; however, most applications remain focused on product design, service quality, and manufacturing improvement contexts.
At the same time, sustainability-oriented decision-making has become increasingly prominent in textile research. Environmental impacts associated with textile materials are now commonly evaluated through life cycle assessment approaches, emphasizing the importance of material selection in developing more sustainable products [18]. Moreover, it has been widely recognized that environmental considerations should be integrated across the entire textile and clothing supply chain, where fiber choice plays a fundamental role [19]. These developments highlight the necessity of incorporating sustainability indicators alongside technical and economic criteria in fiber selection processes.
Previous studies have successfully applied MCDM techniques to various textile-related decision problems. Majumdar et al. applied the Analytic Hierarchy Process (AHP) for cotton fiber selection and demonstrated the usefulness of structured decision-making approaches in fiber evaluation [20]. Banwet and Majumdar compared AHP–TOPSIS and GA–TOPSIS methods for raw material selection in textile industries, showing that multi-criteria approaches can effectively support material prioritization [21]. In addition, sustainability-oriented textile studies have employed TOPSIS and related MCDM techniques to evaluate environmental performance and support decision-making processes. These studies demonstrate the suitability of MCDM methods for textile applications; however, many of them rely primarily on technical or environmental indicators and do not adequately incorporate customer expectations into the decision structure.
Despite these advances, several important research gaps remain. First, most Kano-QFD studies have focused on product design, service quality, manufacturing improvement, and customer satisfaction applications rather than sustainable fiber selection for sportswear products. Second, existing studies generally rely on a single decision-making technique, such as AHP or TOPSIS, making the final ranking potentially sensitive to method-specific assumptions. Third, comparative applications involving multiple MCDM methods within the same Kano-QFD framework remain limited. Furthermore, statistical validation of ranking consistency and the use of consensus-based aggregation techniques such as Borda Count are rarely addressed in sustainable textile material selection studies. Therefore, there remains a need for a comprehensive framework that simultaneously integrates customer expectations, sustainability considerations, multiple MCDM methods, and ranking validation procedures for sportswear fiber selection. Addressing this need requires a more holistic decision-support structure capable of combining user-oriented evaluation with sustainability-focused performance assessment. Unlike conventional MCDM-based fiber selection studies, the proposed framework integrates customer-driven weighting, sustainability evaluation, comparative ranking, and ranking validation within a single decision-support structure. Accordingly, the integration of Kano, QFD, and multiple MCDM methods was considered necessary because sustainable sportswear fiber selection involves simultaneously conflicting technical, environmental, economic, and user-centered criteria that cannot be adequately represented through single-dimensional evaluation approaches.
To address these gaps, the present study proposes an integrated decision-support framework for fiber selection in sportswear applications. In this framework, user requirements are first classified using the Kano model and then translated into technical criteria through QFD. The resulting criterion weights are evaluated using three different MCDM methods—TOPSIS, EDAS, and VIKOR—to provide a comprehensive and comparative analysis. Furthermore, statistical tests are employed to assess ranking consistency, and a consensus-based aggregation approach is used to determine the final decision. The primary scientific contribution of this study lies not in the final fiber ranking itself, but in the integration of customer-driven weighting, sustainability criteria, multiple MCDM methods, and consensus-based ranking within a single framework. Unlike many previous sustainable material selection studies that rely primarily on literature-derived performance indicators or purely theoretical evaluation frameworks, the present study is supported by experimentally obtained textile performance data generated under standardized laboratory conditions.
The main contributions of this study can be summarized as follows: (i) development of a customer-oriented sustainable fiber selection framework integrating Kano and QFD; (ii) simultaneous evaluation of environmental, technical, economic, and user-related criteria within a unified decision structure; (iii) comparative application of TOPSIS, EDAS, and VIKOR methods; (iv) statistical validation of ranking consistency; and (v) generation of a consensus-based final ranking using the Borda Count approach.
By integrating user-oriented evaluation, sustainability considerations, multi-method MCDM analysis, and statistical validation within a unified framework, this study offers a robust, transparent, and reproducible approach to fiber selection in sportswear design to support sustainable material selection decisions in textile product design.
2. Materials and Methods
2.1. Fiber Alternatives and Performance Criteria
In this study, six different fiber alternatives intended for use in sportswear products, specifically T-shirt samples, were evaluated: bamboo, Tencel, soy, modal, cotton, and polyester. These fibers represent both conventional and emerging fiber alternatives that are widely used in contemporary sportswear and apparel markets. Fiber selection directly affects not only the physical properties of the fabric but also user comfort, environmental impact, and final product cost. Therefore, the selected alternatives were analyzed holistically in terms of technical, environmental, and economic criteria.
To ensure comparability among the evaluated fiber alternatives, all fabrics were produced under similar structural conditions. The fabrics were manufactured using Ne 30/1 yarns with an average twist level of approximately 700 tpm and a target fabric mass per unit area of approximately 250 g/m2. By maintaining comparable yarn count, twist level, and fabric weight, the influence of structural parameters was minimized, allowing the observed performance differences to be attributed primarily to fiber characteristics rather than differences in fabric construction.
The performance criteria used in the study were grouped under nine categories: bursting strength, pilling tendency, air permeability, water vapor permeability, moisture management capacity, UV protection factor, carbon footprint, biodegradation time, and product cost. These criteria represent the fundamental parameters that determine functional performance and sustainability in sportswear. Each criterion was measured in accordance with the relevant international test standards: bursting strength according to ISO 13938-2 [22], pilling resistance according to ISO 12945-2 [23], air permeability according to ISO 9237 [24], water vapor permeability according to BS 7209 [25], moisture management capacity according to AATCC 197 [26], and UV protection factor according to AS/NZS 4399:1996 [27].
Carbon footprint and biodegradation time were not determined through direct experimental measurements; instead, these criteria were evaluated based on life cycle assessment (LCA) data and biodegradation durations reported in the relevant literature. Product cost data were obtained from the sales and marketing department of an industrial textile manufacturer and were evaluated according to final T-shirt-oriented retail pricing. All measurements were conducted separately for each fiber alternative, and the resulting quantitative data were directly incorporated into the multi-criteria decision matrix for subsequent analyses.
The carbon footprint and biodegradability values used in this study were compiled from previously published literature sources reporting environmental performance indicators for different fiber types, whereas all technical performance parameters, including bursting strength, pilling resistance, air permeability, water vapor transmission, wicking performance, UV protection, and cost data, were obtained directly from experimental measurements and industrial market data collected within the scope of this research. Since the environmental data were derived from studies performed under different geographical conditions, system boundaries, functional units, and assessment methodologies, direct numerical comparisons should be interpreted with caution. Representative midpoint or average values were adopted when literature sources reported value ranges. Therefore, the carbon footprint and biodegradability indicators were incorporated as representative sustainability criteria rather than as definitive environmental declarations for the investigated fibers. The primary objective of including these indicators was to enable the integration of environmental considerations into the proposed Kano–QFD–MCDM framework and to evaluate their influence on the decision-making process. Consequently, the contribution of this study lies in demonstrating the applicability, robustness, and practical usefulness of the proposed integrated decision-support framework rather than establishing definitive environmental impact values or providing a full life cycle assessment of the evaluated fiber alternatives [18,28,29,30,31].
All experimental measurements were conducted under standardized laboratory conditions in accordance with the relevant international testing standards. To improve reproducibility and measurement reliability, each test was repeated multiple times depending on the test protocol. Bursting strength, pilling resistance, and water vapor permeability tests were performed in three repetitions, air permeability measurements were conducted in five repetitions, and UV protection analyses were carried out using ten measurements for each fabric type. Fabric construction parameters were kept as constant as possible throughout the study in order to minimize structural variability and to ensure that the observed performance differences primarily originated from fiber characteristics rather than fabric architecture or testing conditions.
2.2. Transforming User Expectations into Criterion Priorities Through Kano and QFD
The Kano model is a classification system that evaluates customer expectations by grouping them into different quality dimensions. The model suggests that user satisfaction is shaped not only by the presence of a product or service but also by the level and manner in which it is delivered [5]. According to this model, user needs are categorized into six groups: Must-be, Performance, Attractive, Indifferent, Reverse, and Questionable.
The user-oriented evaluation stage was conducted through exploratory focus-group discussions involving 20 physically active individuals between the ages of 20 and 40 who regularly use sportswear products. Participants were recruited from local fitness and recreational sports environments in order to obtain practical user perspectives regarding comfort, moisture management, breathability, durability, and sustainability expectations associated with sports T-shirts. Rather than employing a large-scale consumer survey, the Kano-based evaluation was designed as an exploratory user-oriented assessment intended to identify dominant sportswear performance expectations and to transfer these expectations into the QFD-based weighting structure. This exploratory approach was considered appropriate for the early-stage decision-support framework proposed in the present study.
In this study, customer expectations were evaluated using paired functional and dysfunctional Kano questions prepared in a clear and user-friendly format. The responses were analyzed according to the standard Kano evaluation matrix using the Kano Analysis module of Minitab Workspace, which automatically classifies customer requirements into Attractive (A), Performance (O), Must-be (M), Indifferent (I), Reverse (R), and Questionable (Q) categories. The resulting classifications were subsequently used to determine user-oriented requirement priorities and to derive criterion weights within the QFD framework.
To facilitate the quantitative integration of Kano results into the QFD framework, numerical importance coefficients were assigned to each Kano category. Performance attributes were assigned a coefficient of 6, Must-be attributes a coefficient of 5, Attractive attributes a coefficient of 4, Indifferent attributes a coefficient of 3, Reverse attributes a coefficient of 2, and Questionable attributes a coefficient of 1. Higher coefficients indicate greater influence on the subsequent QFD-based criterion-weighting process. These coefficients were used to transform qualitative Kano classifications into quantitative importance values for the House of Quality calculations. In the present study, the final customer requirements were classified only as Performance, Must-be, and Indifferent attributes; therefore, Attractive, Reverse, and Questionable categories were not represented in the final weighting calculations.
For each customer requirement, user-friendly and plain-language questions were employed instead of technical terminology to ensure clarity and consistency in responses. Table 1 presents the user-directed questions together with the corresponding performance criteria to which they were mapped.
Table 1.
User-oriented expressions and corresponding technical criteria.
Although the user-oriented expression “If the T-shirt keeps its shape and does not shrink after washing” refers to dimensional stability, direct dimensional stability measurements were not included in the experimental program. Therefore, within the QFD framework, this requirement was represented by durability-related indicators, namely bursting strength and pilling resistance, which were considered the closest measurable technical characteristics available in the study.
The paired responses obtained from the participants were evaluated using the Kano Analysis module of Minitab Workspace according to the standard Kano evaluation matrix (Table 2).
Table 2.
Standard Kano evaluation matrix showing the classification of customer responses based on functional and dysfunctional question pairs.
Quality Function Deployment (QFD) is a customer-oriented planning tool that systematically translates customer requirements into measurable technical characteristics [6]. In this study, the House of Quality matrix was used to establish relationships between customer expectations and technical performance criteria and to determine criterion priorities for the subsequent MCDM analyses.
In the present study, only the first phase of the QFD methodology, namely the House of Quality matrix, was employed. Customer requirements were placed in the rows and the nine technical criteria were placed in the columns. Relationship strengths were evaluated using scores of 1 (weak), 3 (moderate), and 9 (strong). These scores were combined with the Kano-derived importance coefficients to calculate weighted criterion priorities.
Following the Kano classification, the identified customer expectations were matched with the technical performance criteria using the QFD method. In the QFD matrix, customer requirements were placed in the rows, and the nine technical criteria were placed in the columns. The degree of relationship in each cell was represented by a score of 1 (weak), 3 (moderate), or 9 (strong), depending on the level of influence. These values were multiplied by the Kano coefficients corresponding to each customer expectation, and weighted scores were obtained for the technical performance criteria. The Kano classifications were subsequently converted into importance coefficients and integrated into the House of Quality matrix, allowing customer expectations to directly influence the final weighting of the technical performance criteria.
2.3. Application of Multi-Criteria Decision-Making (MCDM) Methods
In this study, three Multi-Criteria Decision-Making (MCDM) methods, namely TOPSIS (Technique for Order Preference by Similarity to Ideal Solution), VIKOR (VlseKriterijumska Optimizacija I Kompromisno Resenje), and EDAS (Evaluation Based on Distance from Average Solution), were employed to evaluate the sustainability performance of the fiber alternatives. These methods were selected because they represent complementary decision-making perspectives and are widely used in sustainability-oriented material selection problems.
TOPSIS ranks alternatives according to their relative closeness to the ideal solution, EDAS evaluates alternatives based on their distances from the average solution, and VIKOR identifies compromise solutions by simultaneously considering group utility and individual regret. The combined use of these methods enables cross-method validation and improves the robustness and reliability of the ranking results.
Prior to the application of the MCDM methods, the decision matrix was constructed using the weighted technical criteria obtained from the Kano–QFD framework. Among the nine evaluation criteria, bursting strength (P1), pilling resistance (P2), air permeability (P3), water vapor transmission (P4), wicking performance (P5), UV protection factor (P6), and biodegradability (P8) were treated as benefit criteria, whereas carbon footprint (P7) and product cost (P9) were considered cost criteria. The same weighted decision matrix was used as the input dataset for TOPSIS, EDAS, and VIKOR analyses to ensure methodological consistency and comparability among the ranking results. For each method, the computational procedures recommended in the original methodological studies were followed, and the resulting performance indices were used to rank the fiber alternatives according to their relative sustainability performance.
The TOPSIS (Technique for Order Preference by Similarity to Ideal Solution) method ranks alternatives according to their relative closeness to the positive ideal solution and their distance from the negative ideal solution. The fundamental assumption of the method is that the best alternative should have the shortest distance from the ideal solution and the greatest distance from the negative ideal solution [1].
First, the decision matrix was normalized using vector normalization:
where denotes the performance value of alternative under criterion , is the normalized value, and is the number of alternatives.
The normalized values were then multiplied by the criterion weights obtained from the Kano–QFD framework to generate the weighted normalized matrix:
where represents the weight of criterion .
Subsequently, the positive ideal solution and negative ideal solution were determined. For benefit criteria, the maximum weighted values constituted the positive ideal solution and the minimum values constituted the negative ideal solution. For cost criteria, the opposite approach was applied.
The Euclidean distances of each alternative from the positive and negative ideal solutions were calculated as:
Finally, the relative closeness coefficient was obtained as:
where represents the closeness coefficient of alternative . Alternatives with higher values are considered more preferable because they are closer to the ideal solution and farther from the negative ideal solution.
The EDAS (Evaluation based on Distance from Average Solution) method evaluates alternatives according to their positive and negative distances from the average solution of each criterion. Unlike TOPSIS, which measures the distance from ideal and negative-ideal solutions, EDAS assesses the relative performance of alternatives with respect to the average performance level of the decision matrix [3].
First, the average value of each criterion was calculated as:
where represents the average value of criterion , denotes the performance value of alternative under criterion , and is the number of alternatives.
For benefit criteria, the Positive Distance from Average (PDA) and Negative Distance from Average (NDA) were calculated as:
For cost criteria, the calculations were reversed:
The weighted sums of positive and negative distances were then determined as:
where denotes the weight of criterion obtained from the Kano–QFD framework and is the total number of criteria.
Subsequently, the normalized positive and negative assessment scores were computed:
Finally, the overall appraisal score () was calculated as:
where represents the appraisal score of alternative . Alternatives with higher values indicate better overall performance and are therefore ranked higher.
The VIKOR (VlseKriterijumska Optimizacija I Kompromisno Resenje) method is a multi-criteria decision-making technique developed to identify compromise solutions among competing alternatives [2]. Unlike TOPSIS and EDAS, VIKOR simultaneously considers the overall group utility and the individual regret associated with each alternative, thereby providing a balanced ranking framework.
First, the best and worst values for each criterion were identified from the decision matrix. For benefit criteria, the maximum value was considered the best value and the minimum value the worst value. For cost criteria, the opposite approach was applied.
The utility measure () and regret measure () were then calculated as follows:
where represents the performance value of alternative under criterion , is the weight of criterion obtained from the Kano–QFD framework, denotes the overall utility measure, and represents the maximum individual regret value.
Subsequently, the compromise ranking index () was determined as:
where:
and the parameter is the weight of the strategy emphasizing group utility. In this study, the conventional value of was adopted, assigning equal importance to group utility and individual regret.
The alternatives were ranked according to their values. Lower values indicate better compromise solutions and therefore correspond to higher-ranking alternatives.
2.4. Sensitivity Analysis
To evaluate the robustness of the proposed Kano–QFD–MCDM framework, a sensitivity analysis was conducted by modifying the importance coefficients assigned to customer requirements within the Kano–QFD stage. Three alternative decision-making scenarios were considered: (i) an environmental-priority scenario, (ii) a cost-priority scenario, and (iii) a technical-performance-priority scenario.
In each scenario, the customer requirements associated with the targeted decision perspective were assigned the highest Kano importance coefficient (6), corresponding to the Performance category, while the remaining requirements retained lower priority levels. The House of Quality matrix was subsequently recalculated, generating revised relative importance weights for the technical performance criteria (P1–P9). These updated criterion weights were then used in the TOPSIS, VIKOR, and EDAS analyses, and the resulting rankings were compared with the original results to evaluate the robustness of the proposed framework under different decision-maker priorities.
2.5. Statistical Evaluation Approach
In this study, statistical analyses were conducted to examine the similarities and differences among the rankings obtained from the TOPSIS, EDAS, and VIKOR methods. Spearman rank correlation analysis was employed to evaluate the degree of association among the ranking results of the alternative fibers, while the Friedman test was used to determine whether statistically significant differences existed among the rankings generated by the three MCDM methods. These analyses were intended to provide an additional perspective on ranking behavior and methodological agreement rather than to establish the superiority of any individual method. All statistical analyses were performed using the Minitab 22 software package.
2.6. Consensus Ranking: Borda Count
In this study, the Borda Count consensus approach was employed to integrate the rankings obtained from TOPSIS, VIKOR, and EDAS. Since the objective was to derive a single consensus ranking from multiple MCDM methods, Borda Count was selected due to its simplicity, transparency, and widespread use in rank aggregation problems [32,33,34].
The consensus ranking was calculated by summing the rank positions assigned by each MCDM method for every alternative:
where denotes the total Borda score of alternative , is the rank assigned by method , and is the number of MCDM methods considered. Alternatives with lower total Borda scores were regarded as more preferable.
This approach enabled the integration of different ranking outcomes into a single coherent and consensus-based decision framework, thereby facilitating a more comprehensive final decision.
3. Results and Discussion
3.1. Classification of User Expectations Using the Kano Model
The paired responses obtained from the questionnaire were evaluated in accordance with the standard classification matrix of the Kano model. Each customer requirement was assigned to one of the six categories—Must-be, Performance, Attractive, Indifferent, Reverse, or Questionable—based on the combination of functional and dysfunctional responses provided by the participants. However, only the Performance, Must-be, and Indifferent categories were observed in the final classification results. Attractive, Reverse, and Questionable categories were not identified among the evaluated customer requirements and therefore did not contribute to the subsequent weighting process.
Table 3 presents the Kano classifications obtained from participant responses together with the numerical importance coefficients assigned to each category for subsequent QFD weighting calculations.
Table 3.
Kano classification results and corresponding numerical importance coefficients assigned to customer requirements.
3.2. Weighting of Technical Criteria Using Quality Function Deployment (QFD)
The customer requirements whose numerical priority levels were determined through the Kano model were subsequently linked to the technical performance criteria using the House of Quality matrix. The relationships between the customer requirements and the technical performance criteria are summarized in Table 4.
Table 4.
House of quality matrix for mapping customer requirements to technical performance criteria.
The degree of relationship between each customer requirement and each technical criterion was evaluated using coefficients of 1 (weak), 3 (moderate), and 9 (strong). These coefficients were multiplied by the Kano weights to obtain the raw scores for each technical criterion. The resulting scores were normalized to calculate the relative importance percentage, the relative importance value, and the importance ranking.
According to the results of the QFD analysis, air permeability (P3) emerged as the highest-priority technical criterion, followed by water vapor transmission (P4) and bursting strength (P1). This outcome can be directly attributed to the Kano–QFD weighting structure. The customer requirements “moisture management” and “breathability” were both classified as Performance attributes and therefore received the highest Kano importance coefficient (6). Since these requirements were strongly associated with air permeability and water vapor transmission in the House of Quality matrix, the corresponding technical criteria accumulated the highest weighted scores.
Similarly, bursting strength (P1) achieved a relatively high priority because it was strongly associated with the customer requirement representing durability-related expectations within the QFD framework. These findings indicate that users primarily associate sportswear quality with comfort-related properties such as airflow and moisture transfer, while maintaining adequate structural durability.
In contrast, wicking performance (P5) received the lowest priority score despite its recognized importance in sportswear applications. This result reflects the structure of the QFD matrix rather than the intrinsic technical value of the criterion itself. The customer requirements identified through the Kano analysis were more strongly associated with general perceptions of breathability and moisture evaporation than with direct moisture transport within the fabric. Consequently, criteria such as air permeability (P3) and water vapor transmission (P4) received greater emphasis in the weighting process. The sustainability-related criteria, namely carbon footprint (P7), biodegradability (P8), and product cost (P9), obtained moderate importance levels, indicating that environmental and economic considerations were recognized by participants; however, comfort-oriented performance attributes received relatively greater emphasis within the proposed Kano–QFD weighting structure.
3.3. Evaluation of Fiber Alternatives Based on Performance Criteria
The performance values of the six fiber alternatives were comparatively evaluated across nine criteria (P1–P9). These criteria include structural durability (bursting strength), surface durability (pilling resistance), breathability, moisture management, UV protection capacity, environmental impact (carbon footprint and biodegradation time), and cost-related parameters.
The performance values of the six fiber alternatives across the nine evaluation criteria are presented in Table 5. According to the comparative analysis results, Tencel exhibited strong performance in pilling resistance (P2), air permeability (P3), and water vapor transmission (P4), indicating a favorable comfort-related performance profile. Polyester, on the other hand, exceeded the upper measurement limit in the bursting strength test (P1), indicating superior structural durability, and also demonstrated the lowest product cost (P9). However, it showed relatively poor performance in pilling resistance (P2), wicking performance (P5), carbon footprint (P7), and biodegradability (P8). These findings highlight the trade-off between technical performance and environmental sustainability in fiber selection. While polyester provided outstanding mechanical performance and cost advantages, its substantially higher carbon footprint and extremely long biodegradation time reduced its sustainability profile. In contrast, bio-based fibers such as bamboo, Tencel, and soy offered more balanced environmental characteristics, although trade-offs in specific technical properties were observed. Soy fiber demonstrated particularly strong performance in UV protection (P6) and wicking capacity (P5), but its relatively high cost limited its economic attractiveness. Overall, the results suggest that no single fiber simultaneously maximized all performance dimensions, emphasizing the importance of multi-criteria evaluation approaches for sustainable sportswear material selection.
Table 5.
Performance values of the fiber alternatives across the nine evaluation criteria (P1–P9).
3.4. TOPSIS Analysis Based on the Decision Matrix
In the first stage of the analysis, the TOPSIS method was applied to evaluate the performance of the fiber alternatives. This method generates a relative closeness coefficient (CCᵢ) for each alternative by considering its distance from the positive and negative ideal solutions. The obtained CCᵢ values and the corresponding ranking results are presented in Table 6.
Table 6.
Closeness Coefficients (CCi) and ranking results obtained by TOPSIS analysis.
The TOPSIS results ranked Tencel as the highest-performing alternative (CCi = 0.972), indicating the closest proximity to the ideal solution among all evaluated fibers. This result suggests that Tencel achieved the most balanced combination of technical, environmental, and economic performance when the weighted criteria were considered simultaneously.
Soy, cotton, and modal exhibited relatively similar CCi values and formed a competitive middle group, indicating that these alternatives satisfied multiple evaluation criteria without demonstrating a dominant advantage. In contrast, bamboo, despite its favorable environmental characteristics, ranked below these alternatives due to comparatively lower performance in several highly weighted technical criteria.
Polyester ranked last despite its outstanding bursting strength (P1) and low cost (P9). Its substantially higher carbon footprint (P7) and extremely long biodegradation time (P8) reduced its overall closeness to the ideal solution and negatively affected its final ranking. These findings demonstrate that strong performance in a limited number of criteria is insufficient to achieve a high TOPSIS ranking when environmental and sustainability-related criteria are also incorporated into the evaluation framework.
Overall, the TOPSIS results indicate that regenerated and bio-based fibers can provide competitive alternatives for sportswear applications when technical, environmental, and economic criteria are evaluated simultaneously.
3.5. VIKOR Analysis Based on the Decision Matrix
Another method used for evaluating the alternatives is the VIKOR analysis. This method determines the relative ranking of the alternatives through a “compromise value” (Q), which simultaneously considers both the average and the worst criterion performances. The results obtained from the analysis are presented in Table 7.
Table 7.
Ranking of fibers based on VIKOR compromise values (Qi).
The VIKOR analysis ranked bamboo as the highest-ranked alternative, followed by Tencel and soy, based on the compromise solution index (Q). Unlike TOPSIS, which identified Tencel as the highest-ranked alternative, VIKOR emphasized the achievement of a balanced compromise among conflicting criteria rather than maximizing overall closeness to the ideal solution. Bamboo’s leading position can be attributed to its relatively balanced performance across technical, environmental, and economic criteria, without exhibiting extreme weaknesses in any major evaluation dimension.
Tencel and soy also achieved relatively low Q values, indicating strong overall performance. However, their rankings were slightly affected by trade-offs among individual criteria. In contrast, polyester benefited from outstanding mechanical performance and low cost but was penalized by its substantially higher carbon footprint and extremely long biodegradation time. Similarly, modal and cotton obtained higher compromise values due to less favorable overall balance among the weighted criteria.
The differences between the VIKOR and TOPSIS rankings demonstrate that the final ranking is influenced by the decision philosophy underlying each MCDM method. While TOPSIS prioritizes proximity to the ideal solution, VIKOR focuses on identifying compromise solutions that provide an acceptable balance among competing criteria. This finding highlights the importance of employing multiple decision-making approaches when evaluating sustainable sportswear fibers.
3.6. EDAS Analysis Based on the Decision Matrix
Another method used to evaluate the fiber alternatives is the EDAS (Evaluation Based on Distance from Average Solution) analysis. This method calculates an overall appraisal score (AS) for each alternative by considering its positive and negative distances from the average solution and determines the ranking of the alternatives based on these normalized values. The resulting EDAS ranking and Overall Appraisal Scores (AS) for all fiber alternatives are presented in Table 8.
Table 8.
EDAS analysis results: Overall Appraisal Scores (AS) and ranking.
The EDAS analysis ranked soy as the highest-performing alternative, followed by bamboo and modal, based on the Overall Appraisal Score (AS). Unlike TOPSIS and VIKOR, which evaluate alternatives according to ideal or compromise solutions, EDAS assesses performance relative to the average solution. Therefore, alternatives exhibiting balanced performance across multiple criteria tend to achieve higher appraisal scores.
Soy achieved the highest AS value due to its strong performance in UV protection (P6) and wicking capacity (P5), combined with acceptable results in the remaining criteria. Similarly, bamboo ranked second because of its balanced technical and environmental characteristics. In contrast, Tencel, which ranked first in TOPSIS, received a lower EDAS score, indicating that superior performance in selected criteria does not necessarily lead to the highest appraisal score in an average-solution-based evaluation.
Polyester again ranked last despite its outstanding bursting strength (P1) and low cost (P9), mainly due to its substantially higher carbon footprint (P7) and extremely long biodegradation time (P8). These findings highlight the trade-off between technical performance and environmental sustainability in fiber selection.
The differences observed among the EDAS, TOPSIS, and VIKOR rankings demonstrate that the final results are influenced by the evaluation logic of each MCDM method. While TOPSIS rewards proximity to the ideal solution and VIKOR emphasizes compromise among conflicting criteria, EDAS favors alternatives with balanced overall performance. This explains why soy emerged as the highest-ranked alternative in EDAS despite not being the top-ranked option in TOPSIS or VIKOR.
3.7. Statistical Evaluation of the Multi-Criteria Decision-Making Methods
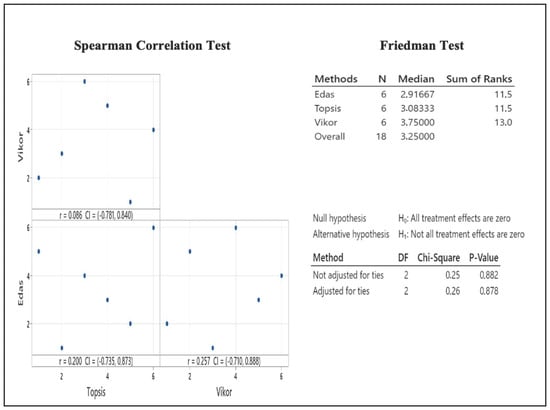
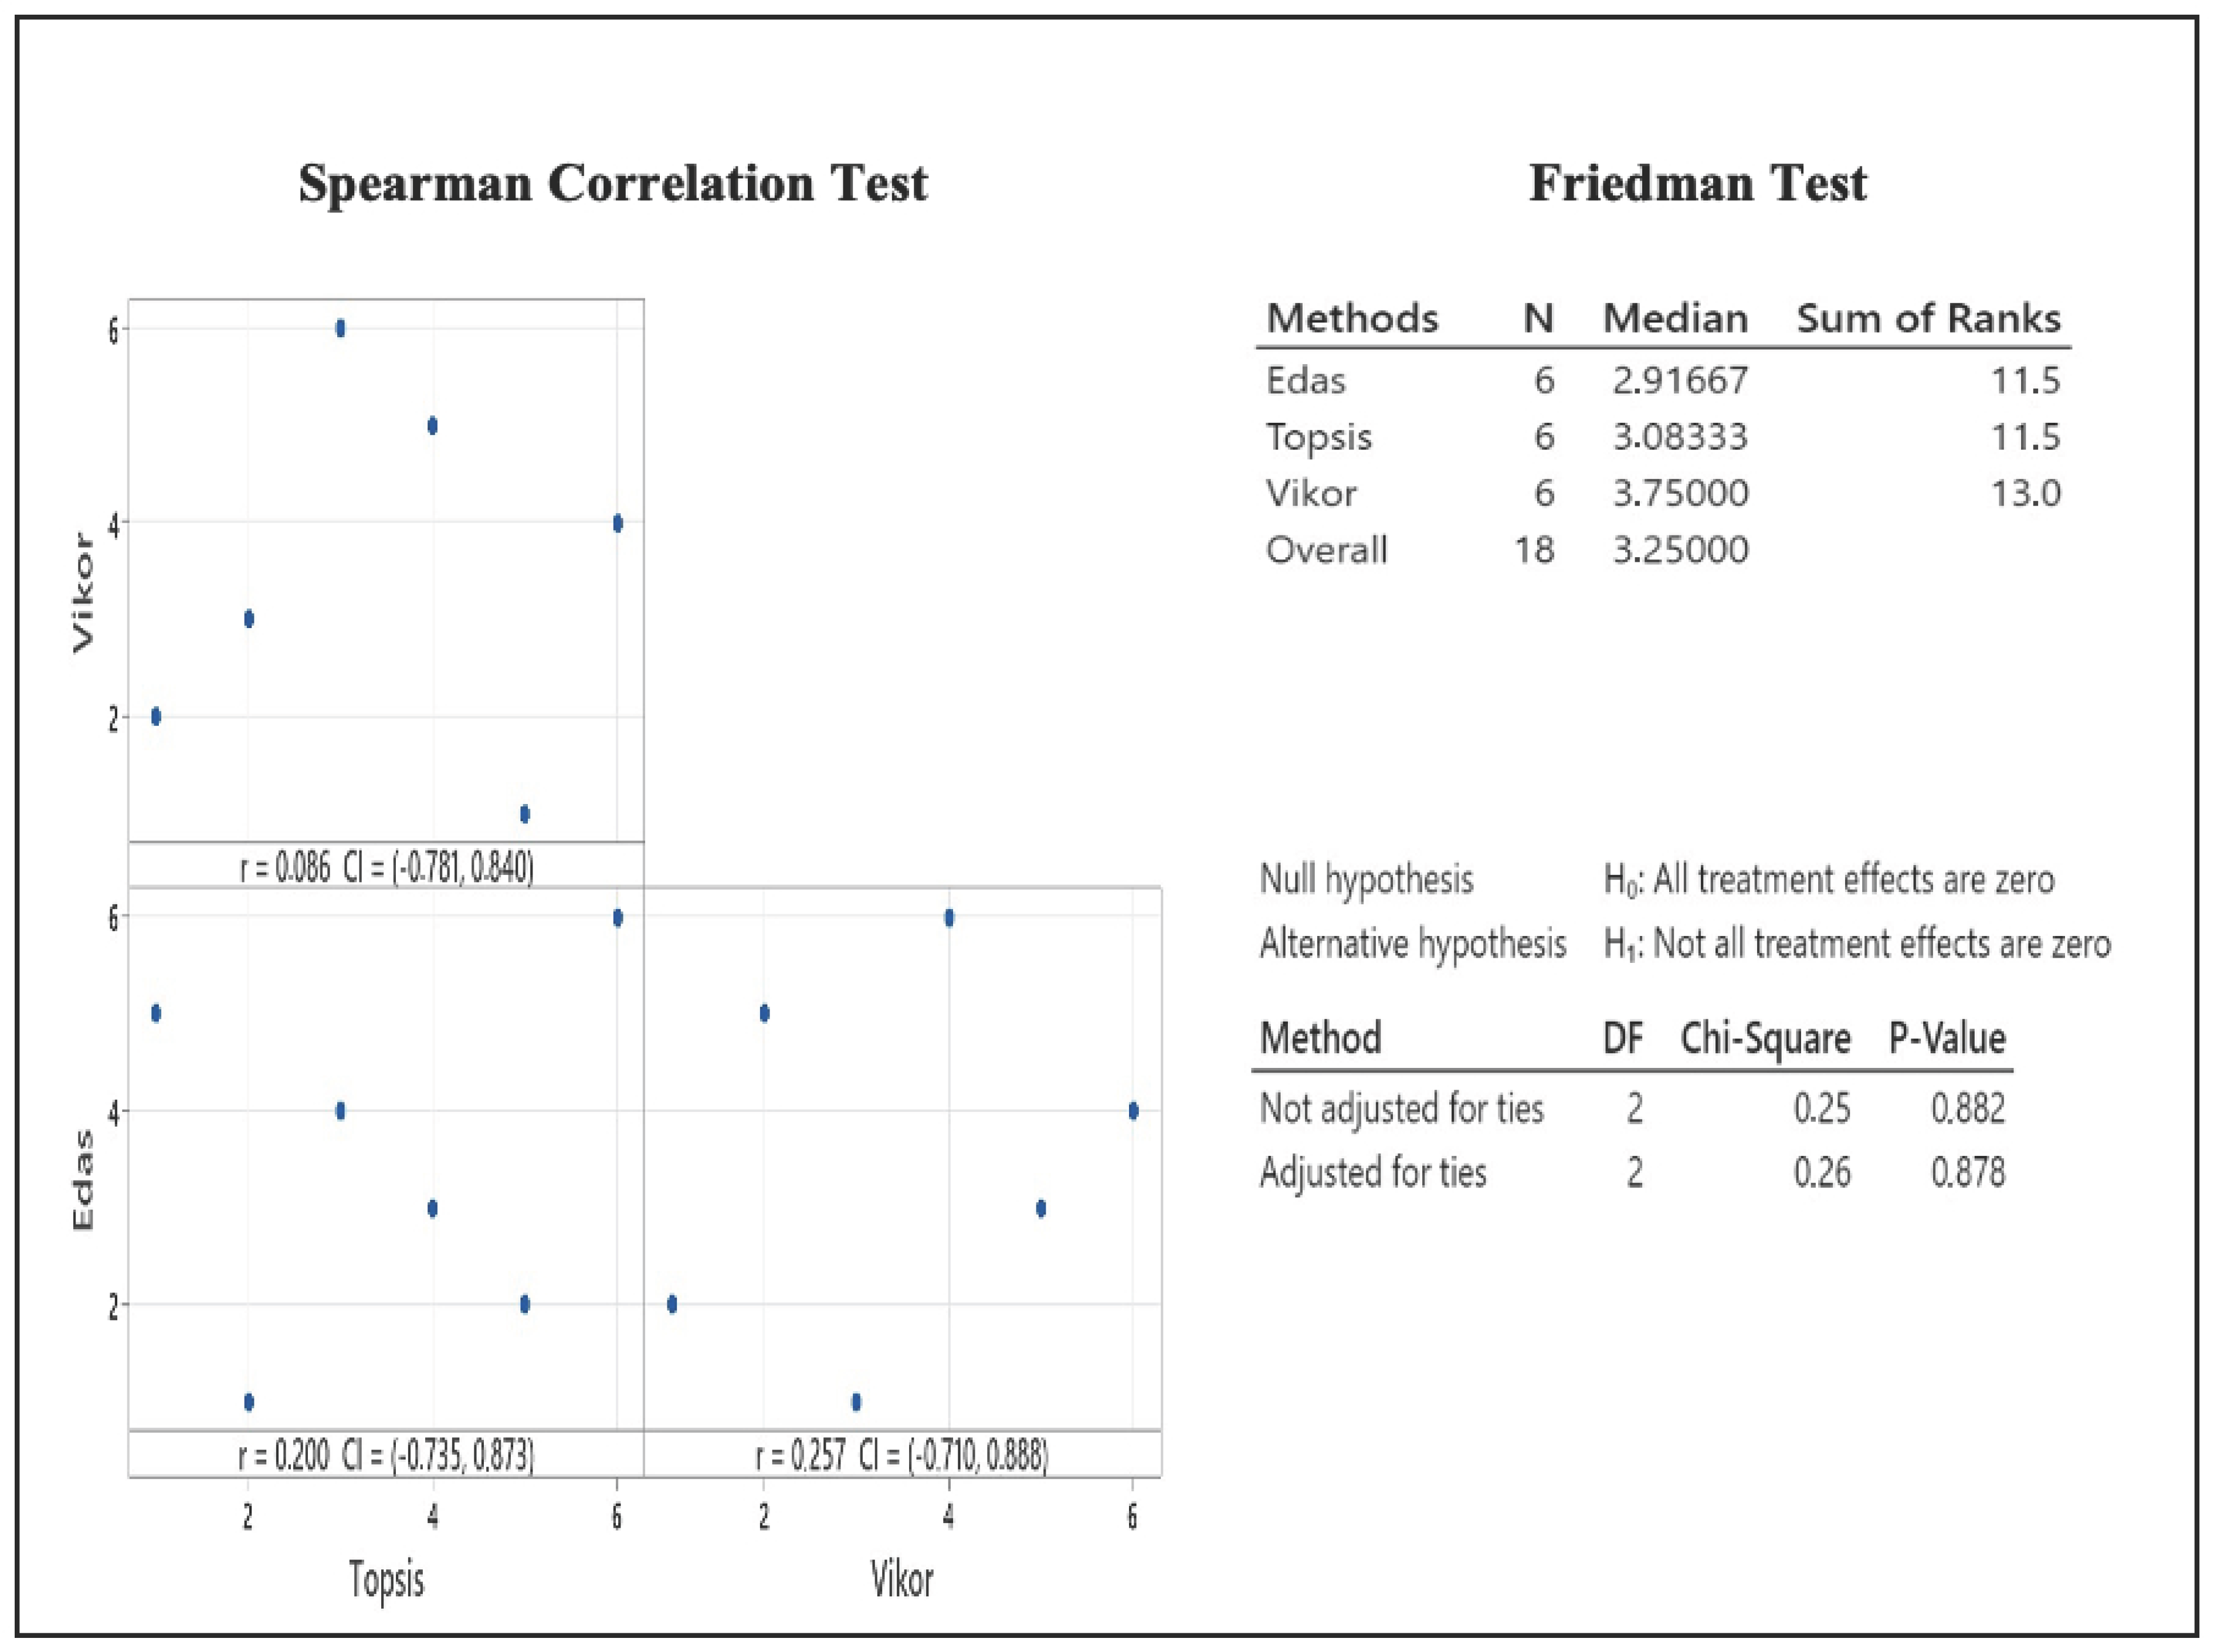
The consistency of the rankings obtained from the decision-making methods was examined using Spearman’s rank correlation and the Friedman variance analysis. These analyses were conducted to assess the degree of similarity among the methods and to determine whether the differences between their ranking results were statistically significant. The statistical comparison of the TOPSIS, VIKOR, and EDAS methods is illustrated in Figure 1.
Figure 1.
Spearman rank correlations and Friedman variance analysis results for the TOPSIS, VIKOR, and EDAS methods. Note: The graphic was produced using the Minitab 22 statistical package.
The Spearman rank correlation analysis indicated weak associations among the three MCDM methods. The correlation coefficient between TOPSIS and VIKOR was r = 0.086, between TOPSIS and EDAS was r = 0.200, and between VIKOR and EDAS was r = 0.257, suggesting limited agreement among the ranking results. Although the Friedman test did not identify statistically significant differences among the rankings produced by TOPSIS, VIKOR, and EDAS (χ2(2) = 0.26, p = 0.878), this result should be interpreted with caution due to the limited number of alternatives evaluated.
Therefore, the non-significant Friedman result does not imply ranking equivalence, but rather indicates that no statistically significant overall difference could be detected under the conditions of the present study. The observed ranking variations, including the selection of different top-ranked alternatives by TOPSIS, VIKOR, and EDAS, highlight the influence of the underlying decision logic of each MCDM method. While TOPSIS identified Tencel as the highest-ranked alternative, VIKOR favored bamboo and EDAS ranked soy first, reflecting the different evaluation philosophies embedded in these approaches.
These findings suggest that the final ranking is method-dependent to a certain extent and reinforce the importance of employing multiple MCDM methods when evaluating sustainable sportswear fibers. The combined use of TOPSIS, VIKOR, and EDAS provides a more comprehensive assessment by capturing different aspects of technical, environmental, and economic performance.
3.8. Sensitivity Analysis of Criterion Weights
To evaluate the robustness of the proposed Kano–QFD–MCDM framework, a sensitivity analysis was performed by modifying the priority levels assigned to customer requirements and recalculating the criterion weights through the QFD process. The sensitivity analysis aimed to assess whether changes in customer requirements and the resulting criterion weights would substantially influence the ranking outcomes. By comparing the rankings obtained under environmental-priority, cost-priority, and technical-performance-priority scenarios with the original results, it was possible to evaluate the degree to which the final decisions depended on the weighting structure adopted in the Kano–QFD process.
Table 9 presents the TOPSIS rankings obtained under the original Kano–QFD weighting structure and the three alternative sensitivity scenarios. The results indicate that the ranking order remained unchanged across all scenarios. Tencel consistently ranked first, followed by soy, cotton, modal, bamboo, and polyester.
Table 9.
TOPSIS ranking results under alternative weighting scenarios.
The stability of the rankings demonstrates that the TOPSIS results were highly robust to variations in customer-priority assumptions and the resulting criterion weights. Even when environmental sustainability, cost efficiency, or technical performance were emphasized through alternative weighting structures, the relative ordering of the fiber alternatives remained identical to the original ranking.
This finding suggests that the superiority of Tencel and the overall ranking pattern were not dependent on a specific weighting configuration. Rather, the performance differences among the alternatives were sufficiently consistent to preserve the ranking outcomes under different decision-making perspectives. Therefore, the TOPSIS-based results can be considered stable and reliable within the scope of the evaluated scenarios.
Table 10 presents the VIKOR rankings obtained under the original Kano–QFD weighting structure and the three alternative sensitivity scenarios. The comparison enables an assessment of the stability of the compromise solutions generated by the VIKOR method under different customer-priority assumptions and criterion-weighting structures.
Table 10.
VIKOR ranking results under alternative weighting scenarios.
Unlike TOPSIS, which produced identical rankings under all weighting scenarios, the VIKOR results exhibited a moderate sensitivity to changes in customer-priority structures. Bamboo and Tencel consistently maintained the first and second positions across all scenarios, whereas the most noticeable changes occurred under the cost-priority scenario, where soy dropped from third to sixth place and modal and cotton improved their rankings. In contrast, the technical-performance-priority scenario produced results identical to the original ranking. These findings indicate that VIKOR is more responsive to weight modifications than TOPSIS, while still demonstrating stable performance for the highest-ranked alternatives.
Table 11 presents the EDAS rankings obtained under the original Kano–QFD weighting structure and the three alternative sensitivity scenarios. Since EDAS evaluates alternatives based on their positive and negative distances from the average solution, the sensitivity analysis provides insight into how changes in customer-priority structures influence ranking outcomes under an average-solution-based evaluation framework.
Table 11.
EDAS ranking results under alternative weighting scenarios.
The EDAS results exhibited a moderate sensitivity to changes in criterion weights. The environmental-priority scenario produced rankings identical to the original results, indicating that the original Kano–QFD weighting structure already reflected environmental considerations to a considerable extent. The most notable changes were observed under the cost-priority scenario, where bamboo moved to first place and soy dropped from first to fourth place. In contrast, only minor ranking variations occurred under the technical-performance-priority scenario. These findings suggest that EDAS is more responsive to weight modifications than TOPSIS, particularly when economic criteria are emphasized, while still maintaining a relatively stable overall ranking structure.
Overall, the sensitivity analysis demonstrated that the ranking stability varied across the MCDM methods. TOPSIS produced identical rankings under all weighting scenarios, indicating a high degree of robustness to changes in customer-priority structures. In contrast, VIKOR and EDAS exhibited moderate sensitivity, particularly under the cost-priority scenario, where noticeable changes occurred among the middle-ranked alternatives. Nevertheless, the highest- and lowest-ranked alternatives remained relatively stable across most scenarios. These findings suggest that, while individual rankings may be influenced by criterion-weight modifications, the overall conclusions of the proposed Kano–QFD–MCDM framework remain largely consistent. Therefore, the framework can be considered sufficiently robust for supporting sustainable fiber selection under different decision-making priorities.
3.9. Consensus Ranking Using the Borda Count Method
The Borda Count method was employed to integrate the rankings obtained from the TOPSIS, VIKOR, and EDAS methods. Since the performance scores generated by these methods differ in scale and interpretation, all results were first converted into ordinal rankings, where rank 1 represents the best-performing alternative in each method.
The Borda Count method was selected because it provides a simple and transparent rank aggregation procedure that combines the results of different MCDM methods without requiring additional normalization or weighting assumptions. Given the ranking differences observed among TOPSIS, VIKOR, and EDAS, Borda aggregation was adopted to obtain a consensus-based final ranking.
Table 12 presents the rankings obtained from the TOPSIS, VIKOR, and EDAS methods together with the aggregated rank scores derived from the Borda procedure. According to the integrated results, soy achieved the best overall performance and ranked first. Bamboo and Tencel shared the second position with equal aggregated rank scores. Modal ranked third, followed by cotton in fourth place, while polyester ranked last. The differences among the individual MCDM rankings demonstrate the value of rank aggregation for obtaining a consensus-based decision outcome.
Table 12.
Final integrated ranking of the fiber alternatives based on the Borda Count method.
From a practical decision-making perspective, the tie between bamboo and Tencel indicates that the final preference may depend on the priorities of decision-makers. Bamboo may be preferred when environmental considerations are emphasized, whereas Tencel may be preferred when technical performance, breathability, and moisture-management properties are prioritized. Therefore, both fibers can be considered strong alternatives under different decision scenarios.
4. Conclusions
This study proposed an integrated decision-support framework for sustainable fiber selection in sportswear by combining Kano–QFD-based weighting with three widely used multi-criteria decision-making (MCDM) methods, namely TOPSIS, VIKOR, and EDAS. Unlike conventional approaches that focus primarily on technical performance, the proposed framework incorporates customer expectations together with environmental and economic considerations, thereby enabling a more comprehensive evaluation process. The inclusion of sustainability-related indicators such as carbon footprint and biodegradability ensured that environmental priorities were explicitly reflected in the decision-making framework.
The results demonstrated that fiber selection substantially influences the overall sustainability profile of sportswear products. Although polyester exhibited advantages in terms of bursting strength and cost, its relatively higher carbon footprint and longer biodegradation time negatively affected its overall sustainability assessment within the adopted framework. In contrast, bio-based and regenerated fibers such as soy, bamboo, and Tencel provided more balanced alternatives by combining acceptable technical performance with lower environmental impacts.
The application of different MCDM methods produced variations in the ranking results. TOPSIS identified Tencel as the highest-ranked alternative, VIKOR favored bamboo, and EDAS ranked soy first. The weak correlations observed among the ranking methods indicate that the final ranking is influenced by the underlying evaluation philosophy of each MCDM technique. Although the Friedman test did not reveal statistically significant overall differences among the rankings, this finding should be interpreted cautiously due to the limited number of alternatives evaluated. Furthermore, the sensitivity analysis demonstrated that the proposed framework remained largely stable under alternative weighting scenarios. TOPSIS produced identical rankings across all scenarios, while VIKOR and EDAS exhibited only moderate sensitivity, with the most noticeable changes occurring under the cost-priority scenario. These findings support the robustness of the proposed framework and indicate that the overall conclusions are not highly dependent on a specific weighting configuration.
The primary contribution of this study is not the identification of a universally superior fiber, but the development of an integrated evaluation framework that systematically combines customer requirements, technical performance, environmental sustainability, and economic considerations within a single decision-support structure. Under the weighting and aggregation framework adopted in this study, soy fiber achieved the highest overall ranking according to the Borda Count results, while bamboo and Tencel also emerged as strong alternatives under different decision-making priorities and evaluation perspectives.
Future research may further strengthen the proposed framework through sensitivity analyses involving alternative weighting scenarios and decision-maker preferences. Additional sustainability indicators, such as water consumption, energy demand, recyclability, and circularity-related metrics, may also be incorporated. Furthermore, the applicability of the framework should be investigated across different textile products and end-use applications to evaluate the generalizability of the proposed approach beyond sportswear fabrics.
Funding
This research received no external funding.
Institutional Review Board Statement
Ethical review and approval were waived for this study by Institution Committee as per Ethics Committee Approval Exemption of TEKİRDAĞ NAMIK KEMAL UNIVERSITY ÇERKEZKÖY VOCATIONAL SCHOOL.
Informed Consent Statement
Informed consent was obtained from all participants involved in the study.
Data Availability Statement
The data supporting the findings of this study are available from the corresponding author upon reasonable request.
Acknowledgments
The authors would like to express their gratitude to HAYTEKS Ecological Textile Industry for providing the soybean protein yarns used in this study; to the Marmara University ITA Textile Research Laboratory for conducting the experimental tests; and to the Turkish Textile Foundation METEM Schools for their support in the fabric manufacturing processes.
Conflicts of Interest
The authors declare no conflicts of interest.
References
- Hwang, C.L.; Yoon, K. Multiple Attribute Decision Making: Methods and Applications; Springer: Berlin/Heidelberg, Germany, 1981. [Google Scholar]
- Opricovic, S.; Tzeng, G.H. Compromise solution by MCDM methods: A comparative analysis of VIKOR and TOPSIS. Eur. J. Oper. Res. 2004, 156, 445–455. [Google Scholar] [CrossRef] [Scilit]
- Ghorabaee, M.K.; Amiri, M.; Zavadskas, E.K.; Turskis, Z. Multicriteria evaluation of green suppliers using an extended EDAS method with interval type-2 fuzzy sets. E+M Ekon. Manag. 2017, 20, 48–68. [Google Scholar] [CrossRef] [Scilit]
- Kishawy, H.A.; Hegab, H.; Saad, E. Design for sustainable manufacturing: Approach, implementation, and assessment. Sustainability 2018, 10, 3604. [Google Scholar] [CrossRef] [Scilit]
- Kano, N.; Seraku, N.; Takahashi, F.; Tsuji, S. Attractive quality and must-be quality. J. Jpn. Soc. Qual. Control 1984, 14, 39–48. [Google Scholar] [CrossRef]
- Akao, Y. Quality Function Deployment: Integrating Customer Requirements into Product Design; Productivity Press: New York, NY, USA, 2004. [Google Scholar]
- Hsu, C.H.; Chang, T.M.; Wang, S.Y.; Lin, P.Y. Integrating Kano’s model into quality function deployment to facilitate decision analysis for service quality. In Proceedings of the 8th WSEAS International Conference on Mathematics and Computers in Business and Economics, Vancouver, BC, Canada, 19–21 June 2007; Volume 8. [Google Scholar]
- Witell, L.; Löfgren, M. Classification of quality attributes. Manag. Serv. Qual. Int. J. 2007, 17, 54–73. [Google Scholar] [CrossRef] [Scilit]
- Shen, X.X.; Tan, K.C.; Xie, M. An integrated approach to innovative product development using Kano’s model and Quality Function Deployment. Eur. J. Innov. Manag. 2000, 3, 91–99. [Google Scholar] [CrossRef] [Scilit]
- Lai, X.; Xie, M.; Tan, K.C. Optimizing product design using the Kano model and QFD. In Proceedings of the 2004 IEEE International Engineering Management Conference; IEEE EMS Singapore Chapter: Singapore, 2004; pp. 1085–1089. [Google Scholar]
- Li, H.; Shi, L. Applied research on the design of protective clothing based on the Kano-QFD-PUGH method. PLoS ONE 2024, 19, e0312045. [Google Scholar] [CrossRef] [Scilit] [PubMed]
- Chaudha, A.; Jain, R.; Singh, A.R.; Mishra, P.K. Integration of Kano’s model into quality function deployment (QFD). Int. J. Adv. Manuf. Technol. 2011, 53, 689–698. [Google Scholar] [CrossRef] [Scilit]
- Ji, P.; Jin, J.; Wang, T.; Chen, Y. Quantification and integration of Kano’s model into QFD for optimising product design. Int. J. Prod. Res. 2014, 52, 6335–6348. [Google Scholar] [CrossRef] [Scilit]
- Zhao, S.; Zhang, Q.; Peng, Z.; Fan, Y. Integrating customer requirements into customized product configuration design based on Kano’s model. J. Intell. Manuf. 2020, 31, 597–613. [Google Scholar] [CrossRef] [Scilit]
- Wu, H.-H.; Tang, Y.-T.; Shyu, J.-W. An integrated approach of Kano’s model and importance-performance analysis in identifying key success factors. Afr. J. Bus. Manag. 2010, 4, 3238–3250. [Google Scholar]
- Li, M.; Zhang, J. Integrating Kano model, AHP, and QFD methods for new product development based on text mining, intuitionistic fuzzy sets, and customers satisfaction. Math. Probl. Eng. 2021, 2021, 9962188. [Google Scholar] [CrossRef] [Scilit]
- Kirgizov, U.A.; Kwak, C. Quantification and integration of Kano’s model into QFD for customer-focused product design. Qual. Technol. Quant. Manag. 2021, 20, 200–220. [Google Scholar] [CrossRef] [Scilit]
- Shen, L.; Worrell, E.; Patel, M.K. Environmental impact assessment of man-made cellulose fibres. Resour. Conserv. Recycl. 2010, 55, 260–274. [Google Scholar] [CrossRef] [Scilit]
- Muthu, S.S. Assessing the Environmental Impact of Textiles and the Clothing Supply Chain; Woodhead Publishing: Cambridge, UK, 2014. [Google Scholar]
- Majumdar, A.; Sarkar, B.; Majumdar, P.K. Application of analytic hierarchy process for the selection of cotton fibers. Fibers Polym. 2004, 5, 297–302. [Google Scholar] [CrossRef] [Scilit]
- Banwet, D.K.; Majumdar, A. Comparative analysis of AHP-TOPSIS and GA-TOPSIS methods for selection of raw materials in textile industries. In Proceedings of the 2014 International Conference on Industrial Engineering and Operations Management, Bali, Indonesia, 7–9 January 2014; pp. 2071–2080. [Google Scholar]
- ISO 13938-2:1999; Textiles—Bursting Properties of Fabrics—Part 2: Pneumatic Method for Determination of Bursting Strength and Bursting Distension. International Organization for Standardization (ISO): Geneva, Switzerland, 1999.
- ISO 12945-2:2020; Textiles—Determination of Fabric Propensity to Surface Fuzzing and to Pilling—Part 2: Modified Martindale Method. International Organization for Standardization (ISO): Geneva, Switzerland, 2020.
- ISO 9237:1995; Textiles—Determination of the Permeability of Fabrics to Air. International Organization for Standardization (ISO): Geneva, Switzerland, 1995.
- BS 7209:1990; Specification for Water Vapour Permeable Apparel Fabrics. British Standards Institution (BSI): London, UK, 1990.
- AATCC TM197-2023; Vertical Wicking of Textiles. American Association of Textile Chemists and Colorists (AATCC): Research Triangle Park, NC, USA, 2023.
- AS/NZS 4399:1996; Sun Protective Clothing—Evaluation and Classification. Standards Australia: Sydney, Australia; Standards New Zealand: Wellington, New Zealand, 1996.
- Cotton Incorporated. Cotton Lifecycle Assessment Update; Cotton Incorporated: Cary, NC, USA, 2023. [Google Scholar]
- Lenzing, A.G. Environmental Performance of LENZING™ Fibers: Life Cycle Assessment and Sustainability Report; Lenzing AG: Lenzing, Austria, 2015. [Google Scholar]
- Kaynak, H.K.; Özşahin, K. Investigation of performance and biodegradability properties of hemp and cotton blended knitted fabrics. Kahramanmaraş Sütçü İmam Univ. J. Eng. Sci. 2025, 28, 994–1006. [Google Scholar] [CrossRef] [Scilit]
- Yıldırım, F.F.; Avinç, O.O.; Yavaş, A. Soya fasulyesi protein lifleri: Bölüm 1. Soya fasulyesi protein liflerinin genel yapısı, üretimi ve çevresel etkileri. Uludağ Univ. J. Fac. Eng. 2014, 19, 87–104. [Google Scholar]
- De Borda, J.C. Mémoire sur les élections au scrutin. Hist. l’Académie R. Sci. 1781, 102, 657–665. [Google Scholar]
- Saari, D.G. Basic Geometry of Voting; Springer: Berlin/Heidelberg, Germany, 1995. [Google Scholar]
- García-Lapresta, J.L.; Martínez-Panero, M. Borda Count versus Approval Voting: A fuzzy approach. Public Choice 2002, 112, 167–184. [Google Scholar] [CrossRef] [Scilit]

Disclaimer/Publisher’s Note: The statements, opinions and data contained in all publications are solely those of the individual author(s) and contributor(s) and not of MDPI and/or the editor(s). MDPI and/or the editor(s) disclaim responsibility for any injury to people or property resulting from any ideas, methods, instructions or products referred to in the content. |
© 2026 by the author. Licensee MDPI, Basel, Switzerland. This article is an open access article distributed under the terms and conditions of the Creative Commons Attribution (CC BY) license.