


Abstract
Road geometry is a modifiable determinant of crash occurrence and severity; addressing it is critical for achieving sustainable transport systems. Yet, policy action requires clear prioritization across road types and years to ensure sustainable resource allocation. This study analyzes fatal and injury outcomes by roadway geometric context in Türkiye (2015–2024) and proposes a cell-level prioritization framework integrating crash burden, severity, and short-term deviations to support long-term sustainable road safety management. Annual data were structured as Year × Road type × Geometry × Category, with severity measured as deaths and injuries per 100 crashes (Kmin = 30). A Road Geometry Severity Index (RGSI; 0–100) combined standardized severity, log crash burden, and deviation from a three-year baseline. Isolation Forest and a MAD-based rule identified anomalies, while K-means clustering (K = 4) revealed burden–severity profiles. Results show deaths per 100 crashes declined from 7.91 (2015) to 3.29 (2022), then rose to 6.22 (2024). Severity was highest on provincial (8.82) and state roads (7.23), compared to motorways (4.66). High-severity cells were dominated by provincial-road contexts, especially dangerous curves and junction-related categories. The highest-priority cell was 2018–Provincial Road–Junction–No Junction (RGSI = 100). Under the predefined contamination specification (γ = 0.05), the Isolation Forest model flagged 35 anomalous cells, all of which also satisfied the MAD-based anomaly criterion. Findings highlight persistent high-priority roadway geometric contexts and demonstrate the potential of RGSI as a transparent infrastructure-prioritization tool.
1. Introduction
Road traffic injuries remain a major and unevenly distributed global public health burden. The World Health Organization (WHO) estimates that approximately 1.19 million people die each year due to road traffic crashes, with road traffic injuries being the leading cause of death among children and young adults aged 5–29 years [1]. In the WHO Global Status Report on Road Safety 2023, the global death toll is similarly estimated at ~1.19 million deaths (2021), underscoring that progress has been modest relative to the scale of preventable harm [2]. Recent burden assessments also emphasize that road traffic injuries remain a leading cause of death and disability among young populations, particularly in low- and middle-income settings where rapid motorization and constrained trauma care can compound the burden of severe road traffic injuries [3]. Against this background, contemporary road safety frameworks increasingly emphasize upstream, system-level interventions capable of preventing high-severity events before they occur.
Global road safety efforts increasingly frame prevention through a “Safe System” logic: deaths and serious injuries are not inevitable by-products of mobility but predictable outcomes of interacting risks across roads, vehicles, speeds, and road users [2]. This policy orientation is reinforced by internationally recognized targets to substantially reduce road traffic deaths and injuries, as well as by national strategy documents that adopt aligned goals and monitoring structures [4]. In line with this broader policy orientation, Türkiye’s “Road Traffic Safety Strategy Document (2021–2030)” and its associated action plans establish a national framework aimed at substantially reducing road traffic fatalities and serious injuries while institutionalizing inter-agency coordination, implementation, and monitoring mechanisms [4]. From a measurement perspective, this national context is also important because Türkiye’s official road-traffic fatality statistics have adopted a 30-day definition for crash-related deaths since 2015 [5].
First, traditional hotspot screening approaches are inherently reactive and highly localized, relying strictly on spatial coordinates to identify high-frequency collision points. While valuable, coordinate-based hotspot analysis often suffers from the regression-to-the-mean phenomenon and tends to mask systemic, infrastructure-wide design vulnerabilities. The RGSI framework shifts this paradigm from a spatial coordinate perspective to a structural geometric stratum perspective (road-type and geometry-category strata). By evaluating safety performance at the geometric stratum cell level, RGSI isolates how specific engineering configurations (such as horizontal curvature thresholds or unsignalized junction categories) systematically amplify injury severity across the entire national network, regardless of a single spatial point. Second, unlike standard composite risk indices that rely on static, linear weighting systems, the RGSI is structurally multi-dimensional and dynamic. It simultaneously balances three distinct mathematical layers: the absolute log-scaled crash burden, the normalized internal severity (fatalities and injuries normalized per 100 crashes), and an operational trend component that computes short-term severity deviations from a moving three-year rolling baseline. This prevents the index from being heavily biased toward high-volume macro highways while remaining highly sensitive to sudden, structural safety regressions in lower-volume provincial networks. Third, conventional safety prioritization approaches typically rank infrastructure based on simple arbitrary thresholds or basic statistical sorting. The proposed framework enhances objective decision-making by coupling the continuous RGSI scoring with an unsupervised machine learning pipeline (Isolation Forest and Median Absolute Deviation rule). This allows the model to systematically detect statistical anomalies in geometric contexts where safety performance has degraded relative to historical baselines, offering highway authorities a transparent and predictive tool for targeted infrastructure asset management and proactive safety audits.
More broadly, customized composite metrics are increasingly adopted in complex analytical domains when conventional single-indicator measures cannot adequately represent multidimensional risk structures or operational decision priorities.
Within this policy and prevention framework, road infrastructure and geometric context emerge as especially important modifiable determinants of crash occurrence and crash severity, making them central to engineering and policy prioritization. While conventional road safety paradigms heavily emphasize behavioral components such as driver error, distraction, or non-compliance, modern proactive safety frameworks recognize that infrastructure status plays a primary, foundational role in shaping and constraining driver behavior itself. Elements such as roadway geometric context, lane configurations, and pavement surface conditions directly dictate driver perception, workload, and speed selection, thereby acting as the structural root cause of behavioral failures. Horizontal curvature is a particularly prominent example: FHWA notes that horizontal curves account for more than 25% of fatalities and that the average crash rate on curves is roughly three times higher than on tangent segments, motivating targeted countermeasure programs [6]. Recent methodological studies have also leveraged connected-vehicle and trajectory-based data to improve the identification of high-severity run-off-road crash conditions on horizontal curves, further emphasizing the importance of curve-focused safety assessment approaches [7]. Evidence from applied safety research similarly shows that curve characteristics (e.g., sharp radius, short length, and spatial arrangement) can be associated with materially higher high-severity crash burden, reinforcing the need to identify and prioritize problematic geometric contexts [8,9]. Beyond curvature, junction and intersection design is another high-leverage domain where geometric form can shape conflict patterns and injury severity [10]. For instance, converting conventional intersections to roundabouts has been associated with large reductions in fatalities and injuries in meta-analytic and before-after evaluations [10,11]. Recent empirical studies have further confirmed that specific structural configurations, such as the number and type of lanes or the presence of median barriers, exert a profound, statistically significant impact on crash severity, demonstrating that self-explaining and forgiving infrastructure design can mitigate human error [12]. At the same time, the safety consequences of geometric context can be heterogeneous, interacting with traffic operations, environment, and driver behavior, suggesting that “one-factor-at-a-time” summaries may miss meaningful, actionable patterns across combinations of road type and geometry [13,14].
Analytically, road safety research has increasingly leveraged machine learning (ML) to model injury severity and to extract patterns from high-dimensional crash records. A recent systematic review and meta-analysis (2014–2025) highlights the rapid expansion of ML and deep learning for crash injury severity prediction while also pointing to substantial heterogeneity in modeling choices, evaluation metrics, and reporting practices [15]. Applied studies and technical reports similarly document the use of supervised ML approaches for crash severity classification and unsupervised methods for grouping or hotspot identification [16,17]. However, supervised prediction is often challenged by structural issues such as class imbalance and low fatality rates, especially when fatal outcomes constitute a small fraction of all crashes, potentially limiting predictive stability and interpretability for policy prioritization [18]. These limitations are especially relevant when the available data are annually aggregated and organized around road-type and geometry categories rather than individual crash-level microdata.
From a sustainability-engineering perspective, proactive identification of high-severity infrastructure contexts may support resilient transportation systems, optimized engineering-resource allocation, and long-term reduction of societal losses associated with severe traffic crashes. More broadly, recent sustainability-oriented engineering studies have similarly emphasized the integration of technical optimization with human-centered and resource-conscious system design approaches [19].
Accordingly, complementary approaches that emphasize prioritization and pattern discovery may be more useful than individual-level prediction in such settings. In practice, decision-makers often require interpretable outputs that (i) identify where severe outcomes cluster across infrastructure contexts, (ii) flag unusual changes relative to recent baselines, and (iii) translate complex strata into actionable priority lists. Türkiye-specific road safety work likewise underscores the importance of characterizing contributing factors and vulnerable road user outcomes using available administrative statistics and contextually meaningful strata [20].
Accordingly, this study aims to (i) quantify temporal and structural variation in fatal and injury outcomes across road types and road-geometry strata in Türkiye (2015–2024), and (ii) develop a cell-level prioritization framework that integrates crash burden, severity, and short-term deviations to support targeted road safety action, complemented by unsupervised anomaly detection and clustering for interpretable severity profiling.
2. Materials and Methods
2.1. Study Design and Reporting Framework
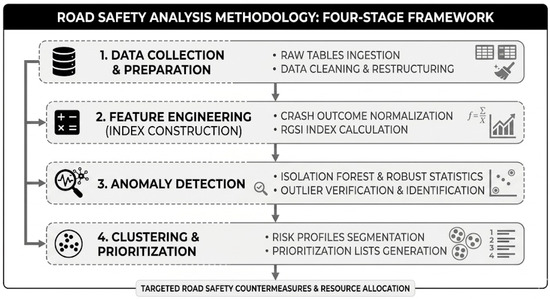
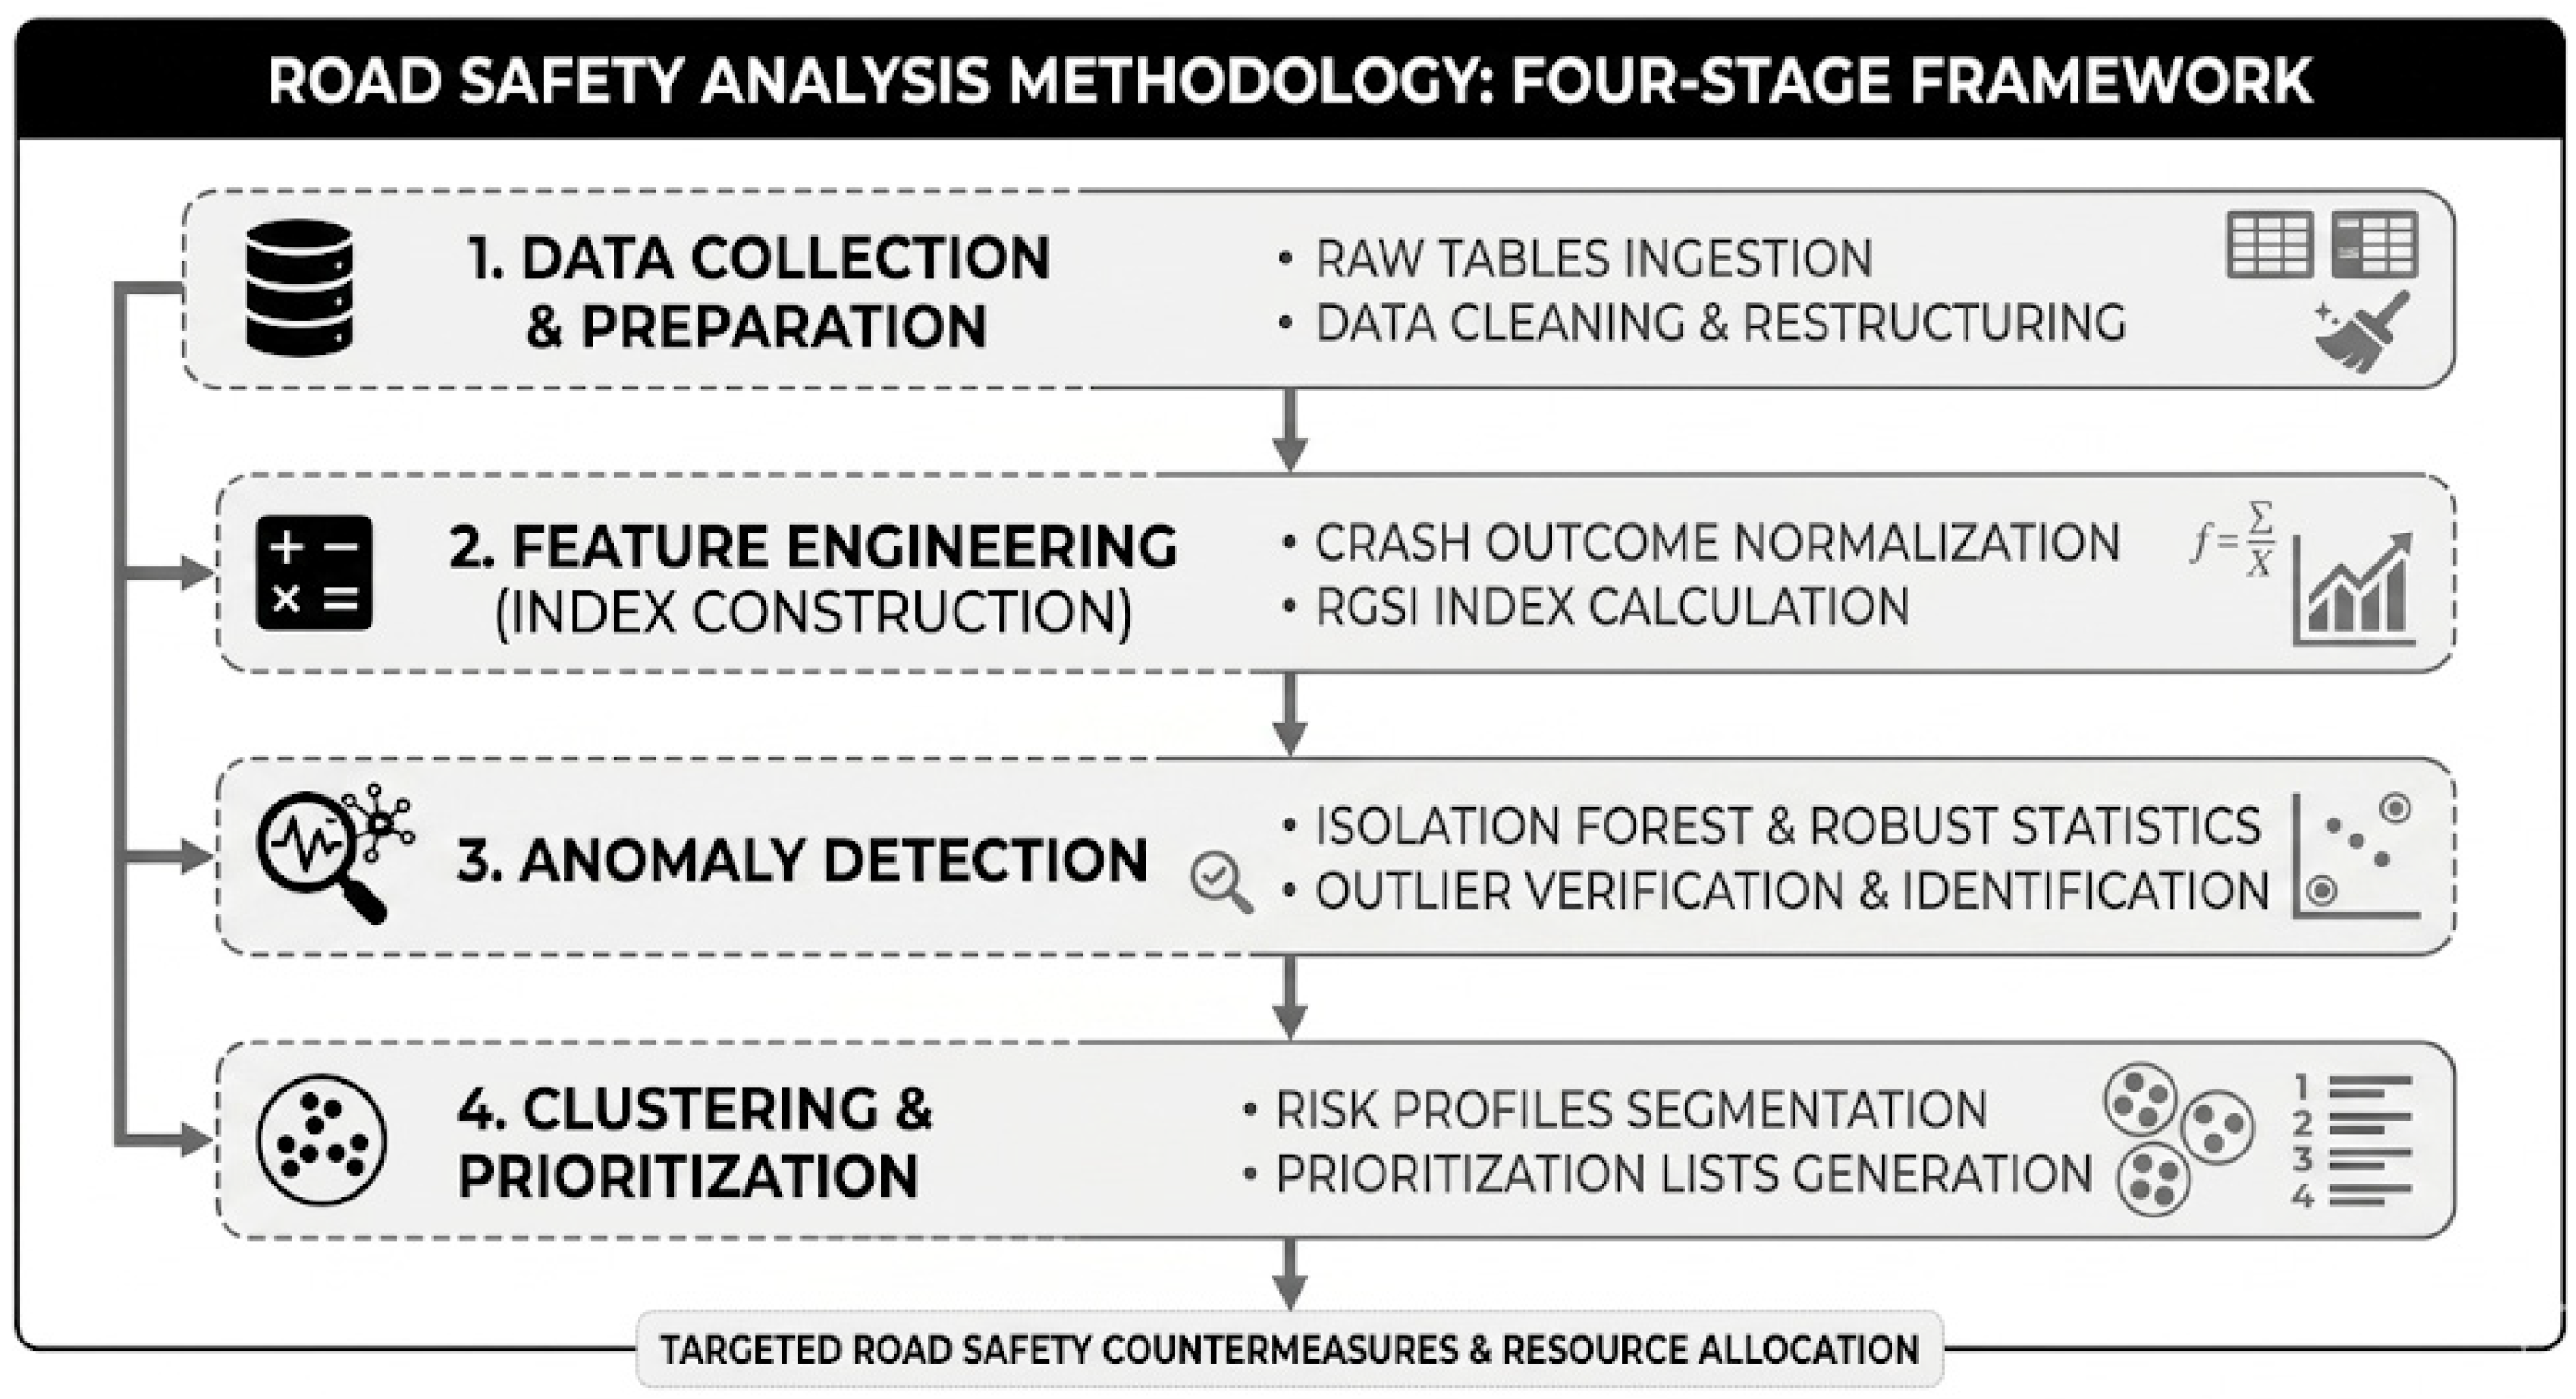
The methodological aim is two-fold: (i) to quantify temporal and structural variation in crash severity across geometry and road-type strata; and (ii) to derive a cell-level prioritization score (RGSI) integrating crash burden, severity, and recent deviations, complemented by unsupervised anomaly detection and clustering. All computational steps are deterministic given the input files, with fixed random seeds for stochastic procedures, and the intermediate analysis tables used to generate the reported results and figures were exported as versioned outputs to enable independent replication. This study is a retrospective, repeated cross-sectional analysis of annually aggregated road-traffic crash outcomes stratified by road type and road-geometry categories over 2015–2024. The overall conceptual flow and operational stages of the proposed experimental framework are systematically presented in Figure 1.
Figure 1.
Methodological flowchart of the proposed four-stage road safety framework.
2.2. Data Sources and Structure
Annual datasets were obtained from the official General Directorate of Highways (KGM) for the years 2015–2024.
Two structured tables were extracted for each year:
- Geometry table (Table 1 in each annual file): counts of crashes, deaths, and injuries disaggregated by road-geometry domains (e.g., horizontal alignment, vertical alignment, junctions, crossings, other) and their categories, further stratified by road type (e.g., motorway, state road, provincial road, connector road) and a “TOTAL” column.
- Driver-fault table (Table 2 in each annual file): counts and percentages of driver-fault categories, stratified by road type and “TOTAL”.
The unit of analysis for geometry-based modeling is a cell defined as:
Cell = (yeart, roadtyper, geometrydomaind, categoryc).
In the present study, the term “roadway geometric context” is used broadly to include horizontal alignment, vertical alignment, junction, crossing, and related roadway-environment categories contained within the administrative database. All inferential and ML components were conducted at this cell level.
2.3. Data Extraction and Preprocessing
Because the annual spreadsheets use multi-row headers and merged cells, raw sheets were imported without predefined headers and transformed into a tidy (long) format through deterministic parsing rules: (i) header rows were reconstructed by forward-filling merged header cells; (ii) measurement columns were generated by combining road-type labels with metric labels; and (iii) section headers (geometry domains) were detected as rows with missing values across all numeric columns and forward-filled to subsequent category rows. All preprocessing operations were executed through a deterministic pipeline to eliminate manual intervention and ensure full reproducibility of the final analytical dataset. Intermediate cleaned datasets, harmonized category mappings, and reconstructed annual tables were version-controlled and exported prior to statistical analysis.
2.4. Text Normalization and Category Harmonization
All string fields were standardized by applying whitespace normalization and canonical label harmonization to ensure consistent category definitions across years. Non-data entries embedded within the table body (e.g., source/footnote rows) were excluded prior to analysis. Geometry categories were analyzed within their respective domains only, and cross-domain aggregation was intentionally avoided because multiple geometry-context classifications may simultaneously apply to the same crash event.
2.5. Handling of “TOTAL” Rows
Two datasets were maintained:
- Detailed dataset: all non-TOTAL category rows (used for cell-level analyses, RGSI, anomaly detection, and clustering).
- TOTAL dataset: TOTAL rows (used for reporting aggregated annual totals when complete).
Geometry-domain categories were not aggregated to reconstruct annual totals because multiple geometry contexts may simultaneously describe the same crash event.
Annual datasets covering the period 2015–2024 were obtained from the official traffic accident statistics database published by the General Directorate of Highways (KGM), Republic of Türkiye. Each year was provided as a separate spreadsheet file containing road-type-specific and geometry-based crash statistics, fatality counts, and injury counts.
These mutually exclusive road-type categories included Motorway, State Road, Provincial Road, Connector Road, and Controlled-Access Highway groups as defined in the administrative tables.
2.6. Outcome Definitions and Derived Severity Metrics
In the present study, severity refers to aggregate crash-conditional casualty severity at the cell level rather than individual crash-level injury severity classification. Accordingly, the proposed severity measures represent aggregated fatalities and injured persons normalized by the number of reported crashes within each analysis cell.
For each cell (t,r,d,c), the following observed counts were extracted:
Two primary severity metrics were derived to summarize crash severity [21]:
Because the administrative datasets report total casualty counts rather than binary crash outcomes, a single crash may involve multiple fatalities and/or multiple injured individuals. Consequently, deaths or injuries per 100 crashes may exceed 100 in high-severity cells. In aggregated roadway-context cells with relatively small crash counts but severe multi-casualty events, injuries per 100 crashes may therefore reach unusually large values.
2.7. Inclusion Threshold for Cell-Level Modeling
To reduce instability from very small denominators, cell-level analyses that depend on severity rates (RGSI, anomaly detection, and clustering) were restricted to cells with:
where the primary specification used K_min = 30 crashes per cell.
K_(t,r,d,c) ≥ K_min,
2.8. RGSI: Road Geometry Severity Index (Cell-Level Prioritization)
The RGSI score was designed as a reproducible prioritization index combining: (i) severity (deaths per 100 crashes), (ii) burden (crash volume), and (iii) deviation from recent historical baseline (trend sensitivity). All transformations and scaling steps were performed strictly within the analysis dataset used to compute RGSI.
2.9. Winsorization for Visualization-Stable Severity Input
Because deaths per 100 crashes can be extreme for some cells even under K_min, we applied percentile-based winsorization and used the winsorized severity measure as the input for RGSI and for visualization in Figure 2D [22]:
where S_(t,r,d,c) denotes deaths per 100 crashes and q_p (S) denotes the empirical p-quantile of S over the RGSI analysis set. Raw (non-winsorized) severity rates were retained for tabular reporting.
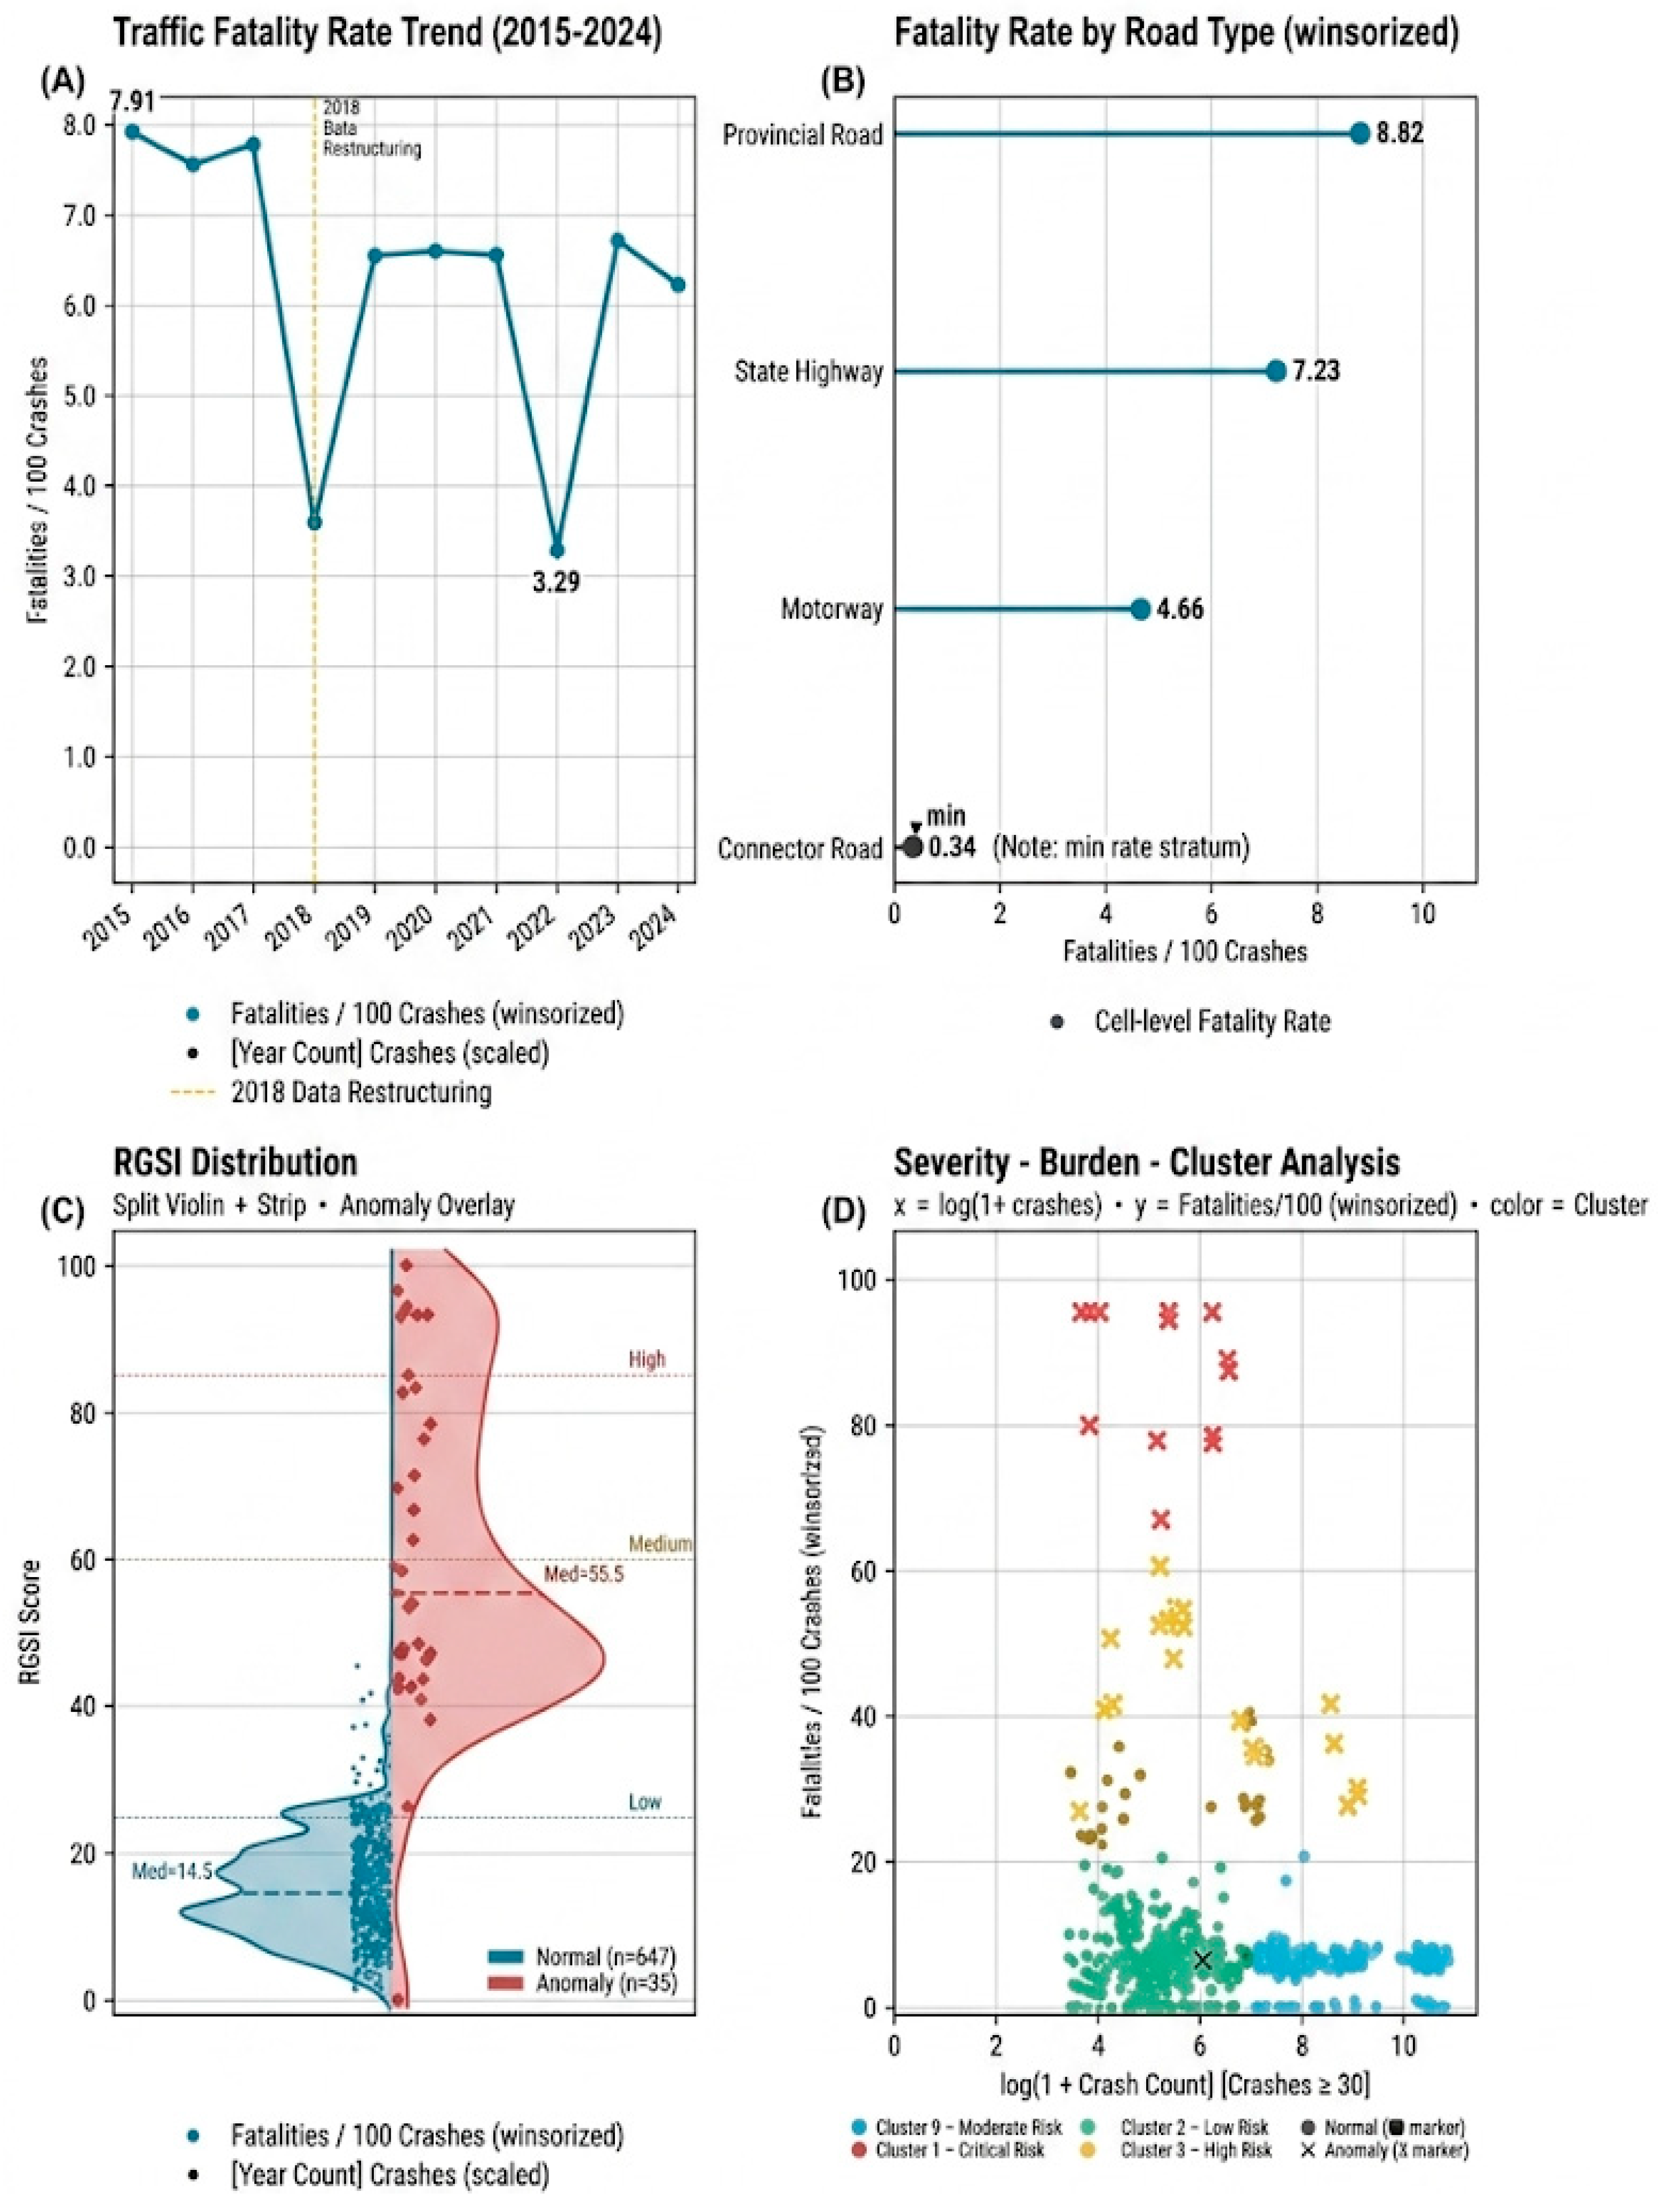
Figure 2.
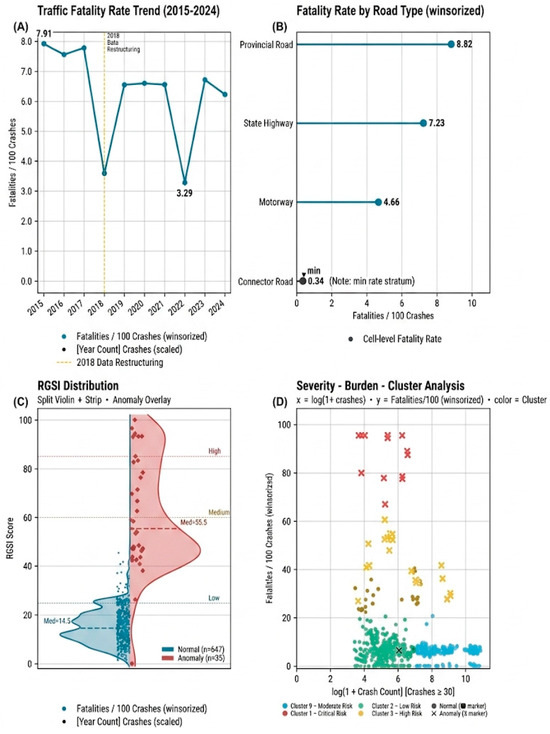
Descriptive outputs: (A) annual crash severity trends; (B) road-type severity comparison; (C) RGSI distribution with anomaly overlay; and (D) burden–severity clustering visualization.
2.10. Burden Transformation
Crash burden was represented using a logarithmic transform:
2.11. Deviation from Recent Baseline
For each fixed stratum (r,d,c), a trailing baseline was computed from the prior three years (excluding the current year):
with a minimum of two prior observations required; otherwise, the deviation term was set to zero. The deviation component was then:
When insufficient historical observations were available for a stable baseline estimation, the deviation component was conservatively set to zero to avoid introducing unstable temporal effects into the RGSI calculation.
2.12. Standardization
Each component was standardized over the RGSI analysis set using z-scores:
where μ_X and σ_X are the mean and standard deviation of X in the analysis set.
2.13. RGSI Construction and Scaling
Conventional road safety indicators based solely on crash frequency or fatality counts may not sufficiently capture the combined influence of severity, crash burden, and temporal instability across heterogeneous geometric contexts.
Accordingly, the RGSI framework was designed as a composite prioritization metric intended to integrate multiple dimensions of infrastructure-related crash severity burden into a unified and interpretable decision-support structure.
The raw RGSI score was defined as a weighted linear combination:
with primary weights (w_S, w_B, w_Δ) = (0.5, 0.3, 0.2). The final RGSI was linearly rescaled to a [0, 100] range:
The primary weighting structure was intentionally designed to emphasize crash severity while still incorporating crash burden and temporal deviation components. Greater weight was assigned to severity because the framework aims to prioritize high-consequence infrastructure contexts for safety intervention. These weights should therefore be interpreted as a pragmatic prioritization configuration rather than a universally optimal weighting scheme.
2.14. Unsupervised Anomaly Detection
Two complementary anomaly definitions were used to address common reviewer concerns regarding robustness and method dependence.
2.15. ML Anomaly Detection (Isolation Forest)
An Isolation Forest model was fitted to the feature vector using the scikit-learn (v1.8.0) library in Python with n_estimators = 300, contamination = 0.05, and random_state = 42 [23]:
Cells predicted as outliers were flagged as ML anomalies:
The model decision score was retained as a continuous anomaly score to enable ranked sensitivity checks.
2.16. Robust Statistical Anomaly Rule (Sensitivity/Verification)
A robust z-score was computed via the median absolute deviation (MAD) for (i) S^((w)) and (ii) Δ [22]:
Cells were flagged as robust anomalies if:
This second definition was reported to demonstrate that ML-flagged anomalies were not artifacts of a single algorithmic choice.
2.17. Clustering (Severity-Profile Segmentation)
To segment cells into distinct burden–severity profiles, K-means clustering was applied to standardized features:
where scale indicates standardization to zero mean and unit variance. The primary specification used K = 4 clusters with n_init = 20 and random seed fixed at 42. Cluster profiles were summarized using cluster-level means of crashes, severity metrics, mean RGSI, and anomaly rates.
2.18. Descriptive Outputs and Figure Construction
All primary descriptive tables were generated deterministically from the analysis dataset: (i) annual totals and severity (Figure 2A), (ii) road-type severity comparisons (Figure 2B), (iii) RGSI distribution with anomaly overlay (Figure 2C), and (iv) severity–burden scatter with cluster and anomaly encoding (Figure 2D). For Figure 2D, the y-axis uses the winsorized severity input S^((w)) defined in Equation (3) to preserve readability; raw severity values remain available in the exported tables and were used for tabular reporting.
2.19. Sensitivity Analyses
To address expected reviewer critiques regarding thresholding, algorithmic assumptions, and parameter dependence, the following sensitivity analyses were prespecified:
- 1.
- Minimum crash threshold: repeat RGSI/anomaly/clustering using K_min∈{20,50,100} and compare stability of top-ranked RGSI cells.
- 2.
- Winsorization range: repeat using (q0.02, q0.98) and no winsorization, reporting the effect on Figure 2D readability and RGSI ranking stability.
- 3.
- Isolation Forest contamination: repeat ML anomaly detection with γ∈{0.02,0.05,0.10} and report overlap with the robust anomaly rule.
- 4.
- Clustering choice: repeat clustering for K∈{3,4,5}; report cluster-profile robustness and reassignment stability of RGSI top decile cells.
- 5.
- Annual totals completeness: confirm that annual crash totals derived from summing road types (excluding TOTAL) match TOTAL columns for years where TOTAL is complete, and document exceptions (notably 2018 and 2022).
All sensitivity analyses used identical preprocessing and inclusion rules, differing only in the specified parameter under evaluation.
Particular attention was given to the stability of top-ranked RGSI cells across alternative parameter specifications to evaluate the robustness of the prioritization framework.
Overall, the sensitivity analyses suggested that the highest-priority RGSI cells remained broadly stable across alternative parameter specifications, indicating that the overall prioritization structure was not driven by a single modeling assumption or parameter choice. Although minor variations in ranking order and anomaly counts were observed, the dominant high-priority geometry contexts were consistently preserved across all tested configurations.
2.20. Reproducibility and Software
All preprocessing, metric computation, RGSI scoring, anomaly detection, and clustering were implemented in a fully reproducible pipeline. The computational environment used Python 3.14.3 and the following key libraries: pandas 3.0.1, NumPy 2.4.3, scikit-learn 1.8.0, Matplotlib 3.10.8, and seaborn 0.13.2.
All random seeds were fixed to ensure computational reproducibility, and identical preprocessing rules were applied across all annual files. The complete analytical workflow was designed to produce deterministic outputs from the raw source spreadsheets.
2.21. Data Quality and Consistency Controls
To ensure consistency across years, all annual datasets were subjected to harmonization and validation procedures, including category reconciliation, duplicate control, header reconstruction, and verification of annual totals against detail-level strata. Missing or incomplete TOTAL fields were reconstructed from disaggregated road-type counts using identical aggregation rules across all years.
3. Results and Discussion
3.1. Data Coverage and Structure
The dataset covered 2015–2024 (10 annual files). For the road-geometry module, the data included 6 road-type columns, 5 geometry domains, and 39 geometry categories after excluding “TOTAL” rows. The driver-fault module comprised 21 fault categories (Table 1).
Table 1.
Data coverage.
3.2. Temporal Pattern of Crash Severity
Across 2015–2017, deaths per 100 crashes were 7.91, 7.56, and 7.78, respectively. In 2018, total crashes were 514,640, deaths 18,520, and injuries 547,115, corresponding to 3.60 deaths per 100 crashes and 106.31 injuries per 100 crashes. In 2019–2021, deaths per 100 crashes ranged between 6.55 and 6.60, while in 2023 it was 6.71 and in 2024 it was 6.22. In 2022, total crashes were 428,200, deaths 14,075, and injuries 410,705, corresponding to 3.29 deaths per 100 crashes and 95.91 injuries per 100 crashes (Table 2; Figure 2A). The marked shifts observed in 2018 and 2022 should be interpreted cautiously, as these years also corresponded to incomplete TOTAL crash fields in the original administrative datasets, requiring reconstruction from detailed road-type strata. The reconstruction procedure used mutually exclusive road-type totals only and did not aggregate geometry-domain rows. Accordingly, the observed reductions in deaths per 100 crashes during 2018 and 2022 may partially reflect administrative completeness limitations rather than genuine temporal declines in crash severity.
Table 2.
Annual totals and severity.
3.3. Differences by Road Type (2015–2024 Aggregated)
When aggregating across 2015–2024, deaths per 100 crashes varied substantially by road type. Provincial roads reported 297,780 crashes and 26,250 deaths (8.82 deaths per 100 crashes). State roads reported 1,707,135 crashes and 123,505 deaths (7.23 deaths per 100 crashes). Motorways reported 406,100 crashes and 18,940 deaths (4.66 deaths per 100 crashes). Connector roads reported 474,465 crashes and 1630 deaths (0.34 deaths per 100 crashes) (Table 3; Figure 2B).
Table 3.
Road-type totals (2015–2024 aggregated).
3.4. Highest-Severity Geometry–Road Combinations (Crash Count ≥ 30)
These severity indicators should be interpreted as casualty-based rates normalized by crash counts rather than probabilities bounded by 100%. Extremely large injury-per-crash values observed in certain cells are attributable to the aggregated casualty structure of the administrative database rather than duplicated crash records or preprocessing inconsistencies.
Under the inclusion criterion of ≥30 crashes per cell, the highest values of deaths per 100 crashes were predominantly observed on provincial roads (Table 4). For example, in 2018, the combination of Provincial Road Horizontal Alignment and Dangerous Curve recorded 44 crashes and 126 deaths, yielding 286.36 deaths per 100 crashes (Table 4). The same category road combination yielded 176.79 deaths per 100 crashes in 2023 and 138.18 deaths per 100 crashes in 2024 (Table 4). In 2018, Provincial Road Junction No Junction recorded 511 crashes and 542 deaths (106.07 deaths per 100 crashes) (Table 4).
Table 4.
Top 10 highest-severity cells (crashes ≥ 30).
3.5. Composite-Index Prioritization and Unsupervised Anomaly Screening
A cell-level prioritization score (Road Geometry Severity Index; RGSI) was computed for each Year × Road Type × Geometry Domain × Category cell as a composite of crash burden, severity, and deviation from the prior three-year reference level. The highest RGSI values clustered on provincial roads and specific geometric contexts (Table 5; Figure 2C,D). The top-ranked cell was 2018–Provincial Road Junction No Junction (RGSI = 100.0) with 106.07 deaths per 100 crashes (Table 5). Other high-priority cells included 2018–Provincial Road–Vertical Alignment–Inclined (94.42 deaths per 100 crashes; RGSI = 96.61) and 2018–Provincial Road–Other–None (88.92 deaths per 100 crashes; RGSI = 94.45) (Table 5).
Table 5.
ML prioritization (RGSI): Top 10 cells.
Anomaly detection was evaluated using two approaches: (i) Isolation Forest (ML) and (ii) a robust z-score rule. Under the predefined contamination specification (γ = 0.05), corresponding to approximately 5% expected anomalies, the Isolation Forest model flagged 35 cells as anomalous. All 35 of these model-flagged cells were also identified by the robust anomaly rule.
Clustering (K = 4) separated cells into distinct burden–severity profiles. The cluster with the highest mean RGSI (Cluster 1; n = 15) had a mean deaths-per-100-crashes of 113.75 and an anomaly rate of 1.00. A higher-burden cluster (Cluster 3; n = 41) had a mean crash count of 1391.15 and an anomaly rate of 0.463, while the largest clusters had near-zero anomaly rates (Cluster 0: 0.00; Cluster 2: 0.003) (cluster profile; Figure 2D).
Using a decade of annually aggregated crash statistics stratified by road type and road-geometry categories, this study produced three complementary outputs: (i) descriptive severity patterns across years and road types (Table 2 and Table 3), (ii) a cell-level prioritization score (RGSI) integrating burden, severity, and short-term deviations (Table 5), and (iii) unsupervised pattern discovery via anomaly detection and clustering to support severity profiling. The prioritization results consistently concentrated among specific geometry contexts (e.g., dangerous curves, junction-related contexts, and crossing-related contexts) and primarily within provincial-road strata (Table 4 and Table 5), aligning with broader evidence that infrastructure context and rural/interurban operating conditions can materially shape crash severity [24,25,26,27].
3.6. Road-Type Differences and Why Provincial-Road Strata Dominate High-Severity Cells
The higher deaths-per-100-crashes observed on provincial roads relative to motorways and connector roads (Table 3) are directionally consistent with prior work showing that rural/interurban settings often experience higher fatality burden conditional on a crash due to higher operating speeds, delayed trauma care, and a larger share of single-vehicle roadway-departure events [25,26,28]. In particular, rural single-vehicle crash severity has been repeatedly linked to roadside hazards, limited forgiving infrastructure, and speed-related mechanisms that increase the probability that a crash, once it occurs, becomes fatal or disabling.
Within the Türkiye context, prior research documents substantial spatial heterogeneity in road mortality across provinces and emphasizes that risk indicators can change materially depending on whether exposure denominators (e.g., vehicle kilometers traveled, road length) are available and used [29,30]. This matters for interpretation: our study’s principal severity metric is normalized by crash counts (deaths per 100 crashes), not exposure, and therefore reflects “severity conditional on a crash” rather than population- or exposure-based risk. The observed concentration of high-severity and high-priority cells within provincial-road strata (Table 4 and Table 5) thus provides actionable triage for infrastructure-focused countermeasures while motivating future work that incorporates exposure denominators where feasible [29,31].
3.7. Horizontal Alignment and “Dangerous Curve” Cells as Recurrent High-Priority Contexts
Among geometry categories, dangerous curves repeatedly appeared among the highest-severity and highest-priority cells (Table 4 and Table 5), consistent with a large body of roadway-safety literature on horizontal curvature. Empirical modeling studies and curve-focused safety performance analyses indicate that curves can exhibit elevated crash occurrence and/or higher injury severity relative to comparable tangents and that curve-related severity patterns are sensitive to geometry, operating speed, and interactions with nearby roadway features [27,28]. Recent work further emphasizes that robust curve severity assessment benefits from explicitly modeling curve context (e.g., adjacency to intersections or other curves), which is conceptually aligned with our cell-based approach that treats geometry as a categorical context rather than a single continuous covariate [27].
Methodologically, the curve literature also highlights a key policy implication: because curves are spatially localizable and treatment options are well-defined (e.g., delineation, friction, superelevation correction, and speed management), prioritization tools that identify which curve contexts dominate severe outcomes can support cost-effective intervention planning [32,33]. In this sense, the repeated emergence of curve-related cells in Table 4 and Table 5 can be interpreted as convergent evidence that horizontal alignment remains a high-leverage infrastructure domain for reducing severe outcomes when paired with targeted, context-appropriate countermeasures [32,34].
3.8. Junction-Related Contexts and the Role of Intersection Design
High-priority cells also included junction contexts (e.g., “no junction” and other junction categories) (Table 4 and Table 5). This aligns with extensive evidence that intersection design shapes conflict patterns, speeds, and crash type distributions—mechanisms that strongly influence injury severity. The roundabout literature is particularly illustrative: a meta-analysis found substantial reductions in fatalities and injuries when conventional intersections are converted to roundabouts, and U.S. evaluations using Empirical Bayes designs similarly report large reductions in injuries after conversion [9,10]. Additional before–after evidence focused on signalized-to-roundabout conversions also supports injury reductions, reinforcing the principle that geometric reconfiguration at conflict points can yield meaningful safety gains [35].
While our dataset is aggregated and does not permit causal attribution to specific intersection treatments, the junction-related concentration among high-RGSI cells (Table 5) is consistent with the broader intersection-safety evidence base and suggests that geometry-aware screening should include junction contexts alongside curve contexts in infrastructure prioritization programs.
3.9. Why Unsupervised ML (Rather than Supervised Prediction) Is a Defensible Choice Here
A growing body of crash-severity literature applies supervised ML to individual crash records and reports predictive performance under diverse modeling and evaluation choices [15,36]. However, prediction-model research increasingly faces scrutiny regarding transparency, reporting completeness, and suitability of metrics issues now formalized in updated reporting guidance (e.g., TRIPOD + AI for prediction models) [36,37]. In an annually aggregated, cell-level dataset such as ours, a supervised prediction framing is less natural because (i) validated individual-level labels and covariate sets are not available, (ii) exposure denominators are not embedded in the cell definitions, and (iii) the primary decision question is prioritization rather than individual crash classification.
In contrast, unsupervised components in this study (Isolation Forest anomaly detection and K-means clustering) are well-aligned with pattern discovery and triage. Isolation Forest is explicitly designed for unsupervised outlier detection via random partitioning, making it suitable for flagging unusual burden–severity combinations without requiring labels [24]. K-means provides an interpretable segmentation of cells into burden severity profiles that can be communicated as “severity typologies” for operational planning [38]. This combined strategy prioritization (RGSI) and anomaly flagging and cluster profiling, therefore, support actionable decision-making while remaining methodologically coherent with the data granularity and the study’s Safe System–consistent emphasis on infrastructure contexts rather than individual blame [39,40].
3.10. Robustness of Anomaly Signals and Why a Dual Definition Helps
A common critique of ML anomaly detection is algorithm dependence. To address this, we paired Isolation Forest with a robust, MAD-based z-score rule (Methods), drawing on established robust statistics foundations [24,41]. The use of the modified z-score constant (0.6745) and a 3.5-type threshold is widely discussed in applied outlier detection guidance, and recent peer-reviewed methodological work continues to note 3.5 as a commonly used reference threshold when leveraging MAD-based rules [41,42]. The empirical patterns in our results carry methodological significance. The Isolation Forest outliers also satisfying the MAD-based anomaly criterion support the interpretation that the highest-priority roadway contexts identified through the proposed framework may represent structurally important high-severity patterns that conventional average-based screening approaches may overlook.
3.11. Interpretation of RGSI as a Prioritization Tool (and Why Winsorization Is Appropriate for Visualization)
RGSI was deliberately framed as a prioritization index rather than a causal effect estimator. Unlike conventional crash severity models that classify individual crash outcomes, the RGSI framework operates at an aggregated infrastructure-context level to prioritize crash-conditional severity burden across geometric strata. From a methodological perspective, the RGSI framework aligns with the broader trend toward customized evaluation metrics in complex analytical systems where conventional averaged indicators may overlook structurally important high-severity patterns. This design is aligned with an applied road-safety practice reality: agencies often need ranked lists for targeted engineering review and countermeasure selection, even when high-resolution exposure data or causal identification is unavailable [29,32]. The winsorization step (used for RGSI inputs and Figure 2D visualization while retaining raw rates for tabular reporting) follows standard logic in robust index construction: limiting the influence of extreme values can stabilize rankings and improve interpretability without suppressing the existence of extremes in the reported results [22]. In this sense, the combination of (i) raw-rate transparency in tables and (ii) robust visualization for pattern comprehension provides a pragmatic compromise that aligns with best practices in robust composite indicator construction. Accordingly, the RGSI outputs should be interpreted primarily as infrastructure-screening and prioritization indicators rather than as direct causal evidence regarding where interventions will necessarily produce the largest safety benefits. Beyond technical prioritization, the RGSI framework may also contribute to sustainability-oriented infrastructure management by supporting evidence-based allocation of limited engineering resources toward structurally high-severity roadway contexts.
3.12. Türkiye-Specific Context and Data-Coverage Considerations
Türkiye’s road-safety literature underscores both the substantial burden of road traffic injuries and the importance of analytic frameworks that can be implemented with available administrative data [31,43]. Prior Türkiye-focused studies have used disaggregated crash records to model injury severity and identify contributing factors, indicating that risk determinants can vary by context and that structured modeling adds policy-relevant value [42]. At the same time, Türkiye data coverage can be influenced by the institutional division of crash recording responsibilities, which can introduce completeness issues depending on whether police-only records or combined systems are analyzed [18,44]. This reinforces the value of transparent preprocessing and explicit documentation of data provenance, as well as the importance of treating year-to-year comparisons cautiously when administrative processes or coverage may change [18,31].
4. Conclusions
This study presents a systematic evaluation of road-traffic crash outcomes across various road-geometry and road-type strata in Türkiye from 2015 to 2024. By transitioning from traditional macro-level frequency reporting to a micro-level, data-driven approach, we developed and applied a comprehensive evaluation framework that integrates the Road Geometry Severity Index (RGSI) with unsupervised machine learning and anomaly detection techniques. The empirical results indicate that traffic fatality and injury outcomes vary substantially across different roadway geometric contexts, with particular vulnerability observed in provincial and secondary road networks where geometric consistency may vary. Thus, this methodology offers a systemic approach to managing road safety by converting massive, multi-year statistical accident datasets into highly local, geometry-specific prioritizing strategies.
From a practical standpoint, the contributions of this study provide actionable insights for highway agencies and road safety practitioners. By identifying systemic anomaly patterns across specific geometric strata, this framework moves beyond traditional, reactive hot-spot analysis. It allows authorities to deploy targeted engineering countermeasures and optimize resource allocation directly where structural road design (such as horizontal curvature bounds or complex junction contexts) amplifies crash injury severity. However, certain practical limitations must be acknowledged. First, the empirical findings are bounded by the granularity of the historical accident records (2015–2024), which may contain inherent underreporting variations across different regional administrative classes. Second, while the study establishes a robust Road Geometry Severity Index (RGSI), it focuses primarily on static geometric and administrative strata, without integrating real-time environmental factors or microscopic behavioral dynamics like instantaneous vehicle speeds.
Looking toward future prospects, these limitations map out clear avenues for subsequent research. The future framework aims to incorporate micro-level traffic flow data and weather anomalies into the unsupervised machine learning pipeline to establish dynamic, proactive safety-condition forecasting models. Furthermore, scaling this methodology into predictive infrastructure asset management software will facilitate real-time safety audits, allowing planners to mitigate high-severity patterns during the geometric design phase before conflicts materialize on the field. Therefore, the proposed framework should be viewed as a decision-support and screening tool intended to guide further engineering assessment rather than as a standalone causal prioritization mechanism. Overall, the proposed framework contributes to sustainability-oriented transportation engineering by integrating infrastructure safety prioritization, proactive safety assessment, and data-driven decision support within a resilient mobility perspective.
Author Contributions
H.B.T.: Conceptualization; Methodology; Data curation; Formal analysis; Visualization; Writing—original draft; Writing—review & editing. F.Y.: Conceptualization; Methodology; Writing—review and editing; Supervision. All authors have read and agreed to the published version of the manuscript.
Funding
This research received no external funding.
Institutional Review Board Statement
Not applicable.
Informed Consent Statement
Not applicable.
Data Availability Statement
The original contributions presented in this study are included in the article. Further inquiries can be directed to the corresponding author.
Conflicts of Interest
The authors declare no conflicts of interest.
References
- WHO. Road Traffic Injuries. Available online: https://www.who.int/news-room/fact-sheets/detail/road-traffic-injuries (accessed on 16 March 2026).
- WHO. Global Status Report on Road Safety, 1st ed.; World Health Organization: Geneva, Switzerland, 2023. [Google Scholar]
- Song, Z.; Zhang, B.; Pang, S.; Qiu, M.; Huang, J.; Hao, J.; Yang, X.; Li, Y. Trends in the burden of road traffic injuries among children and adolescents aged 0–19 years in low-and middle-income countries, 1990–2023. J. Glob. Health 2026, 16, 04094. [Google Scholar] [CrossRef] [Scilit]
- Presidency of the Republic of Türkiye. Road Traffic Safety Strategy (2021–2030) and Road Traffic Safety Action Plan (2021–2023); Official Gazette: Ankara, Türkiye, 2021.
- TUİK; Republic of Turkey Ministry of Interior. Road Traffic Accident Statistics-2024-Data Portal-TURKSTAT. Available online: https://veriportali.tuik.gov.tr/en/press/54056/metadata (accessed on 16 March 2026).
- Federal Highway Administration [FHWA]. Horizontal Curve Safety. Available online: https://highways.dot.gov/safety/rwd/keep-vehicles-road/horizontal-curve-safety (accessed on 16 March 2026).
- Chen, Y.; Wang, C.; Xie, Y. Modeling the risk of single-vehicle run-off-road crashes on horizontal curves using connected vehicle data. Anal. Methods Accid. Res. 2024, 43, 100333. [Google Scholar] [CrossRef] [Scilit]
- Awasthi, D.; Parti, R.; Mahajan, K. Effect of spatial relationship between curves on crash severity at horizontal curves in a mountainous terrain. Accid. Anal. Prev. 2024, 206, 107714. [Google Scholar] [CrossRef] [Scilit] [PubMed]
- Donnell, E.T.; Porter, R.J.; Li, L.; Hamilton, I.; Himes, S.; Wood, J. Reducing Roadway Departure Crashes at Horizontal Curve Sections on Two-Lane Rural Highways. Safety Evaluation FHWA-SA-19-005. 2019. Available online: https://rosap.ntl.bts.gov/view/dot/55604 (accessed on 16 March 2026).
- Elvik, R. Road safety effects of roundabouts: A meta-analysis. Accid. Anal. Prev. 2017, 99, 364–371. [Google Scholar] [CrossRef] [Scilit]
- Retting, R.A.; Persaud, B.N.; Garder, P.E.; Lord, D. Crash and injury reduction following installation of roundabouts in the United States. Am. J. Public Health 2001, 91, 628–631. [Google Scholar]
- Gkyrtis, K.; Pomoni, M. Use of historical road incident data for the assessment of road redesign potential. Designs 2024, 8, 88. [Google Scholar] [CrossRef] [Scilit]
- Nadimi, N.; Fathipour, H.; Sheykhfard, A. Assessing safety in horizontal curves using surrogate safety measures and machine learning. Sci. Rep. 2025, 15, 12384. [Google Scholar] [CrossRef] [Scilit] [PubMed]
- Safari, M.; Effati, M.; Arabani, M. Spatial analysis of daytime and nighttime crash severity on horizontal curves of mountainous rural highways: A case study in Northern Iran. Results Eng. 2024, 24, 103344. [Google Scholar] [CrossRef] [Scilit]
- Kotsyubynska, Y.; Kozan, N.; Chadiuk, V.; Kostyshyn, A.; Kotsyubynsky, A.; Fentsyk, V. Machine Learning and Deep Learning for Predicting Traffic Crash Injury Severity: A Systematic Review and Meta-Analysis (2014–2025). J. Road Saf. 2026, 37, 46–60. [Google Scholar] [CrossRef] [Scilit]
- Khosravi, Y.; Hosseinali, F.; Adresi, M. Identifying accident prone areas and factors influencing the severity of crashes using machine learning and spatial analyses. Sci. Rep. 2024, 14, 29836. [Google Scholar] [CrossRef] [Scilit] [PubMed]
- Kumar, A.; Melempat Kalapurayil, H.K. Modeling Crash Severity and Collision Types Using Machine Learning. 2022. Available online: https://repository.lsu.edu/transet_pubs/13 (accessed on 16 March 2026).
- Kuyumcu, Z.C.; Aslan, H.; Yurtay, N. Casualty Analysis of the Drivers in Traffic Accidents in Turkey: A CHAID Decision Tree Model. Appl. Sci. 2024, 14, 11693. [Google Scholar] [CrossRef] [Scilit]
- Wang, Z.; Matsuhasi, R. Low-energy miniature wearable air-conditioner with direct cold-air delivery: A novel water- electricity hybrid energy system. Build. Environ. 2026, 297, 114590. [Google Scholar] [CrossRef] [Scilit]
- Ozen, M.; Karabulut, N.C. Epidemiologic analysis of pedestrian crashes in Türkiye, East. Mediterr. Health J. 2025, 31, 688–697. [Google Scholar] [CrossRef] [Scilit]
- International Transport Forum. Road Safety Annual Report 2015. In Road Safety Annual Report; OECD: Paris, France, 2015. [Google Scholar] [CrossRef] [Scilit]
- Boudt, K.; Todorov, V.; Wang, W. Robust Distribution-Based Winsorization in Composite Indicators Construction. Soc. Indic. Res. 2020, 149, 375–397. [Google Scholar] [CrossRef] [Scilit]
- Liu, F.T.; Ting, K.M.; Zhou, Z.-H. Isolation Forest. In Proceedings of the Eighth IEEE International Conference on Data Mining, Pisa, Italy, 15–19 December 2008; IEEE: Piscataway, NJ, USA, 2008; pp. 413–422. [Google Scholar] [CrossRef] [Scilit]
- Huber, P.J.; Ronchetti, E.M. Robust Statistics. In Wiley Series in Probability and Statistics, 1st ed.; Wiley: Hoboken, NJ, USA, 2009. [Google Scholar] [CrossRef] [Scilit]
- Xie, Y.; Zhao, K.; Huynh, N. Analysis of driver injury severity in rural single-vehicle crashes. Accid. Anal. Prev. 2012, 47, 36–44. [Google Scholar] [CrossRef] [Scilit]
- Zwerling, C.; Peek-Asa, C.; Whitten, P.S.; Choi, S.-W.; Sprince, N.L.; Jones, M.P. Fatal motor vehicle crashes in rural and urban areas: Decomposing rates into contributing factors. Inj. Prev. 2005, 11, 24–28. [Google Scholar] [CrossRef] [Scilit]
- Bejleri, I.; Xu, X.; Silva, K.R.; Srinivasan, S. Safety performance analysis of horizontal curves in urban areas. Accid. Anal. Prev. 2024, 195, 107402. [Google Scholar] [CrossRef] [Scilit] [PubMed]
- Rangaswamy, R.; Alnawmasi, N.; Zhang, Y. Analysis of injury severity of work zone crashes on rural and urban work zones: Accounting for out-of-sample prediction and temporal instability. Accid. Anal. Prev. 2024, 203, 107641. [Google Scholar] [CrossRef] [Scilit]
- Erdogan, S. Explorative spatial analysis of traffic accident statistics and road mortality among the provinces of Turkey. J. Saf. Res. 2009, 40, 341–351. [Google Scholar] [CrossRef] [Scilit] [PubMed]
- Tortum, A.; Atalay, A. Spatial analysis of road mortality rates in Turkey. Proc. Inst. Civ. Eng.-Transp. 2015, 168, 532–542. [Google Scholar] [CrossRef] [Scilit]
- Puvanachandra, P.; Hoe, C.; Ozkan, T.; Lajunen, T. Burden of road traffic injuries in Turkey. Traffic Inj. Prev. 2012, 13, 64–75. [Google Scholar] [CrossRef] [Scilit]
- Yang, Z.; Yu, P.; Shah, R.; Knezevich, R.; Tsai, Y.-C. Crash Prediction on Horizontal Curves: Review and Model Performance Comparison. Transp. Res. Rec. J. Transp. Res. Board 2024, 2678, 416–430. [Google Scholar] [CrossRef] [Scilit]
- Kronprasert, N.; Boontan, K.; Kanha, P. Crash Prediction Models for Horizontal Curve Segments on Two-Lane Rural Roads in Thailand. Sustainability 2021, 13, 9011. [Google Scholar] [CrossRef] [Scilit]
- Gooch, J.P.; Gayah, V.V.; Donnell, E.T. Safety performance functions for horizontal curves and tangents on two lane, two way rural roads. Accid. Anal. Prev. 2018, 120, 28–37. [Google Scholar] [CrossRef] [Scilit] [PubMed]
- Gross, F.; Lyon, F.; Persaud, B.; Srinivasan, B. Safety effectiveness of converting signalized intersections to roundabouts. Accid. Anal. Prev. 2013, 50, 234–241. [Google Scholar] [CrossRef] [Scilit] [PubMed]
- Chakraborty, M.; Gates, T.J.; Sinha, S. Causal Analysis and Classification of Traffic Crash Injury Severity Using Machine Learning Algorithms. Data Sci. Transp. 2023, 5, 12. [Google Scholar] [CrossRef] [Scilit]
- Collins, G.S.; Moons, K.G.; Dhiman, P.; Riley, R.D.; Beam, A.L.; Van Calster, B.; Ghassemi, M.; Liu, X.; Reitsma, J.B.; van Smeden, M.; et al. TRIPOD+ AI statement: Updated guidance for reporting clinical prediction models that use regression or machine learning methods. BMJ 2024, 385, e078378. [Google Scholar] [CrossRef] [Scilit]
- MacQueen, J. Some Methods for Classification and Analysis of Multivariate Observations. In Proceedings of the Fifth Berkeley Symposium on Mathematical Statistics and Probability; University of California Press: Berkeley, CA, USA, 1967; pp. 281–297. [Google Scholar]
- Khan, M.N.; Das, S. Advancing traffic safety through the safe system approach: A systematic review. Accid. Anal. Prev. 2024, 199, 107518. [Google Scholar] [CrossRef] [Scilit] [PubMed]
- Kim, E.; Muennig, P.; Rosen, Z. Vision zero: A toolkit for road safety in the modern era. Inj. Epidemiol. 2017, 4, 1. [Google Scholar] [CrossRef] [Scilit]
- Iglewicz, B.; Hoaglin, D.C. How to detect and handle outliers. In ASQC Basic References in Quality Control; ASQC Quality Press: Milwaukee, WI, USA, 1993; Volume 16. [Google Scholar]
- Berendrecht, W.; Vliet, M.v.; Griffioen, J. Combining statistical methods for detecting potential outliers in groundwater quality time series. Environ. Monit. Assess. 2022, 195, 85. [Google Scholar] [CrossRef] [Scilit]
- Çelik, A.K.; Oktay, E. A multinomial logit analysis of risk factors influencing road traffic injury severities in the Erzurum and Kars Provinces of Turkey. Accid. Anal. Prev. 2014, 72, 66–77. [Google Scholar] [CrossRef] [Scilit] [PubMed]
- Kuyumcu, Z.Ç.; Aslan, H.; Yurtay, N. Identifying Interrelated Factors of Fatal and Injury Traffic Accidents Using Association Rules. Turk. J. Civ. Eng. 2023, 34, 55–80. [Google Scholar] [CrossRef] [Scilit]

Disclaimer/Publisher’s Note: The statements, opinions and data contained in all publications are solely those of the individual author(s) and contributor(s) and not of MDPI and/or the editor(s). MDPI and/or the editor(s) disclaim responsibility for any injury to people or property resulting from any ideas, methods, instructions or products referred to in the content. |
© 2026 by the authors. Licensee MDPI, Basel, Switzerland. This article is an open access article distributed under the terms and conditions of the Creative Commons Attribution (CC BY) license.