


Abstract
Rapid urban expansion in Riyadh has intensified spatial disparities in access to higher education services. However, empirical studies that comprehensively evaluate university accessibility using GIS-based network analysis integrating both travel time and distance remain limited, highlighting a critical research gap in spatially equitable higher education planning. This study examines the spatial distribution and accessibility efficiency of universities in Riyadh City using GIS-based network analysis, integrating both travel time and network distance metrics. The method of this research uses service area analysis and Origin-Destination (OD) cost matrix techniques to quantify both ways, travel time and distance from residential areas to the nearest universities in terms of actual road network conditions. The spatial analysis stage was set and performed by combining datasets from the Riyadh Municipality and the Ministry of Education and by processing in ArcGIS Pro using topologically corrected road networks. The results showed that there were considerable spatial disparities in accessibility; the central sectors had very high accessibility (within 0–10 min or <10 km), whereas the outer sectors had very limited accessibility (>20 min or >20 km). The analysis reveals that approximately 46% of Riyadh’s residential population resides in areas characterized by low or very low accessibility to universities, highlighting substantial spatial inequities in higher education provision. The comparison between time-based and distance-based service areas unveiled the great effect that travel time efficiency has on accessibility efficiency. Thus, the combined accessibility evaluation figured out the areas where people were deprived of services and hence, the need for strategic intervention in those areas. The results highlight the importance of spatially equitable educational planning and offer a set of evidence-based recommendations for the optimal locations of future universities to increase accessibility, facilitate balanced urban development, and create equal opportunities for higher education throughout the sprawling metropolitan area of Riyadh. This paper adds to the body of literature that employs GIS to analyze accessibility to educational facilities in rapidly urbanizing contexts.
1. Introduction
The spatial distribution of urban public services like institutions of higher education has a vital impact on the provision of equitable access, social mobility, and sustainable urban development. Recent studies reveal a resurgence of universities as foundational factors for human capital development and economic growth, especially in fast-growing countries [1,2]. A rapidly urbanizing Riyadh, the capital and most populous city of Saudi Arabia, and a conscious national policy transition to the knowledge-based economy have resulted in an extensive increase in university infrastructure. However, access to tertiary education has far-reaching effects on the level of education attained, the social and economic mobility achieved, and regional development trajectories [3,4]. Moreover, with the latest trend, in rapidly developing countries, universities have become a fundamental stone when developing human capital and economic growth [1,2]. The quality of life of people depends upon who goes to higher education institutions. They have a major impact on educational attainment, socio-economic mobility and local development trends.
With a global population increasing rapidly, the urban distribution location and proximity to universities and schools have become important factors in providing educational services for all people without discrimination or degradation. The population of Riyadh, the capital city of Saudi Arabia, has increased from approximately 1.5 million in 1985 to over 7.6 million in 2022, growing over four decades [5]. Driven by economic diversification projects and Vision 2030 development projects to increase their economies, in the wake of this rapid urbanization [6], spatial mobility and development patterns have shown that enormous growth beyond the usual urban centers is the result of the massive pattern of urbanization. As a result, the spatial allocation of public services becomes more and more important to provide universal reach of such services, especially for higher education, and to ensure fair access and balanced urban growth [7,8].
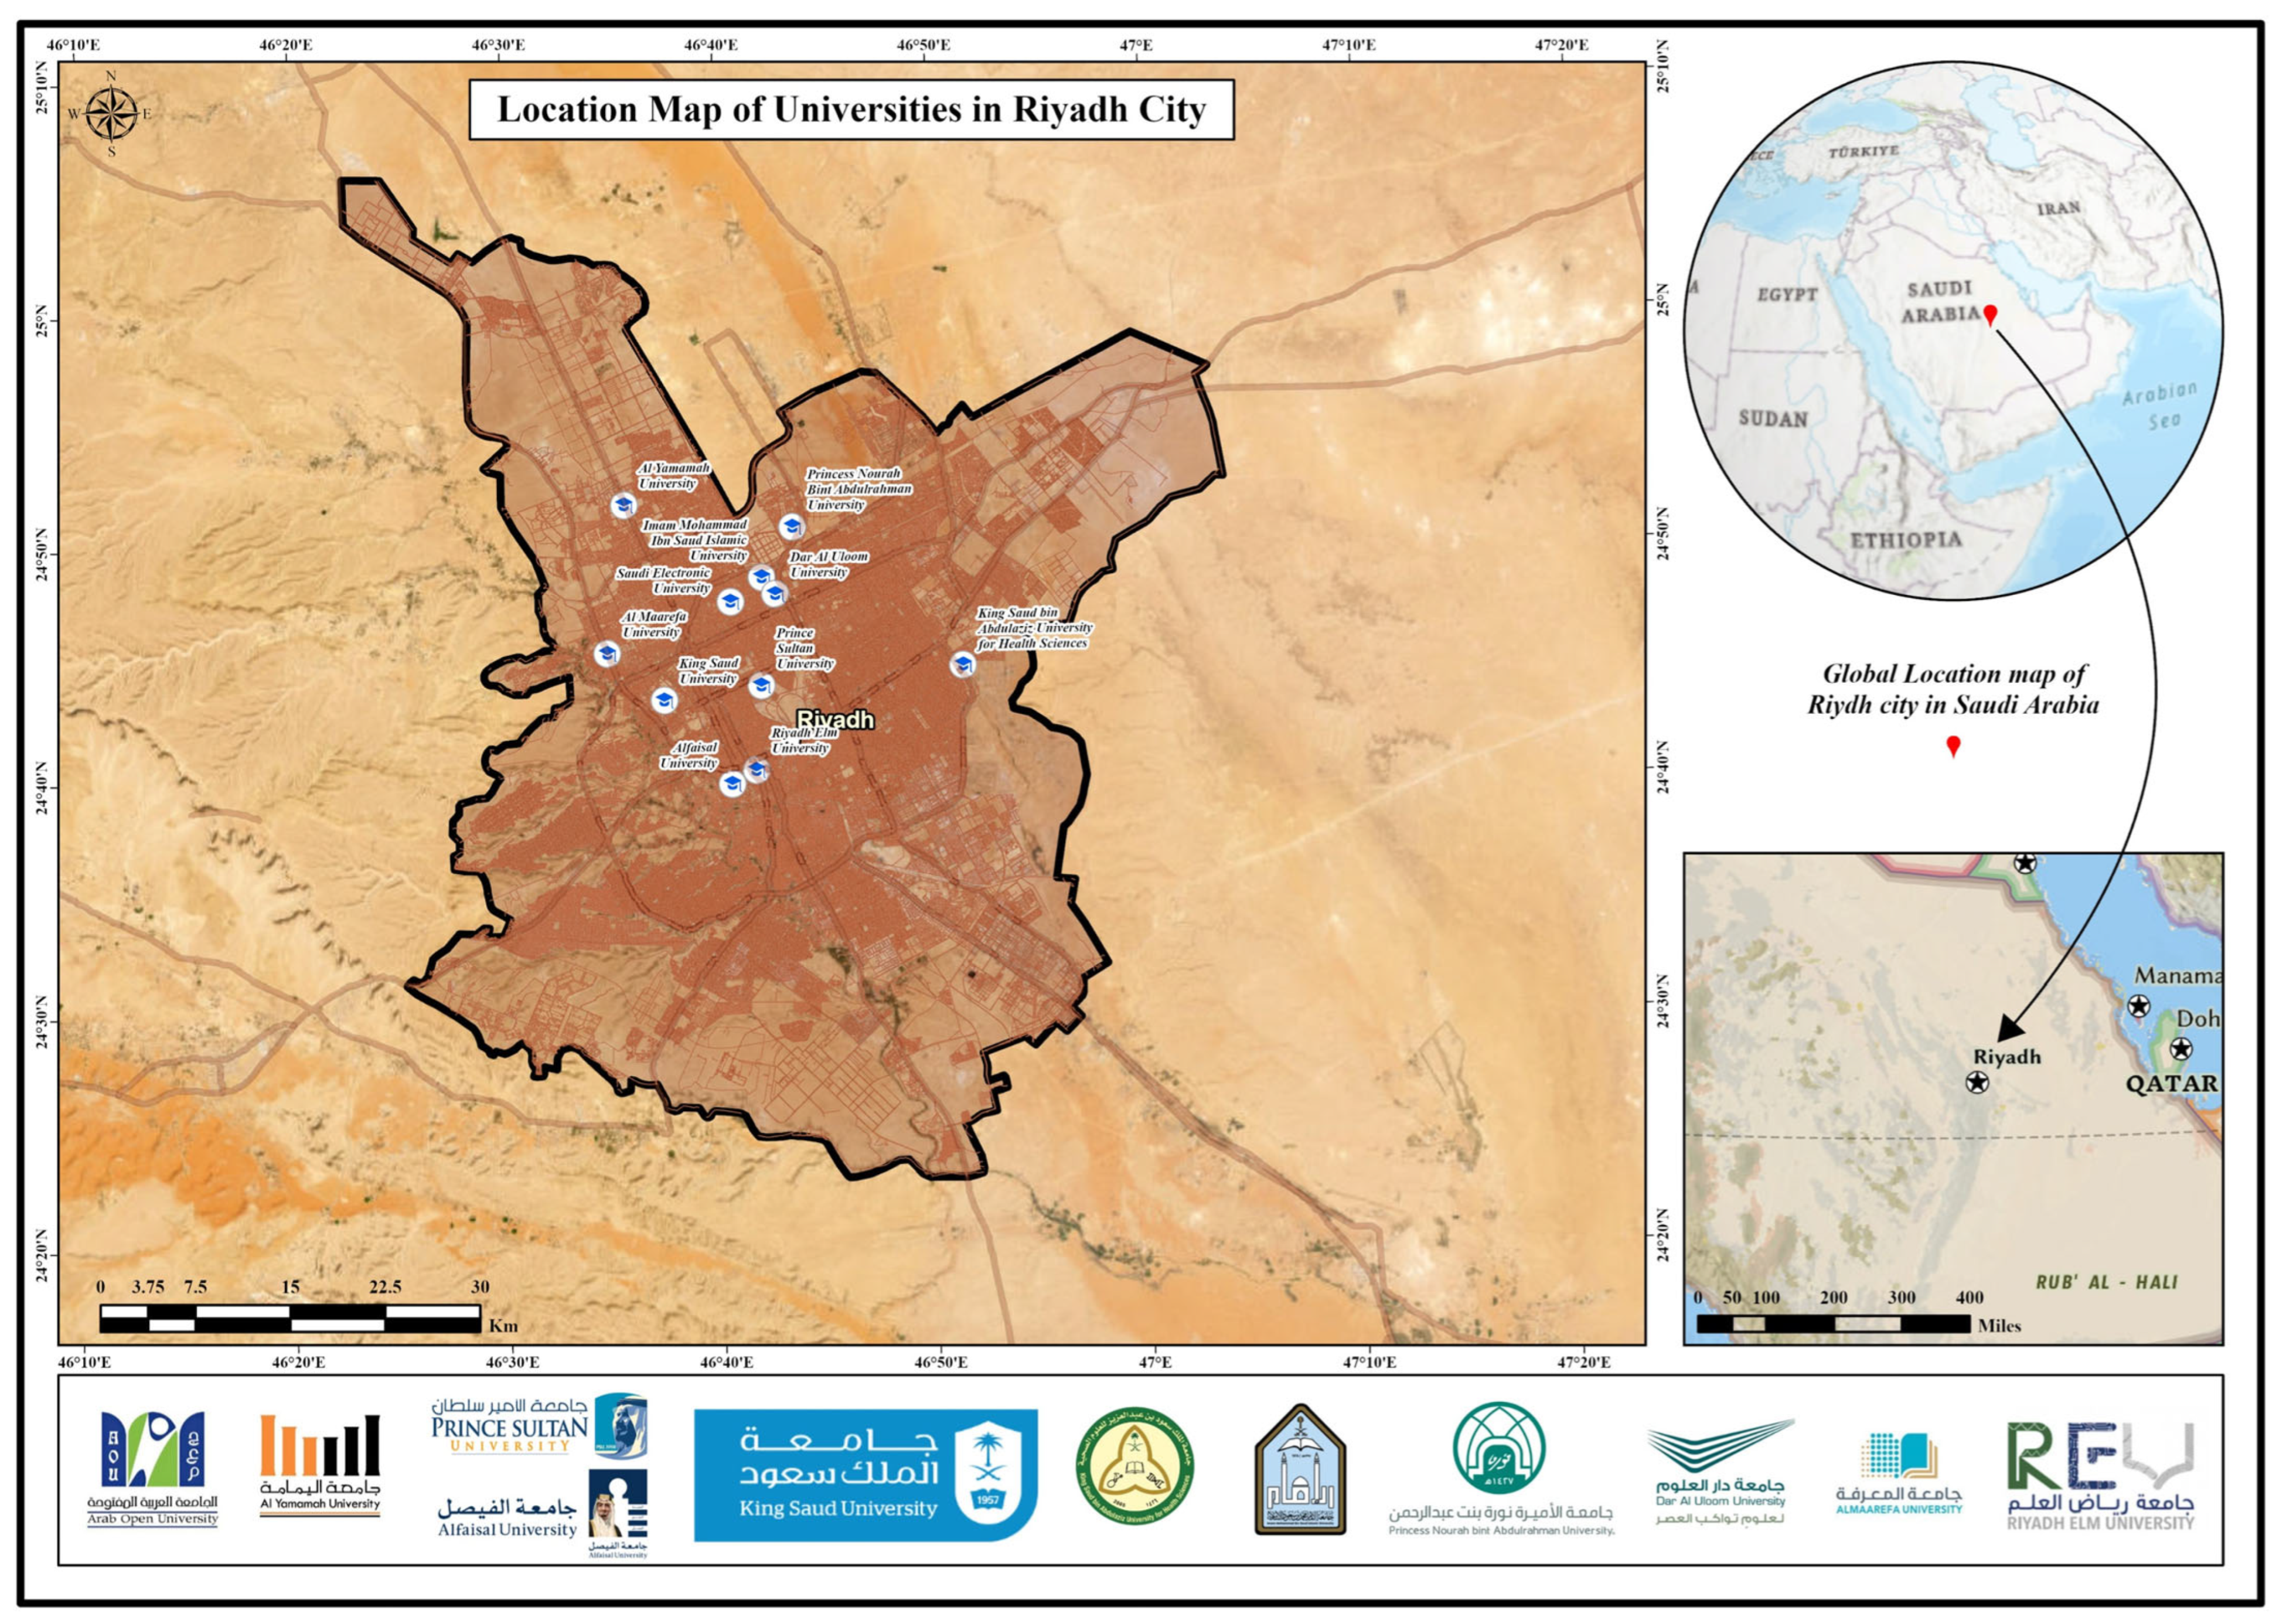
Riyadh City is located at about 24°38′ N latitude and 46°43′ E longitude in the central Arabian Peninsula and is the political, administrative and economic hub of the Kingdom of Saudi Arabia. The city’s urban boundary encompasses approximately 2850.06 km2 and covers a mix of residential zones from the oldest core area to new peripheral areas (Figure 1). In the study area, there is a well-developed hierarchical road network system including major arterial highways, secondary roads and local streets, allowing cross-boundary connectivity in the metropolitan area [9,10].
Figure 1.
Location of the main universities of study area in Riyadh.
This study contributes to the existing literature by introducing an integrated spatial accessibility framework that combines time-based and distance-based network analysis using topologically corrected road networks. Unlike previous studies that rely on single accessibility metrics, this research simultaneously evaluates travel time efficiency and spatial distance to reveal deprived areas more accurately. In addition, the application of GIS network analysis to the rapidly urbanizing metropolitan context of Riyadh provides empirical evidence to support spatially equitable higher education planning.
2. Theoretical Framework
GIS offers powerful analytical techniques for spatial accessibility pattern assessments and service gap analysis in urban settings [11,12]. Network analysis methods such as service area analysis (SA) and Origin-Destination (OD) cost matrix methods can be used to accurately measure accessibility, which can depend on the actual configurations of road networks and travel impedances [13,14]. These approaches have been pragmatically applied to assess access to a range of publicly accessible services (e.g., medical centers [15,16], schools [10,17], recreational facilities [18]); however, a number of empirical studies on university accessibility in Middle Eastern settings remain limited. More studies into educational facility accessibility have focused on elementary and secondary schools [19,20] than on higher education institutions, which play a crucial role in developing human capital [4]. As to the context of Saudi Arabia, Mansour [21] did pioneering work on healthcare facility accessibility across Riyadh Governorate, while AlQuhtani [22] analyzed the elementary school geography of Najran and noted vast geographical inequalities. Yet in the literature, there is no systematic study of university accessibility patterns in Riyadh applied through sophisticated GIS network analyses. Educational institutions, spatially distributed and accessible due to rapid urban population growth, have been considered essential in the context of equitable services and sustainable urban design, despite international demographic development [23,24].
In spatial planning literature, accessibility is commonly conceptualized as the potential ease with which opportunities can be reached from a given location through a transportation network. This study adopts the concept of potential accessibility, which reflects the spatial relationship between residential areas and universities under assumed travel conditions, rather than revealed accessibility, which represents actual observed usage patterns. While revealed accessibility depends on behavioral, institutional, and socio-economic factors, potential accessibility remains a fundamental planning indicator for identifying spatial inequities in service provision.
Despite the presence of multiple higher education institutions in Riyadh, systematic spatial analysis of their accessibility using network-based measures remains limited, particularly with respect to variations across different urban sectors. In this study, we utilize an advanced geospatial framework to assess and analyze spatial accessibility concerning a cluster of university institutions located in Riyadh, the capital city. The study seeks to transcend conventional proximity-based methodologies by integrating GIS network analysis.
The uneven distribution of universities geographically in Riyadh’s expanding metropolitan area creates a situation where there are vast disparities in accessibility of higher education within the residential sector, leading to unequal access to higher education. While the city possesses extensive road networks, intricate interactions such as population density, travel time efficiency, and distance-related barriers are what make the accessibility efficiency in the city vary from high to low. Thus, the core research problem for this research study is “…How efficient is the spatial distribution of universities in Riyadh in terms of residents’ accessibility measured by travel time and distance under current travel time efficiency and road network conditions…?”
Further, the present research study addresses this research gap by conducting a comprehensive spatial accessibility analysis of universities across Riyadh. Despite Riyadh’s well-developed road infrastructure, increasing population density and recurrent travel time efficiency significantly affect travel time and accessibility efficiency [25].
Understanding these spatial patterns is essential for evidence-based educational planning and policy formulation aimed at achieving spatial equity in higher education access.
3. Materials and Methods
3.1. Data Sources and Preparation
Spatial datasets for this research study were obtained from multiple authoritative sources to ensure data accuracy and reliability (Table 1).
Table 1.
Data sources and descriptions.
Primary data sources included the Riyadh Municipality (Al-Amana, Government), Ministry of Education, and Esri base maps.
All spatial data were standardized to the WGS 1984 UTM Zone 38N coordinate system to ensure geometric consistency and accurate distance measurements.
3.2. Data Processing and Network Preparation
The road network dataset was thoroughly preprocessed to guarantee topological precision for network analysis tasks [26,27,28].
Topological correction procedures encompassed:
1. Connectivity verification: Ensuring proper node connectivity at intersections and eliminating pseudo-nodes.
2. Duplicate feature removal: Identifying and removing overlapping line segments.
3. Geometric validation: Correcting geometric anomalies and ensuring proper network connectivity.
4. Attribute standardization: Classifying Road segments by hierarchy (highways, arterial Roads, collectors, local streets) and assigning necessary speed limits according to road categories.
The parameters of the network dataset were also set up to show real-world situations, such as road hierarchy, speed limits, and one-way restrictions when they were needed. Because Riyadh’s landscape is mostly flat, turn impedances and changes in elevation were thought to be unimportant and were left out of the analysis.
3.3. Network Analysis Methodology
The spatial accessibility analysis was conducted using this software application, ArcGIS Pro 3.6 Network Analyst extension, operating and employing two primary analytical techniques as follows.
3.3.1. Service Area Analysis
Service area analysis shows how far areas can be reached from university locations within certain travel cost limits (either distance or time) [29,30]. The analysis was conducted independently for distance-based and time-based criteria, adhering to the following steps:
1. The network dataset marked universities as facility points.
2. For each threshold category (5, 10, 15, 20, 30 km for distance; 10, 20, 30 min for time), service area polygons were made.
3. The polygon geometry types were set to “detailed” so that the road network would be accurately shown.
4. Overlapping service areas from different universities were combined to make zones of continuous coverage.
5. The travel direction was set to “toward facilities” to show how residents travel to and from the university.
The service area polygons that came out of this show areas with the same level of accessibility, making it easy to find areas that are well-served and areas that are not [31].
3.3.2. Accessibility Analysis Parameters
Two complementary accessibility criteria were utilized to conduct a thorough evaluation of university accessibility:
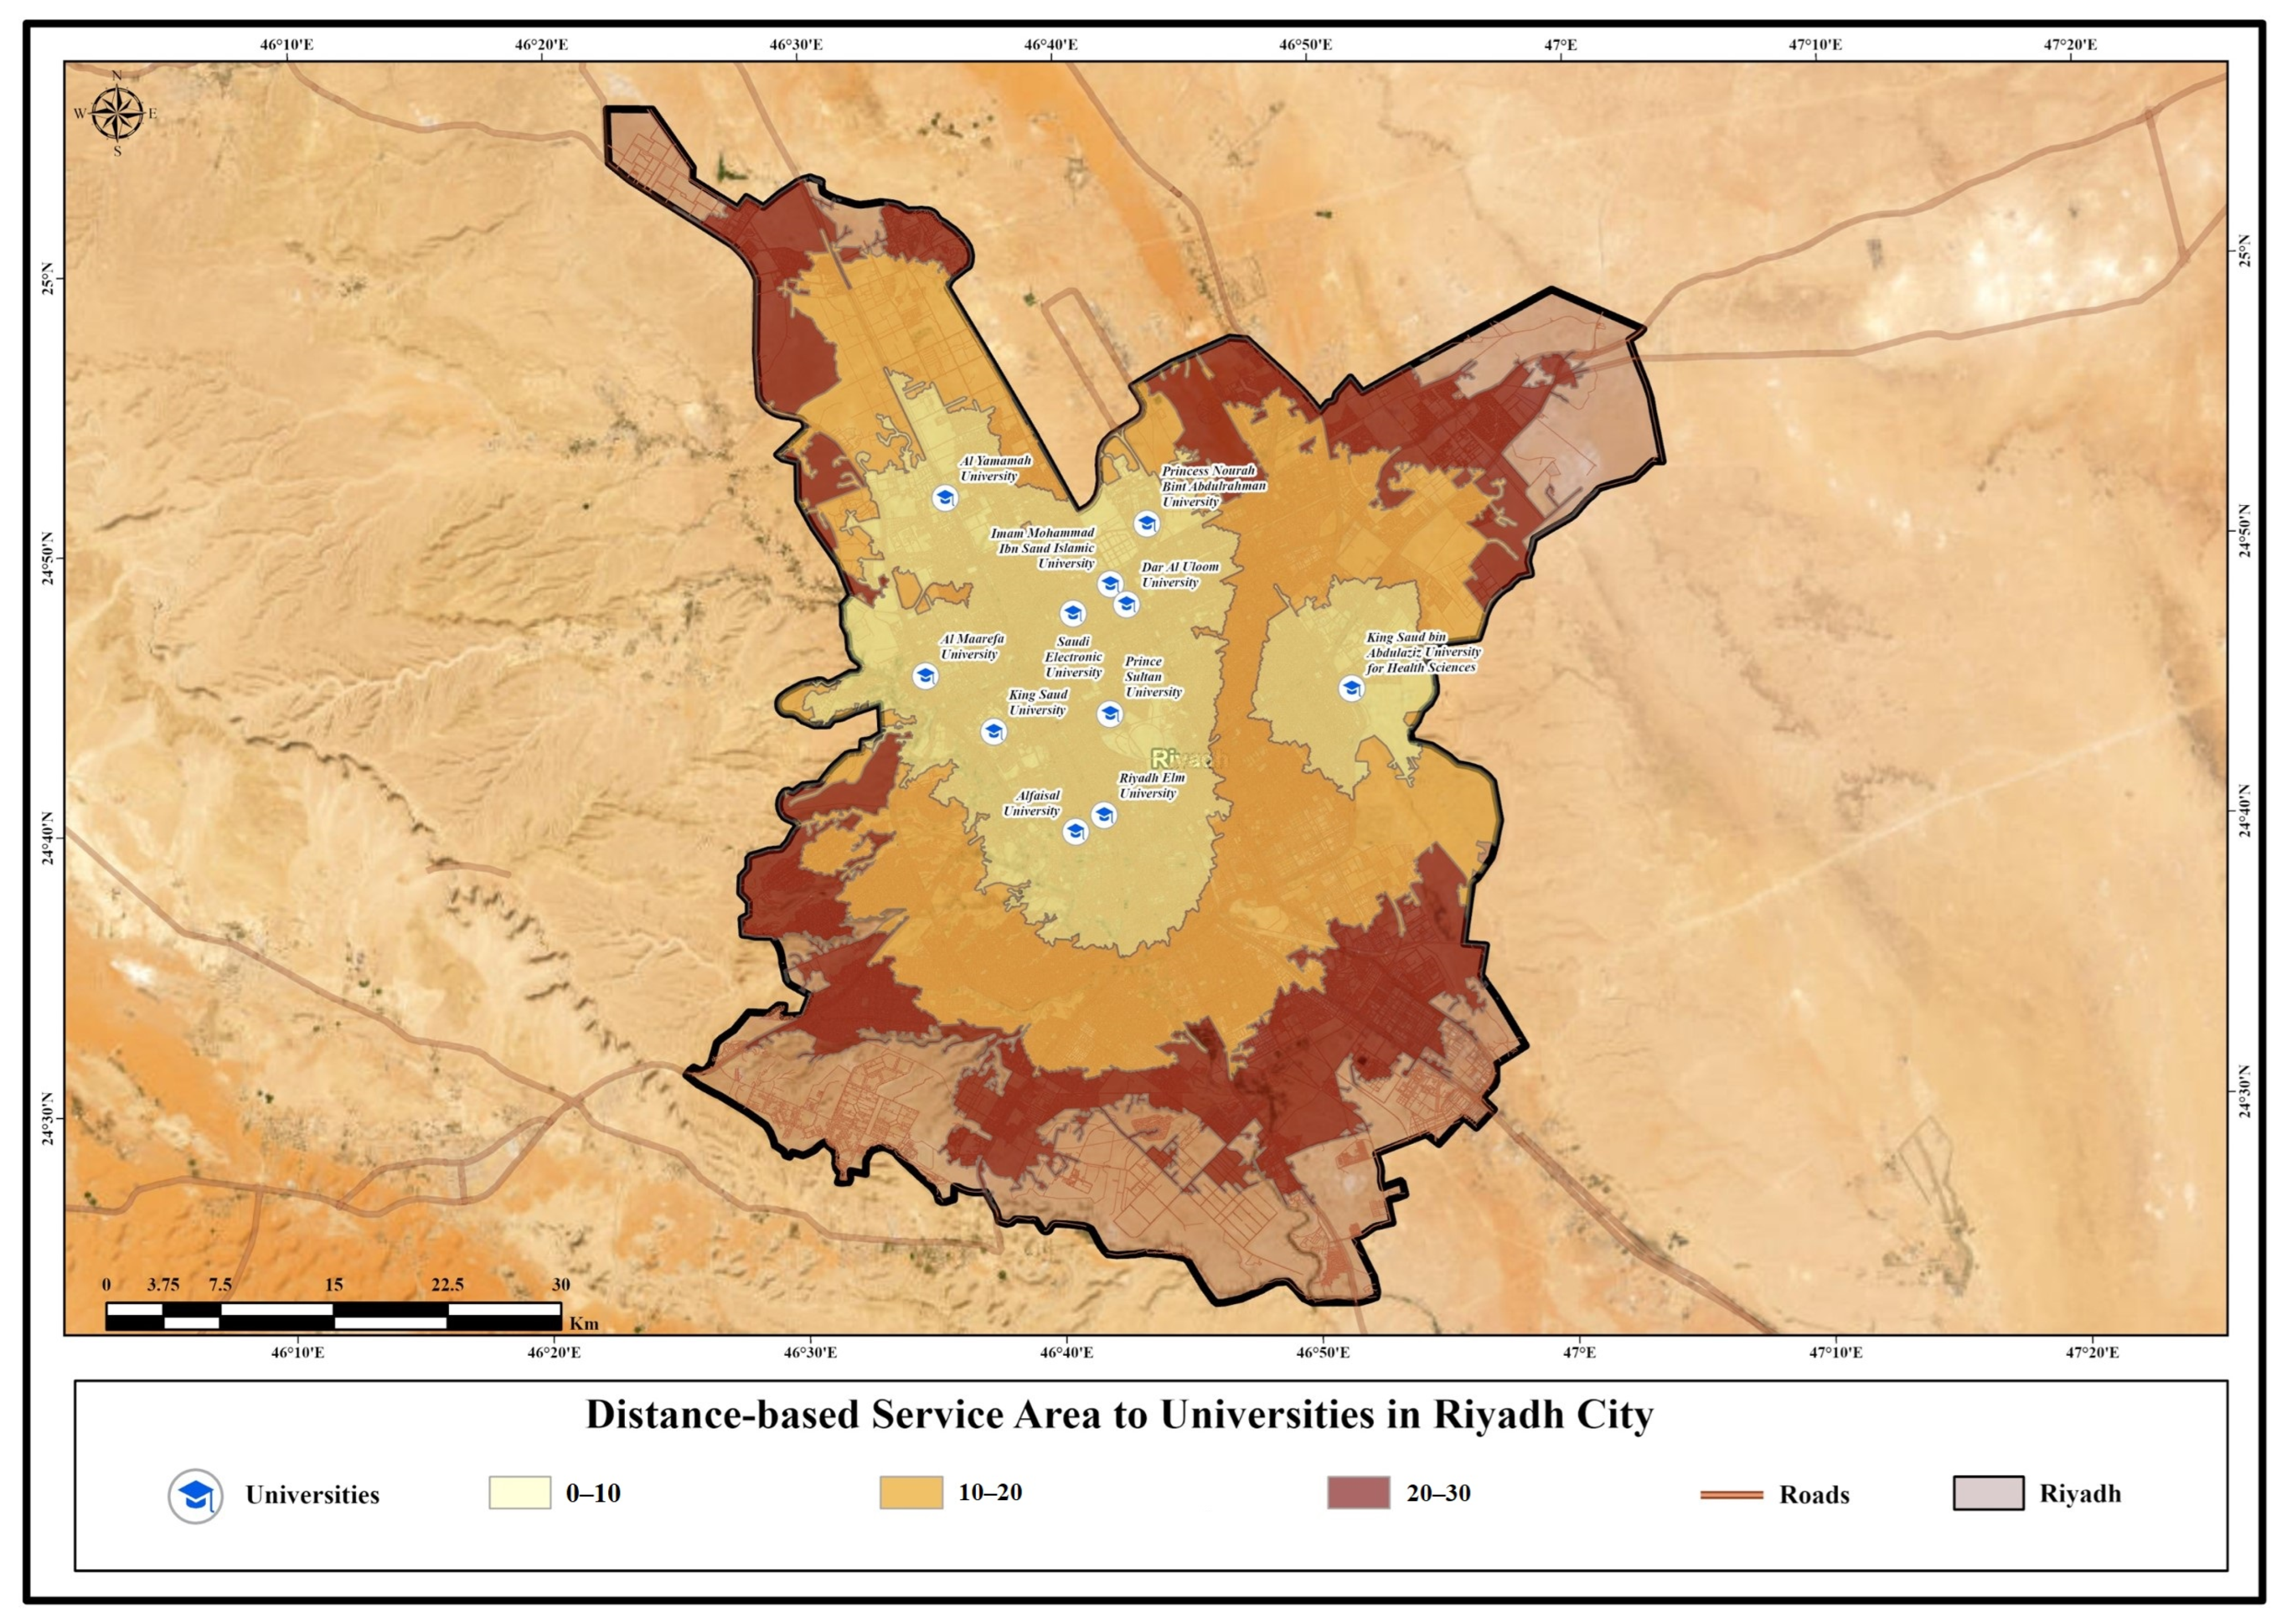
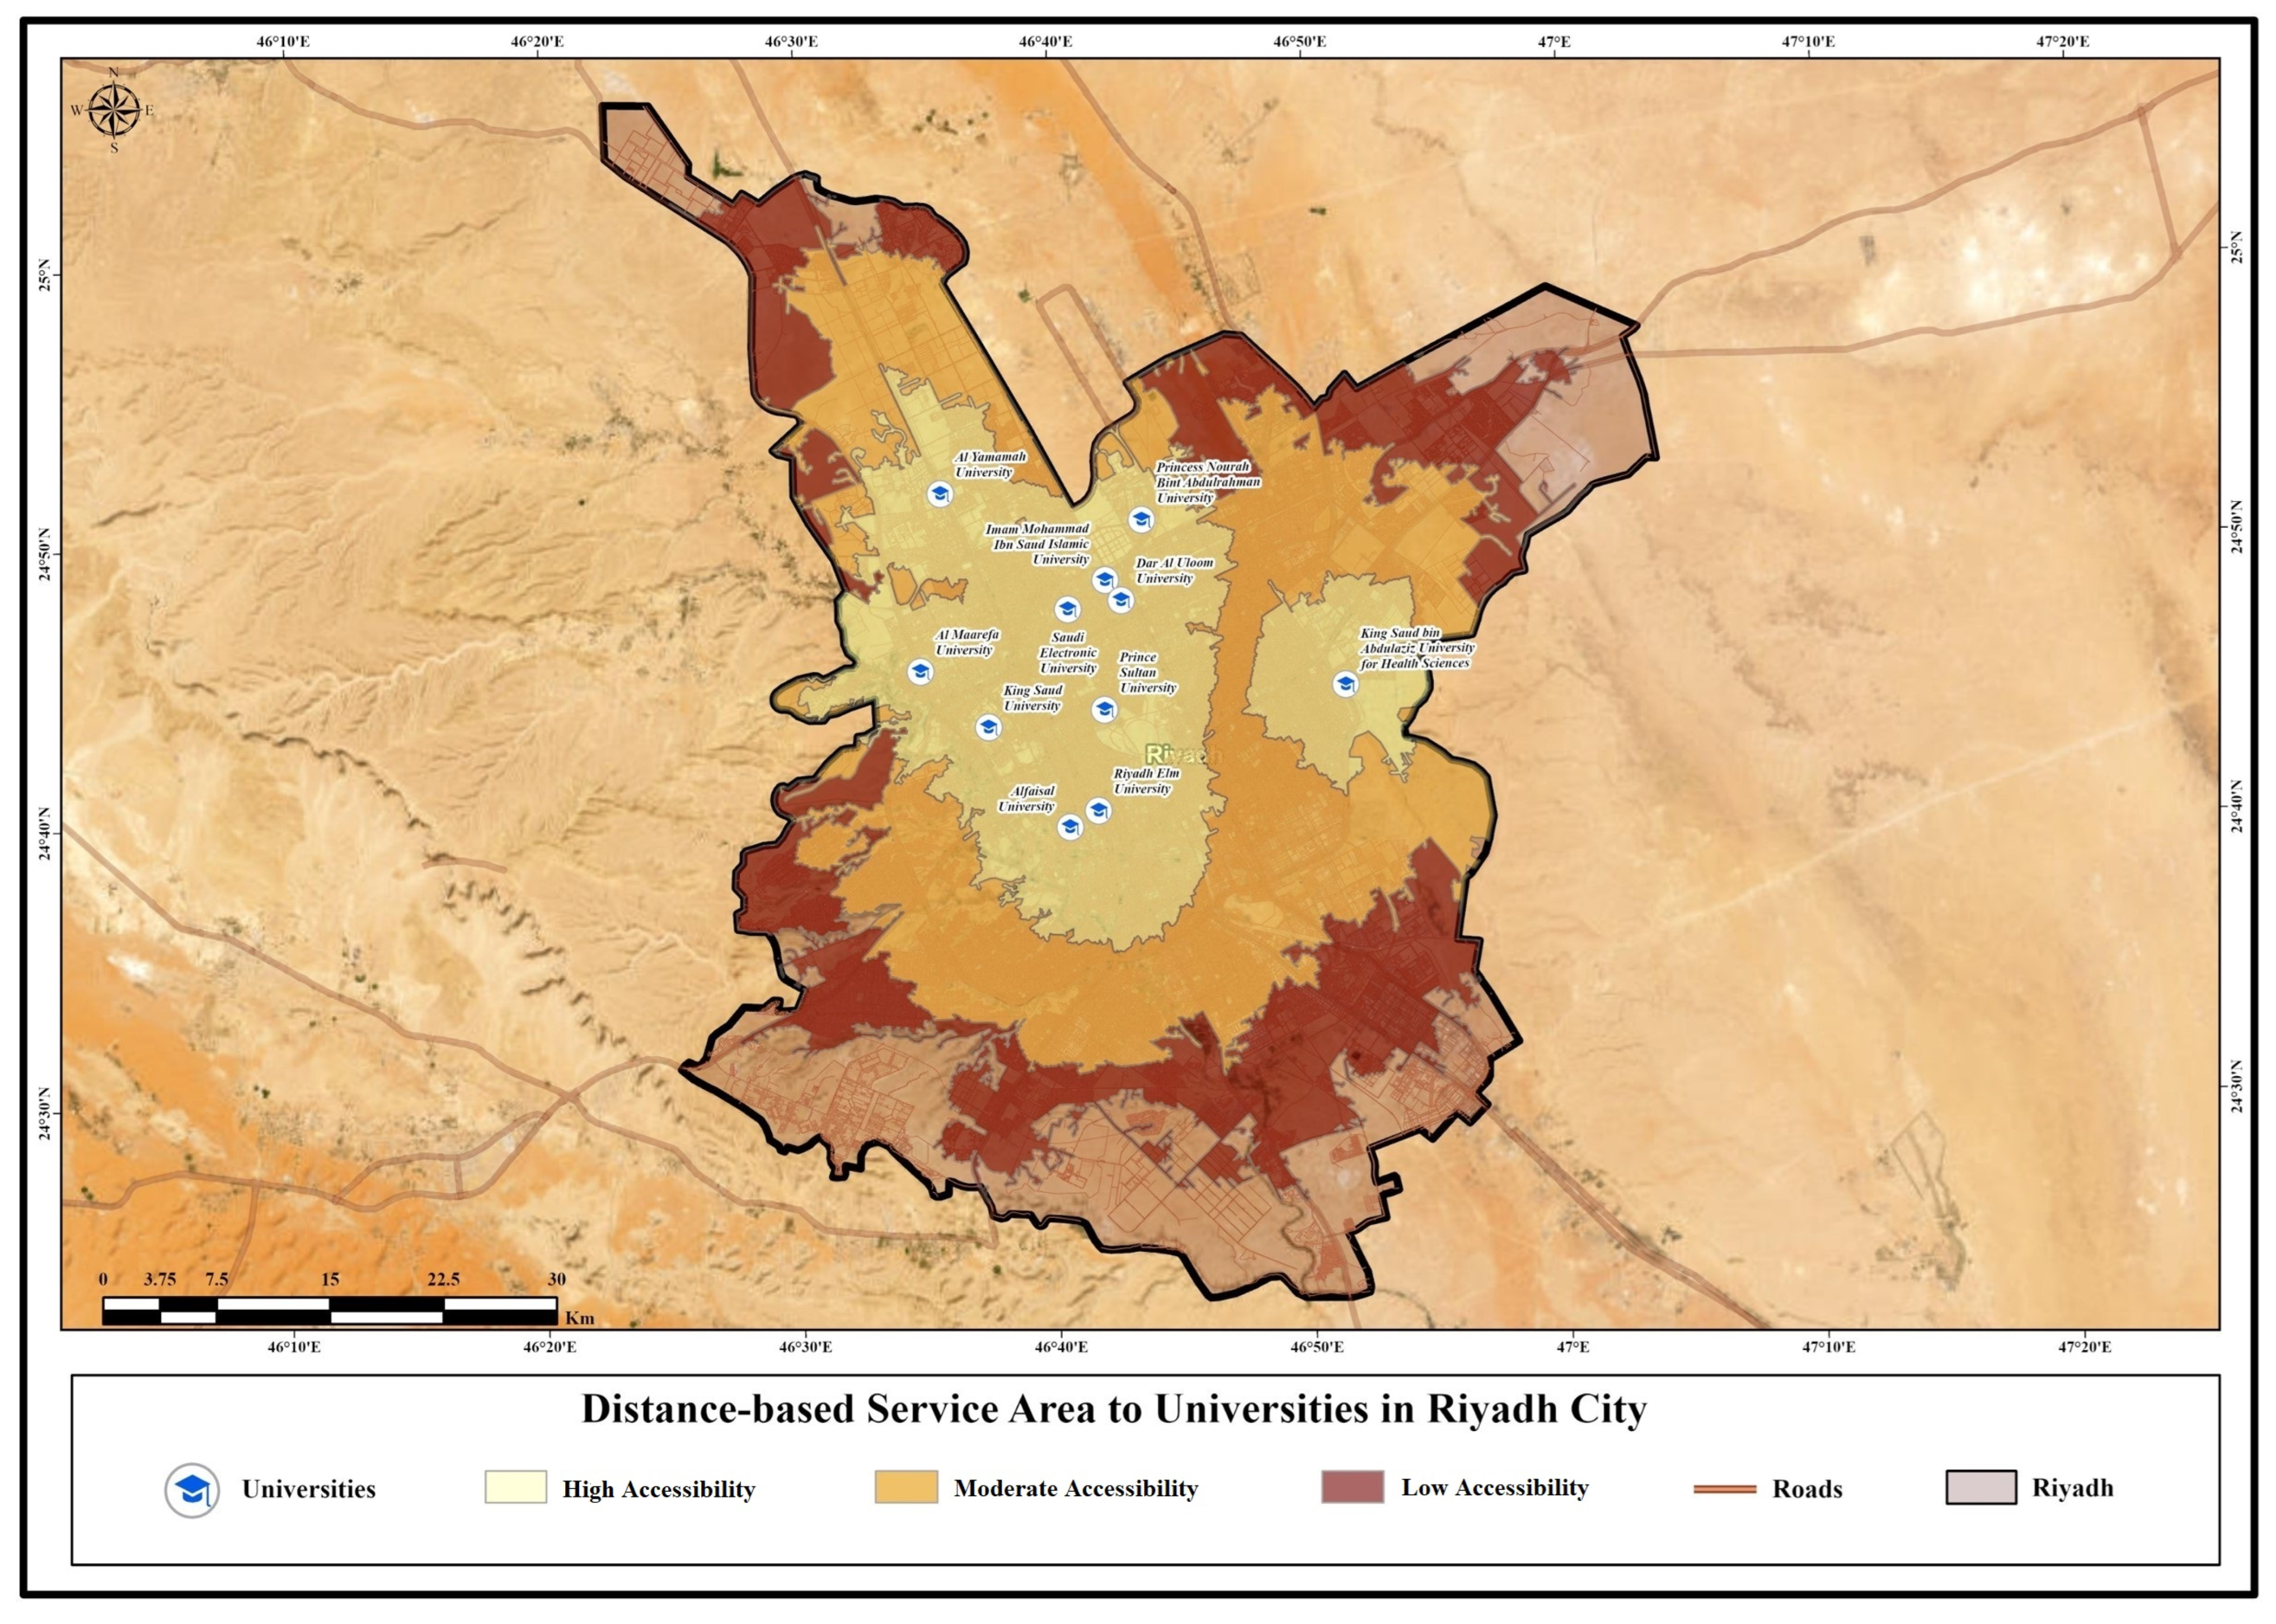
- Distance-based accessibility: Measured in kilometers with threshold categories of 5, 10, 15, 20, and 30 km Figure 2.Figure 2. Distance-based service area of the study area.
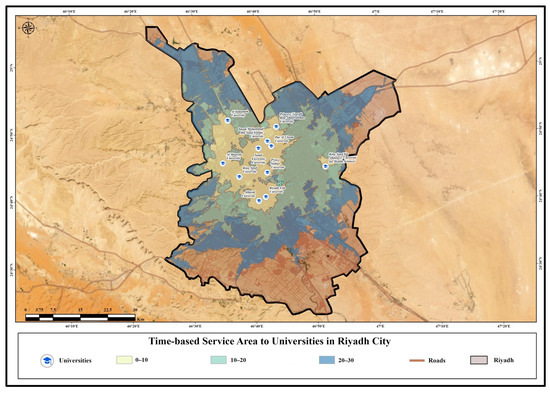
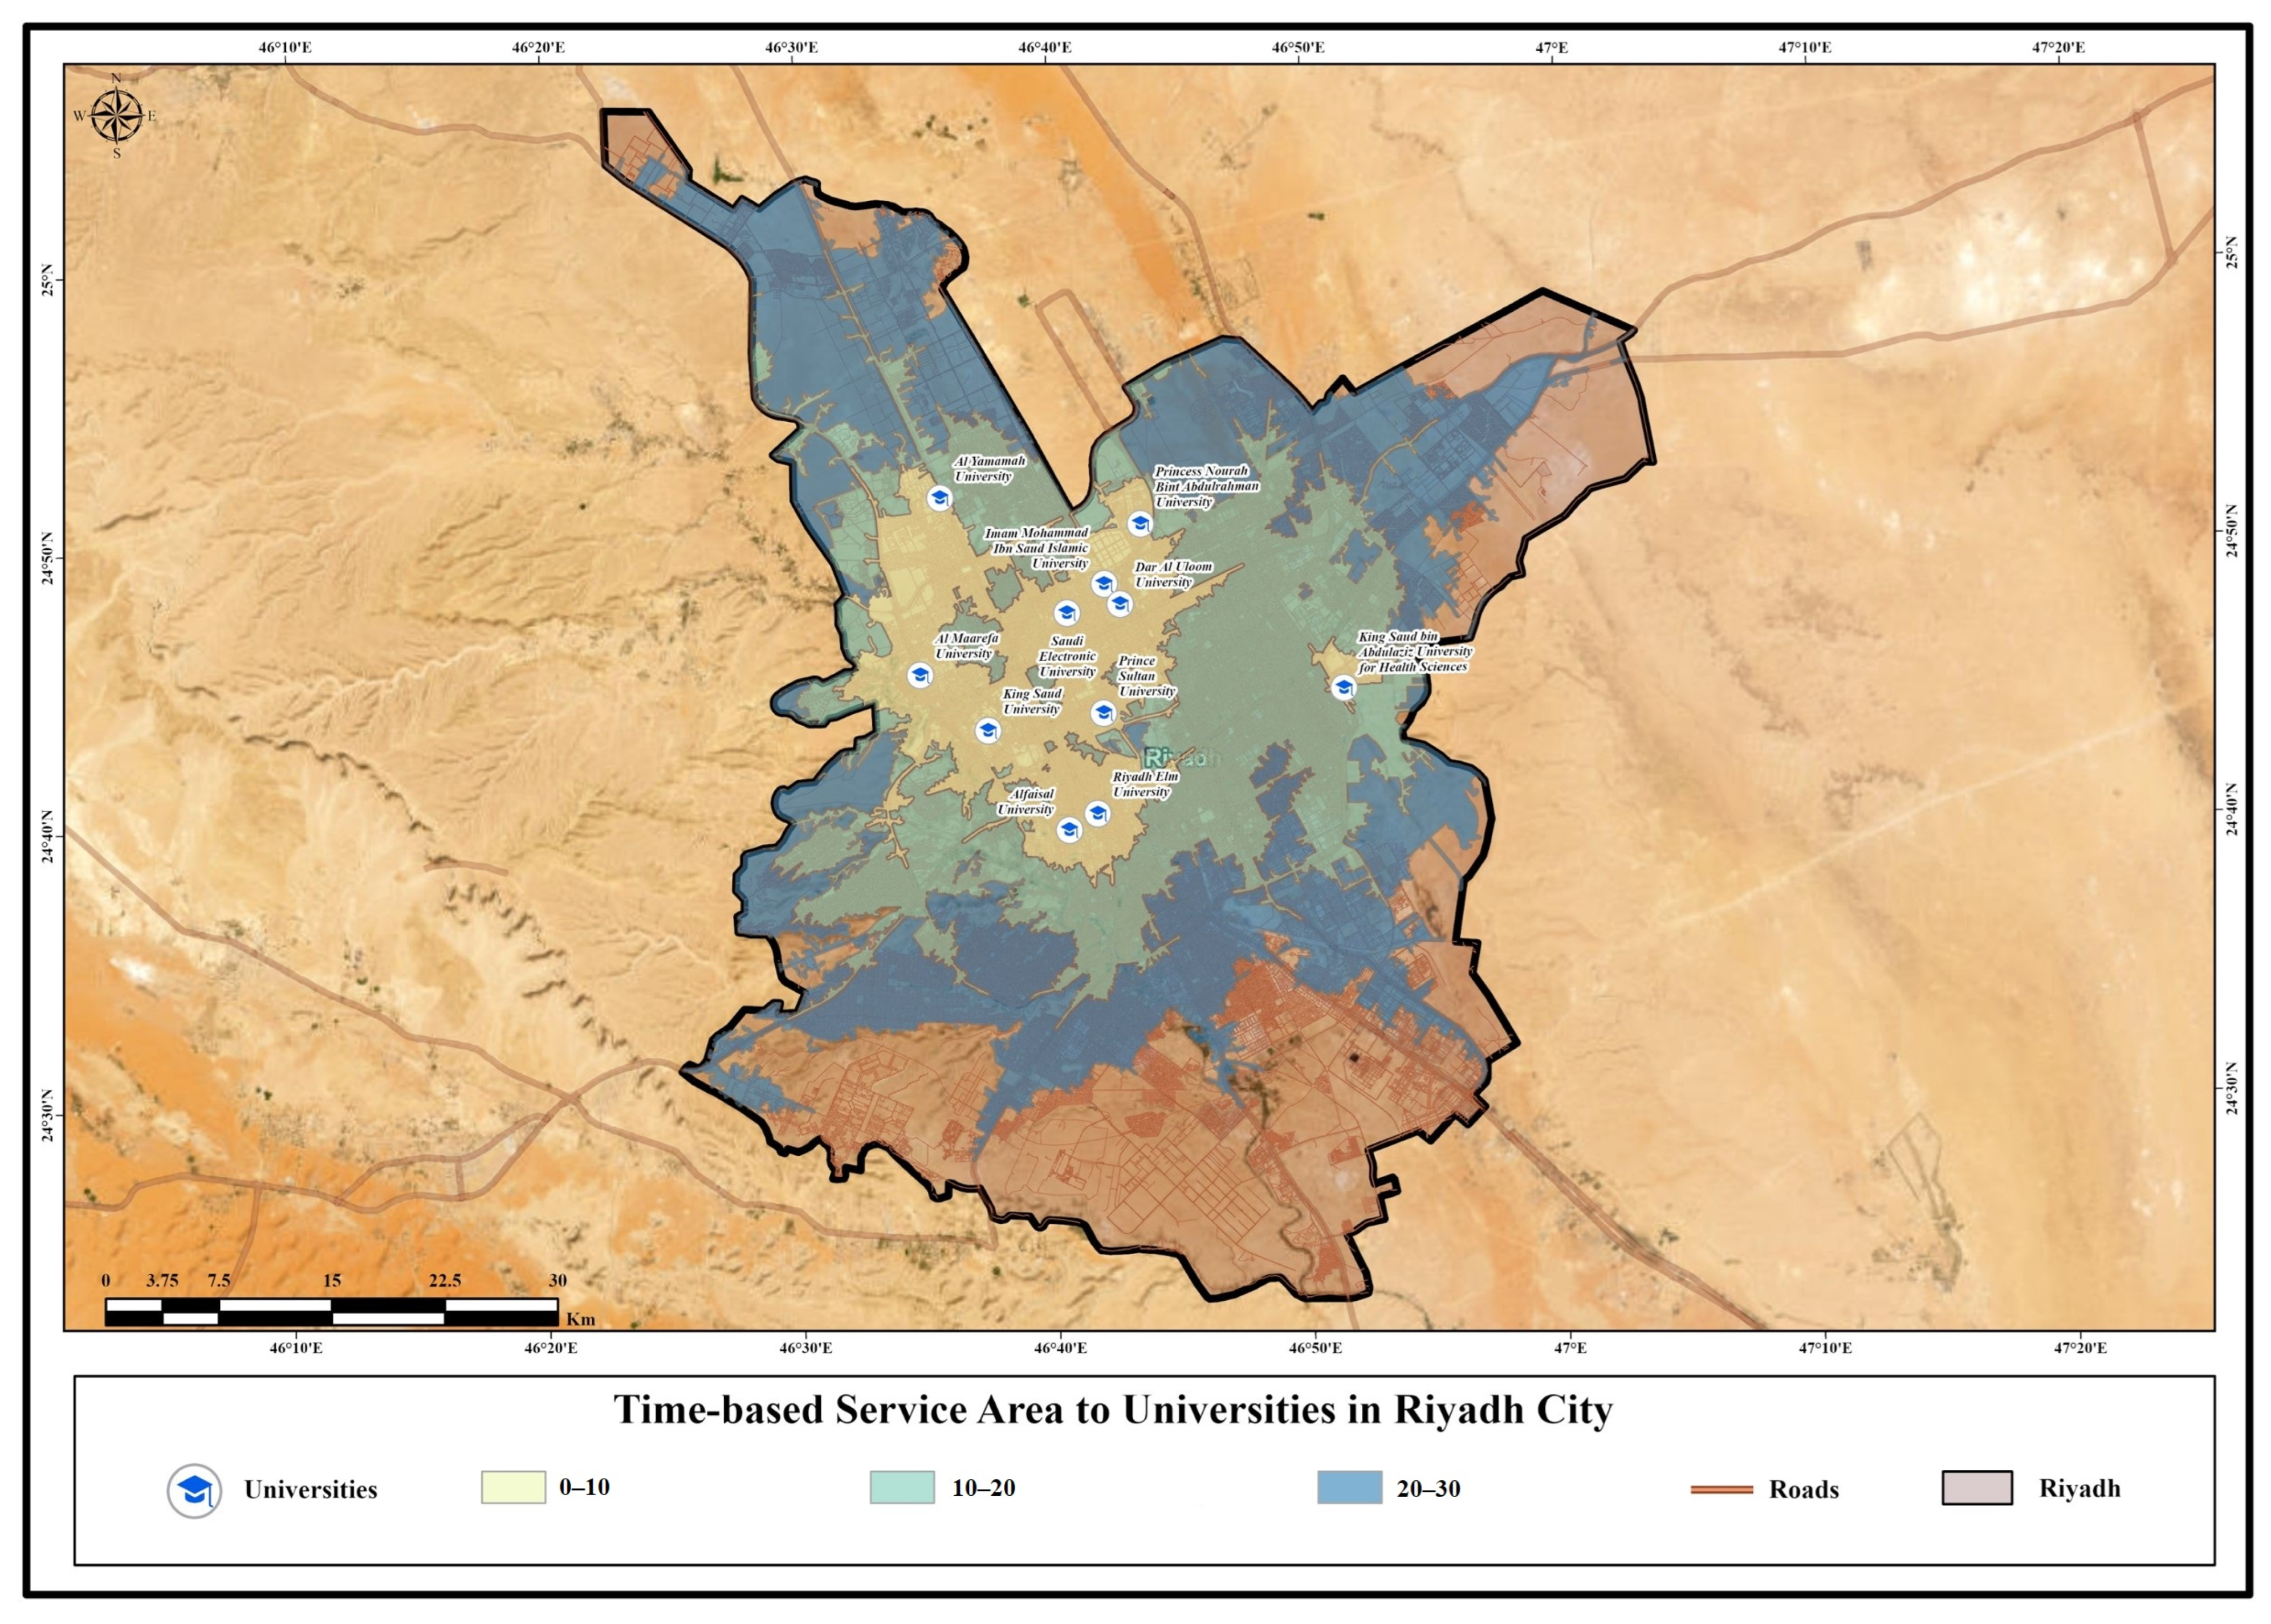
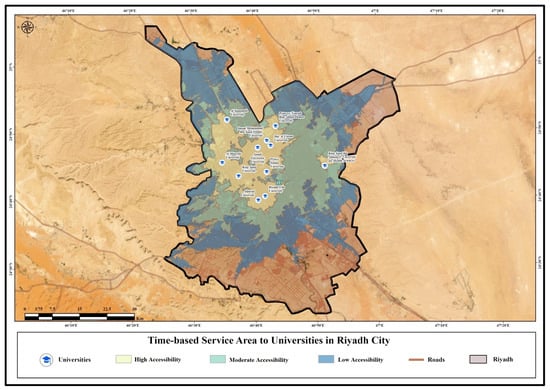
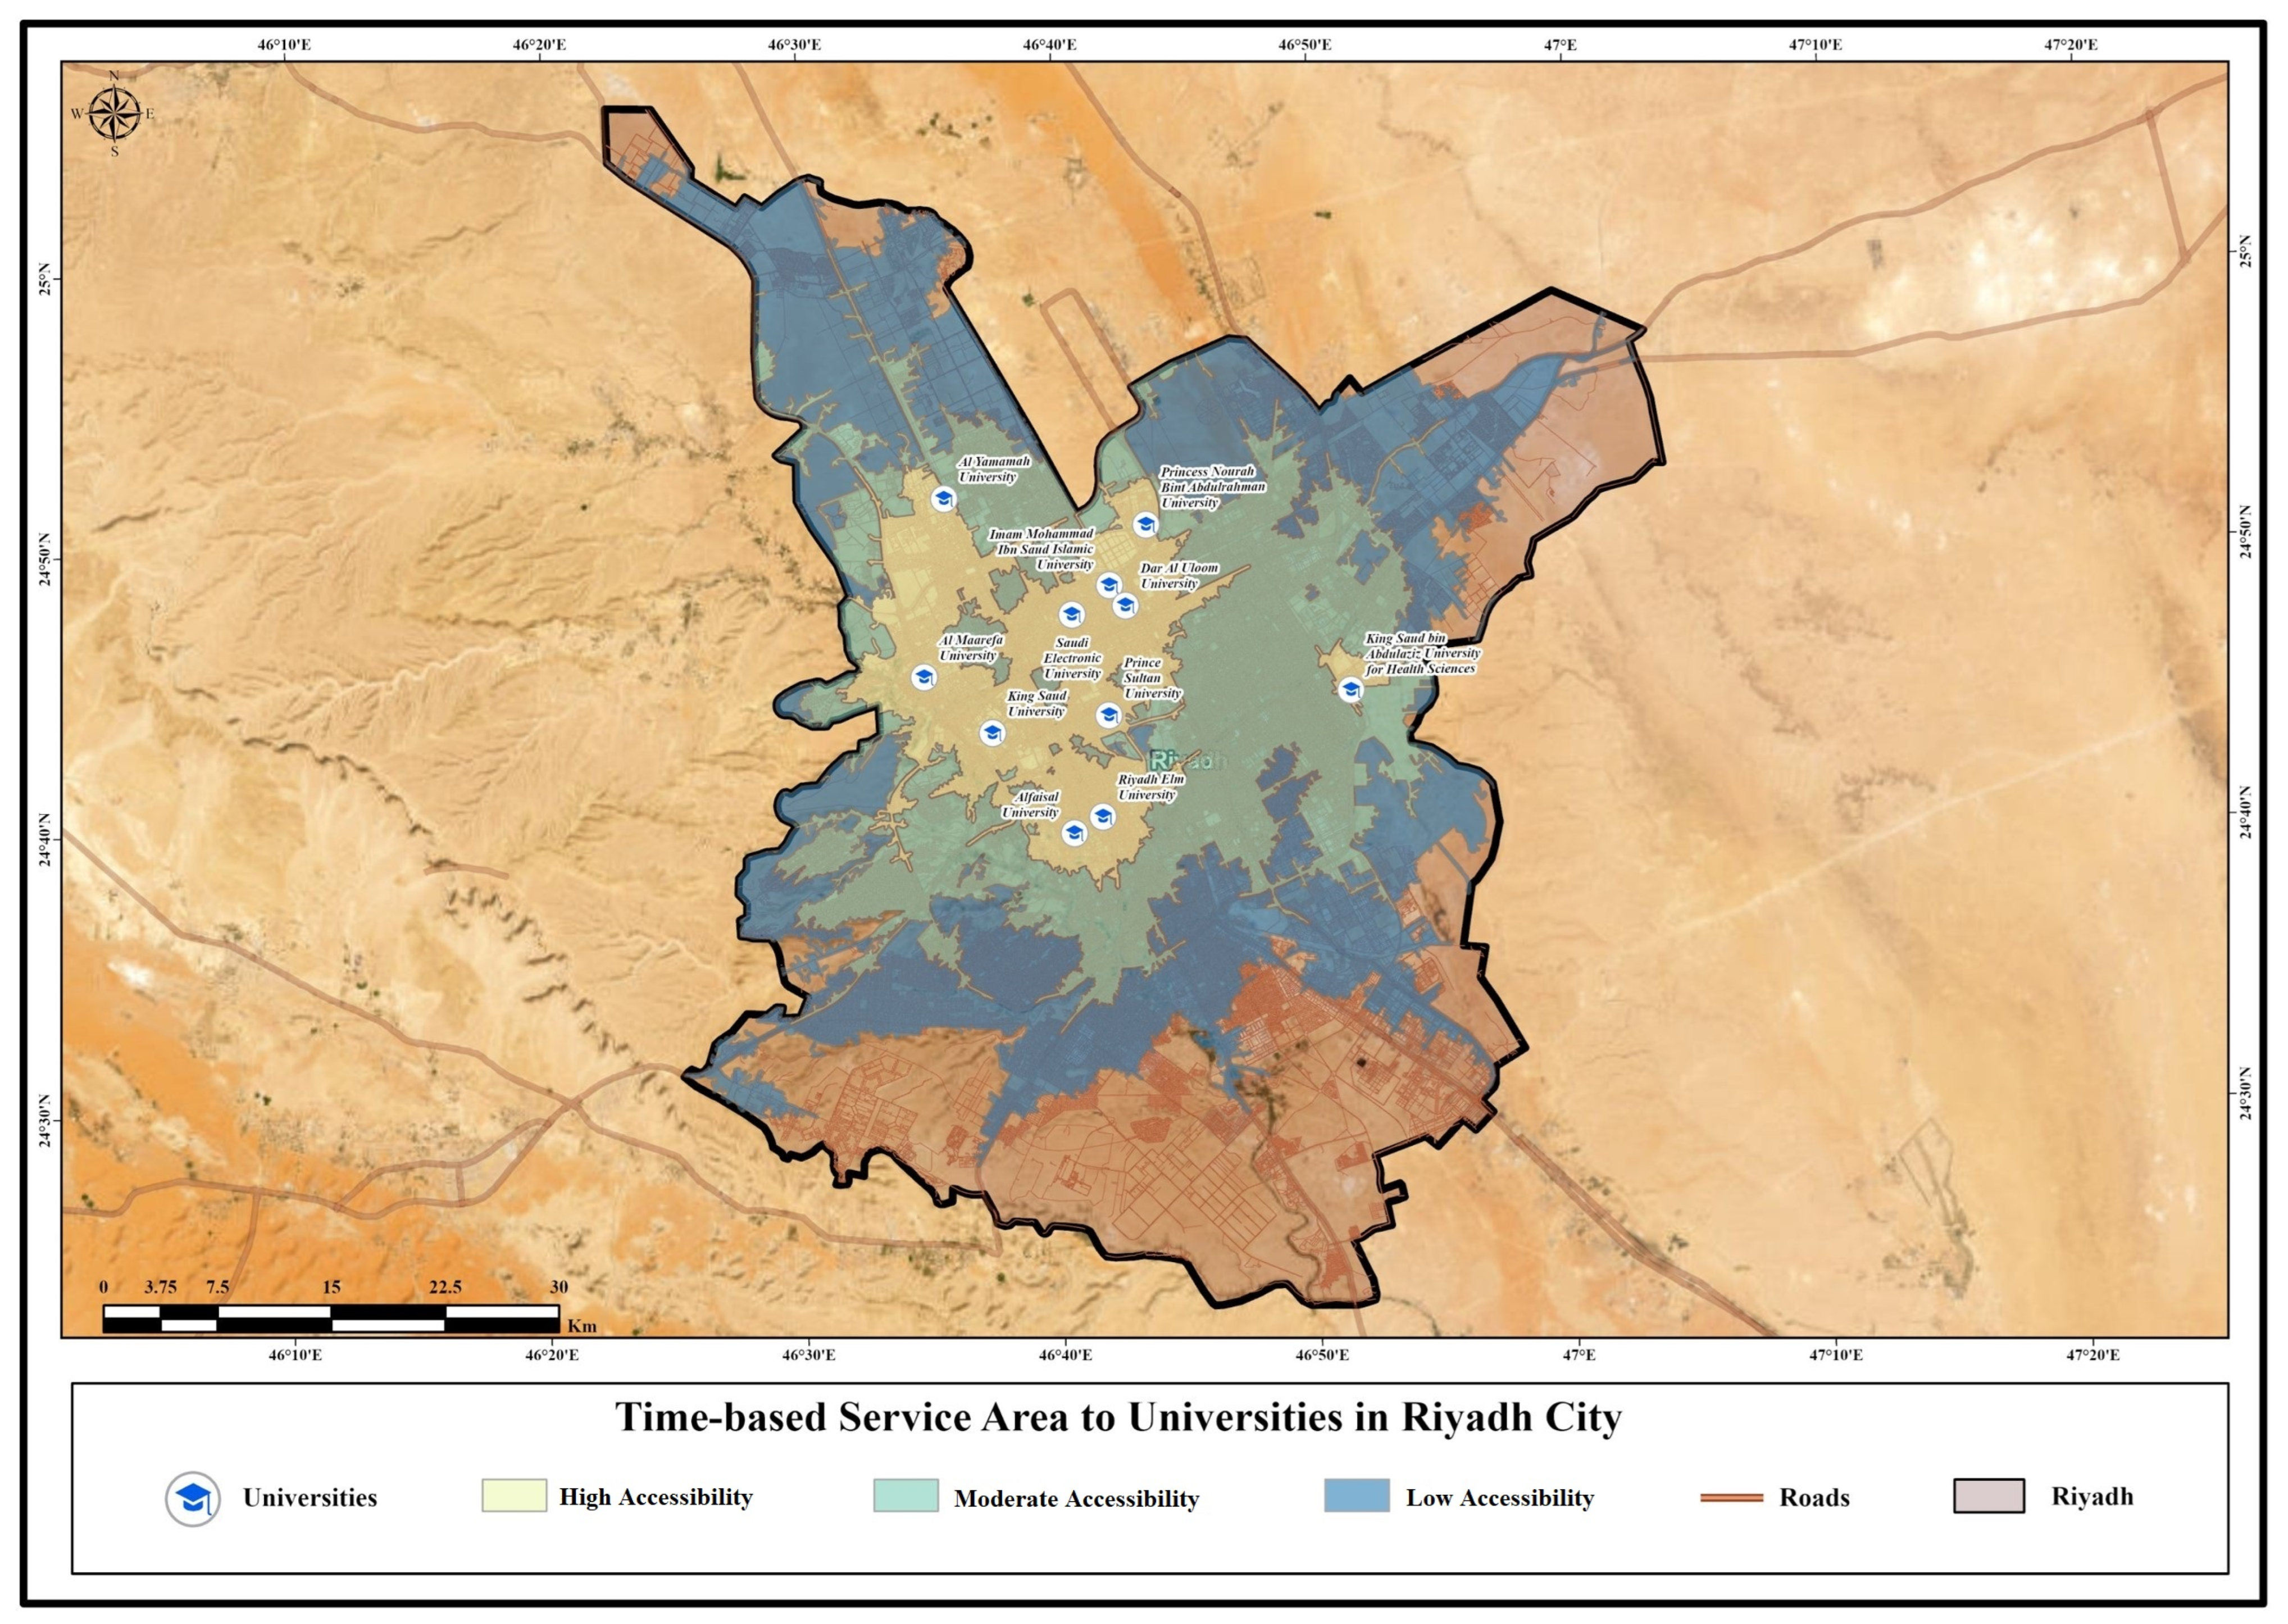
- Time-based accessibility: Measured in minutes with threshold categories of 10, 20, and 30 min Figure 3.Figure 3. Time-based service area of study locations.
Travel time was estimated based on assigned speed limits corresponding to road hierarchy categories due to the unavailability of historical or real-time traffic data. Accordingly, time-based accessibility results represent potential travel conditions rather than observed congestion-related delays. This approach is consistent with established GIS-based accessibility studies conducted in data-constrained urban contexts.
The selected time thresholds (10, 20, and 30 min) were informed by international accessibility standards commonly applied in educational planning, while acknowledging that university-level education typically involves greater travel tolerance compared to primary and secondary schooling. These thresholds were therefore adapted to reflect the spatial scale and mobility patterns of Riyadh’s metropolitan context. Time-based thresholds especially show how much people in Middle Eastern cities are willing to put up with when they commute [32].
3.3.3. Origin-Destination (OD) Cost Matrix Analysis
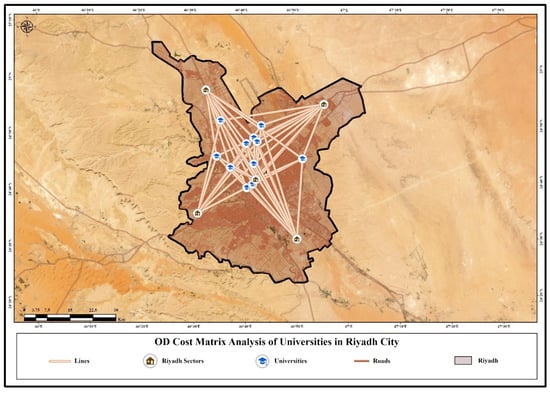
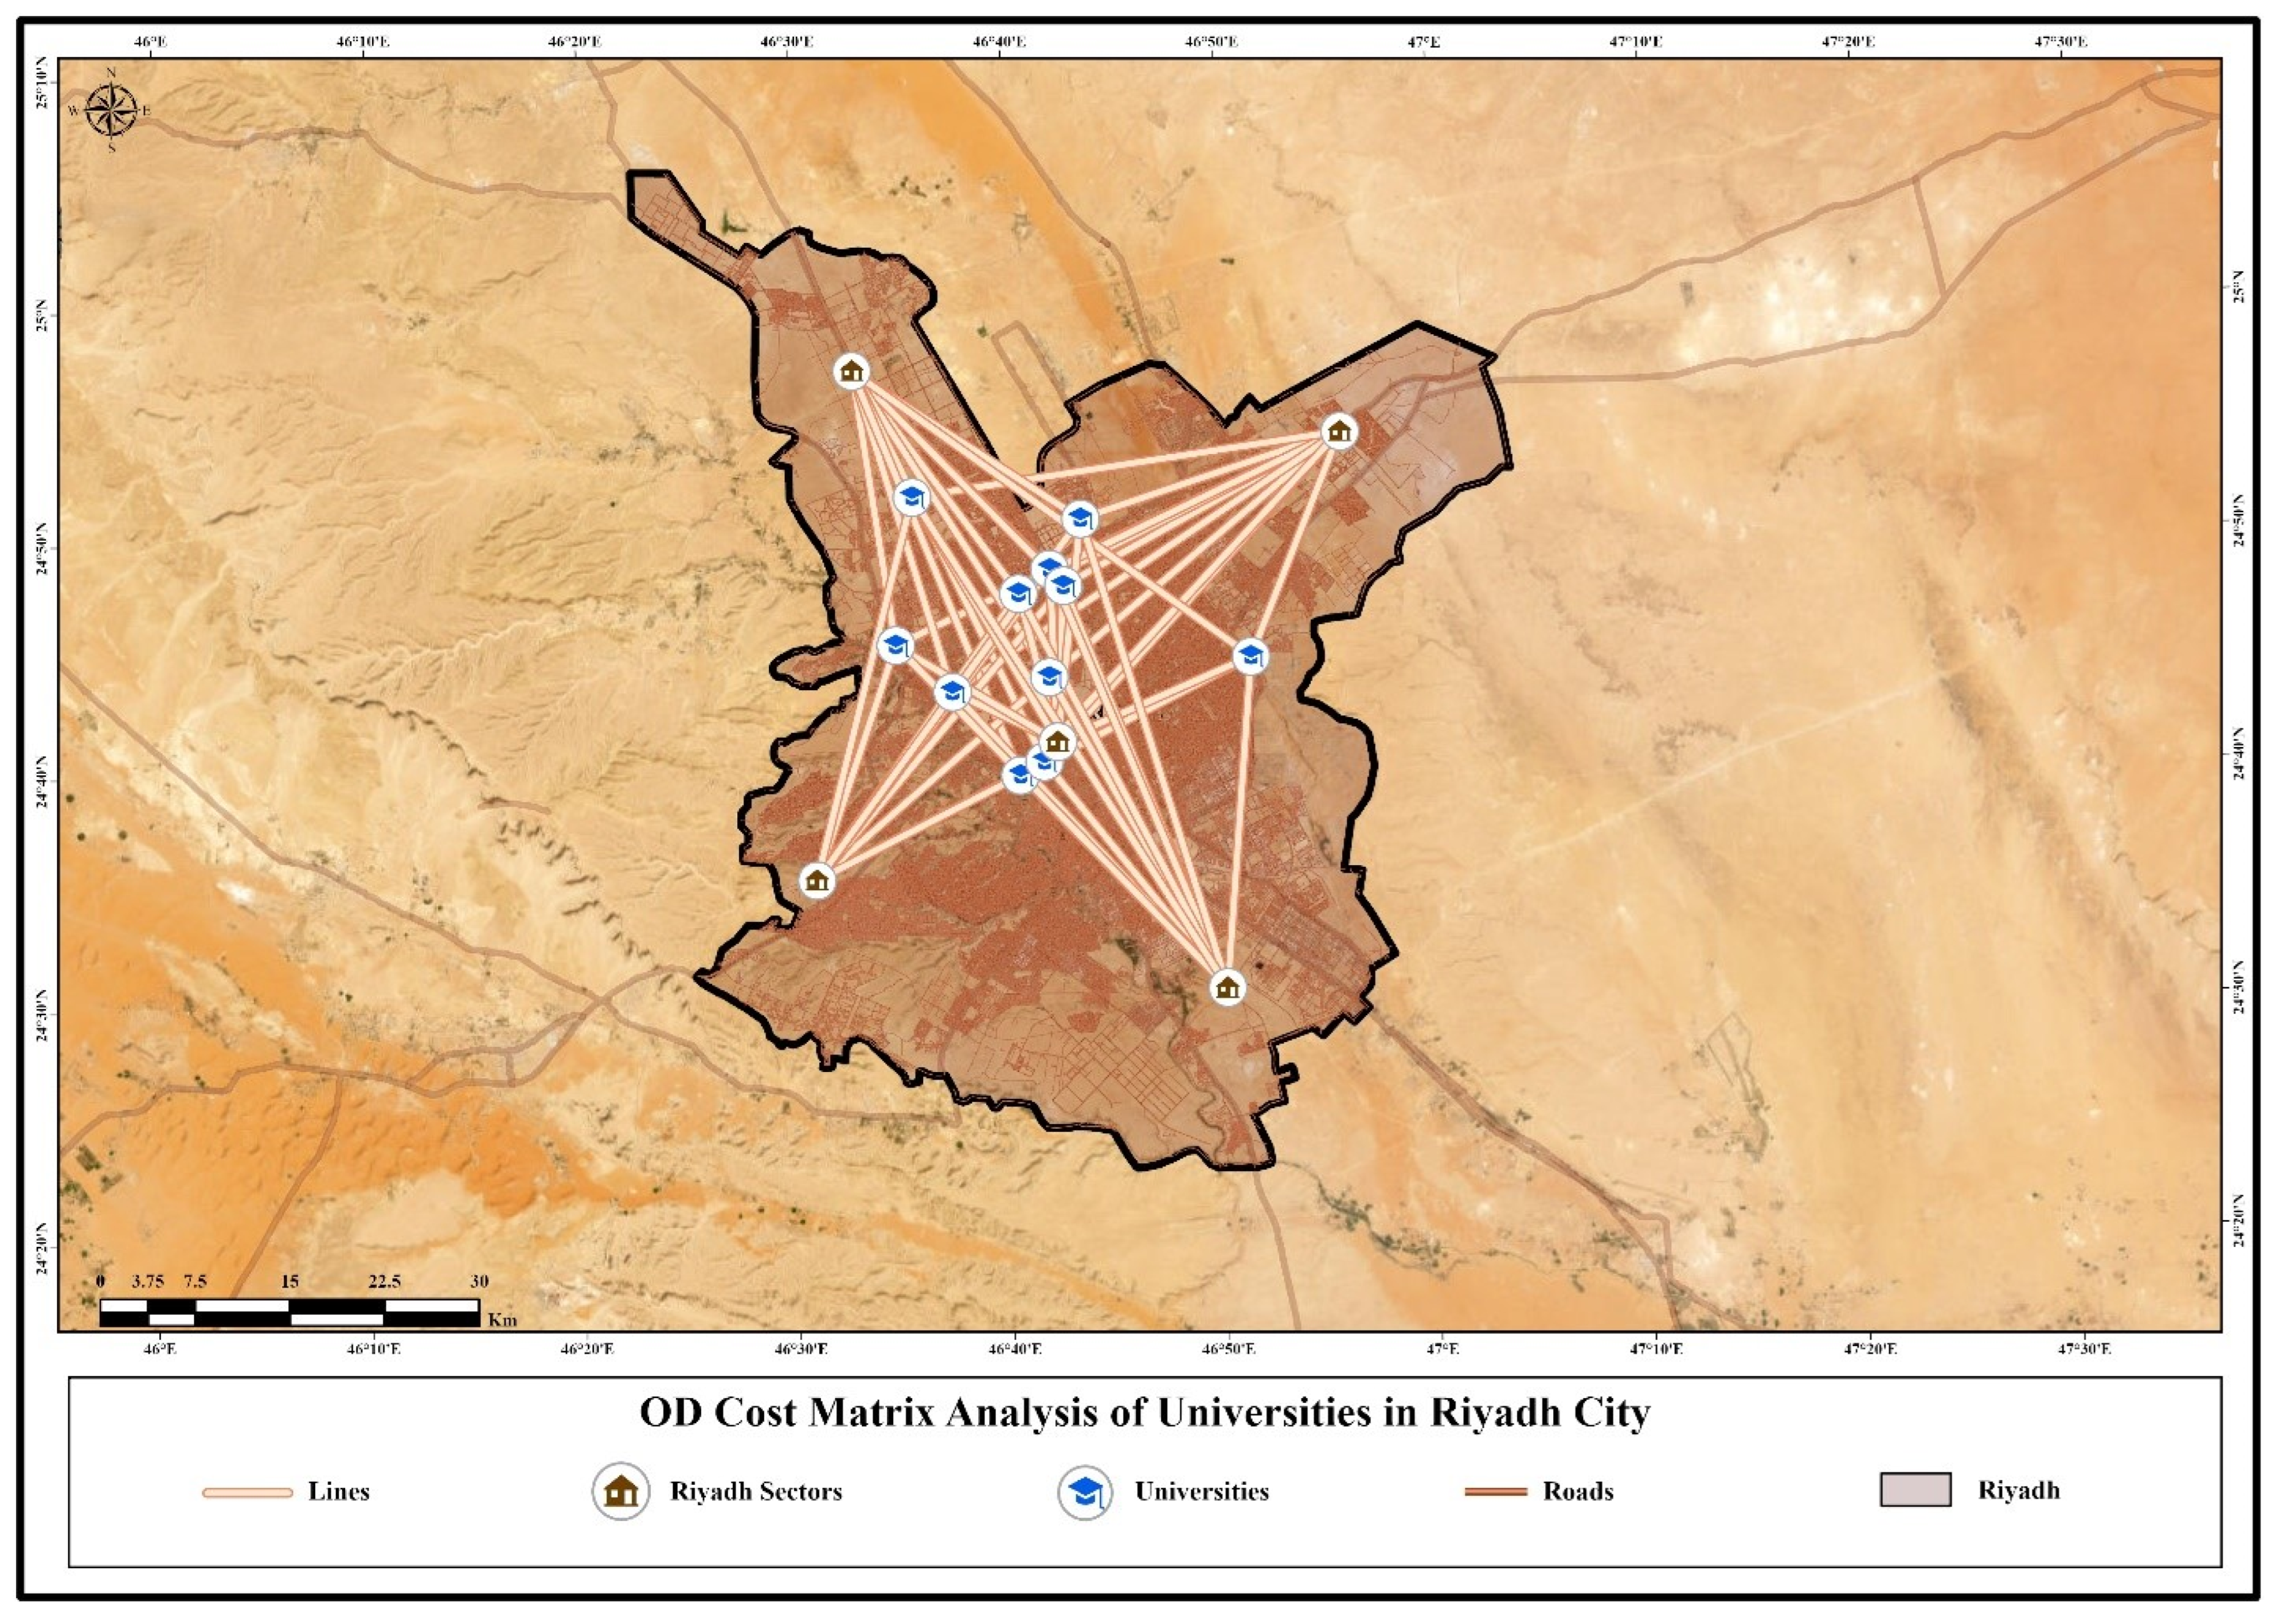
OD cost matrix analysis determines and computes the shortest network path, quantified by distance or time, between various origin points (residential sector centroids) and destination points (universities) [33] Figure 4.
Figure 4.
OD cost matrix analysis of the study area.
Residential sector centroids (n = 5) were defined based on the five officially designated main planning sectors of Riyadh, as formally adopted by the Riyadh Municipality. These macro-level sectors represent the city’s primary spatial structure, encompassing central, intermediate, and peripheral zones, and were selected to ensure comprehensive metropolitan coverage rather than fine-scale neighborhood representation. The selected universities (n = 11) include the major public and governmental higher education institutions officially operating within the city, which constitute the core providers of university-level education and serve extensive catchment areas. This sampling strategy is grounded in official planning classifications and institutional hierarchies, ensuring methodological replicability while effectively capturing spatial variability in accessibility conditions.
The analytical procedure included:
1. Residential sector centroids were designated as origin points (n = 5).
2. University locations were designated as destination points (n = 11).
3. The analysis computed the least-cost path from each origin to each destination along the road network.
4. Results were compiled into a matrix documenting travel time and distance between all origin-destination pairs.
5. For each residential sector, the minimum travel time and distance to the nearest university were extracted for accessibility classification.
This approach provides sector-specific accessibility metrics, enabling precise identification of underserved residential areas [9].
3.4. Accessibility Classification and Spatial Equity Assessment
Accessibility levels were classified into four categories based on travel time and distance thresholds (Table 2), adapted from international accessibility standards [10,34].
Table 2.
Accessibility classification criteria.
Based on the above Table 2, spatial equity was addressed via criteria, e.g., comparing accessibility distributions across sectors and calculating the coefficient of variation to quantify disparity levels [35]. Sectors classified as “Low” or “Very Low” accessibility were identified as underserved areas requiring policy intervention.
3.5. Comparative Analysis and Mapping
Comparative analysis between both distance-based and time-based accessibility measurements was set and conducted to recognize discrepancies attributable to traffic potential accessibility effects. A combined accessibility assessment integrated both metrics to provide a comprehensive evaluation framework. All findings were visualized and figured out through thematic maps shown and created in ArcGIS Pro App, operating and employing standardized cartographic principles to facilitate interpretation.
3.6. Spatial Pattern Analysis Using Average Nearest Neighbor (ANN)
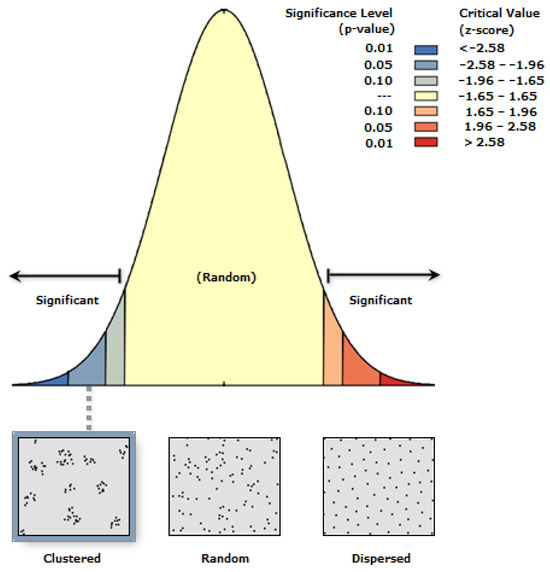
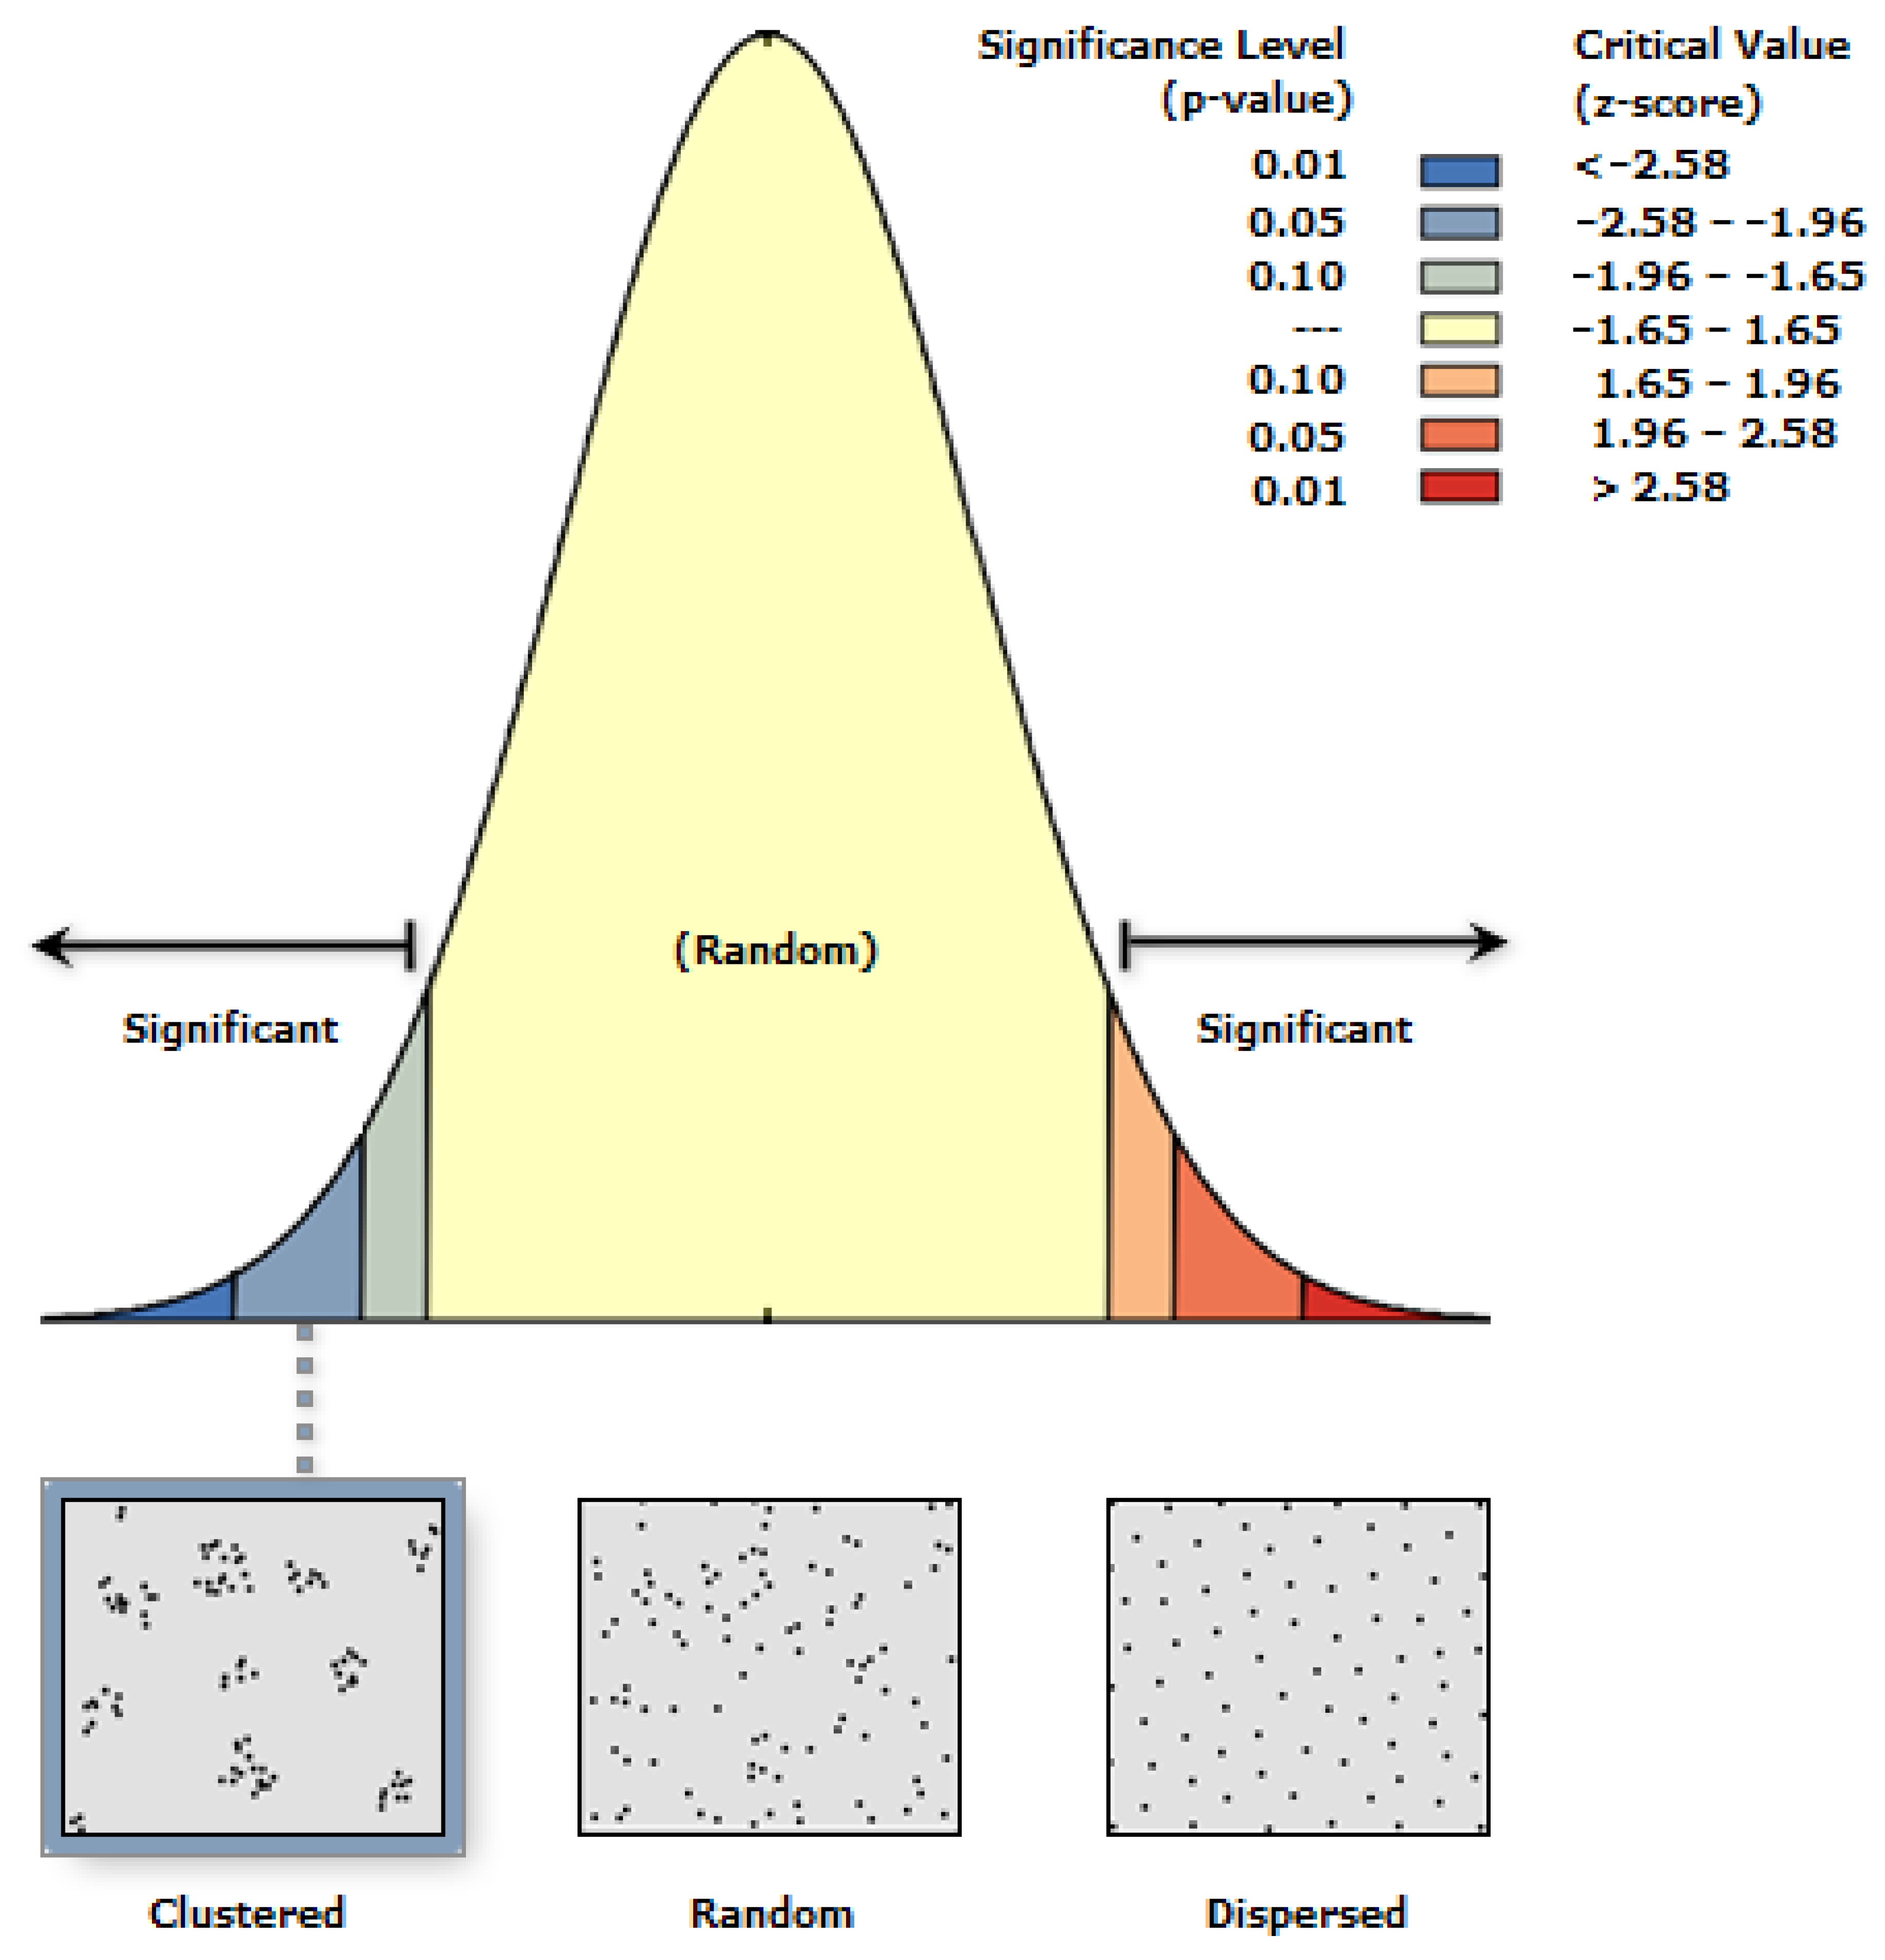
To understand the spatial distribution pattern of universities in Riyadh City, the Average Nearest Neighbor (ANN) statistical technique was used. This method gauges if point features are clustered, random, or dispersed when comparing the observed mean distance each feature has to the nearest neighbor with the expected mean distance in a random spatial distribution Figure 5.
Figure 5.
The ANN index of study area.
The ANN index was calculated based on the ratio of the observed mean distance to the expected mean distance. Such an ANN value less than 1 indicates there is a clustered distribution, values close to 1 suggest randomness, while values greater than 1 indicate dispersion. The Z-score and p-value at a 95% confidence level were used to determine statistical significance. For distance measurement accuracy, the ArcGIS Pro App was used, and the projection of all the datasets on the WGS 1984 UTM Zone 38N coordinate system.
4. Results
4.1. Spatial Distribution of Universities
The examination revealed 11 universities spread across the metropolitan area of Riyadh. A simple spatial profile was provided as follows: the distribution was shown as being clustered with most of its educational institutions in central and northern cities, the number of institutions in peripheral southern, eastern, and western cities was shown to have a much lower density. This uneven distribution is also reflected in the access challenges people encounter throughout the city.
4.2. Service Area Analysis Results
4.2.1. Time-Based Accessibility
As shown in Figure 6, the time-based service area analysis shows that about 19% of the area of Riyadh falls within 10 min travel time from the closest university, which suggests very good accessibility. The major sector zones are primarily central sectors, such as the Central Sector of Riyadh City. Moderate accessibility zones (10–20 min) are about 35% of the city area and are found in intermediate sectors. Importantly, 46% of the population lives in a region where accessibility is generally low to very low (>20 min) and often concentrated in peripheral areas in the south, east, and west.
Figure 6.
Time-based accessibility to the universities of study area.
4.2.2. Distance-Based Accessibility
Distance-based service area analysis, presented in Figure 7, indicated that 34% of the city area lies within 10 km Euclidean distance from universities (high access). This area coverage is more concentrated in the north and center. The 10–20 km moderate accessibility zones represent 38% of the area. Approximately 28% of Riyadh’s urban area lies beyond 20 km from the closest university, denoting low to very low access to that area, and these areas allude to peripheries in a similar manner to time-based analysis, but with the presence of important spatial variations.
Figure 7.
Distance-based accessibility to the university of the study area.
4.3. Comparative Analysis: Time vs. Distance Accessibility
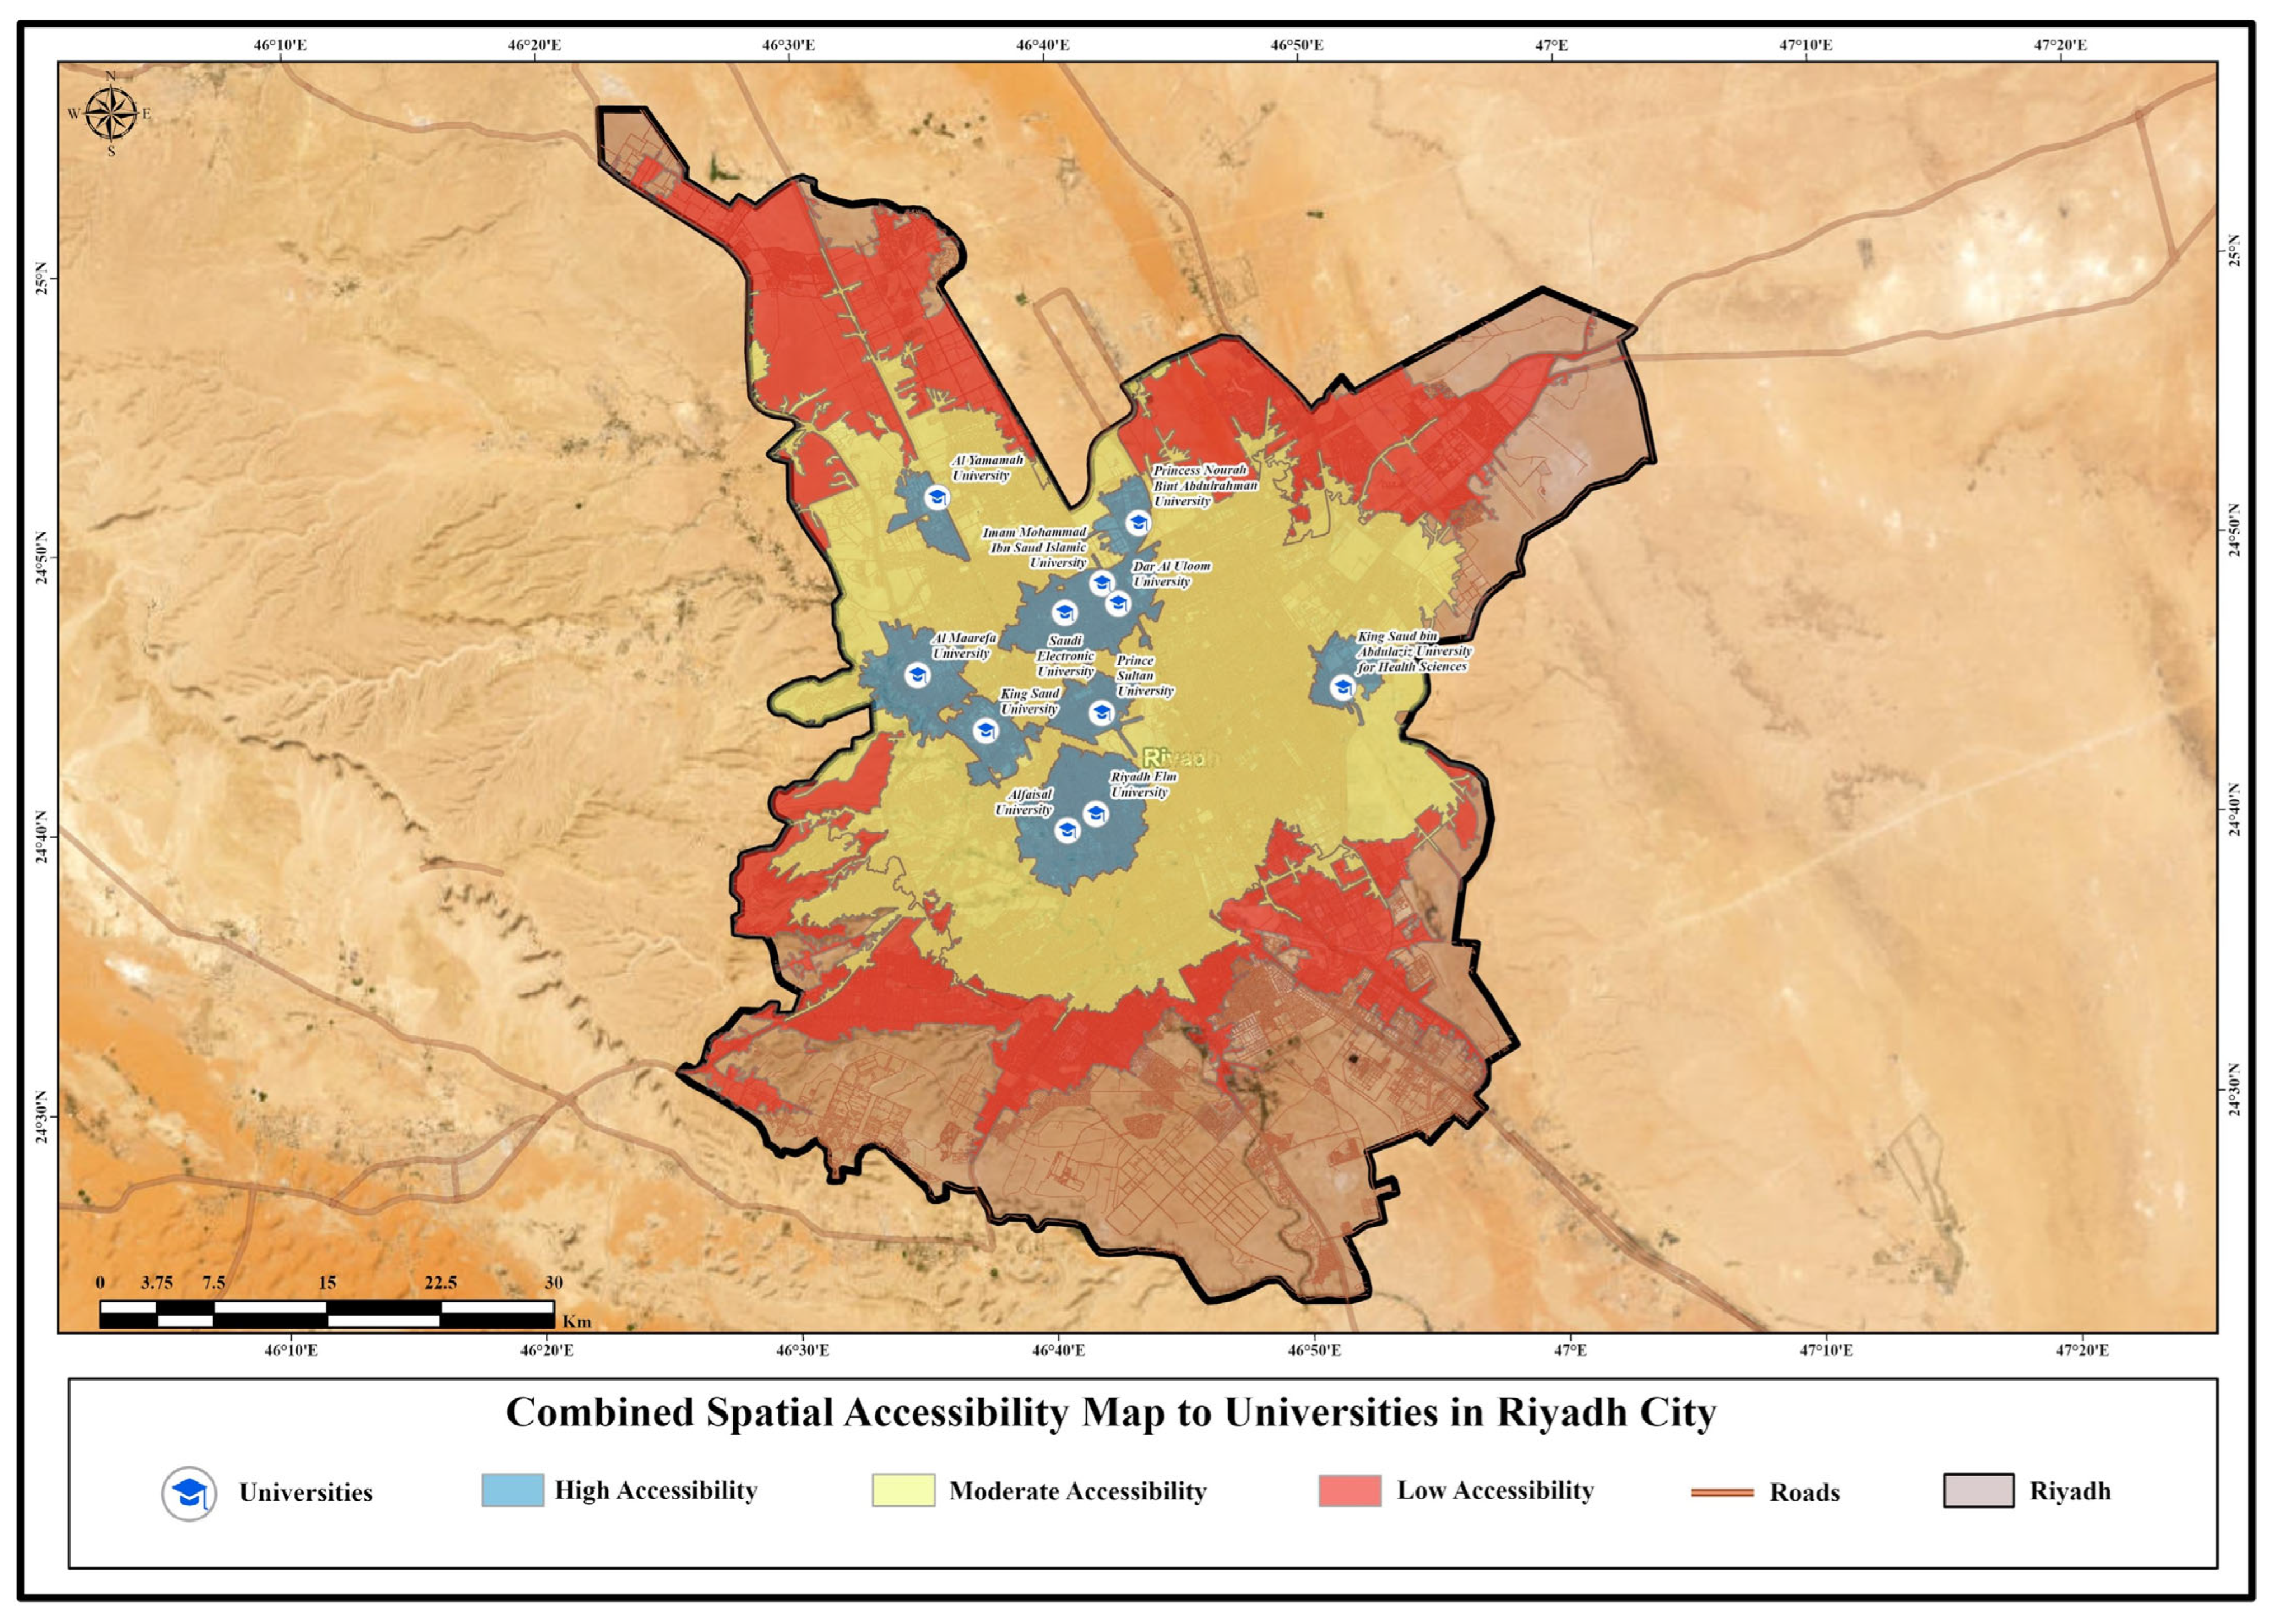
Analysis of accessibility measurements, which used both time- and distance-based, and therefore represented some areas, had significant discrepancies Figure 8―especially in the affected travel time efficiency zone. To this end, when time-based indicators were applied to the number of sectors that were ranked with a distance definition as “high” and “moderate” or “low” accessibility, several such “high” and “moderate” availability domains were lowered to “moderate” or “low” levels based on the use of time-based metrics. This difference in amount, expressed as 60% (some sectors as 50% difference), shows that the speed of movement of the transport in certain sectors was affected a lot by actual accessibility efficiency and network-based travel impedance.
Figure 8.
Combined spatial accessibility map of the study area.
Most significant time-distance discrepancies were found for segments South Sector, Eastern Sector, West Sector and relatively short distances, such as 10–15 km, were associated with road transport times (20–25 min) attributed to travel time efficiency, lack of road capacity, or routing problems caused by network structure, and are often represented by the worst case for road construction. “Approximately 46% of Riyadh’s residential population falls within areas classified as low or very low accessibility to universities.”
4.4. Spatial Equity Assessment
The spatial analysis of the disparities in access by regions on the basis of the coefficient of variation and the Gini coefficient of accessibility distribution, as indicated by the data of Riyadh, revealed large gaps among different sections. This translated as 40% for a coefficient of variation in travel time, indicating interpretation: high spatial inequality. Accessibility was skewed upwards in central regions compared to peripheral areas, leaving much to be desired; thus, creating a concern over equity in higher education access.
In particular, among these, three segments accounting for approximately 46% of the residential population of Riyadh were defined as significantly underserved, categorized according to accessibility criteria as “Low” or “Very Low” in accessibility.
- Southern Riyadh: Sectors including the South Sector of Riyadh City.
- Eastern Riyadh: Sectors including the Eastern Sector of Riyadh City.
- Western Riyadh: Sectors including the West Sector of Riyadh City.
4.5. Statistical Evidence of Spatial Clustering in University Locations
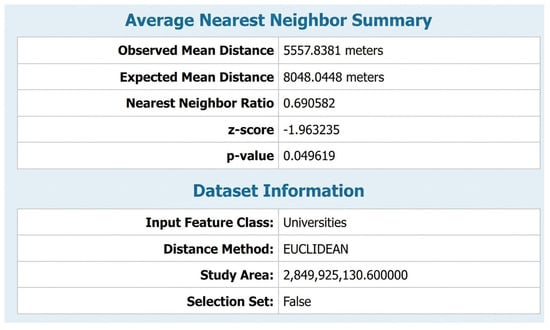
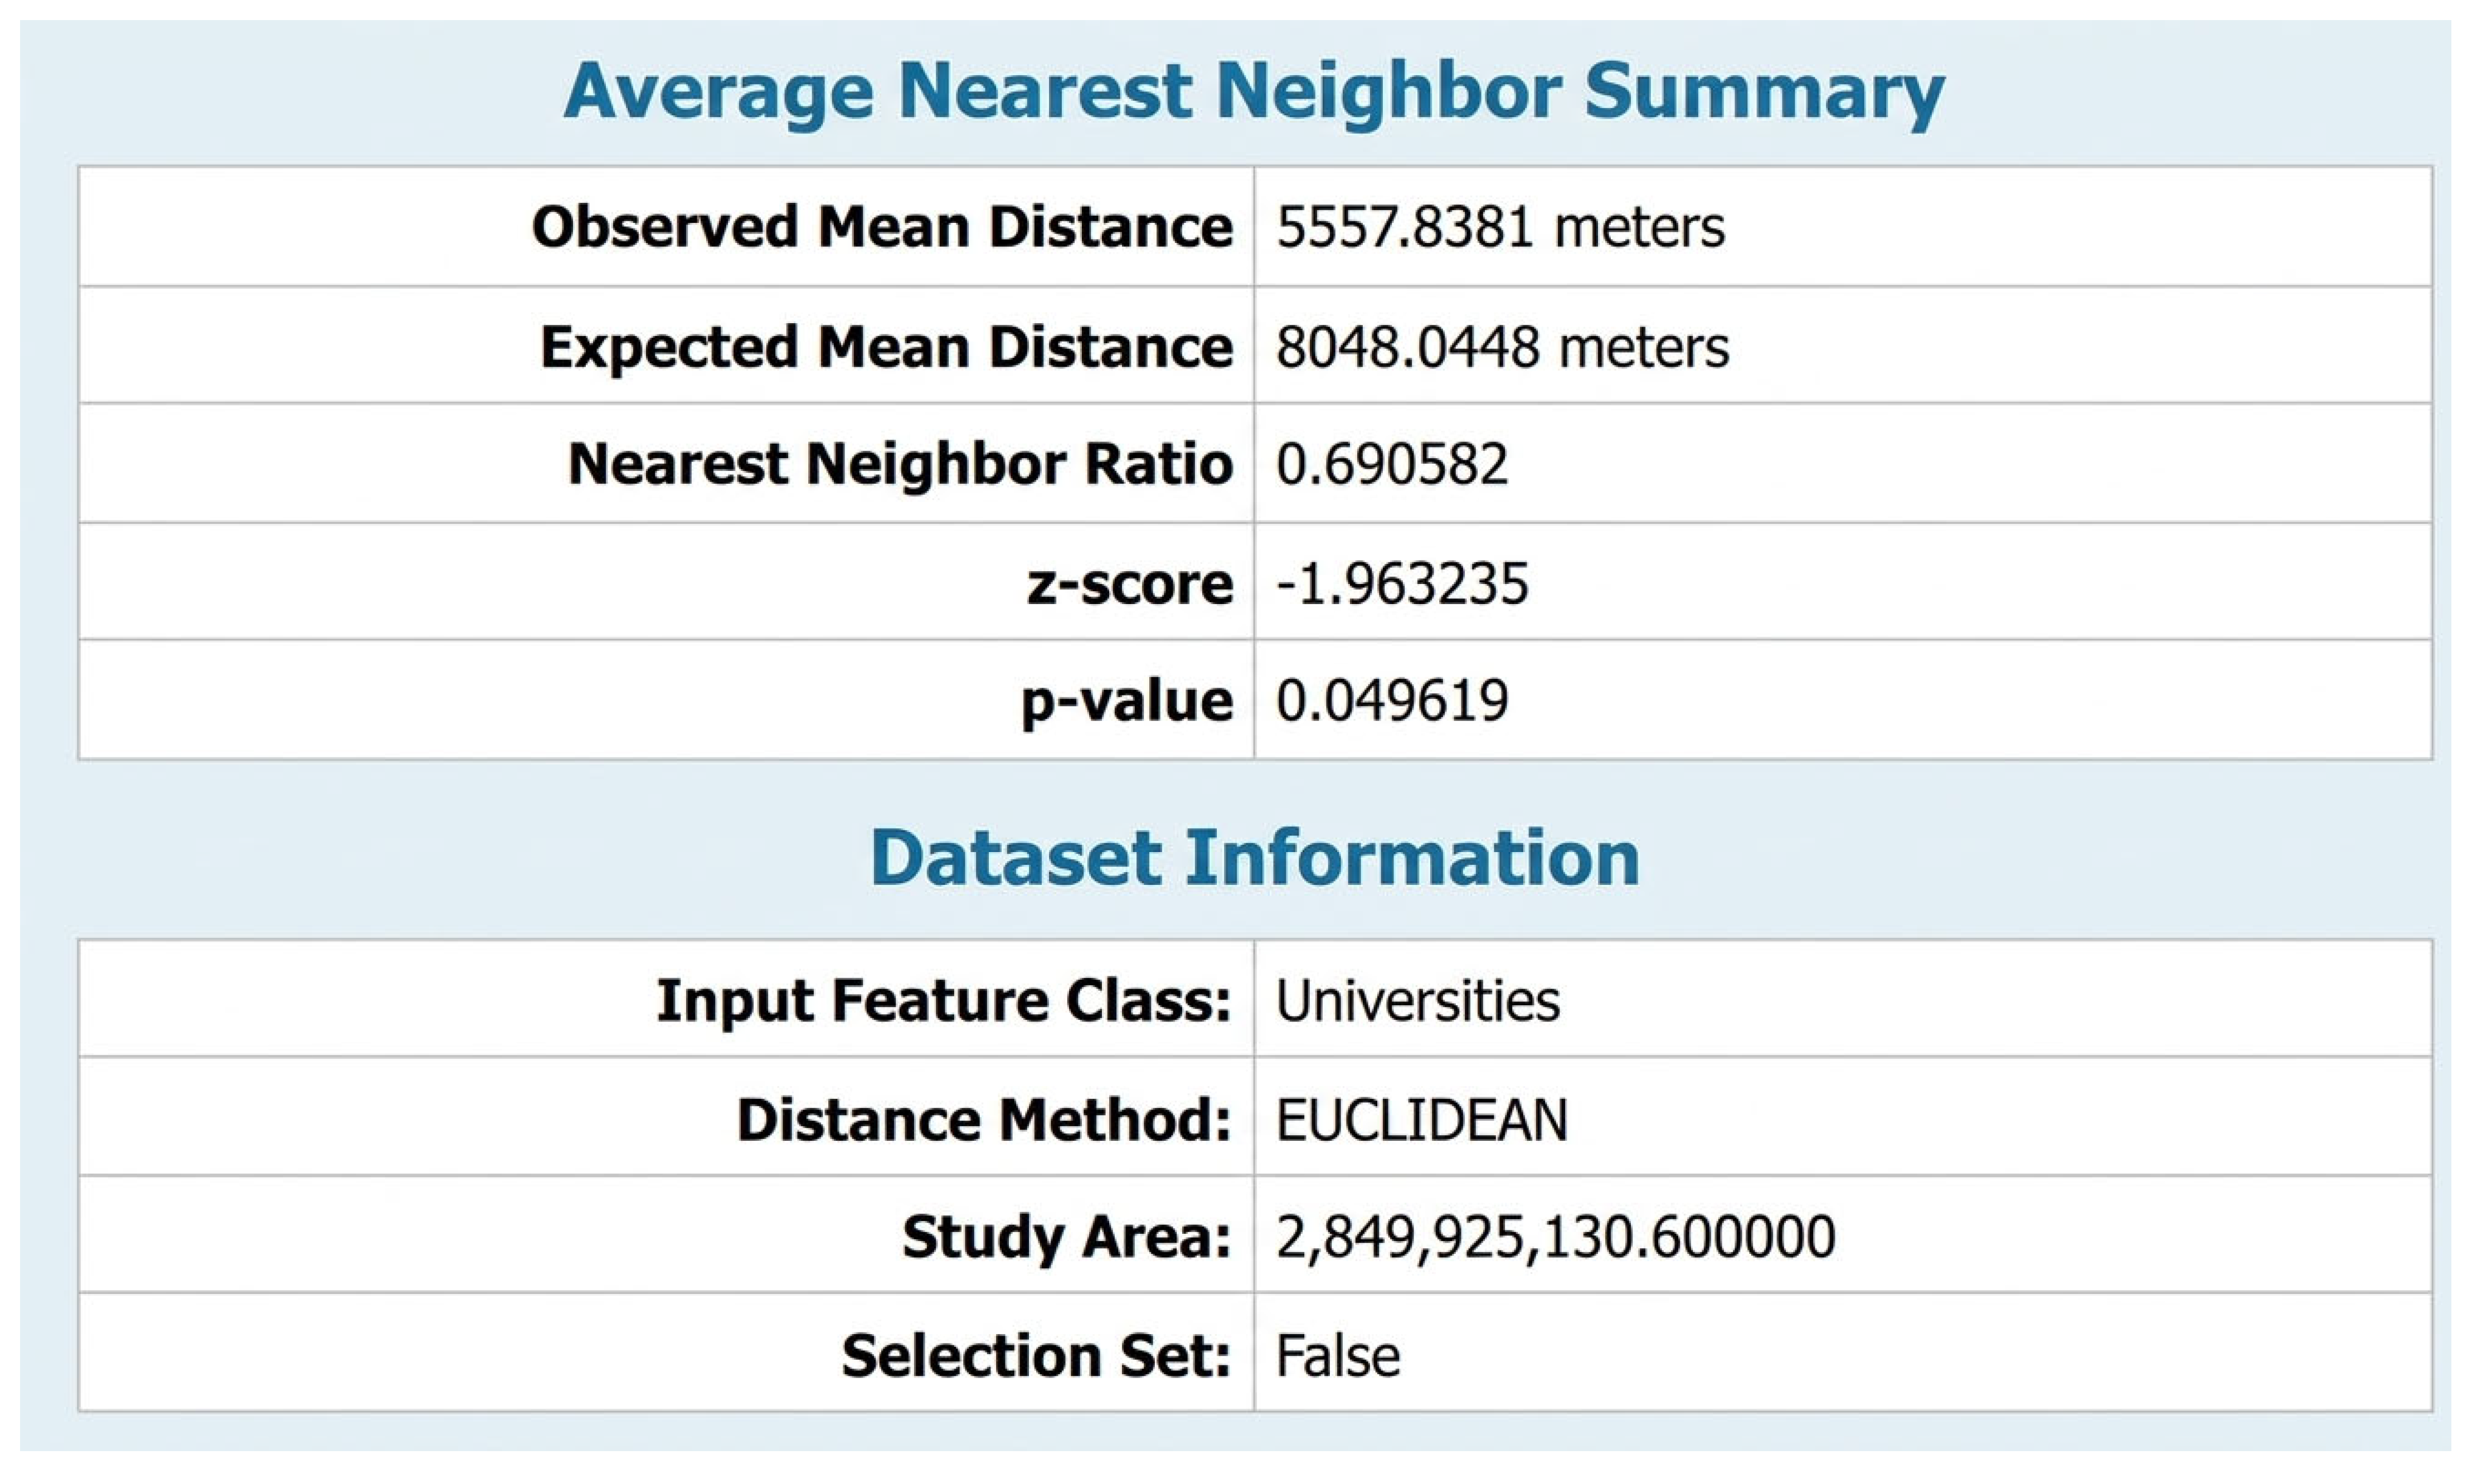
In accordance with the results from the Average Nearest Neighbor (ANN) tests, the observed mean distance from an area was defined as about 5557.8 m (5.56 km) between the university and its nearest neighbor or its nearest neighboring university, which is considerably below the expected mean distance under a random spatial distribution (8048.0 m; 8.05 km).
This means that the calculated Nearest Neighbor Ratio (ANN Index) of 0.69, which is less than unity, signifies a clustered spatial distribution pattern rather than a random or dispersed distribution one. Related statistical measures lend support to this interpretation. The Z-score of −1.96 is at the statistical significance level at the 95% confidence level, and the p-value of 0.0496, lower than 0.05, ensures that the finding of observed clustering is statistically significant and unlikely to have been due to chance. Additionally, the negative Z-score indicates a spatial clustering, versus a spatial dispersion tendency. In practice, this seems to imply that the universities in Riyadh City are not evenly spread out in terms of spatial density, concentrated in the main areas of the city. By comparison, the outer areas (north, south, east, and west) have a lower concentration of universities, which may imply a shortfall in the higher education service coverage.
The significant discrepancy between the observed mean distance (≈5.56 km) and the expected mean distance (≈8.05 km) indicates further evidence of spatial imbalances in the placement of higher educational institutions and the necessity for a more equitable spatial planning of the universities in future positioning.
Although the ANN result is statistically significant at the 95% confidence level, the p-value indicates a borderline level of significance. From a planning perspective, an ANN ratio of 0.69 suggests a clear tendency toward spatial clustering, reflecting historical concentration of universities in central urban zones and underscoring the need for more spatially balanced higher education planning in future development phases Figure 9.
Figure 9.
Average nearest neighbor summary of the study area.
5. Discussion
5.1. Interpretation of Accessibility Patterns
The results very clearly illustrate spatial disparities of university accessibility in Riyadh, which is in line with other fast urbanizing cities everywhere in the world [36,37]. The placement of universities in the core and northern areas follows past development patterns and historical trends and the history of incremental urban development (e.g., increasing density, urbanization). But this model of centralized distribution has increasingly become inefficient with the modern demographics and population growth process, such that peripheral areas experienced a high population growth [38]. The discrepancy of distance-based and time-based accessibility indicators highlights the importance of factoring in the actual travel situation in such distances rather than using Euclidean distance measures [39,40]. Potential accessibility, especially in peak hour commuting times, seriously reduces an accessible design in some corridors, causing “accessibility deserts” despite the relatively short distances. This result is consistent with that of Silalahi et al. [16] and Deliry and Uyguçgil [14], who also reported some similar experiences in accessibility studies in health care.
The findings primarily reflect potential accessibility conditions, emphasizing spatial and network-based constraints rather than actual enrollment behavior. Nevertheless, identifying areas with low potential accessibility remains critical for long-term educational planning, as persistent spatial barriers may translate into reduced participation over time, particularly for peripheral populations.
The observed accessibility disparities are closely linked to Riyadh’s urban structure and road network configuration. Universities are predominantly concentrated in central districts characterized by higher road connectivity and efficient traffic flow, resulting in shorter travel times. In contrast, peripheral residential areas experience lower accessibility due to longer travel distances, limited network connectivity, and the city’s horizontal urban expansion pattern. These findings reflect the influence of transportation infrastructure and functional land-use distribution on higher education accessibility.
5.2. Implications for Spatial Equity
The geographical inequity of university access affects the allocation of academic opportunities for students and raises concerns regarding social justice. People who live in marginalized areas find it hard to get to college, even when they need help (for example, long commutes, high transportation costs, or not enough time).
This is true for those who can afford it. This limited access has a more negative impact on disadvantaged groups and could make existing socio-economic inequalities. Previous studies on spatial accessibility and equity have highlighted how unequal access to services can create a cycle of disadvantage, limiting individuals’ opportunities to access human capital [41,42,43,44] conducted one of the initial studies on intersectionality and location, illustrating how accessibility issues can create a cycle of disadvantage, restricting individuals’ access to human capital as an opportunity. In light of the objectives set forth by Saudi Vision 2030, which emphasize the advancement of the knowledge economy and the enhancement of educational attainment in accordance with ref. [45], it is imperative to address these disparities in accessible opportunities to achieve inclusivity objectives.
5.3. Policy Implications and Planning Recommendations
Because of what the results mean, there are a number of important lessons for Riyadh’s education planning and urban development policy.
5.3.1. Decentralization of University Facilities
The ability to gain access to college campuses or satellite locations within the country, especially in underserved areas of the city (southern, eastern, and western), could be very helpful in closing the gap. Strategically, site selection includes selection for positions taking advantage of coverage of presently underserved populations with a set of future urban growth projections [46]. Applying location-allocation optimization can assist in determining the optimal site that provides the minimum travel distance or time to the aggregate site [47].
5.3.2. Transportation Network Enhancement
Road substructure and public transportation connectivity to existing universities would reduce travel time impediments, mainly in potential accessibility-prone corridors. Another significant opportunity for accessibility is the anticipated Riyadh metro system, which could be developed and enhanced if university locations are strategically integrated with transit nodes [48]. The accessibility of metro stations serving universities can be further improved through mixed-use development and a sustainable urban form [49].
5.3.3. Integration of GIS-Based Accessibility Assessment in Planning Processes
Regular accessibility assessments based on GIS network analysis tools can aid in decision-making based on evidence for educational institution placement in future projects [50], which is how the institutional framework of the Riyadh Municipality-wide planning is established. This follows best practices of international spatial planning and promotes data-driven policy development [51].
5.3.4. Methodological Considerations
Utilizing two GIS network analysis tools, service area analysis, and OD cost matrix, is beneficial to achieve a comprehensive accessibility assessment. In fact, the comparative approach combining distance-based and time-based metrics provides insights not achievable with single-metric analyses [52]. However, a number of limitations need to be recognized. The study made the assumption of uniform patterns of travel and disregarded mode-specific differences (private vehicles vs. public transportation vs. walking) [53]. Future studies need to include multi-modal accessibility assessment and account for temporal differences based upon traffic circumstances [54]. Additionally, spatial accessibility (proximity-based measures) was incorporated solely as a dimension in the research, excluding aspatial factors such as institutional capacity systems (including admission policies) or individual socio-economic limitations [55].
5.3.5. Comparison with Regional Studies
The accessibility gap discussed in this article aligns with trends observed in other Middle Eastern cities. AlQuhtani’s analysis in a study [22] regarding the distribution of elementary schools in Najran, Saudi Arabia, revealed analogous disparities in center-periphery dynamics, indicating that the allocation of educational facilities is not exclusive to this region in the Kingdom but rather indicative of systemic trends. Mansour’s [21] study on healthcare facilities in Riyadh found similar spatial inequities, showing that access challenges apply beyond individual sectors of the service. On an international scale, Tome et al. [26], for example, in the comparison of access to community facilities between medium urban cities in Europe reported similar trends but with less inequality, in general speaking, than that in Riyadh.
Such development challenges seem to make it more difficult to ensure the equity of service distribution in rapidly urbanizing contexts, typical for developing and emerging economies, as they face rapid spatial growth [56].
5.4. Linking the Findings to Saudi Vision 2030
The findings of this study are closely aligned with the objectives of Saudi Vision 2030, particularly those related to human capital development, spatial equity, and sustainable urban planning. The observed disparities in university accessibility—especially in the southern, eastern, and western sectors of Riyadh—highlight structural spatial inequalities that may limit equal access to higher education opportunities. Such disparities could, in turn, affect the development of a skilled and knowledge-based workforce, which represents a core pillar of the national transformation agenda. Improving spatial accessibility to higher education institutions through balanced university distribution, enhanced transport connectivity, and the strategic establishment of new or satellite campuses can support Vision 2030 goals by promoting inclusive growth, reducing regional inequalities, and strengthening the integration between education infrastructure and urban expansion patterns. Therefore, the results of this study provide spatially explicit evidence that can assist policymakers and planners in aligning future higher education investments with national development priorities.
6. Conclusions
A spatial accessibility analysis of universities in Riyadh City was conducted with GIS network analysis tools, which confirmed the significant spatial differences between the universities in accessibility. Accessibility in the central region is highly accessible with travel times below 10 min and distances less than 10 km, whereas the peripheral regions―especially in southern, eastern, and western Riyadh have a significantly lower accessibility with travel times over 20 min and distances beyond 20 km. In contrast to time, distance-based (measured through time series data) analysis shows that the accessibility efficiency is significantly affected by travel time efficiency, and the findings confirm that Euclidean distance alone is insufficient for assessing accessibility efficiency, as travel time is significantly influenced by network configuration and mobility conditions.
The results of the spatial equity evaluation indicated that [number] of underserved areas needed specific strategies to ensure equitable higher education access. The findings provide evidence-based recommendations that may be applicable to education planning and urban city development policies in Riyadh. Recommendations at a minimum of three points are: (1) institution of new university campuses to establish footing in marginal areas; (2) improvement of road infrastructure and public transport connectivity; and (3) revisiting on an ongoing basis to track on a regular basis the extent of the accessibility changes throughout the urban area. This study adds to the GIS-based accessibility analysis literature for educational institutions, particularly for the developing countries in the Middle East. The utilization of the applied methodologies—service area analysis and OD cost matrix methodology—illustrates that the framework can be employed to enhance accessibility in urban settings encountering analogous accessibility issues. Future research could advance this study by integrating multi-modal transportation and the temporal dynamics of movement alongside socio-economic determinants pertinent to actual university utilization.
Lastly, spatial equity in university access is important for fostering inclusive human capital development and reducing social and economic disparities. It will also help the knowledge economy change, which is necessary for sustainable urban development in Saudi Arabia’s Vision 2030.
Author Contributions
A.I.M. conceived the research idea, designed the methodology, performed the GIS network analysis and spatial modeling, processed and analyzed the data, and drafted the manuscript. K.A.A. supervised and enhanced the research, demonstrated most contributions that give pace to the interpretation of results, reviewed and edited the manuscript, and provided academic guidance. All authors have read and agreed to the published version of the manuscript.
Funding
This research was funded by the Deanship of Postgraduate Studies and Scientific Research at Majmaah University, grant number R-2026-100. The Article Processing Charges (APC) were funded by Majmaah University.
Institutional Review Board Statement
Not applicable.
Informed Consent Statement
Not applicable.
Data Availability Statement
The original contributions presented in this study are included in the article. Further inquiries can be directed to the corresponding author.
Acknowledgments
The authors extend appreciation to the Department of Geography at King Saud University for organizing the GIS Day event 2025, during which this work was presented and awarded among the best scientific posters presented at the event by first authors as a Visitor Researcher at King Saud University, and acknowledges the Deanship of Scientific Research at King Saud University for supporting scientific research and publication. Also authors give and extend the appreciation to the Deanship of Postgraduate Studies and Scientific Research at Majmaah University for funding this research work through the project number (R-2026-100), Also we would like to thank the Journal and their staff and reviewers for their expertise and support throughout all aspects of my research paper and their valuable guidance.
Conflicts of Interest
The authors declare no conflicts of interest.
References
- Marginson, S. Higher Education and Public Good. High. Educ. Q. 2011, 65, 411–433. [Google Scholar] [CrossRef] [Scilit]
- Valero, A.; Van Reenen, J. The Economic Impact of Universities: Evidence from Across the Globe. Econ. Educ. Rev. 2019, 68, 53–67. [Google Scholar] [CrossRef] [Scilit]
- Hawley, J.D.; Rork, J.C. The Case of Geographic Accessibility of Higher Education in the U.S. Educ. Econ. 2013, 21, 476–496. [Google Scholar] [CrossRef] [Scilit]
- Gibbons, S.; Vignoles, A. Geography, Choice and Participation in Higher Education in England. Reg. Sci. Urban Econ. 2012, 42, 98–113. [Google Scholar] [CrossRef] [Scilit]
- General Authority for Statistics. Population Estimates in the Midyear of 2022; GASTAT: Riyadh, Saudi Arabia, 2022.
- Saudi Vision 2030. Kingdom of Saudi Arabia. Available online: https://www.vision2030.gov.sa/ (accessed on 10 December 2024).
- Alshuwaikhat, H.M. Strategic Urban Growth and Sustainable Development: The Case of Riyadh. Habitat Int. 2005, 29, 15–139. [Google Scholar]
- Aljoufie, M.; Zuidgeest, M.; Brussel, M.; van Maarseveen, M. Spatial–Temporal Analysis of Urban Growth and Transportation in Jedda City, Saudi Arabia. Cities 2013, 31, 57–68. [Google Scholar] [CrossRef] [Scilit]
- Luo, W.; Wang, F. Measures of Spatial Accessibility to Health Care in a GIS Environment: Synthesis and a Case Study in the Chicago Region. Environ. Plan. B Plan. Des. 2003, 30, 865–884. [Google Scholar] [CrossRef] [Scilit]
- Talen, E.; Anselin, L. Assessing Spatial Equity: An Evaluation of Measures of Accessibility to Public Playgrounds. Environ. Plan. A 1998, 30, 595–613. [Google Scholar] [CrossRef] [Scilit]
- Higgs, G. A Literature Review of the Use of GIS-Based Measures of Access to Health Care Services. Health Serv. Outcomes Res. Methodol. 2004, 5, 119–139. [Google Scholar] [CrossRef] [Scilit]
- Páez, A.; Scott, D.M.; Morency, C. Measuring Accessibility: Positive and Normative Implementations of Various Accessibility Indicators. J. Transp. Geogr. 2012, 25, 141–153. [Google Scholar] [CrossRef] [Scilit]
- Liu, S.; Zhu, X. Accessibility Analyst: An Integrated GIS Tool for Accessibility Analysis in Urban Transportation Planning. Environ. Plan. B Plan. Des. 2004, 31, 105–124. [Google Scholar] [CrossRef] [Scilit]
- Deliry, S.I.; Uyguçgil, H. Accessibility Assessment of Urban Public Services Using GIS-Based Network Analysis: A Case Study in Eskişehir, Türkiye. GeoJournal 2023, 88, 4805–4825. [Google Scholar] [CrossRef] [Scilit]
- Guagliardo, M.F. Spatial Accessibility of Primary Care: Concepts, Methods and Challenges. Int. J. Health Geogr. 2004, 3, 3. [Google Scholar] [CrossRef] [Scilit] [PubMed]
- Silalahi, F.E.S.; Hidayat, F.; Dewi, R.S.; Purwono, N.; Oktaviani, N. GIS-Based Approaches on the Accessibility of Referral Hospital Using Network Analysis and the Spatial Distribution Model of the Spreading Case of COVID-19 in Jakarta, Indonesia. BMC Health Serv. Res. 2020, 20, 1053. [Google Scholar] [CrossRef] [Scilit]
- Smoyer-Tomic, K.E.; Hewko, J.N.; Hodgson, M.J. Spatial Accessibility and Equity of Playgrounds in Edmonton, Canada. Can. Geogr. 2004, 48, 287–302. [Google Scholar] [CrossRef] [Scilit]
- Wolff, M. Taking One Step Further—Advancing the Measurement of Green and Blue Area Accessibility Using Spatial Network Analysis. Ecol. Indic. 2021, 126, 107665. [Google Scholar] [CrossRef] [Scilit]
- Talen, E. School, Community, and Spatial Equity: An Empirical Investigation of Access to Elementary Schools in West Virginia. Ann. Assoc. Am. Geogr. 2001, 91, 465–486. [Google Scholar] [CrossRef] [Scilit]
- Geurs, K.T.; van Wee, B. Accessibility Evaluation of Land-Use and Transport Strategies: Review and Research Directions. J. Transp. Geogr. 2004, 12, 127–140. [Google Scholar] [CrossRef] [Scilit]
- Mansour, S. Spatial Analysis of Public Health Facilities in Riyadh Governorate, Saudi Arabia: A GIS-Based Study to Assess Geographic Variations of Service Provision and Accessibility. Geo-Spat. Inf. Sci. 2016, 19, 26–38. [Google Scholar] [CrossRef] [Scilit]
- AlQuhtani, S. Spatial Distribution of Public Elementary Schools: A Case Study of Najran, Saudi Arabia. J. Asian Archit. Build. Eng. 2023, 22, 705–725. [Google Scholar] [CrossRef] [Scilit]
- Penchansky, R.; Thomas, J.W. The Concept of Access: Definition and Relationship to Consumer Satisfaction. Med. Care 1981, 19, 127–140. [Google Scholar] [CrossRef] [Scilit]
- Neutens, T. Accessibility, Equity and Health Care: Review and Research Directions for Transport Geographers. J. Transp. Geogr. 2015, 43, 14–27. [Google Scholar] [CrossRef] [Scilit]
- Aljoufie, M. The Impact Assessment of Increasing Population Density on Jeddah Road Transportation Using Spatial-Temporal Analysis. Sustainability 2021, 13, 1455. [Google Scholar] [CrossRef] [Scilit]
- Tome, A.; Santos, B.; Carvalheira, C. GIS-Based Transport Accessibility Analysis to Community Facilities in Mid-Sized Cities. IOP Conf. Ser. Mater. Sci. Eng. 2019, 471, 062034. [Google Scholar] [CrossRef] [Scilit]
- Apparicio, P.; Abdelmajid, M.; Riva, M.; Shearmur, R. Comparing Alternative Approaches to Measuring the Geographical Accessibility of Urban Health Services: Distance Types and Aggregation-Error Issues. Int. J. Health Geogr. 2008, 7, 7. [Google Scholar] [CrossRef] [Scilit] [PubMed]
- Zhang, X.; Lu, H.; Holt, J.B. Modeling Spatial Accessibility to Parks: A National Study. Int. J. Health Geogr. 2011, 10, 31. [Google Scholar] [CrossRef] [Scilit] [PubMed]
- O’Sullivan, D.; Morrison, A.; Shearer, J. Using Desktop GIS for the Investigation of Accessibility by Public Transport: An Isochrone Approach. Int. J. Geogr. Inf. Sci. 2000, 14, 85–104. [Google Scholar] [CrossRef] [Scilit]
- Horner, M.W. Exploring Metropolitan Accessibility and Urban Structure. Urban Geogr. 2004, 25, 264–284. [Google Scholar] [CrossRef] [Scilit]
- Langford, M.; Higgs, G.; Fry, R. Multi-Modal Two-Step Floating Catchment Area Analysis of Primary Health Care Accessibility. Health Place 2016, 38, 70–81. [Google Scholar] [CrossRef] [Scilit]
- Mokhtarian, P.L.; Chen, C. TTB or Not TTB, That Is the Question: A Review and Analysis of the Empirical Literature on Travel Time (and Money) Budgets. Transp. Res. Part A Policy Pract. 2004, 38, 643–675. [Google Scholar] [CrossRef] [Scilit]
- Geertman, S.C.M.; Van Eck, J.R.R. GIS and Models of Accessibility Potential: An Application in Planning. Int. J. Geogr. Inf. Syst. 1995, 9, 67–80. [Google Scholar] [CrossRef] [Scilit]
- Rosero-Bixby, L. Spatial Access to Health Care in Costa Rica and Its Equity: A GIS-Based Study. Soc. Sci. Med. 2004, 58, 1271–1284. [Google Scholar] [CrossRef] [Scilit] [PubMed]
- Hewko, J.; Smoyer-Tomic, K.E.; Hodgson, M.J. Measuring Neighbourhood Spatial Accessibility to Urban Amenities: Does Aggregation Error Matter? Environ. Plan. A 2002, 34, 1185–1206. [Google Scholar] [CrossRef] [Scilit]
- Gu, W.; Wang, X.; McGregor, S.E. Optimization of Preventive Health Care Facility Locations. Int. J. Health Geogr. 2010, 9, 17. [Google Scholar] [CrossRef] [Scilit]
- Luo, W.; Qi, Y. An Enhanced Two-Step Floating Catchment Area (E2SFCA) Method for Measuring Spatial Accessibility to Primary Care Physicians. Health Place 2009, 15, 1100–1107. [Google Scholar] [CrossRef] [Scilit] [PubMed]
- Alshuwaikhat, H.M.; Aina, Y.A. GIS-Based Urban Sustainability Assessment: The Case of Dammam City, Saudi Arabia. Local Environ. 2006, 11, 141–162. [Google Scholar] [CrossRef] [Scilit]
- Boisjoly, G.; El-Geneidy, A.M. How to Get There? A Critical Assessment of Accessibility Objectives and Indicators in Metropolitan Transportation Plans. Transp. Policy 2017, 55, 38–50. [Google Scholar] [CrossRef] [Scilit]
- Chen, A.; Yang, C.; Kongsomsaksakul, S.; Lee, M. Network-Based Accessibility Measures for Vulnerability Analysis of Degradable Transportation Networks. Netw. Spat. Econ. 2007, 7, 241–256. [Google Scholar] [CrossRef] [Scilit]
- Talen, E. The Social Equity of Urban Service Distribution: An Exploration of Park Access in Pueblo, Colorado, and Macon, Georgia. Urban Geogr. 1997, 18, 521–541. [Google Scholar] [CrossRef] [Scilit]
- Tsou, K.-W.; Hung, Y.-T.; Chang, Y.-L. An Accessibility-Based Integrated Measure of Relative Spatial Equity in Urban Public Facilities. Cities 2005, 22, 424–435. [Google Scholar] [CrossRef] [Scilit]
- Lucas, K. Transport and Social Exclusion: Where Are We Now? Transp. Policy 2012, 20, 105–113. [Google Scholar] [CrossRef] [Scilit]
- Hansen, W.G. How Accessibility Shapes Land Use. J. Am. Inst. Plan. 1959, 25, 73–76. [Google Scholar] [CrossRef] [Scilit]
- Alamri, M.M. Higher Education in Saudi Arabia. J. High. Educ. Theory Pract. 2011, 11, 88–91. [Google Scholar]
- Church, R.; ReVelle, C. The Maximal Covering Location Problem. Pap. Reg. Sci. 1974, 32, 101–118. [Google Scholar] [CrossRef] [Scilit]
- Teixeira, J.C.; Antunes, A.P. A Hierarchical Location Model for Public Facility Planning. Eur. J. Oper. Res. 2008, 185, 92–104. [Google Scholar] [CrossRef] [Scilit]
- Royal Commission for Riyadh City. Riyadh Metro Project. Available online: https://www.rcrc.gov.sa/en/projects/riyadh-metro (accessed on 10 December 2024).
- Cervero, R.; Kockelman, K. Travel Demand and the 3Ds: Density, Diversity, and Design. Transp. Res. Part D Transp. Environ. 1997, 2, 199–219. [Google Scholar] [CrossRef] [Scilit]
- Maantay, J.A.; Maroko, A.R. Mapping Urban Risk: Flood Hazards, Race, and Environmental Justice in New York. Appl. Geogr. 2009, 29, 111–124. [Google Scholar] [CrossRef] [Scilit]
- Klosterman, R.E. Planning Support Systems: A New Perspective on Computer-Aided Planning. J. Plan. Educ. Res. 1997, 17, 45–54. [Google Scholar] [CrossRef] [Scilit]
- Kwan, M.-P.; Murray, A.T.; O’Kelly, M.E.; Tiefelsdorf, M. Recent Advances in Accessibility Research: Representation, Methodology and Applications. J. Geogr. Syst. 2003, 5, 129–138. [Google Scholar] [CrossRef] [Scilit]
- Mavoa, S.; Witten, K.; McCreanor, T.; O’Sullivan, D. GIS Based Destination Accessibility via Public Transit and Walking in Auckland, New Zealand. J. Transp. Geogr. 2012, 20, 15–22. [Google Scholar] [CrossRef] [Scilit]
- Salonen, M.; Toivonen, T. Modelling Travel Time in Urban Networks: Comparable Measures for Private Car and Public Transport. J. Transp. Geogr. 2013, 31, 143–153. [Google Scholar] [CrossRef] [Scilit]
- Khan, A.A. An Integrated Approach to Measuring Potential Spatial Access to Health Care Services. Socio-Econ. Plan. Sci. 1992, 26, 275–287. [Google Scholar] [CrossRef] [Scilit]
- Banister, D. The Sustainable Mobility Paradigm. Transp. Policy 2008, 15, 73–80. [Google Scholar] [CrossRef] [Scilit]

Disclaimer/Publisher’s Note: The statements, opinions and data contained in all publications are solely those of the individual author(s) and contributor(s) and not of MDPI and/or the editor(s). MDPI and/or the editor(s) disclaim responsibility for any injury to people or property resulting from any ideas, methods, instructions or products referred to in the content. |
© 2026 by the authors. Licensee MDPI, Basel, Switzerland. This article is an open access article distributed under the terms and conditions of the Creative Commons Attribution (CC BY) license.