


Abstract
The relationship between humans and the land has always been a topic in geographical studies. Northeast China, one of the regions with the shortest history in China, is also one of the regions most representative of changes in human–land relationships. However, scholars have rarely conducted quantitative region-scale research on the dynamic changes in, and drivers of, human–land relationships in this region. This study utilizes Landsat remote sensing imagery to identify changes in the distribution of land use types in Northeast China from 1990 to 2022. By constructing a human–land coordination model, it measures the intensity of human activity and levels of human–land coordination, analyzes their spatiotemporal dynamic characteristics, and further uses the Geodetector model to explore the factors driving and interactions influencing this evolution. (1) The results show that, from 1990 to 2022, the level of human–land coordination in Northeast China generally exhibited a spatial distribution pattern decreasing from northwest to southeast. The area of imbalanced human–land relationships continuously decreased, while coordinated areas steadily increased, indicating gradual improvement in human–land relations. The predominant type of coordination was moderate imbalance, with high imbalance as a secondary level. (2) The results also demonstrate that population size, GDP, and tertiary industry output have significant explanatory power regarding levels of human–land coordination. The importance of economic development level, natural resource endowment, and natural environmental characteristics to the evolution of human–land has progressively increased.
1. Introduction
The relationship between humans and the land they inhabit is an important issue that has become a frontier field in Earth system research [1] and a core topic in geography and ecology. Against the background of human social development and global change, the coexistence of humans and nature is not only at the core of human development [2] but is an essential requirement of Chinese-style modernization [3]. Exploring the patterns that underpin this relationship is of great significance for the rational utilization and protection of natural resources, alleviating human–land conflicts, and promoting coordinated sustainable development [4,5,6]. The development of Northeast China has a relatively short history, but this region occupies a strategic position that is important in terms of national ecological security and socioeconomic development. However, the region faces issues such as black soil erosion, the decline of the ecological function of forests, grassland degradation, desertification, and salinization, as well as developmental challenges like urban structure distortion caused by population growth and rapid urbanization [7] and imbalances regarding the proportions of heavy/light industry and agriculture [8]. This makes it a region with prominent and complex human–land conflicts. In recent years, with the advancement of the Beautiful China initiative and efforts to construct an ecological civilization, as well as the development concept that “lucid waters and lush mountains are invaluable assets” [9], investing in the spatiotemporal evolution of human–land relationships in Northeast China is of significant importance for environmental protection and high-quality development [10].
The formation of spatiotemporal patterns in human–land relationships in Northeast China results from the dynamic interplay between the region’s unique natural geographical foundations and long-term socioeconomic activities [11,12,13]. As an area critical to national grain production, an ecological security barrier, and a traditional industrial agglomeration zone in China, this region displays traits of complexity, sensitivity, and phased development in its human-land interaction systems [14]. While substantial research exploring these topics has been conducted, particularly focusing on carbon accounting for the use of cultivated land, agricultural modernization levels, urbanization, and ecosystem services, existing studies reveal significant limitations. Existing research predominantly relies on static evaluation frameworks based on single time slices [15] or short-term sequential data [16], and thus lacks systematic analyses of long-term spatiotemporal evolution patterns across extended time periods [17]. Commonly applied methodological approaches, including coupling coordination degree models [18], regression analysis, and basic spatial comparative analyses [19], are often insufficient to uncover the deep-seated mechanisms governing changes in human-land systems. Furthermore, most studies mechanically isolate coordination evaluation from driving force analysis, and few adopt quantitative tools such as the Geodetector to measure the explanatory power of and intertwined relationships between influencing factors; consequently, these studies fail to comprehensively interpret the complex nonlinear feedback mechanisms inherent to human-land systems [20,21]. To address these gaps, this study adopts a human–land coordination model and the Geodetector to identify spatiotemporal patterns and influencing factors, while proposing targeted recommendations for the improvement of sustainable development in the region. Research Objectives: (1) to analyze the dynamic characteristics and evolutionary trends of land use types in Northeast China from 1990 to 2022; (2) to investigate the patterns of human–land relationships in the region; and (3) to identify the key drivers influencing human–land relationships and evaluate their interactions.
This study provides insights critical to enhancing regional environmental awareness, improving disaster response capabilities, and promoting sustainable development.
2. Overview of the Study Area and Research Methods
2.1. Overview of the Study Area
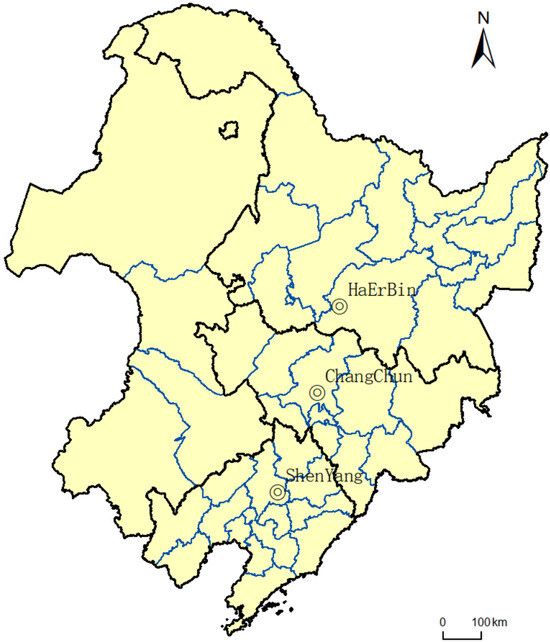
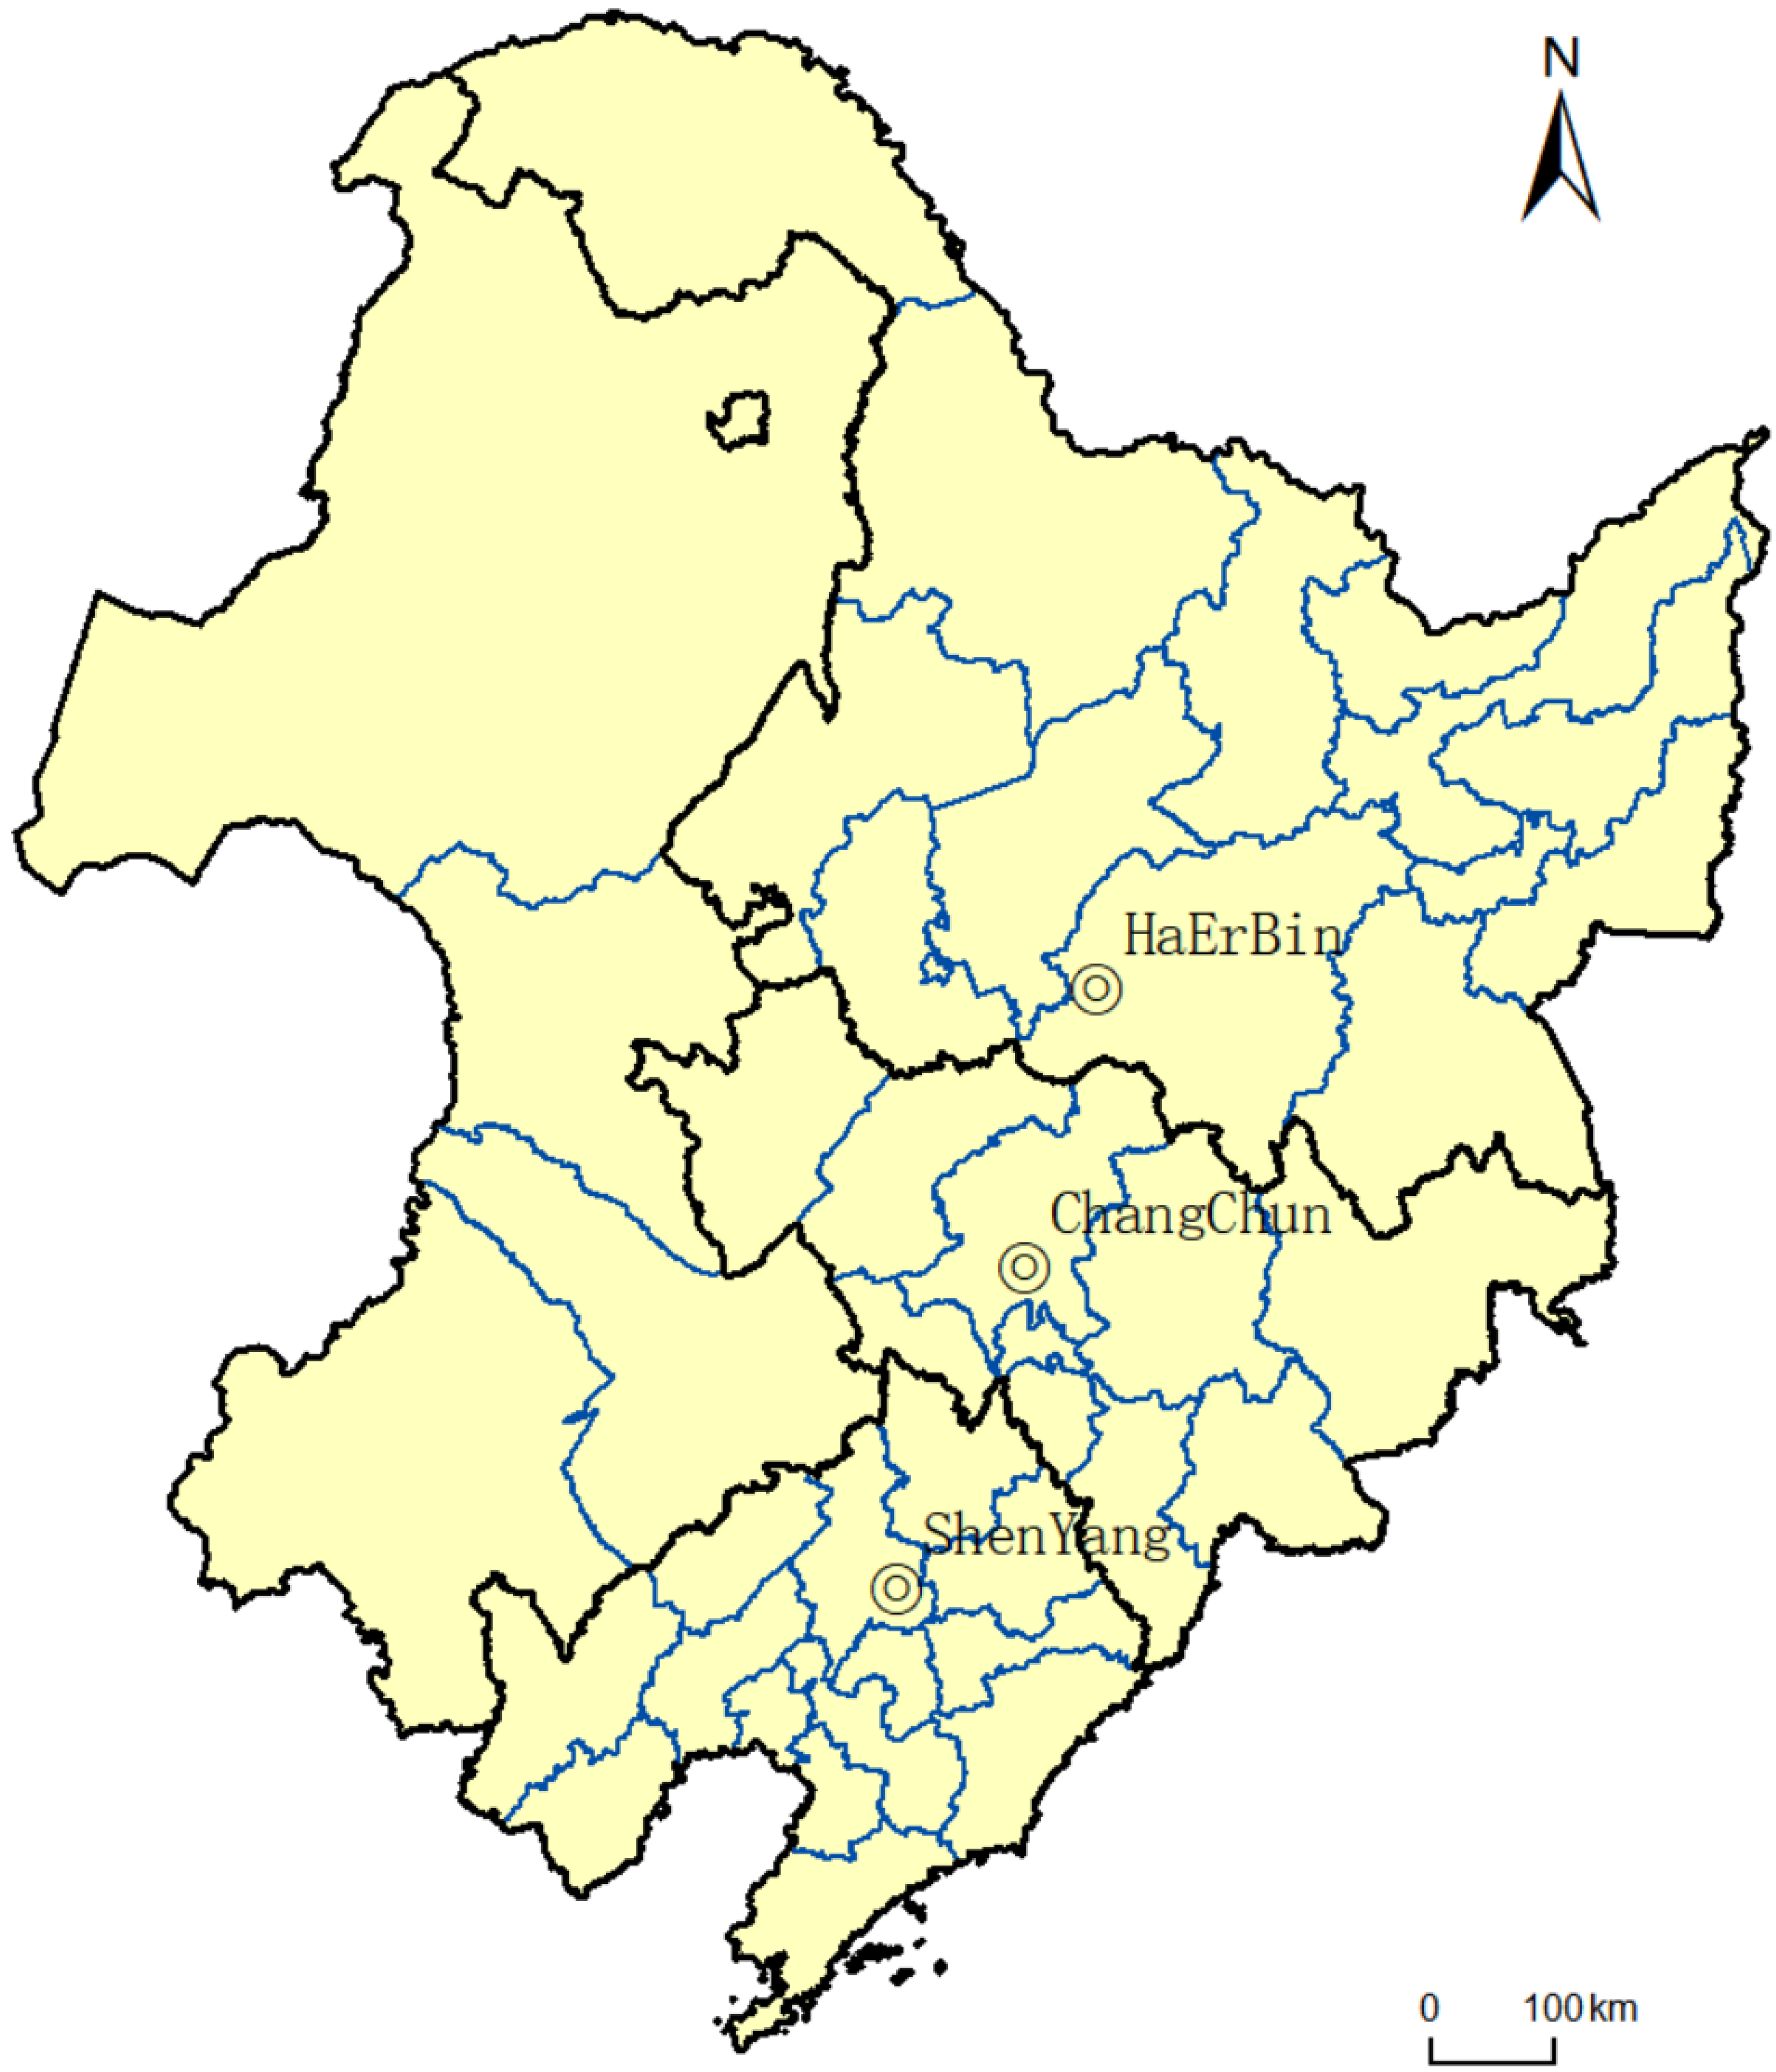
The Northeast region comprises Liaoning Province, Jilin Province, Heilongjiang Province and the four eastern leagues of the Inner Mongolia Autonomous Region (Figure 1) [22], comprising 40 prefecture-level administrative divisions [23]. Geographically, it spans 112° E to 140° E and 40° N to 55° N, stretching 1300 km east–west and 1400 km north–south, covering a total area of approximately 1.45 million square kilometers [24]. The region transitions through cold temperate, mid-temperate, and warm temperate zones, with its terrain divided from east to west into humid, semi-humid, and semi-arid zones. Its fertile soils and abundant resources [25] contribute to a distinctive geographical distribution pattern, featuring the Inner Mongolia Plateau, Greater Khingan Range, Northeast Plain, Lesser Khingan Range, Changbai Mountains, and Liaodong Hills.
Figure 1.
Map of Northeast China.
Northeast China is a vital industrial hub [26], with the region’s economy relying predominantly on heavy industry, encompassing sectors such as steel, machinery, chemicals, and automotive manufacturing. It is the region with the highest grain [27] production in the country, with crops primarily grown in a single-harvest system. Major cultivated crops also include corn, rice, peanuts, wheat, and soybeans.
2.2. Data Sources
The core datasets comprise eight-year land zoning for Northeast China (1990–2022), comprehensive socioeconomic indicators covering key resources (annual precipitation, water availability, arable land, and built-up area), and socioeconomic metrics (population size, GDP, urbanization rate, fiscal revenue, and the output values of primary, secondary, and tertiary industries) within the study area. The land use data were sourced from interpretations of remote sensing image data of the Landsat TM/ETM dataset at the Resource and Environmental Science Data Center of the Chinese Academy of Sciences; elevation data were obtained from the SRTM data released by the USGS (http://earthexplorer.usgs.gov (accessed on 27 October 2025)); precipitation data were acquired through the China Meteorological Data Network (http://data.cma.cn/ (accessed on 12 August 2025)); and statistical data were sourced from the Water Resources Bulletin, China Urban Statistical Yearbook, China Urban Construction Statistical Yearbook, and municipal bulletins. According to the China Land Use Status Classification GB/T21010-2017, the land types in the study area were classified into six primary categories: grassland, forestland, water area, construction land, unused land, and arable land [28]. Through field surveys and the integration of high-resolution imagery (Google), 322 corrected samples were obtained.
2.3. Research Methods
2.3.1. Human–Environment Coordination Model
The calculation of human–land coordination encompasses synergy between human “activities” and “natural environments” [29]. This study develops a model using two key variables: human activity intensity (HAILS) and ecological carrying capacity (ECC). HAILS quantifies the impact of activities on the environment [30], representing the influence of “humans” on the “ECC”. In turn, ECC reflects the natural environment’s capacity to withstand human activities, indicating land’s impact on development. After dimensionless processing, the calculation of these variables represents the overall harmony between them [31,32,33]. Building upon Xu Yong et al.’s [34] proposed construction of a land equivalent model and a classical ecological footprint model, this study integrates the agricultural and ecological characteristics of Northeast China’s cold-temperate and mid-temperate zones with the human activity patterns pertaining to the agglomeration of heavy industry. Regional parameter optimization ensures the results are better aligned with the actual conditions of the study area.
Construction Land Equivalent Method
The calculation of the intensity of human activity employs the Construction Land Equivalent (CLE) model proposed by Xu Yong et al. [35] and the Conversion Index (CI) algorithm for land use/land cover types. The formula is as follows:
In the equation, HAILS (Human Activity Intensity of Land Surface) represents the intensity of human activity on the land surface; denotes the equivalent area of built-up land; S represents the total area of the study region; denotes the area of the i-th land use/land cover type; denotes the conversion factor for that land use/land cover type; and n denotes the total number of land use types within the study region.
In the process of calculating human activity intensity, different land use/cover types are assigned different conversion coefficients. Based on the extent of surface modification caused by human activities, construction land, arable land, water bodies, forestland, grassland, and unused land can be respectively assigned conversion coefficients.
Yield and Equilibrium Factor Methods
The ecological carrying capacity of Northeast China is calculated using the yield and equilibrium factor methods. Based on the characteristics of the region and incorporating the ecosystem footprint model [36], statistical yearbook data, and the FAO database, the yield factor and equilibrium factor are determined. The calculation formula is as follows:
In the formula, represents the ecological carrying capacity of region i; Yi represents the yield factor for the region; Bi represents the equilibrium factor for the region; and Si represents the area of the region.
Method for Calculating the Degree of Harmony Between People and the Environment
The degree of human–land coordination is calculated by measuring the degree of coupling between human activity intensity and ecological carrying capacity [37]. The model calculation results include two main components—the degree of coordination and the coordination coefficient—with the calculation process being as follows:
In the formula, represents the intensity of human activity in region i; ECCi represents the ecological carrying capacity of region i. Ci denotes the coupling degree between human activity intensity and ecological carrying capacity in the Northeast region, with values ranging from 0 to 1.Ti represents the comprehensive coordination coefficient, whilst and are two undetermined parameters ( + = 1). As humans and nature hold equal status in the human-land relationship, = = 0.5. Di represents the degree of human-land coordination, where Di ∈ [0, 1].
The comprehensive coordination coefficient is defined as two indeterminate parameters. The equal status of humans and nature in human–land relationships helps to define the degree of human–land coordination.
To more intuitively reflect the spatiotemporal differentiation characteristics of the human–land relationship in Northeast China, the results of the coordination degree calculation were divided into 10 grades by adopting the equal-distance grading method [38] (Table 1).
Table 1.
Classification evaluation criteria for human–land coordination in Northeast China.
2.3.2. Geodetector
Geodetectors can be utilized to analyze spatial heterogeneity in environmental data and reveal the underlying patterns of the drivers of spatiotemporal evolution [39]. The model primarily consists of four components: factor detectors, risk detectors, ecological detectors, and interaction detectors [40]. Its key advantage lies in the absence of preconditions or constraints, ensuring universality and effectively overcoming the limitations of traditional statistical analysis methods when handling categorical variables [41]. This model has a clear form and explicit physical meaning, and has been applied in various research fields such as the natural sciences, social sciences, environmental sciences, and human health [42]. This study primarily focuses on two of the model’s components: factor detectors and interaction detectors.
(1) Factor Detector: This study employs the q-value from the factor detector to quantify the impact of each factor on the spatial differentiation of the degree of response across counties in Northeast China, as expressed in the following formula:
In the formula, h = 1, ⋯, L denotes the stratification of the variable Y or the factor X, i.e. the classification or partitioning; Nh and N denote the number of units in stratum h and the total population, respectively; and denote the variances of the Y values in stratum h and the total population, respectively. The range of q is [0, 1]; a larger value of q indicates that the independent variable X has a stronger explanatory power for the attribute Y, whilst a smaller value indicates weaker explanatory power.
(2) Interaction Detector: Examines the impact of interactions among different factors driving the human–land relationship in Northeast China [43]. This model identifies whether the combined effects of environmental variables enhance or diminish the explanatory power of the dependent variable Y. Table 2 provides a comprehensive overview of interaction types.
Table 2.
Criteria for assessing interaction effects of influencing factors and their interaction modes.
Building upon prior research [44,45,46,47,48,49], this study selects 11 environmental variables—population size (X1), GDP (X2), fiscal revenue (X3), urbanization rate (X4), per capita water resources (X5), annual precipitation (X6), per capita construction land (X7), per capita arable land area (X8), primary industry (X9), secondary industry (X10), and tertiary industry output (X11)—in order to analyze their dynamic relationships with human–land interactions. As the Geodetector algorithm operates on discrete data, optimization methods were employed to convert these 11 variables into discrete variables.
3. Results
3.1. Change Characteristics and Evolution Trends of Land Use Types in Northeast China
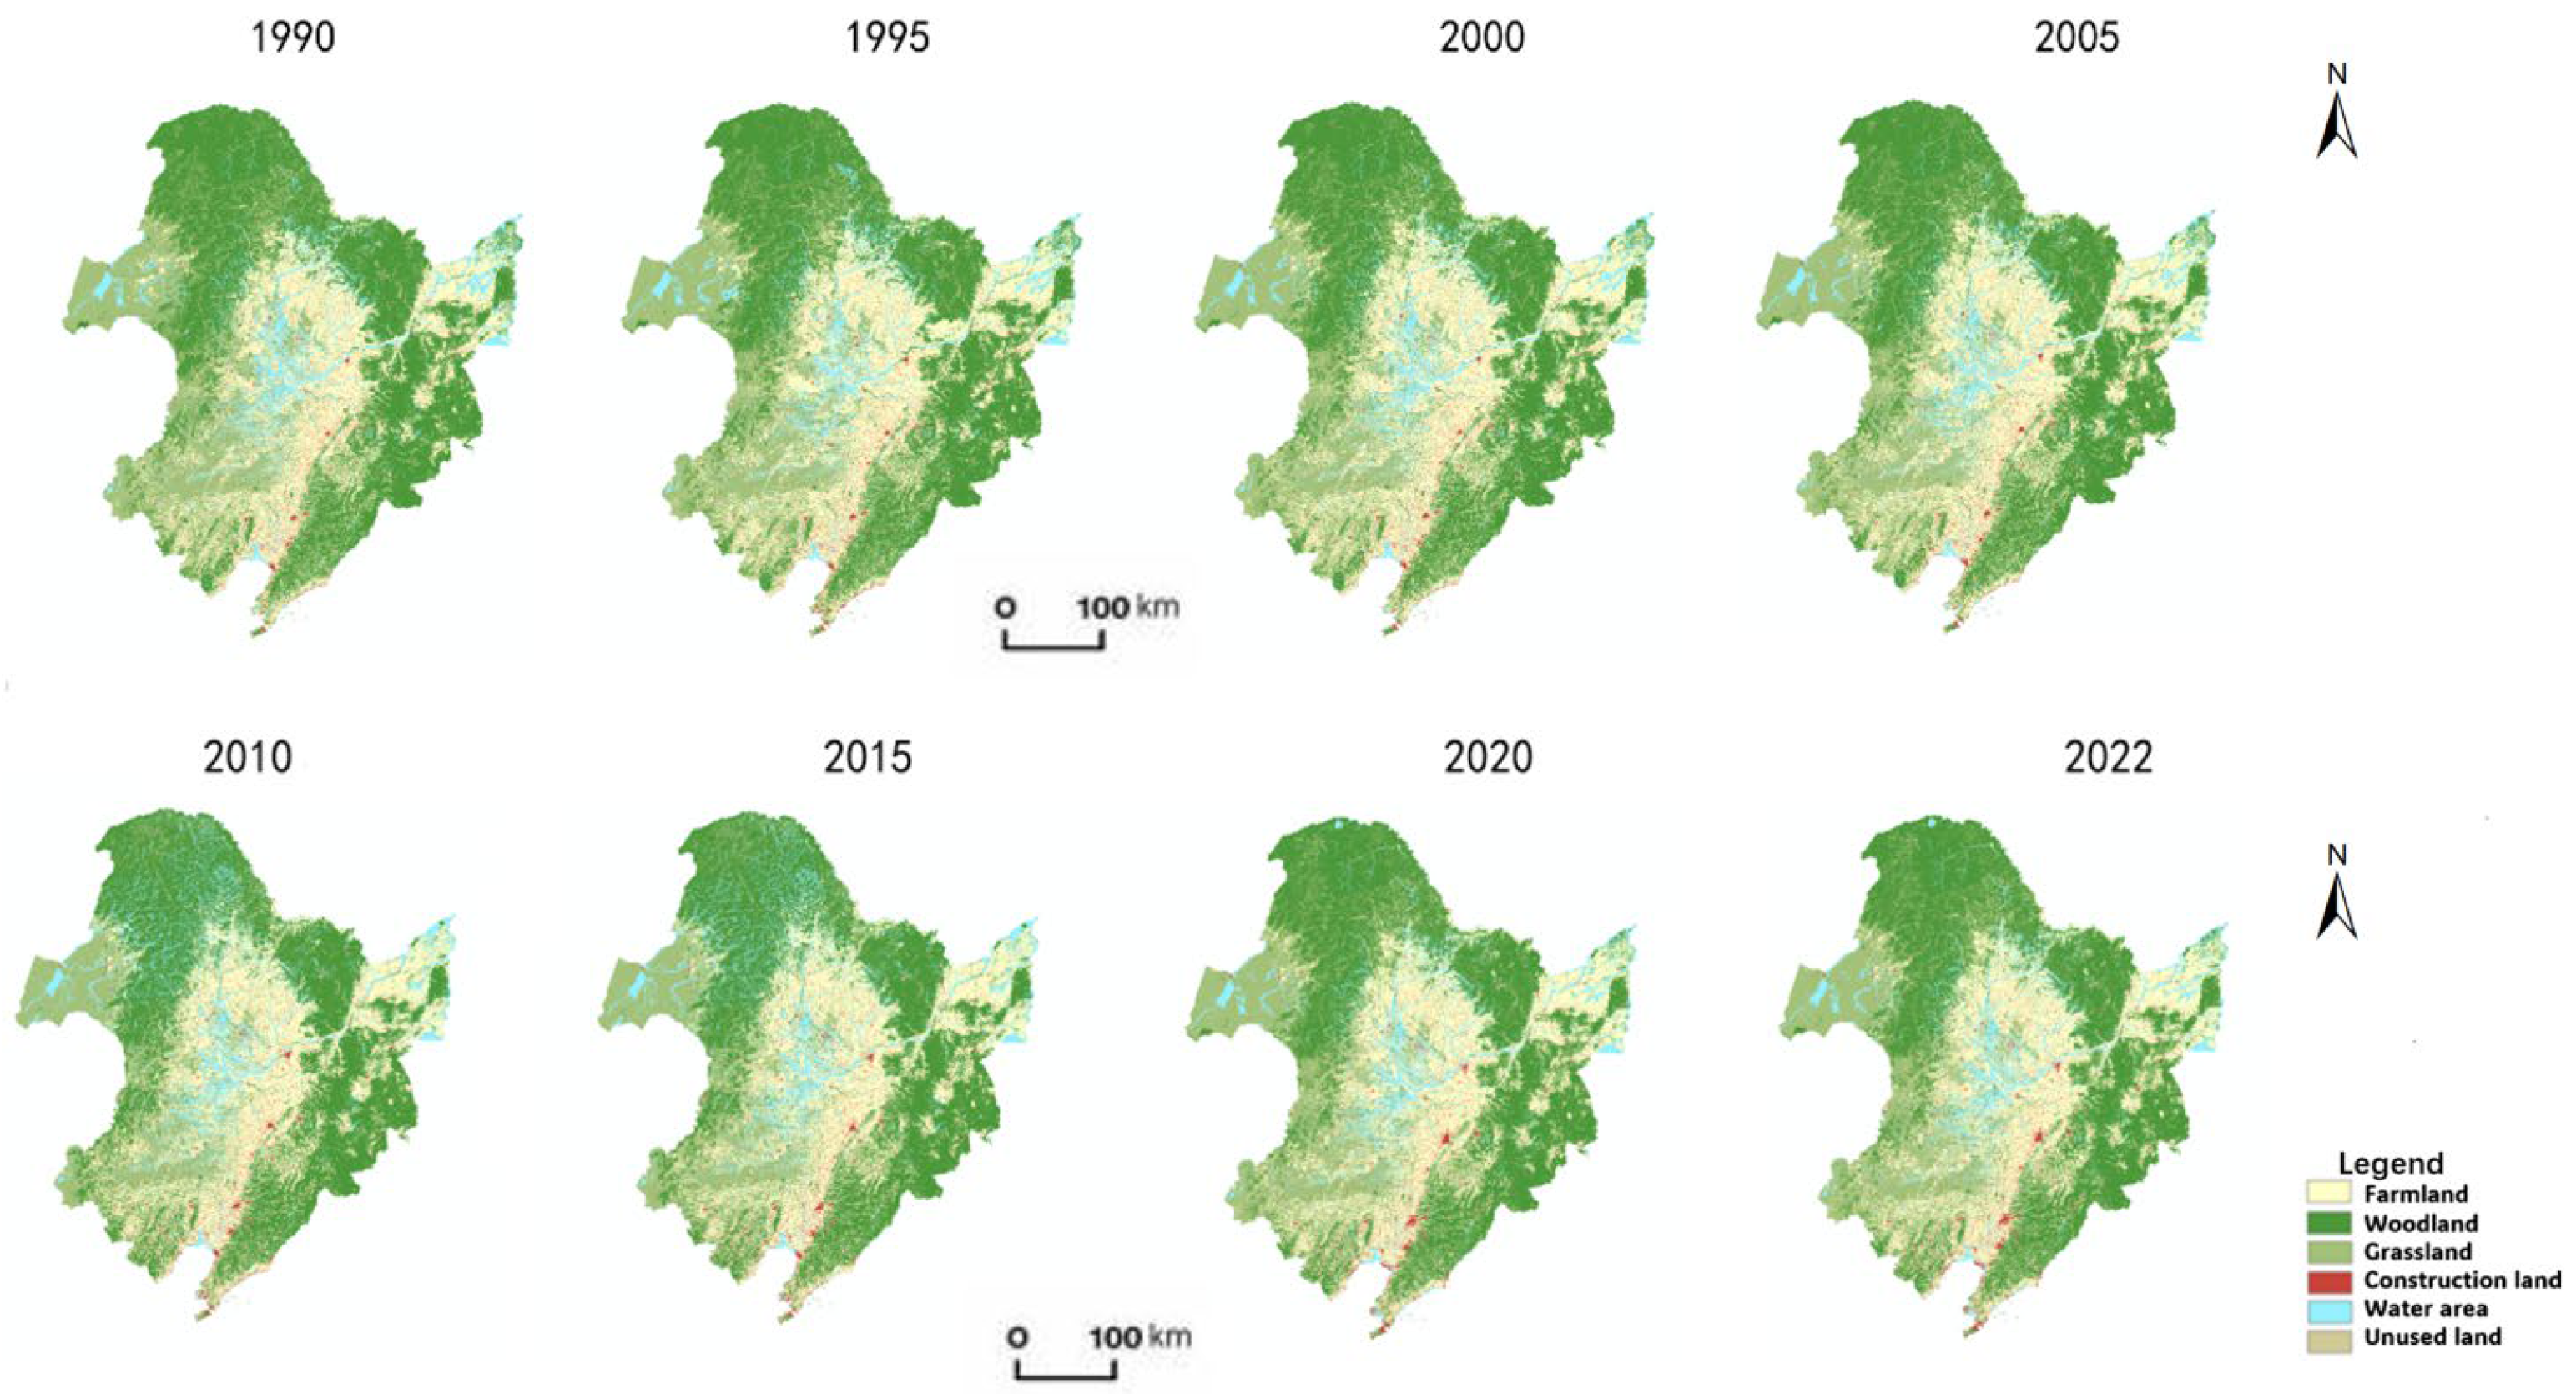
Supported by GIS technology, this study conducted a dynamic analysis of land patterns in Northeast China that were significant to land use change from 1990 to 2022 (Figure 2). The research reveals marked transformations in the region’s land use landscape.
Figure 2.
Temporal and spatial distribution of land use types in Northeast China from 1990 to 2022.
Construction land, as the primary manifestation of human activities, has shown continuous expansion in terms of equivalent area. While cultivated land has remained stable, localized conversions have occurred due to adjustments in crop type. Forest and grassland areas have gradually and steadily expanded under the support of ecological engineering initiatives and national policies. The persistent reduction in unused land reflects the intensification of land use. Water areas have remained generally stable, with only minor fluctuations caused by human activities in certain regions. Evolutionarily, the study witnesses a gradual shift in regional land use toward a balanced integration of ecological conservation and productive development. The intensity with which various land types undergo conversion and the spatiotemporal evolution of human–land coordination demonstrate a high level of compatibility, ultimately giving form to a spatial pattern that harmonizes natural environments with human development.
3.2. Temporal and Spatial Dynamics of Human–Land Relationship in Northeast China
3.2.1. The Dynamic Changes of Time
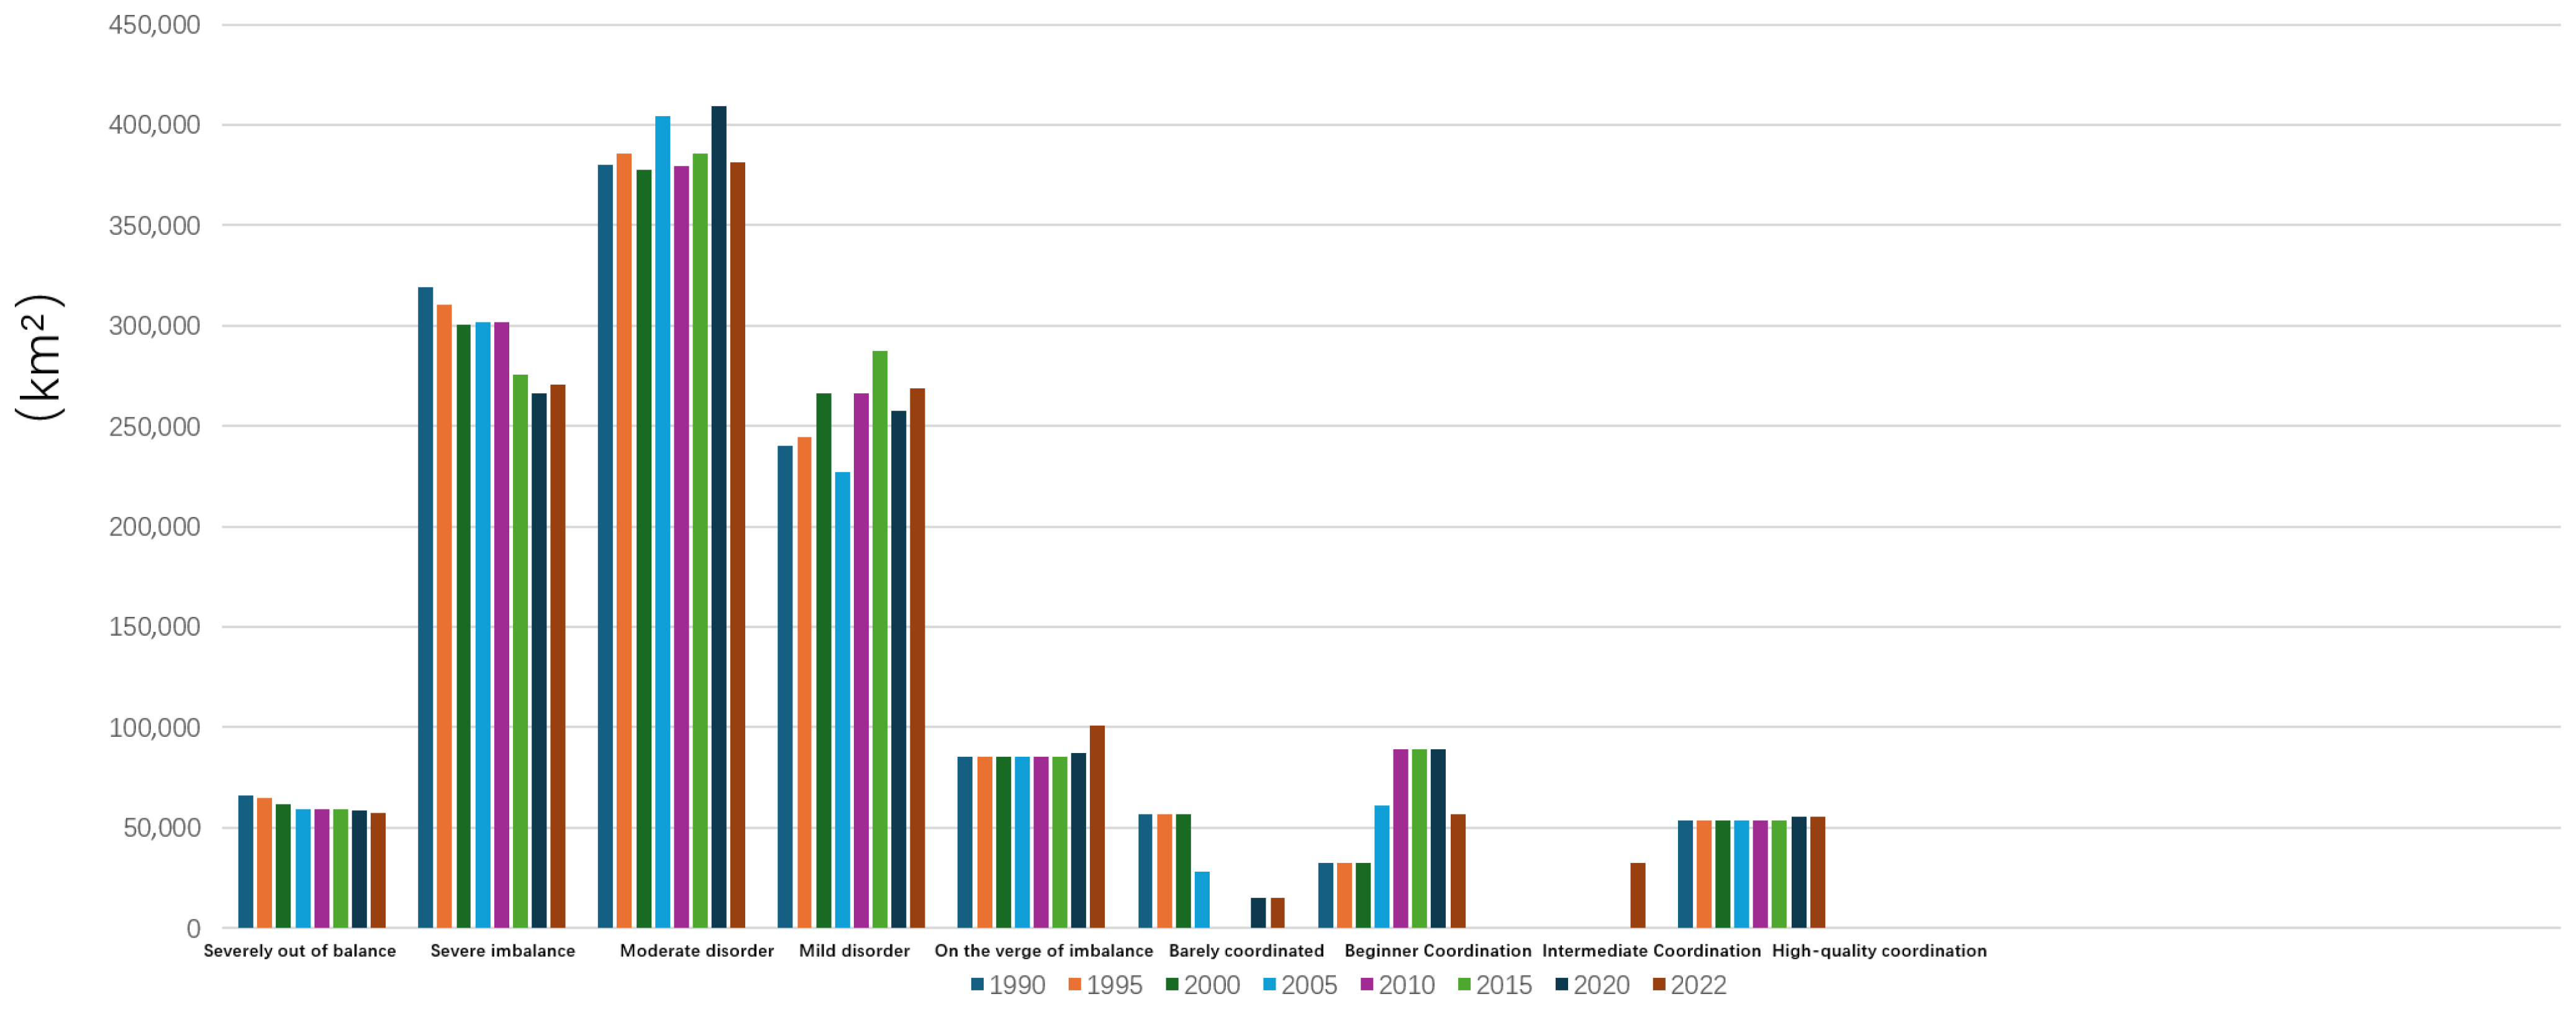
From 1990 to 2022, the Northeast China region has witnessed significant change in terms of human–land coordination, with the imbalance area showing a decreasing–increasing–decreasing trend, while the area of coordinated land maintained an increasing trend (Figure 3). In the 1990–1995 period, barely coordinated areas and areas characterized by extreme or high imbalances experienced slight declines, while moderate, borderline, and barely coordinated areas, as well as those characterized by primary high-quality coordination, saw modest increases. From 1995 to 2000, areas of extreme imbalance decreased significantly, with slight reductions in areas characterized by high, moderate, borderline, and primary coordination, as well as barely coordinated areas, while areas with a mild imbalance increased markedly and primary high-quality coordination areas saw minor growth. From 2000 to 2005, areas of extreme imbalance continued to decrease but at a slower rate compared to 1995–2000. Areas of high and moderate imbalance exhibited a rebounding trend by increasing instead of decreasing, while areas with a mild imbalance expanded significantly. From 2005 to 2010, areas with extreme, high, and mild imbalances increased, while areas of moderate imbalance decreased, and well-coordinated areas maintained their upward trend. From 2010 to 2015, areas of extreme, high, and borderline imbalances steadily declined, while areas characterized by moderate and mild imbalances gradually increased, and well-coordinated areas showed a marked rise. From 2015 to 2020, areas of moderate and borderline imbalances increased significantly, and the well-coordinated areas continued to expand. From 2020 to 2022, the imbalanced areas gradually decreased, while the coordinated areas maintained a steady increase.
Figure 3.
Regional area changes to degree human–land coordination in Northeast China from 1990 to 2022.
3.2.2. Dynamic Changes in Spatial Patterns
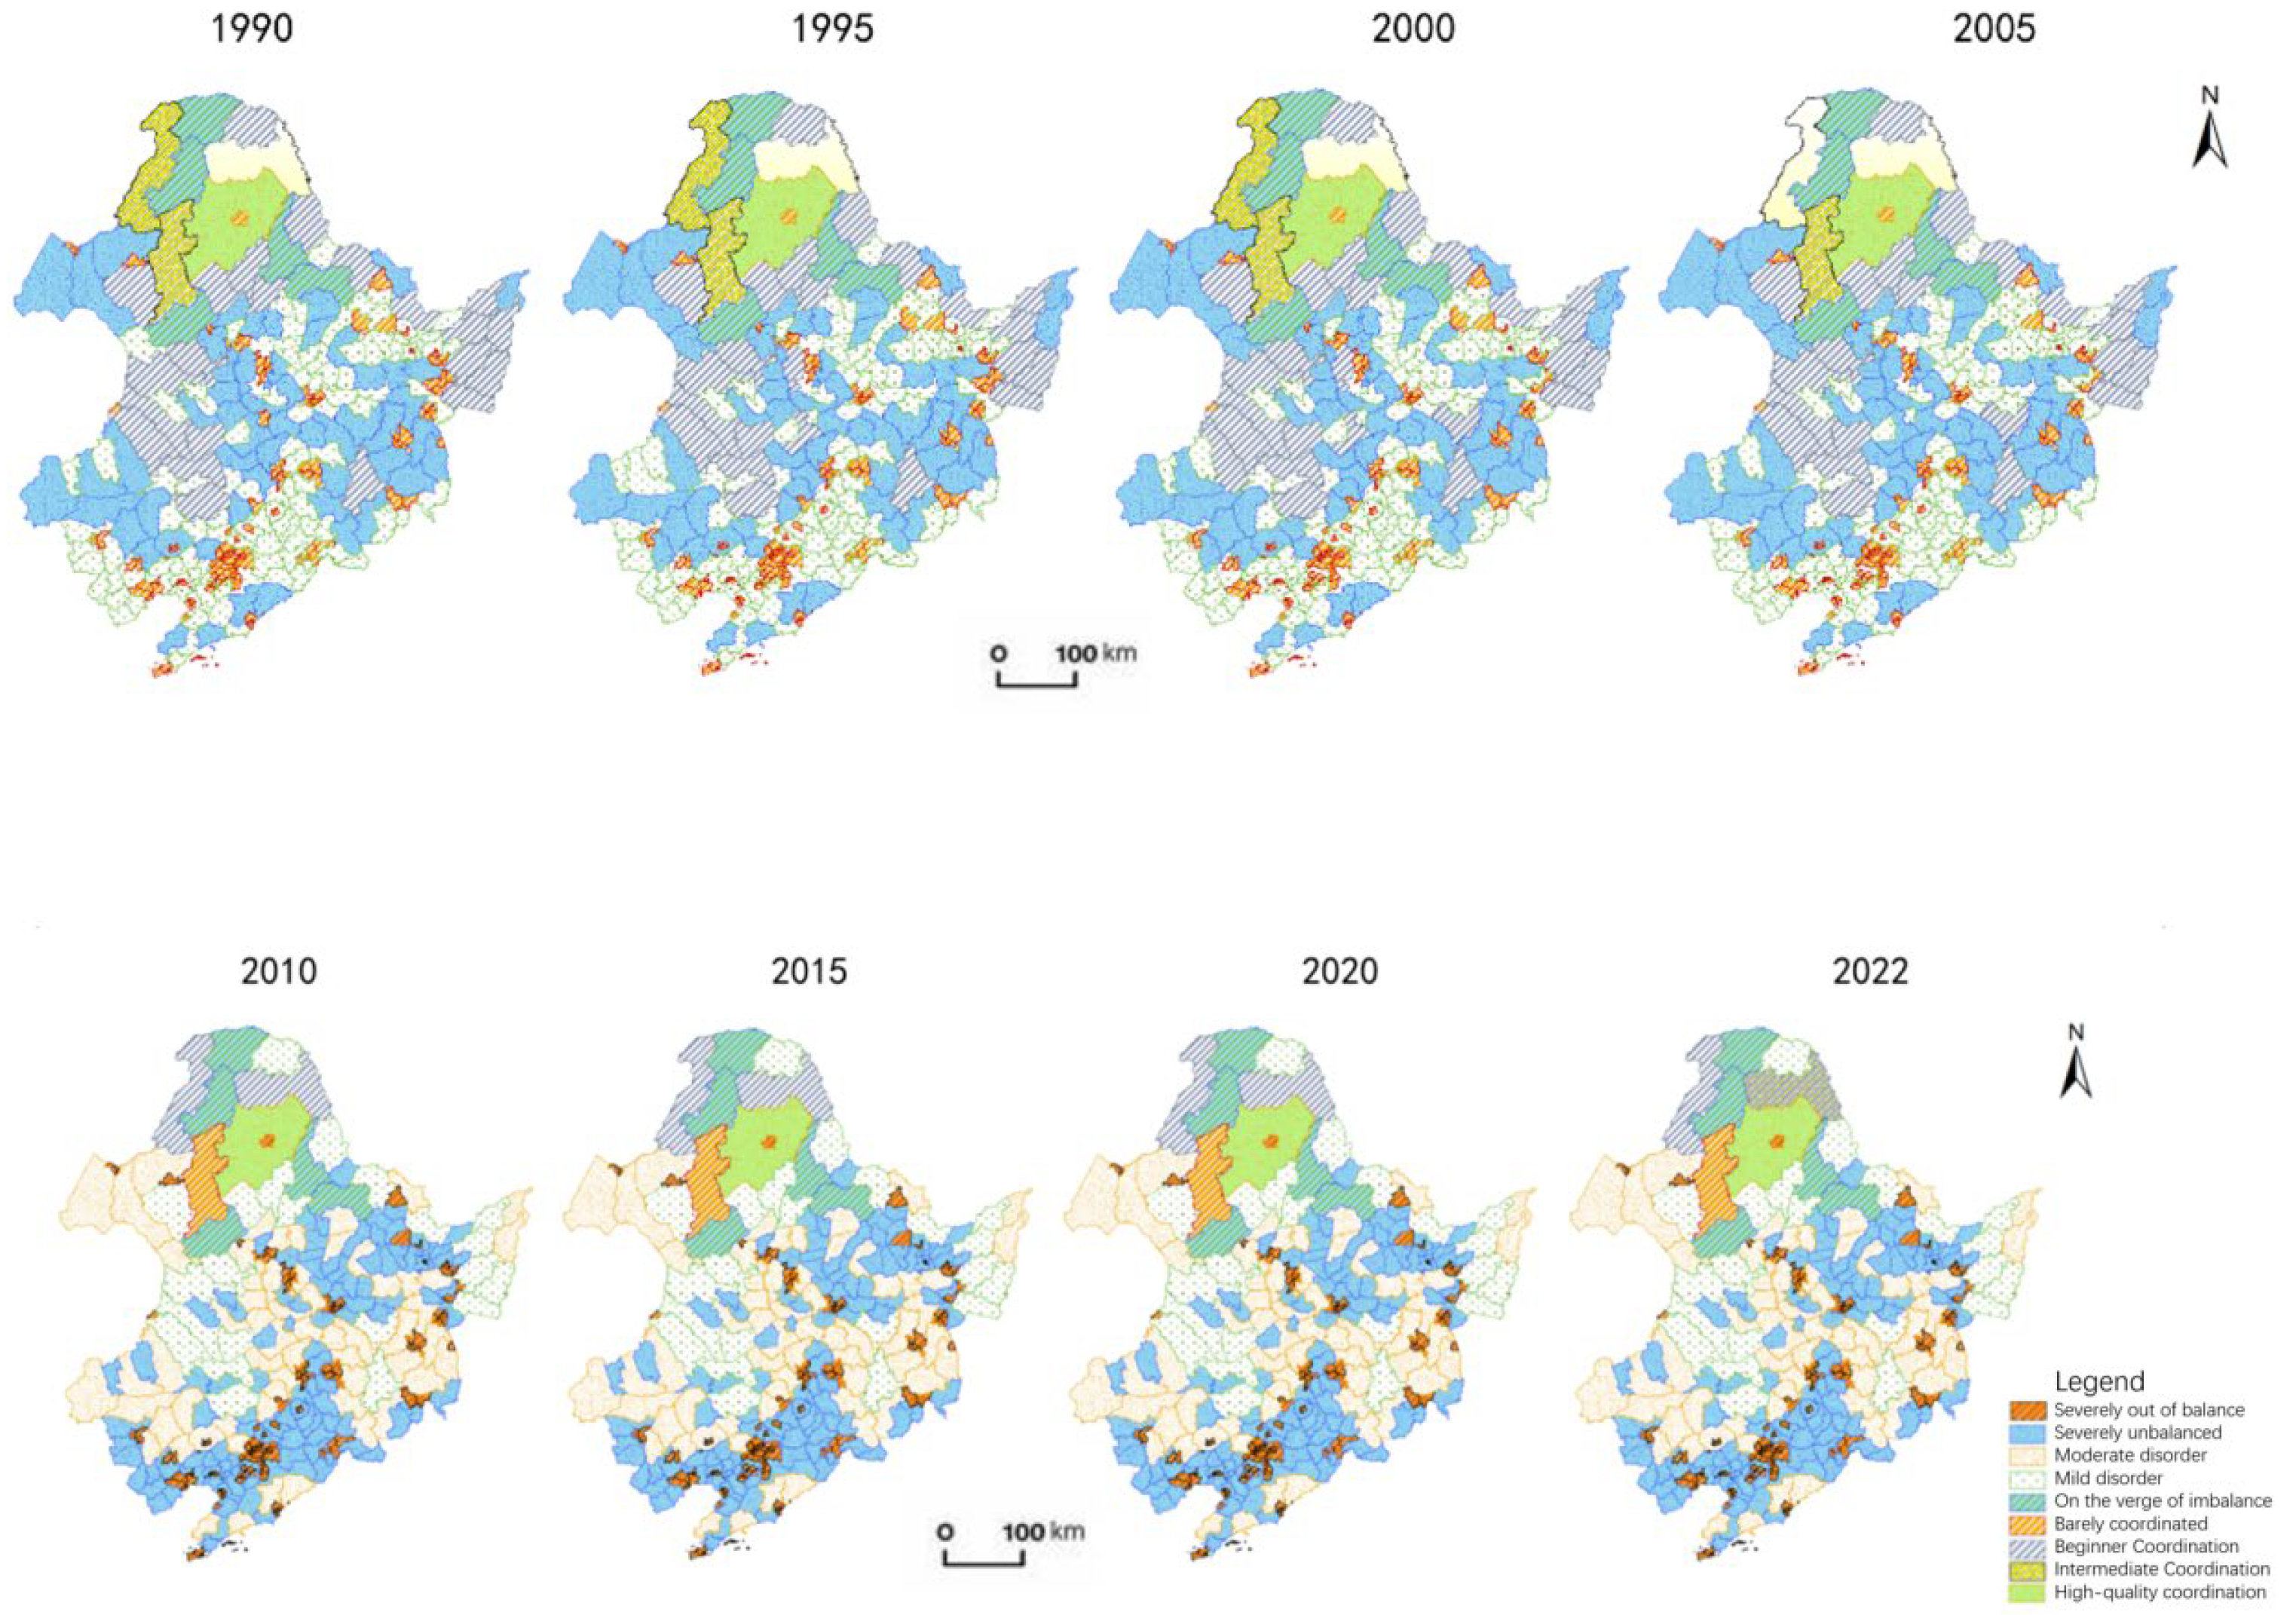
The spatiotemporal distribution pattern of Northeast China from 1990 to 2022 exhibits a northwest–southeast gradient (Figure 4). Research areas in the Sanjiang Plain, Songnen Plain, and Liaohe Plain demonstrate relatively higher coordination levels, while mountainous and hilly regions show lower levels of coordination. High-coordination zones show significant expansion, outwardly primarily concentrated in the Xiaoxing’anling Mountains and Nenjiang River Basin. Disordered regions are mainly distributed across Liaoning’s western and eastern hilly areas and along the Changbai Mountain range. During this period, regional development and construction activities were largely concluded and gradually subsided, leading to the expansion of moderately and mildly disordered areas. Due to topographical factors and industrial activities, mountainous regions in Northeast China exhibited extreme disorder. However, with technological advancements and policy adjustments, human–land conflicts have eased, and coordination levels in mountainous areas have progressively improved.
Figure 4.
Temporal and spatial distribution of degree of human–land coordination in Northeast China from 1990 to 2022.
Analysis of human–land coordination metrics across Northeast China reveals that the area has maintained relatively low levels of coordination since 1990. During the initial research phase, most counties exhibited coordination gaps. By 2022, disparities in human–land coordination had gradually narrowed, with overall improvement observed.
3.3. Analysis of Factors Driving Human–Land Relationship Evolution in Northeast China
3.3.1. Changes in the Explanatory Power of Drivers of Human–Land Relationship Evolution in Northeast China
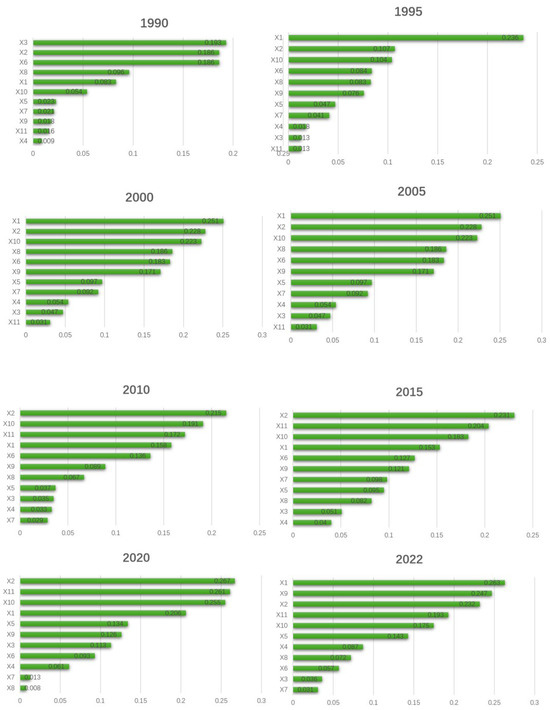
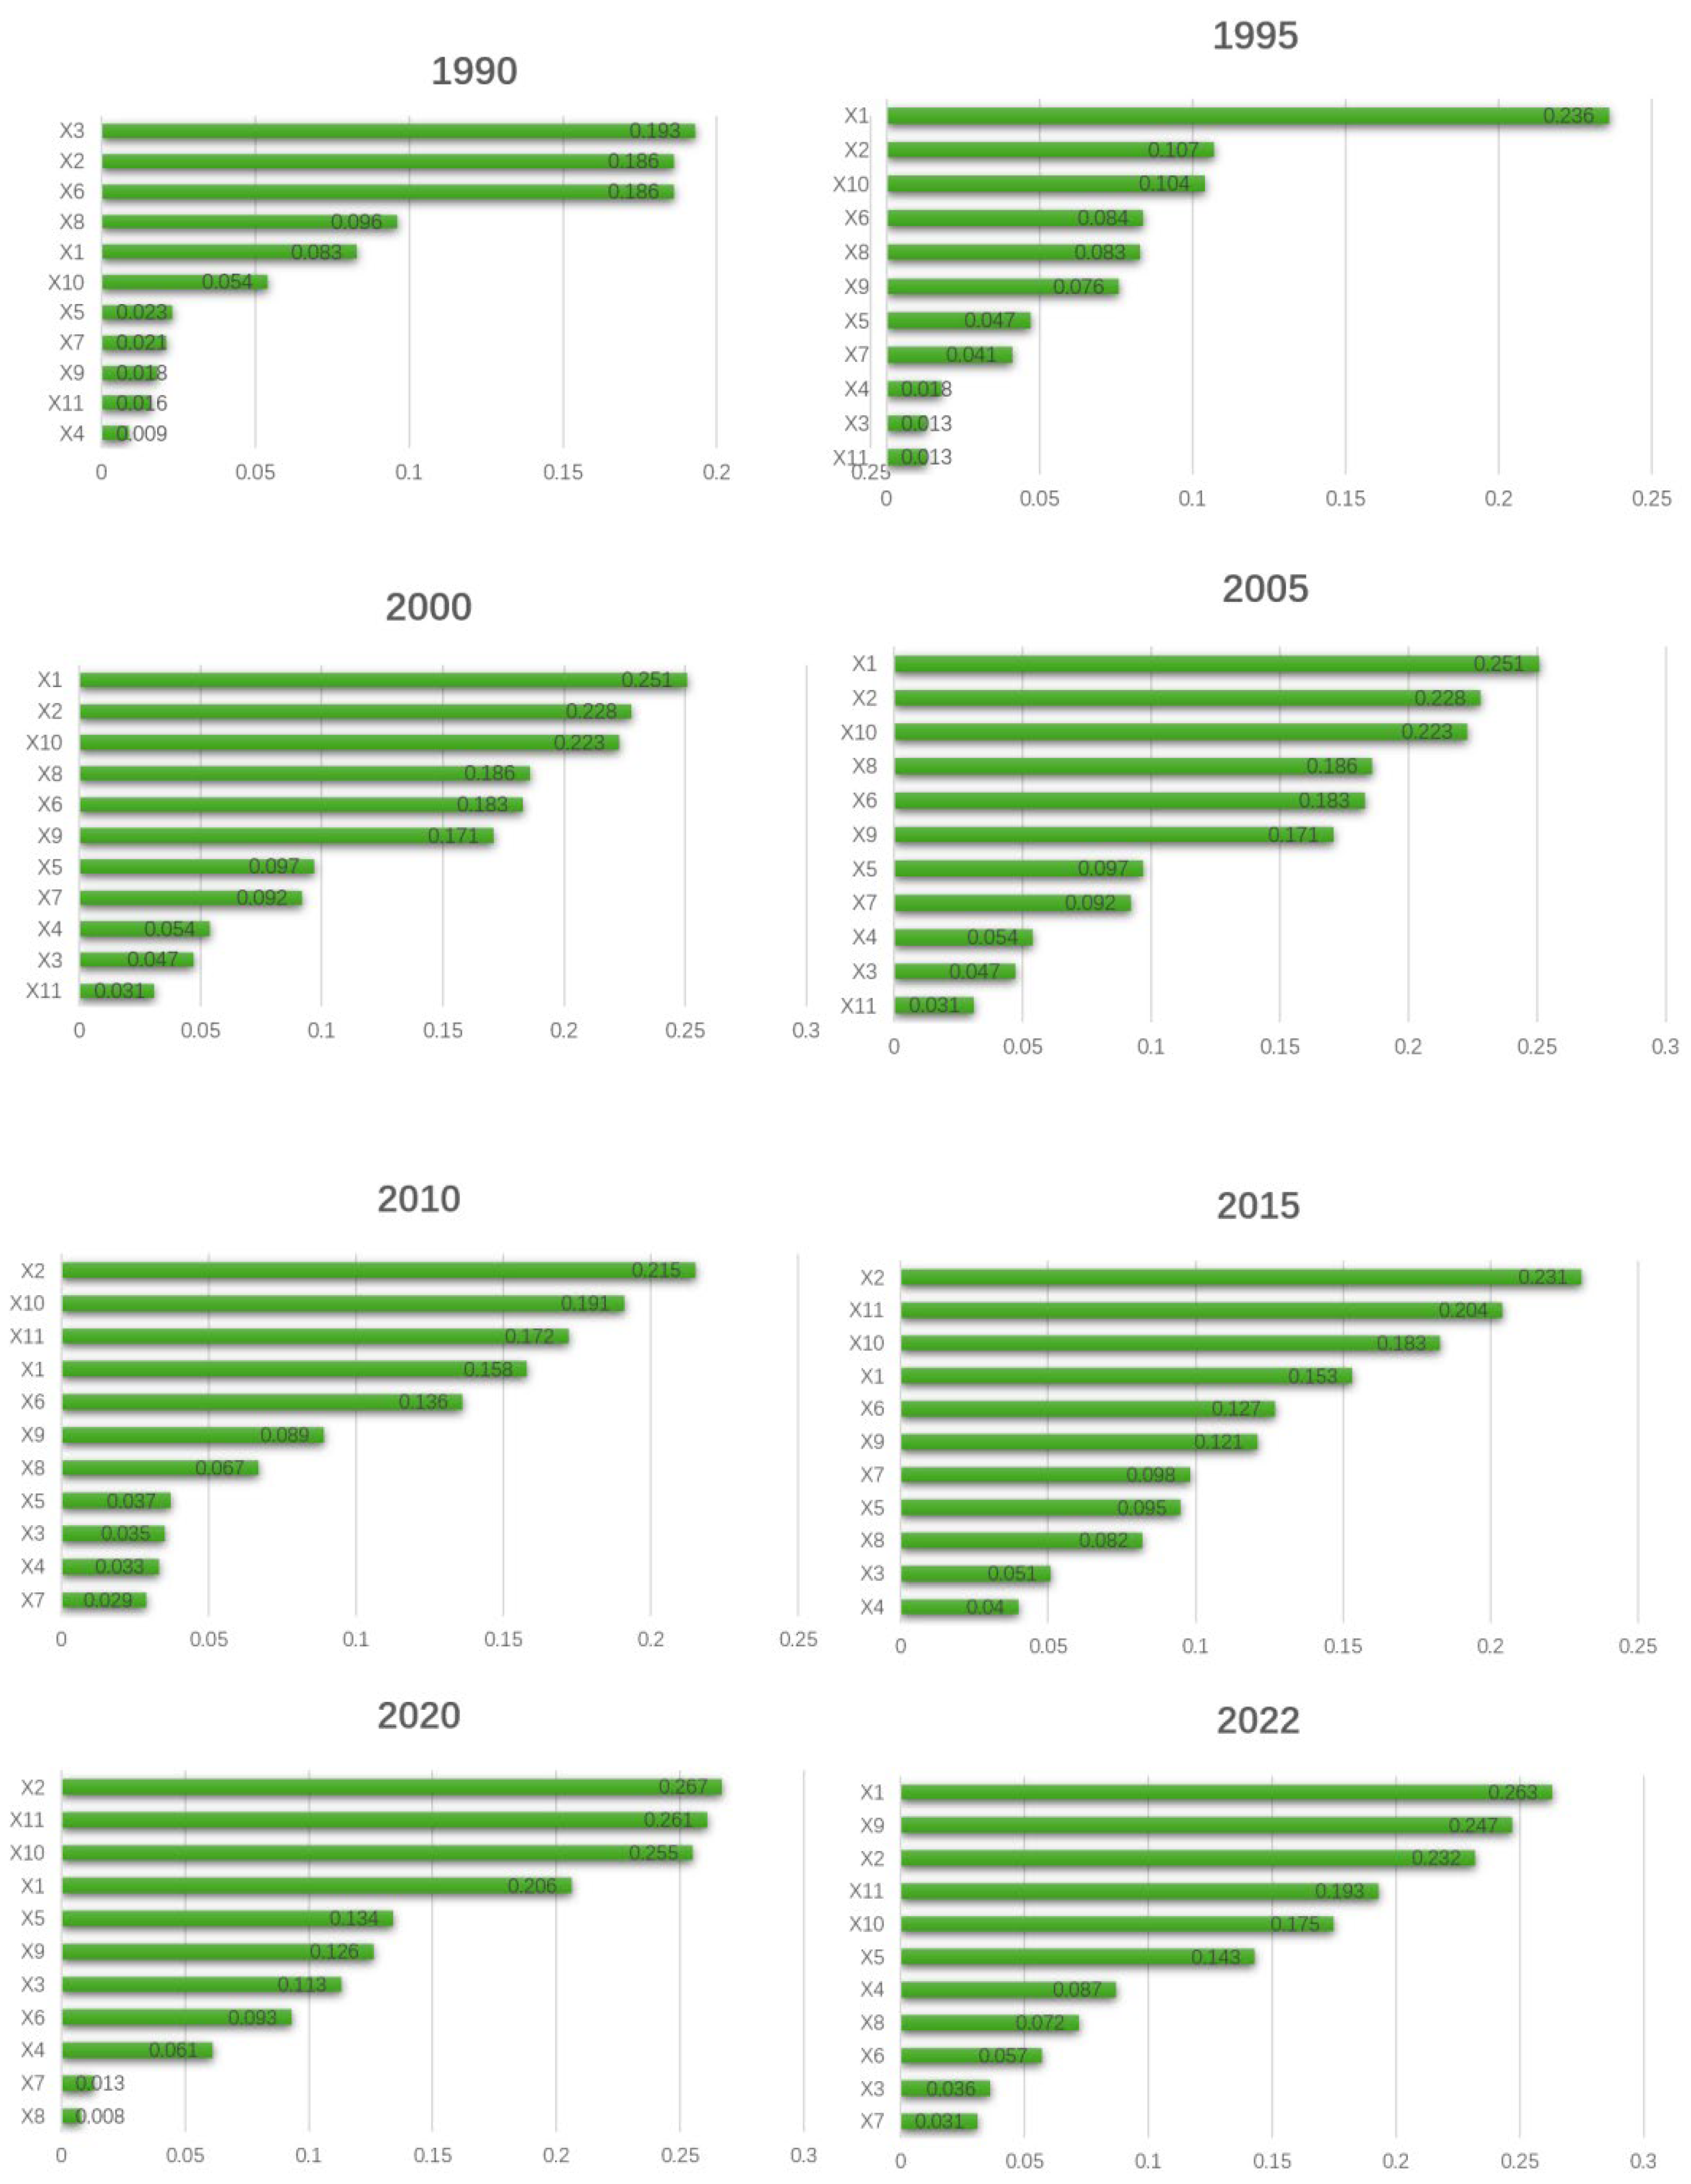
Factor detector analysis of environmental variables in Northeast China (1990–2022) (Figure 5) revealed the explanatory power of various factors driving human–land coordination. All factors passed the statistical tests (p < 0.05). The results demonstrate that human–land coordination levels in Northeast China are closely related to population size/GDP. Overall, population size and GDP, as well as the output values of secondary/tertiary industries, were the dominant factors influencing the spatiotemporal evolution of human–land coordination during 1990–2022, though their explanatory power (q-values) remained relatively low. In 2022, the explanatory order of factors for spatiotemporal differentiation was: population size (0.263), primary industry output (0.247), GDP (0.232), tertiary industry output (0.193), secondary industry output (0.175), per capita water resources (0.143), urbanization rate (0.087), per capita arable area (0.072), per capita precipitation (0.057), fiscal revenue (0.036), and per capita construction land area (0.031). Population size and GDP exhibited the strongest impact, followed by per capita water resources and per capita arable land area. Therefore, the economic development of Northeast China and restoring and protecting the region’s natural environment are the key pathways toward achieving harmonious human–land development in the region [50].
Figure 5.
Changes in forces driving human–land relationship evolution in Northeast China from 1990 to 2022.
From 1990 to 2022, the explanatory power of various factors influencing the human–land coordination index in Northeast China underwent significant change. Levels of economic development, natural resource endowments, and environmental factors demonstrated increasing importance in the evolution of this index. Notably, population size, GDP, tertiary industry output, and per capita water resources (q-value) exhibited the most significant growth. The expansion of construction land, as the primary manifestation of economic development in human activity systems, resulted in progressive increases in its environmental impact as the ranges of this activity expanded. During this period in particular, rapid economic growth in Northeast China intensified the transformation of natural environments and resource endowments through the expansion of land devoted to construction, exacerbating regional human–land conflicts. Consequently, the explanatory power of economic development levels, natural environmental endowments, and environmental characteristics in terms of the human–land coordination in the study area gradually increased during the research period.
3.3.2. Interaction of Factors Driving the Evolution of the Human–Land Relationship in Northeast China
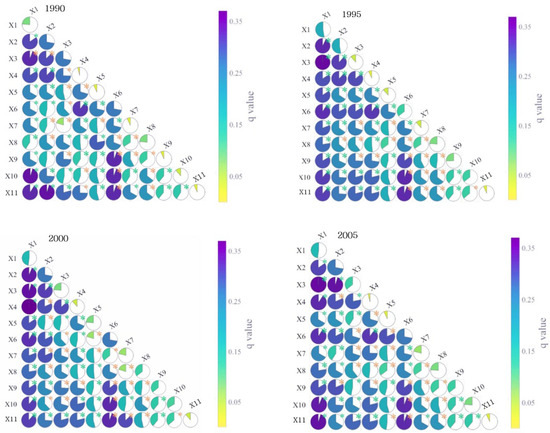
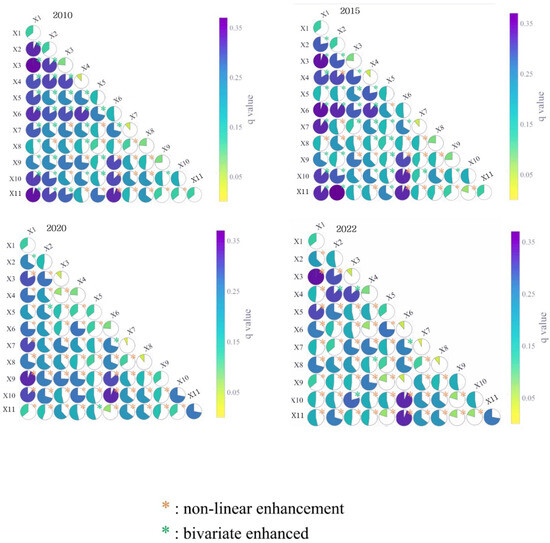
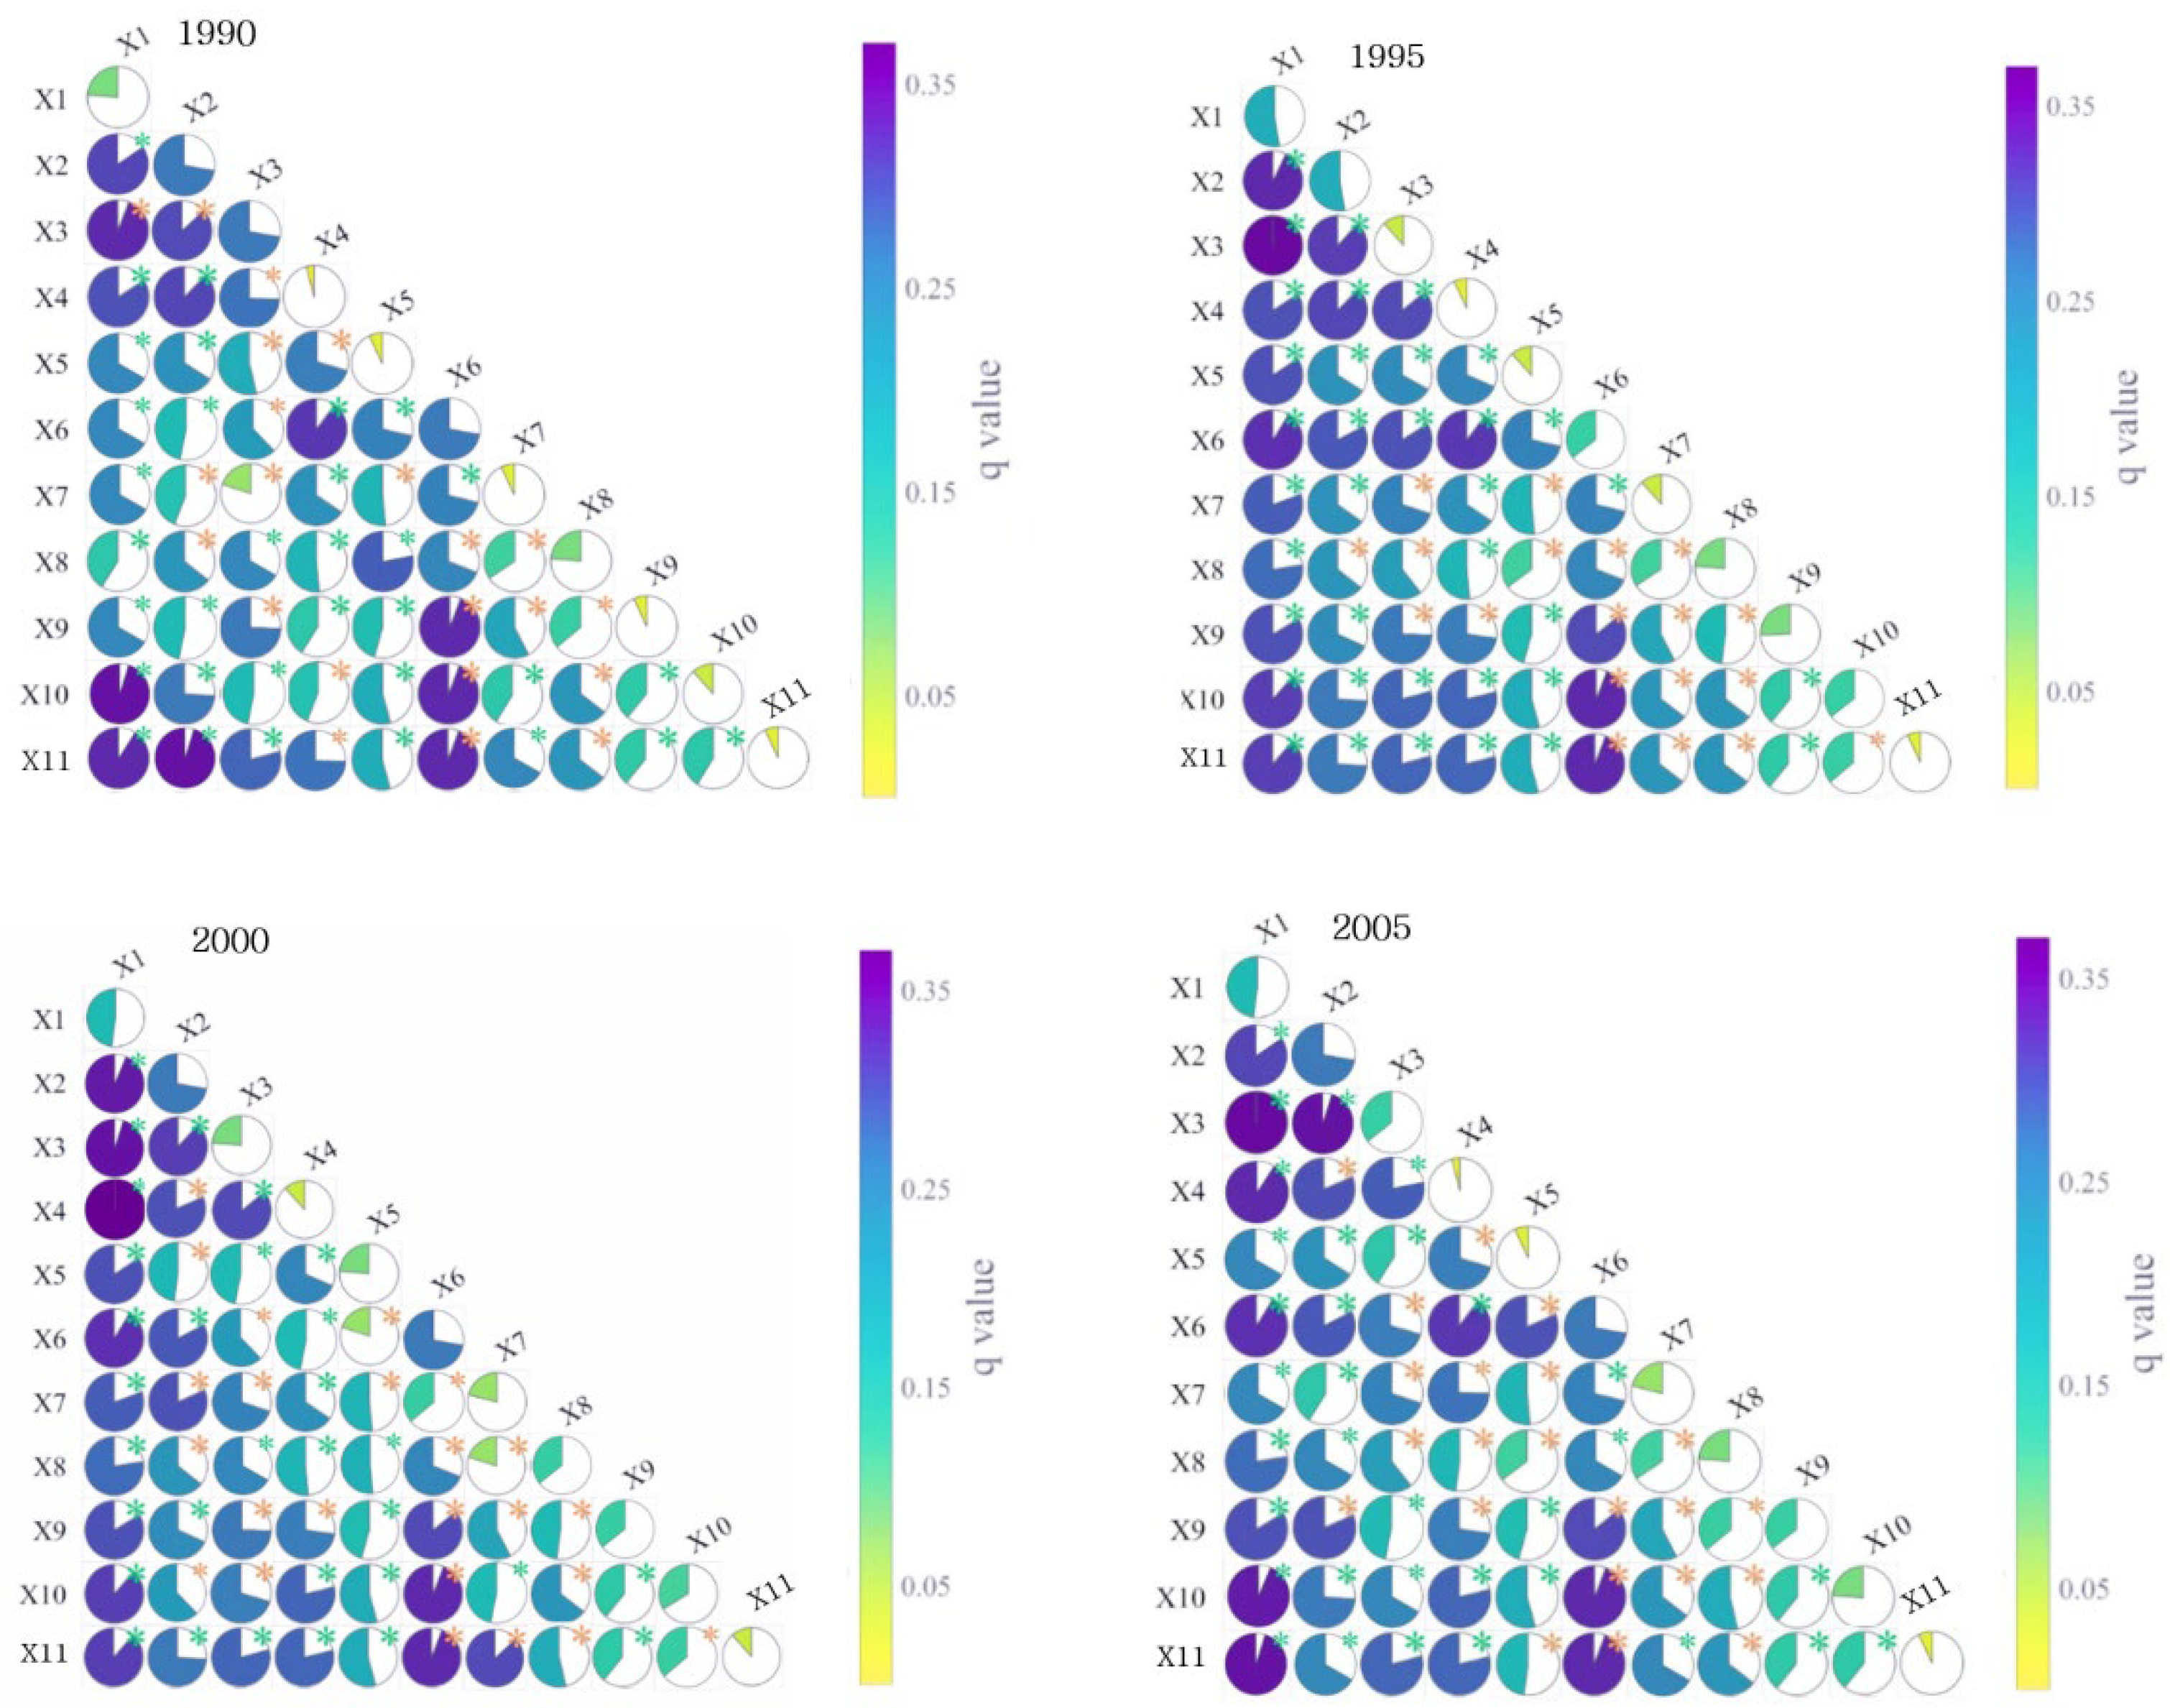
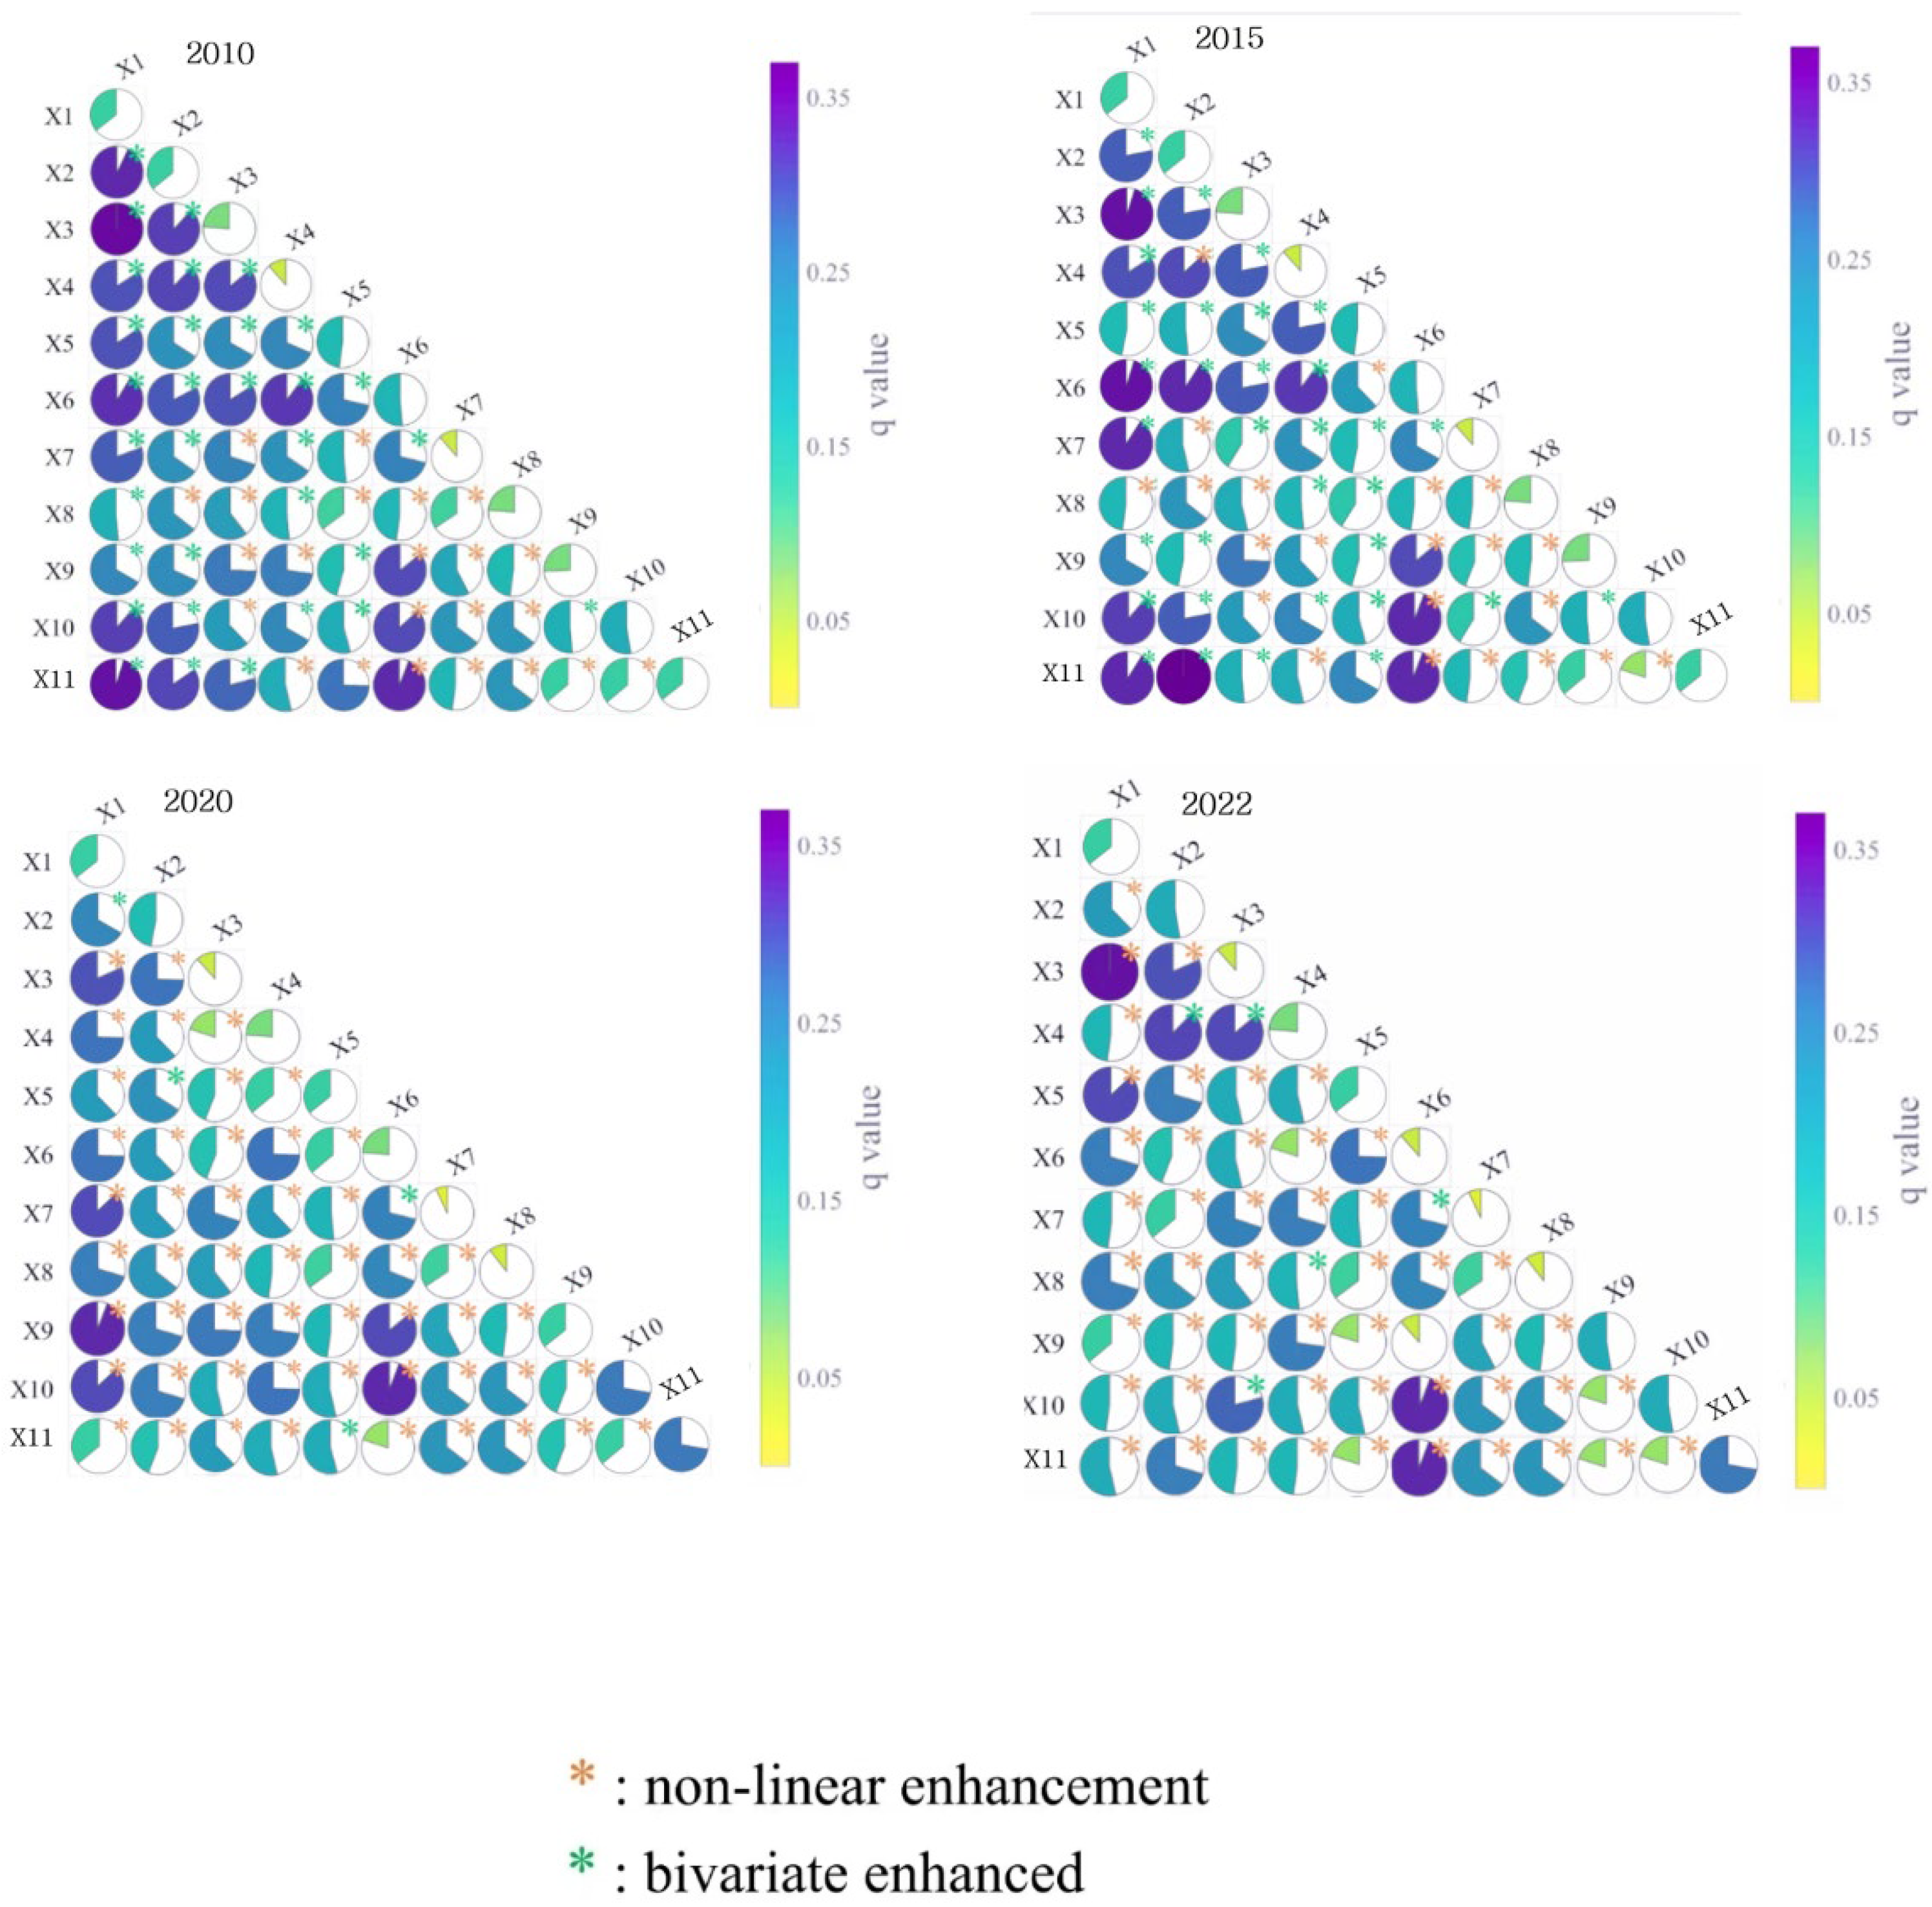
The spatial differentiation of the degree of human–land coordination results from the combined effects of multiple factors [51]. Interactive analysis of the key factors indicates that the explanatory power of these interactions, with regard to the degree of human–land coordination in the study area, has exhibited an increasing trend from 1990 to 2022 (Figure 6). The patterns of interaction among these factors mainly include nonlinear enhancement, dual-factor enhancement, and single-factor nonlinear weakening.
Figure 6.
Interaction matrix of driving factors in Northeast China from 1990 to 2022.
During the study period, most factors exhibited nonlinear enhancement interactions, with dual-factor enhancement patterns becoming increasingly prevalent. Between 1990 and 2022, certain natural resource endowments, economic development levels, and environmental characteristics demonstrated dual-factor enhancement interactions. For instance, per capita arable land area interacted with per capita construction land area and annual precipitation; secondary industry interacted with per capita arable land area, urbanization rate, GDP, and annual precipitation, as well as with GDP and per capita construction land area. By 2022, per capita water resources exhibited dual-factor enhancement interactions with all factors except per capita arable land area and tertiary industry output value. Similarly, per capita construction land area showed dual-factor enhancement interactions with population, primary industry output value, and fiscal revenue. These findings indicate that the influence of natural resource endowments, economic development levels, and environmental characteristics on human–land coordination has progressively intensified. Moreover, the explanatory power of per capita water resources, per capita construction land area, secondary industry output value, and tertiary industry output with regard to human–land coordination has been increasing steadily.
4. Discussion
4.1. Dynamic Changes in Human–Land Relationship in Northeast China
4.1.1. The Dynamic Changes of Time
From 1990 to 2022, the Northeast China region experienced three distinct phases of evolution regarding the coordination of its human–land relationships [52]. The 1990–2000 period marked a phase of low-level equilibrium and latent pressure accumulation. During this time, as a key national grain producer and heavy industry hub, the region maintained a superficial balance between human activity intensity and ecological carrying capacity. Early studies revealed moderate imbalances, with a widespread but stable distribution of discordant areas. Although agricultural expansion and industrial development exerted environmental pressure, the overall intensity of development had not yet exceeded ecological thresholds, resulting in a pattern of “harmonious on the surface, but under pressure beneath” [53] that foreshadowed subsequent conflicts. The 2000–2010 period saw intensified contradictions and high-intensity imbalances. Driven by the “Revitalizing Northeast Old Industrial Bases” strategy [54], rapid industrialization and urbanization led to skyrocketing human activity intensity and accelerated land expansion continuously overstepping ecological carrying capacity. This phase witnessed a significant rebound in highly and moderately imbalanced areas, stagnation of the expansion of the coordinated zone, and core conflicts centered on economic development encroaching on ecological space and the overexploitation of natural resources [55]. The 2010–2022 period entered a phase of systematic restoration and collaborative reconstruction. Guided by ecological civilization initiatives and the “lucid waters and lush mountains are invaluable assets” philosophy [56], unprecedented efforts were made to protect and restore ecosystems. Imbalanced areas began shrinking steadily, coordinated zones expanded, and overall human–land conflicts showed signs of easing. However, structural issues accumulated over many years have resulted in a complex process of improvements characterized by ‘overall progress, localized fluctuations, and regional disparities’ [57]. By 2022, ‘moderate imbalance’ remained the predominant coordination type across the entire domain, indicating that the system as a whole is still in a critical phase of transitioning to higher levels of coordination.
4.1.2. Dynamic Changes in Spatial Patterns
Spatially, the Northeast region exhibits a distinct “northwest—high, southeast—low” gradient of human–land coordination, with response mechanisms across different geographical units varying. The ecological barrier zones and grassland pastoral areas in the northwest, where human interference is relatively low, maintain excellent ecological conditions and generally high and stable levels of coordination. Changes here are primarily influenced by climate fluctuations, ecological engineering projects, and the intensity of livestock activities. The central agricultural region, a cornerstone of national food security, experiences a high density of human activities. While this area demonstrates relatively high levels of coordination, fluctuations here are significant, and are closely tied to agricultural policies, crop structure adjustments, and the effectiveness of black soil conservation measures. The core challenge lies in achieving precise balance between ensuring food production capacity and maintaining the sustainability of black soil resources. The mountainous and forested regions in the east play a vital ecological role. Initially constrained by terrain and transportation limitations, these areas saw low levels of development and coordination. Yet, with major ecological projects like natural forest protection underway, ecological restoration has progressed and coordination levels have improved. The current challenge is to achieve a win–win situation in terms of both ecological conservation and sustainable development in forested regions. The southern Liaozhongnan urban agglomeration, an area of high-intensity industrialization and urbanization, demonstrates the most intense human–land interactions. Its coordination has undergone a complete cycle of “severe imbalance–difficult restoration”. Early extensive development led to severe environmental impacts, yet improvements in the form of industrial upgrading, spatial optimization, and pollution control have enhanced coordination. However, systemic fragility remains, making it a key region for observing the transformation and upgrading of Northeast China’s old industrial base [58].
4.2. Forces Driving Human–Land Relationship Evolution in Northeast China
4.2.1. Temporal Changes in the Explanatory Power of Key Drivers
Factor analysis of geographic indicators reveals that the explanatory power (q-values) of various factors explaining spatial differentiation in human–land coordination in Northeast China has exhibited significant temporal variations between 1990 and 2022. Population size, GDP, and the output values of secondary and tertiary industries remained the core drivers throughout the study period. From 1990 to 2000, population size demonstrated the greatest explanatory power, reflecting the early development model where population growth directly drove land reclamation and resource consumption. During 2000–2010, GDP’s explanatory power reached its peak, indicating that economic development became the dominant force intensifying human–land conflicts. After 2010, with economic restructuring and ecological civilization initiatives, the relative importance of the output values of secondary and tertiary industries continued to rise, reflecting the deepening influence of industrial and economic activities on human–land relationships. Concurrently, the explanatory power of natural resources and environmental factors exhibited a significant upward trend, with the q-value of per capita water resources maintaining its growth even in the later stages of the study period, highlighting the role of water resources as a critical natural constraint in terms of balancing economic development and ecological protection. The influence of resource endowment factors like per capita arable land area also grew, indicating that land scarcity has become a more pronounced constraint on human–land coordination through the dual pressures of food security and ecological conservation. In contrast, individual socioeconomic indicators such as fiscal revenue and urbanization rate exhibited weakening explanatory power, but exerted significant influence through interactions with GDP and industrial output.
4.2.2. Enhancement Effect of Interactions Between Factors
Interactive analysis of the detected results demonstrates that interactions between any two driving factors provide greater explanatory power in terms of human–land coordination in Northeast China than any single factor on its own, typically exhibiting “nonlinear”, enhancement, or bifactor patterns. This indicates the complexity of and synergy in the evolution of human–land systems.
The interaction between population and GDP showed exceptional explanatory power in 1995, 2000, 2005, and 2010, revealing that rapid economic growth combined with population concentration intensified regional resource pressures, serving as a key coupling mechanism driving human–land tensions. The explanatory power of the GDP–tertiary industry interaction peaked in 2015, reflecting how the quality and direction of economic growth shape new human–land interaction patterns under conditions of structural transformation. Furthermore, the explanatory power of interactions between GDP, industrial output, per capita water resources, and per capita arable increased in the later stages of the study period, highlighting how the constraints of economic development path and resource carrying capacity have become central to the evolution of human–land relationships under tightening environmental conditions. The extensive and strong interactions between various driving factors reveal that changes in Northeast China’s human–land system result from nonlinear coupling and co-evolution between natural foundations and socioeconomic activities.
This study has certain limitations. Due to the 32-year time span, the land use data employed is constrained by remote image acquisition from different sources, resulting in varying levels of data resolution. Such inconsistencies may affect the accuracy of long-term trend analysis. Despite multi-source dataset fusion and correction, minor boundary errors remain. Furthermore, the driving factors selected in this study may not fully reflect the complexity of human–land relationships. Future research could incorporate more diverse driving factors to enhance interpretability. Existing models may not fully capture the nonlinear characteristics of human–land relationship evolution. Scholars are often affected by sudden events [59], while existing models have a limited capacity to simulate such dynamic responses and, therefore, cannot effectively reflect all dynamic outcomes. Future work should incorporate additional factors to further improve research accuracy and scientific rigor.
5. Conclusions
- (1)
- From 1990 to 2022, the human–land coordination index in Northeast China exhibited significant spatial heterogeneity, showing a distribution pattern with a gradient that decreased from the northwest to the southeast. Pressure on the human–land system was highly correlated with the distribution of regional socioeconomic development priorities and natural resource endowments. During the study period, the area of the imbalanced regions continued to shrink while the area of the coordinated regions steadily expanded, indicating a gradual shift from early tensions to relative easing. “Moderate imbalance” remained predominant across the entire region.
- (2)
- Through the factor analysis of the Geodetector, population, GDP, secondary and tertiary industry output value, and per capita water resources were identified as the core factors driving the spatial differentiation of the degree of human–land coordination in Northeast China.
- (3)
- The effects of interactions between the driving factors on the evolution of human–land relationships in Northeast China were significantly higher than the effect of any single driving factor. The effects of interactions between population and GDP in 1995, 2000, 2005, 2010, and 2022, and between GDP and tertiary industry in 2015, were the strongest, with values of 0.187, 0.352, 0.363, 0.241, 0.197, and 0.274, respectively.
Author Contributions
Conceptualization, J.L. and M.Y.; methodology, M.Y.; software, D.Z.; validation, M.Y., J.L., and D.Z.; formal analysis, M.Y.; investigation, M.Y.; resources, J.L.; data curation, M.Y.; writing—original draft preparation, M.Y.; writing—review and editing, J.L. and D.Z.; visualization, M.Y.; supervision, M.Y.; project administration, J.L.; funding acquisition, J.L. All authors have read and agreed to the published version of the manuscript.
Funding
This research was funded by the Jilin Provincial Department of Science and Technology Project (YDZJ202401363ZYTS).
Institutional Review Board Statement
Not applicable.
Informed Consent Statement
Not applicable.
Data Availability Statement
All data is contained within the article.
Conflicts of Interest
The authors declare no conflicts of interest.
References
- Liu, Y.S. Modern human-land relationships and human-land system science. Geogr. Sci. 2020, 40, 1221–1234. [Google Scholar]
- Li, Y.; Tang, Q. Review of research methods on the relationship between people and land and the regional system of the relationship between people and land in China. Geogr. Res. 2018, 37, 1655–1670. [Google Scholar]
- Liu, H.; Fang, C.; Huang, J. Temporal and spatial evolution of human activity-ecological quality coupling in the Beijing-Tianjin-Hebei urban agglomeration. Acta Geogr. Sin. 2018, 73, 129–141. [Google Scholar]
- Turner, B.L.; Robbins, P. Land-change science and political ecology: Similarities, differences, and implications for sustainability science. Annu. Rev. Environ. Resour. 2008, 33, 295–316. [Google Scholar] [CrossRef]
- Liu, J.; Liu, Y.; Li, Y. Classification and valuation of ecosystem services for sustainable development of Northeast China. J. Clean. Prod. 2019, 228, 1–12. [Google Scholar] [CrossRef] [Scilit]
- Chen, M.; Li, Y.; Gong, Y. Population distribution and urbanization patterns on both sides of the Hu Huanyong Line: An attempt to answer Premier Li Keqiang’s question. Acta Geogr. Sin. 2016, 71, 179–193. [Google Scholar]
- Zhang, Y.; Ren, J.L.; Liu, K. Analysis of the Evolution Process and Driving Factors of Human-Land Relationship in Shandong Province over the Past 15 Years. J. Nat. Sci. 2019, 42, 1–8. [Google Scholar]
- Ma, L.; Jin, F.; Liu, Y. Analysis of the coupling degree pattern between China’s economy and environmental pollution and industrial structure. Acta Geogr. Sin. 2012, 67, 1299–1307. [Google Scholar]
- Lu, D. Research on the “Human-Environment System” Theory in Geography. Geogr. Res. 2002, 21, 135–145. [Google Scholar]
- Rockström, J.; Steffen, W.; Noone, K. A safe operating space for humanity. Nature 2009, 461, 472–475. [Google Scholar] [CrossRef] [Scilit]
- Liu, M.C.; Li, W.H. Measurement of China’s ecological footprint production factors based on net primary productivity. Acta Ecol. Sin. 2010, 30, 0402–0410. [Google Scholar]
- Borucke, M.; Moore, D.; Cranston, G. Accounting for demand and supply of the biosphere’s regenerative capacity: The National Footprint Accounts’ underlying methodology and framework. Ecol. Indic. 2013, 24, 518–533. [Google Scholar] [CrossRef] [Scilit]
- Ren, Z.; Xu, Q.; Yang, R. Study on the coordination relationship between ecosystem services and urbanization in the Wei River Basin based on a coupling model. Acta Geogr. Sin. 2018, 73, 87–103. [Google Scholar]
- Liu, Y.; Li, R.; Song, X. Analysis of the coupling degree between urbanization and ecological environment in China. Acta Nat. Sin. 2005, 20, 105–112. [Google Scholar] [CrossRef] [Scilit]
- Fang, C.; Zhou, C.; Gu, C. Theoretical framework and technical approaches for analyzing the interactive coupling effects between urbanization and ecological environment in megacity clusters. Acta Geogr. Sin. 2016, 71, 531–550. [Google Scholar]
- Song, Y.; Wang, J.; Ge, Y. An optimal parameters-based geographical detector model enhances geographic characteristics of explanatory variables for spatial heterogeneity analysis: Cases with different types of spatial data. GIScience Remote Sens. 2020, 57, 593–610. [Google Scholar] [CrossRef] [Scilit]
- Feng, Z.; Yang, Y.; You, Z. Research on the Land Resource Limitation and Limitation System of China’s Population Distribution. Geogr. Res. 2014, 33, 1395–1405. [Google Scholar]
- Xia, J.; Liu, C.; Ren, G. Research on the Impact of Climate Change on China’s Water Resources and Coping Strategies. China Sci. Earth Sci. 2011, 41, 1377–1391. [Google Scholar]
- Fan, J. The scientific basis of China’s main functional zoning. Acta Geogr. Sin. 2007, 62, 339–350. [Google Scholar]
- Ren, Q.; Chen, C. A Study of a Century of Change in the Human-Land Relationship in the Northeast Region: Population, Urban and Transport Development. Hum. Geogr. 2004, 5, 69–73. [Google Scholar] [CrossRef]
- Chen, J.; Chang, K.; Karacsonyi, D. Comparing urban land expansion and its driving factors in Shenzhen and Dongguan, China. Habitat Int. 2014, 43, 61–71. [Google Scholar] [CrossRef] [Scilit]
- Fu, B. Geography: From Knowledge, Science to Decision-Making. Acta Geogr. Sin. 2017, 72, 1923–1932. [Google Scholar]
- Cheng, Y.; Ren, J.; Xu, C. Evolution trends of human-land relationship in Shandong Province from the perspective of ecological civilization and its influencing factors. China Popul. Resour. Environ. 2015, 25, 121–127. [Google Scholar]
- Han, X.Z.; Zou, W.X. Research progress and future prospects of black soil conservation and utilization in Northeast China. Acta Soil Sci. 2021, 58, 537–544. [Google Scholar]
- Liu, J.; Diamond, J. China’s environment in a globalizing world. Nature 2005, 435, 1179–1186. [Google Scholar] [CrossRef] [Scilit]
- Li, C.; Li, P.; Tan, X. Research on the Driving Mechanism of Industrial Structure Adjustment and Upgrading in Northeast China. Geogr. Sci. 2004, 24, 258–263. [Google Scholar]
- Wei, H.K. Strategic Thoughts on Revitalizing Northeast China’s Economy. Econ. Rev. 2004, 9, 36–38. [Google Scholar] [CrossRef]
- Liu, T.; Cao, G.; Yan, Y. Urban land expansion and the floating population in China: An analysis of the 2000–2010 period. Cities 2016, 60, 495–503. [Google Scholar]
- Gu, S.Z. Reflections on the Construction of Property Right System of Natural Resource Assets. China Land 2019, 6, 4–7. [Google Scholar] [CrossRef]
- Zhang, X.; Sui, Y. Current status and conservation strategies of black soil resources in Northeast China. Soil Crops 2018, 7, 1–6. [Google Scholar]
- Zhao, Y.; Wang, S.; Zhou, C. Understanding the relation between urbanization and the eco-environment in China’s Yangtze River Delta using an improved EKC model and coupling analysis. Sci. Total Environ. 2016, 571, 862–875. [Google Scholar] [CrossRef] [Scilit]
- Ouyang, Z.; Wang, X.; Miao, H. Preliminary study on the ecosystem services function and ecological economic value of China’s terrestrial ecosystems. Acta Ecol. Sin. 1999, 19, 607–613. [Google Scholar]
- Liu, Y.; Li, J.; Zhang, H. An ecosystem service valuation of land use change in Taiyuan City, China. Ecol. Model. 2012, 225, 127–132. [Google Scholar] [CrossRef] [Scilit]
- Fang, C. The regularity and key directions of high-quality development of China’s new urbanization. Geogr. Res. 2019, 38, 13–22. [Google Scholar]
- Zhou, K.; Jian, X.; Wang, F. Spatiotemporal patterns and driving factors of environmental pollution in China. Acta Geogr. Sin. 2021, 76, 2664–2680. [Google Scholar]
- Bai, W.; Zhao, S. Analysis of the Driving Forces System of Land Use Change. Resour. Sci. 2001, 23, 39–41. [Google Scholar]
- Liu, J.; Zhang, Z.; Zhuang, D. Spatiotemporal characteristics and causes of land use change in China during the 1990s. Geogr. Res. 2003, 22, 1–12. [Google Scholar]
- Turner, B.L.; Meyer, W.B.; Skole, D.L. Global land-use/land-cover change: Towards an integrated study. Ambio 1994, 23, 91–95. [Google Scholar]
- Wu, Y.; Zhang, Y. Research on the Coupled and Coordinated Development of Regional Economic Growth and Environment in China. Resour. Sci. 2008, 30, 25–30. [Google Scholar]
- Ostrom, E. A general framework for analyzing sustainability of social-ecological systems. Science 2009, 325, 419–422. [Google Scholar] [CrossRef] [Scilit]
- Wang, J.; Xu, C. Geophysical detectors: Principles and prospects. Acta Geogr. Sin. 2017, 72, 116–134. [Google Scholar]
- Zhao, J.L.; Wang, J.F.; Li, L.F. Application of geodetectors in regional natural disaster risk assessment: A case study of landslide disasters in Chongqing. Adv. Geosci. 2014, 33, 145–152. [Google Scholar]
- Editorial Committee of “China Natural Geography”. China Natural Geography·General Theory; Science Press: Beijing, China, 1985. [Google Scholar]
- Sun, J.; Li, H. Path and Policy Research on Economic Transformation in Northeast China. Econ. Geogr. 2017, 37, 1–8. [Google Scholar]
- Liu, J.; Ning, J.; Kuang, W.; Xu, X.; Zhang, S.; Yan, C.; Li, R.; Wu, S.; Hu, Y.; Du, G.; et al. Spatio-temporal patterns and new characteristics of land-use change in China, 2010–2015. Acta Geogr. Sin. 2018, 73, 789–802. [Google Scholar]
- Liao, C. Quantitative evaluation and classification system of coordinated development of environment and economy A case study of urban agglomeration in Pearl River Delta. Trop. Geogr. 1999, 19, 171–177. [Google Scholar]
- Haberl, H.; Erb, K.H.; Krausmann, F. Quantifying and mapping the human appropriation of net primary production in earth’s terrestrial ecosystems. Proc. Natl. Acad. Sci. USA 2007, 104, 12942–12947. [Google Scholar] [CrossRef] [Scilit] [PubMed]
- Xu, Y.; Sun, X.; Tang, Q. Human activity intensity in terrestrial surface: Concepts, methods and applications. Acta Geogr. Sin. 2015, 70, 1068–1079. [Google Scholar]
- Xu, Y.; Sun, X. Evaluation method of human activity intensity and resource-environment carrying capacity in territorial spatial planning. Geogr. Res. 2020, 39, 2270–2282. [Google Scholar]
- Gao, J.; O’Neill, B.C. Mapping global urban land for the 21st century with data-driven simulations and Shared Socioeconomic Pathways. Nat. Commun. 2020, 11, 2302. [Google Scholar] [CrossRef] [Scilit]
- Wackernagel, M.; Rees, W.E. Our Ecological Footprint: Reducing Human Impact on the Earth; New Society Publishers: Gabriola Island, BC, Canada, 1996. [Google Scholar]
- Grossman, G.M.; Krueger, A.B. Economic growth and the environment. Q. J. Econ. 1995, 110, 353–377. [Google Scholar] [CrossRef] [Scilit]
- Liu, J.; Dietz, T.; Carpenter, S.R. Complexity of coupled human and natural systems. Science 2007, 317, 1513–1516. [Google Scholar] [CrossRef] [Scilit]
- Ehrlich, P.R.; Holdren, J.P. Impact of population growth. Science 1971, 171, 1212–1217. [Google Scholar] [CrossRef] [Scilit] [PubMed]
- Dietz, T.; Rosa, E.A. Rethinking the environmental impacts of population, affluence and technology. Hum. Ecol. Rev. 1994, 1, 277–300. [Google Scholar]
- Vörösmarty, C.J.; McIntyre, P.B.; Gessner, M.O. Global threats to human water security and river biodiversity. Nature 2010, 467, 555–561. [Google Scholar] [CrossRef] [Scilit] [PubMed]
- Jia, S.; Zhang, J.; Zhang, S. Regional water resources pressure index and water resources security evaluation index system. Adv. Geogr. Sci. 2002, 21, 538–545. [Google Scholar]
- O’Brien, K.L.; Leichenko, R.M. Double exposure: Assessing the impacts of climate change within the context of economic globalization. Glob. Environ. Change 2000, 10, 221–232. [Google Scholar] [CrossRef] [Scilit]
- Turner, B.L.; Kasperson, R.E.; Matson, P.A. A framework for vulnerability analysis in sustainability science. Proc. Natl. Acad. Sci. USA 2003, 100, 8074–8079. [Google Scholar] [CrossRef] [Scilit]

Disclaimer/Publisher’s Note: The statements, opinions and data contained in all publications are solely those of the individual author(s) and contributor(s) and not of MDPI and/or the editor(s). MDPI and/or the editor(s) disclaim responsibility for any injury to people or property resulting from any ideas, methods, instructions or products referred to in the content. |
© 2026 by the authors. Licensee MDPI, Basel, Switzerland. This article is an open access article distributed under the terms and conditions of the Creative Commons Attribution (CC BY) license.