Abstract
The relationship between forest ecosystem services and human health has emerged as a key topic in forest economics and health policy research. This study develops a spatial modelling framework to quantify the health benefits of forest ecosystem services and proposes policy mechanisms to incorporate these benefits into governmental health strategies. Using county-level panel data from 66 administrative units in Zhejiang Province, China, covering the period 2013–2023, we analyse the relationship between forest-mediated air purification services and two population health outcomes: the incidence of respiratory diseases and cardiovascular disease mortality. We employ a Spatial Durbin Model (SDM) to estimate both direct and spatial spillover effects across county boundaries. The findings indicate that forest ecosystem services exert significant negative effects on adverse health outcomes, with spillover effects extending beyond administrative boundaries. The monetised health benefit of forests is estimated at approximately RMB 1108.6 per hectare per year, substantially exceeding current ecological compensation standards and suggesting systematic undervaluation of forest health services. Heterogeneity analysis reveals that health benefits are greater in urbanised regions and among vulnerable population groups, including the elderly. These findings provide an empirical basis for reforming health-oriented ecological compensation mechanisms and offer implications for sustainable land use governance aligned with SDG 3 (Good Health and Well-being) and SDG 15 (Life on Land).
1. Introduction
The relationship between forest ecosystems and human health is receiving growing attention from researchers, policymakers, and public health practitioners worldwide. Forests function as natural infrastructure that supports population health through multiple pathways: they filter airborne particulate matter, regulate local temperatures, provide spaces for physical activity, and contribute to psychological restoration [1,2]. Understanding and quantifying these pathways has become increasingly urgent in the context of rapid urbanisation and persistent environmental degradation, particularly in developing economies where both forest endowment and public health systems are undergoing significant transformation.
China offers an important empirical setting for examining these relationships. Over the past two decades, large-scale afforestation programmes have increased net forest cover by approximately 42 million hectares between 2000 and 2023, making China one of the largest contributors to global forest area expansion [3]. At the same time, ambient fine particulate matter (PM2.5) pollution remains a leading health risk, causing an estimated 1.9 million premature deaths annually according to the Global Burden of Disease Study 2021 [4]. These two realities converge around a central policy question: how can forest ecosystem services be leveraged as nature-based solutions to improve population health, and how can the resulting health benefits inform the design of ecological compensation policies?
Forest ecosystem services and health outcomes. The literature on forest ecosystem services has expanded considerably over the past three decades, shifting from an early focus on provisioning services such as timber production towards a broader recognition of regulating and cultural services [5,6,7]. Within this expanded framework, health-related ecosystem services have attracted increasing attention. Studies have documented that urban green space and forest cover are associated with reduced respiratory disease burden [8,9,10], lower cardiovascular mortality [11], and improved mental health outcomes [12,13,14,15]. The primary mechanism linking forests to respiratory health operates through air purification: forest canopies absorb and intercept particulate matter, reducing ambient PM2.5 concentrations and thereby lowering exposure-related health risks [16,17,18,19]. While this air purification pathway is well established at the local scale, its magnitude, spatial extent, and interaction with socioeconomic factors remain incompletely understood, particularly at the regional scale using longitudinal data.
Spatial dimensions of environmental health effects. A second body of literature highlights the importance of spatial processes in shaping environmental health outcomes. Environmental exposures do not respect administrative boundaries: air pollutants disperse across jurisdictions, and forest cover in one county may generate health benefits in neighbouring areas through cross-boundary pollution reduction [20,21,22,23]. Spatial econometric methods, including Moran’s I statistics and spatial panel regression models, have been widely applied to detect spatial autocorrelation in health outcomes and to estimate spillover effects of environmental variables [24,25,26]. However, most existing studies on forest–health associations rely on cross-sectional designs that are ill-suited to capturing dynamic processes and are prone to omitted variable bias. Longitudinal spatial panel approaches that simultaneously account for direct and indirect effects remain relatively rare in the forest–health literature.
Economic valuation of forest health services. A third strand of the literature addresses the monetisation of ecosystem service health benefits, motivated by the need to incorporate these values into policy instruments such as ecological compensation schemes. Established methods include the cost-of-illness approach for morbidity outcomes and the value of a statistical life (VSL) approach for mortality outcomes [27,28,29,30]. Existing estimates suggest that forests generate substantial health benefits that are systematically undervalued in current compensation frameworks [31,32,33]. However, monetisation studies have typically focused on single ecosystem services and single health endpoints, and few have linked valuation estimates directly to spatially explicit regression results at the regional scale.
Research gaps and objectives. Despite this growing body of evidence, three important gaps remain. First, most studies adopt cross-sectional designs and examine single ecosystem services in isolation, limiting the ability to draw dynamic inferences or to assess the joint contribution of multiple forest service pathways. Second, the spatial dimension of forest health benefits—including heterogeneity across urban and rural contexts and spillover effects across administrative boundaries—has received insufficient attention. Third, a methodological framework that connects spatially explicit health effect estimates to policy-relevant economic valuations and that translates these valuations into concrete compensation mechanisms has yet to be developed for the Chinese context.
This study addresses these gaps through three specific objectives. First, we estimate the direct and spatial spillover effects of forest-mediated air purification services on respiratory disease incidence and cardiovascular disease mortality using a Spatial Durbin Model applied to an eleven-year county-level panel dataset from Zhejiang Province. Second, we monetise the estimated health benefits using established valuation methods to provide an empirical basis for evaluating ecological compensation standards. Third, we propose a health-oriented policy mechanism that integrates forest management with public health planning, grounded in the spatial and economic evidence generated by the empirical analysis. Together, these objectives contribute to the emerging literature on nature-based solutions to public health challenges and to the practical design of sustainable land governance instruments.
2. Data and Methods
2.1. Study Area
Zhejiang Province is located on the southeast coast of China, with geographic coordinates of 118°01′–123°10′ E and 27°03′–31°11′ N (Figure 1). It has a total area of about 105,500 km2, with mountainous and hilly land accounting for approximately 74.6%. The province has a subtropical monsoon climate, with annual precipitation levels of 1200 to 2200 mm and a mean annual temperature of 15 to 18 °C. Zhejiang Province has an abundance of forest resources.
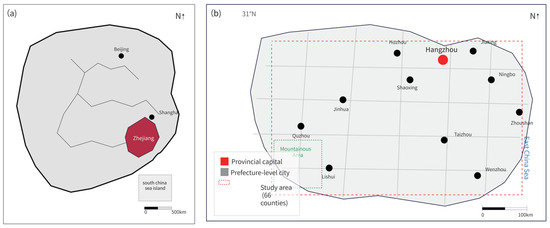
Figure 1.
Study area: county-level administrative units and spatial distribution of forest cover in Zhejiang Province. (a) Location of Zhejiang Province in China; (b) County-level administrative units and spatial distribution of forest cover in Zhejiang Province (66 counties).
Forest coverage stood at 61.5 in 2023, with the total forest area being over 6.68 million hectares. The forest ecosystem is dominated by subtropical evergreen broadleaved forest, with the main species being Chinese fir (Cunninghamia lanceolata) and moso bamboo (Phyllostachys edulis), with a wide range of broadleaf species. The province leads in enacting provincial-level regulations on ecological compensation based on watershed conservation, and it demonstrates strong national value in terms of institutional innovation. Population health in Zhejiang has been improving, with parameters such as life expectancy at birth standing at 80.1 years as of 2022. However, respiratory and cardiovascular diseases remain a substantial burden in urbanised regions. Nevertheless, the health surveillance system is well developed, and vital statistics data provide a good empirical basis for epidemiological research. In this paper, the study sample incorporates all 66 county-level units (counties, county-level cities, and districts) within the province for which complete panel data are available during the study period. This study employs a survey design and combines data obtained from various sources to create a complex county-level panel dataset that includes forest ecosystem services, health outcomes, and socioeconomic factors. A number of sources provide data on forest ecosystem services. The forest coverage rate and forest area by type are obtained from the continuous forest inventory of Zhejiang and annual statistics bulletins of the Provincial Forestry Bureau. The normalised difference vegetation index (NDVI) is calculated based on 250-metre-resolution satellite images from MODIS, and it is used to describe vegetation density and forest ecological functions.
2.2. Data Sources and Variable Construction
The primary explanatory variable of interest is forest coverage rate (FOREST), measured as the percentage of county land area covered by forest. This variable captures the aggregate stock of forest ecosystem services available within each county and serves as the main indicator of forest air purification capacity at the county scale. To complement the coverage measure, we include two additional forest ecosystem service indicators. The Normalised Difference Vegetation Index (NDVI) is derived from 250-metre-resolution MODIS (Moderate Resolution Imaging Spectroradiometer) satellite imagery collected by the Terra satellite (NASA, Goddard Space Flight Center, Greenbelt, MD, USA), specifically the MOD13Q1 Version 6.1 product, and reflects the density and photosynthetic activity of vegetation. While NDVI is not a direct measure of air purification capacity, it provides a spatially continuous and temporally consistent proxy for vegetation density and canopy structure, both of which are positively associated with particulate matter interception efficiency [18,19,34]. Its inclusion allows us to assess the robustness of the forest coverage results to alternative operationalisations of forest ecosystem services. The Air Purification Index (AIR_PUR) is estimated using algorithms that account for stand area, tree species composition, and leaf area index to approximate the mass of PM2.5 absorbed per hectare of forest annually [18,19,34]. This variable provides a more functionally specific measure of the air purification service pathway and is included as an alternative specification in robustness checks.
We acknowledge that these variables collectively capture the air purification pathway of forest ecosystem services and do not directly measure thermal regulation. Although thermal regulation is a potentially important forest health service, particularly through urban heat island mitigation, incorporating it rigorously would require fine-resolution land surface temperature data matched to health outcome records, which are not consistently available across all 66 county units over the full study period. The empirical analysis therefore focuses on the air purification pathway, for which both the service indicators and the mediating variable (PM2.5) are directly observable. The contribution of thermal regulation to forest health benefits is acknowledged as a limitation and identified as a direction for future research.
Health outcome data are obtained from the Zhejiang Provincial Health Commission and National Disease Surveillance Points System. The major dependent variables are the incidence of respiratory disease (ICD-10: J00–J99; newly confirmed cases/10,000 population), cardiovascular disease mortality (ICD-10: I00–I99; deaths/100,000 population), and all-cause mortality (deaths/100,000 population). Data on air quality are obtained as annual mean concentrations of PM2.5, PM10, SO2, NO2, and O3 in counties with monitoring stations; in counties without monitoring stations, missing values are imputed using ordinary kriging spatial interpolation implemented in ArcGIS (version 10.8; Esri, Redlands, CA, USA) following established methods [35].
Socioeconomic control variables are obtained from the Zhejiang Statistical Yearbook and county-level statistical communiqués [36], and they include: per capita GDP (constant 2023 RMB 10,000), population density (persons/km2), urbanisation rate (%), mean years of schooling (years), healthcare resources (hospital beds per 1000 population), and demographic structure (proportion of population aged 65 or above). Meteorological data (mean annual temperature, annual precipitation, and relative humidity) are obtained from the China Meteorological Data Service Centre.
Table 1 reports the definitions of and descriptive statistics for all variables. Detailed data sources for all variables are provided in Table A1 (Appendix A).

Table 1.
Variable definitions and descriptive statistics.
2.3. Empirical Strategy
The empirical strategy proceeds in three sequential stages that correspond to the three research objectives stated in the Introduction: (1) exploratory spatial data analysis to characterise spatial dependence in health outcomes; (2) spatial panel regression to estimate the direct and spillover effects of forest ecosystem services on health outcomes; and (3) monetisation of the estimated health effects. Each stage is described below.
2.3.1. Spatial Autocorrelation Methods
We first employ Moran’s I statistic to test for spatial autocorrelation in health outcomes:
where n is the number of spatial units, yi is the health outcome value for unit i, is the sample mean, and wij are elements of the spatial weight matrix W. The spatial weight matrix is constructed using the Queen contiguity rule, whereby county-level units sharing a common boundary or vertex are classified as neighbours; the matrix is row-standardised such that each row sums to unity. Local Indicators of Spatial Association (LISA) are computed following Anselin [23] to identify local spatial clustering patterns and outliers. A statistically significant positive Moran’s I would indicate that counties with similar health outcome levels tend to cluster geographically, providing the empirical motivation for spatial panel regression methods.
2.3.2. Spatial Panel Regression Model
The choice of spatial model specification is motivated by two theoretical considerations. First, health outcomes are likely to exhibit spatial dependence: air quality—the primary mediating variable—is determined by emissions and meteorological conditions that are inherently spatially continuous, so that health outcomes in one county are plausibly affected by environmental conditions in neighbouring counties. Second, the explanatory variables, particularly forest coverage, are also spatially correlated, as forests tend to cluster geographically and their air purification benefits disperse across boundaries. When both the dependent variable and the explanatory variables exhibit spatial dependence, the Spatial Durbin Model (SDM) is the theoretically appropriate specification, as it accommodates spatial lags in both the outcome and the regressors simultaneously [22,24,25,26,37,38,39]. In contrast, the Spatial Lag Model (SLM) captures dependence only in the outcome variable, and the Spatial Error Model (SEM) treats spatial dependence as a nuisance in the error term rather than modelling it structurally. We formally test the SDM against both nested alternatives using Wald tests and likelihood ratio tests, and report the results in Section 3.3. All spatial panel estimations are implemented using the spatial econometrics toolbox for MATLAB developed by Elhorst [26] in MATLAB (version R2023b; MathWorks, Natick, MA, USA).The SDM is specified as follows:
where Hit is the health outcome for county i in year t; Xit is a vector of explanatory variables comprising forest ecosystem service indicators, PM2.5 concentration, and socioeconomic control variables; W is the row-standardised spatial weight matrix; ρ is the spatial autoregressive coefficient, which measures the degree to which health outcomes in county i are influenced by health outcomes in neighbouring counties after conditioning on observed covariates; β represents the own-county effects of the explanatory variables; θ captures the spatial lag effects of the explanatory variables, reflecting how changes in covariates in neighbouring counties affect health outcomes in county i; μi and λt are county and year fixed effects, respectively; and εit is the idiosyncratic error term assumed to be independently and identically distributed.
Because spatial dependence induces feedback loops across units, the coefficient estimates β and θ cannot be directly interpreted as marginal effects. Following LeSage and Pace [22], we decompose the total effect into: (i) the direct effect, defined as the average impact of a unit change in a covariate in county i on the health outcome in county i itself; and (ii) the indirect effect (spatial spillover), defined as the average impact of a unit change in a covariate in county i on health outcomes in all other counties j ≠ i.
This study tests three hypotheses using the SDM framework.
Hypothesis 1.
Greater forest coverage is associated with lower respiratory disease incidence within counties (direct effect) and in neighbouring counties (indirect/spillover effect), mediated through the air purification pathway.
Hypothesis 2.
The health benefits of forest coverage are heterogeneous across urbanisation levels, with larger effects in highly urbanised counties where baseline pollution is higher and green space is scarcer.
Hypothesis 3.
The monetary value of forest health benefits exceeds current ecological compensation standards, indicating systematic undervaluation of forest ecosystem services.
Comprehensive model selection test results are reported in Table A2 (Appendix B).
2.3.3. Monetisation Methods
We employ two complementary methods to convert the estimated health effects into monetary values. For incidence outcomes (respiratory disease), we apply the cost-of-illness approach:
where ΔCases is the estimated reduction in disease incidence attributable to forest ecosystem services, Cmedical is the average medical expenditure per case, and Cproductivity is the productivity loss per case. For mortality outcomes, we apply the value of a statistical life (VSL) approach:
where ΔDeaths is the estimated reduction in deaths attributable to forest coverage, and VSL is the value of a statistical life. Drawing on recent estimates calibrated for the Chinese population [27], we adopt RMB 6.2 million as the central VSL estimate, with RMB 4.68 million and RMB 7.85 million as the lower and upper bounds for sensitivity analysis, respectively. The total health benefit per hectare of forest is derived by aggregating the monetised morbidity and mortality benefits and dividing by the total forest area in Zhejiang Province.
2.4. Robustness Checks Design
A number of robustness checks are performed to determine the validity of the results. First, other specifications of spatial weight matrices, such as k-nearest neighbours and inverse distance weights, are used. Second, the instrumental variable (IV) is estimated; historical forest cover (1990 data) is used to estimate contemporary forest cover in order to overcome the endogeneity issue. Third, subsample heterogeneity is examined by stratifying subsamples by urban–rural categorisation and economic development level.
3. Results
3.1. Spatial Distribution of Forest Ecosystem Services and Health Outcomes
Figure 2 illustrates the spatial distribution of county-level forest coverage rates and the incidence of respiratory disease across Zhejiang Province in 2023. Counties in the mountainous southwestern part of the province—such as Qingyuan, Longquan, and Jingning—tend to have forest coverage rates exceeding 70%, whereas urbanised counties in the coastal region, including metropolitan Ningbo, Jiaxing, and Shaoxing, have rates below 30%.
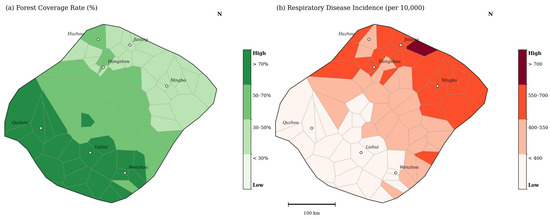
Figure 2.
Spatial distribution of forest coverage and respiratory disease incidence at the county level in Zhejiang Province (2023).
The incidence of respiratory disease shows an approximately mirror-image spatial pattern, being higher in the urbanised coastal strip and markedly lower in the heavily forested mountainous counties. This descriptive correspondence suggests a negative association between forest coverage and respiratory disease incidence; however, establishing the direction and magnitude of this relationship requires formal statistical testing with adequate controls for confounding variables, which is undertaken in Section 3.3. The spatial pattern of cardiovascular disease mortality is more complex: mortality rates are elevated in urbanised regions due to pollution and lifestyle factors, but are also relatively high in several rural areas due to limited healthcare access and ageing populations.
3.2. Spatial Autocorrelation Analysis
Table 2 reports the global Moran’s I statistics for health outcome indicators across selected years and for the pooled sample. All three indicators exhibit statistically significant positive spatial autocorrelation at the 1% level throughout the study period, confirming that neighbouring counties tend to share similar health outcome levels. This finding motivates the use of spatial panel regression methods that explicitly model cross-county dependence.
Table 2.
Global Moran’s I statistics for health outcome indicators.
Moran’s I values display a moderate upward trend over the study period, reflecting a strengthening of spatial clustering in health outcomes consistent with deepening regional integration and intensifying spatial spillovers from environmental and socioeconomic factors. Figure 3 presents a LISA cluster map of respiratory disease incidence in 2023.
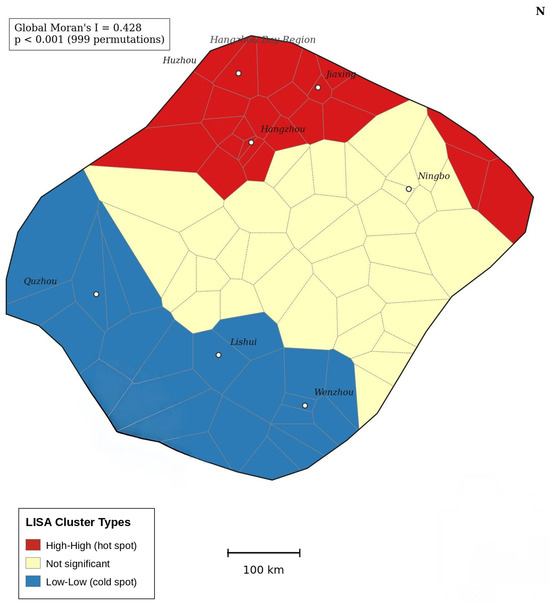
Figure 3.
LISA cluster map of the incidence of respiratory disease in Zhejiang Province (2023).
The LISA analysis identifies significant high–high clusters in the Hangzhou Bay region and low–low clusters in the southwestern mountains, further corroborating the spatial heterogeneity patterns identified in the descriptive analysis.
3.3. Spatial Panel Regression Results
Before presenting the main regression estimates, we report the results of model selection tests. Wald tests and likelihood ratio tests comparing the SDM against the nested SLM and SEM specifications both reject the restrictions imposed by the simpler models at the 1% significance level (Wald test for SLM restriction: χ2 = 38.4, p < 0.01; Wald test for SEM restriction: χ2 = 31.7, p < 0.01). These results confirm that the SDM is the appropriate specification for the data, consistent with the theoretical motivation outlined in Section 2.3.2.
The results provide consistent support for Hypothesis 1. Forest coverage is negatively and significantly associated with respiratory disease incidence across all model specifications. In the full model (Model 3), a one-percentage-point increase in forest coverage is associated with a reduction of 1.312 cases per 10,000 population within the county (direct effect) and an additional reduction of 0.624 cases per 10,000 in neighbouring counties (indirect/spillover effect), yielding a total effect of 1.936 cases per 10,000 (Table 3). The positive and significant spatial autoregressive coefficient ρ across all specifications indicates that health outcomes in a given county are influenced by health outcomes in neighbouring counties even after controlling for observed spatial lags in the explanatory variables.
Table 3.
SDM estimation results: forest ecosystem services and the incidence of respiratory disease.
PM2.5 concentration has a strong positive effect on respiratory disease incidence: each 1 μg/m3 increase in annual mean PM2.5 is associated with an increase of 1.924 cases per 10,000 within the county and 0.958 cases per 10,000 in neighbouring counties, consistent with the epidemiological literature [40,41]. The negative and significant interaction term in Model 4 (coefficient = −0.031, p < 0.05) indicates that forest coverage moderates the health-damaging effect of PM2.5, which is theoretically consistent with the mechanism by which forest canopies intercept and absorb particulate matter.
Table 4 reports the estimation results for cardiovascular disease mortality and all-cause mortality under the full model specification (Model 3). The mortality estimates corroborate the incidence-level findings: a one-percentage-point increase in forest coverage is associated with a combined reduction (direct plus spillover) of 0.582 deaths per 100,000 population for cardiovascular disease and 0.787 deaths per 100,000 population for all-cause mortality, with both effects being statistically significant.
Table 4.
SDM estimation results: forest ecosystem services and mortality outcomes.
3.4. Heterogeneity Analysis
To examine whether the health effects of forest ecosystem services vary systematically across contexts, we estimate subsample models stratified by urbanisation level and degree of population ageing, using the sample median as the threshold for classification. The results are reported in Table 5.
Table 5.
Heterogeneity analysis: direct effect estimates of forest coverage by subsample.
The heterogeneity analysis reveals a consistent pattern in support of Hypothesis 2: the health benefits of forests are significantly larger in counties with higher levels of urbanisation and in those with higher proportions of elderly population. In highly urbanised counties, a one-percentage-point increase in forest coverage is associated with a reduction of 1.653 respiratory disease cases per 10,000 population, compared with only 0.857 cases in less urbanised counties—a difference of approximately 93%.
Two theoretical mechanisms explain the larger benefits observed in urbanised settings. First, a scarcity premium mechanism: in counties where natural vegetation is scarce relative to the built environment, each additional unit of forest cover provides greater marginal air purification benefits. Second, a baseline pollution mechanism: highly urbanised counties exhibit significantly higher baseline PM2.5 concentrations, and the interaction term in Model 4 confirms that the health-protective effect of forest cover is amplified under high-pollution conditions. Together, these mechanisms imply that targeted forest expansion in peri-urban and urban areas would yield disproportionately large health returns.
The larger health benefits observed among elderly populations reflect the well-documented heightened vulnerability of older adults to air pollution exposure. Individuals aged 65 and above exhibit reduced respiratory and cardiovascular reserve capacity, impaired immune responses, and higher rates of pre-existing cardiopulmonary conditions, all of which amplify the marginal harm of particulate matter and, correspondingly, the marginal benefit of pollution reduction through forest air purification services.
3.5. Robustness Checks
Table 6 summarises the results of robustness checks using alternative spatial weight matrices and instrumental variable (IV) estimation. The main findings are qualitatively consistent and statistically significant across all alternative specifications.
Table 6.
Robustness checks: direct effect of forest coverage on the incidence of respiratory disease under alternative specifications.
The IV estimate (−1.438) is slightly larger in magnitude than the OLS-based baseline (−1.312), consistent with mild attenuation bias due to measurement error in contemporaneous forest coverage data. The instrument satisfies the relevance condition (first-stage F-statistic = 43.8) and is plausibly exogenous given that 1990 forest conditions predate the study period. The upward correction in the IV estimate suggests that the baseline results, if anything, understate the true health benefits of forest ecosystem services.
3.6. Monetisation Results
Based on the regression estimates from Model 3 and the valuation parameters described in Section 2.3.3, we calculate the monetary value of health benefits attributable to forest ecosystem services in Zhejiang Province.
Regarding morbidity benefits, a one-percentage-point increase in provincial forest coverage reduces respiratory disease incidence by 1.936 cases per 10,000 population (direct plus spillover effects). Applied to Zhejiang’s population of 65.8 million, this implies approximately 12,738 fewer respiratory disease cases per year. At an average cost of illness of RMB 10,200 per case, the annualised morbidity benefit is approximately RMB 130 million.
Regarding mortality benefits, a one-percentage-point increase in forest coverage reduces all-cause mortality by 0.787 deaths per 100,000 population, corresponding to approximately 518 fewer deaths province-wide per year. At the central VSL estimate of RMB 6.2 million, the annualised mortality benefit is approximately RMB 3211.6 million.
Aggregating morbidity and mortality benefits and dividing by the total forest area of Zhejiang Province (6.68 million hectares), the implied health benefit per hectare of forest is approximately RMB 1108.6 per year under the central VSL scenario. As shown in Table 7, sensitivity analysis using low and high VSL bounds yields estimates of RMB 850.3 and RMB 1387.4 per hectare per year, respectively. All three scenarios substantially exceed the current provincial ecological compensation standard of RMB 225–600 per hectare, providing quantitative support for Hypothesis 3. The spatial heterogeneity of these monetised benefits across counties is illustrated in Figure 4.
Table 7.
Estimates of the health benefits of forest ecosystem services in Zhejiang Province.
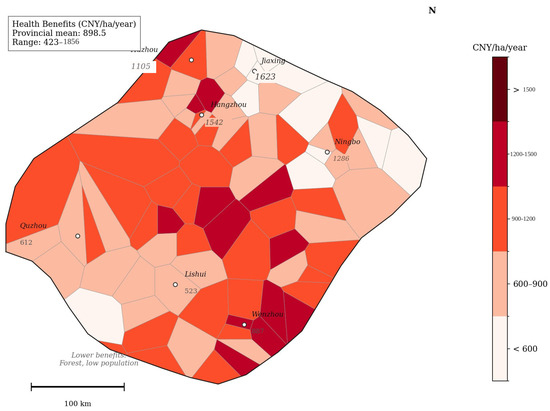
Figure 4.
Spatial distribution of the monetary value of forest ecosystem service health benefits at the county level in Zhejiang Province.
4. Discussion
4.1. Synthesis of Findings
This study provides spatially explicit empirical evidence that forest ecosystem services generate substantial population health benefits through the air purification pathway. The central finding—that a one-percentage-point increase in county-level forest coverage reduces respiratory disease incidence by approximately 1.936 cases per 10,000 and all-cause mortality by 0.787 deaths per 100,000 (including spillover effects)—is consistent across model specifications, robust to alternative spatial weight matrices, and survives an instrumental variable correction for potential endogeneity.
The mechanisms underlying these effects operate primarily through the particulate matter reduction pathway. Forest canopies intercept and absorb PM2.5 through both dry deposition on leaf surfaces and the physical obstruction of particle movement through the canopy structure [18,19]. The significance of PM2.5 as a mediating variable across all model specifications, combined with the negative and significant forest–PM2.5 interaction term, provides direct empirical support for this pathway. The spatial spillover effects are consistent with the atmospheric transport of particulate matter across administrative boundaries, confirming that the air purification service has a regional rather than purely local character.
The heterogeneity results reveal two important moderating conditions. First, the scarcity of natural green space in urbanised environments amplifies the marginal value of forest cover. Second, high ambient pollution levels in urbanised counties create a stronger demand for natural air filtration, so that the health-protective effect of forest cover is most pronounced precisely where it is most needed. These findings are theoretically coherent and have direct implications for the spatial targeting of forest expansion investments.
4.2. Comparison with the Existing Literature
The magnitude of our health effect estimates is broadly consistent with, and in some respects extends, the existing literature on green space and health outcomes. Wang et al. found a significant negative association between urban green space coverage and depressive symptoms in Guangzhou [42], while Liu et al. documented a negative relationship between residential greenness and diabetes prevalence across Chinese cities [43]. The current study contributes to this body of evidence, which also includes county-level analyses of forest health benefits in Chinese cities [44,45], by providing county-level panel estimates that capture dynamic effects over an eleven-year period and by explicitly decomposing health benefits into direct and cross-boundary spillover components.
In terms of magnitude, our per-hectare health benefit estimate of RMB 1108.6 per year is broadly consistent with international evidence. Nowak et al. estimated that urban trees in the United States remove approximately 17.4 million tonnes of air pollution annually, generating health benefits valued at USD 6.8 billion [18]. Adjusted for income-level differences using purchasing power parity and income-scaled VSL methods, this figure implies per-hectare benefit ranges that overlap with our central estimate. Our finding that current ecological compensation standards substantially undervalue forest health services is consistent with evidence from international contexts [31,32,46].
A notable contribution of the current study relative to the existing Chinese literature is the explicit treatment of spatial spillover effects. The finding that approximately one-third of total health benefits accrue to counties other than those in which the forest is located has important implications for compensation design: a purely local framework will systematically underprovide conservation incentives because forest-owning jurisdictions cannot capture the full value of the services they generate [20]. This market failure provides a strong economic rationale for intergovernmental transfer payment mechanisms.
4.3. Policy Implications
4.3.1. Health-Oriented Ecological Compensation Mechanisms
The monetisation results provide empirical context relevant to the reform of ecological compensation standards. The central finding that the health benefit of forest ecosystem services amounts to RMB 1108.6 per hectare per year—substantially exceeding the current provincial compensation standard of RMB 225–600 per hectare—suggests that existing schemes may not fully capture the social value of forest health services, and that there may be scope for upward revision from a public health perspective. Based on these findings, we outline a three-layer reform framework as a tentative policy reference.
First, compensation standards could be spatially differentiated to reflect the heterogeneous health value documented in Section 3.4. Forest plots located in close proximity to densely populated, highly urbanised, or high-pollution counties appear to generate greater marginal health benefits per hectare. Compensation rates could therefore be calibrated to reflect proximity to beneficiary populations and local pollution baselines, subject to broader institutional and fiscal considerations. The subsample estimates in Table 5 provide empirical parameters that could inform the design of such spatial differentiation.
Second, health impact assessment could be more formally integrated into the evaluation of major forestry policy decisions. When governments consider afforestation programmes, land use conversion decisions, or the designation of conservation areas, spatially explicit modelling frameworks such as the one developed in this study could be applied to generate quantitative health impact estimates that supplement conventional cost–benefit analyses.
Third, the spatial spillover results in Table 3 demonstrate that approximately 32% of the total health benefit of forest cover accrues to neighbouring counties [20]. This externality provides a direct quantitative rationale for intergovernmental horizontal transfer payment schemes, whereby counties that benefit from cross-boundary air purification services compensate the counties that maintain the forest stock. Zhejiang’s existing watershed-based ecological compensation system provides an institutional model that could be adapted to incorporate this mechanism.
4.3.2. Cross-Sectoral Coordination
Effective integration of forest ecosystem services into public health strategy requires sustained institutional coordination between forestry and health authorities, which currently operate largely in separate administrative silos. We propose three specific coordination mechanisms grounded in the findings of this study.
First, joint planning mechanisms at the provincial and prefectural levels could help ensure that forestry planning decisions are better informed by public health priorities and vice versa. The heterogeneity results in Section 3.4 suggest that health returns to forest expansion may be particularly high in urbanised and high-ageing counties; these spatial priorities could usefully be considered in forestry planning. Representation of health authorities in forestry management planning may help ensure that health co-benefits are monitored alongside ecological indicators.
Second, incorporating forest ecosystem service indicators—including forest coverage rates and estimated air purification capacity—into public health monitoring and reporting systems at the county level could facilitate more integrated environmental health governance. A shared data infrastructure linking forestry bureau statistics with health commission disease surveillance records could support ongoing evaluation of the forest–health relationship.
Third, the evidence that health benefits appear disproportionately concentrated among elderly populations (Section 3.4) suggests that forest management could usefully be considered within healthy ageing policy frameworks. Counties with high and rising proportions of elderly residents may warrant particular attention in both forest conservation funding allocation and targeted health monitoring, subject to broader resource allocation considerations.
4.3.3. Targeted Forest Expansion
The heterogeneity analysis results provide a spatially explicit basis for prioritising forest expansion investments to maximise health co-benefits. Urbanised and peri-urban counties characterised by high population density, elevated ambient pollution, and limited green space endowment offer the greatest potential returns to additional forest cover, as documented by the substantially larger effect estimates in the high-urbanisation subsample (Table 5). Zhejiang’s existing Forest Town (森林城镇) programme represents an appropriate policy vehicle for implementing these recommendations.
More broadly, the findings of this study contribute to the evidence base for sustainable land governance aligned with the United Nations Sustainable Development Goals [47]. The quantified health benefits connect directly to SDG 3 (Good Health and Well-being) by demonstrating that forest conservation and expansion are effective nature-based interventions for reducing the burden of respiratory and cardiovascular disease. The spillover results reinforce the case for cross-jurisdictional cooperation in forest management, consistent with SDG 15 (Life on Land) and SDG 11 (Sustainable Cities and Communities). By providing monetised estimates of health co-benefits, this study supports the case for treating forests as multifunctional sustainability infrastructure whose full social value extends well beyond timber production or carbon sequestration [48,49].
4.4. Limitations and Future Directions
This study has several limitations that qualify the interpretation of its findings and point towards directions for future research.
Regarding data constraints, the health outcome variables are derived from registered administrative records and formal healthcare institutions. This introduces potential under-reporting bias, particularly for mild respiratory conditions that may not prompt formal medical consultation. Future studies using household survey data or primary health screening records would provide a more complete picture of the forest–health relationship.
Regarding identification, while the instrumental variable strategy using 1990 historical forest coverage addresses the most obvious source of endogeneity, it cannot fully eliminate the possibility of confounding from time-varying unobserved variables. Individual-level longitudinal data combined with quasi-experimental variation in forest cover would provide stronger causal identification.
Regarding the scope of ecosystem services, this study focuses on the air purification pathway and does not directly estimate the health benefits of thermal regulation, noise reduction, or psychological restoration. As noted in Section 2.2, the exclusion of thermal regulation reflects data availability constraints. Recent evidence suggests that forest cover significantly mitigates urban heat island effects and that high ambient temperatures independently increase cardiovascular and respiratory mortality [8,12,50]. Future research incorporating land surface temperature data would enable a more comprehensive assessment of the total health value of forest ecosystem services.
Regarding spatial and temporal scope, the analysis is conducted at the county level, which may obscure important within-county heterogeneity. Finer-resolution analyses using gridded exposure data and residential address-level health records would permit more precise estimation of exposure–response relationships. The study period of 2013–2023 may not fully capture the lagged health effects of forest expansion, as biological mechanisms linking air quality improvement to chronic disease outcomes typically operate over longer time horizons.
Finally, the monetisation estimates are sensitive to the choice of VSL. We address this through sensitivity analysis across a range of VSL estimates, but acknowledge that the central estimate of RMB 6.2 million carries substantial uncertainty. As VSL estimation methods improve, the monetary benefit estimates reported here should be updated accordingly.
5. Conclusions
This study develops and applies a spatial modelling framework to quantify the health benefits of forest ecosystem services and to translate these benefits into actionable policy instruments. Using an eleven-year county-level panel dataset from 66 administrative units in Zhejiang Province, China, we estimate a Spatial Durbin Model that simultaneously captures the direct and cross-boundary spillover effects of forest-mediated air purification services on respiratory disease incidence and cardiovascular disease mortality. The results demonstrate that forest ecosystem services generate statistically significant, spatially extensive, and economically substantial health benefits: a one-percentage-point increase in forest coverage reduces respiratory disease incidence by approximately 1.936 cases per 10,000 population and all-cause mortality by 0.787 deaths per 100,000 population when direct and spillover effects are combined. The monetised health benefit amounts to approximately RMB 1108.6 per hectare per year under the central valuation scenario, substantially exceeding current ecological compensation standards and suggesting that compensation mechanisms may benefit from incorporating health co-benefits into their design.
Three findings deserve particular emphasis. First, the spatial spillover effects imply that a purely local compensation framework may systematically underprovide forest conservation incentives, suggesting that intergovernmental horizontal transfer payment mechanisms could be considered to help internalise these externalities. Second, the heterogeneity analysis reveals that health benefits appear disproportionately large in urbanised and high-ageing counties, pointing to the potential importance of spatially targeted forest expansion in peri-urban areas. Third, the instrumental variable results are consistent with a causal interpretation of the estimated associations, though further identification strategies using finer-resolution data would help strengthen confidence in the policy recommendations.
These findings contribute to the emerging evidence base for nature-based solutions to public health challenges and to the design of sustainable land governance instruments. By providing quantified estimates of forest health co-benefits, this study offers empirical grounding for considering the integration of forest ecosystem service management into health policy and sustainable development planning aligned with SDG 3, SDG 11, and SDG 15 [47,48,49]. Future research should extend this framework to incorporate additional ecosystem service pathways—particularly thermal regulation and psychological restoration—and to apply finer-resolution exposure data that can capture within-county heterogeneity in forest benefits and population vulnerability.
Author Contributions
Conceptualization, G.T. and Y.Z.; Methodology: Y.Z. and G.T.; Software: Y.Z.; Validation: Y.Z. and G.T.; Formal analysis: Y.Z.; Investigation: Y.Z.; Resources: G.T.; Data curation: Y.Z.; Writing—original draft preparation: Y.Z.; Writing—review and editing: G.T. and Y.Z.; Visualization: Y.Z.; Supervision: G.T.; Project administration: Y.Z.; Funding acquisition: Y.Z. All authors have read and agreed to the published version of the manuscript.
Funding
This study was funded by the Basic Research on Basic Scientific Research and Business Expenses of Heilongjiang Provincial Department of Education: Research on the development of forest ecological products in the context of ecological poverty alleviation in Heilongjiang (No. 2020-KYWF-0315).
Institutional Review Board Statement
Not applicable.
Informed Consent Statement
Not applicable.
Data Availability Statement
The original contributions presented in this study are included in the article. Further inquiries can be directed to the corresponding author.
Acknowledgments
The authors thank the anonymous reviewers for their constructive comments that improved this manuscript. We also thank MDPI’s Author Services for the professional language revision.
Conflicts of Interest
The authors declare no conflicts of interest.
Appendix A
Table A1.
Variable definitions and data sources.
Appendix B
Table A2.
Model selection test results.
References
- Frumkin, H.; Bratman, G.N.; Breslow, S.J.; Cochran, B.; Kahn, P.H.; Lawler, J.J.; Levin, P.S.; Tandon, P.S.; Varanasi, U.; Wolf, K.L.; et al. Nature contact and human health: A research agenda. Environ. Health Perspect. 2017, 125, 075001. [Google Scholar] [CrossRef] [PubMed]
- Twohig-Bennett, C.; Jones, A. The health benefits of the great outdoors: A systematic review and meta-analysis of greenspace exposure and health outcomes. Environ. Res. 2018, 166, 628–637. [Google Scholar] [CrossRef] [PubMed]
- Chen, C.; Park, T.; Wang, X.; Piao, S.; Xu, B.; Chaturvedi, R.K.; Fuchs, R.; Brovkin, V.; Ciais, P.; Fensholt, R.; et al. China and India lead in greening of the world through land-use management. Nat. Sustain. 2019, 2, 122–129. [Google Scholar] [CrossRef]
- GBD 2021 Risk Factors Collaborators. Global burden and strength of evidence for 106 risk factors in 204 countries and territories, 1990–2021. Lancet 2024, 403, 2162–2203. [CrossRef]
- Millennium Ecosystem Assessment. Ecosystems and Human Well-Being: Synthesis; Island Press: Washington, DC, USA, 2005. [Google Scholar]
- TEEB. The Economics of Ecosystems and Biodiversity; Kumar, P., Ed.; Earthscan: London, UK, 2010. [Google Scholar]
- Costanza, R.; de Groot, R.; Sutton, P.; van der Ploeg, S.; Anderson, S.J.; Kubiszewski, I.; Farber, S.; Turner, R.K. Changes in the global value of ecosystem services. Glob. Environ. Change 2014, 26, 152–158. [Google Scholar] [CrossRef]
- Eisenman, T.S.; Churkina, G.; Jariwala, S.P.; Kumar, P.; Lovasi, G.S.; Pataki, D.E.; Weinberger, K.R.; Whitlow, T.H. Urban trees, air quality, and asthma: An interdisciplinary review. Landsc. Urban Plan. 2019, 187, 47–59. [Google Scholar] [CrossRef]
- Rao, M.; George, L.A.; Rosenstiel, T.N.; Shandas, V.; Dinno, A. Assessing the relationship among urban trees, nitrogen dioxide, and respiratory health. Environ. Pollut. 2014, 194, 96–104. [Google Scholar] [CrossRef]
- Donovan, G.H.; Butry, D.T.; Michael, Y.L.; Prestemon, J.P.; Liebhold, A.M.; Gatziolis, D.; Mao, M.Y. The relationship between trees and human health: Evidence from the spread of the emerald ash borer. Am. J. Prev. Med. 2013, 44, 139–145. [Google Scholar] [CrossRef] [PubMed]
- Villeneuve, P.J.; Jerrett, M.; Su, J.G.; Burnett, R.T.; Chen, H.; Wheeler, A.J.; Goldberg, M.S. A cohort study relating urban green space with mortality in Ontario, Canada. Environ. Res. 2012, 115, 51–58. [Google Scholar] [CrossRef]
- Bowler, D.E.; Buyung-Ali, L.M.; Knight, T.M.; Pullin, A.S. Urban greening to cool towns and cities: A systematic review. Landsc. Urban Plan. 2010, 97, 147–155. [Google Scholar] [CrossRef]
- James, P.; Banay, R.F.; Hart, J.E.; Laden, F. A review of the health benefits of greenness. Curr. Epidemiol. Rep. 2015, 2, 131–142. [Google Scholar] [CrossRef]
- Dadvand, P.; Nieuwenhuijsen, M.J.; Esnaola, M.; Forns, J.; Basagaña, X.; Alvarez-Pedrerol, M.; Rivas, I.; López-Vicente, M.; De Castro Pascual, M.; Su, J. Green spaces and cognitive development in primary schoolchildren. Proc. Natl. Acad. Sci. USA 2015, 112, 7937–7942. [Google Scholar] [CrossRef] [PubMed]
- Gascon, M.; Triguero-Mas, M.; Martínez, D.; Dadvand, P.; Forns, J.; Plasència, A.; Nieuwenhuijsen, M.J. Mental health benefits of long-term exposure to residential green and blue spaces: A systematic review. Int. J. Environ. Res. Public Health 2015, 12, 4354–4379. [Google Scholar] [CrossRef]
- Nowak, D.J.; Hirabayashi, S.; Bodine, A.; Hoehn, R. Modeled PM2.5 removal by trees in ten US cities and associated health effects. Environ. Pollut. 2013, 178, 395–402. [Google Scholar] [CrossRef]
- Pugh, T.A.M.; MacKenzie, A.R.; Whyatt, J.D.; Hewitt, C.N. Effectiveness of green infrastructure for improvement of air quality in urban street canyons. Environ. Sci. Technol. 2012, 46, 7692–7699. [Google Scholar] [CrossRef] [PubMed]
- Nowak, D.J.; Crane, D.E.; Stevens, J.C. Air pollution removal by urban trees and shrubs in the United States. Urban For. Urban Green. 2006, 4, 115–123. [Google Scholar] [CrossRef]
- Hirabayashi, S.; Kroll, C.N.; Nowak, D.J. i-Tree Eco Dry Deposition Model Descriptions; Citeseer: Princeton, NJ, USA, 2012. [Google Scholar]
- Wang, H.; Ren, Y.; Chang, X.; Wu, S.; Liang, T.; Cheng, W.; Shi, D.; Zhang, L. Optimizing Forest Ecosystem Service Compensation Using Spillover Analysis: Evidence from Linyi’s Indicator Trading Policy, China. Sustainability 2026, 18, 643. [Google Scholar] [CrossRef]
- Song, Y.; Huang, B.; Cai, J.; Chen, B. Dynamic assessments of population exposure to urban greenspace using multi-source big data. Sci. Total Environ. 2018, 634, 1315–1325. [Google Scholar] [CrossRef]
- LeSage, J.P.; Pace, R.K. Introduction to Spatial Econometrics; CRC Press: Boca Raton, FL, USA, 2009. [Google Scholar]
- Anselin, L. Local indicators of spatial association—LISA. Geogr. Anal. 1995, 27, 93–115. [Google Scholar] [CrossRef]
- Elhorst, J.P. Spatial Econometrics: From Cross-Sectional Data to Spatial Panels; Springer: Berlin/Heidelberg, Germany, 2014. [Google Scholar]
- Anselin, L. Spatial Econometrics: Methods and Models; Kluwer Academic Publishers: Dordrecht, The Netherlands, 1988. [Google Scholar]
- Elhorst, J.P. Matlab software for spatial panels. Int. Reg. Sci. Rev. 2014, 37, 389–405. [Google Scholar] [CrossRef]
- Zhang, J.; Mu, Q.; Cao, J. The value of a statistical life in China: A systematic review and meta-analysis. Environ. Resour. Econ. 2022, 83, 891–928. [Google Scholar]
- Hammitt, J.K.; Zhou, Y. The economic value of air-pollution-related health risks in China: A contingent valuation study. Environ. Resour. Econ. 2006, 33, 399–423. [Google Scholar] [CrossRef]
- Chen, Y.; Ebenstein, A.; Greenstone, M.; Li, H. Evidence on the impact of sustained exposure to air pollution on life expectancy from China’s Huai River policy. Proc. Natl. Acad. Sci. USA 2013, 110, 12936–12941. [Google Scholar] [CrossRef] [PubMed]
- Cropper, M.L.; Jiang, Y.; Alberini, A.; Baur, P. Getting the most out of contingent valuation. Land Econ. 2014, 90, 209–228. [Google Scholar]
- Ferraro, P.J.; Lawlor, K.; Mullan, K.L.; Pattanayak, S.K. Forest figures: Ecosystem services valuation and policy evaluation in developing nations. Rev. Environ. Econ. Policy 2012, 6, 20–44. [Google Scholar] [CrossRef]
- Pearce, D. The economic value of forest ecosystems. Ecosyst. Health 2001, 7, 284–296. [Google Scholar] [CrossRef]
- Fang, X.; Zhao, Z.; Zhou, C.; Chen, W. Ecological compensation standards for forest ecosystem services in China. Ecosyst. Serv. 2021, 47, 101235. [Google Scholar]
- Escobedo, F.J.; Kroeger, T.; Wagner, J.E. Urban forests and pollution mitigation: Analysing ecosystem services and disservices. Environ. Pollut. 2011, 159, 2078–2087. [Google Scholar] [CrossRef]
- Li, J.; Heap, A.D. Spatial interpolation methods applied in the environmental sciences: A review. Environ. Model. Softw. 2014, 53, 173–189. [Google Scholar] [CrossRef]
- Zhejiang Provincial Bureau of Statistics. Zhejiang Statistical Yearbook 2023; China Statistics Press: Beijing, China, 2023. [Google Scholar]
- Kelejian, H.H.; Prucha, I.R. A generalized spatial two-stage least squares procedure. J. Real Estate Financ. Econ. 1998, 17, 99–121. [Google Scholar] [CrossRef]
- Lee, L.-F.; Yu, J. Estimation of spatial autoregressive panel data models with fixed effects. J. Econom. 2010, 154, 165–185. [Google Scholar] [CrossRef]
- Baltagi, B.H.; Fingleton, B.; Pirotte, A. Spatial lag models with nested random effects. J. Urban Econ. 2014, 80, 76–86. [Google Scholar] [CrossRef]
- Pope, C.A.; Dockery, D.W. Health effects of fine particulate air pollution: Lines that connect. J. Air Waste Manag. Assoc. 2006, 56, 709–742. [Google Scholar] [CrossRef]
- WHO. Ambient Air Pollution: A Global Assessment of Exposure and Burden of Disease; World Health Organization: Geneva, Switzerland, 2016. [Google Scholar]
- Wang, R.; Liu, Y.; Xue, D.; Yao, Y.; Liu, P.; Helbich, M. Cross-sectional associations between long-term exposure to particulate matter and depression in China: The mediating effects of sunlight, physical activity, and neighborly reciprocity. J. Affect. Disord. 2019, 249, 8–14. [Google Scholar] [CrossRef] [PubMed]
- Liu, W.; Dong, G.; Smit, L.A.M.; Zhao, Y.; Ye, T.; Wang, T. Associations between residential greenness and diabetes mellitus in Chinese adults. Environ. Health 2022, 21, 43. [Google Scholar]
- Chen, X.; Li, F.; Li, X.; Li, Y. Evaluating the health effects of urban forest ecosystem services: The case of Shenzhen. Urban For. Urban Green. 2019, 46, 126477. [Google Scholar]
- Zhang, L.; Chen, L.; Bi, H. Forest ecosystem services and human well-being in China: A meta-analysis. Ecosyst. Serv. 2022, 54, 101415. [Google Scholar]
- Lu, C.; Zhao, T.; Shi, X.; Cao, S. Ecological restoration by afforestation may increase groundwater depth in arid and semiarid China. J. Clean. Prod. 2018, 176, 1213–1222. [Google Scholar] [CrossRef]
- United Nations. Transforming Our World: The 2030 Agenda for Sustainable Development; United Nations: New York, NY, USA, 2015. [Google Scholar]
- Liu, J.; Li, S.; Ouyang, Z.; Tam, C.; Chen, X. Ecological and socioeconomic effects of China’s policies for ecosystem services. Proc. Natl. Acad. Sci. USA 2008, 105, 9477–9482. [Google Scholar] [CrossRef]
- Ouyang, Z.; Zheng, H.; Xiao, Y.; Polasky, S.; Liu, J.; Xu, W.; Wang, Q.; Zhang, L.; Xiao, Y.; Rao, E.; et al. Improvements in ecosystem services from investments in natural capital. Science 2016, 352, 1455–1459. [Google Scholar] [CrossRef] [PubMed]
- Fang, F.; Zhan, Y.; Kang, W.; Chen, Z.; Wang, M. Temporal changes in the effects of ambient temperature on hospital admissions for cardiovascular diseases in China. Environ. Res. 2021, 198, 111211. [Google Scholar]


Disclaimer/Publisher’s Note: The statements, opinions and data contained in all publications are solely those of the individual author(s) and contributor(s) and not of MDPI and/or the editor(s). MDPI and/or the editor(s) disclaim responsibility for any injury to people or property resulting from any ideas, methods, instructions or products referred to in the content. |
© 2026 by the authors. Licensee MDPI, Basel, Switzerland. This article is an open access article distributed under the terms and conditions of the Creative Commons Attribution (CC BY) license.