


Abstract
Thermal modernization of existing buildings is an important part of sustainability-oriented retrofit practice because it can reduce operational energy demand, but its environmental effect depends partly on the insulation material selected and on the thermal assumptions used in design. This study examines how the use of declared thermal conductivity (λdecl) and design conductivity (λdesign) affects the required insulation thickness and the A1–A3 global warming potential (GWP) of alternative insulation materials for an attic ceiling separating heated space from an unheated ventilated attic in a multi-family building. This study supports product-stage sustainability assessment; it does not constitute a comparison of the full life cycle climate effect of the selected material groups. The thickness needed to achieve Utarget = 0.15 W/(m2·K) was determined for scenarios based on λdecl, temperature-corrected λdesign, and a moisture sensitivity analysis for cellulose. Environmental assessment was based on European EN 15804+A2-compliant EPDs, with separate reporting of GWPfossil and GWPbiogenic. In the analyzed case, differences between material groups were driven mainly by EPD data, whereas conversion from declared to design thermal properties had a smaller, but not negligible, effect. This effect became more important for moisture-sensitive materials. The results show that sustainability-oriented environmental comparisons based only on declared thermal conductivity may be misleading when functionally equivalent solutions are compared. In the analyzed case, the transition from λdecl to temperature-corrected λdesign resulted in only a small change in the required insulation thickness and the corresponding GWP result. At the same time, the scenario-based sensitivity analysis for cellulose insulation and the variability of data reported in the EPDs indicate that moisture-related assumptions and the selection of input data may be of greater importance. The results show that, when interpreting the environmental performance of insulation solutions in sustainable retrofit design, consistency should be maintained between the adopted functional unit and the method used to define the thermal properties of the material after installation in the building envelope.
1. Introduction
Thermal modernization of existing buildings is one of the primary measures used to limit energy consumption and greenhouse gas emissions in the construction sector and is therefore an important element of sustainability-oriented retrofit strategies. However, the mere reduction in operational energy does not resolve the environmental problem, because along with the increase in energy efficiency of buildings, the relative importance of the environmental impact of materials increases [1], which results in the fact that the greenhouse gas emissions associated with insulation materials become an increasingly important design parameter [2,3,4,5]. Consequently, it is necessary to compare individual materials in order to support sustainability-oriented material selection. Nevertheless, in order to make sure that such comparisons are meaningful, it is required to use equivalent technical parameters. In practice, such comparisons are often based on the declared value of the thermal conductivity coefficient λdecl, while in the scope of thermal calculations of building envelopes, it is necessary to use the design value λdesign, which takes into account the actual operating conditions, including the impact of temperature, moisture and aging [6,7,8,9]. This is crucial because the adopted value of the thermal conductivity coefficient λ has a direct impact on the required thickness of the insulation layer, which is necessary to achieve the assumed level of thermal protection, thus also on the amount of material assigned to the functional unit, as well as the final result of environmental assessment within the limits of A1–A3 [10,11,12,13].
Such distinction is especially important in the case of hygroscopic materials [14], whose thermal properties may significantly change along with the moisture conditions [15,16,17,18,19,20]. Thus, a reliable comparison of materials should not be limited to a juxtaposition of declared catalog parameters, but should also take into account the hygrothermal properties of the material, the method of its installation, the geometry of the joint and the arrangement of envelope layers, because these factors influence its actual operational behavior [21,22,23,24,25,26]. When this effect is ignored, it may lead to distortions in comparisons, both in technical and environmental terms.
From a sustainability perspective, particular attention needs to be paid to the interpretation of results for biogenic materials, for which the interpretation of environmental outcomes requires caution, in order to avoid overestimating the seeming climatic benefits of using specific materials.
Previous research has addressed several issues relevant to the sustainability assessment of insulation solutions, including embodied carbon and functional equivalence in insulation design [3,4,5], the distinction between declared and design thermal conductivity values [6,7,8,9,10,11], hygrothermal sensitivity of insulation materials [7,13,14,15,16,18,19,20,21], and the interpretation of EPD-based environmental indicators [3,4,5]. However, these aspects are not always considered together when alternative insulation solutions are compared under the same thermal performance requirement. In particular, less attention has been paid to the relative importance of thermal conductivity assumptions and the resulting material quantity for the environmental assessment of functionally equivalent insulation solutions within one consistent calculation framework. Thus, the aim of this study is to assess how the use of declared and designed thermal conductivity coefficients affects the required thickness of insulation, as well as the environmental outcome of the product stage (A1–A3) for solutions that provide the same required thermal performance. The contribution of this study lies in combining these aspects within a single functional-unit-based calculation framework and in comparing the relative magnitude of three sources of variability: the conversion from declared to temperature-corrected design thermal conductivity [8,9,10,11], the scenario-based moisture conversion for a hygroscopic material [10], and the scatter of GWP values reported in EPD datasets [3,4,5,27]. This makes it possible to assess whether the refinement of thermal assumptions materially changes the A1–A3 GWP result used in sustainability-oriented retrofit assessment. The study is methodological in nature and focuses on the importance of consistency between the adopted thermal properties of the material and the environmental result assigned to the same functional unit. It is not the aim of this paper to establish a universal ranking of thermal insulation materials or to compare product groups as such.
2. Materials and Methods
In accordance with the PN-EN ISO 6946 [8] standard, the design values of the thermal conductivity coefficient of building materials, determined in compliance with PN-EN ISO 10456 [9], should be used for thermal calculations of building envelopes. The design value, derived based on the declared value in accordance with the dependence (1), takes into account the change in the value of thermal conductivity coefficient of the material (λ), depending on the operating conditions of the material after installation in the building.
where
- —design value of thermal conductivity coefficient [W/(m·K)];
- —declared value of thermal conductivity coefficient [W/(m·K)];
- —temperature conversion factor [–];
- —moisture conversion factor [–];
- —aging conversion factor [–].
The need to convert the thermal transmittance coefficient of materials from a declared value to a design value results from the differences between the conditions under which material properties are examined in the laboratory, and the operating conditions of material after installation in the building. Thus, during selection of the material, it is important to take into account its actual operating conditions, as well as the parameters achieved by the material under these conditions, which is influenced by the building’s operating conditions, but also by the arrangement of envelope layers and the properties of individual materials comprising the entire system. Therefore, this may also influence the required material thickness that is necessary for installation in order to achieve the expected effect, which may directly translate into the associated carbon footprint of the considered solutions.
2.1. Object of Study and Scope of Analysis
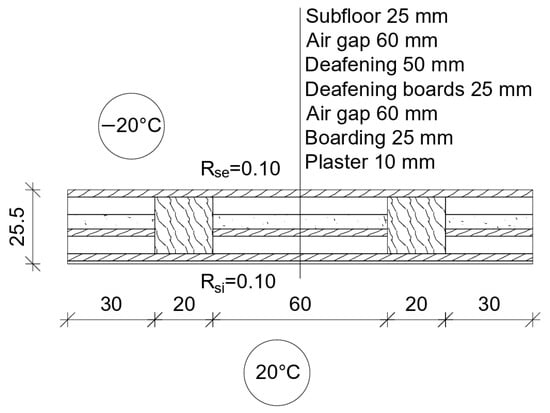
The subject of the analyses is the ceiling under an unheated attic in a multi-family building. The numerical analysis was based on a material–structural–functional solution that was typical for buildings constructed in Poland in the 19th and 20th century [28] (Figure 1). The insulation of the building envelope was installed from the attic side by embedding the thermal insulation material into the existing ceiling layers, without interfering with the existing structure of the envelope. In order to meet legal requirements for the maximum permissible thermal transmittance of envelopes applicable in Poland [29], it was assumed that every considered envelope insulation variant must ensure the achievement of thermal transmittance coefficient of the envelope at the level of U = 0.15 W/m2K. Six groups of thermal insulation products were used in the analysis that constitute alternative solutions for the considered envelope, which were selected due to their potential for use in insulating the ceiling from the unheated attic side without interfering with the existing envelope structure, as well as their diversity in terms of product form, installation technology and environmental characteristics, i.e., cellulose insulation, polyurethane foam, wood wool in the form of granules and mats, as well as glass wool in the form of granules and mats. In order to assess the impact of selected materials on the carbon footprint of individual solutions, the analysis considered three scenarios for assuming the thermal conductivity of insulating material:
Figure 1.
Diagram of the analyzed envelope (state before additional insulation) and boundary conditions assumed for the analysis.
S1: λdecl declared conductivity (without conversion) for all materials;
S2: λdecl · FT declared conductivity corrected by the temperature conversion factor;
S3: λdecl · FT · Fm declared scenario-based sensitivity analysis of the moisture conversion factor carried out only for cellulose insulation, treated as an example of a hygroscopic material for which sufficiently representative and comparable literature data were available. This scenario was not intended to compare the effect of moisture between the analyzed material groups.
2.2. Determination of the Thermal Transmittance Coefficient of the Envelope Before Insulation
The thermal transmittance coefficient of the analyzed heterogeneous envelope was determined based on stationary numerical simulation of a 3D model in the TRISCO 16.0 software (Physibel, Floraliënlaan 51/001, Gent, Belgium). In this study, a steady-state heat conduction model was adopted, because the aim of the analysis was not to reproduce the time-dependent moisture behavior of the material or to predict the actual evolution of the thermal and moisture conditions of the envelope during operation. The applied model was intended to isolate the effect of the adopted value of the thermal conductivity coefficient of the insulation material on the required insulation thickness, and subsequently on the GWP result for the product stage (A1–A3), while maintaining the same functional unit. Therefore, the adopted calculation scheme should be treated as a sensitivity study carried out under simplified assumptions, rather than as a comprehensive assessment of the long-term performance of materials after installation. The model included a representative section of the ceiling measuring 1.60 [m] × 1.00 [m]. The ceiling layer arrangement and material parameters were adopted in accordance with the inventory (Figure 1). Boundary conditions were assumed as the steady-state heat flow between the “internal” and “external” side of the envelope. In regard to the lateral surfaces, the adiabatic conditions were used. Boundary temperatures of θi = 20 °C and θe = −20 °C (Δθ = 40 K) were assumed. In the case of linear analysis (constant λ of materials), the value of thermal transmittance coefficient of the envelope (U [W/(m2K)]) does not depend on the absolute value of ΔT, but only on the geometry of the envelope and the thermal conductivity of individual materials, thus the assumed temperature difference was used only for the stable determination of the heat flow. The individual elements of the model are assigned parameters that characterize their physical properties. The characteristics of materials included in the model (Table 1) were assumed based on the data specified in the literature [30,31,32,33] and standards [8,9].
Table 1.
Adopted design thermal parameters of building materials.
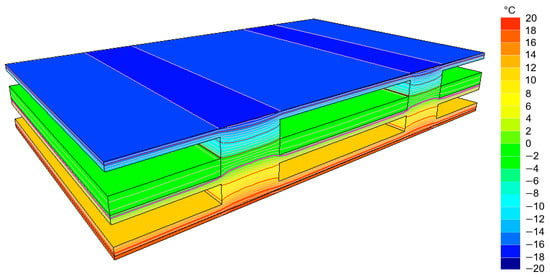
The thermal transmittance coefficient of the ceiling in its existing state (without thermal insulation) was determined based on the heat flow values obtained from the simulation, in accordance with the dependence (2). Figure 2 presents the result of numerical simulation, in the form of temperature distribution in the ceiling cross-section.
where
Figure 2.
Temperature distribution in the ceiling cross-section.
—Heat flow rate [W] = 51.6657;
—Surface area of the envelope fragment [m2] = 1.60;
—Temperature difference at boundary conditions [K] = 40.
The thermal conductivity coefficient of the analyzed ceiling in its existing state amounts to . The value of thermal transmittance coefficient U of the envelope was reported as “total U”, while taking into account the thermal transfer resistance on the internal and external side (Rsi, Rse) adopted in accordance with PN-EN ISO 6946 [8]. All calculations in this study were therefore performed under fixed thermal boundary conditions. The model should not be interpreted as representing real in-use hygrothermal behavior, seasonal moisture accumulation, drying potential, or long-term performance of the insulation layer. Its role was limited to providing a consistent thermal basis for the subsequent functional-unit-based comparison of insulation thickness and A1–A3 GWP.
2.3. Determination of the Required Minimum Thickness of Thermal Insulation
Due to the adopted material arrangement (the thermal insulation was designed to be installed on the ceiling, i.e., as the next layer in the series in relation to the thermal resistance of the existing envelope), the required insulation thickness allowing to achieve was determined analytically, without the need to perform further numerical simulations, with the use of the following dependencies:
where
—Total thermal resistance of the ceiling in its existing state [(m2K)/W];
—Thermal conductivity coefficient of the envelope in its existing state [W/(m2K)];
—Required additional thermal resistance of the thermal insulation layer [(m2K)/W];
—Target value of the thermal conductivity coefficient of the envelope after insulation—0.15 [W/(m2K)];
—Required thickness of the thermal insulation material [m];
—Thermal conductivity coefficient of the material, depending on the variant (S1; S2; S3) [W/(m·K)].
2.4. Climate Data
The analysis used climate data for the city of Poznań, in the form of a typical meteorological year, which are available on the government administration website as “Data for energy calculations of the buildings”. The above-mentioned data include hourly profiles of basic meteorological parameters, including air temperature and relative moisture. In this study, it was used as input data to describe conditions on the side of unheated, ventilated attic, and in order to determine the representative operating temperature of the additional insulation layer. The presented analysis is a case study for a single climatic location and does not include a comparison of different climatic zones. Poznań was adopted as the case study location for the analyzed building and the available set of input data.
Climatic Assumptions for the Attic
It was assumed that the analyzed attic is a well-ventilated space, thus the conditions on its side are similar to the outside conditions. This assumption results from the nature of the system under consideration: the lack of heat sources in the attic, the lack of roof insulation, and constant air exchange with the outside environment via ventilation openings.
2.5. Conversion of the Thermal Conductivity Coefficient of Thermal Insulation Materials
2.5.1. Temperature Conversion
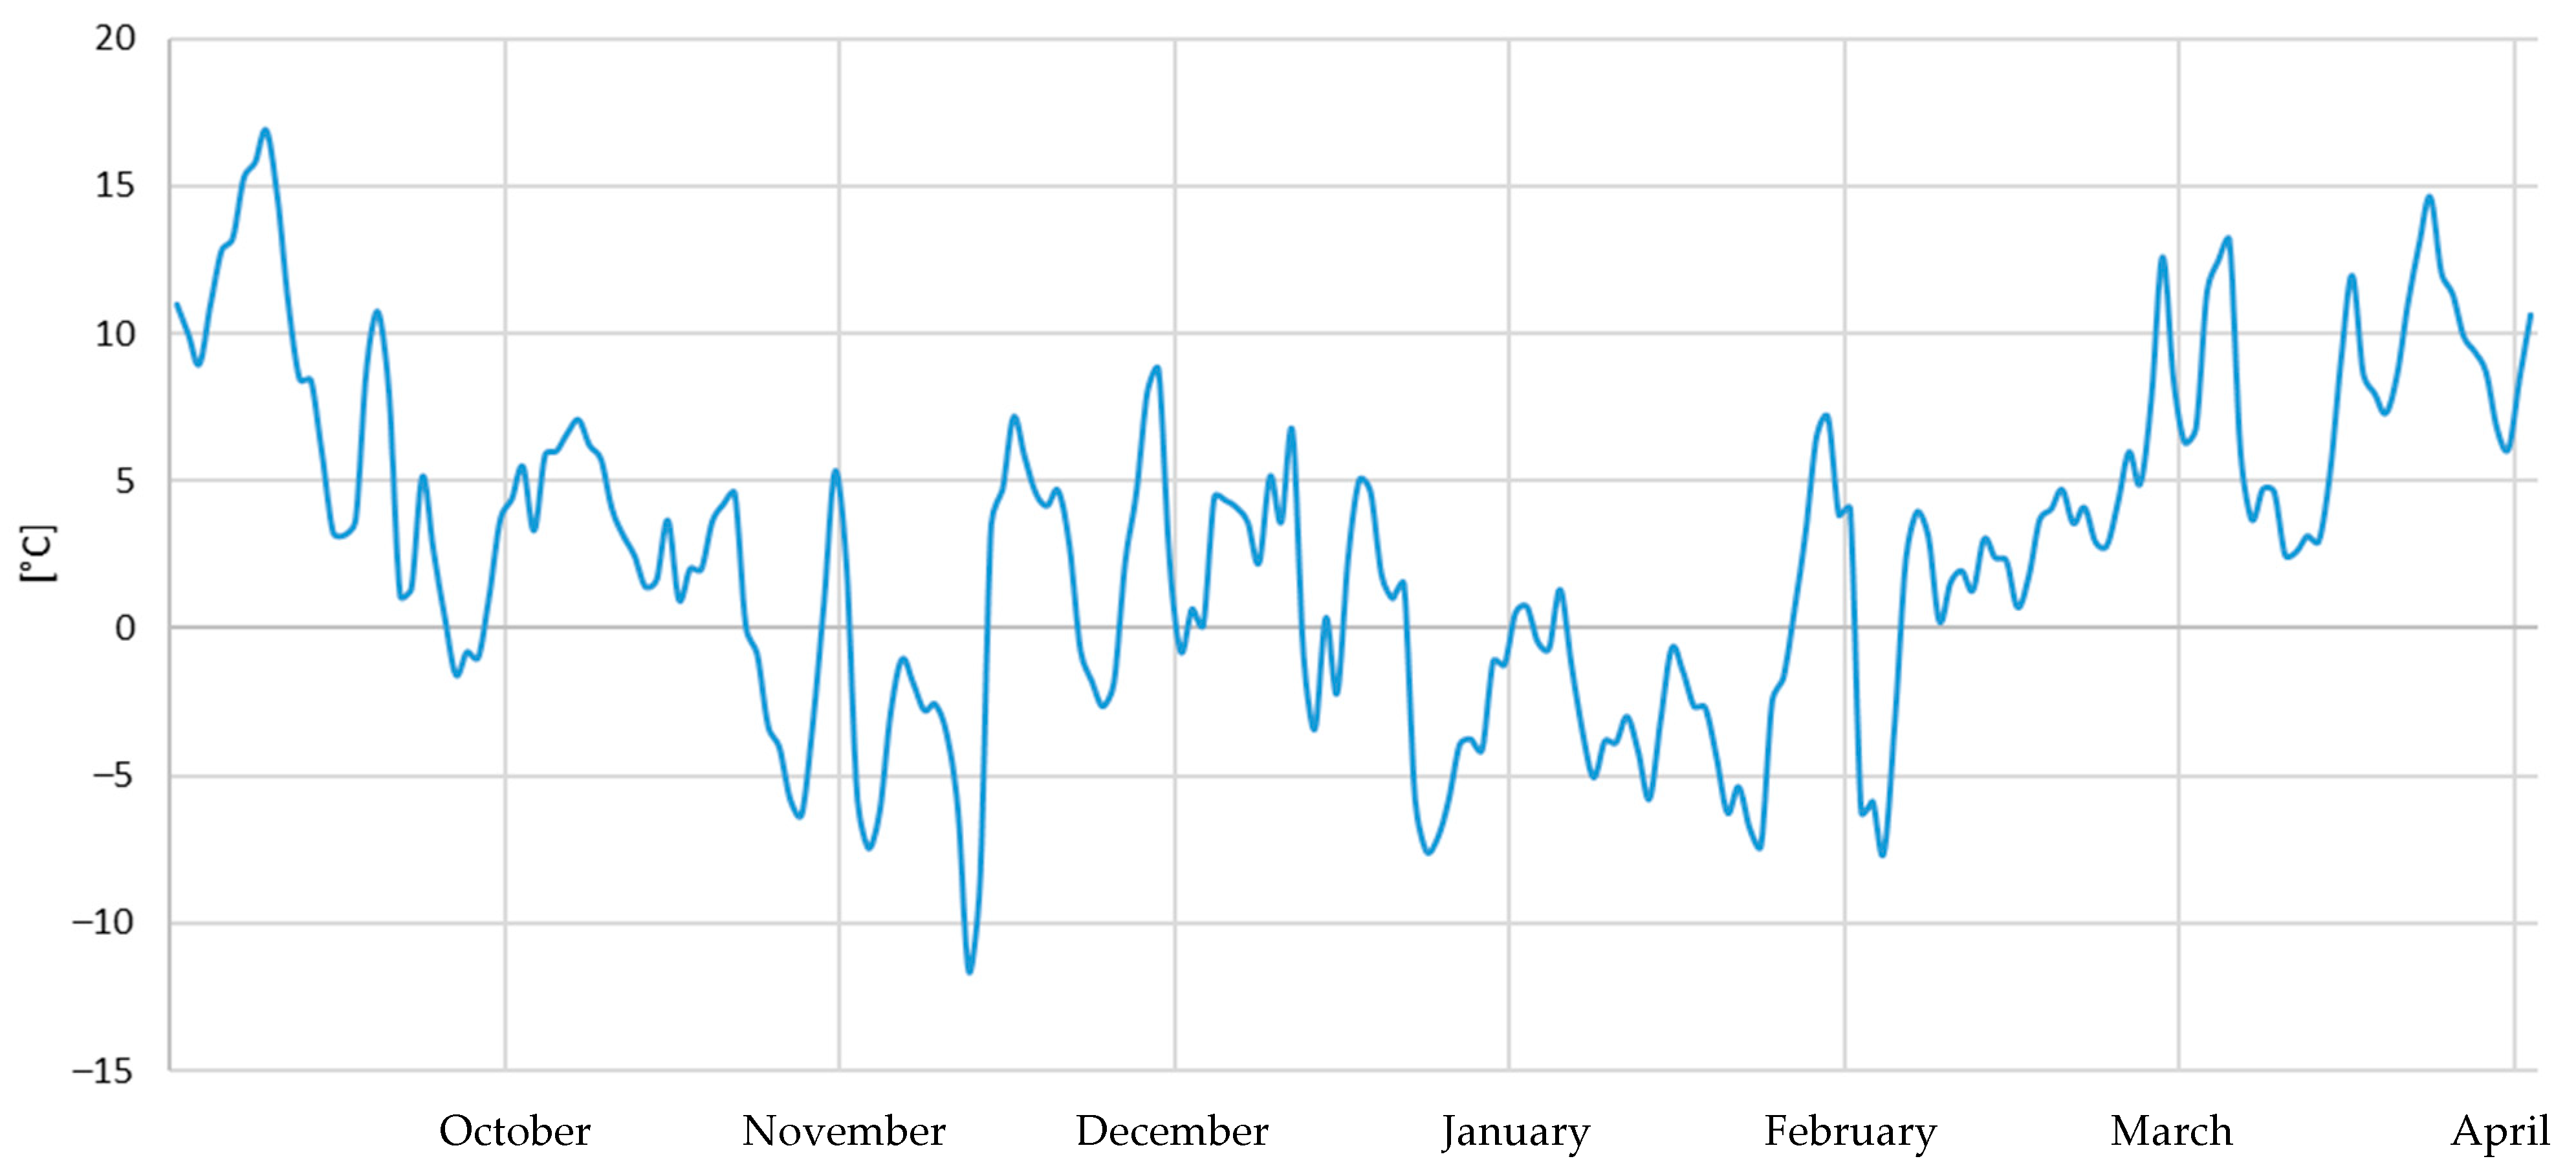
The temperature conversion coefficient was determined based on linear interpolation of the data contained in PN-EN ISO 10456 [9] (Table 2). The temperature conversion factor was determined by taking into account the average operating temperature of insulating material, which was calculated from the average daily external temperatures during the heating season. Due to the fact that the impact of temperature on conduction should correspond to the periods of the highest heat losses, the average insulation temperature was determined as the heat flow-weighted average during the considered heating season, based on the dependencies (6–11), which according to PN-B-02025: 2001 [34], was assumed from October to the end of April (Figure 3).
Table 2.
The values of temperature conversion coefficient and temperature conversion factor of the analyzed materials.
Figure 3.
Outside temperature during the heating season for Poznań (average daily air temperature).
The heat flow-weighted average was used to determine a representative temperature on the attic side. For further time steps (day), the heat flow through 1 m2 of the ceiling was calculated from the following dependence:
Subsequently, the weighted average air temperature on the attic side was determined:
The temperature is an air temperature in the attic space. Therefore, the surface temperature on the cold side (on top of the insulation) was calculated by taking into account the thermal transfer resistance on the external side , as
where is the flow corresponding to the weighted temperature:
The temperature at bottom of the insulation layer (ceiling–insulation contact point) was determined from the thermal resistance network of the envelope:
where is the transfer resistance on the internal side, and is the resistance of existing ceiling layers without any transfer resistance. While assuming a linear temperature distribution in the insulation layer, the average operating temperature of insulation was calculated as
The determined was used to calculate the correction factor in accordance with EN ISO 10456 [9] and to determine the design conductivity in S2 scenario.
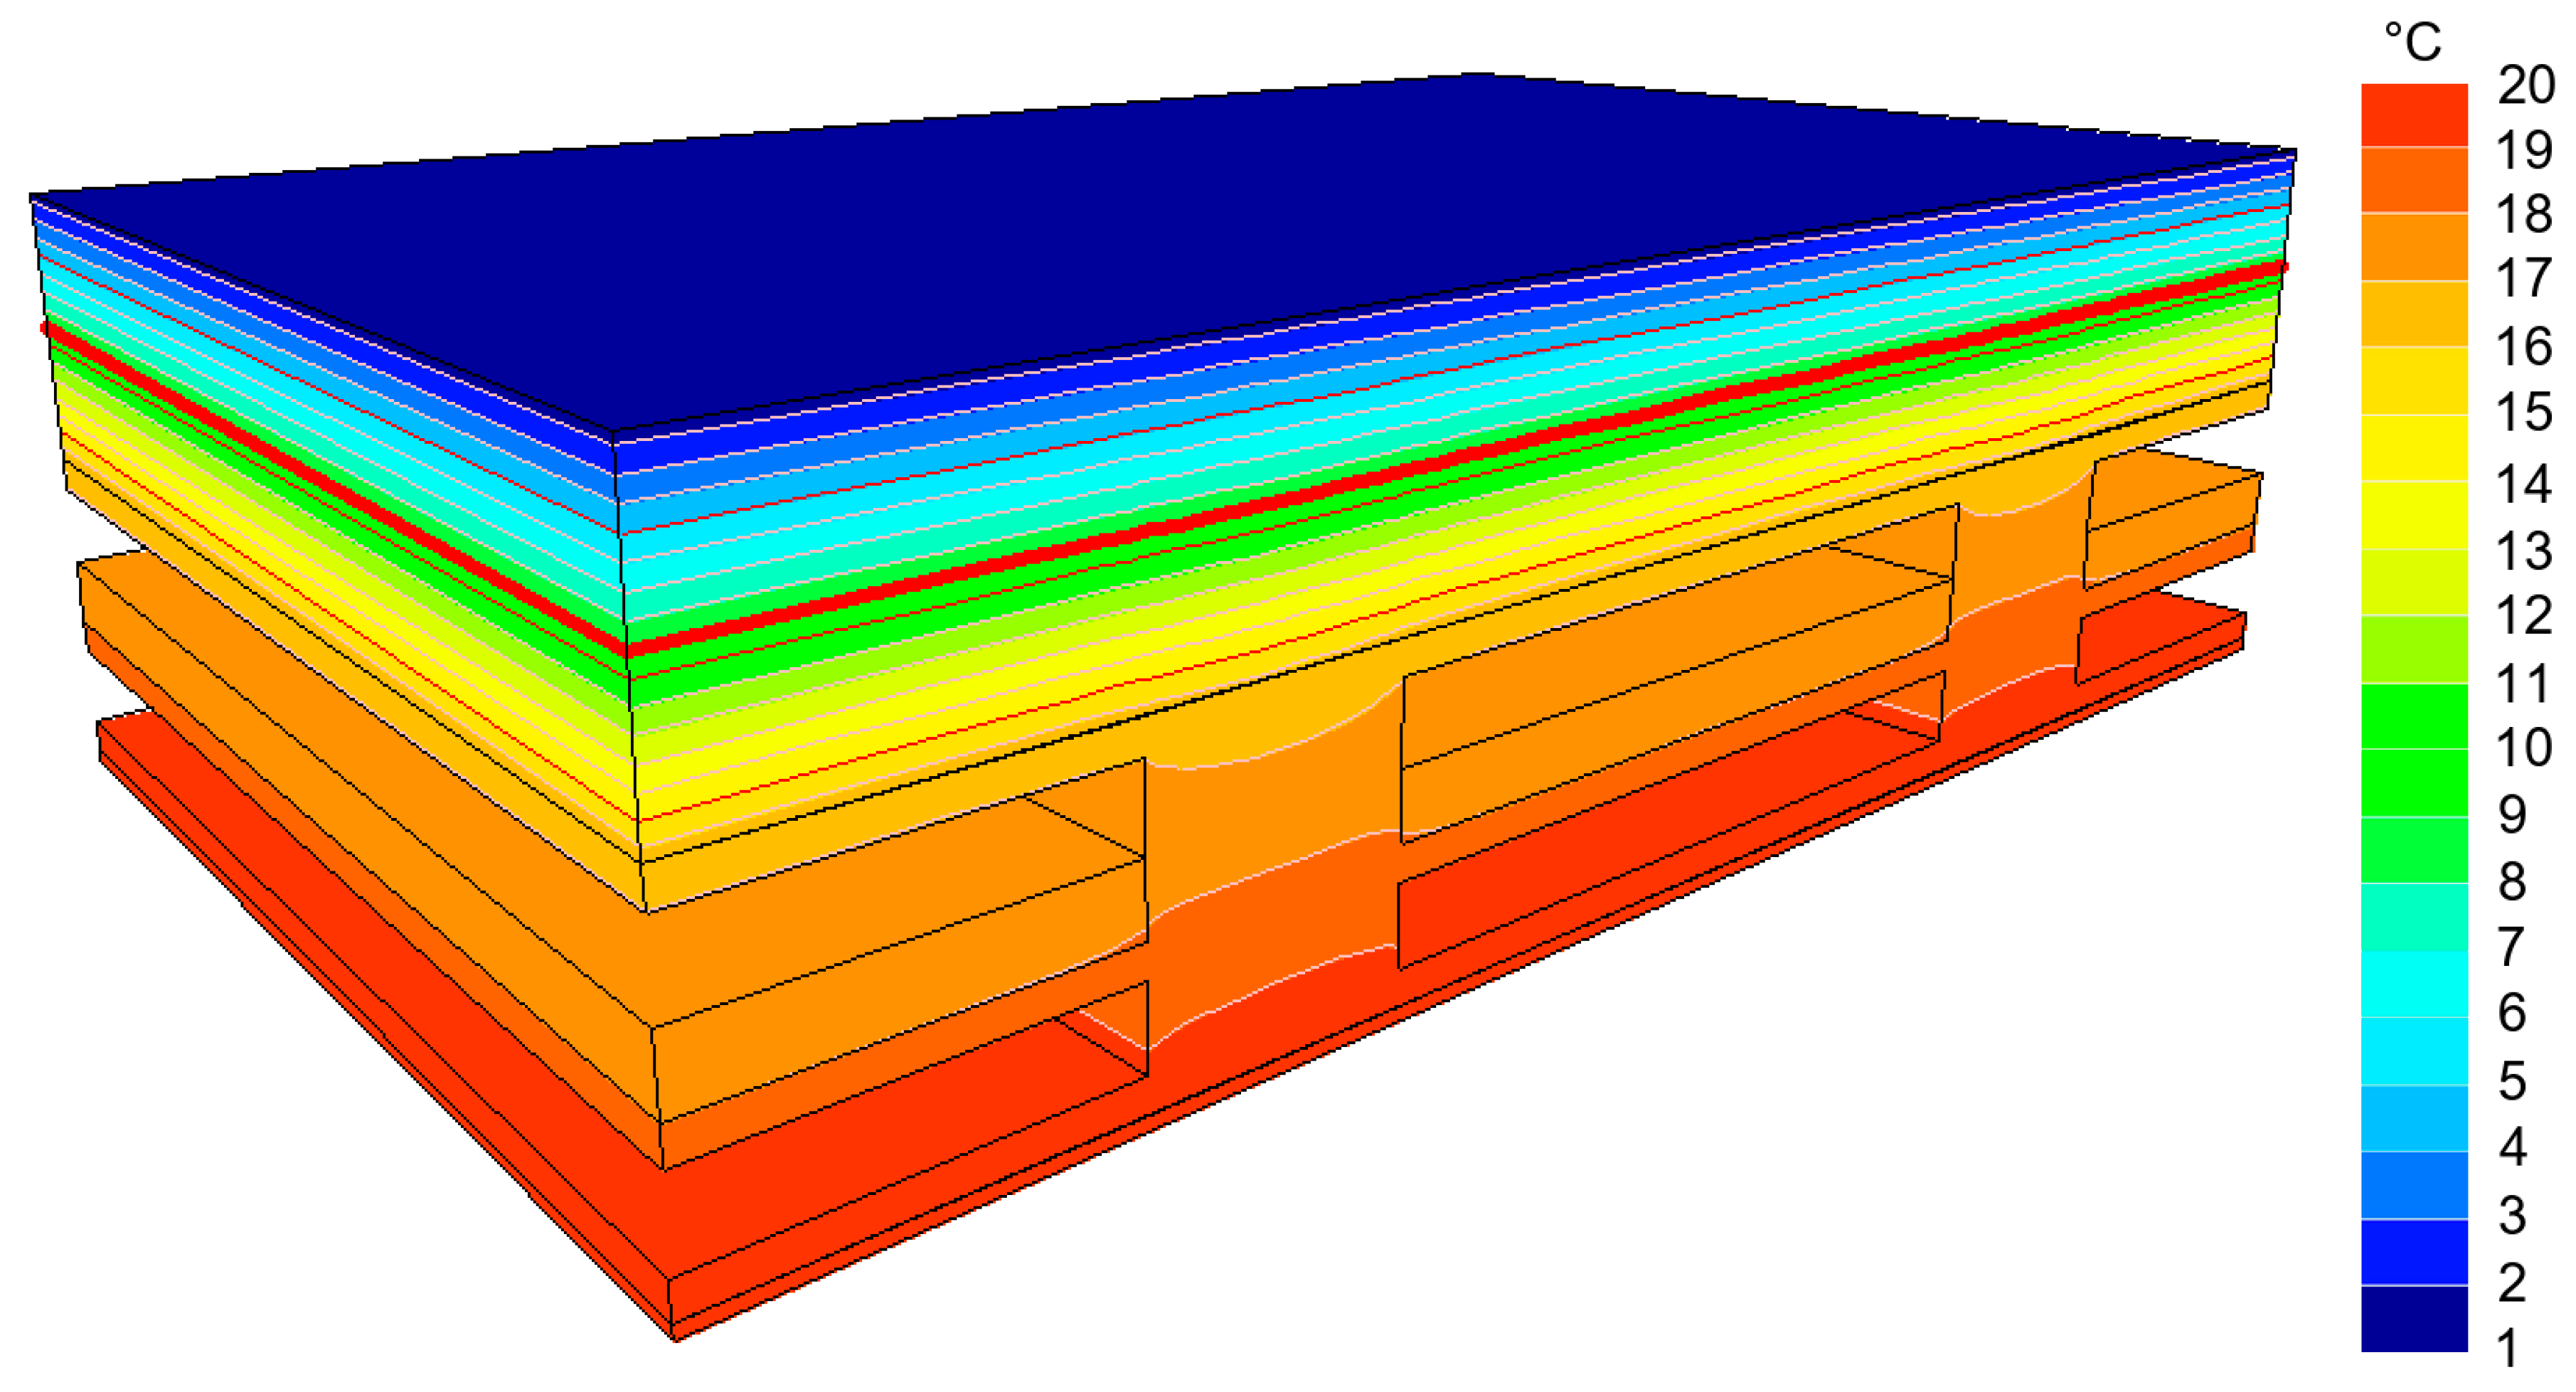
In order to check the correctness of this approach, an additional simulation was carried out for the selected variant (Figure 4), and a difference of approximately 2% compared to the analytical calculation was obtained.
Figure 4.
Example of a cellulose-insulated envelope calculated for the adopted boundary conditions based on the declared thermal conductivity properties, with the distinguished average material temperature amounting to 9.185 °C.
The temperature conversion factor FT for all materials was less than 1 (Table 2).
2.5.2. Moisture Conversion
The moisture conversion factor for all analyzed thermal insulation materials was not determined in this study. Such an approach would require the performance of a transient hygrothermal analysis, while taking into account the sorption properties of materials, attic ventilation conditions, as well as variable boundary conditions.
For this reason, the analysis of the effect of moisture was limited only to cellulose insulation, treated as an illustrative example of a hygroscopic material for which literature data were available that allowed the definition of a scenario-based range of Fm in envelopes with similar operating conditions [10]. The adopted Fm values do not attempt to recreate the actual moisture content in the material, nor do they constitute a basis for comparing materials with one another, but rather the calculation scenarios that allow to assess the sensitivity of results to the adopted design assumptions. Consequently, the results should be read only as an sensitivity analysis for cellulose insulation. They cannot be generalized to other insulation materials and must not be used to infer relative moisture sensitivity between the material groups considered in this study.
2.5.3. Aging Conversion
The aging conversion was Fa omitted in the conducted analyses. The calculations used λdecl values which, in accordance with the requirements of the relevant product standards and the rules specified therein for declaring the thermal properties of thermal insulation materials [35,36,37,38], already include an allowance for aging. For this reason, no additional separate aging correction was applied in this study beyond the method of declaring properties adopted in the standardization system.
2.6. Environmental Data
Publicly available environmental product declarations (EPDs) for the European region were used in order to conduct environmental assessment. The EPD selection criteria were limited to European origin (i.e., EPDs issued for products from European countries), while excluding EPDs of construction products originating outside Europe. A full list of the used EPDs, along with their metadata, is presented in Appendix B.
Data Sources
Publicly available environmental product declarations (EPDs) for the thermal insulation materials available on the European market were used in order to carry out environmental assessment. Only the EPDs developed in compliance with PN-EN 15804+A2 [27] and valid on the date of data acquisition were included in the analysis. Basic metadata were recorded for each declaration, including the document identifier, program operator, manufacturer and expiration date. A full list of the used declarations is presented in Appendix B.
The analysis was limited to the A1–A3 modules, i.e., the product stage. Other life cycle stages were not taken into account. Consequently, negative values of GWPbiogenic within this scope should not be automatically interpreted as a net climatic benefit over the whole life cycle of the material. The values of GWPfossil and GWPbiogenic were taken from the EPD in the functional unit indicated by the manufacturer, and then they were normalized to a common form of kg CO2 e/m3, with the use of density and if necessary, the reference thickness declared in the EPDs. Such converted values constituted the basis for further environmental calculations.
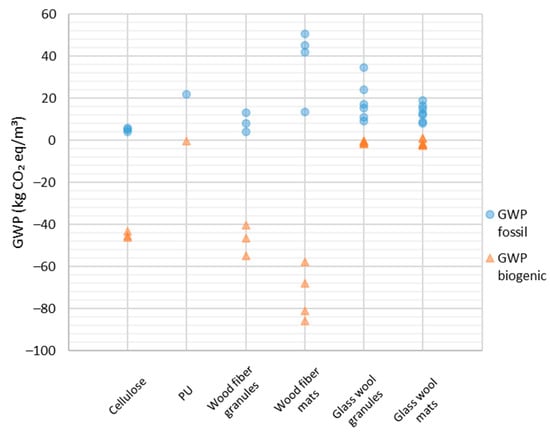
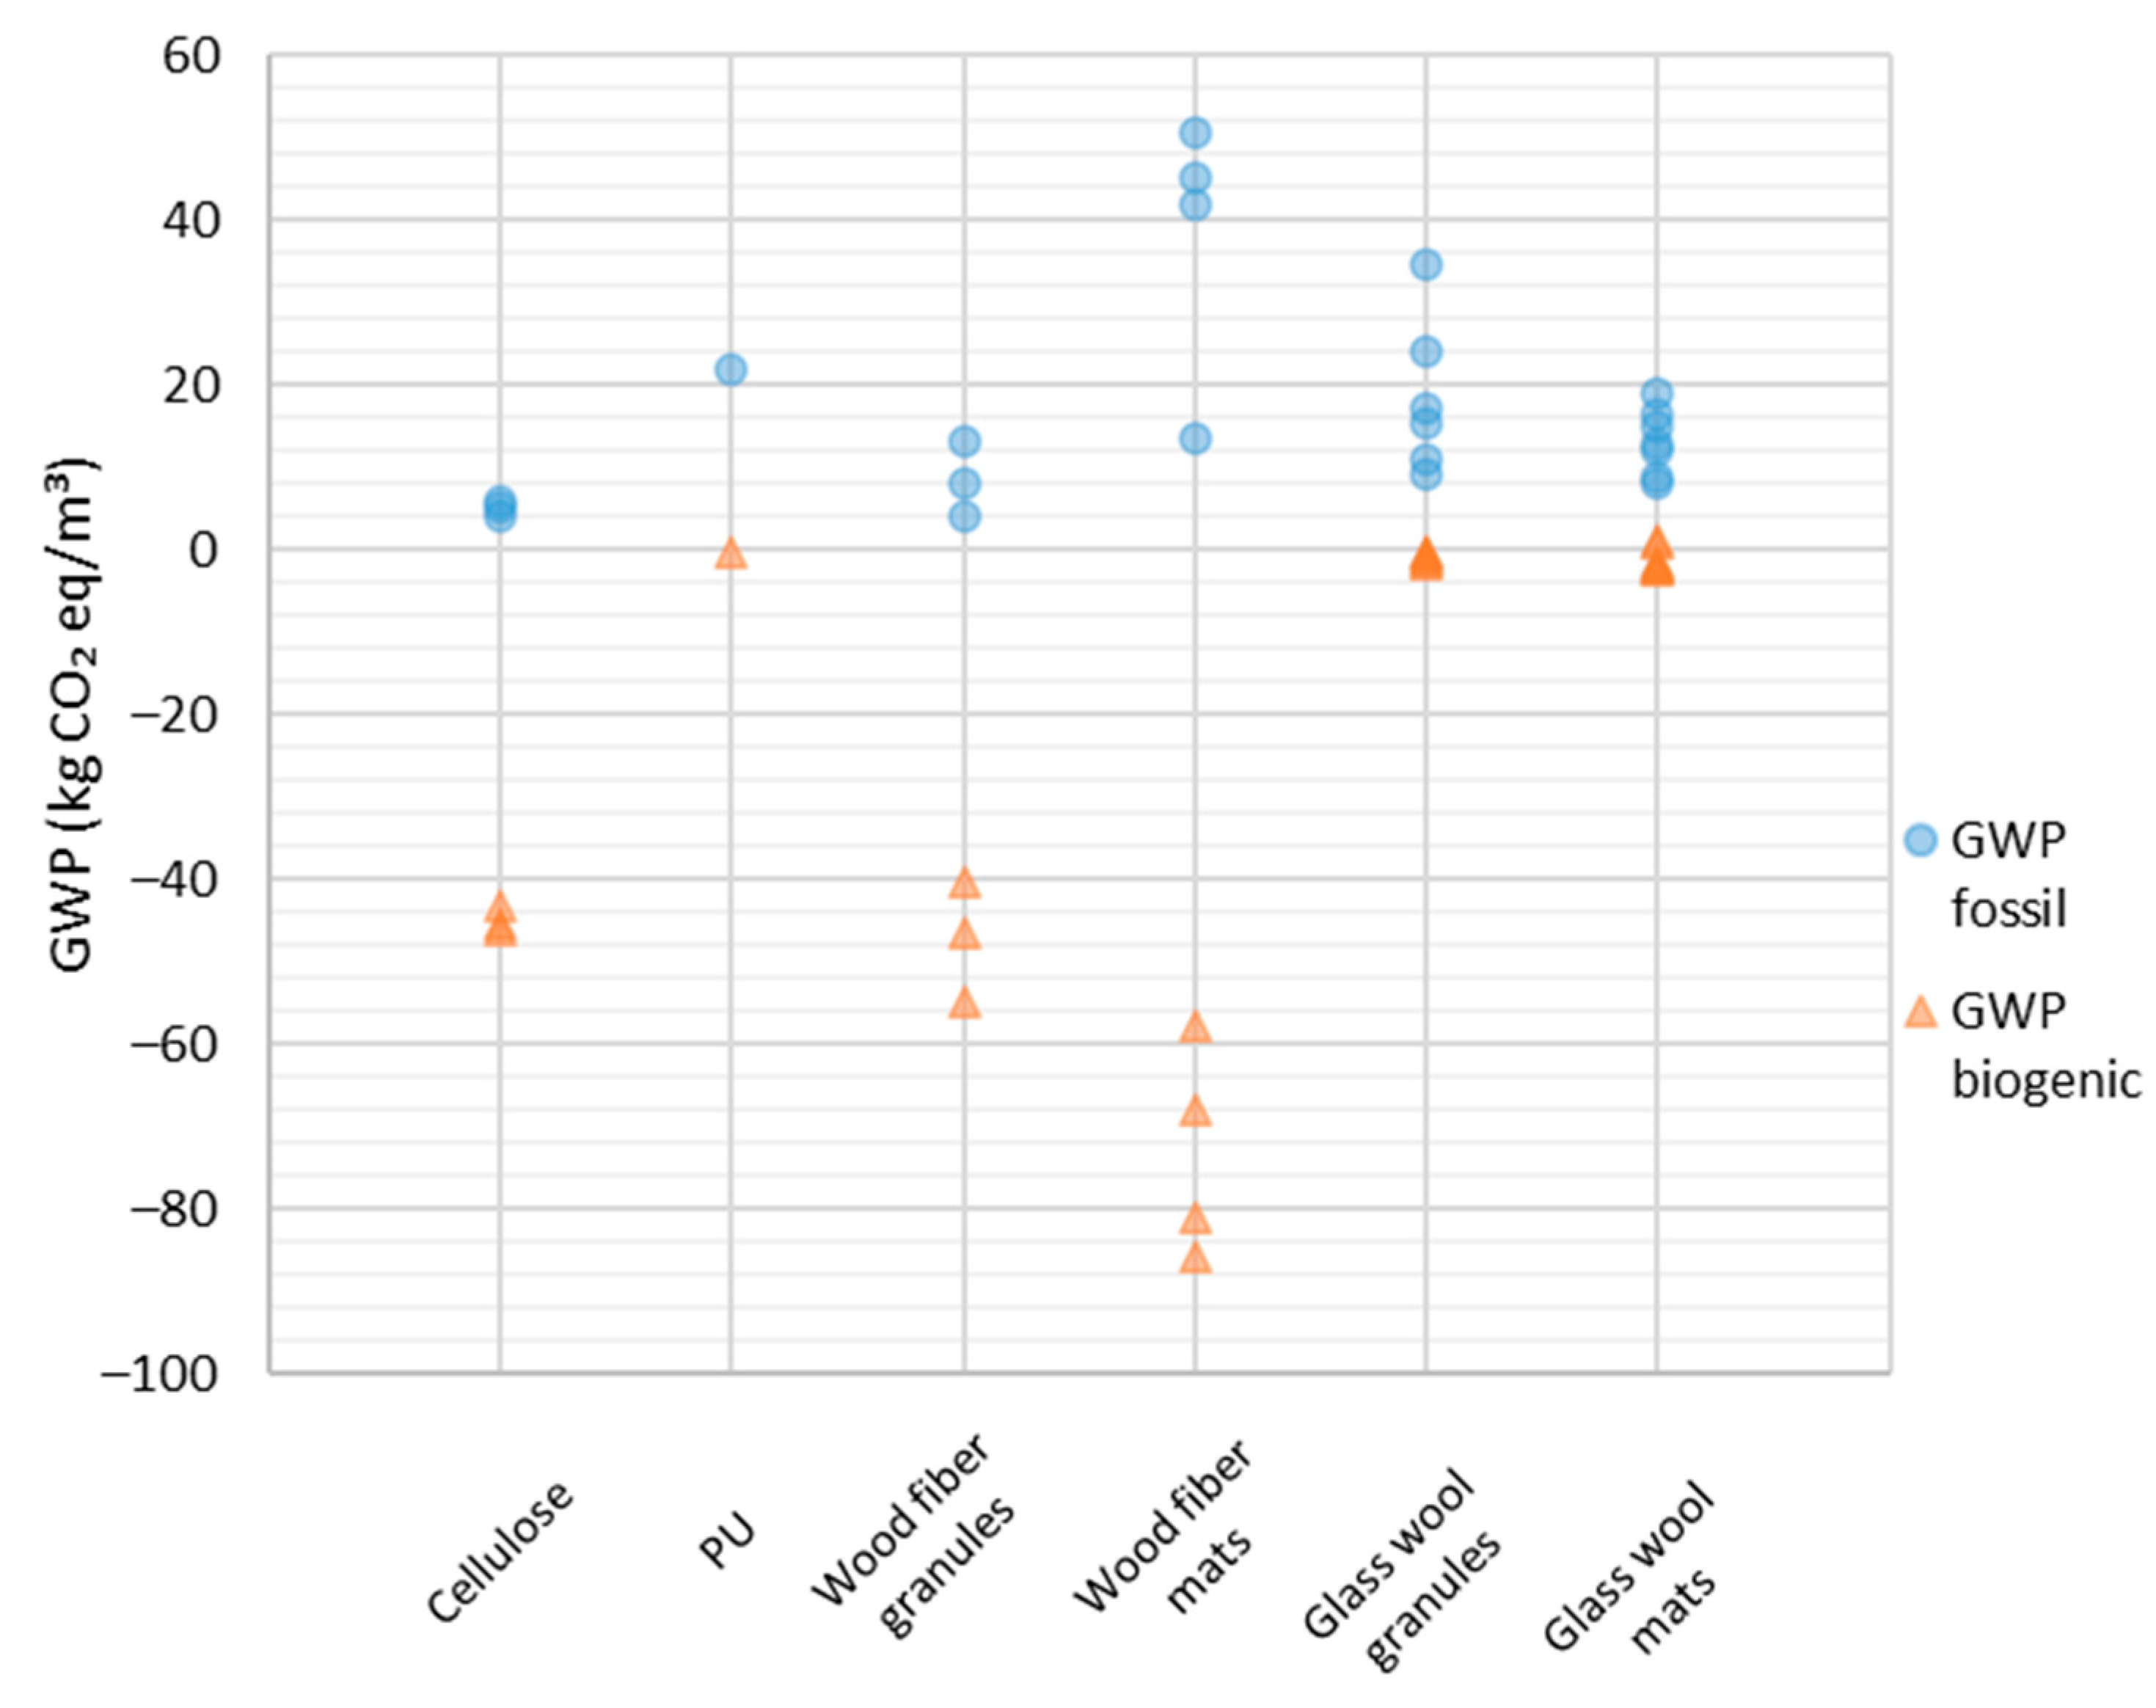
The materials were grouped by product type and application method, while distinguishing between, among others, bulk products and mats, in order to reduce the mixing of products characterized by significantly different performance parameters within a single comparative group. Subsequently, the minimum, median and maximum values of GWPfossil and GWPbiogenic calculated per 1 m3 of material were determined for each material group. The variability of these values in the analyzed EPD dataset is illustrated in Figure 5, while the corresponding numerical summary is presented in Table 3. In the subsequent calculations, the median value of GWP reported in the analyzed set of EPDs was adopted as the representative value for each material group, while the min-max range was used to demonstrate the scatter of results originating from the variability of data reported in the EPDs. The use of the median was intended to limit the influence of extreme values on the calculation results. However, this does not mean that the median constitutes a universal description of a given material group. Therefore, the results should be interpreted as referring to the analyzed dataset, rather than as a basis for formulating a general ranking of thermal insulation materials. In the case of PU/PIR group, the result is based on a single declaration (n = 1) and therefore should not be treated as a basis for formulating strong comparative conclusions for this material group. The presented result is of an illustrative nature only for the specific input dataset.
Figure 5.
The values of GWPfossil and GWPbiogenic (A1–A3) for the analyzed EPD set.
Table 3.
The median values of GWP (A1–A3) calculated per 1 m3 of material, broken down into GWPfossil and GWPbiogenic.
2.7. Functional Unit and Variant Comparison Method
The functional unit was assumed as 1 m2 of the ceiling after the application of thermal modernization achieving Utarget = 0.15 [W/m2K]. In the case of each considered variant, the GWPfossil/m2 index was determined based on material consumption (resulting from the thickness) and the GWP indices from EPD (A1–A3). In addition, the GWPfossil calculation was presented for the entire analyzed surface of the envelope, A = 164.84 m2.
3. Results
3.1. Influence of Temperature Correction on Required Insulation Thickness and GWPfossil
Table 4 summarizes the required insulation thickness dreq, which is necessary to achieve Utarget = 0.15 W/(m2·K) for the analyzed ceiling under an unheated ventilated attic, as well as the corresponding medians of GWPfossil (A1–A3) calculated per 1 m2 of the envelope. For all material groups, two common scenarios of thermal properties were compared: S1—based on the declared value of the thermal conductivity coefficient λdecl, and S2—taking into account the temperature correction, i.e., λdecl · FT.
Table 4.
The required insulation thickness dreq for Utarget = 0.15 W/(m2·K) and the corresponding median GWPfossil (A1–A3) calculated per 1 m2 of the ceiling under the unheated attic for the scenarios S1 (λdecl) and S2 (λdecl·FT).
In the case of all analyzed material groups, the application of temperature correction resulted in a slight reduction in the required insulation thickness. In the S2 scenario, the change in thickness compared to the S1 scenario was small and similar for all materials, from −0.46% to −0.50%, which results from the fact that the assumed values of temperature conversion factor were below 1.0. Analogically, the values of GWPfossil related to 1 m2 of the envelope were slightly reduced, from −0.45% to −0.50%.
The obtained results indicate that—in the analyzed case—the temperature correction affects the amount of material necessary to achieve the same functional purpose; however, this effect is minimal and in reality it would be offset by the rounding of values resulting from the insulation operating thicknesses. In the analyzed case, the effect of temperature correction on the GWPfossil result is smaller than the variability associated with the selection of EPDs within some material groups. Therefore, the adopted median should be treated as a calculation simplification rather than as a basis for formulating universal conclusions about the relative environmental advantage of the analyzed material groups.
3.2. Illustrative Sensitivity Analysis of the Cellulose Results with Respect to the Adopted Moisture Conversion Factor Fm
The impact of moisture was taken into account only for cellulose insulation, which resulted from the limited availability of literature data. The presented analysis is an illustrative sensitivity study for a single hygroscopic material and does not constitute a basis for comparing the effect of moisture between the analyzed material groups. The analysis was based on sources that allowed for adoption of the Fm parameter value in a manner sufficiently representative for operating conditions of the material in the considered envelope [10]. The adopted values of Fm do not constitute an attempt to determine the actual coefficient for the analyzed ceiling based on hygrothermal simulation, but rather a range of scenarios based on literature data. The above-mentioned caveat is necessary, because the source publication directly indicates that the determination of moisture conversion factor should be associated with the specific structure and climatic conditions. At the same time, in the case of cellulose in ventilated roof systems, depending on the adopted assumption, the Fm values in the range of 0.9759–1.0101 are reported.
As presented in Table 5, the adopted Fm value influences the change in the required thickness of cellulose insulation, resulting in a correction of the GWPfossil value. In regard to the S2 scenario, the GWPfossil values for 1 m2 of the ceiling vary in the range from −2.51% to +1.00% compared to S1 scenario. The scale of this variability is greater than in the case of the temperature correction alone; however, it is necessary to emphasize that it results from the adopted range of literature scenarios, and not from a detailed hygrothermal simulation carried out for the analyzed envelope. The presented range of results for cellulose insulation should therefore be treated as a scenario-based example of the possible sensitivity of the result to the adopted moisture assumptions. It does not constitute a basis for comparing the effect of moisture between all analyzed materials.
Table 5.
Scenario-based sensitivity analysis based on the literature range of Fm value: the impact of Fm range on the required insulation thickness and the median of GWPfossil (A1–A3) calculated per 1 m2 of the ceiling.
3.3. Scatter of Results Originating from the Selection of EPD Data
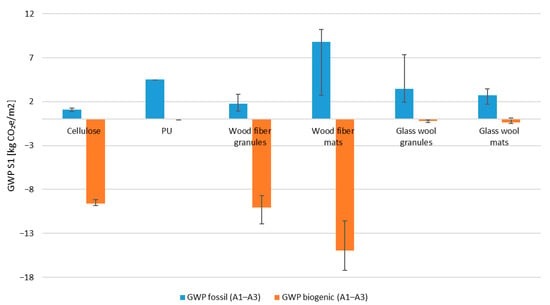
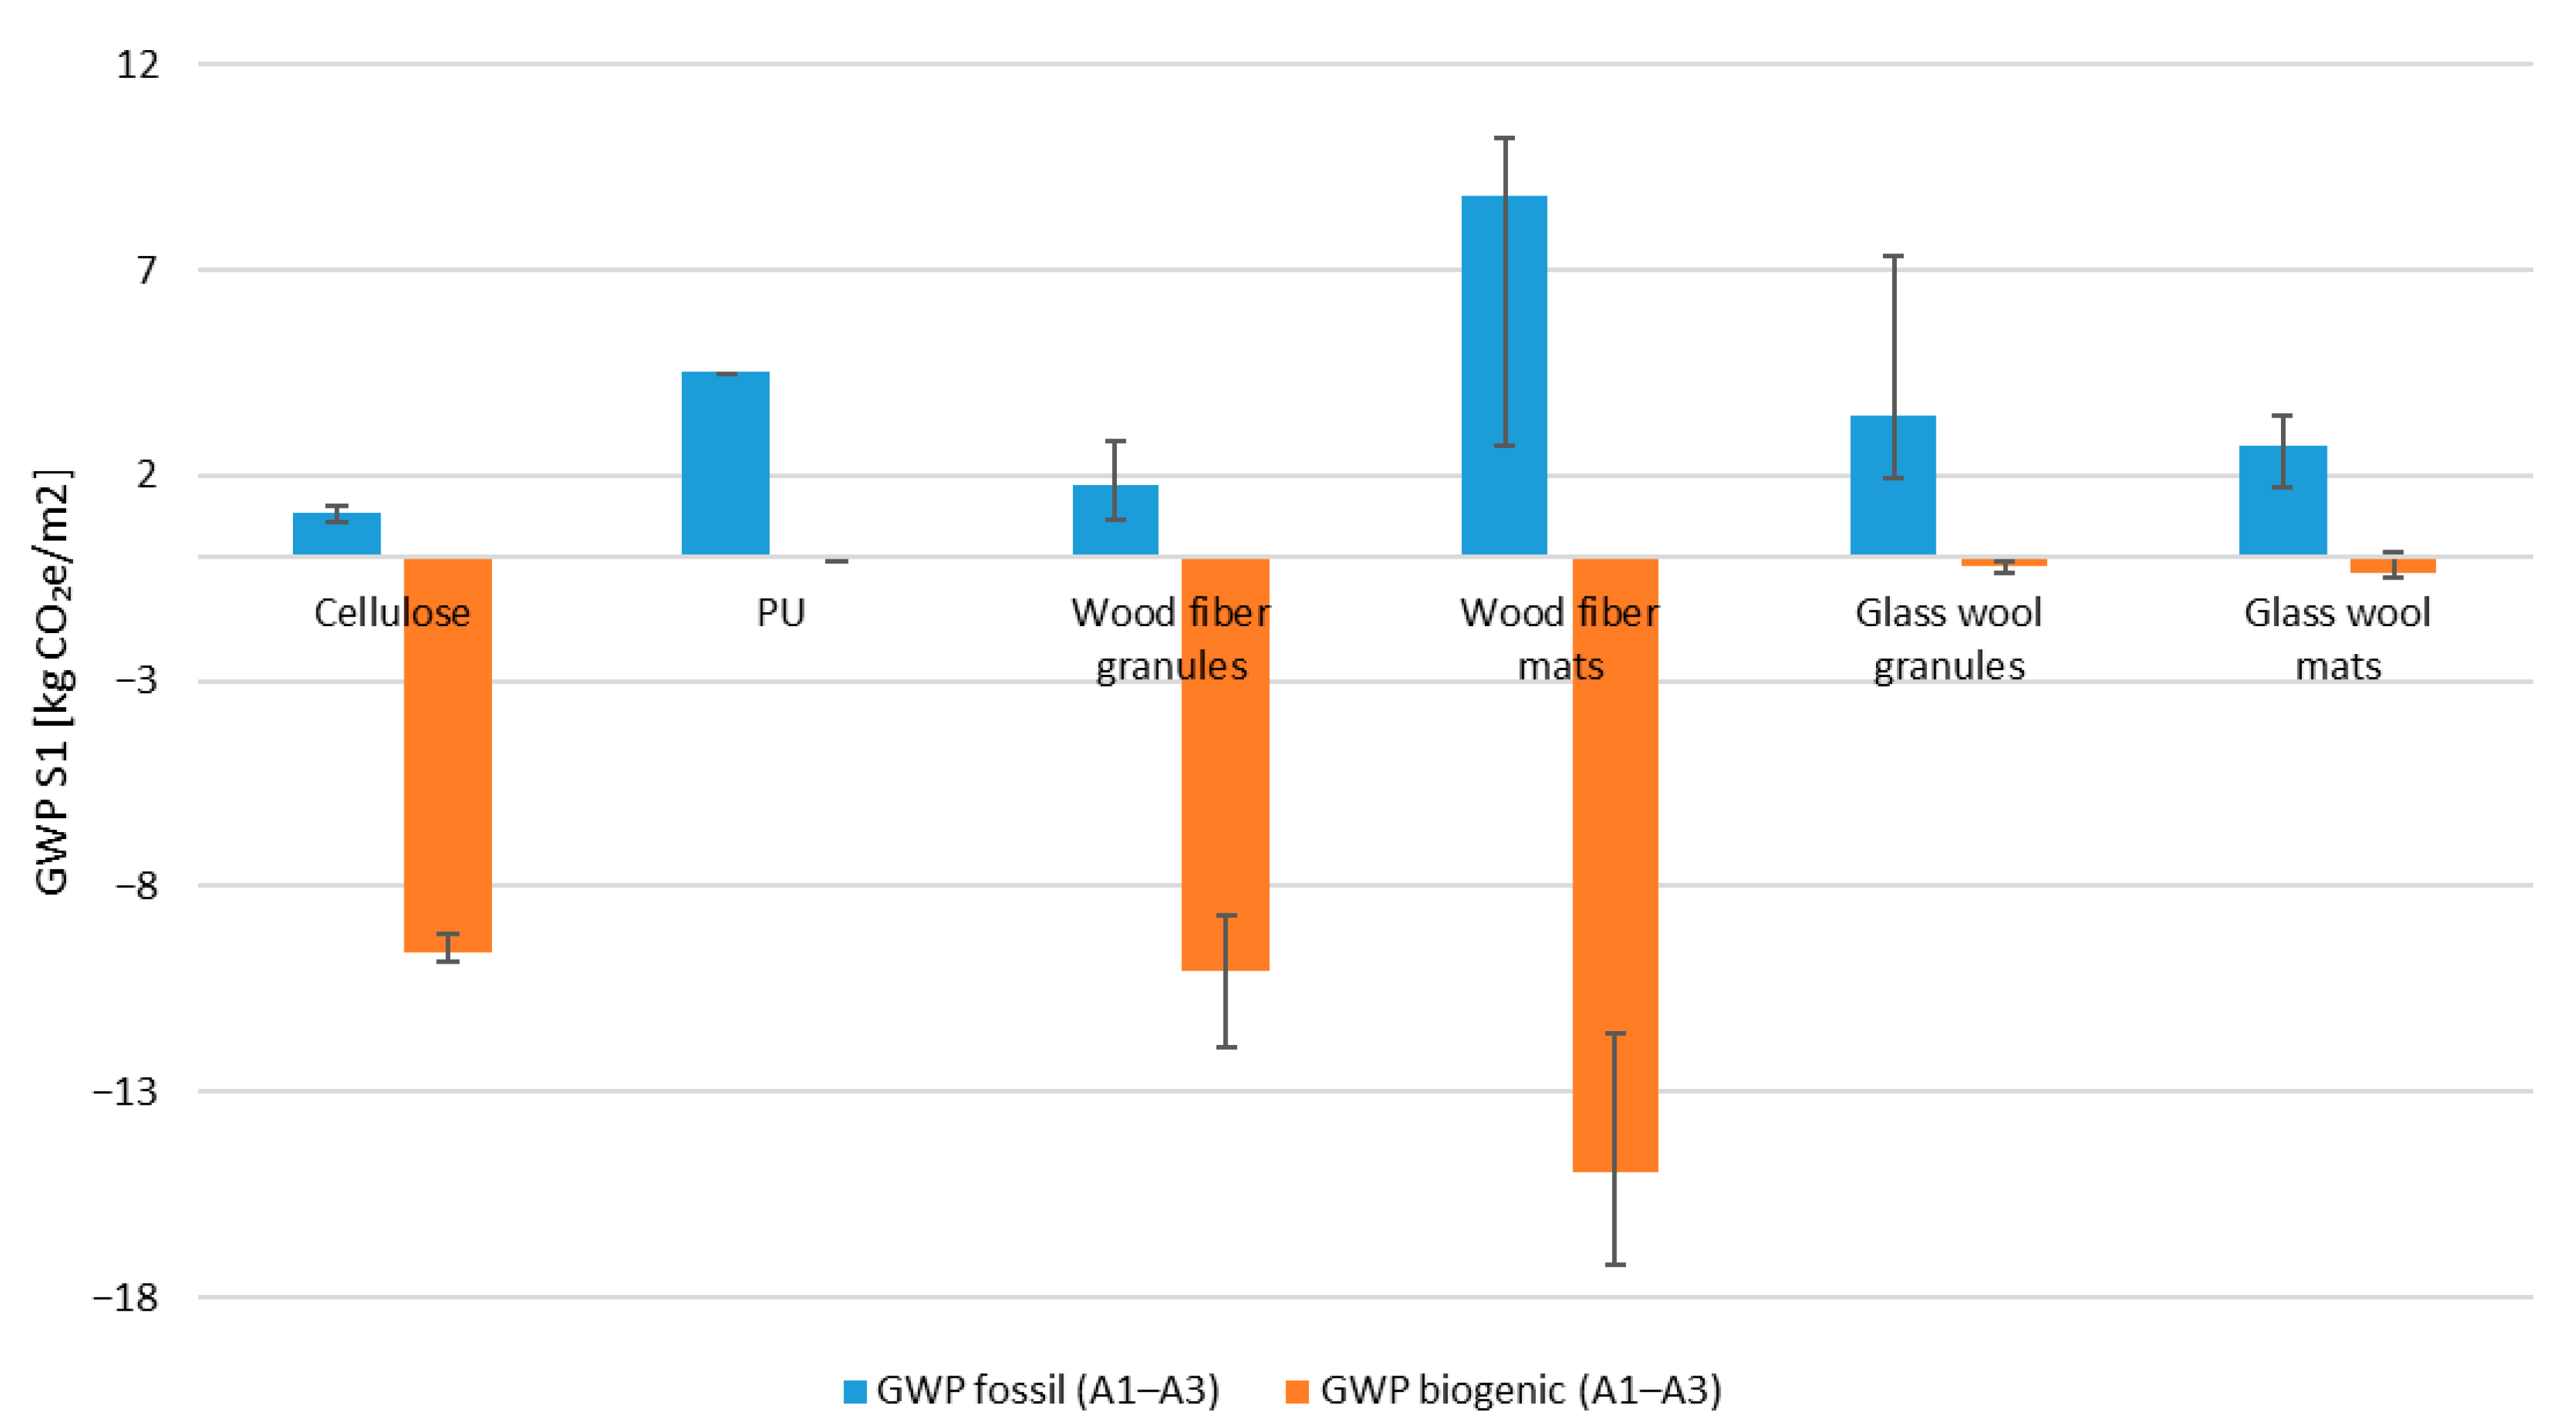
Regardless of the adopted thermal scenario, an additional source of variability of the results is the scatter of environmental data contained in the analyzed EPDs. As indicated in Table 3, a significant scatter of minimum and maximum values of GWPfossil is observed within individual material groups, e.g., from 13.468 to 50.714 kg CO2 e/m3 for wood fiber mats, and from 9.130 to 34.474 kg CO2 e/m3 for glass wool granules. In the analyzed case, the scatter of EPD data is greater than the effect of thermal property correction alone. In addition, Figure 6 demonstrates that the groups of bio-based materials are characterized by significantly negative medians of GWPbiogenic, while mineral and petrochemical materials remain close to zero. However, this result refers only to the product stage (A1–A3) and should not be interpreted as evidence of a net climatic benefit over the whole life cycle, since this also depends on the assumptions adopted for the use phase and the end-of-life scenario of the material.
Figure 6.
The GWP results for the product stage (A1–A3) for the S1 scenario (λdecl). The above bars represent median values, while the error bars represent the min–max range that results from the variability of reported values in the analyzed EPD set. The error bars show the range of the data, not the confidence interval.
4. Discussion
4.1. Significance of Consistent Thermal Assumptions in Environmental Comparisons
The obtained results are consistent with the current state of knowledge, according to which the design value of the thermal conductivity coefficient of a material should not be equated with its declared value, because it depends on the operating conditions after installation in the building envelope [8,9,10,11]. The literature and the normative approach emphasize that the influence of temperature and moisture on the thermal properties of materials may lead to differences between declared parameters and values appropriate for operating conditions [6,7,9,10,15]. In the analyzed case, the correction of the declared thermal conductivity value affected the required insulation thickness, and thus the amount of material assigned to 1 m2 of the envelope and the final GWPfossil result. At the same time, the scale of this effect was limited, and the change in the required material thickness, after taking into account the temperature correction, ranged from −0.46% to −0.50%, which indicates a marginal practical effect of this factor in the considered case. The small magnitude of this effect is consistent with the fact that the calculated temperature conversion factors remained close to unity. Although previous studies and standard-based procedures indicate that declared thermal conductivity values should be converted to design values under operating conditions [6,9,10,11,15,20], the present results show that the effect of temperature correction alone was limited under the adopted boundary conditions.
At the same time, an independent source of result variability in this study is the scatter of EPD data, the scale of which in many cases exceeds the effect of the correction of thermal properties itself. For this reason, the adopted medians should be understood as calculation inputs specific to the analyzed EPD dataset, rather than as a basis for constructing a universal ranking of materials. This issue is discussed in more detail in Section 4.3.
4.2. Significance of Moisture Assumptions for Hygroscopic Materials
The effect of moisture correction on the results for cellulose insulation was different to the effect of temperature correction alone. This is consistent with previous studies indicating that, for hygroscopic materials, the influence of moisture conditions on thermal conductivity may be more pronounced than the effect of temperature alone [7,13,14,16,21]. In this sense, the obtained results highlight the importance of the adopted assumptions when assigning an environmental result to a solution meeting the same functional requirement. However, this should not be interpreted as quantitative validation of the adopted Fm range, because the present study did not determine the actual moisture content of the insulation layer.
As indicated in Table 5, for the adopted range of scenarios, the GWPfossil values for 1 m2 of the ceiling varied from −2.51% to +1.00% compared to the S2 scenario, which indicates greater variability than in the case of temperature correction. Nevertheless, the moisture impact analysis was carried out only for cellulose, for which literature data allowed the Fm range to be defined for ventilated roof-envelope conditions [10], confirming the high sensitivity of the result to the method of defining the reference conditions. The adopted values do not constitute the actual mapping of moisture conditions of the analyzed envelope, but rather calculation scenarios intended for assessing the sensitivity of results. A more precise determination of the moisture effect would require a transient hygrothermal analysis, because the value of conversion factor is influenced by the boundary conditions, as well as the envelope layout and the hygrothermal properties of individual materials [14,17,19,21]. The dependence of thermal properties on moisture conditions may also apply to other hygroscopic materials; however, in this study it was not compared quantitatively due to the lack of comparable input data for all material groups. The presented values do not constitute conclusive quantitative evidence, but illustrate the potential sensitivity of the result to the adopted moisture assumptions in the case of a hygroscopic material.
4.3. Scatter of EPD Data as an Independent Source of Variability
The results demonstrate that the environmental data adopted for the analysis have the greatest impact on the carbon footprint and sustainability interpretation of compared solutions. Table 4 shows a wide range of the min–max GWPfossil values per 1 m3 of material. This means that the final result depends not only on the required amount of material, but also on the representative value adopted from the analyzed EPD set. This observation is consistent with broader findings in the literature, according to which the environmental assessment results for insulation materials strongly depend on the adopted functional unit, the scope of data, and the source of environmental information [3,4,27].
In the analyzed case, the variability resulting from the selection of EPD data was generally greater than the effect of converting declared thermal conductivity to temperature-corrected design thermal conductivity. Therefore, the numerical influence of λ-conversion should be interpreted in relation to the uncertainty introduced by environmental input data. While the λ-conversion affects the calculated insulation thickness and the corresponding A1–A3 result, the choice of representative EPD values may alter the environmental interpretation to a greater extent.
For this reason, the use of median values in this study should be understood as a transparent calculation procedure for the analyzed EPD dataset, not as a universal characterization of material groups. The min–max ranges reported in Table 3 and shown in Figure 6 indicate the possible spread of results within the collected declarations, but they do not represent statistical confidence intervals. Consequently, the obtained results should not be interpreted as a manufacturer-independent or market-independent ranking of insulation materials. Rather, they show that simplified environmental comparisons of insulation solutions are sensitive to the structure and representativeness of the adopted EPD dataset. In this context, EPD selection may influence the final environmental assessment more strongly than the correction of thermal properties itself. This finding complements previous studies on embodied carbon and insulation materials [3,4,27] by showing that, within the analyzed functional-unit-based framework, environmental data variability may have a greater influence on the interpretation of results than temperature-based λ-conversion.
4.4. Significance of Separate Reporting of GWPfossil and GWPbiogenic
A consequence of limiting the analysis to the product stage (A1–A3) is the need to separately report GWPfossil and GWPbiogenic. In Table 3, the bio-based materials exhibit significantly negative GWPbiogenic values, while mineral and petrochemical materials remain close to zero. Such distribution of results is consistent with the literature on the environmental assessment of bio-based materials, which emphasizes that the interpretation of indicators related to biogenic carbon requires caution and strongly depends on the system boundaries and the end-of-life scenario of the material [3,5,27].
Negative GWPbiogenic values for the product stage therefore do not automatically mean that these materials provide a net climatic benefit over the whole life cycle. Such an interpretation would require consideration of subsequent life cycle stages, in particular the end-of-life scenario of the material and the manner in which biogenic carbon is released or further stored. For this reason, the present study should be treated as an analysis of product-stage indicators, rather than as a comparison of the full climatic effect of the analyzed solutions.
4.5. Limitations of This Study and Directions for Further Work
The scope of this study was deliberately limited in order to isolate the impact of adopting declared and design thermal conductivity coefficients on the environmental assessment result of thermal insulation materials. The adopted steady-state heat conduction model is appropriate for assessing how the assumed value of thermal conductivity translates into the required insulation thickness and the resulting GWP value; however, it does not constitute a basis for predicting the actual moisture content of the material or its long-term performance under operating conditions. In this sense, the present study should be treated as a screening/sensitivity study carried out under simplified modeling assumptions, rather than as a full assessment of coupled heat and moisture transfer over time. Consequently, the results should be interpreted as sensitivity outcomes obtained under fixed boundary conditions, not as predictions of real in-use hygrothermal behavior, seasonal moisture accumulation, drying potential, or long-term changes in insulation performance.
The most important limitation of this study is the lack of a transient hygrothermal analysis of the analyzed envelope. For this reason, the impact of moisture on thermal conductivity was not determined for all materials, and in the case of cellulose, it was presented only as a range of scenarios based on literature data. Therefore, the presented results do not allow the actual accumulation of moisture over time or the long-term performance of materials after installation to be assessed, but rather show the influence of the adopted calculation assumptions on the result of a simplified environmental assessment. A second limitation is the narrowing of environmental assessment to the A1–A3 product stage, which does not allow to assess a full life cycle. A third limitation is the EPD set structure, including a small amount of data for some material groups. An additional limitation of the study is the use of climate data only for the Poznań location. This means that the presented results have the character of a single-climate case study and should not be directly transferred to maritime climates or colder continental climates, in which the temperature and humidity profiles may lead to a different scale of the effect of the adopted calculation assumptions.
In subsequent studies, it would be justified to combine the environmental analysis with a transient simulation of heat and moisture transfer for a specific envelope, as well as to expand the scenario assessment to include the full range of EPD variability. Only such an approach would allow an assessment of the extent to which the obtained results remains stable under changes in operating conditions, climate, envelope layer arrangement, and the adopted set of environmental data.
5. Conclusions
Thermal modernization of existing buildings is increasingly focused not only on the assessment of energy efficiency, but also on environmental performance, which is central to sustainability-oriented retrofit decision-making and requires a consistent interpretation of environmental results assigned to thermal insulation solutions. This study analyzed the impact of adopting the declared and design thermal conductivity of insulating materials on the required thickness of the thermal insulation layer, and on the GWPfossil value for the product stage (A1–A3), for the ceiling under an unheated ventilated attic. The comparison was carried out for the same functional unit, i.e., 1 m2 of the envelope after the application of thermal modernization achieving Utarget = 0.15 W/(m2·K).
The most important findings include the following.
The results indicate that, when the amount of insulation material is calculated from a target U-value in sustainability-oriented assessment, the use of declared or design thermal conductivity values should be clearly stated, because this assumption affects the material quantity assigned to the functional unit. This results from the fact that thermal properties of a product depend on the envelope layer arrangement and the method of its application, which influences its actual thermal efficiency (λdecl vs. λdesign). Therefore, when interpreting the environmental result of solutions involving moisture-sensitive materials, it is justified to take into account design values determined for a specific envelope solution.
In the analyzed case, the temperature correction alone changed the required insulation thickness and the corresponding GWPfossil result by approximately 0.50%. Therefore, its quantitative influence was small and would likely be of limited practical importance compared with typical rounding of insulation thicknesses.
In the case of cellulose, the sensitivity analysis based on the literature Fm range showed greater variability of the result than the temperature correction alone. The change in GWPfossil in relation to the S2 scenario ranged from −2.51% to +1.00%. This cellulose-only result should be interpreted only as an illustrative sensitivity example based on the adopted literature-derived Fm range. It does not replace a transient hygrothermal analysis for a specific envelope and should not be generalized to other insulation materials.
Within the analyzed dataset, the variability of EPD-derived GWP values was a key source of interpretative uncertainty and generally exceeded the effect of thermal property correction itself. This means that, in practical assessments, the environmental result may depend more on the specific product, manufacturer, and EPD selected for a project than on the generic material category alone. Therefore, the selection and representativeness of EPD data should be treated as a key methodological issue in environmental comparisons of functionally equivalent insulation solutions intended to support sustainable retrofit decisions. In the case of bio-based materials, the reporting method of GWPfossil and GWPbiogenic indices is of crucial importance. Negative GWPbiogenic values reported for the product stage (A1–A3) do not automatically indicate a net climatic benefit over the whole life cycle of the material. Such an assessment would require consideration of subsequent life cycle stages, in particular the end-of-life scenario.
The presented results indicate that, when interpreting the environmental results of thermal insulation solutions in sustainable retrofit design, consistency should be maintained between the functional unit and the method used to determine the thermal properties of the material after its installation in the building envelope.
Nevertheless, it is necessary to clearly indicate the limitations of the conducted study. The environmental analysis was limited to the A1–A3 modules, the amount of EPD data set for some material groups was limited, and the impact of moisture was not determined based on a transient hygrothermal simulation of the analyzed envelope. The presented analysis does not constitute a comprehensive assessment of the long-term hygrothermal performance of materials under operating conditions, but rather a sensitivity study showing how the adopted assumptions regarding the λ value affect the required insulation thickness and the assigned A1–A3 result.
In subsequent studies, it would be justified to combine the environmental assessment with a transient analysis of moisture and heat transfer for a specific envelope, as well as to expand the comparisons to include the full scatter of EPD data and subsequent life cycle stages. Only such an approach would allow the range of reliability of the obtained sustainability-oriented assessment results to be determined under changing operating conditions, climate and adopted material data.
Author Contributions
Conceptualization, M.S. and A.S.-G.; methodology, M.S.; validation, A.S.-G. and B.K.; formal analysis, M.S.; investigation, M.S.; data curation, M.S.; visualization, M.S.; writing—original draft preparation, M.S.; writing—review and editing, A.S.-G. and B.K.; supervision, A.S.-G. and B.K.; project administration, A.S.-G. All authors have read and agreed to the published version of the manuscript.
Funding
This research received no external funding.
Institutional Review Board Statement
Not applicable.
Informed Consent Statement
Not applicable.
Data Availability Statement
The data presented in this study are available from the corresponding author upon reasonable request. Publicly available source data used in the study are cited in the manuscript and listed in Appendix B.
Conflicts of Interest
The authors declare no conflicts of interest.
Appendix A
Table A1.
List of symbols used in the manuscript.
Appendix B
Table A2.
Environmental product declarations used in the analysis.
References
- United Nations Environment Programme. Global Status Report for Buildings and Construction 2024/2025; UNEP: Paris, France, 2025; Available online: https://wedocs.unep.org/20.500.11822/47214 (accessed on 8 April 2026).
- Landolfi, R.; Nicolella, M. Durability Assessment of ETICS: Comparative Evaluation of Different Insulating Materials. Sustainability 2022, 14, 980. [Google Scholar] [CrossRef] [Scilit]
- Gervasio, G.; Asdrubali, F.; Thomas, G. Embodied Energy and Carbon of Building Insulating Materials: A Critical Review. Clean. Environ. Syst. 2021, 2, 100032. [Google Scholar] [CrossRef] [Scilit]
- Di Fraia, R.; Minichiello, F.; Alfano, R.; Di Mauro, R.; Senatore, S.B. A Novel Prescriptive Approach for Buildings’ Insulation Design Considering Embodied Carbon. Renew. Sustain. Energy Rev. 2025, 212, 115369. [Google Scholar] [CrossRef] [Scilit]
- O’Brien, L.; Liu, L.; Fedorik, W.; Santos, J.; Harter, B.; O’Neill, S. Review of Bio-Based Wood Fiber Insulation for Building Envelopes: Characteristics and Performance Assessment. Energy Build. 2025, 328, 115114. [Google Scholar] [CrossRef] [Scilit]
- Le, D.H.A.; Pásztory, Z. An Overview of Factors Influencing Thermal Conductivity of Building Insulation Materials. J. Build. Eng. 2021, 44, 102604. [Google Scholar] [CrossRef] [Scilit]
- Jerman, M.; Černý, R. Effect of Moisture Content on Heat and Moisture Transport and Storage Properties of Thermal Insulation Materials. Energy Build. 2012, 53, 39–46. [Google Scholar] [CrossRef] [Scilit]
- PN-EN ISO 6946:2017-10; Building Components and Building Elements. Thermal Resistance and Thermal Transmittance. Calculation Method. ISO: Geneva, Switzerland, 2017.
- PN-EN ISO 10456:2009; Building Materials and Products. Hygrothermal Properties. Tabulated Design Values and Procedures for Determining Declared and Design Thermal Values. ISO: Geneva, Switzerland, 2009.
- Rode, C.; Rudbeck, C.C. A Procedure to Determine the Design Value of Thermal Conductivity of Thermal Insulation Materials. In Research in Building Physics; CRC Press: Boca Raton, FL, USA, 2020. [Google Scholar]
- Rudbeck, C.C.; Rode, C. Procedure for Determining the Design Value of the Thermal Conductivity of Thermal Insulation Materials; Technical University of Denmark: Lyngby, Denmark, 2001. [Google Scholar]
- Balázs, N.; Tamás, K.S. Energy and Hygrothermal Performance of Built-In Mineral Wool Thermal Insulations. MATEC Web Conf. 2018, 163, 07002. [Google Scholar] [CrossRef] [Scilit]
- Yang, W.; Zhang, G.; He, W.; Liu, J. The Effect of Relative Humidity Dependent Thermal Conductivity on Building Insulation Layer Thickness Optimization. Buildings 2022, 12, 1864. [Google Scholar] [CrossRef] [Scilit]
- Fojtík, F.; Zajíček, J.; Lstibůrek, M.; Kabrhelová, H.-R.; Kočí, R.; Jerman, M.; Ivánek, K.; Achten, S. Hygrothermal Properties of Advanced Bio-Based Insulation Materials. Energy Build. 2021, 253, 111528. [Google Scholar] [CrossRef] [Scilit]
- Kendzierawska, W.A.; Trochonowicz, M. Effect of Temperature and Humidity on the Thermal Conductivity λ of Insulation Materials. Civ. Environ. Eng. Rep. 2023, 33, 42–49. [Google Scholar] [CrossRef] [Scilit]
- Kosiński, P. Moisture Transport in Loose Fibrous Insulations under Steady-State Boundary Conditions. Materials 2023, 16, 7656. [Google Scholar] [CrossRef] [Scilit] [PubMed]
- Mattila, H. Moisture Behavior of Building Insulation Materials and Good Building Practices. In Proceedings of the Rakennusfysiikka 2017, Tampere, Finland, 11–14 June 2017. [Google Scholar]
- Szymczak-Graczyk, A.; Gajewska, G.; Ksit, B.; Laks, I.; Kostrzewski, W.; Urbaniak, M.; Pawlak, T. Application of Experimental Studies of Humidity and Temperature in the Time Domain to Determine the Physical Characteristics of a Perlite Concrete Envelope. Materials 2024, 17, 4938. [Google Scholar] [CrossRef] [Scilit] [PubMed]
- Ksit, B.; Szymczak-Graczyk, A.; Pilch, R. Numerical Simulation of the Impact of Water Vapour and Moisture Blockers in Energy Diagnostics of Ventilated Envelopes. Materials 2022, 15, 8257. [Google Scholar] [CrossRef] [Scilit]
- Kaczmarek, P.; Wróbel, R.; Ruciński, A. An Influence of Temperature on Thermal Conductivity of Loose Fill Insulations of Natural Origin. J. Phys. Conf. Ser. 2023, 2654, 012076. [Google Scholar] [CrossRef] [Scilit]
- Ranefjärd, O.; Strandberg-de Bruijn, P.B.; Wadsö, L. Hygrothermal Properties and Performance of Bio-Based Insulation Materials Locally Sourced in Sweden. Materials 2024, 17, 2021. [Google Scholar] [CrossRef] [Scilit]
- Vėjelis, S.; Gailius, A.; Kičaitė, A. Performance of Loose-Fill Cellulose Insulation. Mater. Sci. 2006, 12, 4. [Google Scholar] [CrossRef] [Scilit]
- Michálková, D.; Ďurica, P. Experimental Verification of Thermal Insulation in Timber Framed Walls. Materials 2022, 15, 2040. [Google Scholar] [CrossRef] [Scilit]
- Gullbrekken, L.; Grynning, S.; Gaarder, J.E. Thermal Performance of Insulated Constructions—Experimental Studies. Buildings 2019, 9, 49. [Google Scholar] [CrossRef] [Scilit]
- Smoczyk, M.; Ksit, B.; Szymczak-Graczyk, A. Numerical Analysis of Heat Transfer and Surface Condensation Risk in the Plinth Zone of Basement-Included Building. Energy Build. 2025, 344, 116001. [Google Scholar] [CrossRef] [Scilit]
- Ksit, B.; Szymczak-Graczyk, A. Thermal Analysis of Structural Nodes as Location of Difficult Geometry Using Computational Methods. In Proceedings of the MBMST 2019, Vilnius, Lithuania, 16–17 May 2019; pp. 612–616. [Google Scholar] [CrossRef] [Scilit]
- PN-EN 15804+A2:2020; Sustainability of Construction Works. Environmental Product Declarations. Core Rules for the Product Category of Construction Products. Polish Committee for Standardization: Warsaw, Poland, 2020.
- Nicer, T. Flat Ceilings in Historic Buildings. Bud. Archit. 2009, 5, 85–100. [Google Scholar] [CrossRef] [Scilit]
- Minister of Development and Technology. Announcement of the Minister of Development and Technology of 15 April 2022 on the Publication of the Consolidated Text of the Regulation of the Minister of Infrastructure on the Technical Conditions to be Met by Buildings and Their Location. Journal of Laws of the Republic of Poland 2022, Item 1225. Available online: https://dziennikustaw.gov.pl/DU/2022/1225 (accessed on 27 March 2026).
- Dylla, A. Fizyka Cieplna Budowli w Praktyce; PWN: Warsaw, Poland, 2015. [Google Scholar]
- Bobociński, A. Dyskusja czynników konwersji współczynnika przewodzenia ciepła z uwagi na zawartość wilgoci. Pr. Inst. Tech. Bud. 2006, 3, 45–54. [Google Scholar]
- Firkowicz-Pogorzelska, K. Metodyka określania wartości obliczeniowej współczynnika przewodzenia ciepła materiałów budowlanych. Pr. Inst. Tech. Bud. 2001, 3, 47–49. [Google Scholar]
- Smoczyk, M.; Ksit, B.; Szymczak-Graczyk, A. Numerical Analysis of the Ground Temperature Function Depending on Edge Thermal Insulation Parameters for Shallow Slab Foundations. Energy 2025, 314, 134221. [Google Scholar] [CrossRef] [Scilit]
- PN-B-02025:2001; Calculation of Annual Space Heating Requirements for Residential and Collective Residential Buildings. Polish Committee for Standardization: Warsaw, Poland, 2001.
- PN-EN 13171+A1:2015-04; Thermal Insulation Products for Buildings. Factory Made Wood Fibre (WF) Products. Specification. Polish Committee for Standardization: Warsaw, Poland, 2015.
- PN-EN 14315-1:2013-06; Thermal Insulating Products for Buildings. In-Situ Formed Sprayed Rigid Polyurethane (PUR) and Polyisocyanurate (PIR) Foam Products. Part 1: Specification for the Rigid Foam Spray System Before Installation. Polish Committee for Standardization: Warsaw, Poland, 2013.
- PN-EN 13162+A1:2015-04; Thermal Insulation Products for Buildings. Factory Made Mineral Wool (MW) Products. Specification. Polish Committee for Standardization: Warsaw, Poland, 2015.
- PN-EN 14064-1:2018-12; Thermal Insulation Products for Buildings. In-Situ Formed Loose-Fill Mineral Wool (MW) Products. Part 1: Specification for the Loose-Fill Products Before Installation. Polish Committee for Standardization: Warsaw, Poland, 2018.

Disclaimer/Publisher’s Note: The statements, opinions and data contained in all publications are solely those of the individual author(s) and contributor(s) and not of MDPI and/or the editor(s). MDPI and/or the editor(s) disclaim responsibility for any injury to people or property resulting from any ideas, methods, instructions or products referred to in the content. |
© 2026 by the authors. Licensee MDPI, Basel, Switzerland. This article is an open access article distributed under the terms and conditions of the Creative Commons Attribution (CC BY) license.