


Abstract
This study investigates the spatiotemporal evolution and key obstacle factors of urban flood resilience in the Shenyang Metropolitan Area, aiming to inform regional flood resilience planning and management. A comprehensive assessment indicator system was established, integrating natural, economic, social, and infrastructure dimensions to capture the multifaceted nature of flood resilience. The long short-term memory (LSTM) network with an attention mechanism, combined with the obstacle degree model, was employed to analyze resilience trends and diagnose limiting factors from 2001 to 2023. The findings reveal a sustained increase in the regional flood resilience index, rising from 0.255 in 2001 to 0.574 in 2023. Spatially, the resilience pattern evolved from a monocentric core diffusion to a dual-core leadership and multi-city collaborative structure, driven by basin-wide management and differentiated development between mountainous and plain areas. Disparities in resilience levels across cities narrowed over time. At the criterion level, infrastructure was the primary obstacle before 2010, while social factors became increasingly significant thereafter. At the indicator level, the main limiting factors varied among cities and shifted over time, reflecting local development dynamics. These results provide a theoretical basis and practical guidance for enhancing urban flood resilience in the Shenyang Metropolitan Area and offer insights applicable to other rapidly urbanizing regions.
1. Introduction
Global climate change and rapid urbanization have emerged as major drivers of increased frequency and intensity of extreme flood events, posing significant challenges to sustainable urban development [1,2]. Traditional disaster prevention and recovery methods are no longer sufficient to address the complex and ever-evolving risks posed by urban flooding. Resilience—as a cutting-edge concept emphasizing adaptability, robustness, and transformative capacity—has emerged as both the theoretical frontier and the practical focal point of urban flood risk management. Enhancing urban flood resilience is not only an urgent necessity for coping with extreme climatic events but also a crucial pathway toward achieving sustainable urban development [3,4,5]. Urban planning plays a pivotal role in the allocation of resources and the construction of infrastructure, directly influencing a city’s capacity to withstand disasters such as floods and earthquakes, as well as its ability to mitigate urban waterlogging. Effective planning is thus fundamental to achieving sustainable urban growth [6]. During China’s urbanization, the traditional philosophy of “prioritizing expansion at the expense of protection” has led to the encroachment of many river and lake ecological spaces. This process exacerbated the “rain island effect” and led to recurrent urban waterlogging. Consequently, establishing an urban flood resilience system with adaptability and self-recovery capabilities has become an urgent priority in contemporary urban planning [7].
The Shenyang Metropolitan Area, a critical region for revitalizing the old industrial base in Northeast China, exhibits a distinctive urbanization trajectory shaped by its unique natural setting of “mountains encircling rivers,” a heavy industry-oriented development model, and an integrated transportation network. Despite these advantages, the region faces persistent challenges from frequent extreme precipitation, diminishing marginal returns from traditional engineering interventions, and limited ecological buffering capacity. Under these circumstances, a comprehensive analysis of the spatiotemporal evolution of urban flood resilience in the Shenyang Metropolitan Area is essential. Such analysis elucidates the coupling mechanisms between urban planning strategies and flood resilience. It also provides theoretical support and practical guidance for optimizing spatial development, strengthening ecological protection, and formulating differentiated resilience enhancement strategies.
Current methods for assessing urban flood resilience primarily include indicator-based evaluation, numerical simulation, and scenario analysis. The indicator-based evaluation method [8,9,10] quantifies resilience by selecting engineering, social, economic, and ecological indicators, assigning weights, and calculating composite scores. This approach is straightforward, operationally efficient, and yields results that facilitate comparative analyses across cities and time periods [11]. Numerous empirical studies have demonstrated its applicability. The numerical simulation method [12,13] employs hydrological and hydrodynamic models to simulate flood processes in detail, thereby providing insights into the underlying mechanisms and impacts of flood events [14,15]. However, the complexity and computational demands of such models limit their suitability for large-scale regional assessments. Scenario analysis [16,17] evaluates urban resilience under various rainfall regimes by constructing alternative scenarios, thereby addressing future uncertainties. Although traditional, purely physical models can represent the mechanistic processes of hydrology, they exhibit limited adaptability to complex changes in underlying surface conditions; conversely, standalone data-driven models, despite their strong fitting capabilities, suffer from poor interpretability, limited generalization and an inadequate accounting of physical constraints. Shen Chaopeng et al. (2023) systematically examined technological pathways for overcoming these limitations, showing that deeply coupling machine-learning methods—such as neural networks and differentiable programming—with physically based hydrological models can exploit the strengths of data-driven approaches to capture complex nonlinear relationships [18].
While each method has distinct advantages, the indicator-based evaluation method is particularly valued for its flexibility and practicality, making it well-suited for rapid diagnosis of flood resilience and widely adopted in urban resilience assessments [19]. On the other hand, existing studies of regions such as the Shenyang Metropolitan Area tend to focus on unidimensional assessments, lacking comprehensive, multidimensional analyses; they do not systematically identify barrier factors, and offer limited insight into the spatiotemporal evolution mechanisms of flood resilience. These gaps hinder the formulation of targeted resilience-enhancement strategies for such regions.
In response, this paper takes the Shenyang Metropolitan Area as its case study, constructing a multidimensional assessment framework to investigate the spatiotemporal evolution characteristics of its flood resilience and to systematically diagnose the factors impeding resilience. The aim is to provide a transferable paradigm for flood-resilience planning in similar metropolitan areas across Northeast China and beyond. For the first time, we apply an LSTM-Attention deep learning model to assess flood resilience in the Shenyang Metropolitan Area. Through end-to-end learning, this approach dynamically allocates indicator weights and delivers precise resilience predictions. Compared with traditional indicator evaluation methods—such as the Analytic Hierarchy Process (AHP) and the entropy method—the attention mechanism more intuitively reveals each indicator’s differential contribution to resilience, addressing the inability of static weighting to reflect the dynamic interconnections within complex systems. When building the four-dimensional “natural–economic–social–infrastructure” framework, we integrate region-specific indicators—such as river network density and the share of secondary industry—by considering Shenyang’s hydrological geomorphology of being “ringed by mountains and interlaced with waterways” and its “heavy-industry-first” development characteristics. This compensates for the overgeneralization of existing indicator systems and their lack of regional adaptability. Moreover, by deeply coupling long-term resilience assessment with barrier-degree diagnosis, we not only identify spatiotemporal evolution patterns but also, through staged obstacle analyses at both the criterion and indicator layers, provide comprehensive support for differentiated policy making—from “phenomenon recognition” to “action guidance”—thereby overcoming the previous limitations of emphasizing evaluation over application.
2. Study Area and Date Sources
2.1. Overview of the Study Area
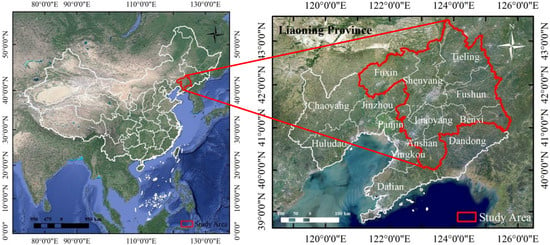
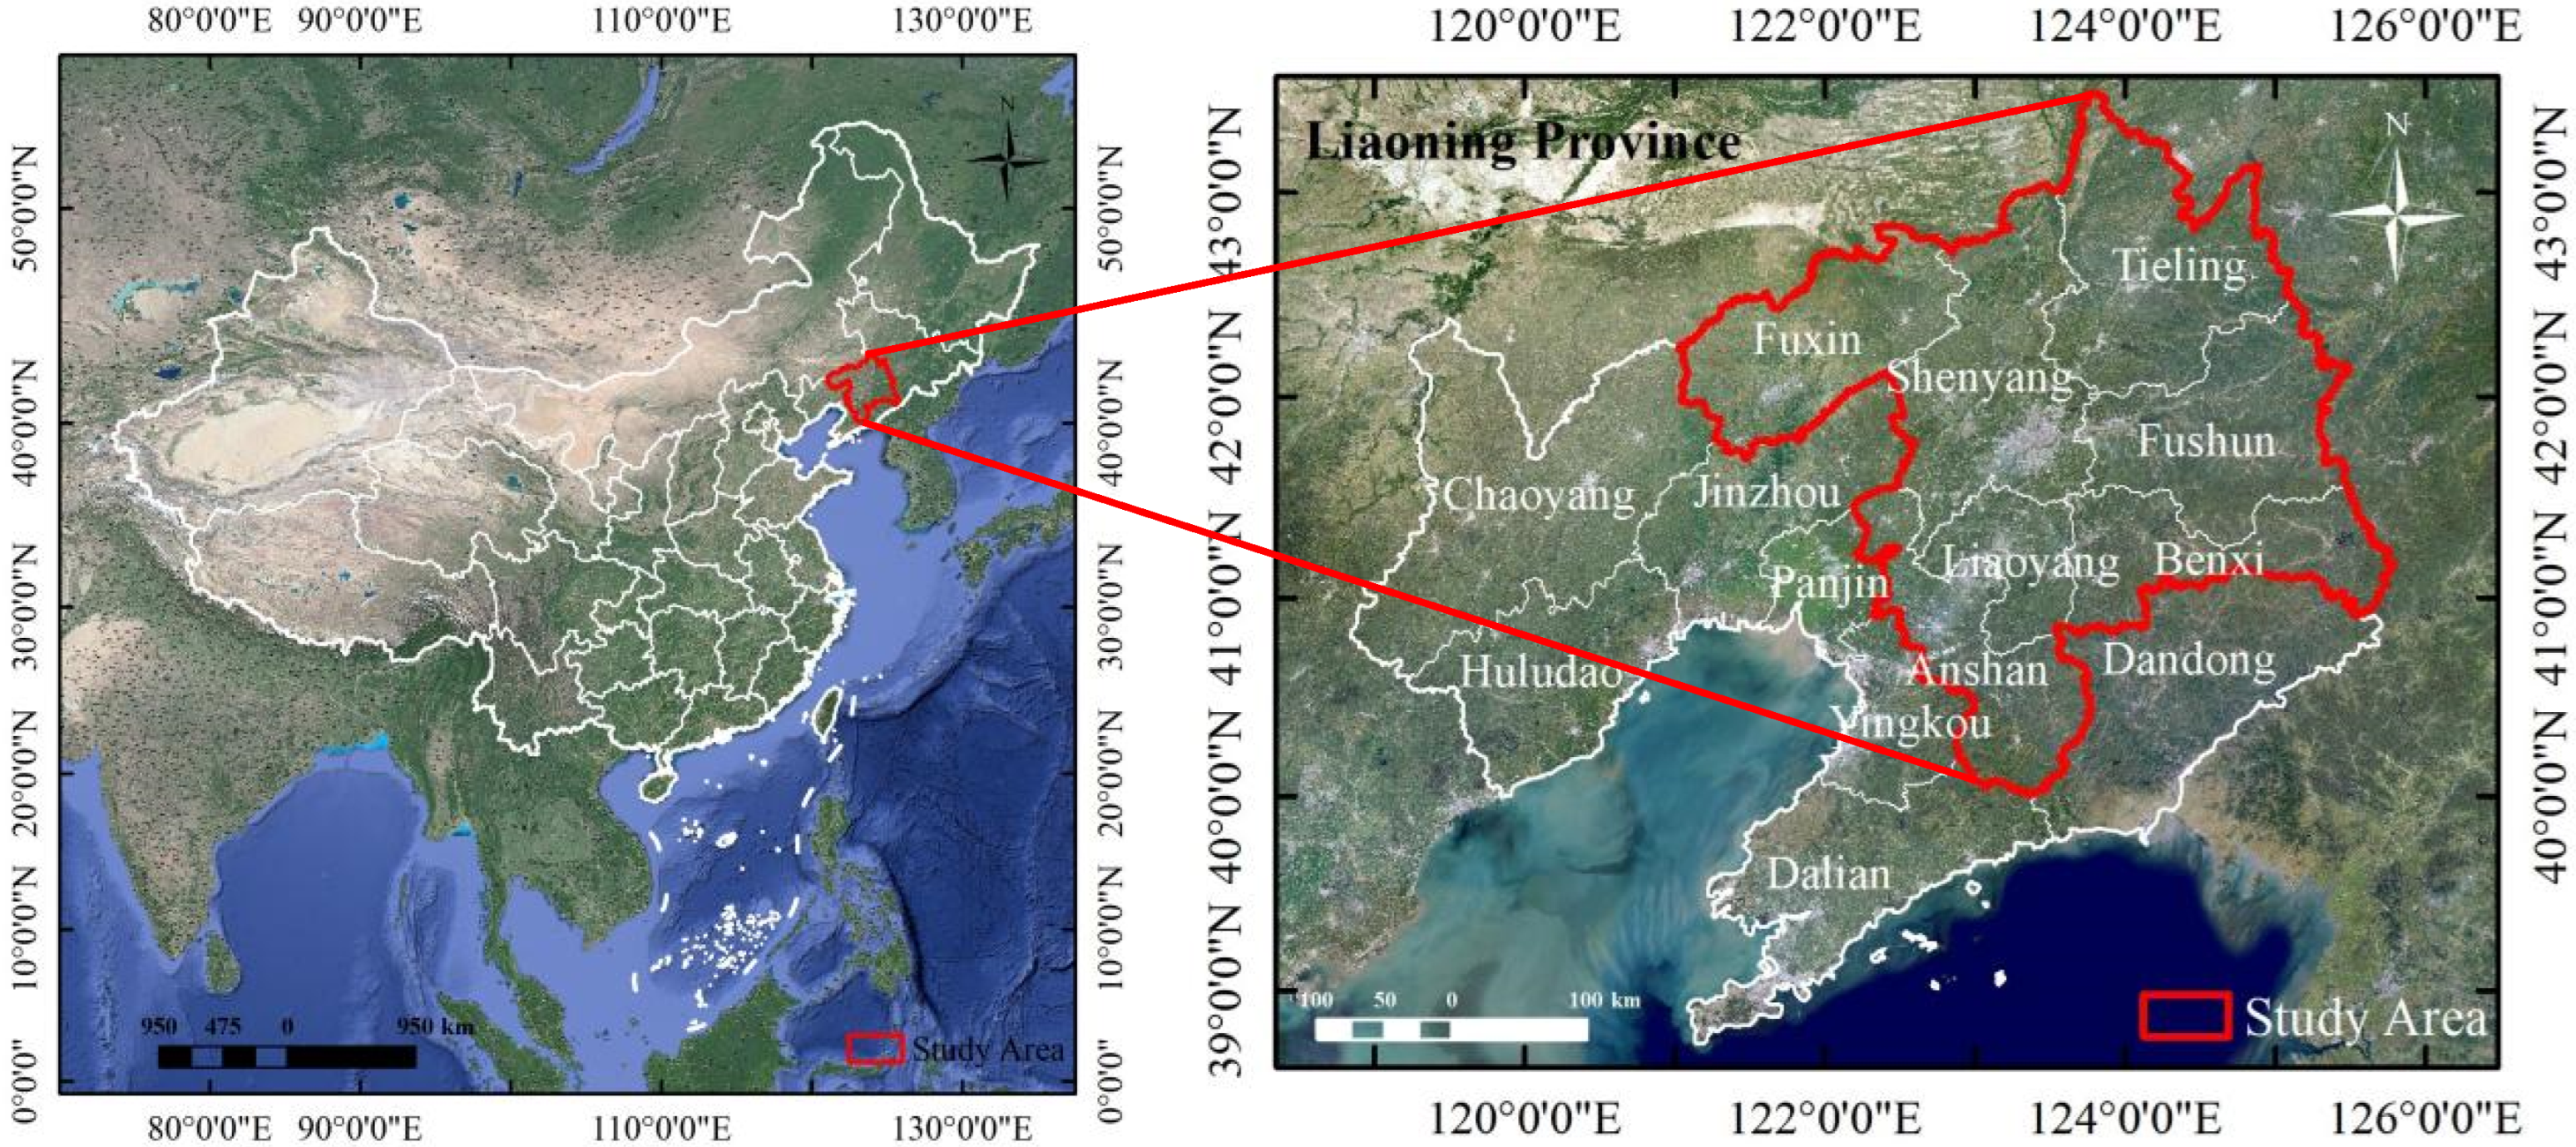
The Shenyang Metropolitan Area, situated in the southern part of Northeast China, represents the region’s only national-level urban agglomeration (see Figure 1). Centered on Shenyang City, this area includes Anshan, Fushun, Benxi, Fuxin, Liaoyang, Tieling, and the Shenfu New District (due to its recent establishment and limited data availability, information for the Shenfu New District is incorporated into the analyses of Shenyang and Fushun rather than treated as an independent research unit). Covering approximately 75,000 km2, the region functions as a national demonstration zone for new-type industrialization and serves as a key growth pole for the revitalization of Northeast China.
Figure 1.
Scope of the study area (Approval Map No. GS (2024) 0650).
The region experiences a temperate continental monsoon climate, with the majority of precipitation occurring in July and August. The eastern mountainous areas are prone to localized heavy rainfall, while the western Liaohe Plain is characterized by low-lying terrain and inadequate drainage. Three major rivers—the Liaohe, Hunhe, and Taizi—traverse the region, creating a distinctive hydrological and geomorphological pattern described as “eastern mountainous water conservation and western plain flood control.”
Historical extreme events, including the 2013 Fushun Qingyuan torrential rainstorm and the 2021 Liaohe mainstream flood, underscore the complexity of flood resilience in this area. In recent years, several cities have adopted sponge city initiatives and upgraded water conservancy infrastructure, facilitating the local retention and infiltration of up to 80% of rainfall. However, under the influence of global climate change, both the frequency and intensity of heavy rainfall events have increased, thereby elevating the risk of flood disasters. Research on urban flood disaster resilience in the Shenyang Metropolitan Area is therefore critical for enhancing the region’s comprehensive disaster prevention capabilities.
2.2. Data Sources
To ensure complete spatial coverage and appropriate precision, this study used the global station daily precipitation data released by the U.S. National Centers for Environmental Information (https://www.ncei.noaa.gov/data/global-summary-of-the-day/archive/, accessed on 23 September 2025). Based on these original data, daily precipitation raster datasets for the study area were generated using inverse distance weighting (IDW) interpolation, with a spatial resolution of 1 km × 1 km and continuous daily temporal coverage. Topographic and geomorphological data were sourced from the Geospatial Data Cloud (http://www.gscloud.cn/, accessed on 23 September 2025), utilizing a Digital Elevation Model (DEM) with a spatial resolution of 30 m to extract average elevation and average slope. River network distribution data were obtained from the National Geomatics Center of China (https://www.ngcc.cn/, accessed on 23 September 2025). Additional data were collected from the Liaoning Statistical Yearbook (https://tjj.ln.gov.cn/tjj/tjsj/tjnj/lntjnj/index.shtml, accessed on 23 September 2025) and the China Urban Construction Statistical Yearbook (https://www.mohurd.gov.cn/gongkai/fdzdgknr/sjfb/tjxx/jstjnj/index.html, accessed on 23 September 2025).
3. Methods
3.1. Construction of the Urban Flood Resilience Assessment Index System
Urban flood resilience encompasses economic, social, institutional, infrastructural, and ecological dimensions. It refers to the capacity of an area to maintain normal socioeconomic operations and restore essential functions following flood disasters [20]. Based on resilience theory and the specific characteristics of urban flood disasters in the Shenyang Metropolitan Area, this study defines urban flood resilience as follows: the ability of cities and their components to withstand flood events, minimize losses, and rapidly recover through rational resource allocation under extreme weather conditions (e.g., heavy rainfall) [21].
The selection of indicators is grounded in the natural and geographic characteristics of the Shenyang Metropolitan Area, its current socioeconomic development, data availability, and alignment with the Chinese national standard GB/T40947-2021 “Guide for Safety and Resilient City Evaluation.” [22] The aim is to comprehensively capture the region’s capacity to cope with flood hazards. The resulting index system for assessing urban flood resilience in the Shenyang Metropolitan Area is presented in Table 1. The specification of indicator attributes is grounded in the core connotations of flood resilience, regional characteristics, and relevant theories and standards. Positive indicators refer to those that contribute to enhancing urban flood resilience, and are defined such that higher values indicate stronger capacities for resisting and responding to flood hazards. Negative indicators, by contrast, represent factors that inhibit flood resilience, and are defined such that higher values correspond to the increased risk or greater potential impacts of flooding.
Table 1.
Urban flood resilience index system.
Natural Resilience Dimension focuses on the environmental baseline conditions that influence flood occurrence and regulation [23]. The Shenyang Metropolitan Area experiences a temperate continental monsoon climate, with most precipitation concentrated in July and August. Cumulative rainfall during the flood season (N1) and the number of heavy rainfall days (N2) directly determine flood risk intensity and are therefore included as negative (harmful) indicators. Topographically, the eastern part of the region is mountainous while the western part lies on the Liaohe Plain. Mean elevation (N3) and mean slope (N4) are intrinsic natural background indicators; although they do not change from year to year, their spatial heterogeneity determines the inherent pattern of flood risk, influencing runoff velocity and the severity of waterlogging. Low-lying plain areas are thus more susceptible to damage, so these indicators are treated as negative indicators. In contrast, green space ratio within built-up areas (N5) and river network density (N6) serve as positive indicators, since parks, open spaces, and the extensive Hun River, Liao River, and Taizi River networks can attenuate flood impacts through storage and diversion. Data for these variables can be obtained from the U.S. National Centers for Environmental Information (rainfall), DEM products (elevation and slope), and the National Geomatics Center of China (river networks), ensuring strong availability and consistency.
Economic Resilience Dimension reflects the region’s financial and fiscal capacity to recover from flood events [24]. As a key growth pole for the revitalization of Northeast China, the Shenyang Metropolitan Area’s per capita GDP (E1) and the disposable incomes of urban residents and rural households (E3, E7) represent the economic foundation for post-disaster recovery. Local government general public budget expenditure (E2) and public safety expenditure (E6) directly fund flood-control infrastructure and emergency response. Furthermore, the shares of secondary and tertiary industry value added (E5, E4) capture the industrial structure: this heavy-industry-oriented economy’s resilience to flooding partly hinges on the balance between manufacturing and service sectors. All economic indicators are sourced from the Liaoning Statistical Yearbook, offering continuous, reliable data.
Social Resilience Dimension addresses population characteristics and societal capacity [25]. High population density (S1) can exacerbate flood impacts by concentrating people in vulnerable areas [26], while the proportions of residents aged 60 and above (S2) and those under 15 (S3) indicate the share of vulnerable groups [27]; these are negative indicators. Regional R&D expenditure (S4) and average years of education per capita (S5) reflect technological innovation and public awareness, and per capita urban housing area (S6) denotes basic post-disaster living standards—each a positive indicator. These measures align with the region’s aging trend and urbanization patterns, with data drawn from the Liaoning Statistical Yearbook.
Infrastructure Resilience Dimension emphasizes the built environment’s capacity for flood defense and recovery [28]. Recognizing diminishing marginal returns from traditional engineering solutions, we include drainage pipe density in built-up areas (I1) and urban road network density (I2) to represent stormwater conveyance and evacuation routes. Medical rescue capability is captured by hospital beds (I3) and doctors per 10,000 people (I4). Flood regulation infrastructure is measured by total reservoir capacity (I5) and the area protected from waterlogging by reservoirs (I6), notably including the Dahuofang Reservoir. Finally, mobile phone penetration (I7) and private car ownership (I8) ensure communication, evacuation, and logistics during emergencies. These eight indicators are available in the Urban Construction and Liaoning Statistical Yearbooks, ensuring high data quality.
Together, these four dimensions—natural, economic, social, and infrastructure—encompass all core elements of urban flood resilience while integrating the local climatic, industrial, topographic, and demographic context of the Shenyang Metropolitan Area. All indicators possess stable, authoritative data sources and adhere to GB/T40947-2021, providing a robust foundation for flood resilience evaluation.
3.2. LSTM-Attention-Based Modeling for Urban Flood Resilience Evaluation
3.2.1. LSTM-Attention
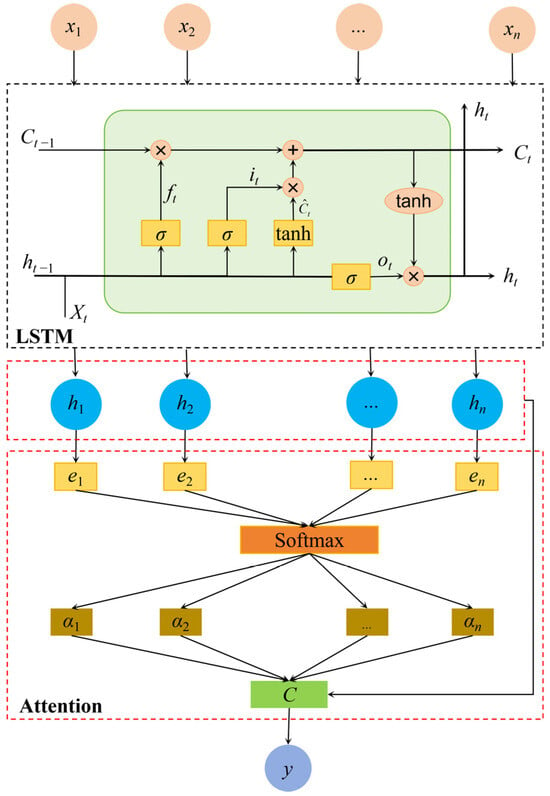
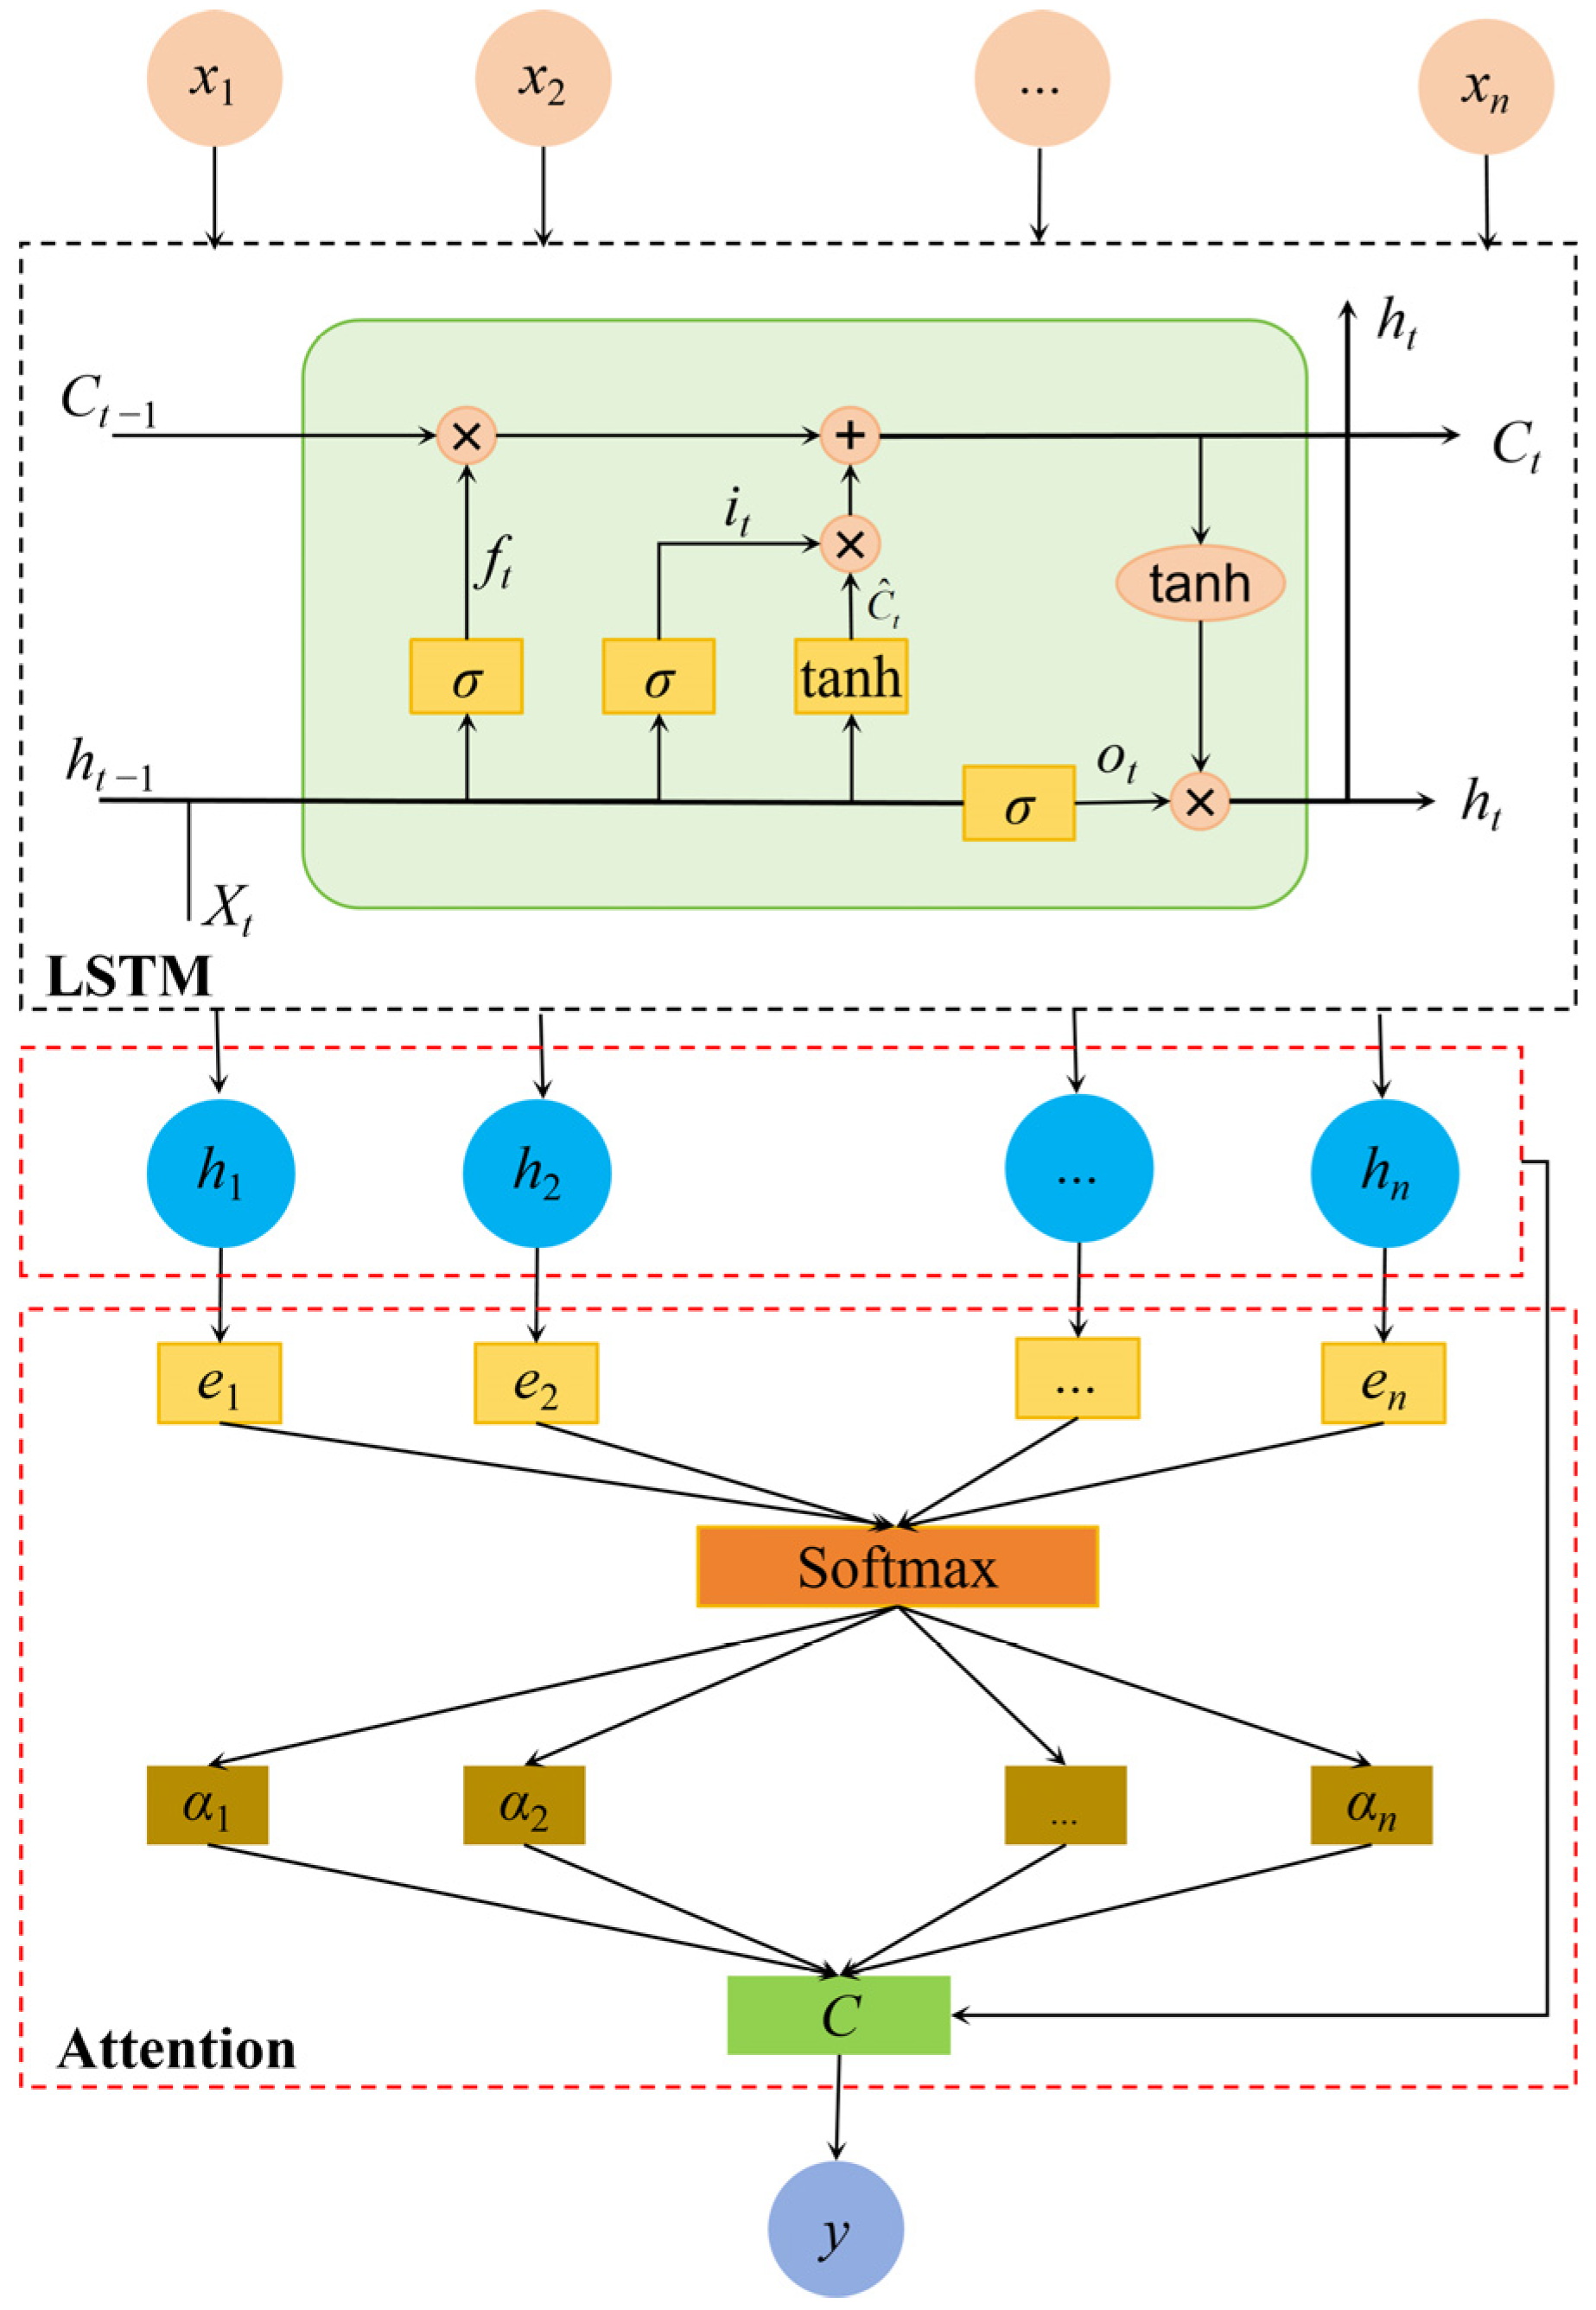
Urban flood resilience assessment is inherently a multi-indicator-driven classification task. The principal challenge involves accurately quantifying the influence of each evaluation indicator on flood resilience and determining their respective weights. To address this, a deep learning framework integrating Long Short-Term Memory (LSTM) [29,30] networks and the attention mechanism [31], termed LSTM-Attention, is developed. This approach enables end-to-end learning for simultaneous resilience prediction and indicator weight estimation. The overall network structure is depicted in Figure 2.
Figure 2.
Schematic diagram of the LSTM-Attention network structure.
The architecture consists of two primary modules: an LSTM-based feature extraction module and an attention-based weight allocation module. The input comprises a standardized 27-dimensional assessment indicator vector, while the output represents the flood resilience level for each city. Both modules are jointly optimized via backpropagation, following these procedures:
- a)
- The LSTM module extracts long-range dependency features among indicators;
- b)
- The attention mechanism dynamically assigns weights to the indicators, generating a context vector that integrates key information;
- c)
- The regression module produces the flood resilience prediction value based on the context vector;
- d)
- Upon completion of training, the contribution of each indicator to flood resilience is inferred from the attention weights;
- (a)
- LSTM sequence feature extraction module.
The LSTM module processes time-series indicators as sequential time steps, explicitly modeling the temporal correlations among them. For constant indicators that do not vary year to year, such as mean elevation and mean slope, the model preserves their effects using a “spatial-dimension encoding” approach: the constant indicator values for the seven cities are treated as spatial features and fed into the model together with dynamic indicators. By learning the mapping between the “constant indicator values+ combinations of dynamic indicators” and resilience levels, the model indirectly quantifies their stable contribution to resilience. The core of the LSTM comprises three types of gating units: the forget gate, input gate, and output gate, which dynamically regulate the retention, removal, and updating of information [32].
The forget gate determines the degree to which historical indicator information is preserved. For example, in the assessment of the “number of heavy rainfall days,” the forget gate assigns a weight close to zero to the “cumulative rainfall during flood season” from the previous time step if it exerts minimal influence on current flood resilience, thereby discarding this information. In contrast, for indicators such as “river network density” that are highly relevant, the output weight approaches one, ensuring the retention of critical information.
The input gate selectively transmits features from the current indicator that inhibit flood resilience. For instance, in the evaluation of “slope,” the input gate assesses the association between slope magnitude and flood resilience. A large slope, which may induce rapid runoff and exacerbate waterlogging, reduces resilience; consequently, the input gate increases the transmission of this feature. Conversely, a small slope, which may slow runoff and enhance resilience, leads the input gate to suppress this feature.
The cell state ct functions as the memory bank of the LSTM, integrating essential historical information and current features through the combined actions of the forget and input gates. For example, during the evaluation of “river network density” at time step t, the cell state synthesizes a comprehensive memory that reflects its impact, thereby providing contextual information for subsequent processing.
The output gate generates the hidden state ht based on the cell state ct, which serves as the resilience-related feature representation at the current time step.
The sequence of hidden states produced by the LSTM, H = {h1,h2,…,h27} (where 27 denotes the number of assessment indicators), forms the basis for attention weight computation. Each hidden state ht encapsulates information regarding the association between indicator xt and the remaining indicators, and its quality directly influences the accuracy of the attention weights.
- (b)
- Attention-based weight allocation module
The attention module applies a fully connected layer to the LSTM hidden states H for nonlinear transformation, calculating the attention score ei for each time step:
where hi ∈ Rd is the hidden state at the ith time step output by the LSTM, d is the hidden layer dimension, Wa ∈ Rk×d is the weight matrix, and ba ∈ Rk is the bias vector. The tanh(·) function enhances nonlinear feature expression.
To convert the scores into a probability distribution (with weights summing to one), the Softmax function is used to compute the attention distribution [33]:
where n is the total number of indicators in the assessment system; αi reflects the contribution of the ith indicator to flood resilience.
A context vector c, integrating key information, is then generated by weighted summation:
The context vector is mapped to a scalar resilience value ():
where c is the context vector obtained by the attention-weighted sum of LSTM hidden states; w0 is the output layer weight vector; b0 is the output layer bias term, adjusting the prediction baseline.
The model is trained end-to-end using the mean squared error loss function ():
where N is the total number of samples in the dataset, and yi is the true value for the ith sample.
After model convergence, the average attention weight for each indicator across all samples is calculated via forward propagation:
where is the average attention weight for indicator j across all samples, and is the attention weight for indicator j in the kth sample. N is the total number of samples.
The final indicator weights ωbj are normalized as follows:
where is the average attention weight for indicator j across all samples, and is the sum of the global average weights for all indicators.
3.2.2. Construction of the Urban Flood Resilience Assessment Model
To enable a clear comparison of indicator differences among cities, the natural breaks method is utilized to classify urban flood resilience data from 2001 to 2023. This method maximizes inter-group differences while minimizing intra-group variation. Resilience levels are categorized into five groups: low (Level I), relatively low (Level II), medium (Level III), relatively high (Level IV), and high (Level V), with minor adjustments made according to actual conditions. The classification results are summarized in Table 2.
Table 2.
Classification thresholds for indicator-based resilience levels.
Based on the classification in Table 2, the criteria for urban flood resilience assessment indicators under flood events are established. Using the rand function, 500 samples are randomly generated within each level interval, resulting in a total of 2500 samples. The expected outputs for the five levels are set as 1, 2, 3, 4, and 5, respectively. The feature values of each sample are normalized as follows [34]:
For positive indicators:
For negative indicators:
where xi is the original value of the indicator, xmax is the maximum value in the set, and xmin is the minimum value.
Following normalization, the dataset is divided into training and test sets at a ratio of 8:2. The partitioned data are input into the LSTM-Attention model for training, yielding the feature importance of each indicator, which are then normalized to obtain the indicator weights (ωi).
Urban flood resilience is calculated using a weighted summation model, in which each indicator’s weight is multiplied by its standardized value and the results are summed. The specific formula is:
where R is the urban flood resilience index, ωi is the weight of the ith indicator, xi is the standardized value of the ith indicator, and n is the number of indicators in the system. This approach constructs a multidimensional comprehensive evaluation model by quantifying the linear combination of indicator weights and values, thereby enabling quantitative assessment of urban flood resilience levels.
The ideal range for the urban flood resilience index R is [0, 1]. An R value approaching 1 indicates high urban flood resilience, whereas a value near 0 signifies low resilience. To further distinguish differences in flood resilience levels among cities within the metropolitan area, the urban flood resilience index is divided into five levels, as shown in Table 3.
Table 3.
Grading criteria for urban flood resilience based on index value ranges.
3.3. Identification of Key Urban Flood Resilience Factors Based on the Obstacle Degree Model
To identify the principal obstacle factors affecting urban flood resilience in the Shenyang Metropolitan Area, the obstacle degree model is applied. This model employs weighted evaluation indicators to quantify the negative impact of each indicator value on flood resilience, thereby diagnosing weaknesses in urban flood resilience management in the region. The obstacle degree is determined by the indicator weight (ωi) and the standardized indicator value (), as expressed in the following formula [35]:
where Oi is the obstacle degree of the ith indicator; a larger value indicates a stronger hindering effect; ωi is the weight of the ith indicator; is the standardized value of the ith indicator.
4. Experiment and Analysis
4.1. Determination of Indicator Weights for the Urban Flood Resilience Assessment System
The model hyperparameters were determined through a principled consideration of the data characteristics and the architectural requirements of the network. For the LSTM-Attention model, the hidden layer dimension was set to 32 and the LSTM input dimensionality was set to 1, with the 27 evaluation indicators treated as sequential time steps. The Adam optimizer was used with an initial learning rate of 1 × 10⁻³. Batch sizes were adjusted according to dataset scale: a training batch size of 32 was adopted to balance parameter-update efficiency and memory consumption, while validation and test batches were set to 64 to improve evaluation stability. Training was conducted for up to 200 epochs, accompanied by measures to prevent overfitting.
Model training was guided by the mean squared error (MSE) loss, and predictive performance was assessed using root mean square error (RMSE) and the coefficient of determination (R2). Their definitions are as follows:
where n denotes the number of samples, yi is the true value of the i-th sample, is the corresponding model prediction, and is the mean of the true values.
Overfitting was mitigated through a multi-level strategy. First, the dataset of 2500 samples was split in two stages to ensure strict separation of training, validation and test data: an initial random partition at an 8:2 ratio produced a training set and a test set, and the training set was further divided at a 3:1 ratio to obtain an independent validation set. Second, early stopping was employed by monitoring validation loss in real time and preserving the model parameters at the validation-loss minimum as the final optimal model, thereby preventing later iterations from fitting training noise. Third, the training data were randomly shuffled during training to enhance the model’s robustness to variations in data distribution.
The RMSE values for the training and test sets were 0.0062 and 0.0068, respectively, with R2 values both reaching 0.9999. The resulting weights for each indicator are presented in Table 4.
Table 4.
Indicator weights by resilience dimension.
4.2. Temporal Evolution of Urban Flood Resilience in the Shenyang Metropolitan Area
4.2.1. Analysis of Overall Flood Resilience Trends
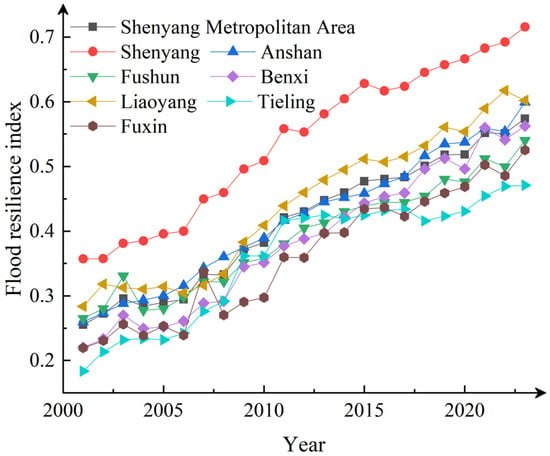
The temporal evolution of urban flood resilience in the Shenyang Metropolitan Area was examined by calculating the flood resilience indices for the metropolitan area and its constituent cities from 2001 to 2023 using the established assessment model, as illustrated in Figure 3.
Figure 3.
Annual flood resilience indices for cities in the Shenyang Metropolitan Area (2001–2023).
Analysis of these trends indicates that, from 2001 to 2023, the flood resilience indices of the seven cities—Shenyang, Anshan, Fushun, Benxi, Fuxin, Liaoyang, and Tieling—as well as the overall metropolitan area, all exhibited an upward trajectory. This reflects continuous improvement in flood resilience across the region, although the rates of increase and the magnitude of fluctuations varied among the cities.
Shenyang consistently maintained the highest flood resilience index among the seven cities, increasing from 0.357 in 2001 to 0.716 in 2023, nearly doubling over the study period. With the exception of a slight decline in 2016, the index demonstrated a steady upward trend, indicating both stability and comprehensive enhancement. This improvement is primarily attributable to Shenyang’s status as the provincial capital and a key city for flood control in Liaoning. Since the 13th Five-Year Plan, significant progress has been achieved through the implementation of the Hunhe River flood control improvement project and the expansion and renovation of the urban drainage network.
Anshan’s flood resilience index increased from 0.260 in 2001 to 0.599 in 2023. After 2018, growth accelerated, reaching 0.559 in 2021, followed by a slight decrease to 0.554 in 2022 and a subsequent increase to 0.599 in 2023, gradually approaching the level of cities such as Benxi. This improvement is mainly attributed to the comprehensive management plan for the Liao River Basin, including river channel regulation, embankment reinforcement along the Taizi River section in Anshan, and renovation of drainage systems in old industrial areas.
Fushun’s flood resilience index rose from 0.265 in 2001 to 0.540 in 2023, with several fluctuations during the period. Since 2010, the index has gradually stabilized and entered a phase of rapid growth, peaking at 0.512 in 2021. The primary driver has been the implementation of ecological restoration projects upstream of the Dahuofang Reservoir since 2005, which enhanced flood control functions and led to steady growth in resilience after 2015.
Benxi’s flood resilience index increased from 0.220 in 2001 to 0.562 in 2023, surpassing Fushun and Fuxin. With the exception of a slight decline in 2020 compared to 2019, the index generally exhibited an upward trend with a significant increase. This improvement is mainly the result of the “Establishing Province by Ecological Way” development strategy in Liaoning, which included extensive construction of water conservation forests in the eastern mountainous areas, effectively enhancing flood prevention and disaster mitigation capabilities.
Fuxin exhibited the largest fluctuations in its flood resilience index. There was a significant increase in 2007 compared to 2006, followed by a decrease to 0.270 in 2008, and another decline in 2017 compared to 2016. Subsequently, growth accelerated, reaching 0.525 in 2023, positioning its resilience at a mid-level. These changes are closely associated with flood control measures implemented under the resource-based city transformation policy. Fuxin constructed three large rainwater pumping stations using mine restoration funds, which resolved frequent flooding in the old urban area and improved the city’s flood resilience.
Liaoyang’s flood resilience index increased from 0.283 in 2001 to 0.602 in 2023, exhibiting a rapid upward trend. The index reached its highest value of 0.617 in 2022, ranking second among all cities (only behind Shenyang), and is one of the few cities, apart from Shenyang, to exceed 0.6. The resilience level has remained relatively stable at an upper-middle level. The prominent growth in the resilience index is mainly associated with the construction of the “Liao River Basin Ecological Corridor [36]” under the integrated planning of the Shenyang Economic Zone.
Tieling’s flood resilience index increased from 0.184 in 2001 to 0.471 in 2023, with a relatively slow overall growth rate, remaining at a lower level among the seven cities for an extended period. There was a significant decline in 2018 compared to 2017, followed by slow growth. The improvement in its resilience index is predominantly due to the flood prevention and disaster mitigation plan for northwest Liaoning, indicating considerable potential for further enhancement.
As a regional composite indicator, the flood resilience index of the Shenyang Metropolitan Area increased from 0.255 in 2001 to 0.574 in 2023, with an overall trend consistent with those of the individual cities. Due to regional synergy, the fluctuation amplitude of the metropolitan area was smaller than that of individual cities such as Fuxin and Fushun. The index reached 0.551 in 2021, and after a slight decline, resumed growth in 2023, reflecting a continuous strengthening of overall resilience to flood impacts.
In summary, from 2001 to 2023, the flood resilience of each city and the Shenyang Metropolitan Area as a whole exhibited an upward trend. Cities such as Shenyang, Liaoyang, and Benxi demonstrated higher resilience, while Tieling remained weaker and Fuxin experienced significant fluctuations. Overall, the improvement in flood resilience across the metropolitan area has become increasingly evident as cities have advanced collectively.
To quantify the statistical robustness of the temporal evolution of flood resilience from 2001 to 2023, the Mann–Kendall nonparametric trend test was applied to the resilience indices of each city and of the metropolitan area as a whole; the results are shown in Table 5.
Table 5.
Results of the Mann–Kendall nonparametric trend test.
According to the Mann–Kendall nonparametric trend test, the flood-resilience index for the Shenyang metropolitan area and all seven constituent cities exhibited highly significant increasing trends (p < 0.01), with Z-values ranging from 5.705 to 6.603. No area showed a non-significant or decreasing trend, indicating that the observed improvement in regional flood resilience over the 23-year period is not a random fluctuation but a statistically significant and sustained upward development.
4.2.2. Temporal Evolution Across Four Resilience Dimensions
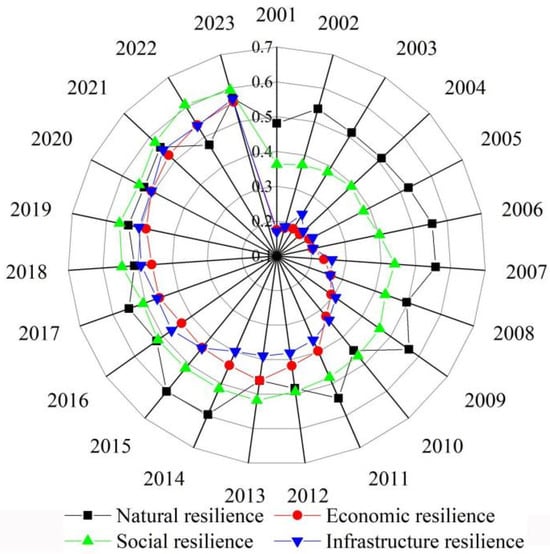
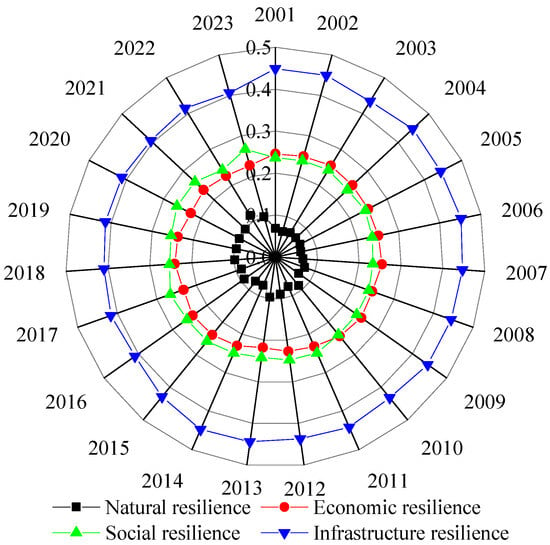
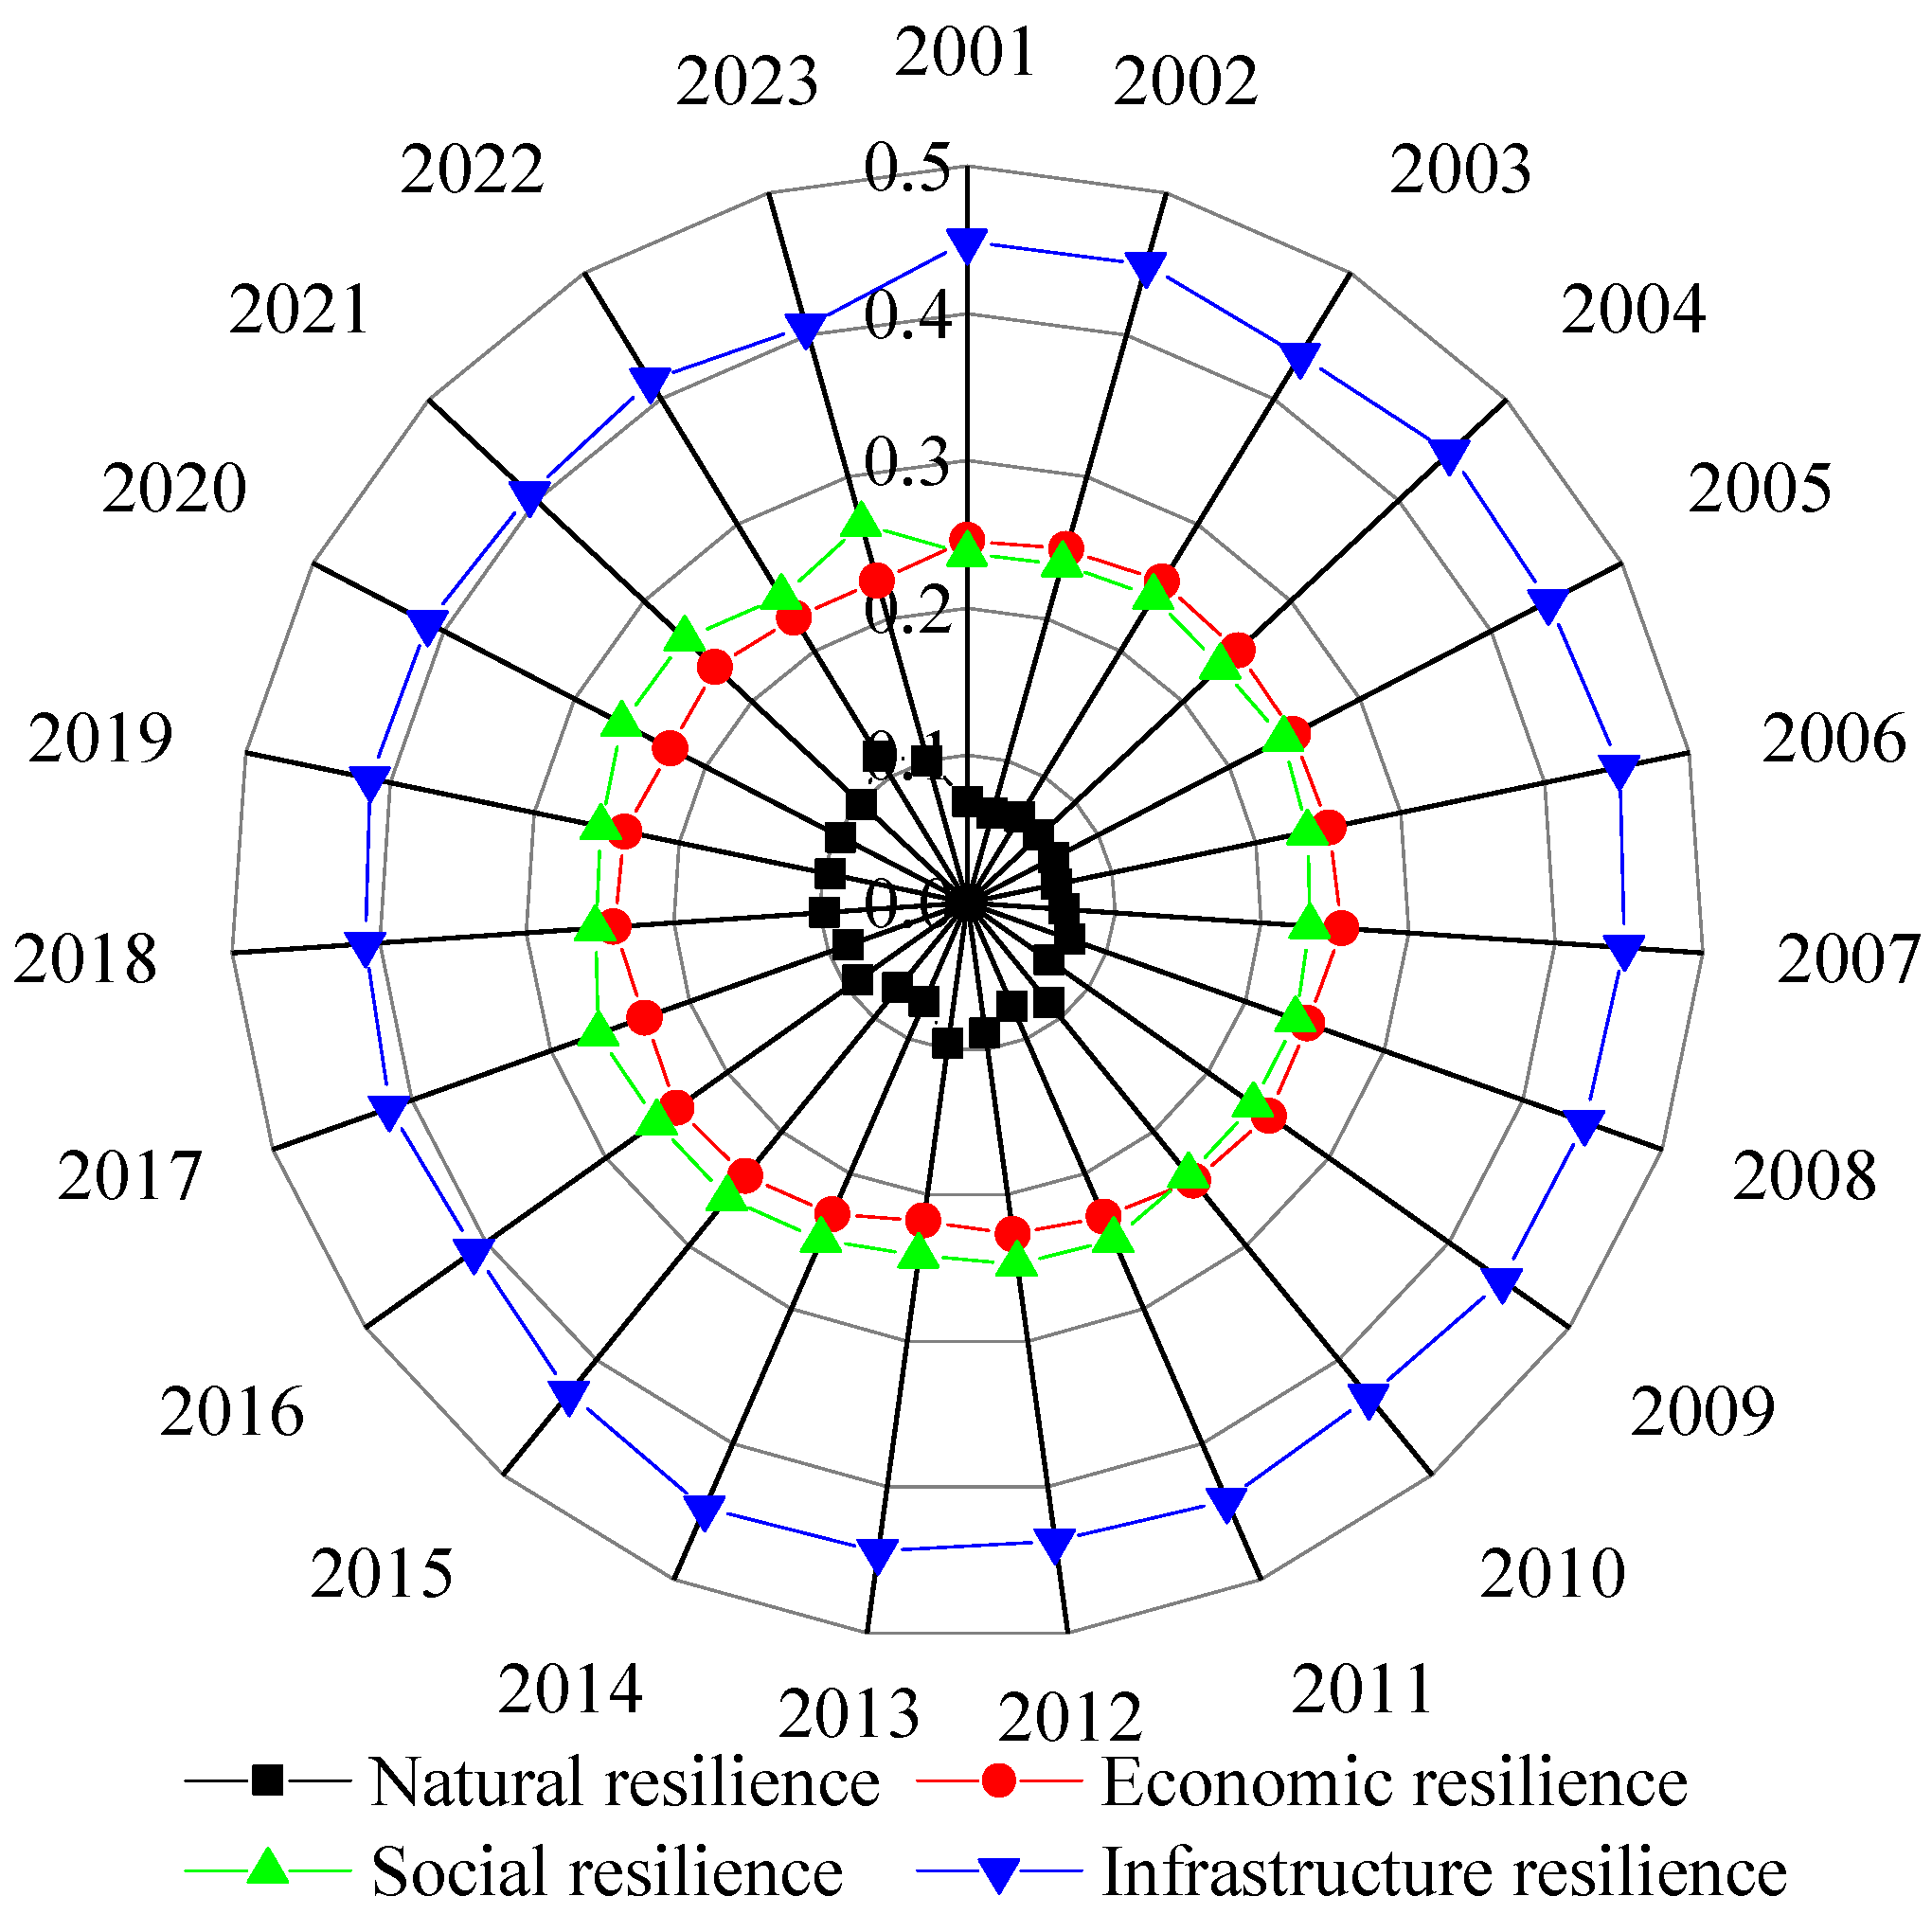
The natural, economic, social, and infrastructure dimensions of urban flood resilience in the Shenyang Metropolitan Area were independently analyzed over time using a weighted summation model. Combined with the dynamic evolution characteristics of indicators from 2001 to 2023, a four-dimensional resilience evolution map was generated (see Figure 4).
Figure 4.
Composite temporal trends of four urban flood resilience dimensions from 2001 to 2023.
As illustrated in Figure 4, all types of resilience values exhibited an overall upward trend. Infrastructure resilience increased most rapidly, followed by economic resilience, while social and natural resilience improved steadily on an annual basis. The years 2013 and 2018 represented key turning points. Following the heavy rainfall event in Qingyuan, Fushun in 2013, natural resilience in the region increased by 12.3% and infrastructure resilience by 18.7%. With the advancement of systematic management in the Liao River Basin in 2018, the annual growth rates of economic and social resilience reached 7.5% and 6.8%, respectively.
4.3. Spatial Pattern Evolution of Urban Flood Resilience in the Shenyang Metropolitan Area
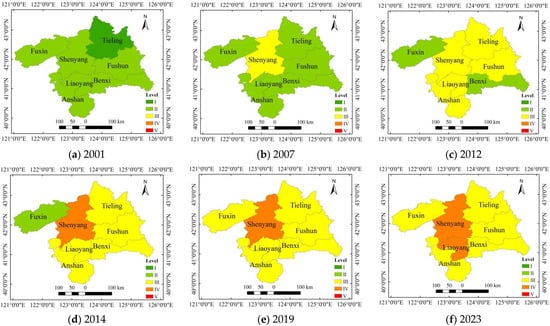
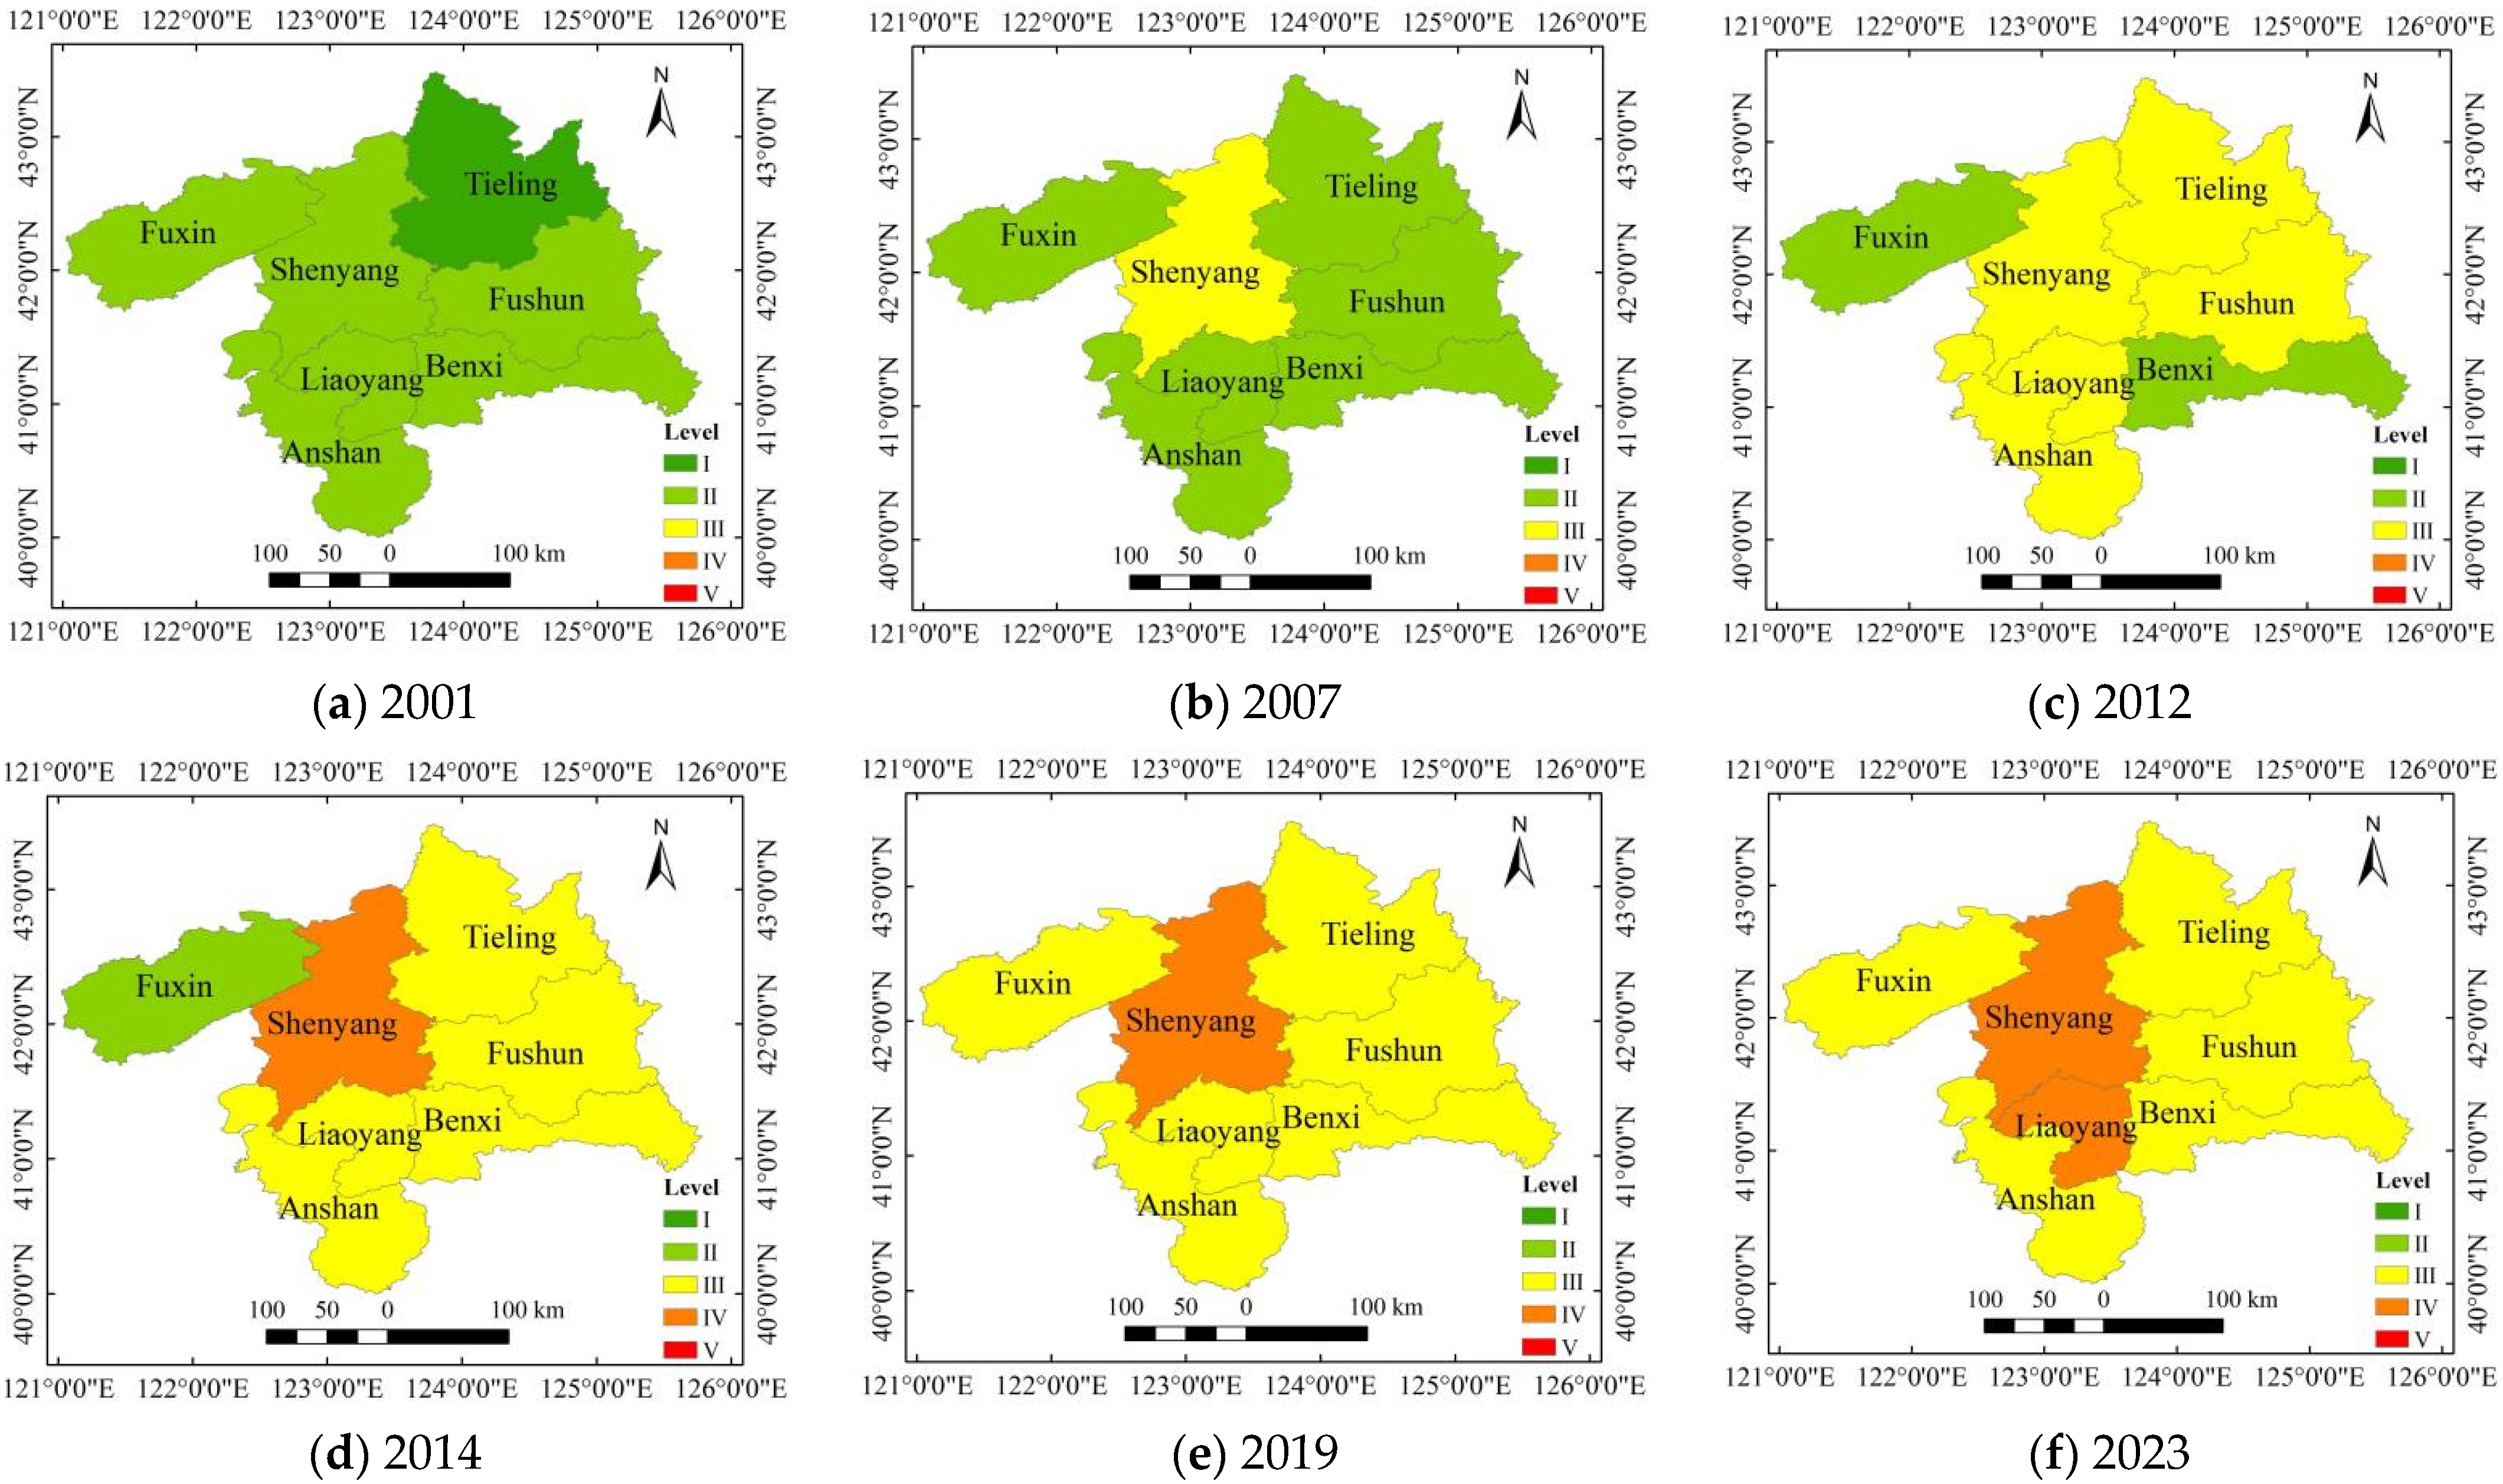
Spatial analysis techniques based on the Geographic Information System (GIS) platform were employed to visualize the spatiotemporal evolution of urban flood resilience indices in the Shenyang Metropolitan Area from 2001 to 2023. The spatial evolution processes of flood resilience in the seven cities were compared by selecting representative years—2001, 2007, 2012, 2014, 2019, and 2023—for analysis. The results are presented in Figure 5.
Figure 5.
Spatiotemporal distribution of urban flood resilience levels in selected years.
The spatial pattern of urban flood resilience in the Shenyang Metropolitan Area exhibited significant spatiotemporal differentiation. In 2001, all cities except Tieling, which was at a low resilience level, were also at relatively low resilience levels. By 2007, the core city of Shenyang was the first to achieve improvement in flood resilience. Influenced by the central city, Tieling shifted from low to relatively low resilience, with resilience extending in a gradient from the center to the periphery, forming a “monocentric core diffusion” pattern. By 2012, except for Benxi and Fuxin, which remained at relatively low resilience, the other cities had reached a moderate resilience level. From 2012 to 2019, the resilience levels of all cities steadily improved. By 2023, Shenyang and Liaoyang had attained relatively high resilience, while the other five cities were in the moderate resilience range, forming a new spatial pattern characterized by “dual-core leadership and multi-city collaboration”.
Overall, from 2001 to 2023, the spatial pattern of urban flood resilience in the Shenyang Metropolitan Area evolved from monocentric core diffusion to multi-city collaboration. This evolution was characterized by basin-wide management driving contiguous improvements, differentiated development between mountainous and plain areas, and a continuous narrowing of resilience level disparities across the region.
Based on the evolutionary patterns of flood resilience development across the Shenyang Metropolitan Area, future resilience governance could establish a coordinated dual-core mechanism centered on Shenyang and Liaoyang to facilitate interconnectivity of flood-control infrastructure. Along the Liao River Basin, segmented management should be implemented, drawing on the watershed restoration experiences of Anshan and Fushun. In the eastern mountainous region, emphasis should be placed on ecological regulation and storage, while in the western plains, engineering drainage capacity ought to be strengthened. Through a “strong to weak” support strategy, regional disparities can be narrowed, enabling coordinated enhancement across the entire area.
To quantify the spatial evolutionary pattern of the “narrowing gap in resilience levels across the entire region,” the coefficient of variation (CV) was employed to measure inter-city differences in resilience for each year. The results are shown in Table 6.
Table 6.
Changes in the coefficient of variation (CV) of flood resilience in key years in the Shenyang Metropolitan Area, 2001–2023.
As shown in Table 6, the CV of flood resilience in the Shenyang Metropolitan Area decreased steadily from 22.35% in 2001 to 14.98% in 2023, representing a cumulative decline of 33.0%, thereby confirming the conclusion that the “regional gap in resilience levels has continually narrowed.” From 2001 to 2007, the CV decreased by 8.6%, corresponding to the early-stage diffusion effect of the “single-core expansion” pattern centered on Shenyang. From 2012 to 2018, the CV declined by an additional 6.1%, directly associated with the basin-wide integrated management initiatives in the Liao River Basin, which promoted a “contiguous enhancement of resilience.” Between 2018 and 2023, the CV further dropped by 8.5%, reflecting the strengthened role of the “dual-core leadership with multi-city collaboration” framework in reducing regional disparities. These findings indicate that the downward trajectory of the CV is highly consistent with the region’s development policies.
4.4. Diagnosis of Obstacle Factors Affecting Urban Flood Resilience in the Shenyang Metropolitan Area
4.4.1. Obstacle Degree Analysis at the Criterion Level
To systematically identify the main constraints and their evolution affecting urban flood resilience in the Shenyang Metropolitan Area, the obstacle degrees of the four primary criterion layers—natural resilience (N), economic resilience (E), social resilience (S), and infrastructure resilience (I)—were quantitatively analyzed using the obstacle degree model and long-term data from 2001 to 2023. Trends in obstacle degree changes are shown in Figure 6.
Figure 6.
Trend of obstacle degree at the criterion level.
From 2001 to 2023, the four criterion layers exhibited distinct evolutionary phases. The obstacle degree of natural resilience remained consistently low. Economic resilience showed a fluctuating downward trend, decreasing from a peak of 0.255 in 2003 to 0.227 in 2023, reflecting the positive impact of industrial transformation, a higher proportion of the tertiary sector, and increased fiscal investment in flood control. A brief rebound in 2008 indicates that economic fluctuations can still temporarily weaken resilience. The obstacle degree of social resilience increased from 0.237 in 2001 to 0.267 in 2023, an approximate 12.7% rise, peaking in 2017. This increase is mainly attributed to accelerated population aging, uneven emergency medical resource distribution, and insufficient investment in scientific research and education. Infrastructure resilience exhibited a high obstacle degree in the early years, peaking in 2006. After 2010, the implementation of projects such as the Hunhe River flood control project, river dredging in Anshan, and construction of rainwater pumping stations in Fuxin significantly reduced the obstacle degree, reaching its lowest point in 2021 and reflecting the gradual alleviation of infrastructure deficiencies.
4.4.2. Obstacle Degree Analysis at the Indicator Level
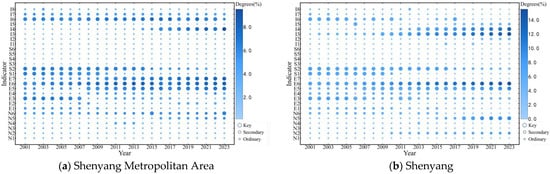
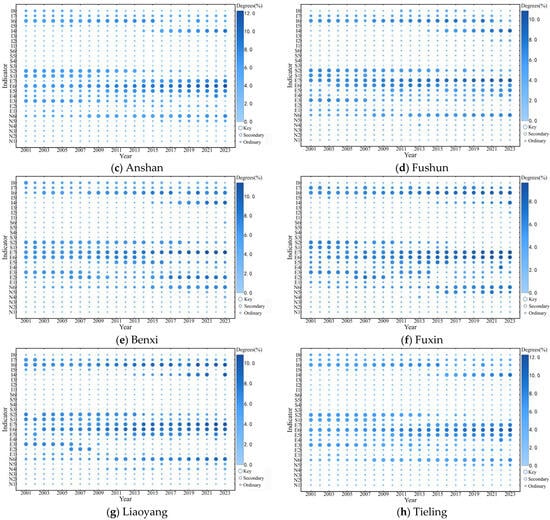
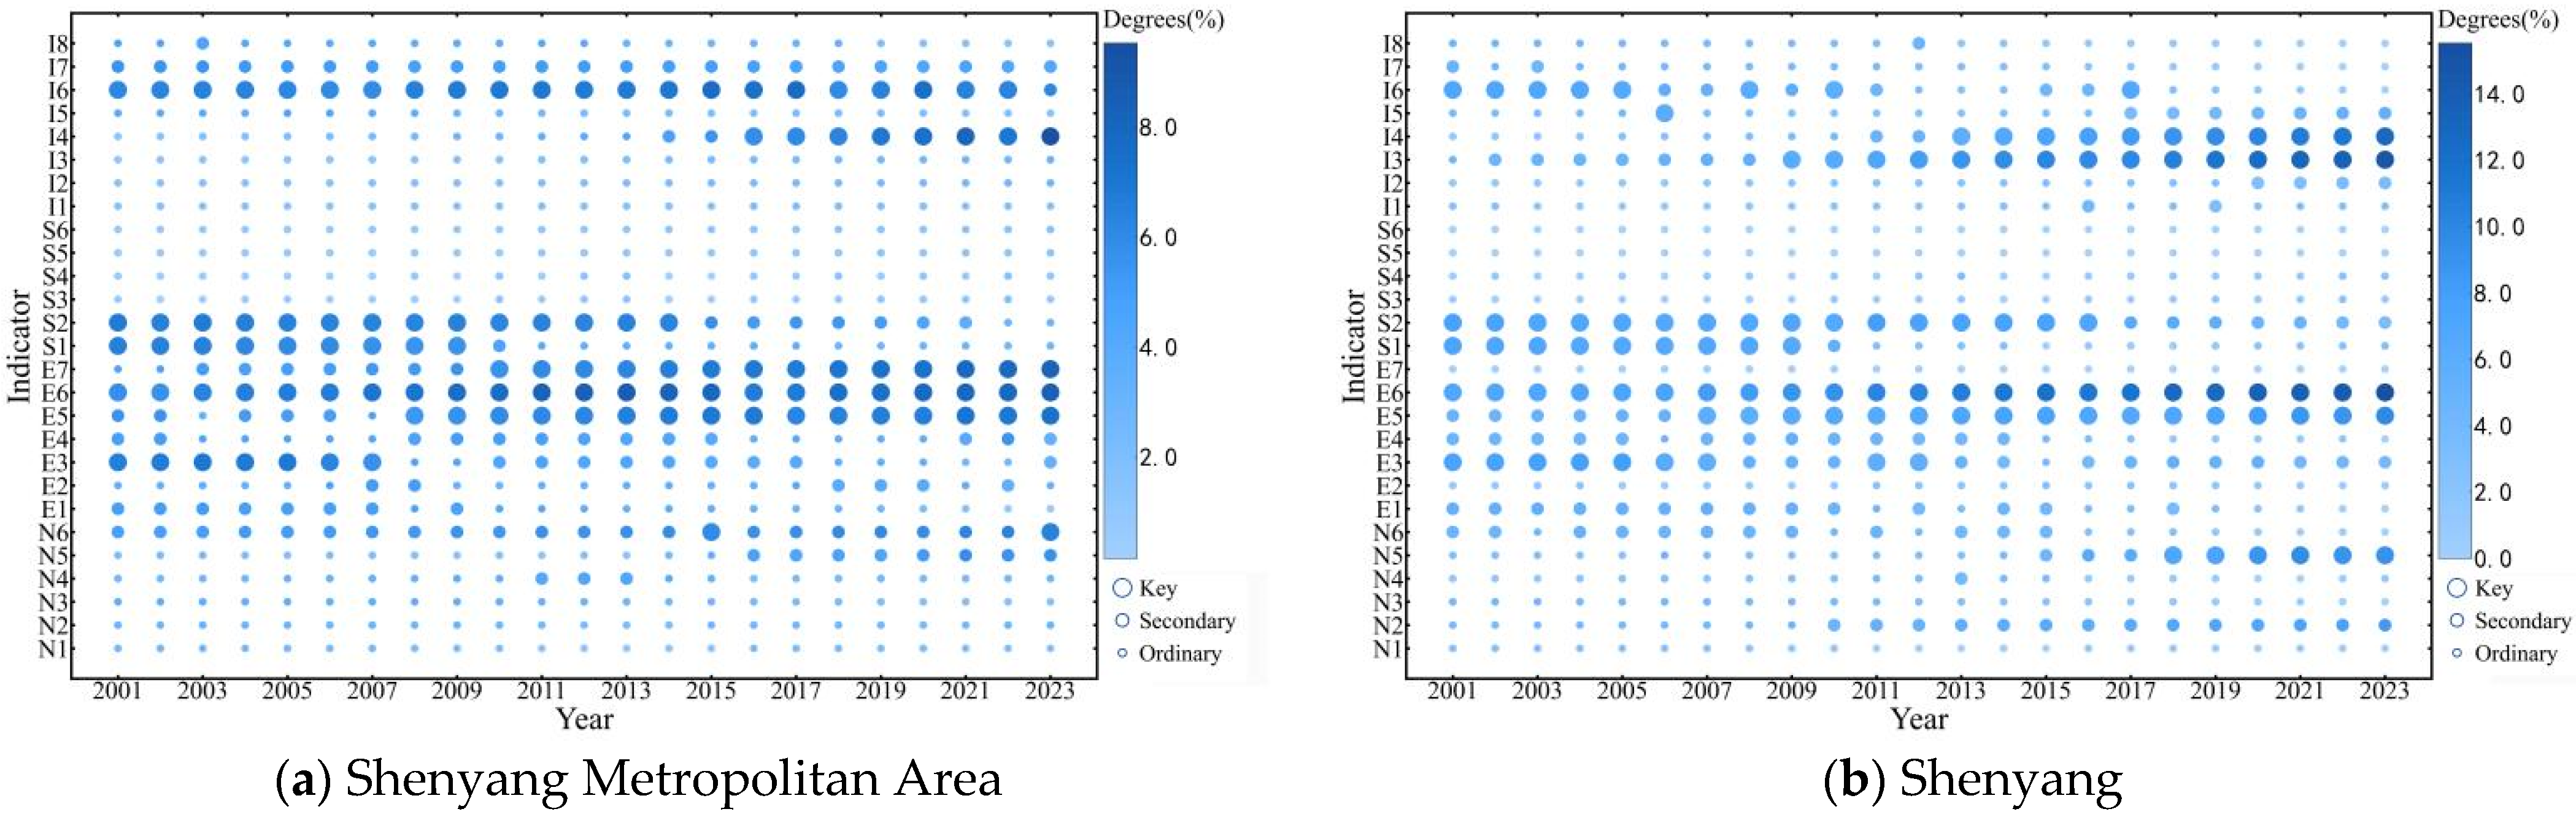
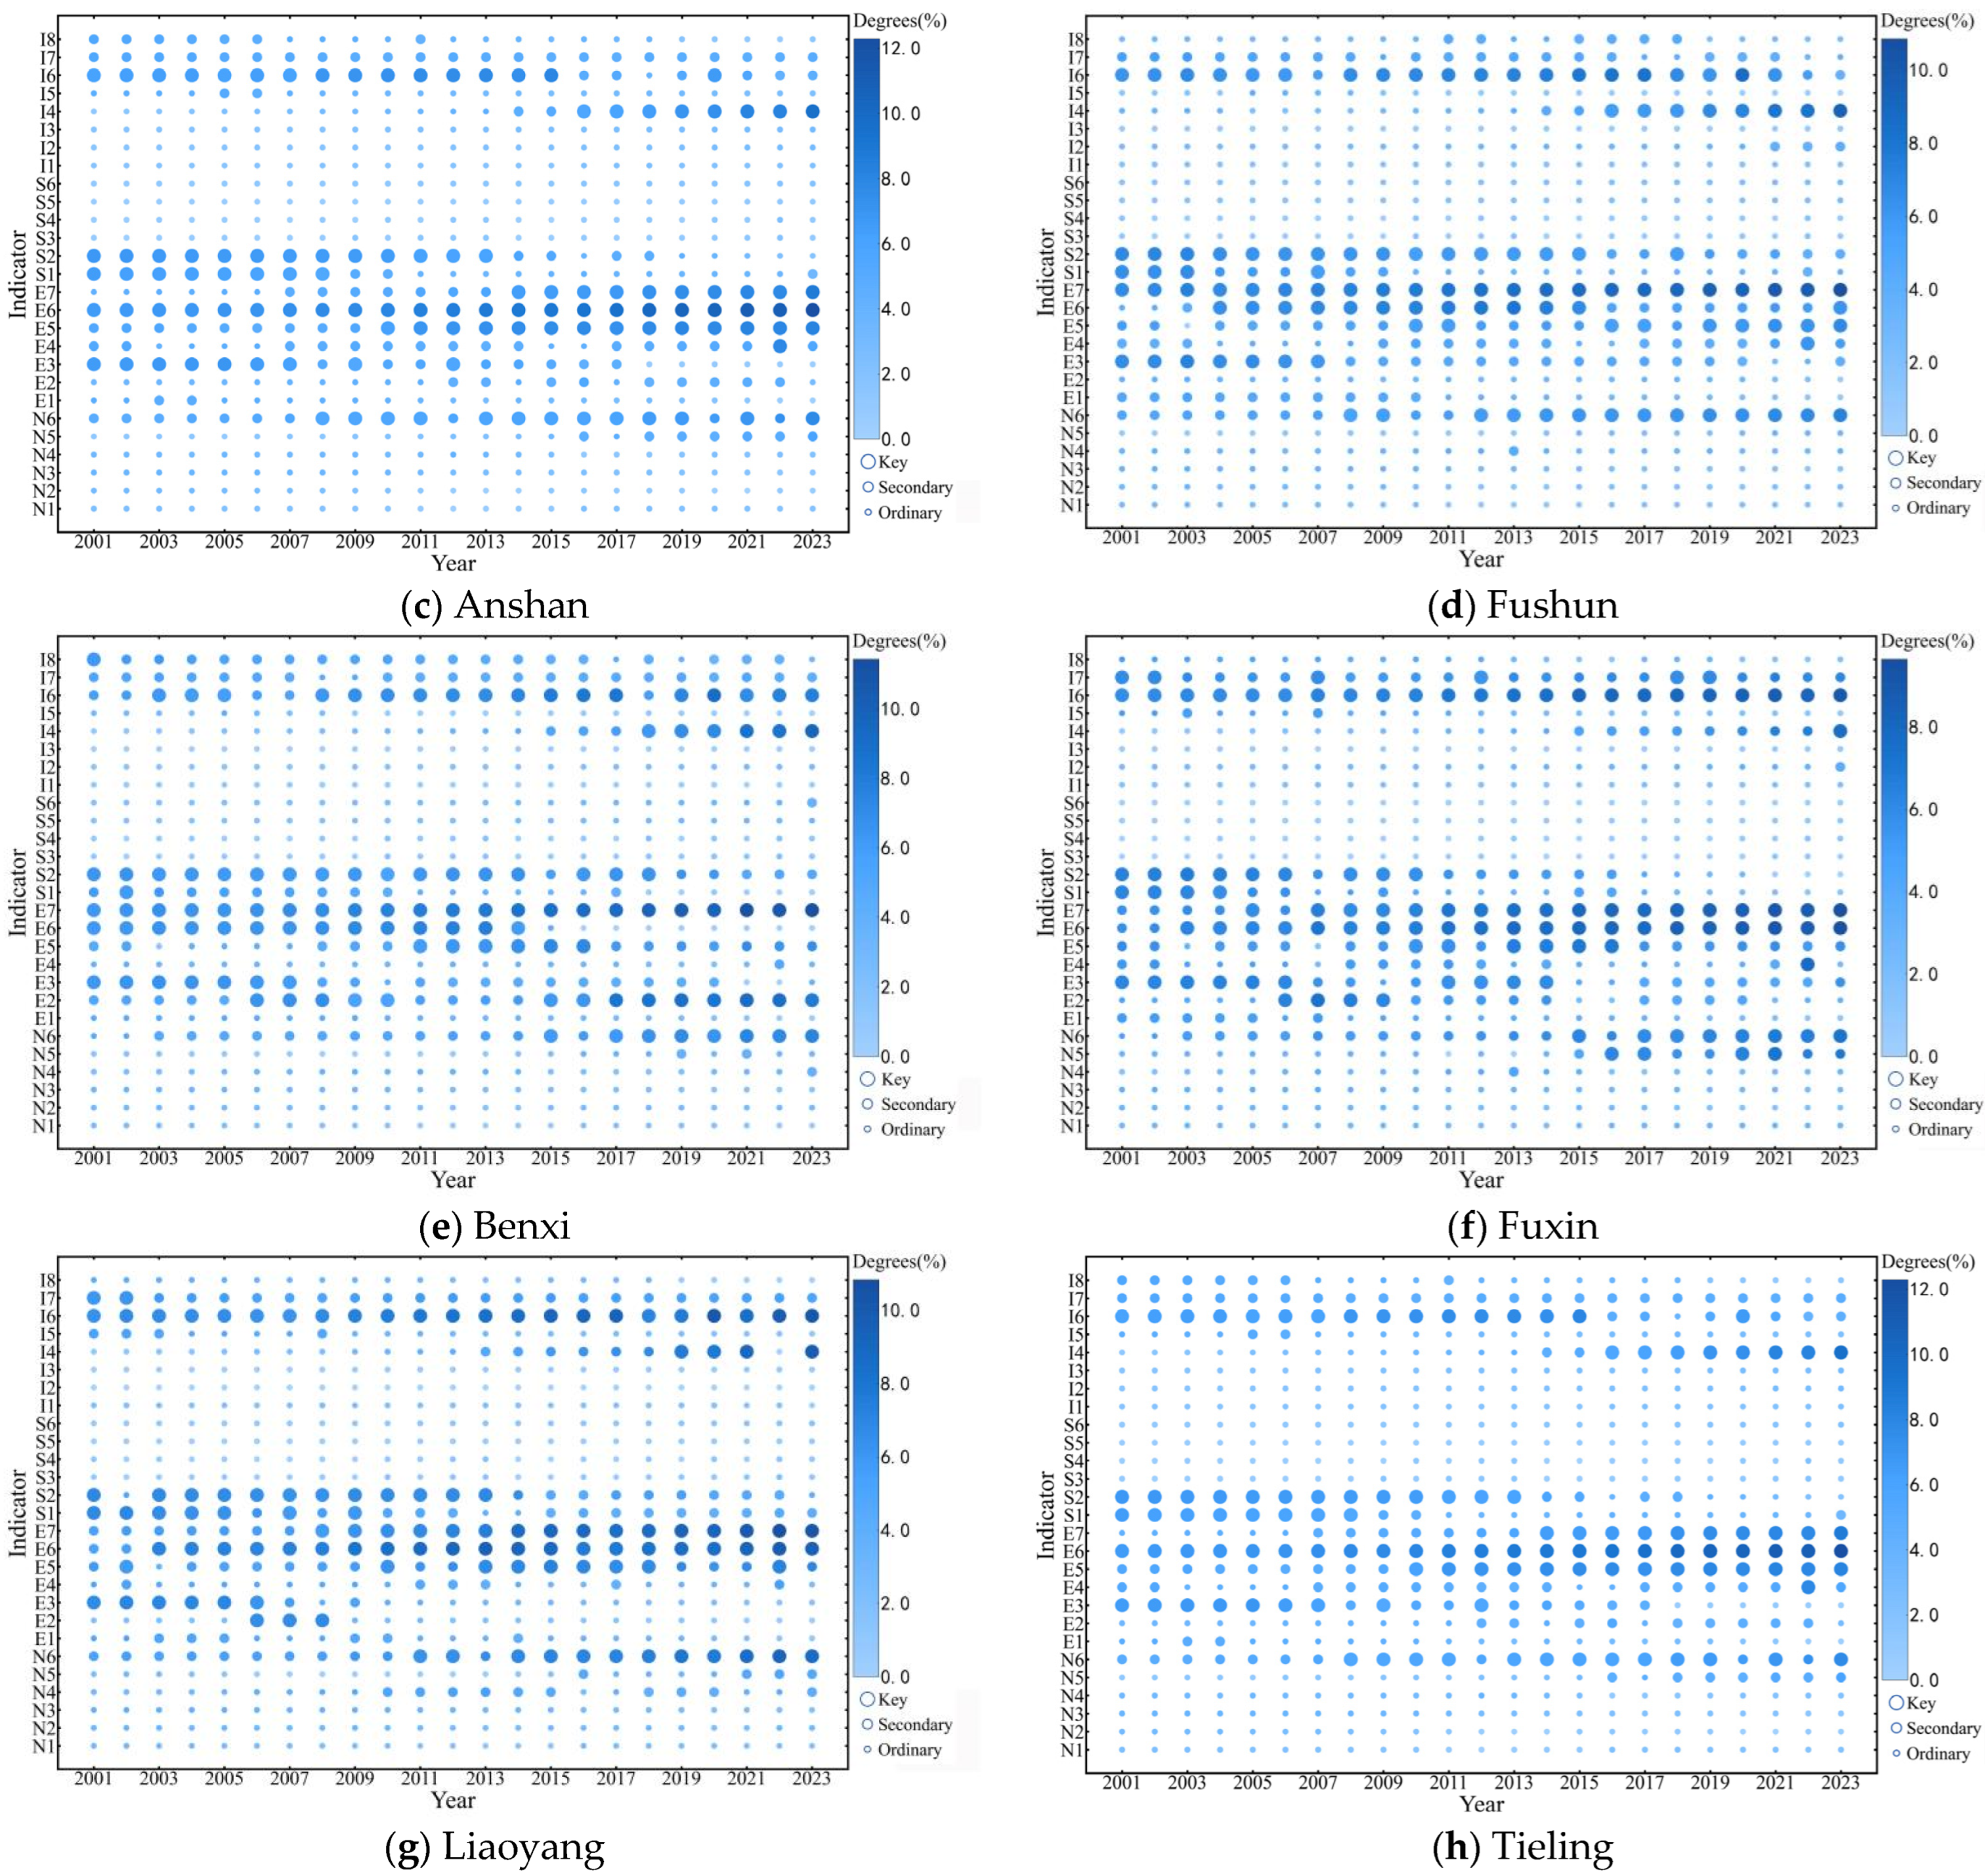
To further diagnose structural shortcomings and precisely identify key obstacle factors, the analysis was extended to 27 specific indicators across the four dimensions. Using the factor obstacle degree model, annual obstacle degrees for each indicator in each city were calculated and classified as ordinary, secondary, or key factors using the natural breaks method. The evolution of obstacle degrees for each indicator in the Shenyang Metropolitan Area and its constituent cities from 2001 to 2023 is illustrated in Figure 7.
Figure 7.
Temporal variation in indicator-level obstacle degrees for the Shenyang Metropolitan Area and its cities (2001–2023).
Figure 7 illustrates that from 2001 to 2005, the primary constraints on urban flood resilience in the Shenyang Metropolitan Area were per capita disposable income of urban residents, government public safety expenditure, population density, proportion of residents aged 60 and above, and reservoir drainage area; this initial stage of urbanization was characterized by a weak economic foundation—resulting in low resident risk-resilience—rapid population agglomeration driving up density, and insufficient flood-control infrastructure, which together imposed early constraints. Between 2006 and 2010, per capita disposable income and population density gradually shifted from primary to secondary factors, while the share of secondary industry value added emerged as a key constraint. From 2011 to 2015, in addition to the share of secondary industry value added, government public safety expenditure, proportion of residents aged 60 and above, and reservoir drainage area, per capita net income of rural households became a new key factor, reflecting the weakness of rural flood-control facilities and the widening urban–rural income gap. After 2016, the dominant constraints comprised the share of secondary industry value added, government public safety expenditure, per capita net income of rural households, number of doctors per 10,000 people, and reservoir drainage area. Thus, over the period 2001–2023, the critical obstacle factors shaping urban flood resilience in the Shenyang Metropolitan Area exhibited a clear, phased pattern of replacement.
Across the cities, key obstacle factors can be grouped into six categories: economic level, industrial structure, public investment, population characteristics, natural and infrastructure factors, and medical resources. Over time, the obstacle degrees of per capita disposable income, population density, and the proportion of the population aged 60 and above generally declined, shifting from key to secondary factors. In contrast, the obstacle degrees of river network density, proportion of value added by the secondary industry, per capita net income of rural households, and number of doctors per 10,000 people generally increased, becoming key factors.
Moreover, intercity variations arise from each locality’s distinctive conditions. In Shenyang, where ratio of green space in built-up areas and the number of hospital beds per 10,000 people are prominent obstacle factors, resilience can be enhanced by creating pocket parks, implementing rooftop greening to raise the built-up green space ratio, and expanding community hospitals to boost bed capacity. In Fuxin, where ratio of green space in built-up areas is a primary constraint, mine-site rehabilitation should be coupled with new park construction and the installation of stormwater retention systems. Tieling’s key limiting factor—local government general public budget expenditure—necessitates securing provincial special transfer payments with a priority focus on flood-control infrastructure. The remaining cities share largely overlapping critical factors; they would benefit from jointly established basin-wide flood standards and coordinated upgrades of drainage networks alongside the augmentation of medical resources. Overall, the evolution of each city’s key factors reflects both regional commonalities and the differentiated impacts of local development characteristics on flood resilience.
4.5. Discussion
4.5.1. Comparison with Similar Studies
The Shenyang Metropolitan Area was compared with analogous studies conducted for the Yangtze River Delta urban agglomeration, Guangdong Province, the Nanjing Metropolitan Area, and the Beijing–Tianjin–Hebei urban agglomeration; the comparison results are summarized in Table 7.
Table 7.
Comparison with Similar Studies.
With respect to assessment frameworks, two principal paradigms emerge in the literature. One is the four-dimensional “Natural–Economic–Social–Infrastructure” framework (adopted in this study and in the Nanjing Metropolitan Area), which emphasizes the completeness of system constituent elements and accords well with the multi-dimensional development characteristics of metropolitan regions. The other is the “Pressure–State–Response” (PSR) framework (used in the Yangtze River Delta, Guangdong Province and the Beijing–Tianjin–Hebei region), which focuses on the logical chain of “hazard pressure → system state → response” during disaster processes and is better suited for analyses of interactions between human activities and the natural environment.
Regarding methodology, most prior studies employ an evaluation approach that combines traditional weighting techniques—such as entropy weighting and Analytic Hierarchy Process (AHP)—with TOPSIS, emphasizing static computation of indicator weights and horizontal ranking of resilience levels. This study is the first to apply an LSTM–Attention deep-learning model to metropolitan-scale flood-resilience assessment, using the attention mechanism to allocate indicator weights dynamically and thereby addressing the inability of traditional methods to reflect temporally evolving inter-indicator relationships over long time series. Although the Nanjing study achieved a fusion of objective and subjective weights via a combined-weighting–TOPSIS approach, it remained constrained by static weighting; by contrast, the dynamic weighting scheme developed here is more appropriate for long time series (2001–2023) and multi-node analyses of resilience evolution.
In terms of temporal evolution, all regions exhibit an overall upward trend in flood resilience, but growth rates and stage characteristics differ. The Shenyang Metropolitan Area rose from relatively low to medium resilience with steady growth and strong regional coordination; the Yangtze River Delta shows a fluctuating upward trajectory; and the Beijing–Tianjin–Hebei region displays a steady incremental increase. Common driving factors include improved infrastructure and increased economic investment. However, owing to a “heavy-industry-first” development model, the Shenyang Metropolitan Area shows a more pronounced contribution from secondary-industry transformation to resilience gains, whereas the Yangtze River Delta and Guangdong rely more on an increased share of tertiary industry and investment in technological innovation—illustrating how industrial structure differences shape resilience trajectories.
Spatially, the Shenyang Metropolitan Area has evolved from a “single-core diffusion” pattern to a “dual-core-led, multi-city coordination” pattern, with pronounced radiative effects from the core cities of Shenyang and Liaoyang. The Yangtze River Delta has formed a multi-centered topology centered on provincial capitals, and resilience disparities among Jiangsu, Zhejiang and Anhui exhibit signs of polarization. Guangdong Province displays a “higher in the south, lower in the east/central/west” spatial pattern, with the Pearl River Delta cities forming a high-value cluster owing to economic and infrastructure advantages. The Beijing–Tianjin–Hebei agglomeration shows a concentric structure of high-value clustering around Beijing and low-value clustering around Shijiazhuang. These differences stem from distinct mechanisms: the Shenyang area’s contiguous improvements are closely tied to integrated management of the Liao River Basin, the Yangtze and Pearl River deltas have benefited from urban-agglomeration integration policies that coordinate resources, and the Beijing–Tianjin–Hebei region is more strongly affected by topographic variation and uneven development.
4.5.2. Study Limitations
Although this study advances long-term evaluation and dynamic diagnostic analysis of flood resilience in the Shenyang Metropolitan Area, several limitations remain. First, while the LSTM–Attention model effectively captures temporal dependencies among indicators, it lacks forward-looking scenario analysis and does not incorporate future climate or policy scenarios for resilience projection. Second, the model validation framework is not fully comprehensive: although the indicator system was constructed with regional characteristics in mind, it remains based on a predefined framework and indicator selection relies on expert judgment. Finally, because the Shenfu New Area was not established until 2016 and lacked independent statistical data for 2001–2015, it was not treated as a separate analysis unit; this omission may affect the generalizability of the findings.
5. Conclusions
This study developed an urban flood resilience assessment system for the Shenyang Metropolitan Area based on a four-dimensional framework encompassing natural, economic, social, and infrastructure resilience. Using the LSTM-Attention model and obstacle degree model, the spatiotemporal evolution and key obstacle factors influencing flood resilience from 2001 to 2023 were comprehensively analyzed. The main conclusions are as follows:
- (1)
- Temporal evolution: Urban flood resilience in the Shenyang Metropolitan Area exhibited a consistent upward trend, with the average resilience index rising from 0.255 in 2001 to 0.574 in 2023. Shenyang maintained the highest resilience, reaching 0.716 in 2023 and becoming the first city in the region to exceed 0.7. Liaoyang and Benxi experienced substantial improvements, while Tieling remained at a relatively low level with slow growth. Fuxin showed significant fluctuations, primarily due to its transition as a resource-based city.
- (2)
- Spatial distribution patterns: The spatial pattern of flood resilience shifted markedly during the study period. In 2001, a “monocentric core diffusion” pattern was observed, with Shenyang as the core and resilience radiating outward. By 2023, the pattern evolved to one of “dual-core leadership and multi-city collaboration,” with Shenyang and Liaoyang acting as dual cores and other cities achieving moderate resilience. Basin management promoted regional improvements, and although differences between mountainous and plain areas persisted, the overall resilience gap across the region narrowed.
- (3)
- Multidimensional obstacle factors: At the criterion level, obstacle degrees exhibited distinct phases. From 2001 to 2010, infrastructure resilience was the primary obstacle, with peak values exceeding 0.4. Following the implementation of flood control and drainage projects, the obstacle degree of infrastructure resilience declined significantly. After 2010, the obstacle degree of social resilience increased from 0.237 in 2001 to 0.267 in 2023. The obstacle degree of natural resilience remained low with minor fluctuations, while economic resilience showed a fluctuating downward trend. These patterns reflect the differentiated impacts of regional development stages on resilience enhancement.
- (4)
- Indicator-level obstacle factors: Key limiting factors at the indicator level underwent phased replacement throughout the study period. From 2001 to 2005, basic conditions such as per capita disposable income of urban residents and population density were the main obstacles. After 2016, the key factors shifted to a more diverse set of indicators, including the proportion of value added by the secondary industry, per capita net income of rural households, the number of doctors per 10,000 people, and reservoir drainage area. City-level differences were also evident: in Shenyang and Fuxin, the ratio of green space in built-up areas was a significant factor, while in Tieling, local government general public budget expenditure was most influential. In other cities, the main influencing factors were largely consistent, reflecting both regional commonalities and city-specific characteristics.
This study provides a scientific basis for optimizing flood prevention and control systems and for formulating targeted resilience enhancement strategies in the Shenyang Metropolitan Area. Future work could further integrate climate-scenario simulations and real-time monitoring data to strengthen planning foresight, employ data-driven optimization for indicator selection to better accommodate dynamic urban systems, and explore models such as ASTGCN to enhance the representation of spatial dependencies, thereby continuously improving the practical relevance and generalizability of the research.
Author Contributions
Conceptualization, Q.Y. and J.Y.; methodology, Q.Y. and D.W.; software, Q.Y., Y.L. and Z.L.; validation, Q.Y., Y.L. and Z.L.; formal analysis, Q.Y. and D.W.; investigation, Q.Y. and J.Y.; resources, J.Y.; data curation, Q.Y. and D.W.; writing—original draft preparation, Q.Y.; writing—review and editing, Q.Y. and J.Y.; visualization, Q.Y.; supervision, Y.L. and Z.L.; project administration, J.Y.; funding acquisition, J.Y. All authors have read and agreed to the published version of the manuscript.
Funding
This research was funded by the National Natural Science Foundation of China (52478064) and in part by the National Key R&D Program of China during the 14th Five-Year Plan period (2022YFE0208700-03).
Institutional Review Board Statement
Not applicable.
Informed Consent Statement
Not applicable.
Data Availability Statement
The original contributions presented in this study are included in the article.
Conflicts of Interest
The authors declare no conflicts of interest.
References
- Baig, A.; Atif, S.; Tahir, A. Urban development and the loss of natural streams leads to increased flooding. Discov. Cities 2024, 1, 9. [Google Scholar] [CrossRef] [Scilit]
- Wu, S.; Zhou, X.; Reyns, J.; Yamazaki, D.; Yin, J.; Li, X. Climate change and urban sprawl: Unveiling the escalating flood risks in river deltas with a deep dive into the GBM river delta. Sci. Total Environ. 2024, 947, 174703. [Google Scholar] [CrossRef] [Scilit]
- Ji, J.; Fang, L.; Chen, J.; Ding, T. A novel framework for urban flood resilience assessment at the urban agglomeration scale. Int. J. Disaster Risk Reduct. 2024, 108, 104519. [Google Scholar] [CrossRef] [Scilit]
- Jamshed, A.; Patel, C.; Puriya, A.; Iqbal, N.; Rana, I.; McMillan, J.; Pandey, R.; Altaf, S.; Mehmood, R.; Saad, U. Flood resilience assessment from the perspective of urban (in)formality in Surat, India: Implications for sustainable development. Nat. Hazards 2024, 120, 9297–9326. [Google Scholar] [CrossRef] [Scilit]
- Yailymov, B.; Yailymova, H.; Kolotii, A.; Shelestov, A.; Skakun, S.; Baber, S. Flooded and Irrigation Area Monitoring After the Kakhovka Dam Disaster Based on Machine Learning and Satellite Data. IEEE J. Sel. Top. Appl. Earth Obs. Remote Sens. 2025, 18, 19129–19144. [Google Scholar] [CrossRef] [Scilit]
- Chen, W.; Lei, Y.; Qi, L.; Zheng, J.; Huang, G.; Wang, H. Understanding the evolution trend of urban flood risk and resilience for better flood management. Ecol. Indic. 2024, 169, 112829. [Google Scholar] [CrossRef] [Scilit]
- Wang, W.; Kim, D.; Han, H.; Kim, K.; Kim, S.; Kim, H. Flood risk assessment using an indicator based approach combined with flood risk maps and grid data. J. Hydrol. 2023, 627, 130396. [Google Scholar] [CrossRef] [Scilit]
- Huang, X.; Wang, D. Urban Flood Resilience in a Megacity Context: Multidimensional Assessment and Spatial Differentiation in Shenzhen. Sustainability 2025, 17, 7852. [Google Scholar] [CrossRef] [Scilit]
- Wang, Y.; Zhang, Q.; Lin, K.; Liu, Z.; Liang, Y.; Liu, Y.; Li, C. A novel framework for urban flood risk assessment: Multiple perspectives and causal analysis. Water Res. 2024, 256, 121591. [Google Scholar] [CrossRef] [Scilit]
- Guan, X.; Yu, F.; Xu, H.; Li, C.; Guan, Y. Flood risk assessment of urban metro system using random forest algorithm and triangular fuzzy number based analytical hierarchy process approach. Sustain. Cities Soc. 2024, 109, 105546. [Google Scholar] [CrossRef] [Scilit]
- Zhran, M.; Ghanem, K.; Tariq, A.; Alshehri, F.; Jin, S.; Das, J.; Pande, C.; Pramanik, M.; Hasher, F.G.; Mousa, A. Exploring a GIS-based analytic hierarchy process for spatial flood risk assessment in Egypt: A case study of the Damietta branch. Environ. Sci. Eur. 2024, 36, 184. [Google Scholar] [CrossRef] [Scilit]
- Wang, Q.; Lu, L.; Li, Q.; Mubbin, M.; Din, S.; Elmannai, H. Enhancing Flood Risk Assessment Using Multi-Sensor Remote Sensing Data and Hydraulic Modeling. IEEE J. Sel. Top. Appl. Earth Obs. Remote Sens. 2025, 18, 19393–19406. [Google Scholar] [CrossRef] [Scilit]
- Khatooni, K.; Hooshyaripor, F. A new approach for urban flood risk assessment using coupled SWMM–HEC-RAS-2D model. J. Environ. Manag. 2025, 374, 123849. [Google Scholar] [CrossRef] [Scilit]
- Wei, H.; Wu, H.; Zhang, L.; Liu, J. Urban flooding simulation and flood risk assessment based on the InfoWorks ICM model: A case study of the urban inland rivers in Zhengzhou, China. Water Sci. Technol. 2024, 90, 1338–1358. [Google Scholar] [CrossRef] [Scilit]
- Apel, H.; Benisch, J.; Helm, B.; Vorogushyn, S.; Merz, B. Fast urban inundation simulation with RIM2D for flood risk assessment and forecasting. Front. Water 2024, 6, 1310182. [Google Scholar] [CrossRef] [Scilit]
- Allegri, E.; Zanetti, M.; Torresan, S.; Critto, A. Pluvial flood risk assessment for 2021–2050 under climate change scenarios in the Metropolitan City of Venice. Sci. Total Environ. 2024, 914, 169925. [Google Scholar] [CrossRef] [Scilit]
- Zhang, R.; Li, Y.; Chen, T.; Zhou, L. Flood risk identification in high-density urban areas of Macau based on disaster scenario simulation. Int. J. Disaster Risk Reduct. 2024, 107, 104485. [Google Scholar] [CrossRef] [Scilit]
- Shen, C.; Appling, A.P.; Gentine, P.; Bandai, T.; Gupta, H.; Tartakovsky, A.; Baity-Jesi, M.; Fenicia, F.; Kifer, D.; Li, L.; et al. Differentiable modelling to unify machine learning and physical models for geosciences. Nat. Rev. Earth Environ. 2023, 4, 552–567. [Google Scholar] [CrossRef] [Scilit]
- Cheng, S.; Li, H. Resilience Assessment of Flood Disasters in Zhengzhou Metropolitan Area Based on the PSR Model. Sustainability 2024, 16, 10243. [Google Scholar] [CrossRef] [Scilit]
- Liao, R.; Xu, Z.; Huang, Y. Dynamic Response of Urban Pluvial Flood Resilience Under a Multi-Dimensional Assessment Framework. Sustainability 2025, 17, 10044. [Google Scholar] [CrossRef] [Scilit]
- Tang, D.; Li, J.; Zhao, Z.; Boamah, V.; Lansana, D. The influence of industrial structure transformation on urban resilience based on 110 prefecture-level cities in the Yangtze River. Sustain. Cities Soc. 2023, 96, 104621. [Google Scholar] [CrossRef] [Scilit]
- SAC/TC 351; Guidelines for Evaluation of Safe and Resilient Cities. China Standards Press: Beijing, China, 2021. (In Chinese)
- Xiao, Y.; Rao, X.; Chang, M.; Chen, L.; Huang, H. Assessment of urban flood resilience and obstacle factors identification: A case study of three major urban agglomerations in China. Ecol. Indic. 2025, 176, 113659. [Google Scholar] [CrossRef] [Scilit]
- Zhou, X.; Zhang, Y.; Wang, W.; Sun, Y. Spatial-temporal variation of economic resilience and its influencing factors under COVID-19: Evidence from Henan province, China. Int. J. Disaster Risk Reduct. 2024, 105, 104357. [Google Scholar] [CrossRef] [Scilit]
- Wen, Y.; Shaw, R. Social resilience to urban floods: Reflections from existing knowledge and practice. Urban Gov. 2025, 5, 303–313. [Google Scholar] [CrossRef] [Scilit]
- Liu, Y.; Zhang, X.; Liu, J.; Wang, Y.; Jia, H.; Tao, S. A flood resilience assessment method of green–grey–blue coupled urban drainage system considering backwater effects. Ecol. Indic. 2025, 170, 113032. [Google Scholar] [CrossRef] [Scilit]
- Luo, L.; Wang, Y.; Liu, Y.; Zhang, X.; Fang, X. Where is the pathway to sustainable urban development? Coupling coordination evaluation and configuration analysis between low-carbon development and eco-environment: A case study of the Yellow River Basin, China. Ecol. Indic. 2022, 144, 109473. [Google Scholar] [CrossRef] [Scilit]
- Pourghasemi, H.R.; Amiri, M.; Edalat, M.; Ahrari, A.H.; Panahi, M.; Sadhasivam, N. Assessment of Urban Infrastructures Exposed to Flood Using Susceptibility Map and Google Earth Engine. IEEE J. Sel. Top. Appl. Earth Obs. Remote Sens. 2021, 14, 1923–1937. [Google Scholar] [CrossRef] [Scilit]
- Hochreiter, S.; Schmidhuber, J. Long Short-Term Memory. Neural Comput. 1997, 9, 1735–1780. [Google Scholar] [CrossRef] [Scilit] [PubMed]
- Wang, S.; Xu, O. High Perplexity Mountain Flood Level Forecasting in Small Watersheds Based on Compound Long Short-Term Memory Model and Multimodal Short Disaster-Causing Factors. IEEE Access 2025, 13, 82783–82795. [Google Scholar] [CrossRef] [Scilit]
- Vaswani, A.; Shazeer, N.; Parmar, N.; Uszkoreit, J.; Jones, L.; Gomez, A.; Kaiser, L.; Polosukhin, I. Attention is all you need. Adv. Neural Inf. Process. Syst. 2017, 30. [Google Scholar] [CrossRef] [Scilit]
- Sherstinsky, A. Fundamentals of recurrent neural network (RNN) and long short-term memory (LSTM) network. Phys. D Nonlinear Phenom. 2020, 404, 132306. [Google Scholar] [CrossRef] [Scilit]
- Chaudhari, S.; Smithal, V.; Polatkan, G.; Ramanath, R. An attentive survey of attention models. ACM Trans. Intell. Syst. Technol. (TIST) 2021, 12, 1–32. [Google Scholar] [CrossRef] [Scilit]
- Yang, P.; Xu, X.; Shao, M.; Liu, Y. Intelligent Prediction of Flood Disaster Risk Levels Based on Knowledge Graph and Graph Neural Networks. IEEE Access 2025, 13, 8416–8424. [Google Scholar] [CrossRef] [Scilit]
- Zhao, Z.; Liu, C.; Chang, W.; Ren, Y. Comprehensive Resilience Assessment and Obstacle Analysis of Cities Based on the PSR-TOPSIS Model: A Case Study of Jiangsu Cities. Land 2025, 14, 1437. [Google Scholar] [CrossRef] [Scilit]
- Zheng, Y.; Tang, P.; Dong, L.; Yao, Z. Evaluation of ecological carrying capacity and construction of ecological security pattern in West Liaohe River Basin of China. Front. Ecol. Evol. 2024, 12, 1335671. [Google Scholar] [CrossRef] [Scilit]
- Chen, J.; Zhang, Y.; Yan, X. Spatiotemporal evolution and influencing factors of flood resilience in Yangtze River Delta urban agglomeration. Water Resour. Prot. 2024, 40, 58–68. [Google Scholar]
- Lu, Y.; Wu, C.; Wang, L.; Chen, X.; Zheng, Y.; Zhang, H. Assessment of Urban Flood Resilience and Spatial Characteristics Analysis in Guangdong Province. South China Geogr. J. 2025, 3, 110–123. [Google Scholar]
- Song, L.; Shen, Y.; Chen, X.; Zhang, Q.; Xu, Q. Analysis of the spatio-temporal evolution and obstacles to urban floodresilience in the Nanjing Metropolitan Area. J. Saf. Environ. 2025, 25, 646–655. [Google Scholar]
- Yang, Y.; Zou, J.; Wang, P.; Zheng, K. The Research on Dynamic Evolution and Spatial Correlation Characteristics of Flood Disaster Resilience in Beijing-Tianjin-Hebei Urban Agglomeration. J. Hebei Norm. Univ. Sci. Technol. 2024, 38, 39–45. [Google Scholar]

Disclaimer/Publisher’s Note: The statements, opinions and data contained in all publications are solely those of the individual author(s) and contributor(s) and not of MDPI and/or the editor(s). MDPI and/or the editor(s) disclaim responsibility for any injury to people or property resulting from any ideas, methods, instructions or products referred to in the content. |
© 2025 by the authors. Licensee MDPI, Basel, Switzerland. This article is an open access article distributed under the terms and conditions of the Creative Commons Attribution (CC BY) license.