1. Introduction
A Project Delivery Method (PDM) is the framework that defines how a construction project is organized, designed, and executed. It outlines the contractual relationships, roles, and responsibilities among key stakeholders such as owners, designers, and contractors throughout the project lifecycle [
1]. The choice of a PDM significantly influences project performance, including cost, schedule, collaboration, risk allocation, and overall quality outcomes. Traditionally, the most widely adopted PDM is the Design–Bid–Build (DBB) method. This linear model separates the design and construction phases, where the owner first contracts a designer, and then, after the design is complete, awards a construction contract to the lowest bidder. While DBB is favored in many public sector projects due to its transparency and role clarity, it has been widely criticized for fostering fragmentation, adversarial relationships, and inefficiencies in project execution [
2].
This fragmentation, between design, construction, and operation, is one of the most persistent challenges in the architecture, engineering, and construction (AEC) industry. It often results in teams working in silos, concentrating only on their designated phase and neglecting early-stage coordination, such as design integration and lifecycle performance considerations. As a result, the owner bears significant risk, particularly when design omissions or inefficiencies surface during construction or operation [
3]. Fragmented delivery further undermines efforts to optimize sustainability and long-term project outcomes, as it inhibits holistic thinking and system-level innovation.
Recent research indicates that fragmented PDMs frequently contribute to miscommunication, delays, rework, and diminished quality, especially in large or complex urban infrastructure projects [
4]. These challenges are particularly problematic in the context of city development, where digital integration, cross-disciplinary collaboration, and sustainability performance are key success drivers. In response, collaborative delivery methods, such as Design–Build (DB), Construction Manager (CM) models, and particularly Integrated Project Delivery (IPD), have gained traction. These methods emphasize early stakeholder engagement, shared objectives, and transparent decision-making processes. Among them, IPD has emerged as a promising PDM for delivering sustainable infrastructure, as it promotes contractor involvement during the design phase, lifecycle-based evaluation, and shared accountability across the project team [
5].
However, while IPD offers significant potential to improve sustainability outcomes, the contractor selection process within IPD remains underdeveloped. Most existing selection models are rooted in traditional procurement logic, prioritizing cost or past experience over collaboration readiness, sustainability performance, or technical innovation. This misalignment presents a barrier to achieving smart city goals, especially when sustainability targets and emissions reduction strategies must be embedded from the earliest project stages. To address this gap, the present study proposes a structured Decision Support System (DSS) for contractor selection under IPD, with emphasis on decarbonization. The model integrates Multi-Criteria Decision-Making (MCDM) techniques, specifically Fuzzy AHP and Fuzzy VIKOR, to enable a structured evaluation process based on economic, environmental, social, and technical sustainability factors. By integrating expert knowledge with literature-based criteria, this approach helps overcome the limitations of fragmented procurement and supports better-informed, transparent, and sustainability-aligned decisions in contractor prequalification through Qualification-Based Selection (QBS).
2. Literature Review
2.1. Fragmentation in the Architecture, Engineering, and Construction (AEC) Industry and the Need for Digital Transformation
The rise of specialized domains within architecture, engineering, and construction (AEC) has driven the adoption of modern project delivery methods designed to manage increasingly complex planning, design, and execution demands. As specialization intensifies, so does the segmentation of roles, resulting in systemic fragmentation across the industry. This disjointed structure introduces inefficiencies, coordination failures, and interoperability gaps that diminish project performance [
3]. The compartmentalization of responsibilities among stakeholders hampers integrated delivery and stifles collaborative innovation [
6].
Fragmented models often lead contractors and subcontractors to focus narrowly on their assigned phases, disregarding early-stage integration and long-term implications. This siloed mindset elevates project risk, particularly when latent design flaws emerge during construction or operations. As noted by [
6], such fragmentation is compounded by structural barriers, misaligned incentives, unfamiliarity with risk-sharing mechanisms, and resistance to collaborative norms, despite the growing appeal of Integrated Project Delivery (IPD) in North America.
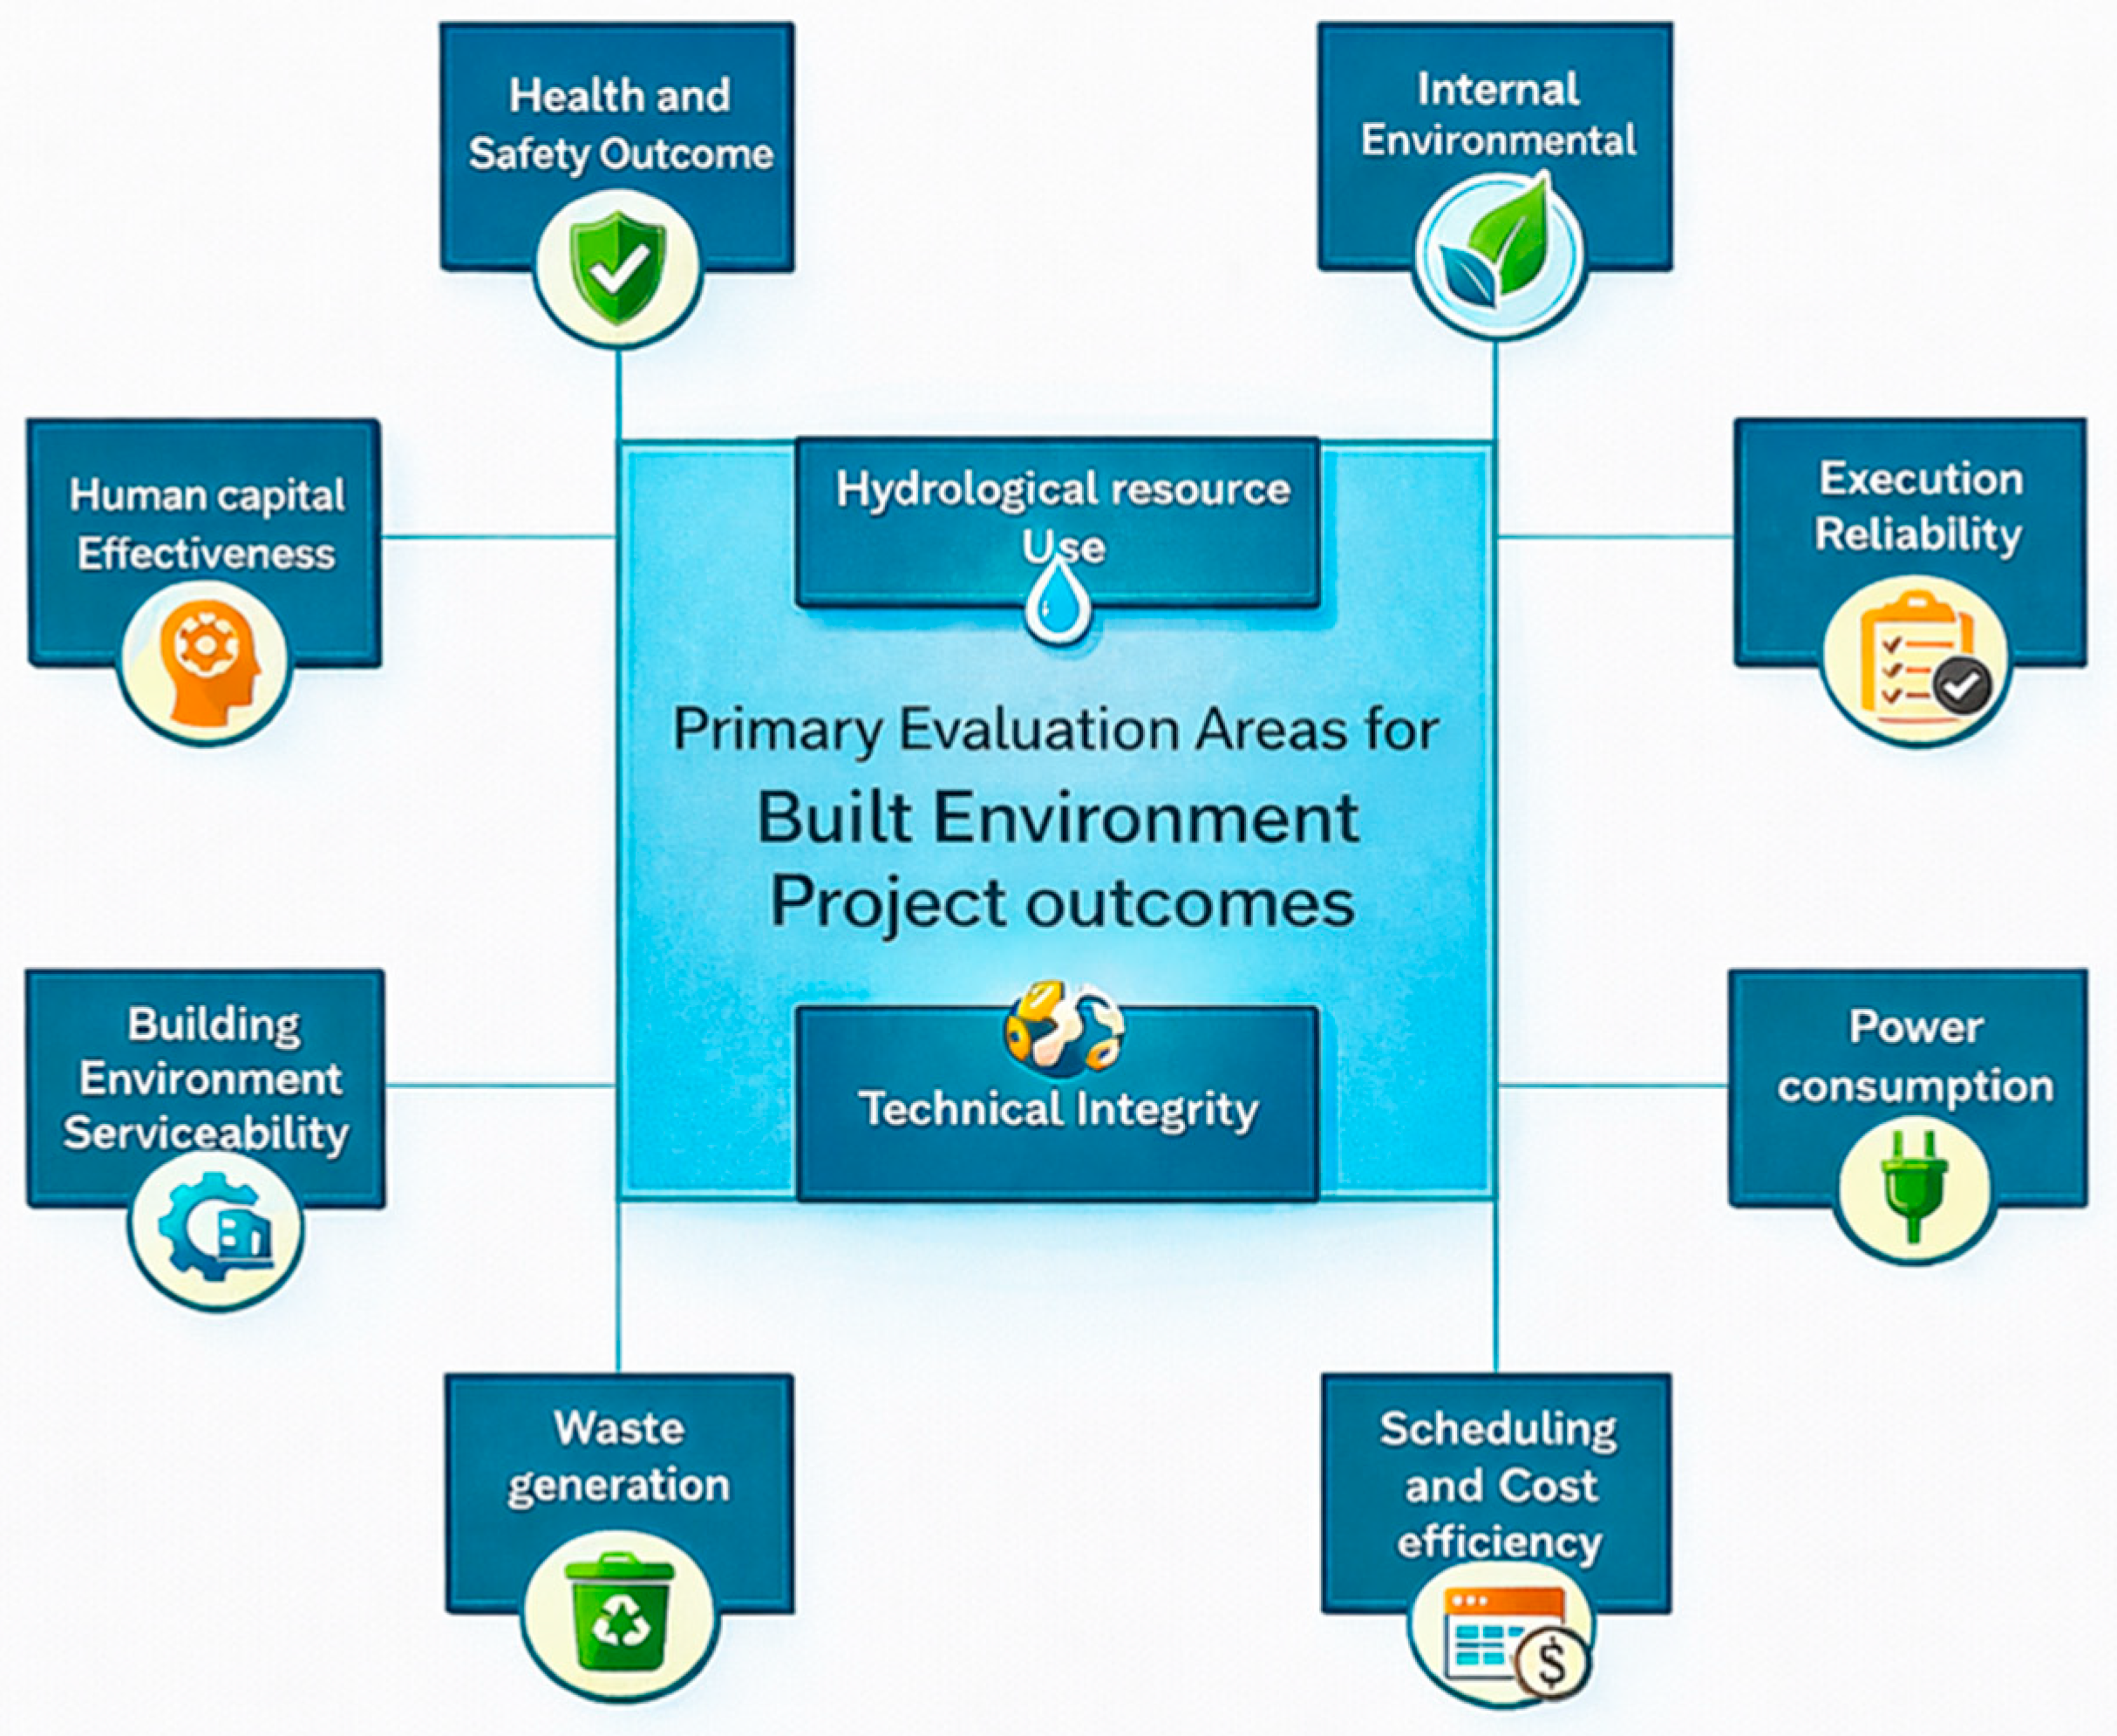
Figure 1 presents a structured conceptual framework of the primary evaluation areas influencing built environment project outcomes, highlighting the central role of technical integrity and hydrological resource use alongside interrelated performance dimensions spanning safety, cost–schedule efficiency, environmental state, resource consumption, waste generation, and human capital effectiveness. As cities pursue ambitious development goals and net-zero mandates, the limitations of traditional delivery models have become more than procedural; they are strategic liabilities. The inability of these frameworks to support real-time, cross-functional coordination undermines both innovation and sustainability. Therefore, overcoming these limitations requires a fundamental recalibration of project delivery, one that embeds digital integration, transparency, and shared accountability from the earliest project stages [
1,
4].
2.2. Implementation and Experiences in Collaborative Project Delivery Methods
Collaboration in construction has become essential, evolving into both synchronous and asynchronous forms. Synchronous collaboration has leveraged technologies, such as video conferencing and instant messaging, while newer tools, like 3D virtual and mixed reality environments, further enable real-time communication. These technologies foster construction innovation by supporting relationship building and the development of unique capabilities across firms [
7]. External collaborations, in particular, play a critical role in driving innovation [
6]. Omissions and design errors account for up to 79% of contract modification costs, translating to an average of 9.5% of total project costs [
8]. Over the past decade, studies have increasingly examined the effectiveness of collaborative delivery models, including the use of selection frameworks based on Request for Proposal (RFP) evaluations and statistical modeling [
9].
Furthermore, the complexity of construction projects and evolving stakeholder expectations have accelerated the adoption of Integrated Project Delivery (IPD). IPD emphasizes early involvement, trust, and shared goals among all key participants, ultimately minimizing adversarial dynamics [
5]. Collaborative agreements under IPD help align incentives and reduce fragmentation [
10]. The IPD model exemplifies the shift from siloed approaches to integrated ecosystems that promote innovation and sustainable construction. When enhanced with digital tools, such as Building Information Modeling (BIM), cloud-based project dashboards, and AI-supported communication, these collaborative frameworks become even more.
2.3. Types of Collaborative Project Delivery
Collaborative Project Delivery (CPD) methods, including IPD, Design–Build (DB), Construction Manager at Risk (CMAR), and Project Alliance (Alliancing), have proven instrumental in advancing sustainability in construction. These methods integrate key participants from the outset to form cohesive teams capable of managing complex challenges [
11]. This structure aligns with sustainable construction goals by reducing waste, optimizing resources, and establishing accountability throughout the project lifecycle.
As CPD evolves, there is a clear trend toward shared risk and open communication, both essential for trust and mutual project success [
12,
13]. IPD, in particular, is associated with improved outcomes and reduced waste, thereby enhancing environmental sustainability [
14]. This shift reflects the industry’s emphasis on lifecycle thinking, where construction is viewed not as a standalone phase but as part of an integrated continuum encompassing design, operation, maintenance, and renewal.
IPD enables comprehensive stakeholder integration from design through to operation and eventual deconstruction, embodying the cradle-to-cradle philosophy [
15]. This integrated view is essential for building sustainable infrastructure and highlights how digital and collaborative methods can transform the role of construction in urban resilience. When coupled with digital twins, real-time analytics, and AI-powered procurement tools, CPD becomes more than a delivery method; it becomes a strategic system.
Alliancing, as an innovative CPD model, brings owners, designers, and contractors under one contract to foster early and continuous collaboration. It emphasizes joint accountability and a no-blame culture, enhancing transparency, risk management, and overall project performance [
16].
2.4. Integrated Project Delivery Method (IPD)
Integrated Project Delivery (IPD) is a collaborative project delivery methodology that unites stakeholders, systems, and digital processes to enhance construction outcomes by improving efficiency, reducing waste, and maximizing value across all project stages, from design to construction and handover [
17,
18]. A defining advantage of IPD is the early engagement of key participants, designers, contractors, and owners, allowing for timely issue resolution, innovation integration, and the minimization of design conflicts or costly revisions [
19,
20,
21]. This early collaboration is particularly beneficial for complex urban projects, where interdependencies and stakeholder expectations are high. IPD promotes a culture of transparency and trust through joint decision-making and open budgeting mechanisms. It implements shared risk and reward structures that reduce adversarial relationships and foster equitable engagement among all parties [
22,
23]. Importantly, financial incentives in IPD are tied to overall project success rather than isolated performance metrics, encouraging alignment in cost, schedule, and quality objectives [
9,
10]. This collaborative model enhances team integration and is well-suited for infrastructure, where holistic performance and stakeholder alignment are critical. Despite its advantages, IPD requires supportive legal and contractual frameworks that differ significantly from conventional agreements [
5,
24]. The success of IPD hinges on a foundation of mutual trust and cooperative culture, both of which are essential for effective communication and shared accountability. Transitioning to IPD may also demand a cultural shift within organizations, as it challenges established practices and hierarchical decision structures. Moreover, IPD’s effectiveness is amplified by the integration of digital technologies such as Building Information Modeling (BIM), real-time collaboration platforms, and cloud-based dashboards [
25].
2.5. Bias and Methodological Challenges in Sustainable Contractor Selection
In the realm of sustainable contractor selection, various biases significantly influence decision-making processes and may hinder the adoption of environmentally responsible practices. Cognitive biases such as cultural bias, confirmation bias, and short-termism have been shown to adversely affect construction professionals’ perception of environmental compliance risks [
26]. These biases often result in the underestimation of environmental risks and the prioritization of immediate gains over long-term sustainability objectives, thereby impeding the selection of contractors committed to sustainable practices [
27,
28]. Empirical evidence from developing regions, including Tanzania and Ghana, highlights these obstacles as critical impediments to sustainability-oriented decision-making in construction projects [
29].
2.6. Trust as a Cornerstone of Integrated Project Delivery IPD
The evolution of IPD has underscored the increasing importance of shared risk and transparent communication as prerequisites for building trust and achieving mutual project objectives [
12,
13]. Within this paradigm, IPD has demonstrated tangible improvements in project outcomes, notably through waste reduction and enhanced efficiency [
14]. Firms lacking technological readiness or integration capability may struggle to realize the full benefits of IPD [
25]. Research in construction management consistently identifies trust as a foundational driver of project performance. “Honest communication, reliance, and delivery of outcomes” are the primary determinants of trust in construction [
30]. Likewise, the broader literature highlights trust’s role in enabling transparency, accountability, and a no-blame culture across project teams [
31,
32,
33,
34,
35].
2.7. Trust at Scale (IPD Value) Lessons from Industry Leaders for IPD
As presented in
Table 1, the frequency of literature engagement across IPD sub-criteria illustrates varying levels of scholarly emphasis, thereby indicating both well-established concepts and areas with limited academic investigation. Beyond academia, industry leaders reinforce this perspective. Daniel Elk, cofounder of Spotify in 2006, observed that trust is “one of the most under-discussed forces in organizations” precisely because it is difficult to scale, yet its absence is the most common reason for organizational breakdown. In line with expert judgement, similarly, Charlie Munger, Vice Chairman (1978–2023) of Berkshire Hathaway, described trust as “one of the greatest economic forces in the world,” stressing the need to cultivate a “seamless web of deserved trust with great people.” Sir Michael Latham, chair of the UK Government/Industry Review and author of Constructing the Team (1994), succinctly captured that “Good relationships based on mutual trust benefit clients.” Such insights align with the construction industry’s experience, where trust functions as both a social and economic force, enabling sustainable collaboration, reducing disputes, and supporting long-term performance [
36].
In sum, trust is not merely a relational ideal but a measurable determinant of project success. Within IPD, it underpins the structures of transparency, shared governance, and collaborative accountability.
2.8. Evaluating Low-Carbon Urban Contractors
Urban infrastructure demands a robust Decision Support System (DSS) integrated within Integrated Project Delivery (IPD) frameworks to assess contractors on low-carbon, sustainability, and performance criteria. Employing advanced Multi-Criteria Decision-Making (MCDM) tools, such as interval type 2 fuzzy ANP and TOPSIS, enables structured handling of matrix complexities under uncertainty [
55] and applies interval-fuzzy MCDM and game theory to street designs, identifying safety as the most critical benchmark, with green infrastructure and smart technologies. Similarly, the AHP is used to rank effectiveness and risk management in smart water management systems [
56]. Embedding these criteria, weighted based on stakeholder input, ensures the DSS filters and prioritizes contractors capable of delivering measurable low-carbon outcomes.
Equally essential is evaluating digital innovation and community integration within a city context. Diffusion of innovation theory demonstrated that perceived advantages, compatibility, and observability critically influence eMobility sharing uptake, indicating that contractors’ digital platform readiness should be a formal evaluation criterion [
57]. Low-carbon behaviors like cycling, energy savings, and reduced plastic use are shaped by socioeconomic and gender factors, underscoring the importance of context-sensitive design and community outreach [
58]. A comprehensive DSS will integrate technical, digital, and social scoring modules, complete with evaluation rubrics and pilot-tested KPIs, empowering IPD teams to award contracts to firms that are not only technically proficient but also committed to advancing low-carbon, socially responsive, and future-ready urban infrastructure.
2.9. Analytic Hierarchy Process (AHP)
The Analytic Hierarchy Process (AHP), developed by Saaty in 1980, is one of the most widely used Multi-Criteria Decision-Making (MCDM) techniques in construction [
59]. It systematically breaks down complex problems into a hierarchy of goals, criteria, and alternatives, allowing for pairwise comparisons to assign precise weights based on relative importance [
60]. This structured approach promotes objectivity and ranks options, with a consistency ratio validating the results. AHP’s straightforward methodology makes it particularly valuable for tasks, like contractor selection, material evaluation, and project ranking, where subjective judgment is essential [
60,
61]. However, because it relies on definitive input values, the AHP can struggle with uncertainty, prompting the development of fuzzy logic extensions, such as Fuzzy AHP. Even so, the method’s capacity to quantify qualitative criteria and maintain consistency ensures its ongoing significance in construction decision-making.
2.10. VIKOR in Multi-Criteria Optimization
VIKOR focuses on ranking alternatives for multi-criteria optimization, especially when conflicting and non-commensurable criteria exist [
62]. VIKOR employs linear normalization to eliminate units of criteria functions. It introduces a compromise solution by minimizing group utility (S) and individual regret (R) [
63]. Extensions like Fuzzy VIKOR have been utilized to handle uncertainties, producing reliable results for MCDM applications [
64]. In construction, VIKOR has proven effective in ranking contractors, assessing sustainable options, and balancing technical, economic, and social dimensions. Its ability to generate solutions that align with stakeholders’ priorities makes it increasingly relevant in sustainable infrastructure decision-making.
2.11. Fuzzy Logic in Multi-Criteria Decision-Making
Fuzzy logic, introduced by Zadeh [
65], is widely used to manage uncertainty, ambiguity, and subjectivity in complex decision-making. In construction, where expert judgment plays a major role, it is often integrated with MCDM methods such as AHP, TOPSIS, and DEMATEL to better interpret qualitative or imprecise information [
66]. Central to fuzzy logic is the use of linguistic variables (e.g., poor, average, excellent) represented through membership functions. Triangular functions, defined by (x, y, z), are preferred for their computational simplicity, while trapezoidal forms offer greater flexibility in higher-uncertainty contexts [
67]. Techniques like Fuzzy AHP help derive criterion weights, while Fuzzy TOPSIS assists in ranking alternatives under uncertainty [
68]. Because of its flexibility, intuitive structure, and compatibility with sustainability-oriented decision frameworks, fuzzy logic continues to gain prominence in engineering applications and contractor selection research [
69].
2.12. Hybrid MCDM Approaches in Construction
The complexity of modern construction projects has driven the adoption of hybrid MCDM methods that combine the strengths of multiple techniques. For instance, AHP has been integrated with TOPSIS, DEMATEL, and fuzzy logic to enhance decision-making accuracy and handle uncertainties [
70]. Hybrid approaches, such as Fuzzy–AHP–TOPSIS and DEMATEL–AHP, enable decision-makers to assign weights, assess interdependencies, and rank alternatives simultaneously. These methods have been applied to contractor selection, sustainability assessments, and project prioritization. Hybrid techniques offer greater flexibility and robustness compared to single methods, as they address subjective judgments and complex criteria interrelationships [
66,
71]. Their increasing use reflects the need for comprehensive tools to manage multi-criteria, multi-dimensional construction problems effectively.
2.13. Evaluating Contractors for Urban Infrastructure
Integrating advanced decision-making into urban infrastructure is essential for low-carbon outcomes. A descriptive analytics and ML study on several years of CO and weather data reveals clear seasonal patterns and key pollution drivers, providing actionable inputs for effective low-carbon strategies [
65]. This is complemented by a six-step community empowerment framework that includes action planning, footprint tracking, flexible energy systems, and digital monitoring, which prioritizes stakeholder engagement, local resource use, and carbon-zero targets [
66]. These approaches underpin the need for weighted evaluation metrics spanning technical, environmental, and social dimensions within a contractor-focused DSS. Building on this, social, digital, and policy dimensions must be captured. Millennials’ low-carbon behaviors, such as cycling, energy saving, and reducing plastic use, are sustained by enabling policies, stakeholder collaboration, and alignment with everyday consumption habits [
51]. Accordingly, a practical DSS should include structured KPI modules, e.g., CO
2 reduction, digital engagement, and public outreach [
50].
2.14. Technical Sustainability
Technical sustainability focuses on a structure’s performance, quality, and durability over its lifecycle [
72,
73,
74]. A list of technical sub-criteria obtained through the literature review, which is utilized in the sustainability assessment of different construction works, is presented in
Table 2.
2.15. Social Sustainability
Social sustainability emphasizes creating healthy, balanced, and prosperous communities through equitable and just practices. A list of social sub-criteria obtained through the literature review, which is utilized in the sustainability assessment of different construction works, is presented in
Table 3.
2.16. Economic Sustainability
Table 4 shows that economic sustainability involves factors that ensure financial health while supporting the economic development of local and global communities. It includes improving construction performance and durability to minimize lifecycle costs, operational expenses, and resource wastage [
93].
2.17. Environmental Sustainability
Environmental sustainability focuses on minimizing the negative impact of construction on the natural environment by promoting efficient use of resources, renewable energy, and pollution control [
102]. A list of environmental sub-criteria obtained through the literature review, which is utilized in the sustainability assessment of different construction works, is presented in
Table 5.
3. Methodological Structure
3.1. Deliberations and Assumptions
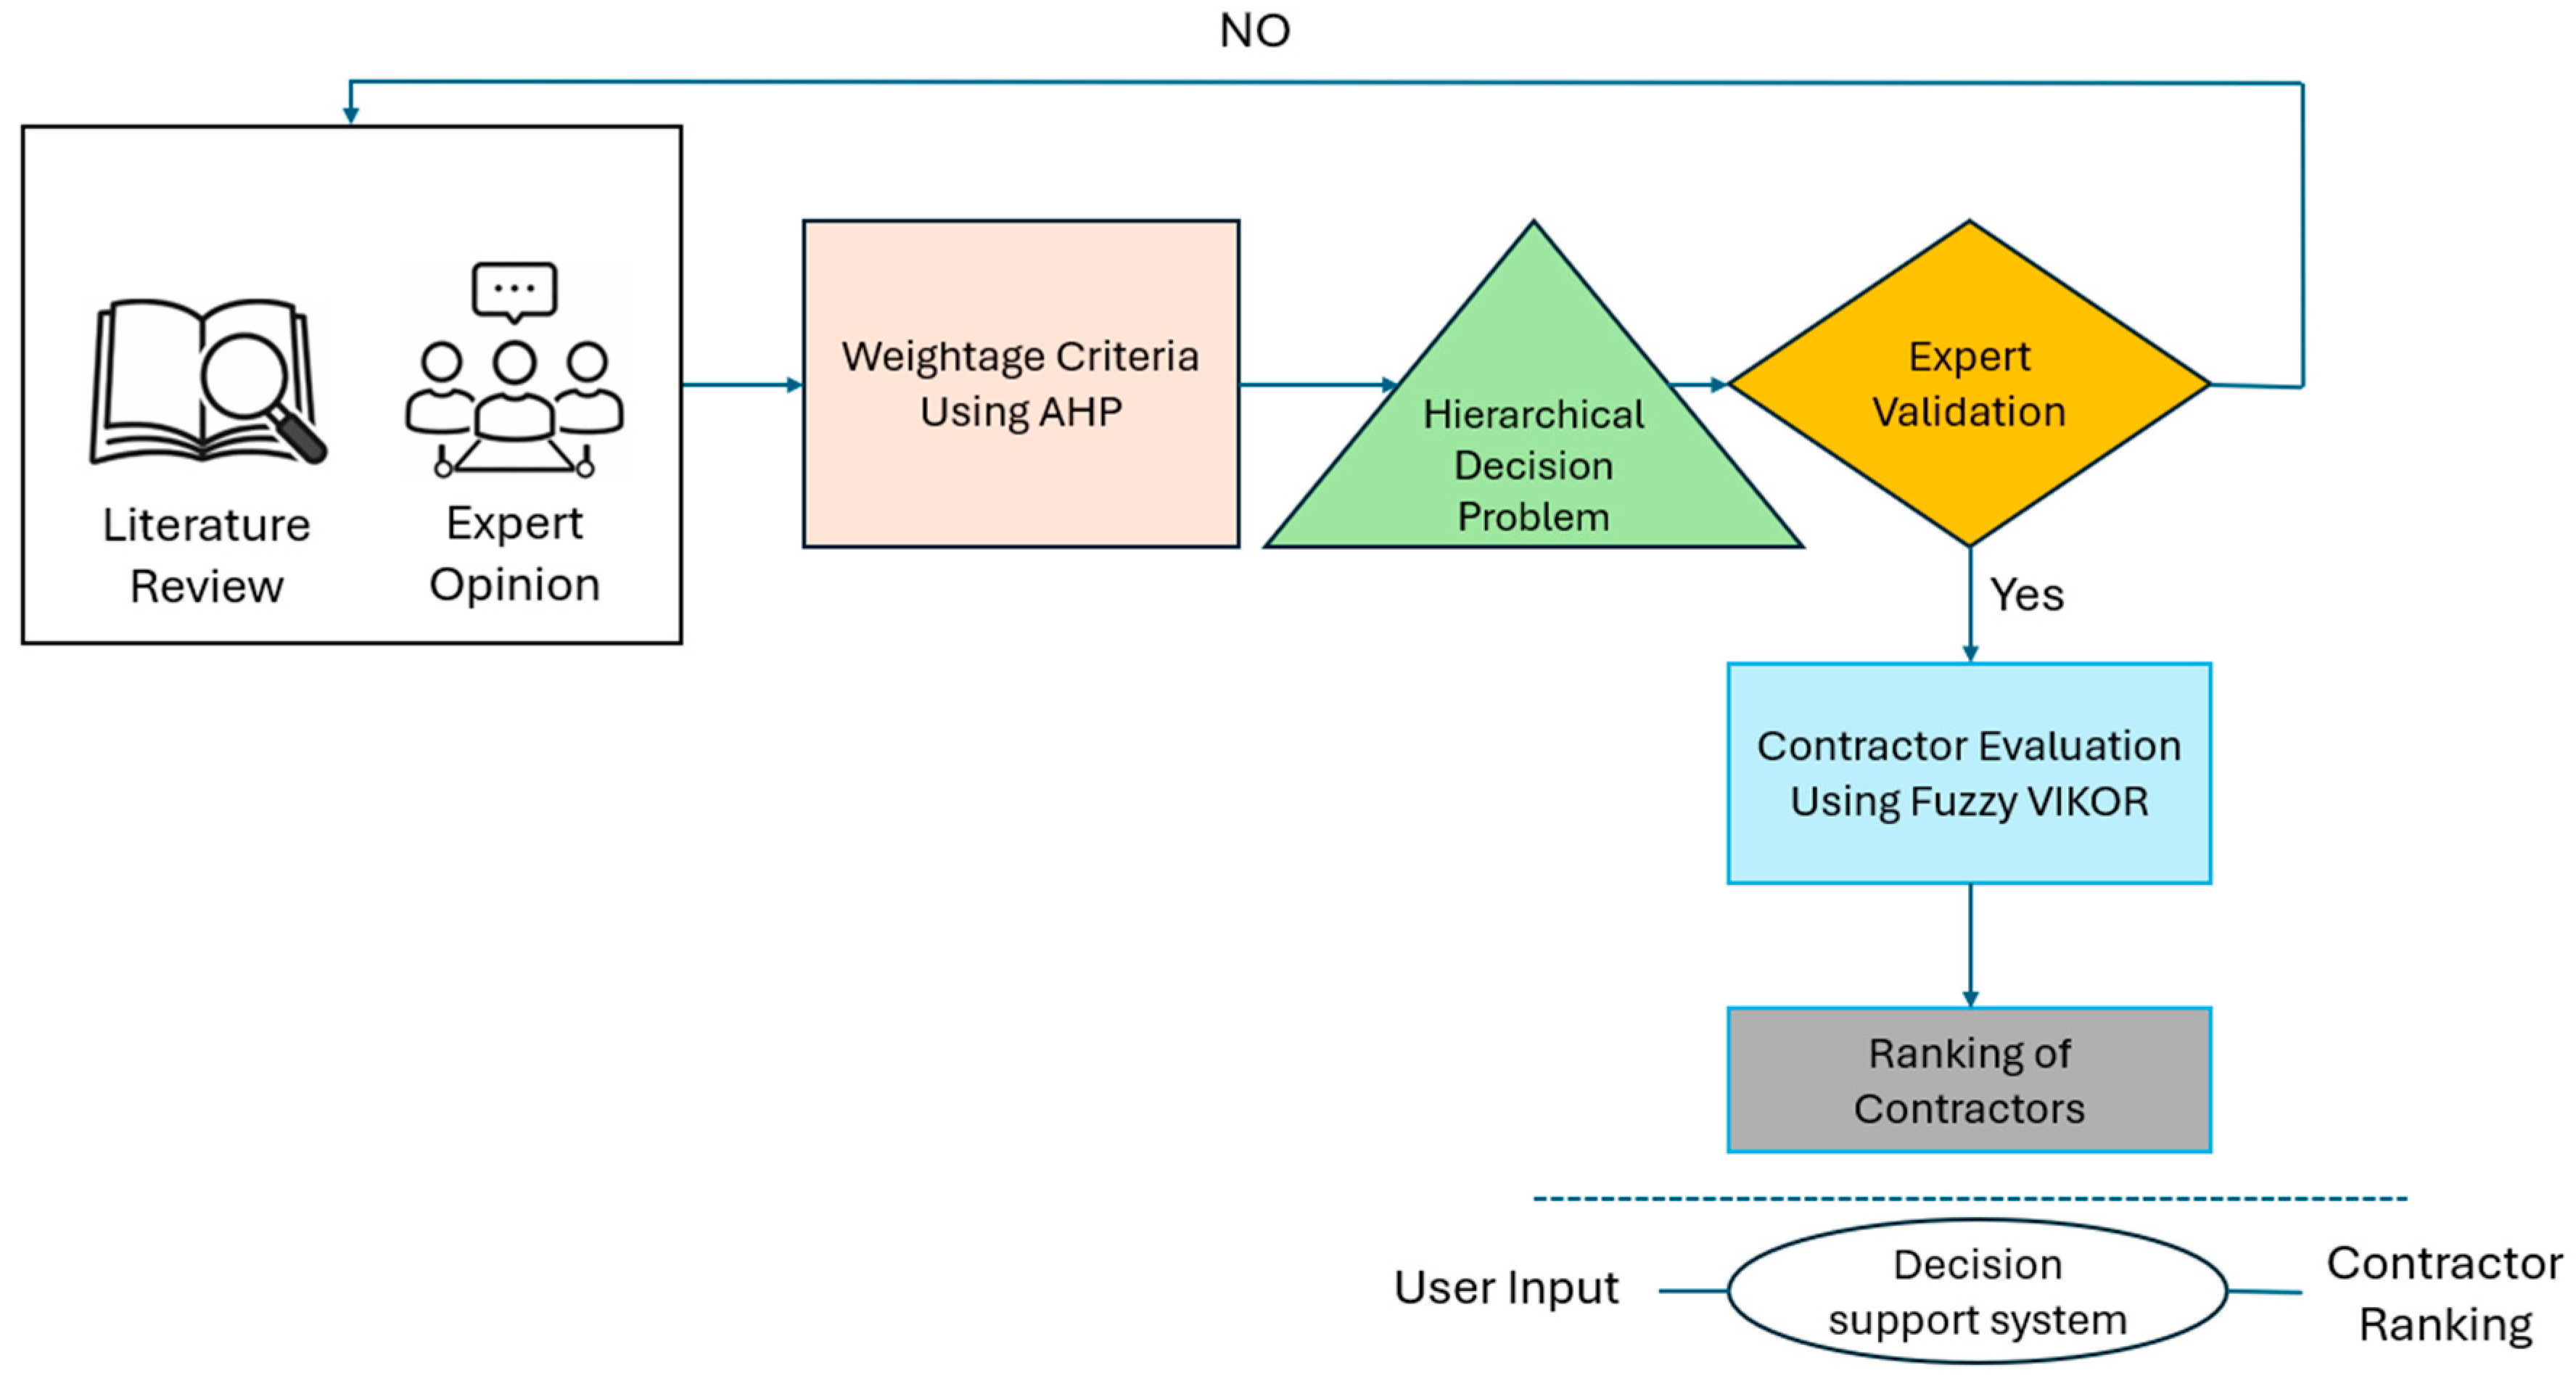
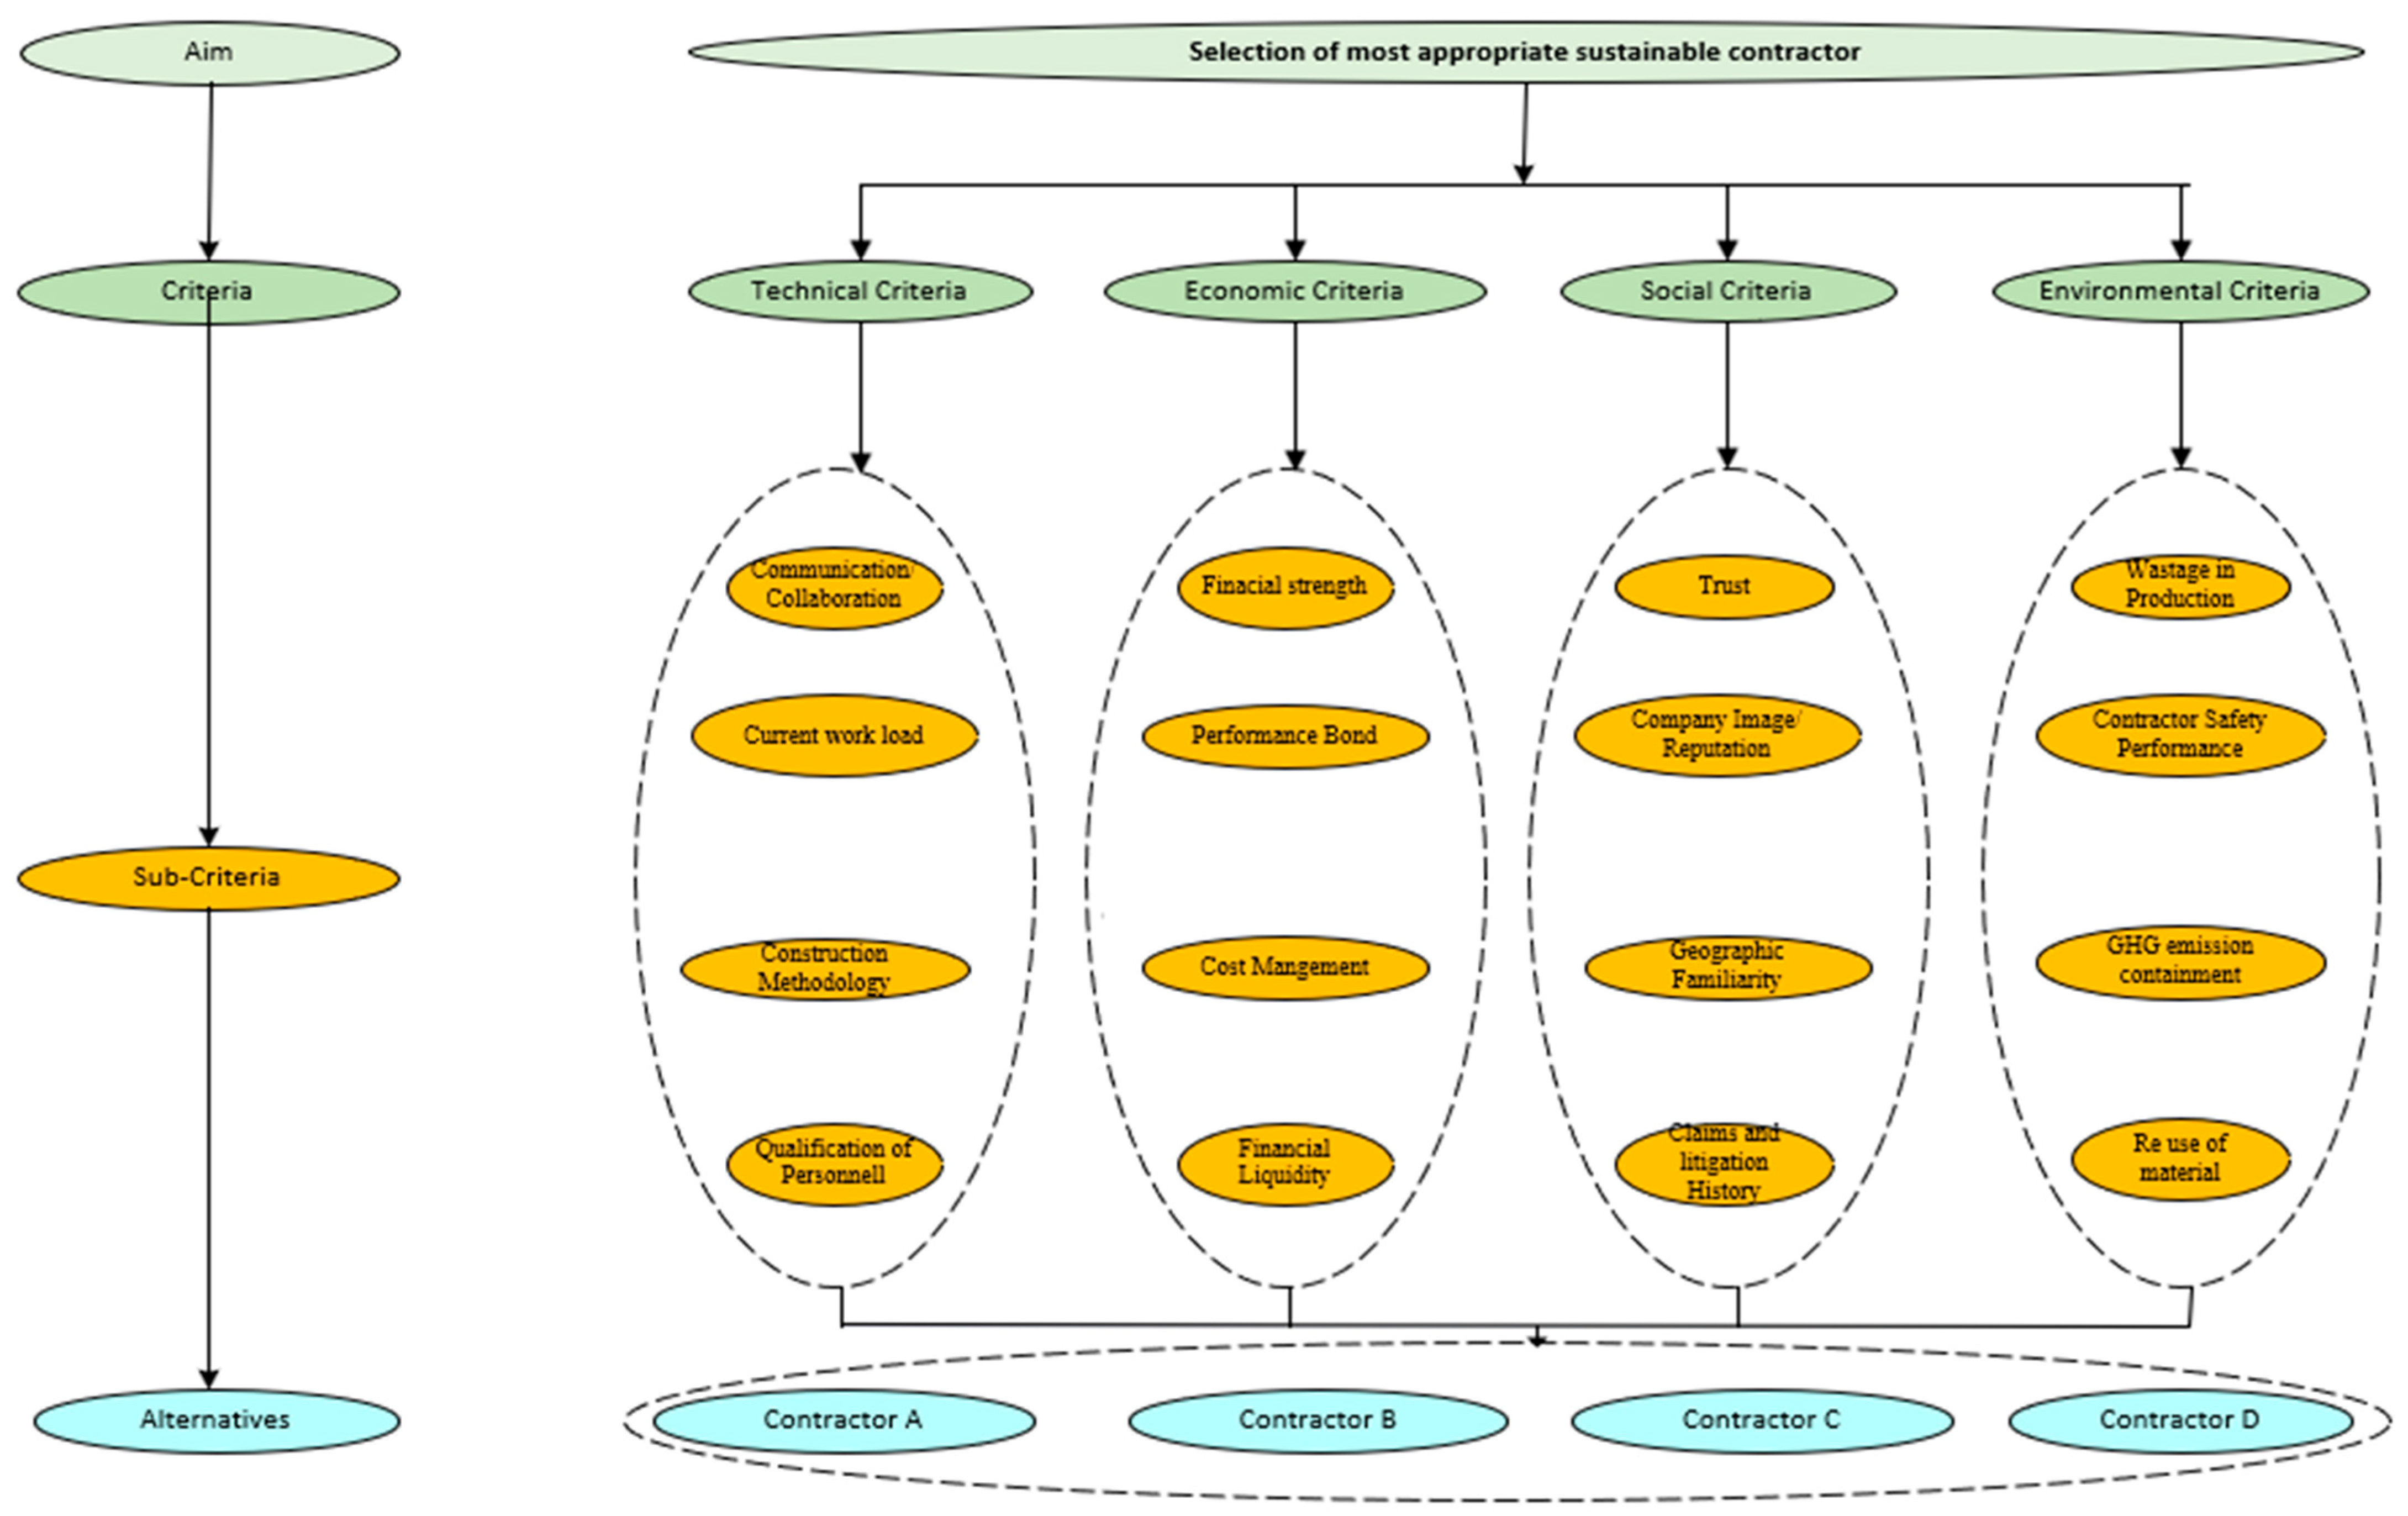
Figure 2 illustrates how the study considered four alternative contractors using the combinations of IPD as a PDM and QBS procurement systems (IPD and QBS), incorporating Fuzzy AHP and Fuzzy VIKOR.
3.2. Rationale for FAHP and Fuzzy VIKOR in Contractor Selection
The selection of sustainable contractors is a complex decision-making process that requires evaluating both qualitative and quantitative factors under uncertainty. To address this complexity, this study adopts a hybrid Multi-Criteria Decision-Making (MCDM) approach, combining the Fuzzy Analytic Hierarchy Process (FAHP) and Fuzzy VIKOR. This combination is selected due to its complementary strengths in handling vague human judgment and optimizing multi-criteria trade-offs [
72,
73].
3.3. Enhancing DSS for Sustainable Contractor Selection Through IPD and QBS Integration
Table 6 shows that the effectiveness of any contractor selection system depends on the quality, relevance, and structure of its evaluation criteria. Traditional contractor selection tools often rely on generic or cost-driven criteria, failing to reflect the collaborative and sustainability-focused needs of modern construction projects. By integrating criteria drawn from Integrated Project Delivery (IPD) and Qualifications-Based Selection (QBS) frameworks, this research develops a Decision Support System (DSS) that offers a more comprehensive, context-sensitive, and sustainability-aligned contractor selection process.
3.4. Development of the Model
As part of the methodology, a prequalification process was established as shown in
Table 7 to ensure that only qualified contractors were considered for sustainable project delivery. This involved the submission of mandatory documentation, including acknowledgement of all addenda, proof of general liability insurance coverage of CAD 10 million in accordance with CCDC 30, and valid Certificates of Recognition (COR) for both Alberta and Saskatchewan. Additional requirements included Workers’ Compensation Board (WCB) letters of clearance for both provinces, along with signed affidavits confirming non-collusion, equal employment opportunity compliance, and the team’s commitment and availability. These criteria were essential in maintaining transparency, safety, and capacity standards throughout the contractor selection process.
3.5. Post-Prequalification Differentiation of Contractors Across Sustainability Dimensions
Contractor A demonstrated strong technical integration, collaboration, and process efficiency. Contractor B excelled financially, showing superior liquidity, cost control, and overall fiscal reliability. Contractor C distinguished itself socially through high community trust, a clean litigation record, and strong stakeholder alignment. Contractor D emerged as the sustainability leader, outperforming others in carbon reduction, material circularity, and safety performance. In this study,
Figure 3 depicts the use of sixteen sub-criteria and four contractor alternatives, which were purposefully adopted to preserve the methodological coherence and computational reliability of the FAHP–Fuzzy VIKOR framework. Increasing the number of sub-criteria beyond this threshold or expanding the alternatives above four would create excessive complexity in the pairwise comparison process, reduce judgment consistency, and diminish the discriminative capacity of the VIKOR ranking procedure. Consequently, maintaining this structure ensures that the decision support model remains stable, interpretable, and analytically effective.
3.6. Converting Objective Values into Subjective Inputs
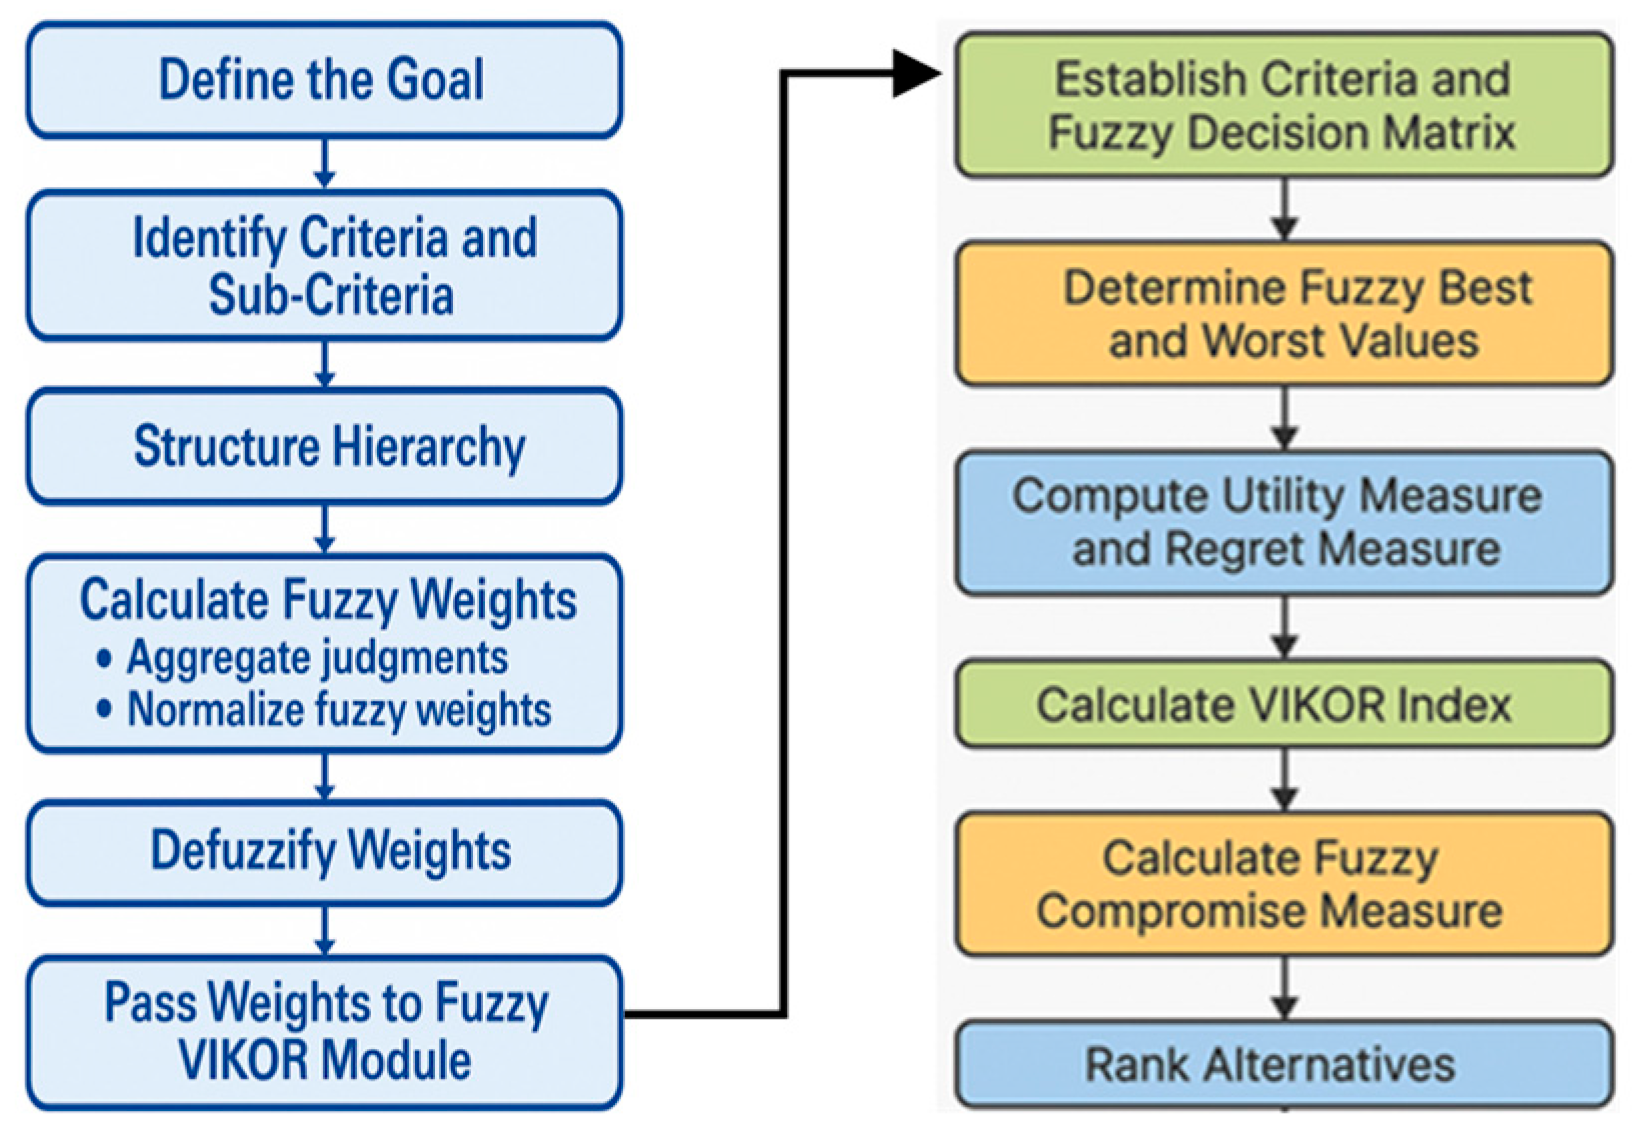
Figure 4 illustrates the sequential integration of the Fuzzy AHP and Fuzzy VIKOR procedures from goal definition and weight calculation to compromise ranking of alternatives forming the complete decision support framework. This study generated an Excel extension that integrates subjective and objective weight. The advantage of the developed approach is that it uses decision makers’ experience and the tangible (numerical input) information from end users throughout the decision-making process. In addition to subjective weights determined by decision-makers, this study derived subjective weights from objective values using Shannon’s entropy as a basis [
117]. The Shannon entropy method is introduced to objectively quantify the information content and variability within each criterion, ensuring that data-driven weights complement rather than replace the subjective FAHP weights. To determine objective weights using the entropy measure, the decision matrix was normalized for each criterion
(
), where
denotes the number of criteria, in order to obtain the projection value
for each criterion. Alongside the subjective weights provided by decision-makers, this study also calculated objective weights based on Shannon’s entropy method.
Step 1.
To calculate objective weights through the entropy method, each criterion in the decision matrix must first be normalized criterion
(
), where
denotes the number of criteria (to obtain the projection value
) of each as follows:
where
m is the number of alternatives.
Step 2.
Once the decision matrix is normalized, the Shannon entropy index can be computed as follows:
Step 3.
Now, the following equation is used to find out the Shannon equitability index or the entropy to measure the evenness of the values in a particular criterion. The entropy value is denoted as e
j as follows:
where m is the total number of alternatives considered in the decision-making process.
Step 4.
The divergence degree is then determined using dj = 1 − ej. A higher dj, value indicates a greater level of divergence. In the matrix, criteria with higher divergence values are prioritized when distributing subjective values across the range.
3.7. Steps for Computing Criteria Weights Using Fuzzy AHP
Problem Definition and Objective Identification
All sixteen criteria are assessed using established MCDM procedures, as illustrated in
Figure 4 and detailed in the subsequent sections.
Step 1: Constructing the Comparison Matrix
The hierarchical decision-making framework evaluates the objective across four sustainability dimensions, technical, economic, social, and environmental, each with four sub-criteria, totaling sixteen. These criteria are assessed using a standard MCDM procedure and elaborated in the following sections. The mathematical formulation for comparisons is a
ij = w
i/w
j. Therefore,
Table 8 shows how fuzzy pairwise comparisons are used to capture expert judgments. Fuzzy AHP was first used to convert experts’ linguistic assessments of relative importance into fuzzy numbers through pairwise comparisons of the 16 sub-criteria. For example, if an expert judged Energy Efficiency (C
1) to be “strongly more important” than Material Carbon Impact (C
2), this linguistic term was mapped to the crisp value 5 and then to the corresponding fuzzy number (3, 4, 5, 6), while the reciprocal judgment became 1/6, 1/5, 1/4, and 1/3.
Step 2: Normalizing the Matrix
After knowing the comparison of its criteria in
Table 9, the next thing is to normalize the matrix. This is performed by dividing each cell by the summation of that column’s value. Here
Step 3: Calculating Criteria Weight
After establishing the pairwise comparison values in
Table 9, the matrix was normalized by dividing each entry by the total of its corresponding column. This procedure standardizes the expert judgments and produces a normalized comparison matrix from which the relative weight of each sustainability sub-criterion can be derived for subsequent FAHP processing.
Step 4: Verifying Consistency
The pairwise comparison matrix was evaluated using Saaty’s Consistency Index (CI) and a consistency ratio (CR) to ensure the logical coherence of expert judgments before fuzzification. The normalized eigenvector was derived and used to compute the maximum eigenvalue , from which the CI and CR were calculated using the corresponding random index. For example, a 3 × 3 matrix in this study produced , yielding and , both within the acceptable threshold (CR < 0.10), confirming that the expert inputs were consistent and suitable for subsequent FAHP weighting.
Step 5: Fuzzification. The given weights need to be fuzzified based on
Table 10, given below.
Step 6: Fuzzified Normalized Weight and Global Ranking. Finally, normalized fuzzy weights are calculated as follows:
where, j = 1, 2, 3, …, m (number of criteria)
For this study, the fuzzified normalized weights were obtained by aggregating the lower, middle, and upper fuzzy values for each criterion using the geometric mean and then normalizing each component by the total of its respective column. This process produced the final normalized fuzzy weights used as inputs for the Fuzzy VIKOR procedure, ensuring that each sustainability sub-criterion contributed proportionally and consistently to the overall contractor ranking.
3.8. Ranking of Alternatives with Fuzzy VIKOR (Using Fuzzy AHP Weightage)
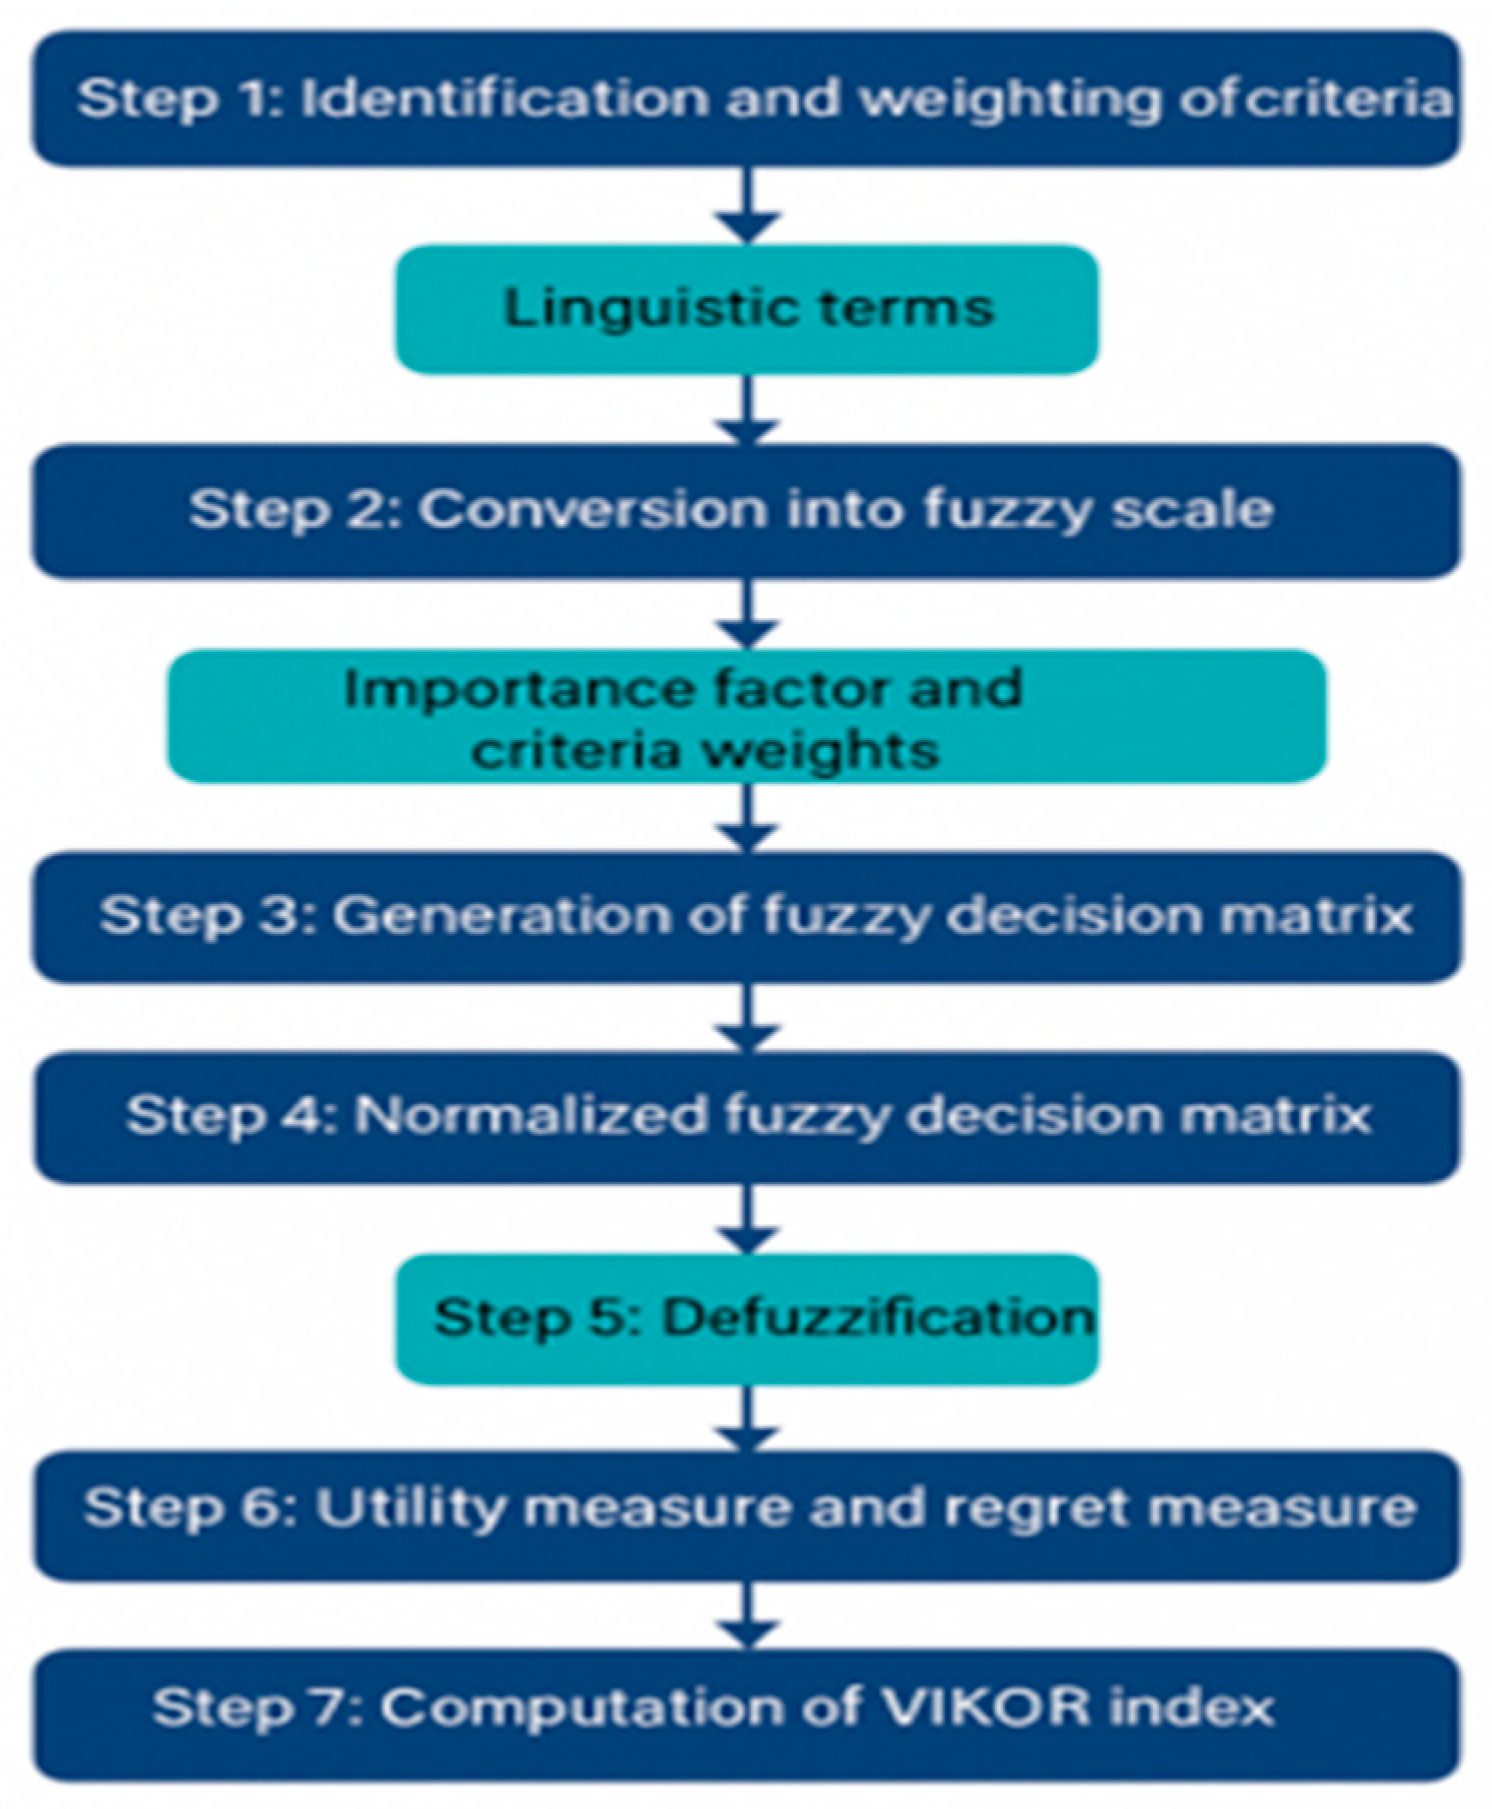
As shown in
Figure 5, the Fuzzy AHP–Fuzzy VIKOR procedure was operationalized in this study through a sequential workflow beginning with the elicitation of expert judgments for the 16 sub-criteria using linguistic terms. These linguistic evaluations were converted into fuzzy scales and used to derive the FAHP importance weights, which subsequently informed the construction and normalization of the fuzzy decision matrix for each contractor. Following the defuzzification step and the computation of the utility and regret measures, the final VIKOR index was calculated, enabling the ranking of contractor alternatives in a transparent and sustainability-oriented manner consistent with the structure outlined in
Figure 5.
4. Case Study and Application
4.1. Overview of the Case Study Application
Fuzzy AHP and a decision matrix were applied to derive criteria weights, followed by an independent Fuzzy VIKOR evaluation to rank the contractor alternatives. The process incorporated stakeholder input consistent with the IPD framework and culminated in the development of an automated multi-criteria DSS using specialized software tools.
4.2. Details of Case Study, MCDM, and DSS Templates
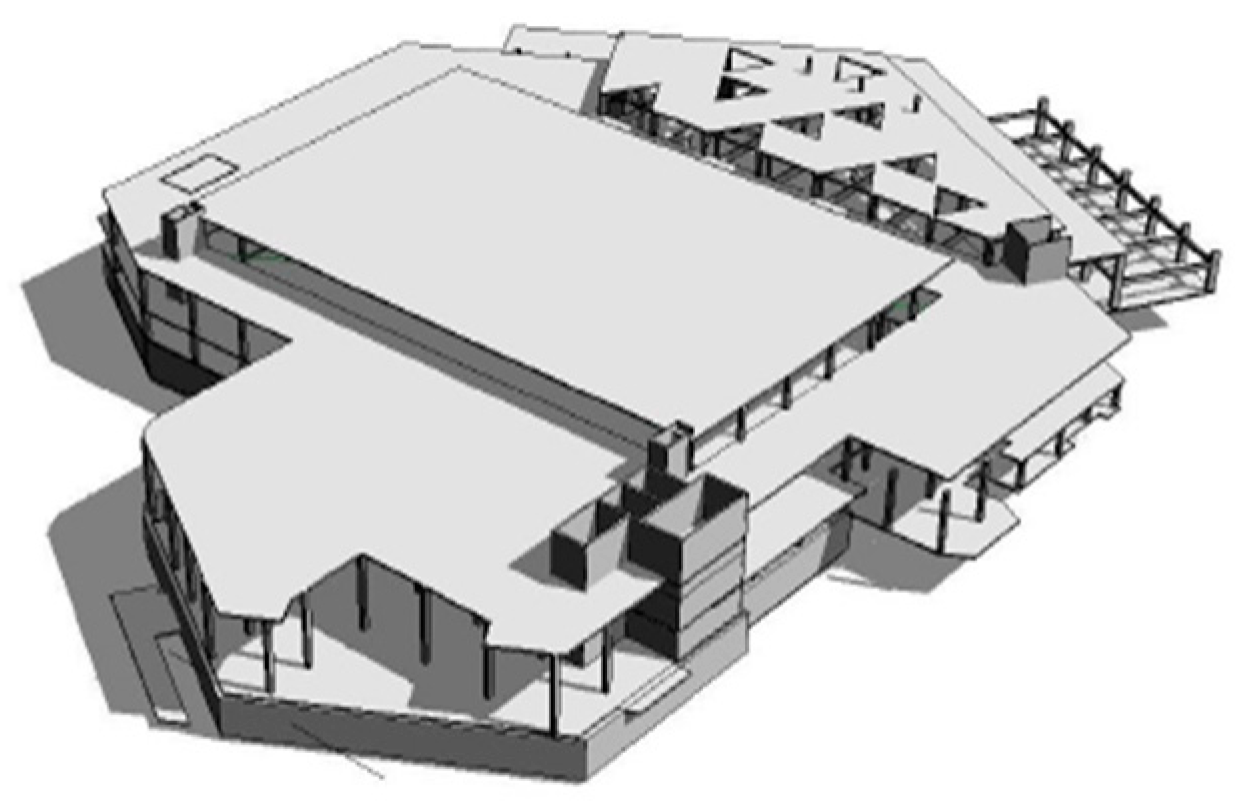
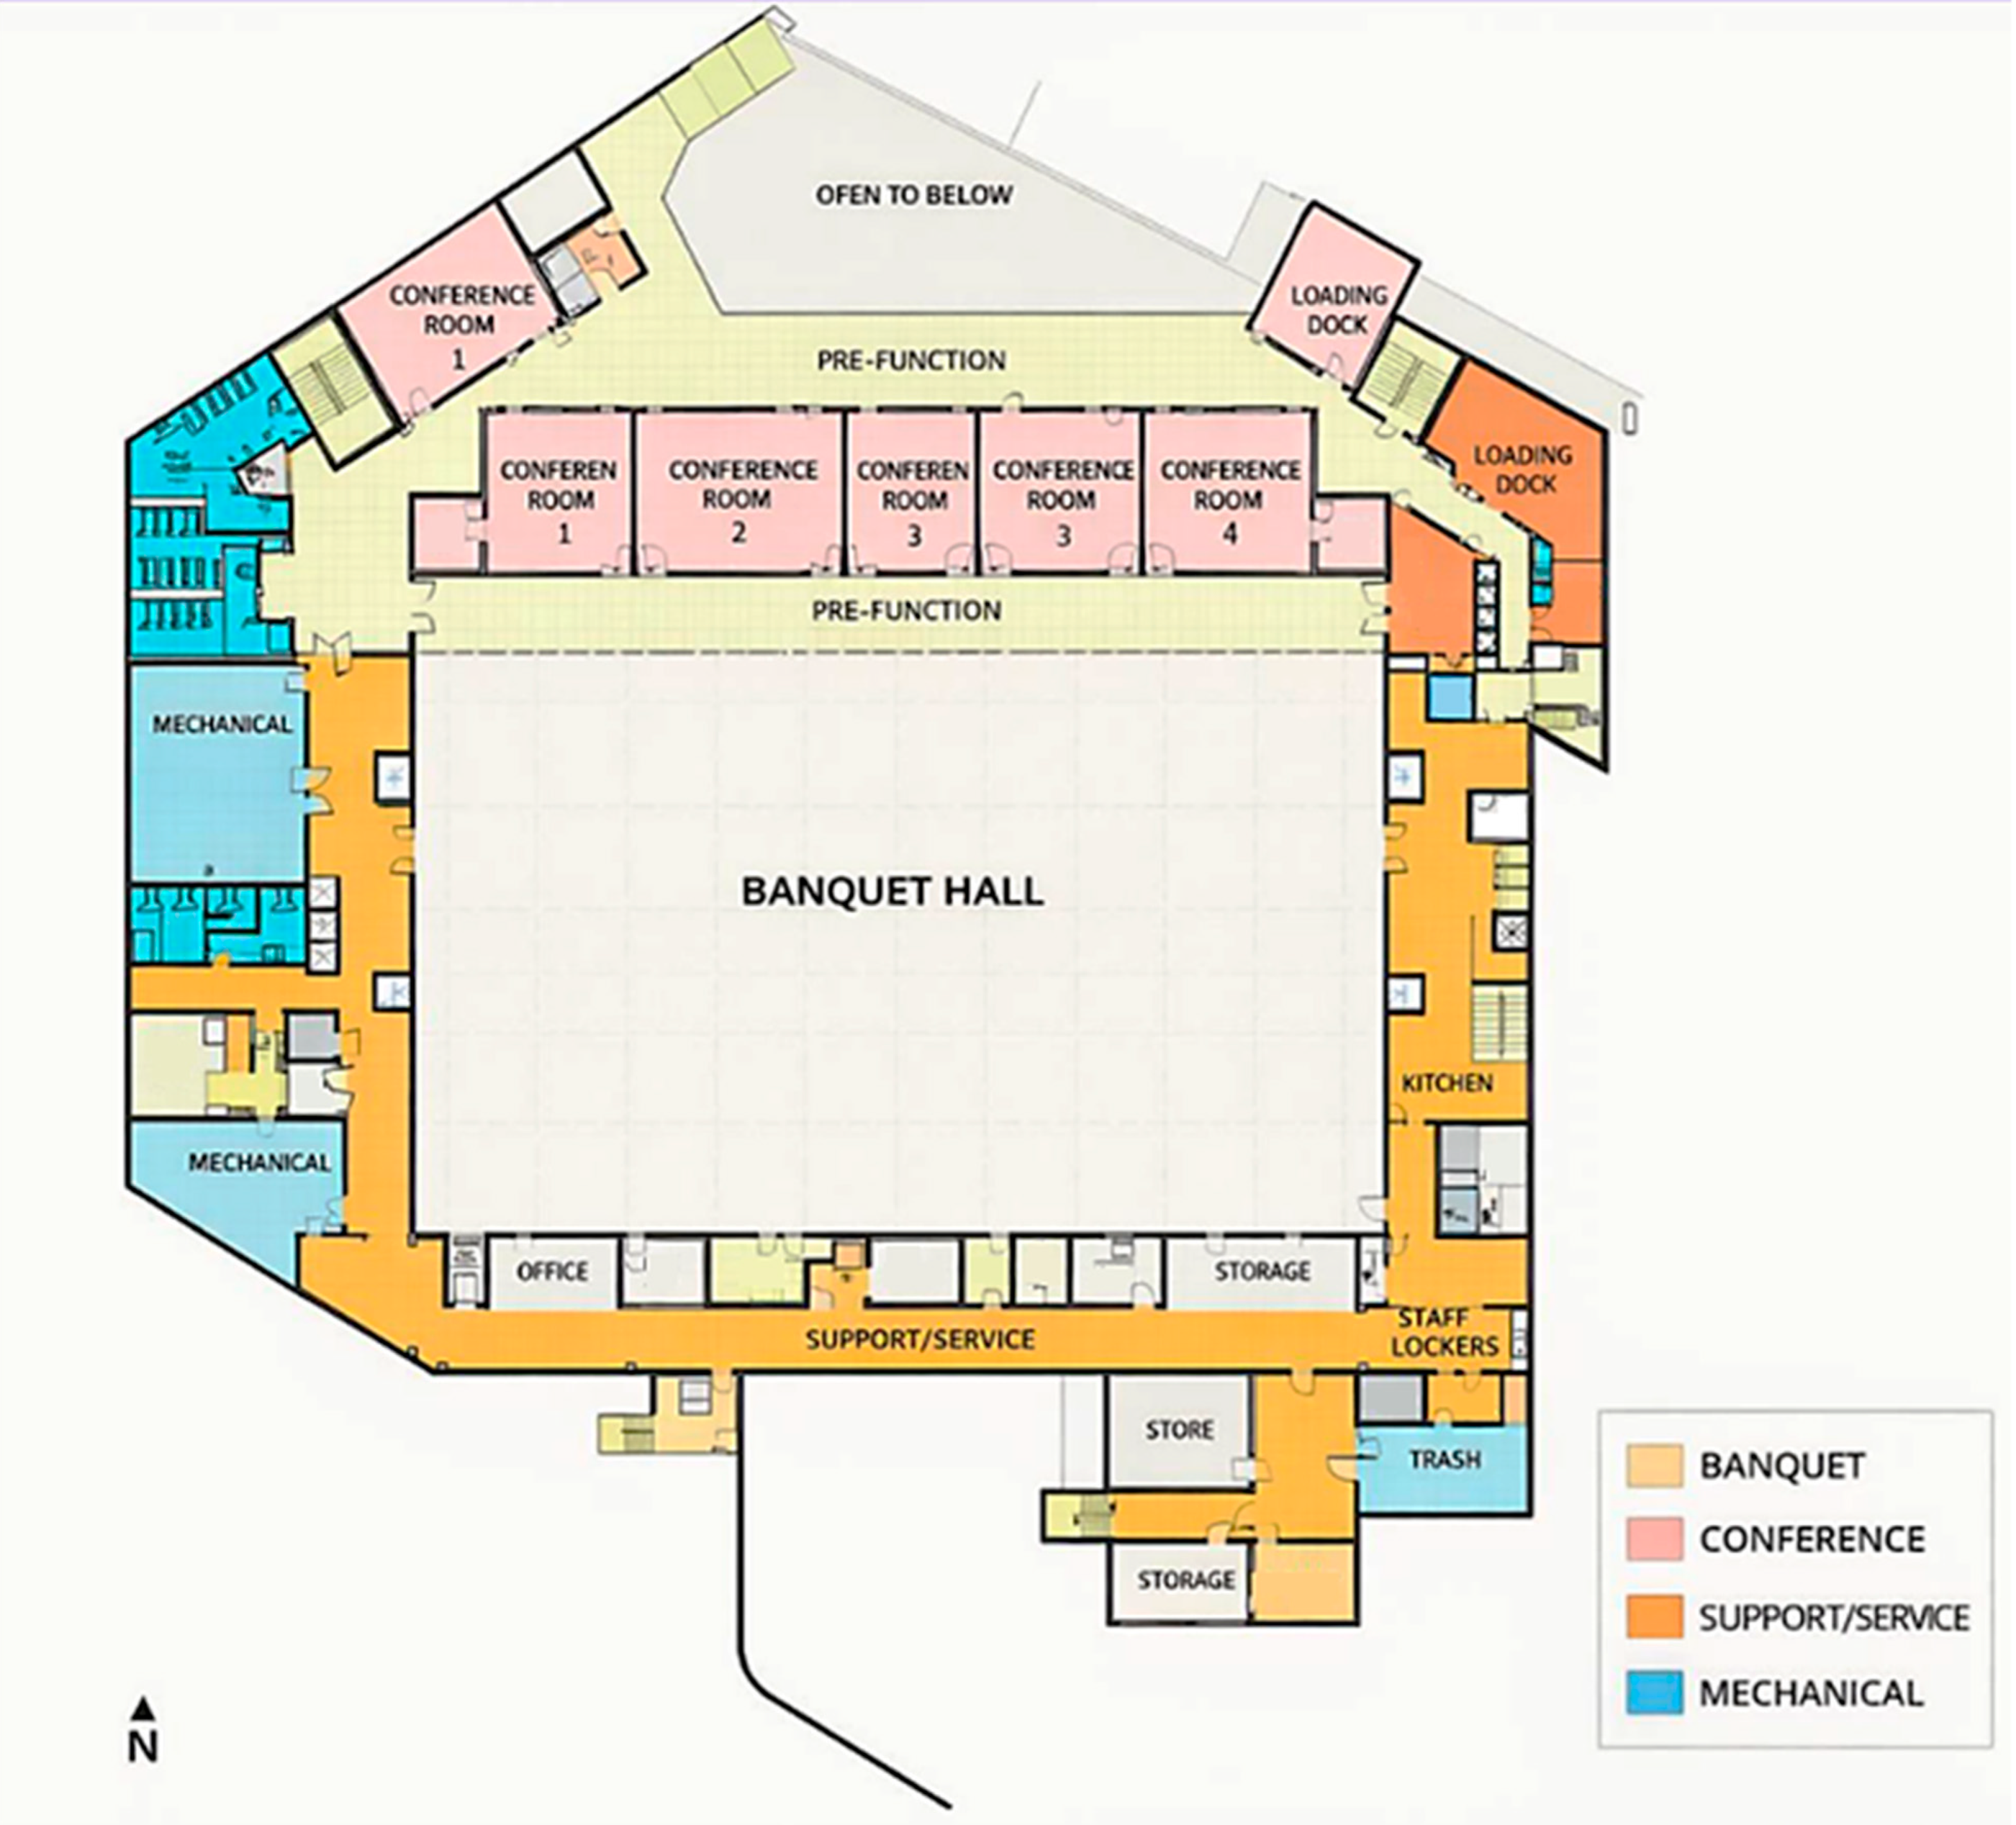
Table 11 provides details of the case study involving a two-story multi-purpose banquet center that was utilized to validate the Decision Support System (DSS) developed in this research. The choice of structure was intentional to align with Integrated Project Delivery (IPD) requirements through a Request for Proposal framework. While
Table 12 presents the expert evaluators’ roles, professional affiliations, and industry experience involved in the case study.
4.3. Details of the MCDM
In the selection of contractors for sustainable construction projects, decision-makers rely on a combination of objective and subjective evaluations. Objective values are quantifiable and measurable data points, while subjective values involve qualitative assessments based on expert judgment, industry benchmarks, and stakeholder preferences. The integration of subjective values ensures a more comprehensive decision-making process, accounting for factors such as risk perception, experience, and sustainability priorities. This section explains how objective values in contractor evaluation criteria can be translated into subjective ratings.
4.4. Objective to Subjective Transformation Framework
The transformation of numerical (objective) data into qualitative (subjective) ratings involves setting predefined ranges that correspond to linguistic categories such as excellent, good, average, poor, and very poor. This allows for an intuitive understanding of contractor performance in various criteria. The methodology follows these steps.
The normalization of objective values involves converting values to a uniform scale.
where X′ is the normalized value and X is the actual raw value.
Xmin is the minimum value in the dataset for that criterion.
Xmax is the maximum value in the dataset for that criterion.
The Shannon diversity index calculation involves evaluating diversity in the criteria distribution to measure variability in contractor performance.
where
P
i is the proportion of each category (e.g., bid score, project count, sustainability rating, etc.) and ln is the natural logarithm Shannon equitability index calculation—determining how evenly performance is distributed across contractors.
where
H′ is the Shannon diversity index, SSS is the total number of categories (e.g., species, contractor alternatives, etc.), and ln(S) is the natural logarithm of the number of categories.
4.5. Conversion of Objective User Input to Subjective Value
Step 1. The inputs of
Table 13 are normalized by dividing each cell value by the sum value of each column (total criteria values for all alternatives). This normalization process yields the normalized matrix, as presented in
Table 14. The criterion weight is computed using a hybrid aggregation of subjective FAHP weights and objective Shannon entropy weights, expressed as
. This combined weight is then normalized across all criteria to yield
, ensuring that both expert judgment and data-driven variability jointly determine the criterion’s importance in a fully reproducible manner.
Step 2. By adding the column values, where each cell value is multiplied by its logarithm (ln) value, Shannon’s diversity index is calculated. The Shannon diversity index measures the diversity of range values for any criterion among the alternatives, while the Shannon equitability index evaluates the evenness of the distribution across categories. The results are presented sequentially in
Table 15 and
Table 16. Linguistic performance ratings were converted into normalized numerical ranges (
Table 17) and assembled into a subjective assessment matrix for all alternatives and criteria (
Table 18), which served as the basis for computing Shannon’s diversity and equitability indices.
4.6. Computation of Criterion Weights and Consistency Verification
Consistency was verified through λₘₐₓ, CI, and CR calculations, all of which met the acceptable CR < 0.10 threshold. The consistent matrices were then converted into fuzzy representations using linguistic–triangular scales, and fuzzified normalized weights were generated following the FAHP formulation. These final fuzzy weights, summarized in
Table 19, represent the relative importance of each criterion.
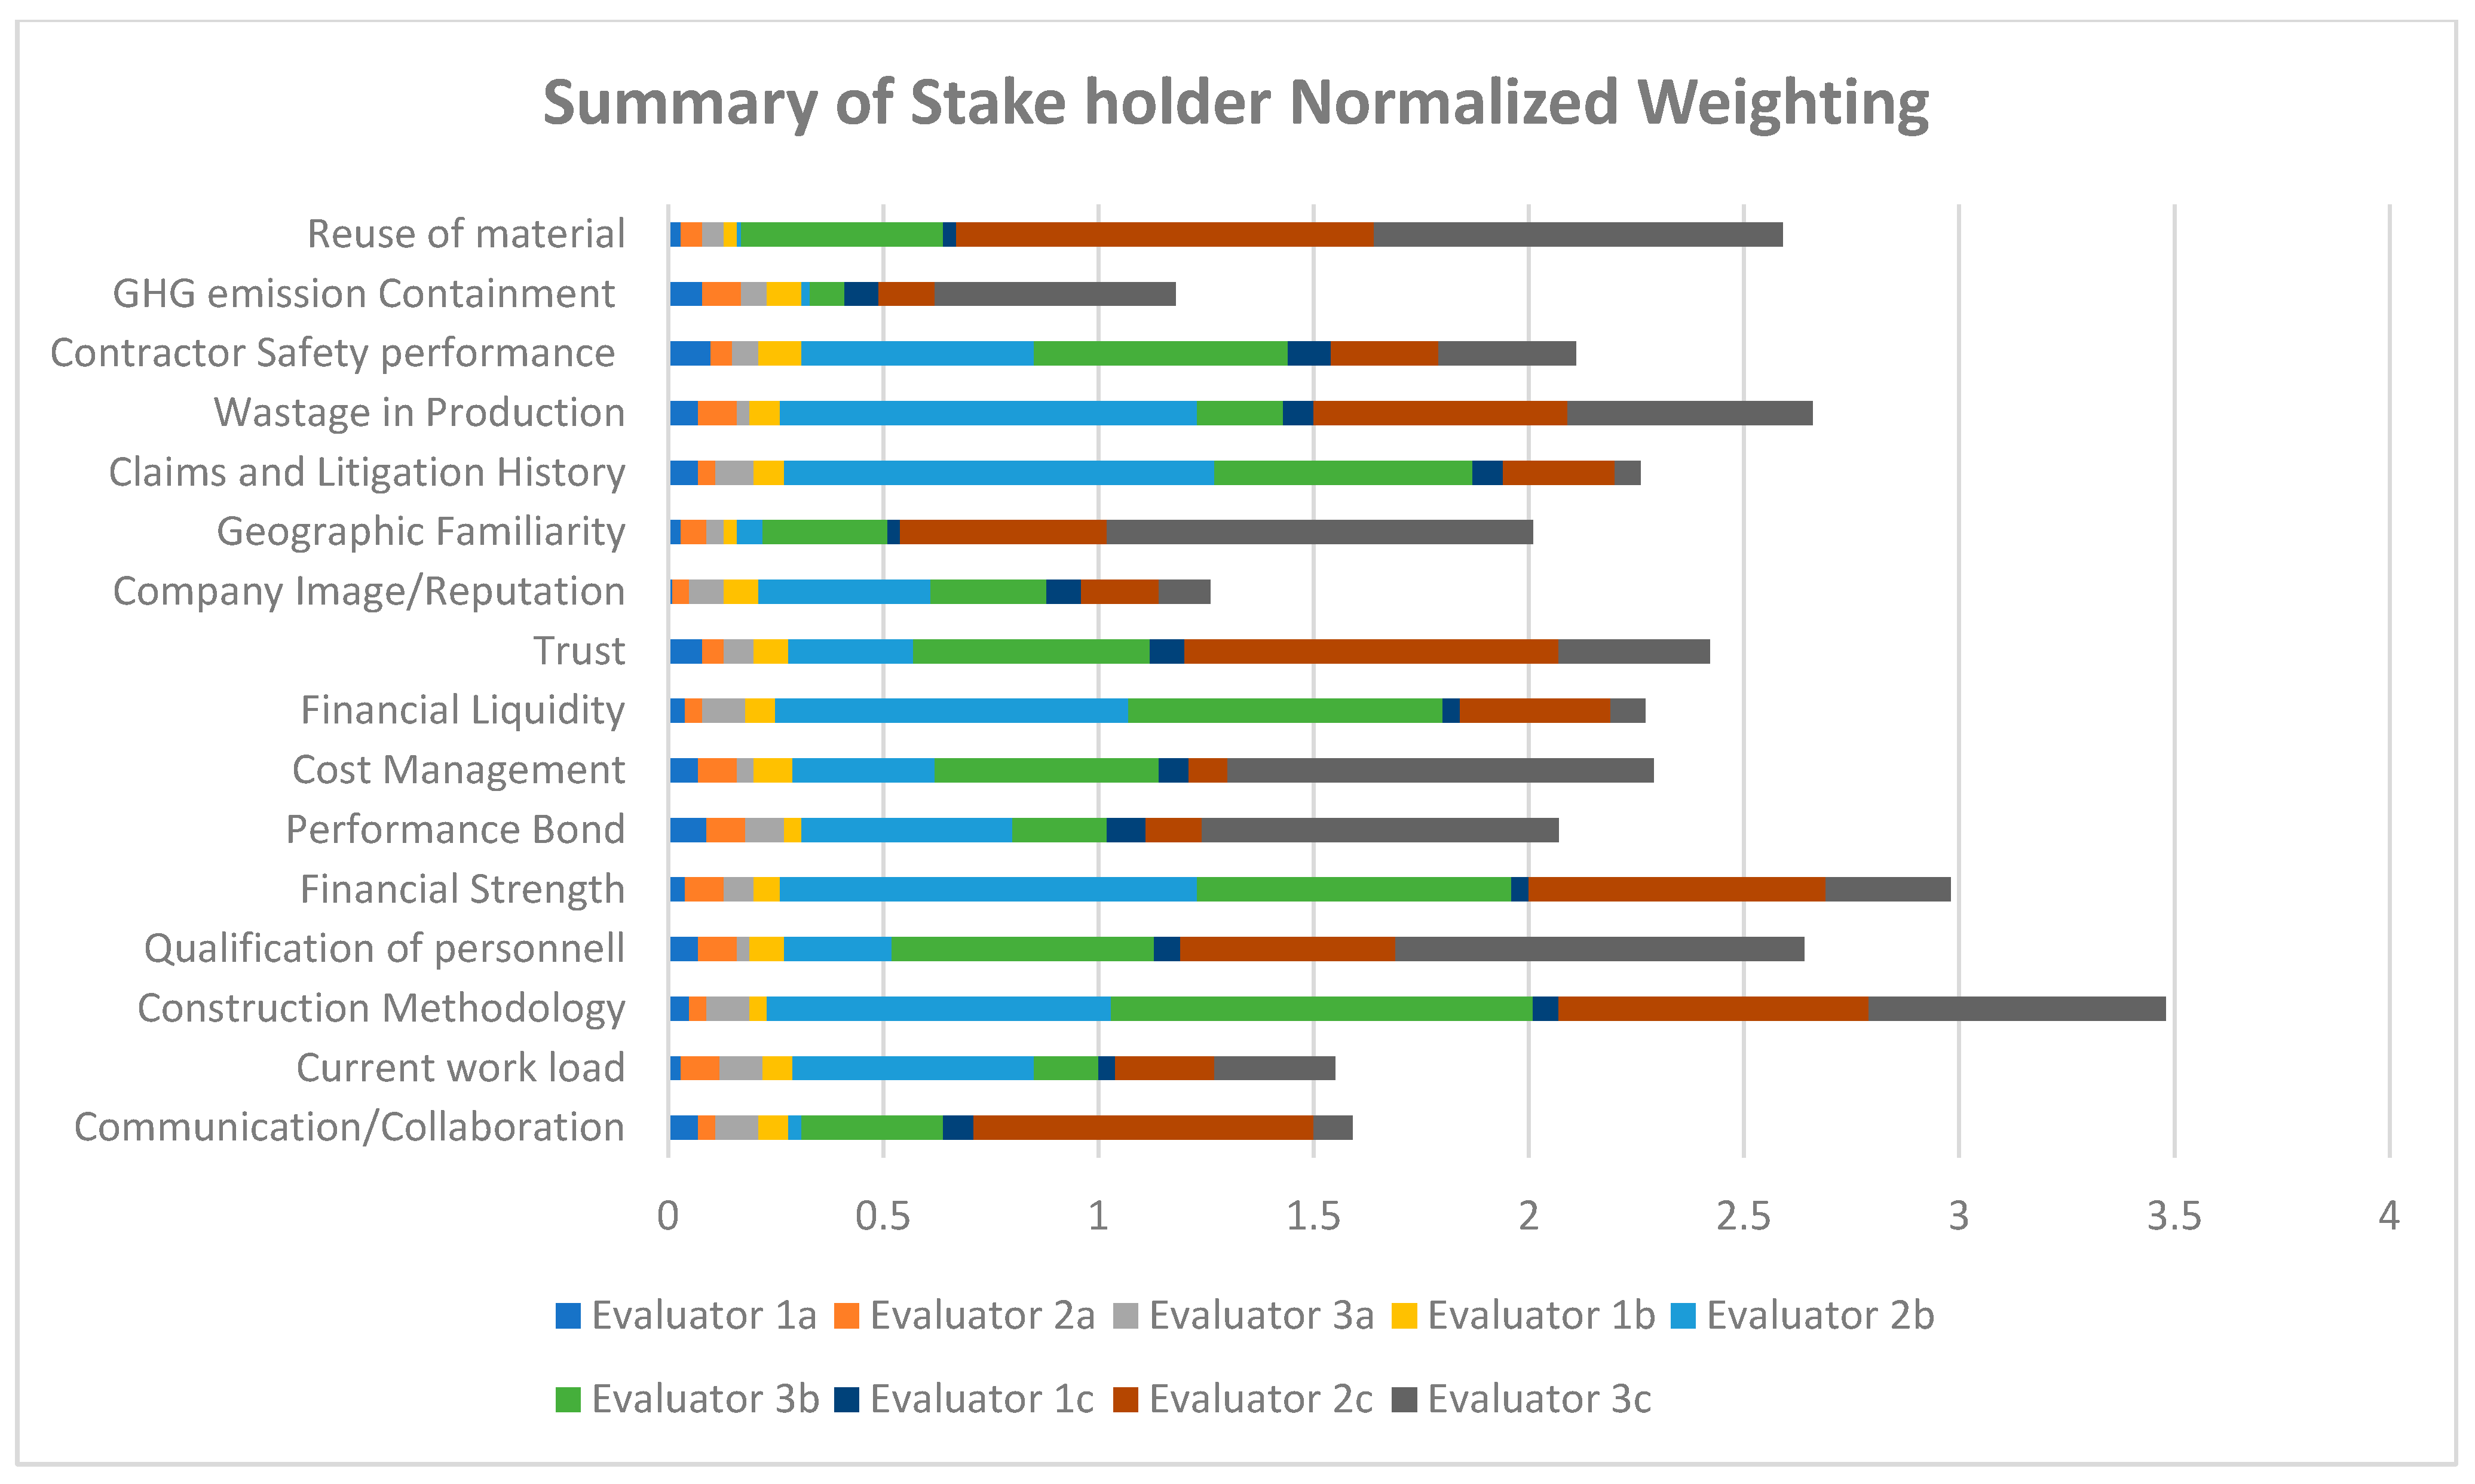
Because the comparison matrix reflects individual inputs, fuzzified normalized weights vary across evaluators.
Figure 9 summarizes and visualizes the overall importance and between-rater variation. Across stakeholders, current workload, construction methodology, financial strength, personnel qualification, and material reuse emerge as the dominant drivers of contractor selection, whereas reputation, safety performance, and GHG emission control receive comparatively lower emphasis.
Step 9. Similarly, Steps 1 to 8 were repeated for Evaluator 2 and Evaluator 3, respectively. The combined result of the stakeholders of Team 3 is thus obtained and shown in
Table 20.
Step 10. Similar analysis was performed on the user inputs from Teams 1 and 2 to rank the alternatives. All the results are compiled in
Table 21 below.
4.7. Fuzzy VIKOR Analysis
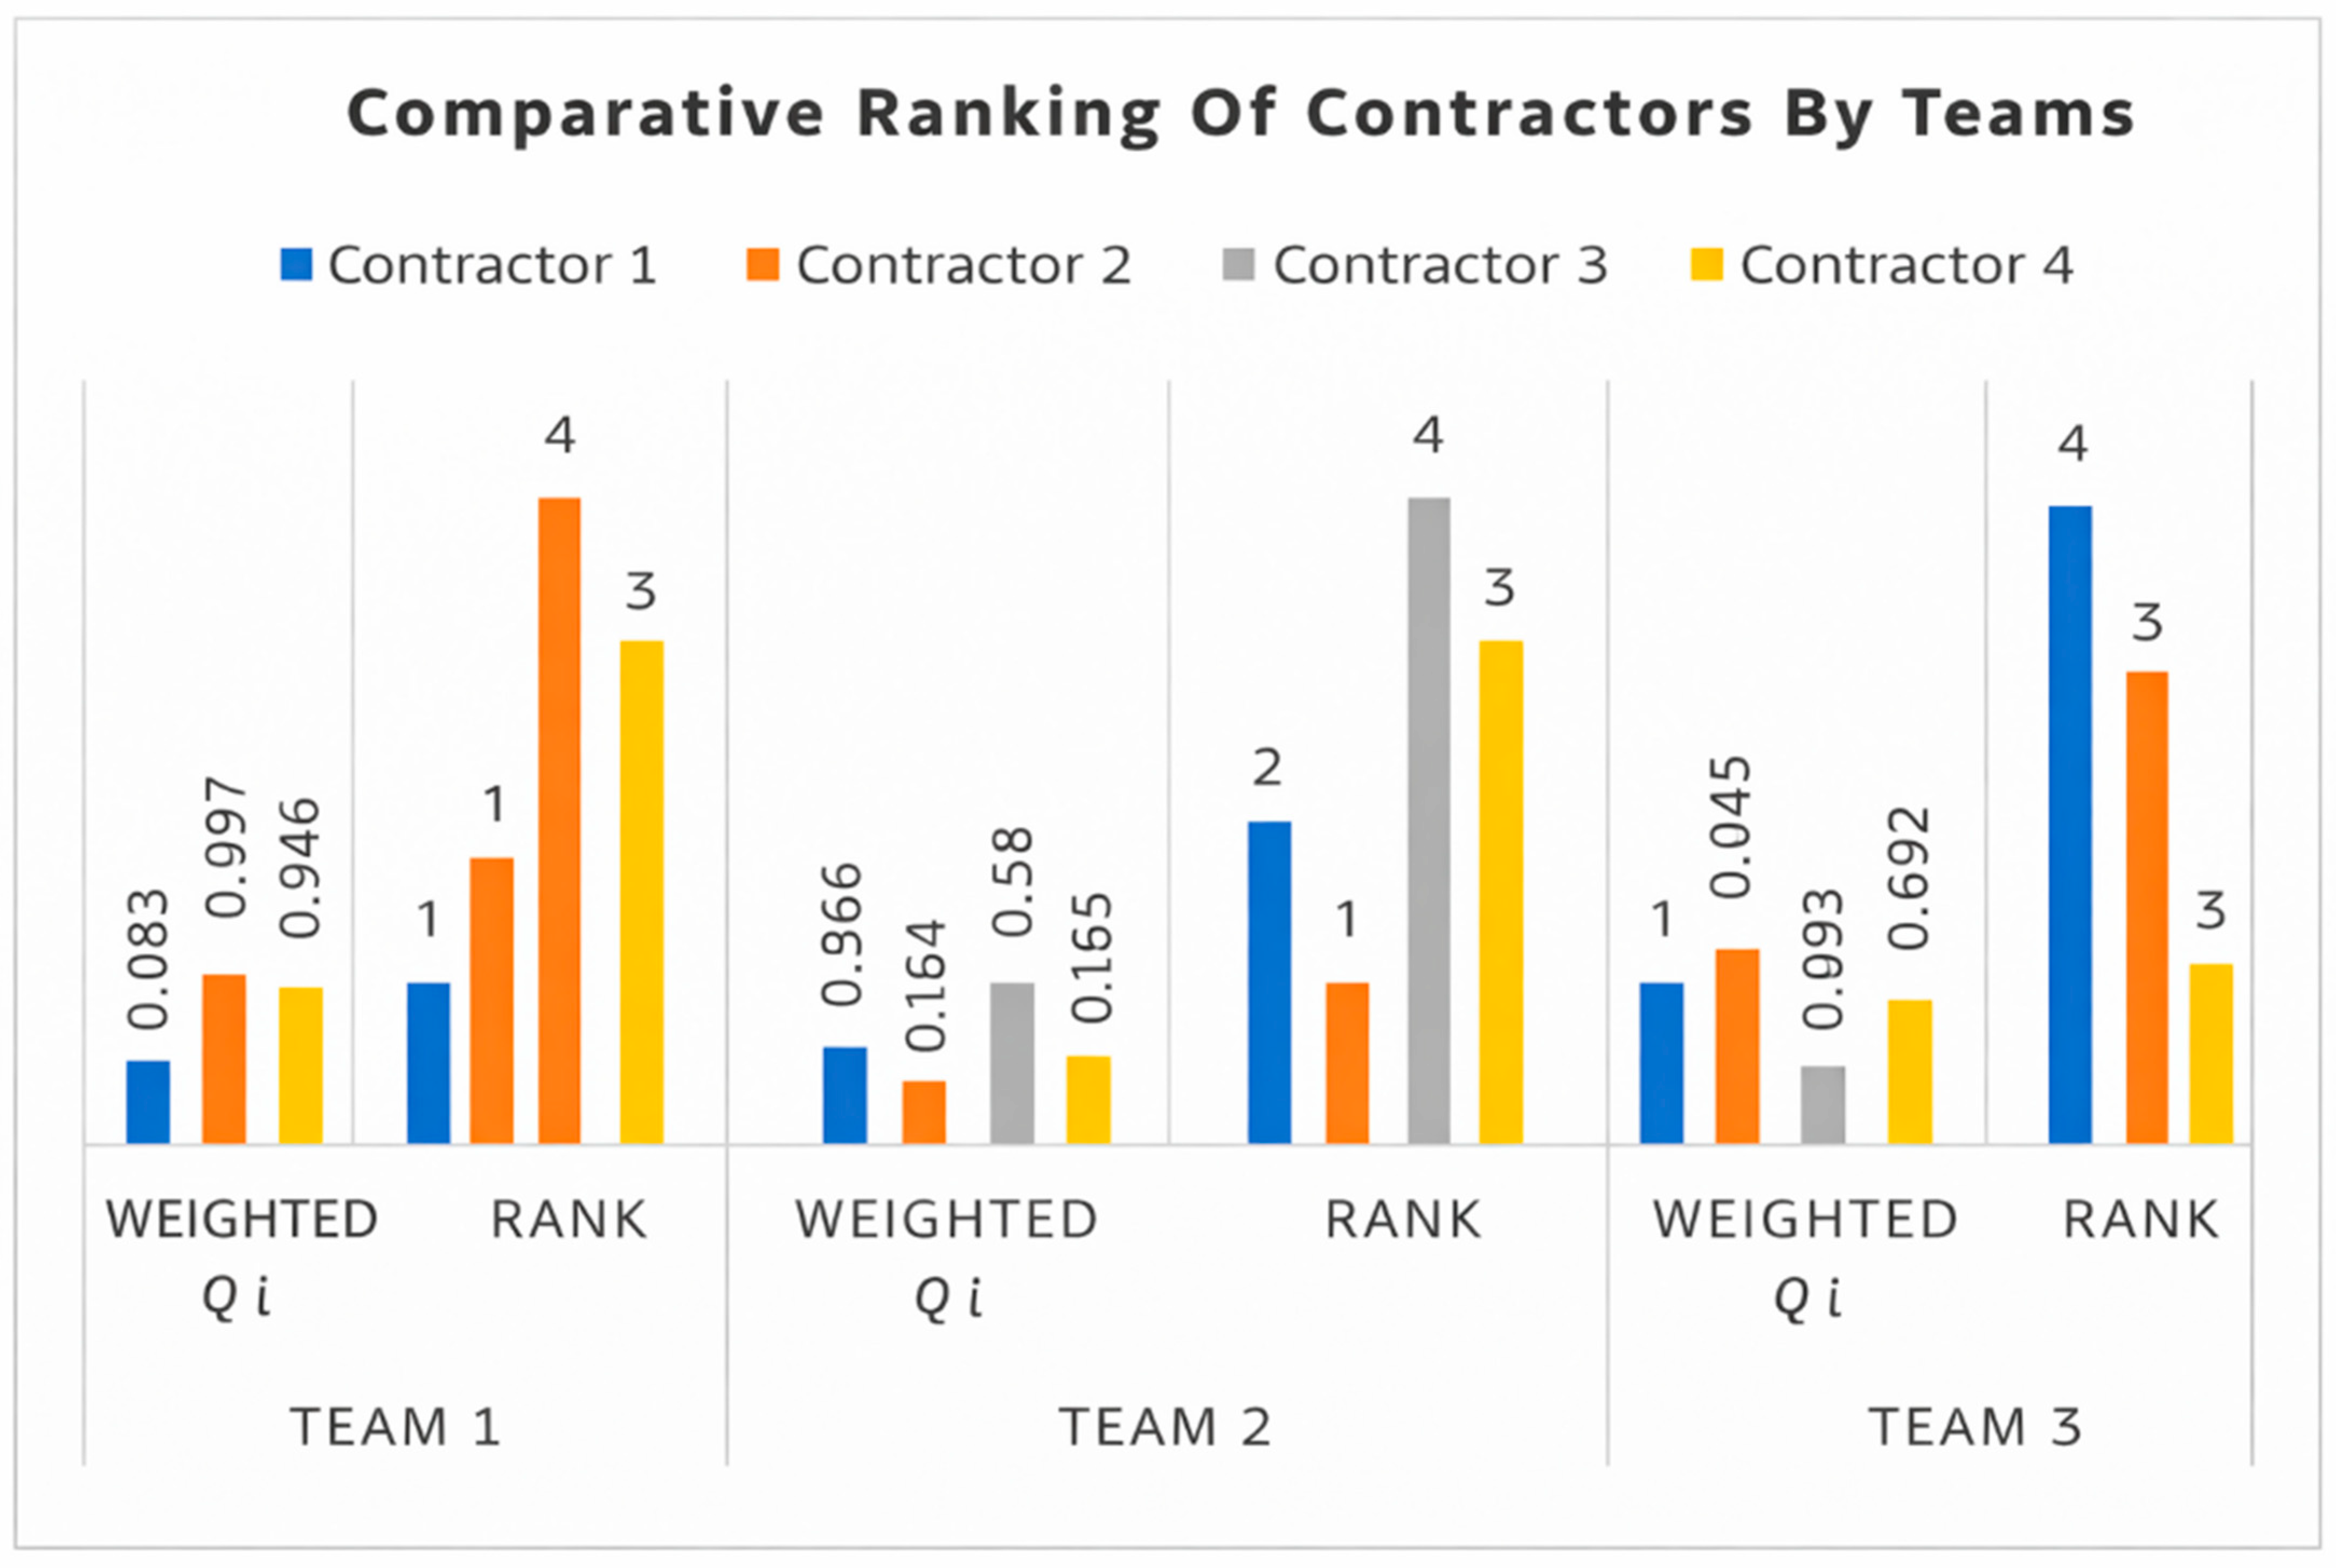
Table 21 and
Figure 10 present the comparative ranking of contractors based on the weighted Fuzzy VIKOR index (Qi) calculated from evaluations by three distinct assessment teams. Contractor 2 emerged as the most favorable candidate, consistently ranking first, second, and third across all evaluation teams with the lowest Qi values (Team 1: 0.0342; Team 2: 0.199; Team 3: 0.845), indicating strong alignment with sustainability objectives and minimal deviation from the ideal solution. Contractor 1 and Contractor 3 exhibited inconsistent rankings, reflecting varied sustainability performance perceptions among evaluators. Contractor 4 displayed intermediate performance stability but never achieved the highest ranking, indicating moderate suitability.
4.8. Digital Implementation of Contractor Evaluation
To enhance decision-making accuracy in contractor selection within Integrated Project Delivery (IPD) environments, this study introduces a Digital Decision Support System (DSS) that integrates the Fuzzy Analytic Hierarchy Process (Fuzzy AHP) and Fuzzy VIKOR, implemented in the C programming language.
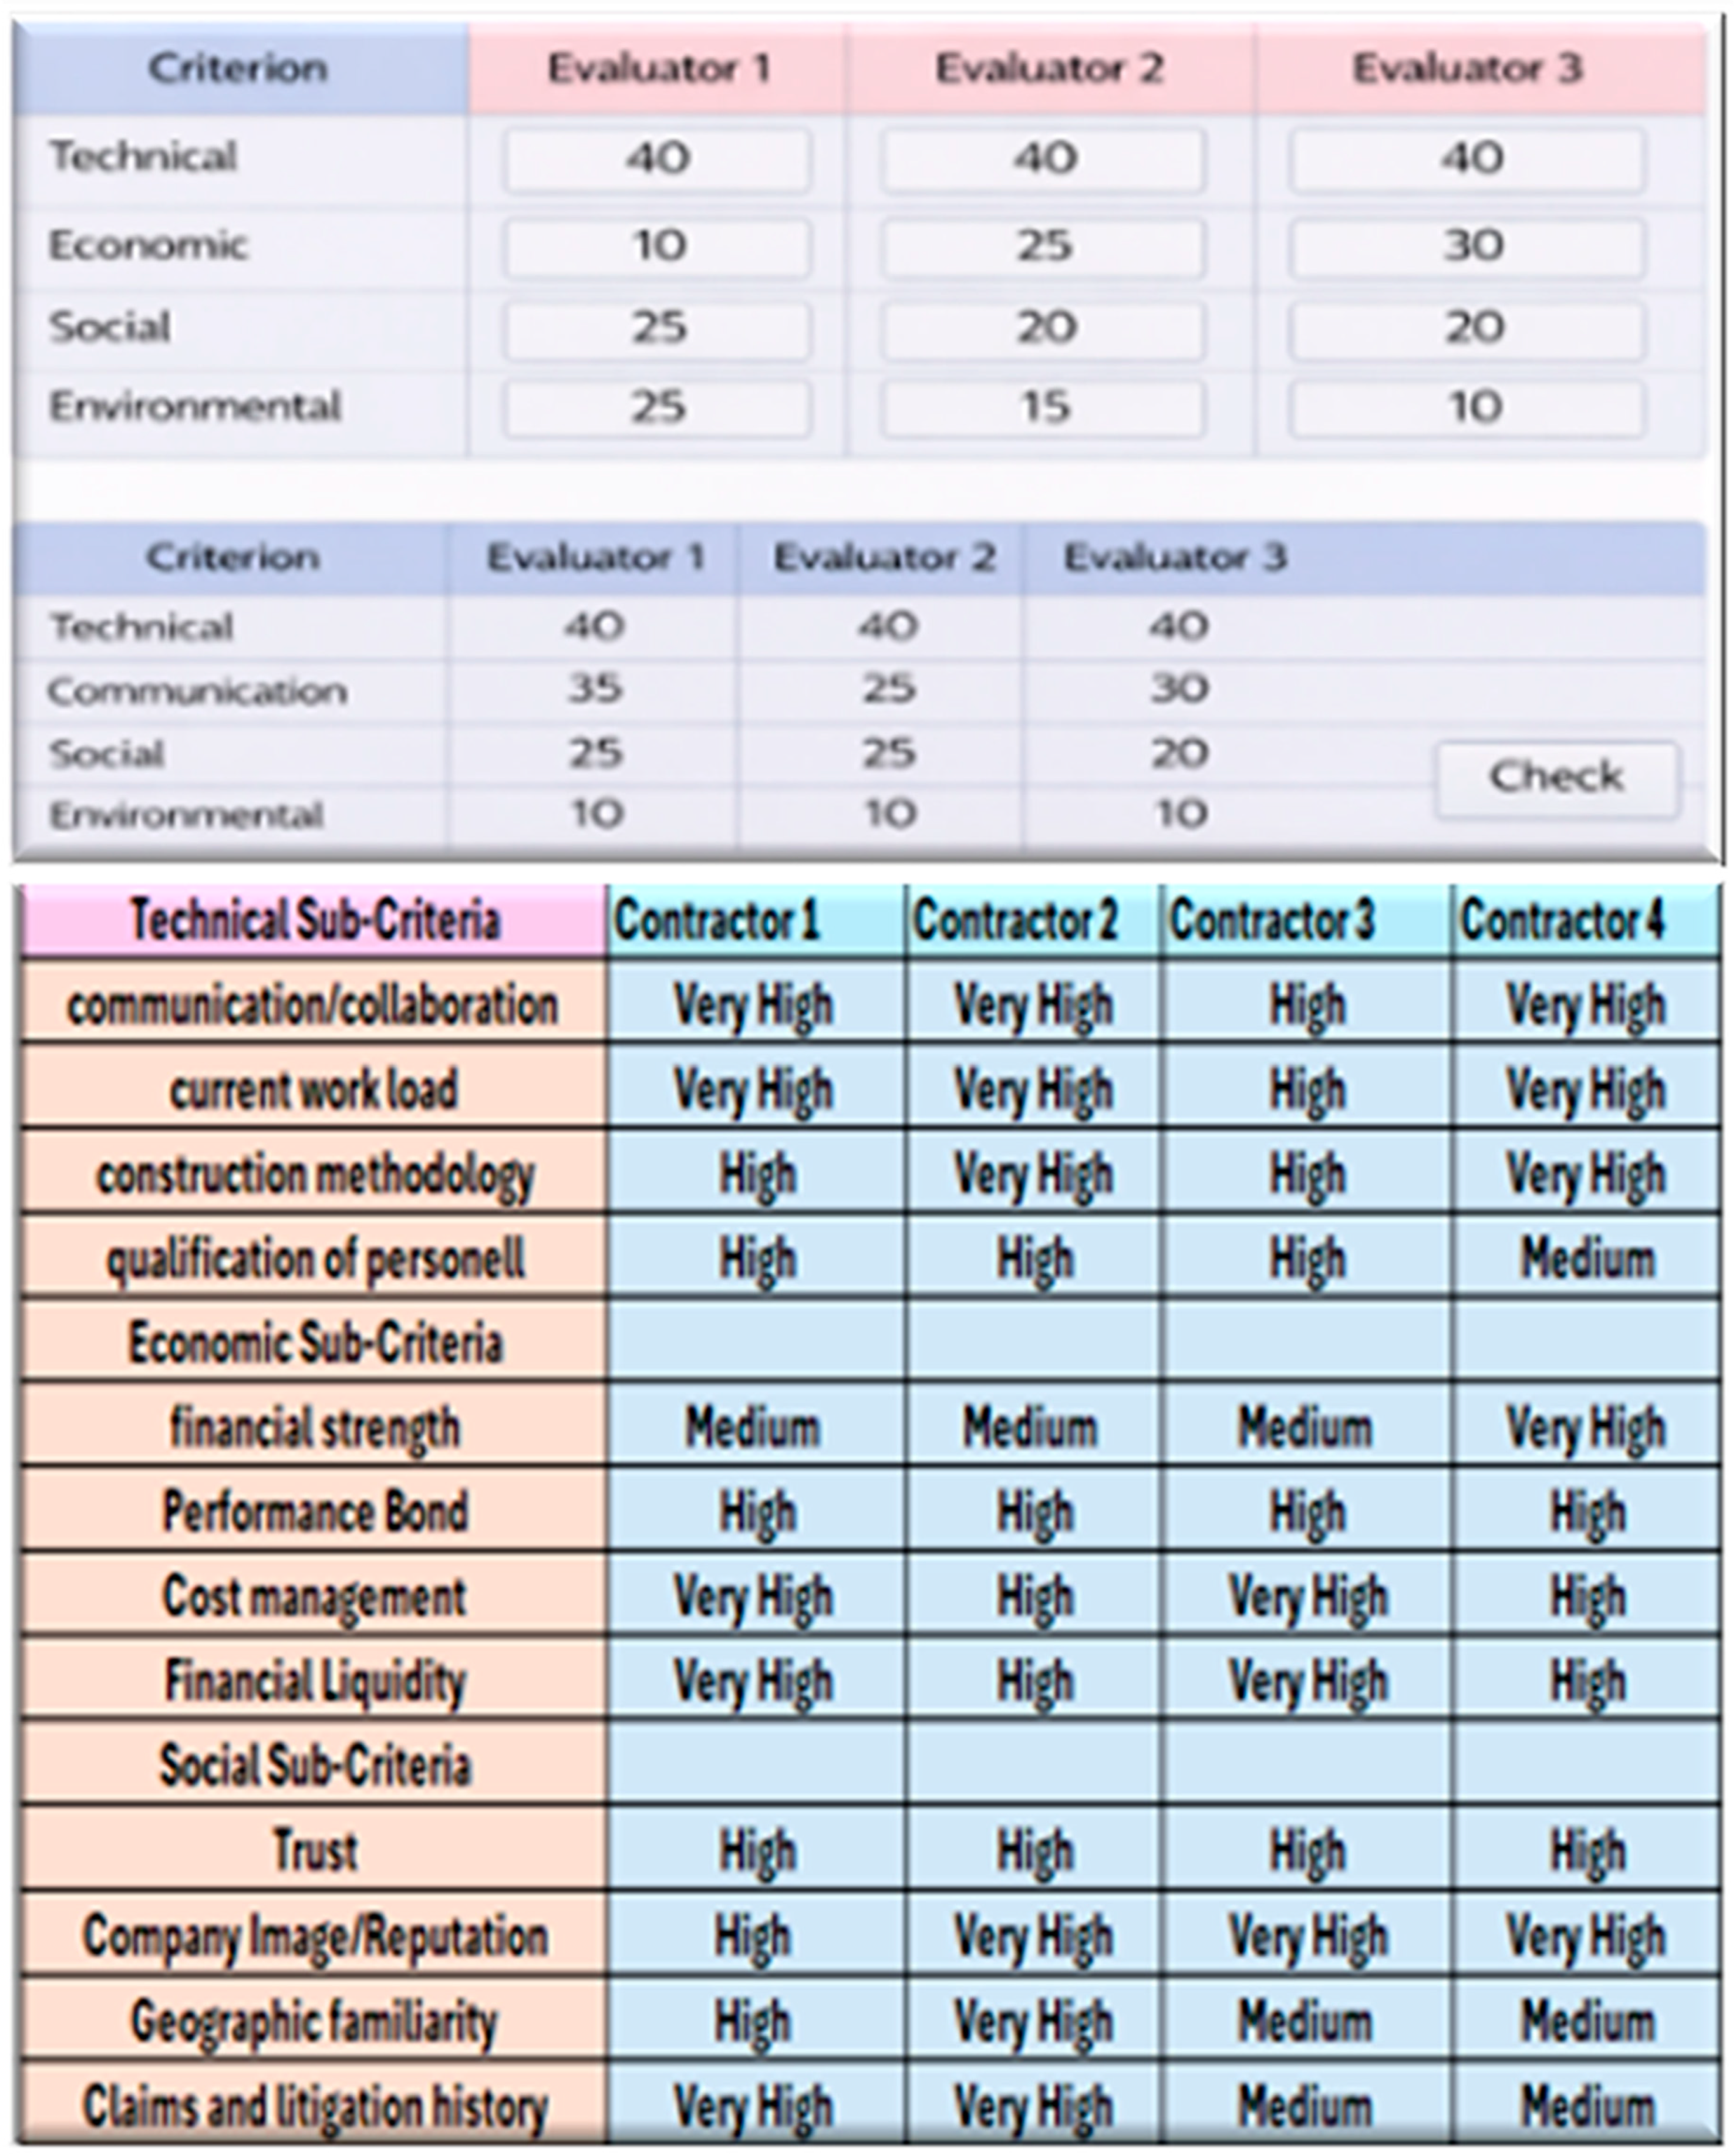
As shown in
Figure 11, the DSS captures two key input stages. It displays the weight-allocation screen where stakeholders assign 0–100 weights to the four main criteria and distribute them across sub-criteria (totals constrained to 100%), structuring priorities across the technical, economic, social, and environmental dimensions with a simple validation step.
Figure 11 presents the evaluator scoring interface, in which Evaluator 1 rates each alternative against every sub-criterion.
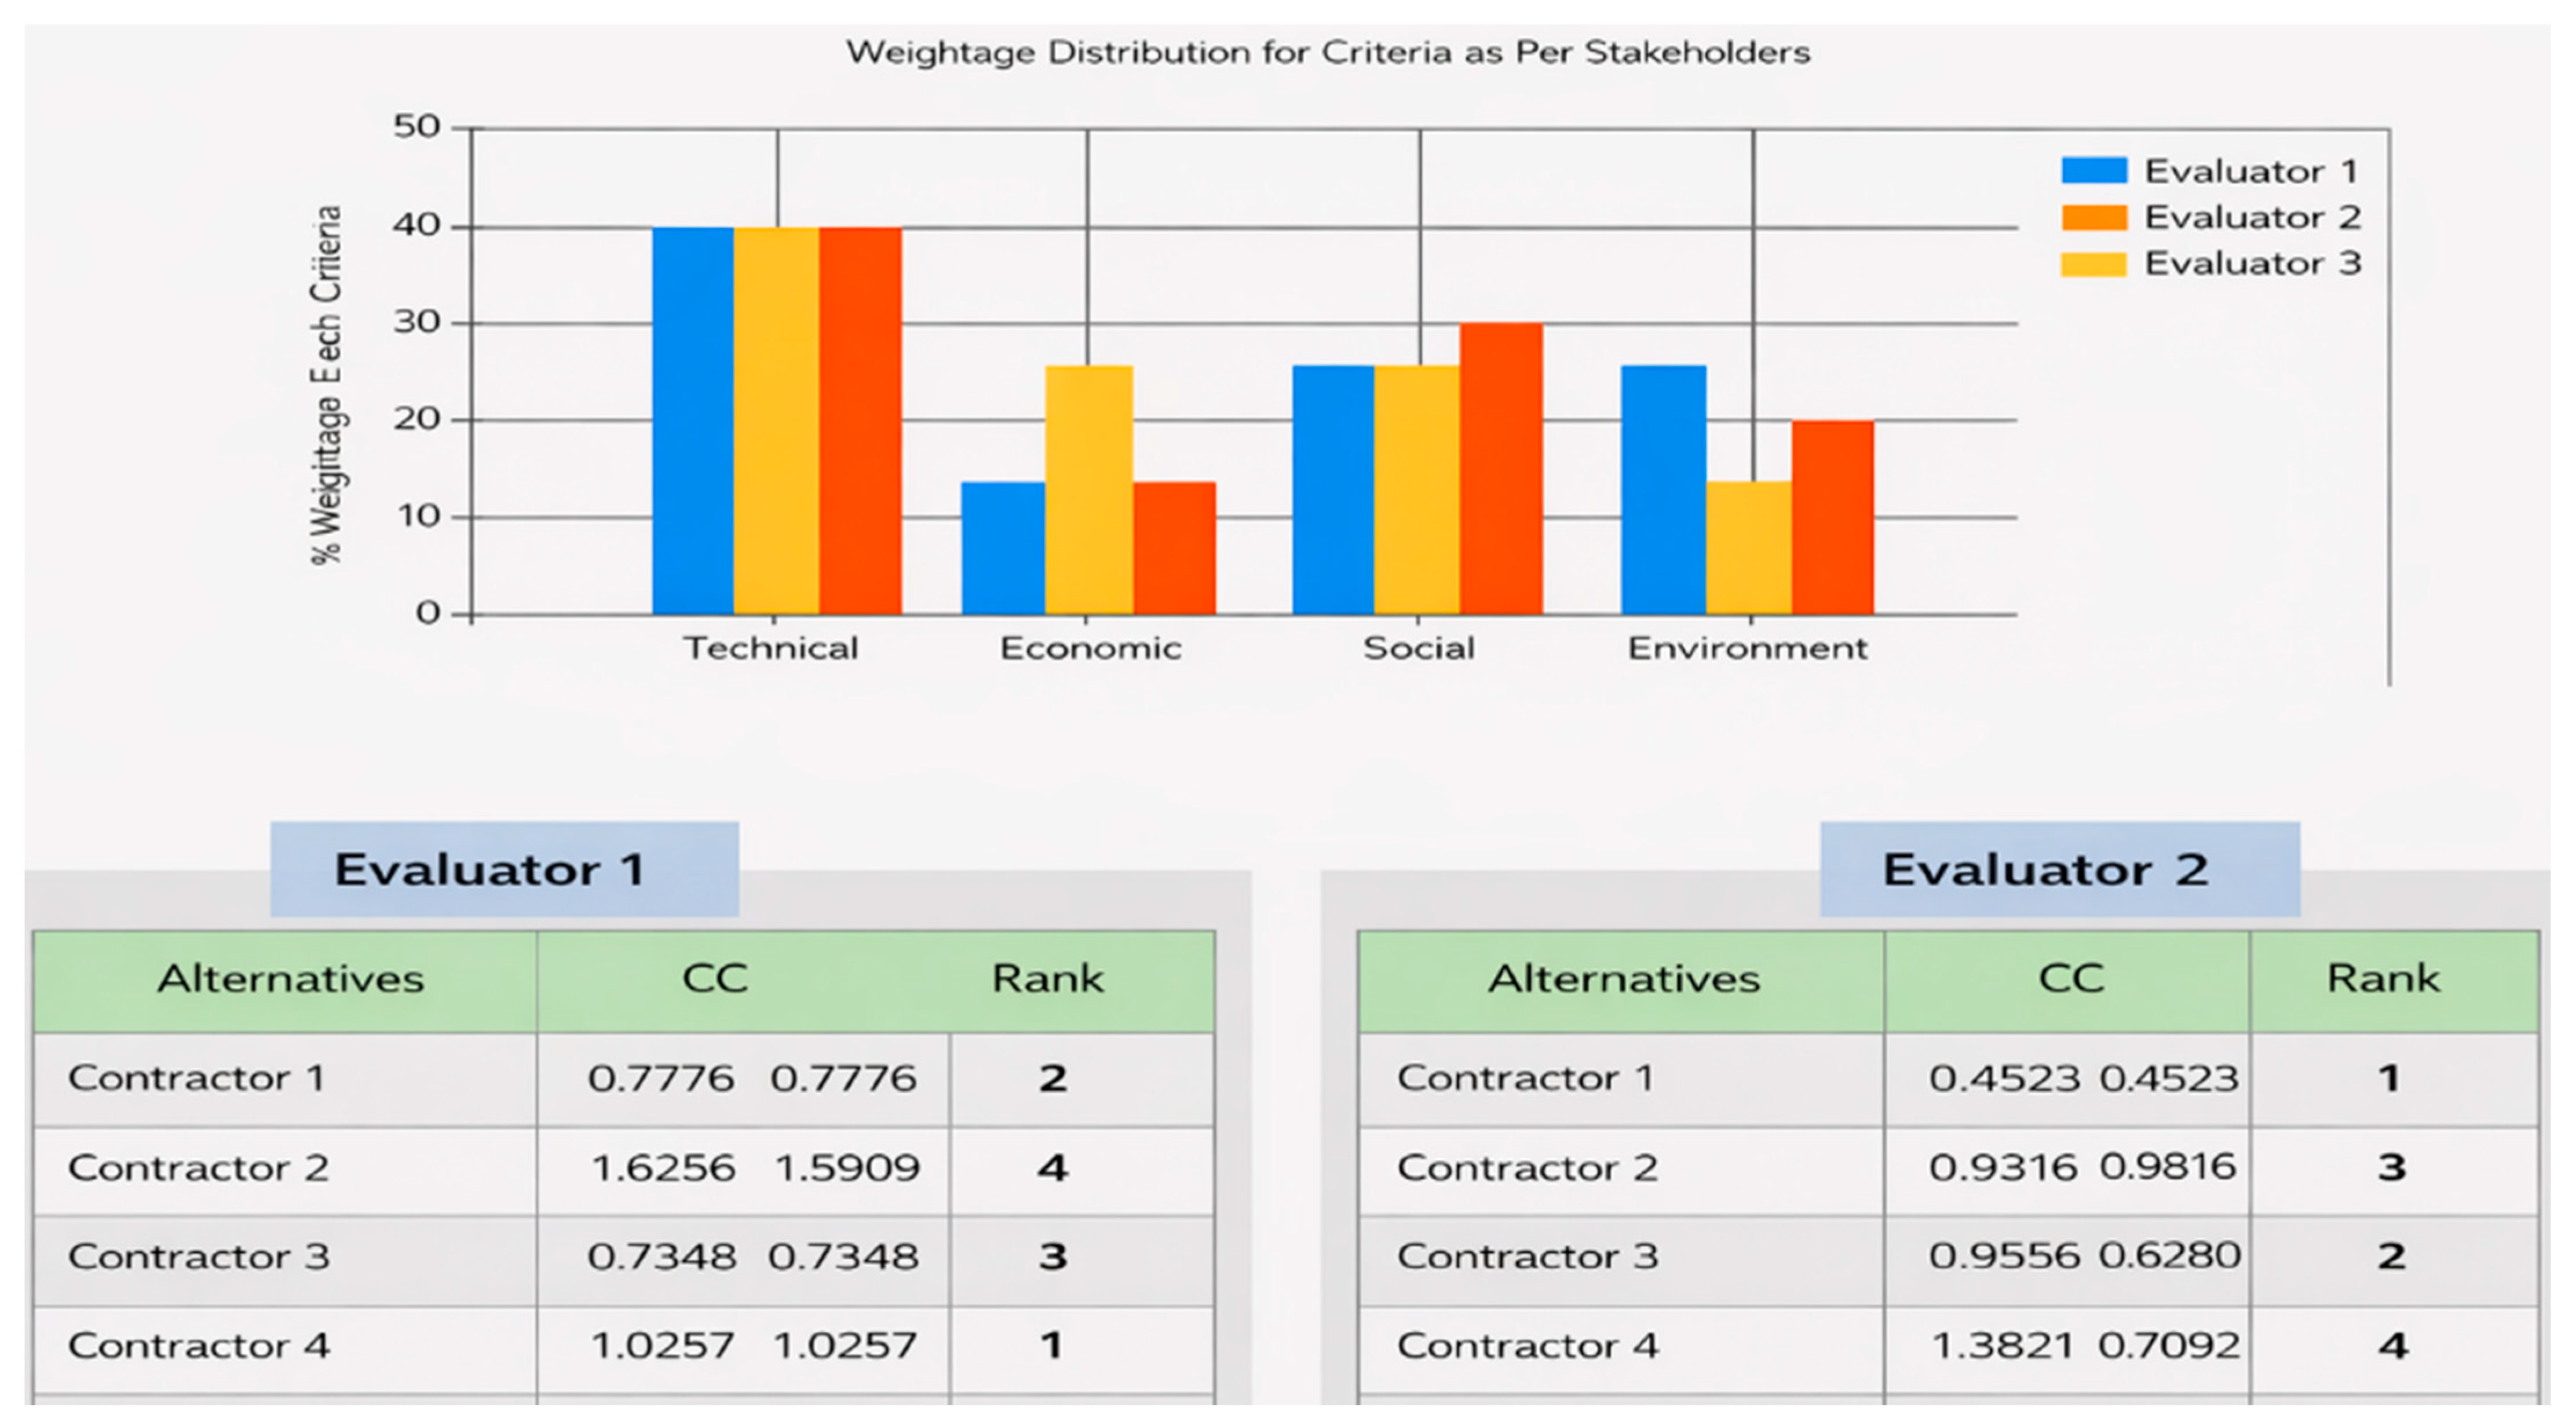
The results dashboard (
Figure 12) synthesizes each evaluator’s criterion weights visualized as a bar chart across the technical, economic, social, and environmental pillars. For every evaluator, a results table lists all alternatives with their computed closeness coefficient (CC) and corresponding rank, while a right-hand control sets evaluator weights (“importance of opinion,” in %). Selecting calculate generates the aggregate ranking, combining evaluator weights with the underlying multi-criteria analysis.
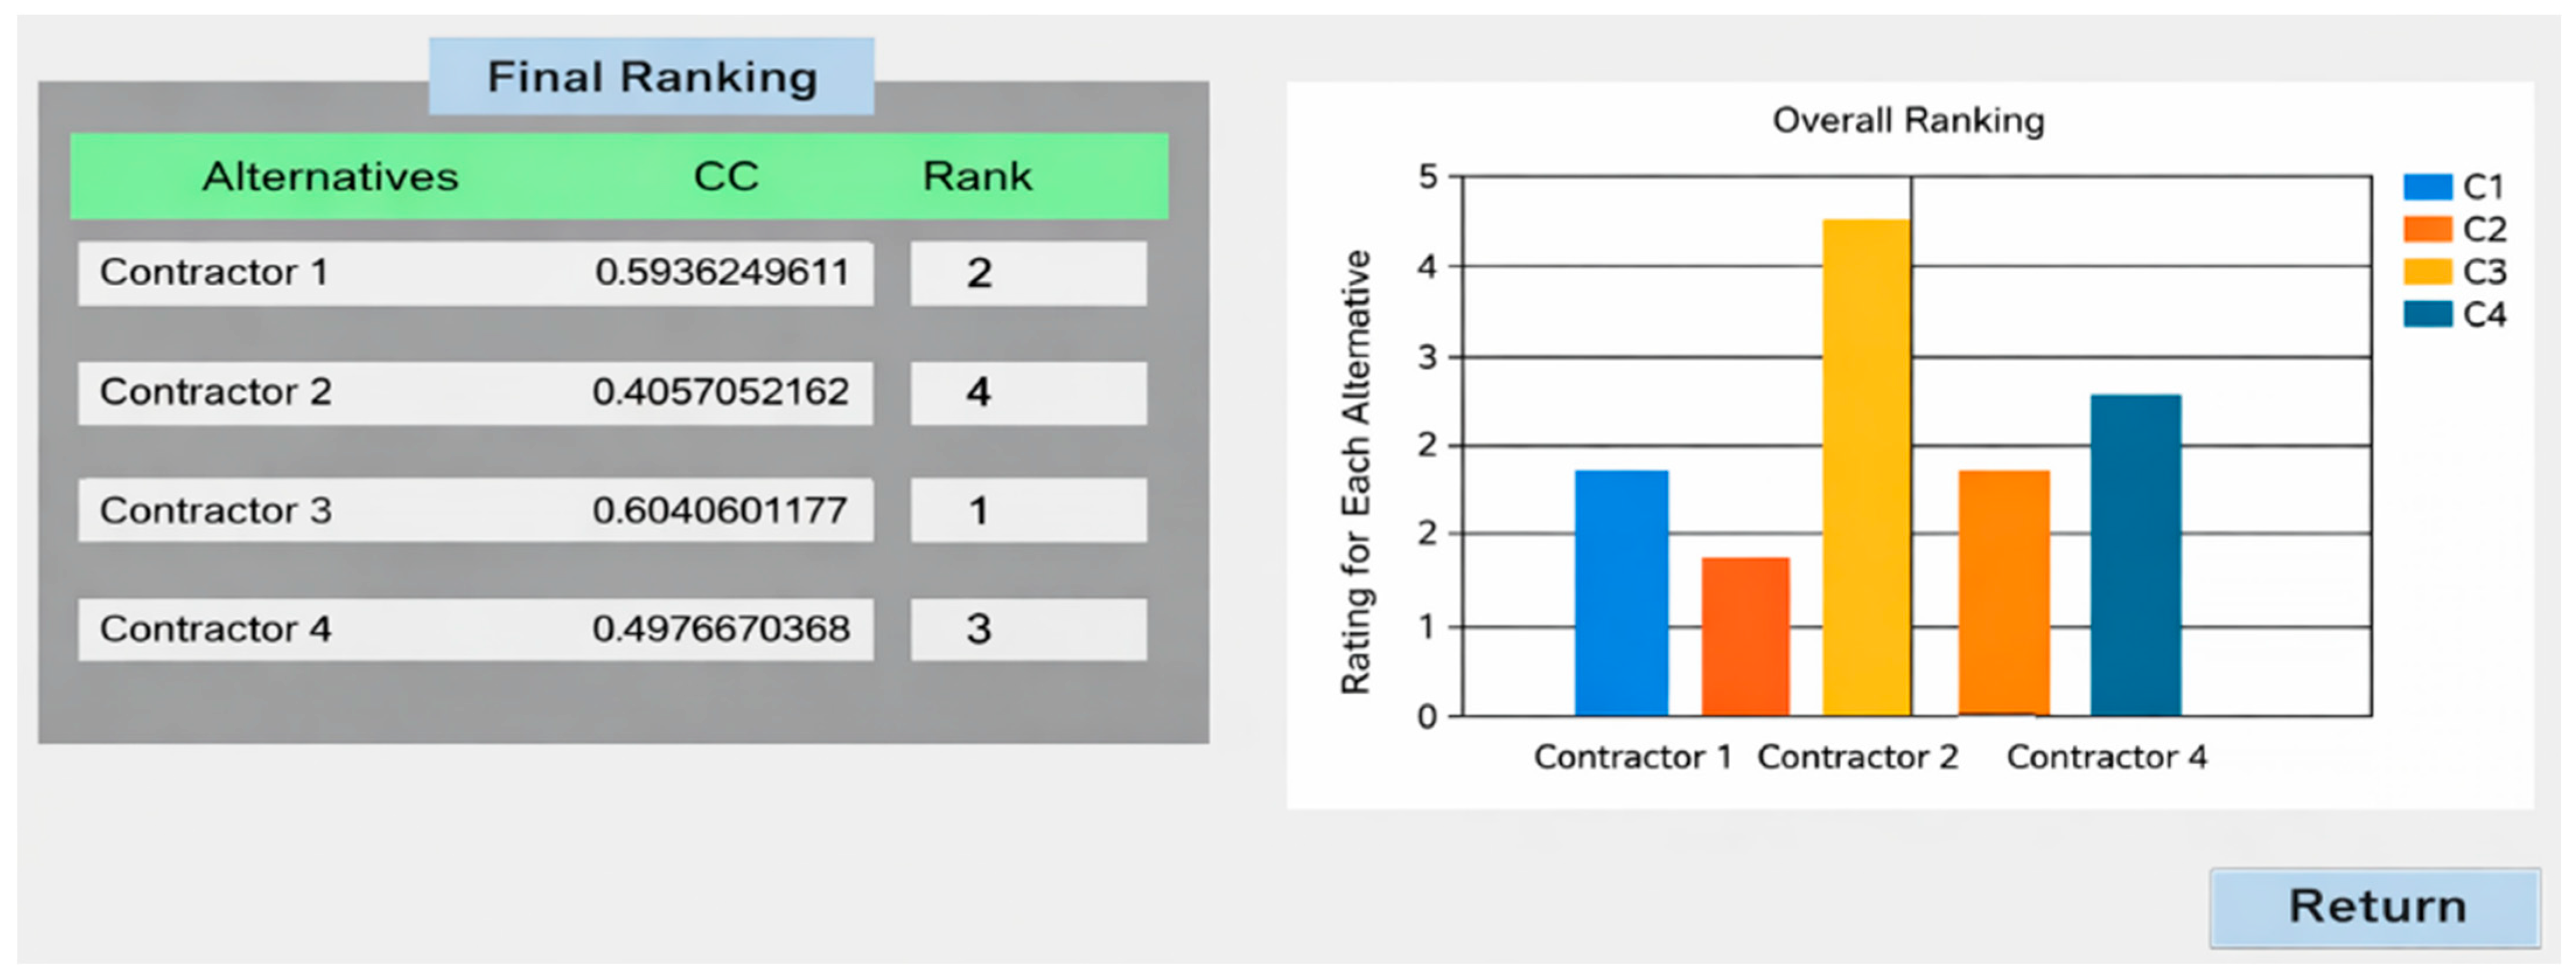
At the final ranking stage, the interface reports each alternative’s closeness coefficient (CC) together with its overall rank. An accompanying bar chart visualizes the aggregated outcomes across alternatives, enabling rapid identification of the preferred option (see
Figure 13).
5. Verification and Validation
5.1. Model Verification and Validation Framework
This chapter outlined the approaches used to verify and validate calculations and the development of the Decision Support System (DSS). The input and output validation of the DSS was conducted based on expert feedback and recommendations, while the verification of calculations and the DSS was carried out using sensitivity analysis.
5.2. Sensitivity Analysis
Sensitivity analysis evaluates how changes in input factors affect a system’s output and helps verify whether the model behaves as intended under varying conditions. In this study, sensitivity analysis was conducted by testing the model across different scenarios to confirm its responsiveness to input changes and the reliability of its results. The multi-criteria Decision Support System (DSS) depends on two main user inputs: criteria weight assignments and preference ratings for ranking alternatives (e.g., “Very High,” “High,” etc.).
5.3. Criteria Weightage Sensitivity
The sensitivity of user inputs and criteria weights was assessed by evaluating four scenarios, each applying a different set of weights, as shown in
Table 22. In each scenario, one sustainability pillar was given higher weight relative to the others, and the resulting impact on the
values and alternative rankings was examined. As reported and illustrated in
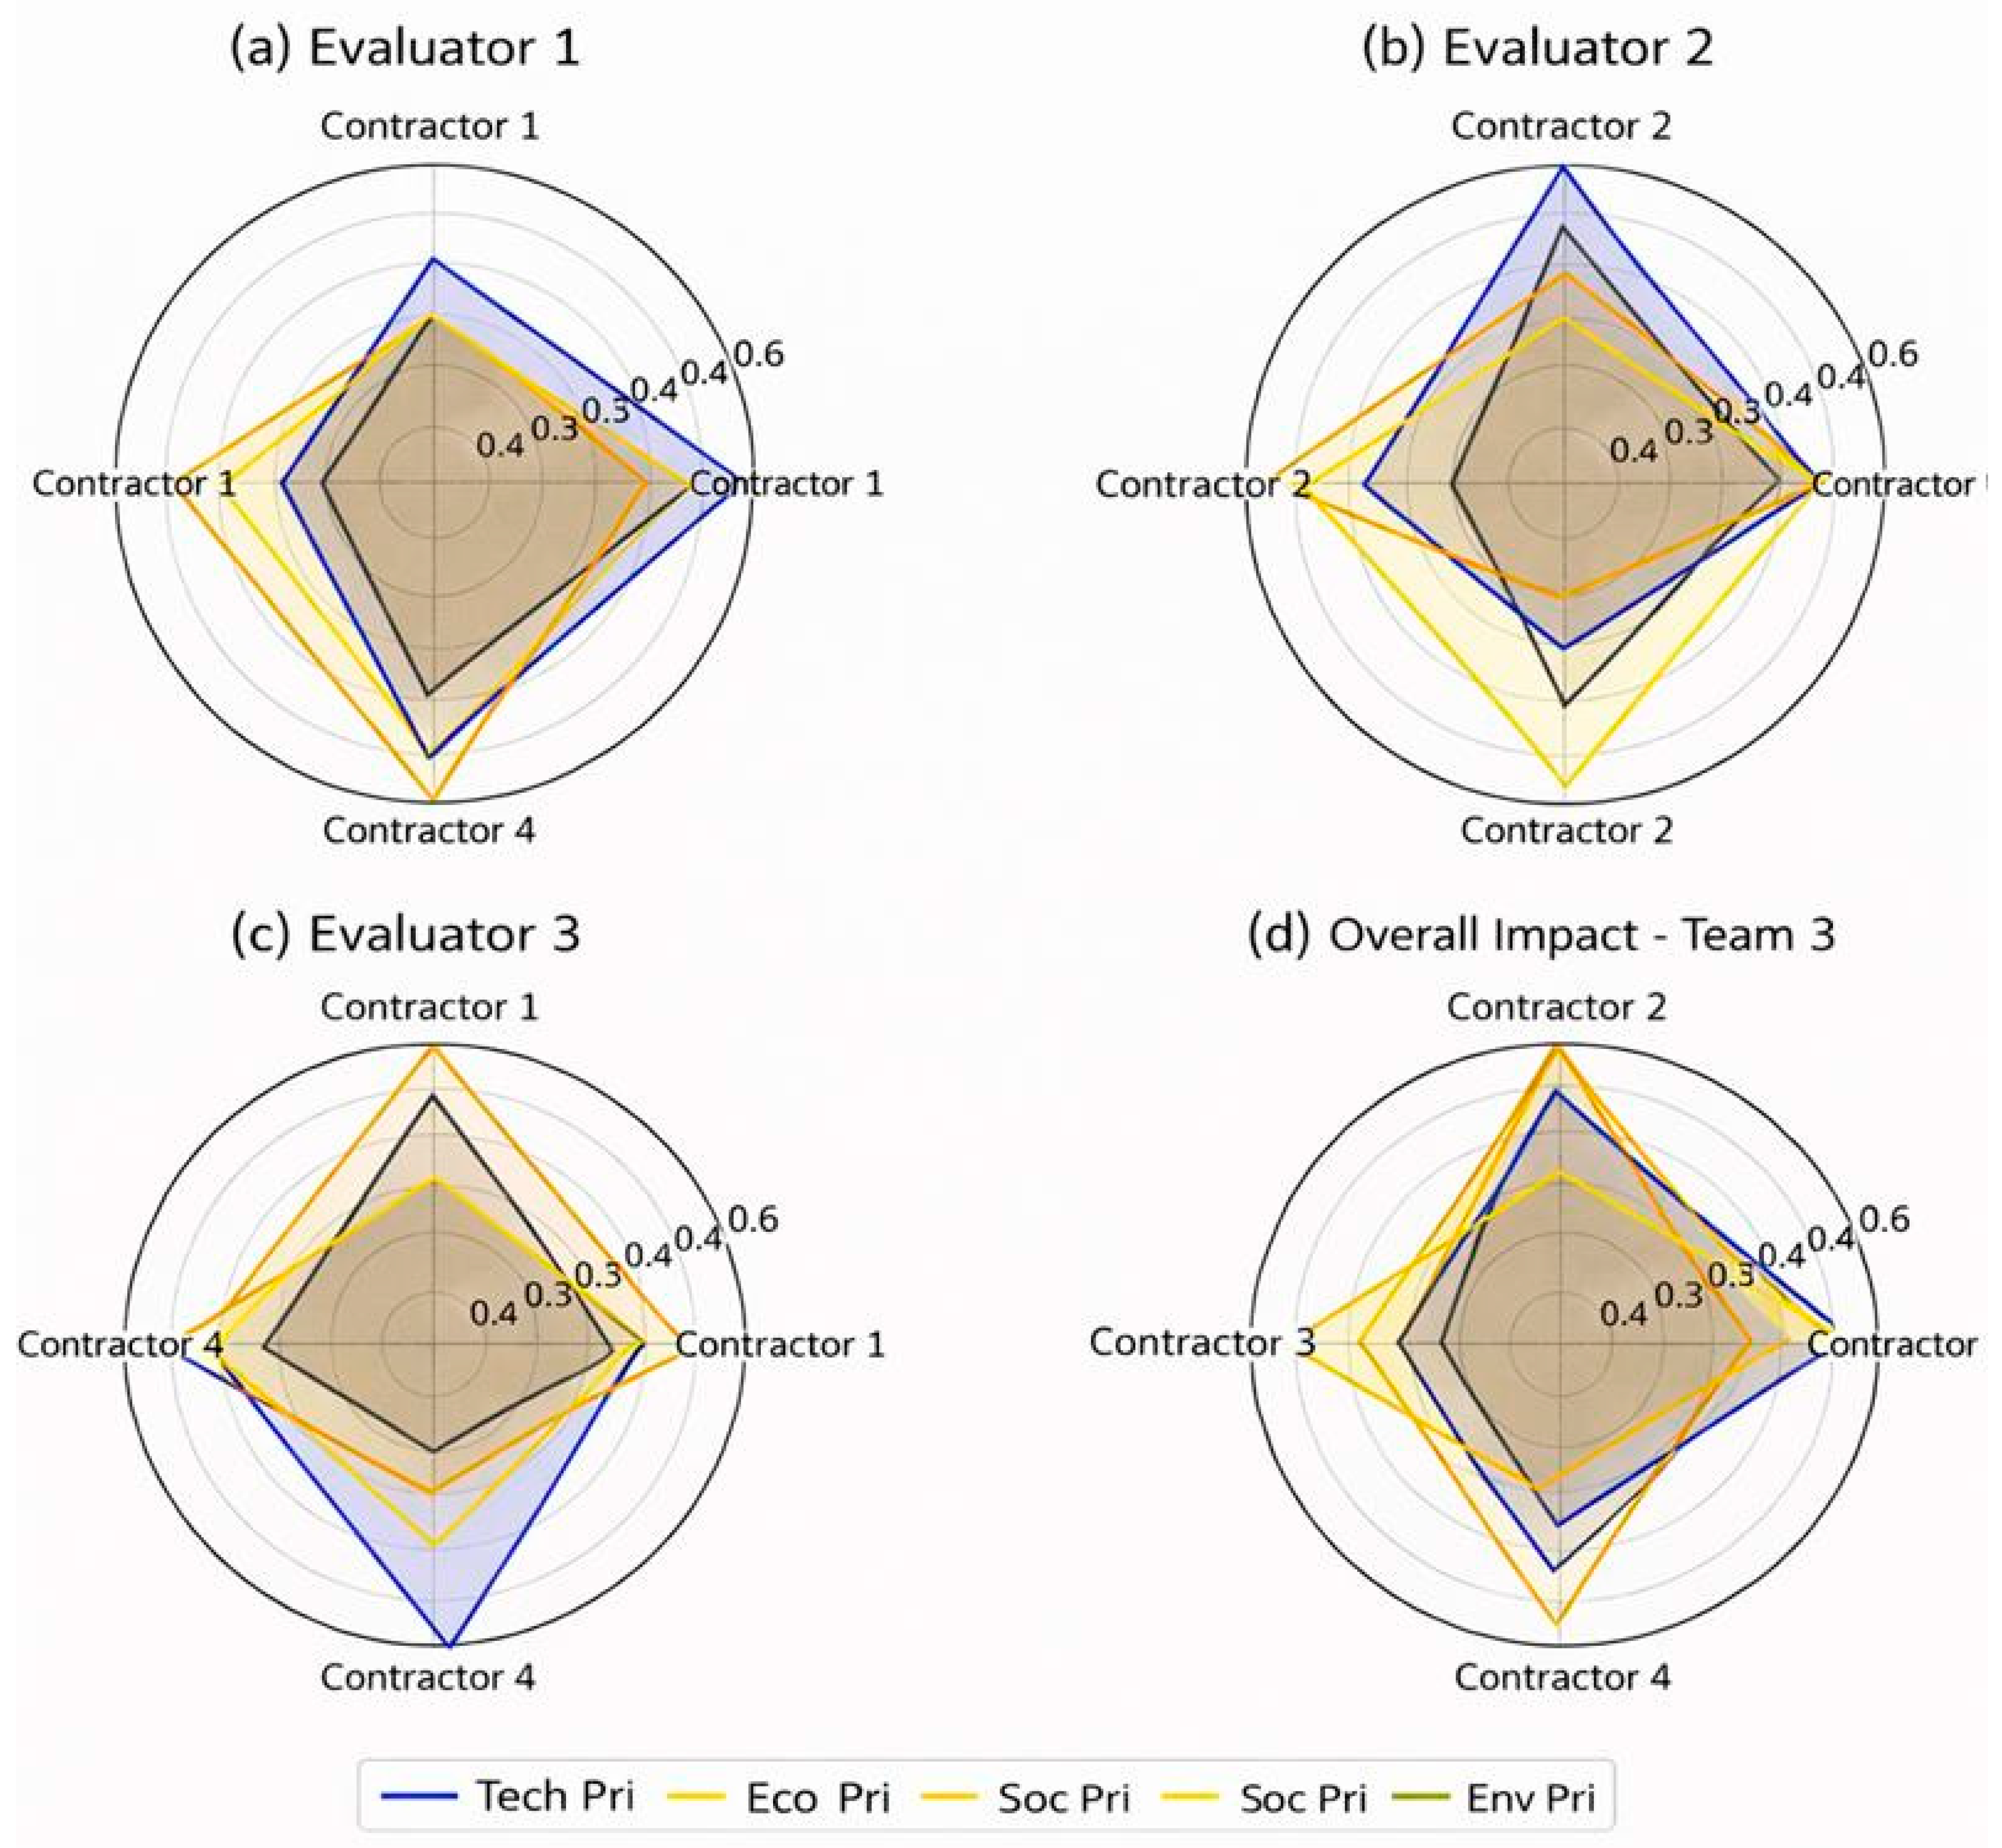
Figure 14, adjusting the pillar weights produced notable changes in the
values, demonstrating that increasing the priority of a specific sustainability dimension leads to a corresponding shift in the ranking of alternatives.
In
Table 22, the criteria within each sustainability pillar were selectively emphasized by assigning four criteria a weight of 0.10 and weighting the remaining criteria at 0.05. This variation was designed to examine how shifting sustainability priorities influences decision outcomes while keeping user preferences constant across all scenarios. Using the Fuzzy VIKOR method, alternatives that aligned more closely with the highly weighted criteria achieved higher scores, whereas those aligned with less emphasized criteria ranked lower. The resulting outputs, presented in
Table 23, demonstrate how changes in criteria weight distribution alone can significantly alter the evaluation and ranking of alternatives.
5.4. Sensitivity Analysis of Preference-Based Evaluation of Alternatives
Table 23 summarizes the results for Contractors C1–C4 across the four scenarios, presenting evaluator-level scores, aggregated totals, and the resulting ranks to show how contractor standing changes with different sustainability priorities.
Figure 14 illustrates these outcomes using a radar chart that breaks performance into the technical, economic, social, and environmental pillars for each evaluator and for the overall team. Larger radii indicate stronger performance, while balanced or skewed polygon shapes reveal capability symmetry or trade-offs; alignment across evaluator polygons reflects consensus, whereas variation indicates differing assessments. The “Overall Impact Team 3” polygon integrates these perspectives and accounts for the final rankings reported in
Table 23.
5.5. Combined Input Table for All Scenarios
Table 24 summarizes the evaluator judgments that feed the DSS by mapping each contractor’s performance to linguistic ratings with corresponding numeric bands (e.g.,
Very High = 7–10, High = 5–8, Medium = 3–6, Low = 1–4). The table is organized by scenario and criteria category (technical, economic, social, environmental) and distinguishes beneficial versus cost criteria (where a “Low” rating indicates better performance). These calibrated inputs are subsequently normalized, weighted, and aggregated within the DSS to produce the pillar scores visualized in
Figure 14 (radar chart) and the overall scores and ranks reported in
Table 23.
5.6. Combined CCi Results Across All Scenarios
The table below presents a consolidated view of the Closeness Coefficient Index (CCi) values and ranking results for all four scenarios used in validating the Decision Support System (DSS) for sustainable contractor selection. This unified table facilitates a comparative analysis of how each alternative performs across varying preference conditions.
Table 25 consolidates the Closeness Coefficient Index (CCi), the proximity of each alternative to the ideal solution, and the induced rank for all four scenarios, providing a single view of performance under different preference settings. Higher CCi values indicate stronger overall performance, and the “Best/Worst Alternative” ticks highlight the scenario winners and laggards at a glance. By aligning the four scenarios vertically, the table enables cross-scenario stability checks (e.g., whether a contractor remains competitive as priorities shift), makes ties or near-ties visible where CCi values converge (a cue for managerial tie-break rules), and supports decision rationale by linking rank movements to scenario intent. In sum,
Table 25 serves as the validation summary for the DSS, demonstrating how the same set of bidders responds to varying weight structures and identifying both scenario-optimal and robust choices across contexts.
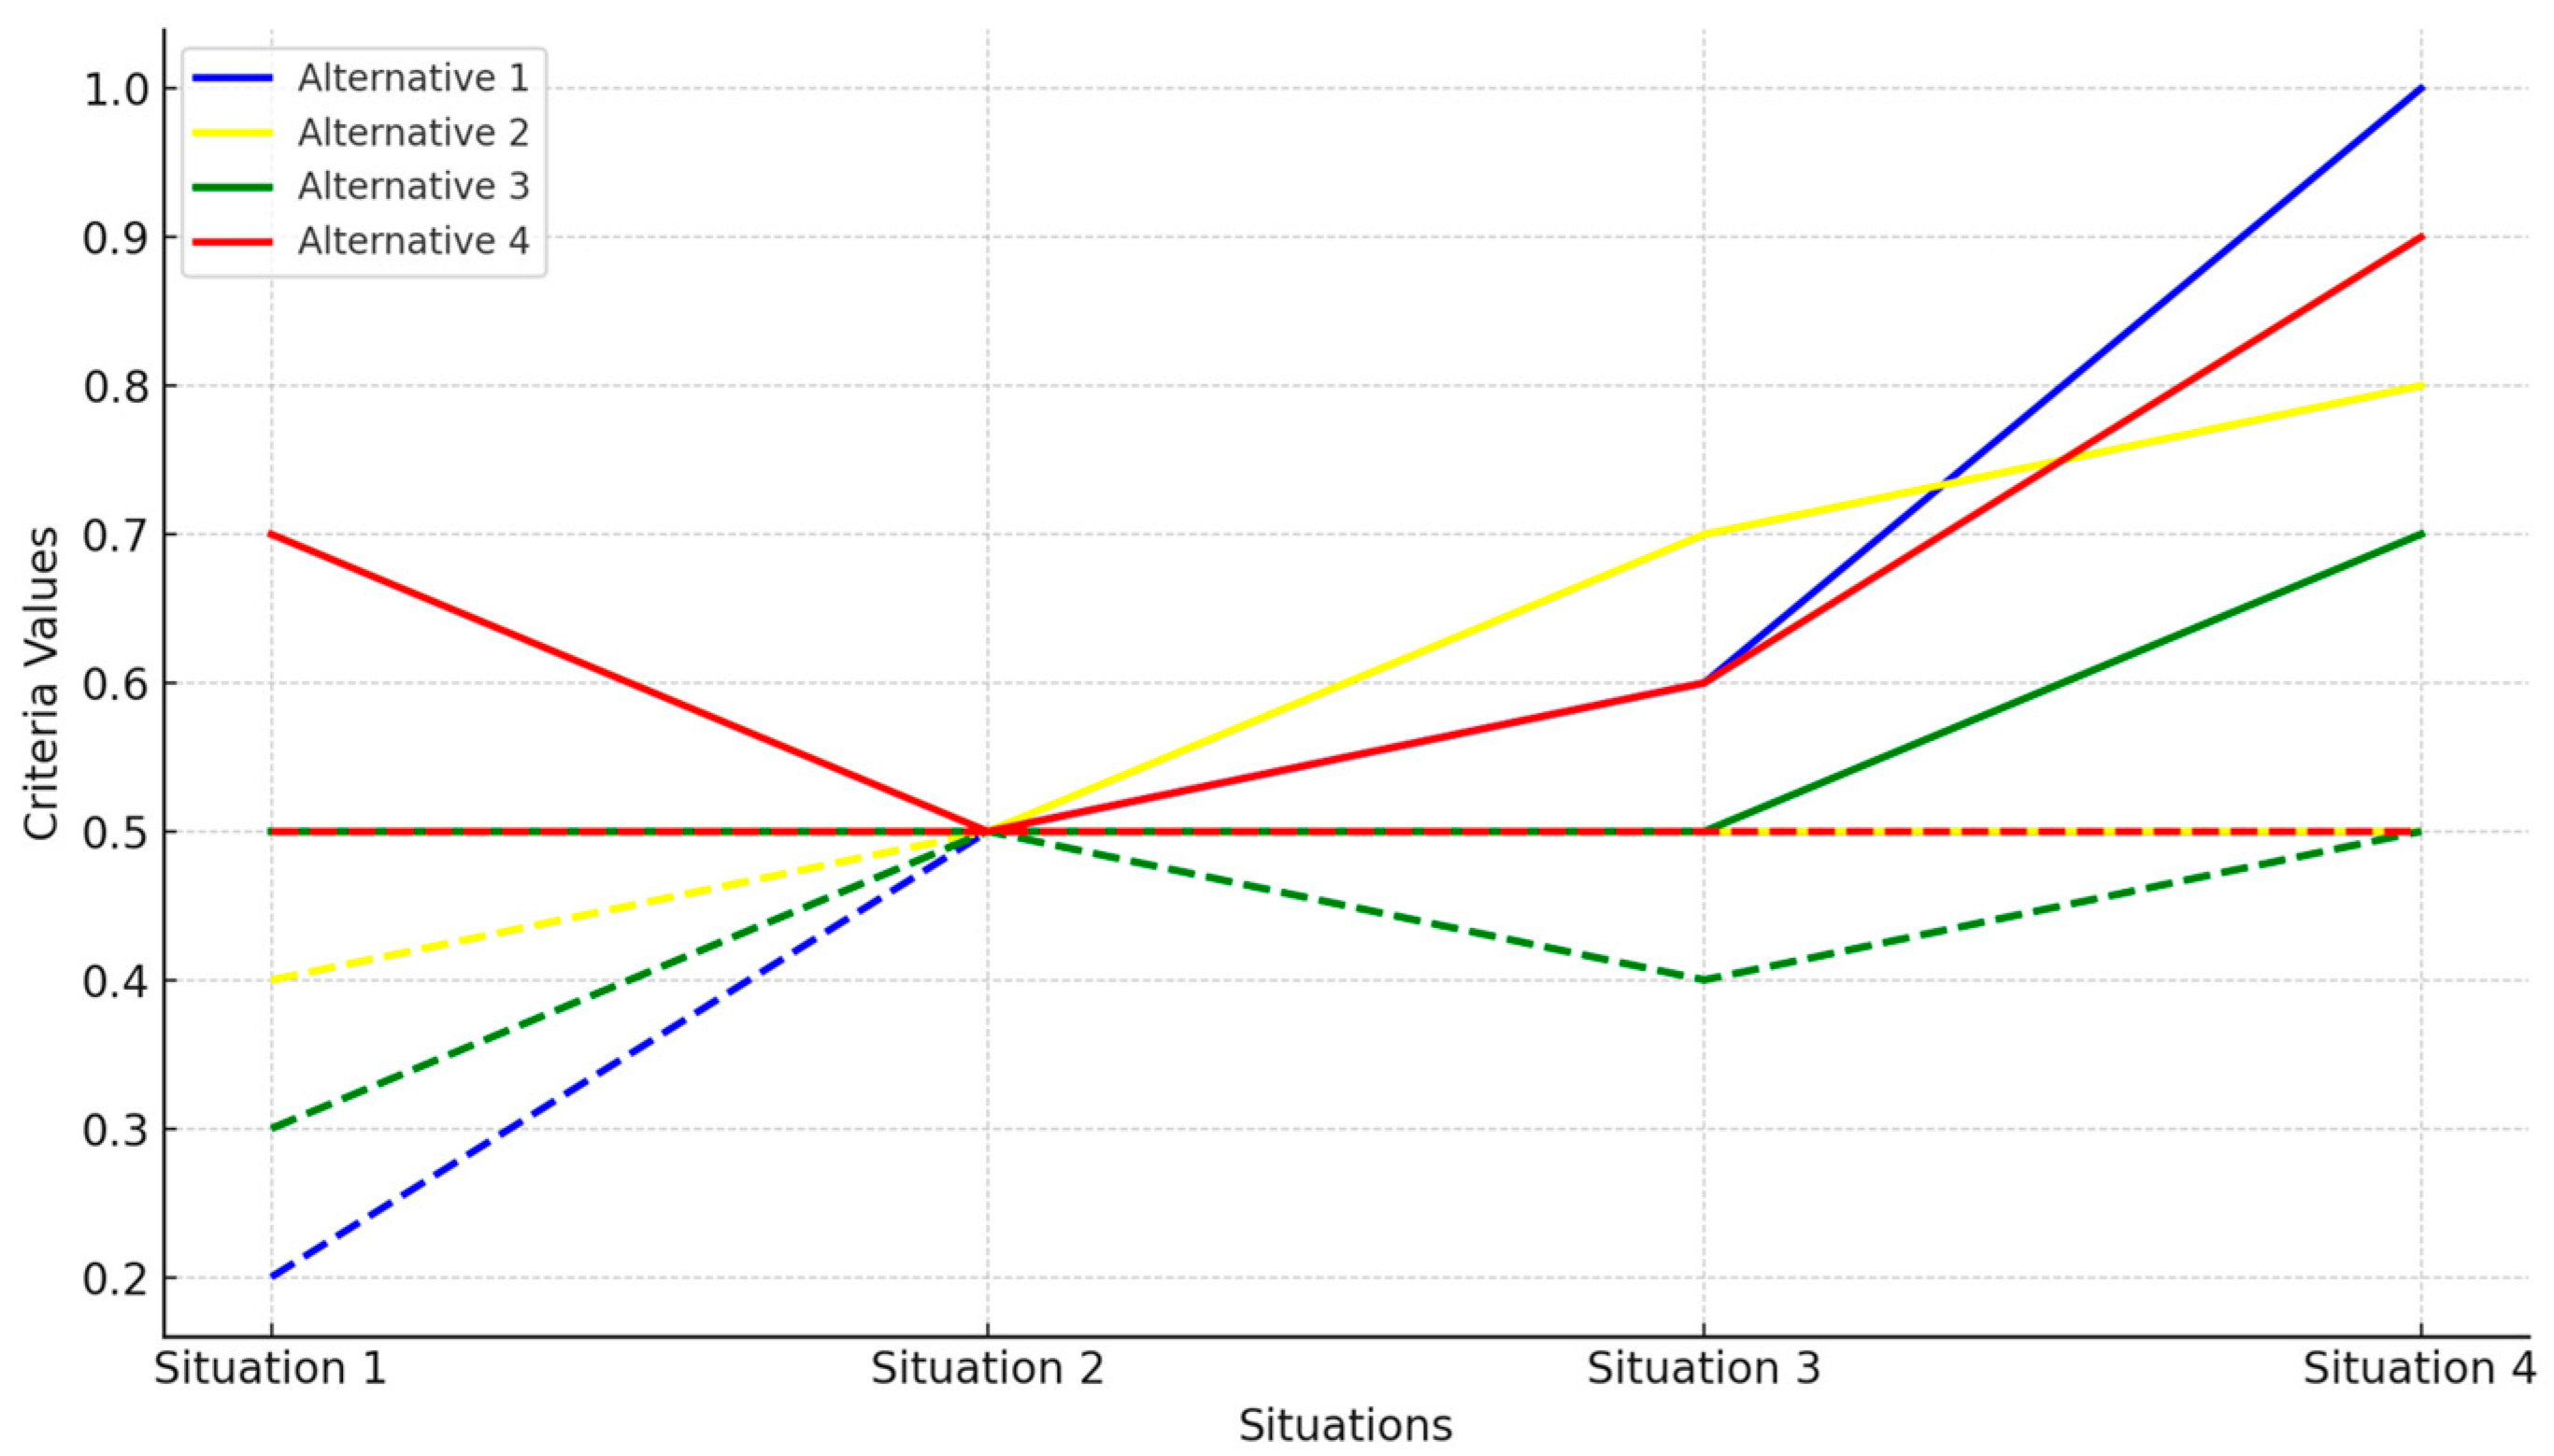
The line chart in
Figure 15 complements
Table 25 by showing how each alternative’s normalized criterion values evolve across the four situations. Solid lines plot the beneficial pillars (where higher is better), while dashed lines plot the cost criterion (where lower is better). The convergence at Situation 2 (all ≈0.50) reflects the neutral baseline in
Table 25; thereafter, the series diverge. Alternative 1 accelerates to ≈1.00 on beneficial criteria while its dashed cost line remains controlled, Alternative 4 rises strongly with a modest cost response, Alternative 3 improves steadily, and Alternative 2 dips on cost at Situation 3 before partially recovering. Line crossings indicate rank reversals across scenarios, and the slope of the solid vs. dashed segments reveals how the DSS weights simultaneous improvements in benefits against cost containment mechanics that produce the CCi spreads and ranks summarized in
Table 25.
6. Limitations of the Research
While this study successfully developed and demonstrated a Decision Support System (DSS) for sustainability-oriented contractor selection using a case study of a multi-purpose banquet center, several limitations were identified. First, the reliance on expert judgment, though systematically structured, introduces potential subjectivity and variability across different evaluators. Additionally, the selection criteria, though derived from literature and expert consensus, may not fully encapsulate the breadth of emerging sustainability metrics or capture the views of broader stakeholder groups, including clients, regulators, and end-users. The validation process was further constrained by the lack of access to comprehensive contractor performance datasets, which limited real-world benchmarking.
The DSS framework is currently based on a static criteria hierarchy and does not support dynamic, real-time decision environments where situational variables shift rapidly. Its scalability and transferability may be impacted by regional disparities in construction practices, digital maturity, and levels of Integrated Project Delivery (IPD) adoption. Furthermore, simplifying sustainability into four broad pillars, technical, economic, environmental, and social, risks overlooking the complex, interdependent nature of sustainability dimensions in contemporary infrastructure delivery. The application of a Qualification-Based Selection (QBS) model, while emphasizing merit, may unintentionally marginalize emerging or non-traditional contractors who bring innovation but lack a long track record. Additionally, the framework’s reliance on advanced digital tools may inhibit adoption among small- and medium-sized enterprises (SMEs) operating with limited technological infrastructure. Furthermore, applying the DSS to large-scale urban infrastructure (e.g., transit systems, public facilities, utility networks) remains an important direction for future research.
6.1. Recommendations for Future Work
6.1.1. Integrate Advanced MCDM Techniques and Real-Time Adaptivity
Future DSSs should fuse network-aware, uncertainty-tolerant MCDM, such as AHP/ANP with fuzzy or hybrid extensions, for weighting and ranking with live, event-driven data streams so rankings adapt as conditions evolve [
118,
119,
120,
121]. In parallel, DT/BIM–IoT pipelines now enable continuous sensing and real-time visualization/decisioning validated in pilots [
122,
123,
124]. Bibliometric evidence in construction DSS supports combining MCDM structures with streaming data and dashboarded feedback loops [
125].
6.1.2. Promote Inclusive, Scalable, and Policy-Responsive Frameworks
Broadening stakeholder involvement across public agencies, private developers, end-users, and community representatives strengthens legitimacy and balances competing priorities, a finding repeatedly evidenced in smart cities through empirical analyses of participatory/e-participation governance and stakeholder mapping [
126,
127,
128,
129,
130,
131,
132,
133]. To ensure scalability and institutional fit, the DSS should be configurable to multiple delivery systems (DB, CMAR, Alliance/IPD) and procurement frameworks, aligning with
Journal of Cleaner Production studies that link governance design and stakeholder engagement to sustainable public procurement performance and smart city outcomes [
134,
135,
136,
137]. This calibration enables transferability across regulatory and organizational contexts while maintaining a transparent, auditable path from stakeholder inputs to final rankings.
6.1.3. Integrate BIM, IoT, and Lifecycle Intelligence
Future DSS models should embed real-time dashboards and sensor-integrated data via BIM/IoT to automate data flows, support lifecycle tracking, and enable early risk mitigation. Robust evidence confirms effective BIM–LCC/LCA integration for decision support [
138], while recent studies validate IoT/DT pipelines for real-time monitoring and analytics in construction, including safety-oriented applications [
123,
139]. Embedding Lifecycle Costing (LCC) alongside contractor performance tracking thus fosters iterative learning and accountability across the asset lifecycle [
138,
140].
6.1.4. Enhance Usability and Transferability Through Interface Design and Comparative Contexts
Automating sustainability criteria updates ensures regulatory alignment and market relevance, while simplified interfaces improve DSS usability for SMEs [
116,
141,
142,
143]. To evidence generalizability, the DSS should be benchmarked through comparative case studies across jurisdictions and delivery models, using standardized usability/adoption metrics (e.g., SUS, task success rate, time on task, error rate) and an auditable decision log that traces stakeholder inputs to outcomes [
129,
143,
144,
145,
146]. Additionally, comparative case studies across diverse regulatory and cultural settings can assess the DSS’s adaptability and generalizability. BIM-integrated frameworks have already demonstrated success in enhancing regional decision-making through visualization and structured data [
54,
123,
147,
148].
7. Conclusions
This study delivers a significant contribution to sustainability-oriented contractor selection by developing an integrated Decision Support System (DSS) that combines Fuzzy AHP and Fuzzy VIKOR within the collaborative structure of Integrated Project Delivery (IPD). By incorporating technical, economic, social, and environmental dimensions rather than limiting evaluation to financial or productivity metrics, the framework addresses a persistent gap in prior research and aligns with broader theoretical foundations such as the sustainability pillars, SDGs, lifecycle value thinking, and collaborative decision-making theory. This comprehensive orientation strengthens the academic positioning of the study and advances the evolving discourse on sustainability-driven procurement.
The findings also offer deeper analytical insight by demonstrating how different contractors express trade-offs across the four sustainability dimensions and how compromise-based ranking can resolve ambiguity under uncertain, incomplete, or expert-derived data conditions. When contrasted with earlier studies that primarily emphasize cost and schedule, the findings demonstrate a substantial methodological and conceptual advancement, supported by a systematic examination of over fifty peer-reviewed publications and reinforced through verification and validation by nine industry and academic experts. This dual evidentiary base ensures that the framework is theoretically grounded, contextually sensitive, and robustly aligned with contemporary stakeholder-driven and fuzzy logic-enhanced decision-making practices. The real-world case study further reinforces the empirical robustness of the framework, illustrating its capability to support transparent, defensible, and multi-stakeholder decision processes in practice.
Practically, the DSS provides a scalable and policy-aligned tool for project owners, public agencies, and practitioners seeking to embed ESG performance, collaboration, and risk sharing into contractor selection. Its adaptability makes it suitable for infrastructure, building, and urban development settings where sustainability outcomes must be prioritized alongside cost and technical performance. Theoretically, the study contributes a structured and reproducible model that bridges MCDM methods with sustainability assessment and IPD procurement, offering a valuable reference point for future research and practice in sustainable construction management.
Author Contributions
Conceptualization, O.G.B. and A.H.; methodology, O.G.B.; software, O.G.B.; validation, O.G.B. and A.H.; formal analysis, O.G.B.; investigation, O.G.B.; resources, O.G.B.; data curation, O.G.B.; writing—original draft preparation, O.G.B.; writing—review and editing, A.H.; visualization, O.G.B.; supervision, A.H. All authors have read and agreed to the published version of the manuscript.
Funding
This research has not received any external funding.
Institutional Review Board Statement
Not applicable.
Informed Consent Statement
Not applicable.
Data Availability Statement
The original contributions presented in this study are included in the article. Further inquiries can be directed to the corresponding author.
Conflicts of Interest
The author declares no conflicts of interest.
References
- Zhong, Q.; Tang, H.; Chen, C. A Framework for Selecting Construction Project Delivery Method Using Design Structure Matrix. Buildings 2022, 12, 443. [Google Scholar] [CrossRef] [Scilit]
- Raouf, A.M.; Al-Ghamdi, S.G. Effectiveness of Project Delivery Systems in Executing Green Buildings. J. Constr. Eng. Manag. 2019, 145, 03119005. [Google Scholar] [CrossRef] [Scilit]
- Mollaoglu-Korkmaz, S.; Swarup, L.; Riley, D. Delivering Sustainable, High-Performance Buildings: Influence of Project Delivery Methods on Integration and Project Outcomes. J. Manag. Eng. 2013, 29, 71–78. [Google Scholar] [CrossRef] [Scilit]
- Love, P.E.; Edwards, D.J. Determinants of rework in building construction projects. Eng. Constr. Archit. Manag. 2004, 11, 259–274. [Google Scholar] [CrossRef] [Scilit]
- El Asmar, M.; Hanna, A.S.; Loh, W.-Y. Quantifying Performance for the Integrated Project Delivery System as Compared to Established Delivery Systems. J. Constr. Eng. Manag. 2013, 139, 04013012. [Google Scholar] [CrossRef] [Scilit]
- Ebrahimi, G.; Dowlatabadi, H. Perceived Challenges in Implementing Integrated Project Delivery (IPD): Insights from Stakeholders in the U.S. and Canada for a Path Forward. Int. J. Constr. Educ. Res. 2019, 15, 291–314. [Google Scholar] [CrossRef] [Scilit]
- Xue, X.; Zhang, R.; Wang, L.; Fan, H.; Yang, R.J.; Dai, J. Collaborative innovation in construction project: A social network perspective. KSCE J. Civ. Eng. 2018, 22, 417–427. [Google Scholar] [CrossRef] [Scilit]
- Burati, J.L.; Farrington, J.J.; Ledbetter, W.B. Causes of Quality Deviations in Design and Construction. J. Constr. Eng. Manag. 1992, 118, 34–49. [Google Scholar] [CrossRef] [Scilit]
- Kent, D.C.; Becerik-Gerber, B. Understanding Construction Industry Experience and Attitudes toward Integrated Project Delivery. J. Constr. Eng. Manag. 2010, 136, 815–825. [Google Scholar] [CrossRef] [Scilit]
- Lahdenperä, P. Making sense of the multi-party contractual arrangements of project partnering, project alliancing and integrated project delivery. Constr. Manag. Econ. 2012, 30, 57–79. [Google Scholar] [CrossRef] [Scilit]
- Engebø, A.; Klakegg, O.J.; Lohne, J.; Lædre, O. A collaborative project delivery method for design of a high-performance building. Int. J. Manag. Proj. Bus. 2020, 13, 1141–1165. [Google Scholar] [CrossRef] [Scilit]
- Ahmed, S.; El-Sayegh, S. Critical Review of the Evolution of Project Delivery Methods in the Construction Industry. Buildings 2020, 11, 11. [Google Scholar] [CrossRef] [Scilit]
- Bond-Barnard, T.; Fletcher, L.; Steyn, H. Linking trust and collaboration in project teams to project management success. Int. J. Manag. Proj. Bus. 2018, 11, 432–457. [Google Scholar] [CrossRef] [Scilit]
- Rodrigues, M.R.; Lindhard, S.M. Benefits and challenges to applying IPD: Experiences from a Norwegian mega-project. Constr. Innov. 2021, 23, 287–305. [Google Scholar] [CrossRef] [Scilit]
- Kaminsky, J. The fourth pillar of infrastructure sustainability: Tailoring civil infrastructure to social context. Constr. Manag. Econ. 2015, 33, 299–309. [Google Scholar] [CrossRef] [Scilit]
- Bygballe, L.E.; Swärd, A. Collaborative Project Delivery Models and the Role of Routines in Institutionalizing Partnering. Proj. Manag. J. 2019, 50, 161–176. [Google Scholar] [CrossRef] [Scilit]
- Rosayuru, H.D.R.R.; Waidyasekara, K.G.A.S.; Wijewickrama, M.K.C.S. Sustainable BIM based integrated project delivery system for construction industry in Sri Lanka. Int. J. Constr. Manag. 2022, 22, 769–783. [Google Scholar] [CrossRef] [Scilit]
- Pishdad-Bozorgi, P. Case Studies on the Role of Integrated Project Delivery (IPD) Approach on the Establishment and Promotion of Trust. Int. J. Constr. Educ. Res. 2017, 13, 102–124. [Google Scholar] [CrossRef] [Scilit]
- Hettiaarachchige, N.; Rathnasinghe, A.; Ranadewa, K.; Thurairajah, N. Lean Integrated Project Delivery for Construction Procurement: The Case of Sri Lanka. Buildings 2022, 12, 524. [Google Scholar] [CrossRef] [Scilit]
- Sherif, M.; Abotaleb, I.; Alqahtani, F.K. Application of Integrated Project Delivery (IPD) in the Middle East: Implementation and Challenges. Buildings 2022, 12, 467. [Google Scholar] [CrossRef] [Scilit]
- Babalola, O.G.; Alam Bhuiyan, M.M.; Hammad, A. Literature Review on Collaborative Project Delivery for Sustainable Construction: Bibliometric Analysis. Sustainability 2024, 16, 7707. [Google Scholar] [CrossRef] [Scilit]
- Manata, B.; Garcia, A.J.; Mollaoglu, S.; Miller, V.D. The effect of commitment differentiation on integrated project delivery team dynamics: The critical roles of goal alignment, communication behaviors, and decision quality. Int. J. Proj. Manag. 2021, 39, 259–269. [Google Scholar] [CrossRef] [Scilit]
- Kraatz, J.A.; Sanchez, A.X.; Hampson, K.D. Digital Modeling, Integrated Project Delivery and Industry Transformation: An Australian Case Study. Buildings 2014, 4, 453–466. [Google Scholar] [CrossRef] [Scilit]
- Ghassemi, R.; Becerik-Gerber, B. Transitioning to integrated project delivery: Potential barriers and lessons learned. Lean Constr. J. 2011, 2011, 32–52. [Google Scholar] [CrossRef] [Scilit]
- Ilozor, B.D.; Kelly, D.J. Building information modeling and integrated project delivery in the commercial construction industry: A conceptual study. J. Eng. Proj. Prod. Manag. 2012, 2, 23–36. [Google Scholar] [CrossRef] [Scilit]
- Chang, T.; Du, Y.; Deng, X.; Wang, X. Impact of cognitive biases on environmental compliance risk perceptions in international construction projects. Front. Psychol. 2024, 15, 1397306. [Google Scholar] [CrossRef] [Scilit]
- Gifford, R. The dragons of inaction: Psychological barriers that limit climate change mitigation and adaptation. Am. Psychol. 2011, 66, 290–302. [Google Scholar] [CrossRef] [Scilit]
- Ochieng, E.G.; Price, A.D.F. Managing cross-cultural communication in multicultural construction project teams: The case of Kenya and UK. Int. J. Proj. Manag. 2010, 28, 449–460. [Google Scholar] [CrossRef] [Scilit]
- Ametepey, O.; Aigbavboa, C.; Ansah, K. Barriers to Successful Implementation of Sustainable Construction in the Ghanaian Construction Industry. Procedia Manuf. 2015, 3, 1682–1689. [Google Scholar] [CrossRef] [Scilit]
- Khalfan, M.M.A.; McDermott, P.; Swan, W. Building trust in construction projects. Supply Chain Manag. Int. J. 2007, 12, 385–391. [Google Scholar] [CrossRef] [Scilit]
- Koolwijk, J.S.J.; Van Oel, C.J.; Gaviria Moreno, J.C. No-Blame Culture and the Effectiveness of Project-Based Design Teams in the Construction Industry: The Mediating Role of Teamwork. J. Manag. Eng. 2020, 36, 04020033. [Google Scholar] [CrossRef] [Scilit]
- Xu, J.; Liu, Y.X.; Luo, L.F. A Trust-Based Method in Construction Industry. Appl. Mech. Mater. 2014, 539, 762–768. [Google Scholar] [CrossRef] [Scilit]
- Ihuah, P.W.; Kakulu, I.I.; Eaton, D. A review of Critical Project Management Success Factors (CPMSF) for sustainable social housing in Nigeria. Int. J. Sustain. Built Environ. 2014, 3, 62–71. [Google Scholar] [CrossRef] [Scilit]
- Guerriero, A.; Kubicki, S.; Halin, G. Toward a Trust-Based Construction Management. Comput. Aided Civ. Infrastruct. Eng. 2010, 25, 253–268. [Google Scholar] [CrossRef] [Scilit]
- Sakr, D.; Baas, L.; El-Haggar, S.; Huisingh, D. Critical success and limiting factors for eco-industrial parks: Global trends and Egyptian context. J. Clean. Prod. 2011, 19, 1158–1169. [Google Scholar] [CrossRef] [Scilit]
- Senra, D. Daniel Ek, Spotify|David Senra, 28 September 2025. [Online Video]. Available online: https://www.youtube.com/watch?v=qiXH0y2V3_8 (accessed on 4 October 2025).
- Bröchner, J.; Badenfelt, U. Changes and change management in construction and IT projects. Autom. Constr. 2011, 20, 767–775. [Google Scholar] [CrossRef] [Scilit]
- Monteiro, A.; Mêda, P.; Martins, J.P. Framework for the coordinated application of two different integrated project delivery platforms. Autom. Constr. 2014, 38, 87–99. [Google Scholar] [CrossRef] [Scilit]
- Hampson, K.D.; Kraatz, J.A.; Sanchez, A.X. The global construction industry and R&D. In R&D Investment and Impact in the Global Construction Industry; Routledge: London, UK, 2014. [Google Scholar]
- Azhar, N.; Kang, Y.; Ahmad, I.U. Factors influencing integrated project delivery in publicly owned construction projects: An information modelling perspective. Procedia Eng. 2014, 77, 213–221. [Google Scholar] [CrossRef] [Scilit]
- Mihic, M.; Sertic, J.; Zavrski, I. Integrated Project Delivery as Integration between Solution Development and Solution Implementation. Procedia-Soc. Behav. Sci. 2014, 119, 557–565. [Google Scholar] [CrossRef] [Scilit]
- Nawi, M.N.M.; Haron, A.T.; Hamid, Z.A.; Kamar, K.A.M.; Baharuddin, Y. Improving integrated practice through building information modeling-integrated project delivery (BIM-IPD) for Malaysian industrialised building system (IBS) Construction Projects. Malays. Constr. Res. J. 2014, 15, 29–38. [Google Scholar]
- Smith, R.E.; Mossman, A.; Emmitt, S. Lean and integrated project delivery. Lean Constr. J. 2011, 2011, 1–16. [Google Scholar] [CrossRef] [Scilit]
- Zhang, L.; He, J.; Zhou, S. Sharing Tacit Knowledge for Integrated Project Team Flexibility: Case Study of Integrated Project Delivery. J. Constr. Eng. Manag. 2013, 139, 795–804. [Google Scholar] [CrossRef] [Scilit]
- Ma, Z.; Zhang, D.; Li, J. A dedicated collaboration platform for Integrated Project Delivery. Autom. Constr. 2018, 86, 199–209. [Google Scholar] [CrossRef] [Scilit]
- Yadav, S.; Kanade, G. Application of Revit as Building Information Modeling (BIM) for Integrated Project Delivery (IPD) to Building Construction Project—A Review. Int. Res. J. Eng. Technol. 2018, 5, 11–14. [Google Scholar]
- Salim, M.S.; Mahjoob, A.M.R. Integrated project delivery (IPD) method with BIM to improve the project performance: A case study in the Republic of Iraq. Asian J Civ Eng 2020, 21, 947–957. [Google Scholar] [CrossRef] [Scilit]
- Ling, Y.Y.; Lau, B.S.Y. A case study on the management of the development of a large-scale power plant project in East Asia based on design-build arrangement. Int. J. Proj. Manag. 2002, 20, 413–423. [Google Scholar] [CrossRef] [Scilit]
- Dalui, P.; Elghaish, F.; Brooks, T.; McIlwaine, S. Integrated Project Delivery with BIM: A Methodical Approach Within the UK Consulting Sector. J. Inf. Technol. Constr. 2021, 26, 922–935. [Google Scholar] [CrossRef] [Scilit]
- Franz, B.; Leicht, R.M. Initiating IPD Concepts on Campus Facilities with a “Collaboration Addendum”. In Construction Research Congress 2012: Construction Challenges in a Flat World; ASCE: Reston, VA, USA, 2012; pp. 61–70. [Google Scholar] [CrossRef] [Scilit]
- Singleton, M.S.; Hamzeh, F.R. Implementing integrated project delivery on department of the navy construction projects: Lean Construction Journal. Lean Constr. J. 2011, 2011, 17–31. [Google Scholar] [CrossRef] [Scilit]
- Franz, B.; Leicht, R.; Molenaar, K.; Messner, J. Impact of Team Integration and Group Cohesion on Project Delivery Performance. J. Constr. Eng. Manag. 2017, 143, 04016088. [Google Scholar] [CrossRef] [Scilit]
- Pishdad-Bozorgi, P.; Beliveau, Y.J. Symbiotic Relationships between Integrated Project Delivery (IPD) and Trust. Int. J. Constr. Educ. Res. 2016, 12, 179–192. [Google Scholar] [CrossRef] [Scilit]
- Mei, T.; Guo, Z.; Li, P.; Fang, K.; Zhong, S. Influence of Integrated Project Delivery Principles on Project Performance in China: An SEM-Based Approach. Sustainability 2022, 14, 4381. [Google Scholar] [CrossRef] [Scilit]
- Fayyaz, M.; Fusco, G.; Colombaroni, C.; González-González, E.; Nogués, S. Optimizing Smart City Street Design with Interval-Fuzzy Multi-Criteria Decision Making and Game Theory for Autonomous Vehicles and Cyclists. Smart Cities 2024, 7, 3936–3961. [Google Scholar] [CrossRef] [Scilit]
- Bouramdane, A.-A. Optimal Water Management Strategies: Paving the Way for Sustainability in Smart Cities. Smart Cities 2023, 6, 2849–2882. [Google Scholar] [CrossRef] [Scilit]
- Bokolo, A.J. Examining the adoption of sustainable eMobility-sharing in smart communities: Diffusion of innovation theory perspective. Smart Cities 2023, 6, 2057–2080. [Google Scholar] [CrossRef] [Scilit]
- Wu, Y.; Martens, P.; Krafft, T. Transitioning to a Low-Carbon Lifestyle? An Exploration of Millennials’ Low-Carbon Behavior—A Case Study in China. Smart Cities 2024, 7, 2015–2041. [Google Scholar] [CrossRef] [Scilit]
- Saaty, T.L.; Vargas, L.G. Hierarchical analysis of behavior in competition: Prediction in chess. Syst. Res. 1980, 25, 180–191. [Google Scholar] [CrossRef] [Scilit]
- Cheng, E.W.L.; Li, H. Contractor selection using the analytic network process. Constr. Manag. Econ. 2004, 22, 1021–1032. [Google Scholar] [CrossRef] [Scilit]
- Al-Harbi, K.M.A.-S. Application of the AHP in project management. Int. J. Proj. Manag. 2001, 19, 19–27. [Google Scholar] [CrossRef] [Scilit]
- Opricovic, S.; Tzeng, G.-H. Compromise solution by MCDM methods: A comparative analysis of VIKOR and TOPSIS. Eur. J. Oper. Res. 2004, 156, 445–455. [Google Scholar] [CrossRef] [Scilit]
- Shemshadi, A.; Shirazi, H.; Toreihi, M.; Tarokh, M.J. A fuzzy VIKOR method for supplier selection based on entropy measure for objective weighting. Expert Syst. Appl. 2011, 38, 12160–12167. [Google Scholar] [CrossRef] [Scilit]
- Opricovic, S. Fuzzy VIKOR with an application to water resources planning. Expert Syst. Appl. 2011, 38, 12983–12990. [Google Scholar] [CrossRef] [Scilit]
- Zadeh, L.A. Fuzzy sets. Inf. Control 1965, 8, 338–353. [Google Scholar] [CrossRef] [Scilit]
- Kahraman, C.; Cebeci, U.; Ulukan, Z. Multi-criteria supplier selection using fuzzy AHP. Logist. Inf. Manag. 2003, 16, 382–394. [Google Scholar] [CrossRef] [Scilit]
- Govindan, K.; Khodaverdi, R.; Jafarian, A. A fuzzy multi criteria approach for measuring sustainability performance of a supplier based on triple bottom line approach. J. Clean. Prod. 2013, 47, 345–354. [Google Scholar] [CrossRef] [Scilit]
- Büyüközkan, G.; Feyzıoğlu, O. A fuzzy-logic-based decision-making approach for new product development. Int. J. Prod. Econ. 2004, 90, 27–45. [Google Scholar] [CrossRef] [Scilit]
- Alam Bhuiyan, M.M.; Hammad, A. A Hybrid Multi-Criteria Decision Support System for Selecting the Most Sustainable Structural Material for a Multistory Building Construction. Sustainability 2023, 15, 3128. [Google Scholar] [CrossRef] [Scilit]
- Zhu, X.; Meng, X.; Zhang, M. Application of multiple criteria decision making methods in construction: A systematic literature review. J. Civ. Eng. Manag. 2021, 27, 372–403. [Google Scholar] [CrossRef] [Scilit]
- Wu, W.-W.; Lee, Y.-T. Selecting knowledge management strategies by using the analytic network process. Expert Syst. Appl. 2007, 32, 841–847. [Google Scholar] [CrossRef] [Scilit]
- Awasthi, A.; Chauhan, S.S.; Goyal, S.K. A fuzzy multicriteria approach for evaluating environmental performance of suppliers. Int. J. Prod. Econ. 2010, 126, 370–378. [Google Scholar] [CrossRef] [Scilit]
- Chen, S.-J.; Hwang, C.-L. Fuzzy Multiple Attribute Decision Making Methods. In Fuzzy Multiple Attribute Decision Making: Methods and Applications; Chen, S.-J., Hwang, C.-L., Eds.; Springer: Berlin/Heidelberg, Germany, 1992; pp. 289–486. ISBN 978-3-642-46768-4. [Google Scholar]
- Hill, R.C.; Bowen, P.A. Sustainable construction: Principles and a framework for attainment. Constr. Manag. Econ. 1997, 15, 223–239. [Google Scholar] [CrossRef] [Scilit]
- Aktas, B.; Ozorhon, B. Green Building Certification Process of Existing Buildings in Developing Countries: Cases from Turkey. J. Manag. Eng. 2015, 31, 05015002. [Google Scholar] [CrossRef] [Scilit]
- Korkmaz, S.; Riley, D.; Horman, M. Assessing Project Delivery for Sustainable, High-Performance Buildings Through Mixed Methods. Archit. Eng. Des. Manag. 2011, 7, 266–274. [Google Scholar] [CrossRef] [Scilit]
- Rasekh, H.; McCarthy, T.J. Delivering sustainable building projects—Challenges, reality and success. J. Green Build. 2016, 11, 143–161. [Google Scholar] [CrossRef] [Scilit]
- Khoso, A.R.; Md Yusof, A. Extended review of contractor selection in construction projects. Can. J. Civ. Eng. 2020, 47, 771–789. [Google Scholar] [CrossRef] [Scilit]
- Cao, M.; Duan, X.; Zhao, X. Construction of integrated evaluation system for green port construction based on BIM technology. J. Coast. Res. 2019, 93, 1073–1079. [Google Scholar] [CrossRef] [Scilit]
- Tan, Y.; Shen, L.; Yao, H. Sustainable construction practice and contractors’ competitiveness: A preliminary study. Habitat Int. 2011, 35, 225–230. [Google Scholar] [CrossRef] [Scilit]
- Gurgun, A.P.; Koc, K. Contractor prequalification for green buildings—Evidence from Turkey. Eng. Constr. Archit. Manag. 2020, 27, 1377–1400. [Google Scholar] [CrossRef] [Scilit]
- Doloi, H.; Sawhney, A.; Iyer, K.C.; Rentala, S. Analysing factors affecting delays in Indian construction projects. Int. J. Proj. Manag. 2012, 30, 479–489. [Google Scholar] [CrossRef] [Scilit]
- Jazayeri, E.; Pajouhi, P. Relationship between Construction Project Delivery Methods and Project Performance. Int. J. Eng. Sci. Comput. 2017, 8, 13615–13622. [Google Scholar]
- Alshihre, F.; Chinyio, E.; Nzekwe-Excel, C.; Daniel, E.I. Improving clients’ satisfaction in construction projects: The case of Saudi Arabia. Built Environ. Proj. Asset Manag. 2020, 10, 709–723. [Google Scholar] [CrossRef] [Scilit]
- Ali Almuhannadi, M.; Salem Ghareeb, A. Enhancing design–bid–build project delivery: A comprehensive review and framework for contractor selection and project optimisation in the construction industry. Organ. Technol. Manag. Constr. Int. J. 2024, 16, 63–80. [Google Scholar] [CrossRef] [Scilit]
- Ibrahim, A.; Zayed, T.; Lafhaj, Z. Enhancing Construction Performance: A Critical Review of Performance Measurement Practices at the Project Level. Buildings 2024, 14, 1988. [Google Scholar] [CrossRef] [Scilit]
- Masrom, M.A.N.; Hamza, G.; Manap, N.; Syahrom, N.S. Factors Affecting the Performance of Medium and Large Local Contractors in the Jigawa State Nigerian Construction Industry. MATEC Web Conf. 2019, 266, 03017. [Google Scholar] [CrossRef] [Scilit]
- Sweis, G.; Sweis, R.; Bisharat, S.; Bisharat, L. Factors Affecting Contractor Performance on Public Construction Projects. ACTA Zhengzhou Univ. Overseas Ed. 2014, 11, 28–39. [Google Scholar]
- Alzahrani, J.I.; Emsley, M.W. The impact of contractors’ attributes on construction project success: A post construction evaluation. Int. J. Proj. Manag. 2013, 31, 313–322. [Google Scholar] [CrossRef] [Scilit]
- Amiri, O.; Ayazi, A.; Rahimi, M.; Khazaeni, G. Risks of water and wastewater PPP projects: An investors’ perspective. Constr. Innov. 2022, 22, 1104–1121. [Google Scholar] [CrossRef] [Scilit]
- Tserng, H.P.; Liao, H.-H.; Tsai, L.K.; Chen, P.-C. Predicting Construction Contractor Default with Option-Based Credit Models—Models’ Performance and Comparison with Financial Ratio Models. J. Constr. Eng. Manag. 2011, 137, 412–420. [Google Scholar] [CrossRef] [Scilit]
- Chen, X.; Zhao, Y.; Xue, S. A Study on the Dynamic Evolution Paths of Social Risks in PPP Projects of Water Environmental Governance—From the Vulnerability Perspective. Sustainability 2024, 16, 3951. [Google Scholar] [CrossRef] [Scilit]
- Roufechaei, K.M.; Hassan Abu Bakar, A.; Tabassi, A.A. Energy-efficient design for sustainable housing development. J. Clean. Prod. 2014, 65, 380–388. [Google Scholar] [CrossRef] [Scilit]
- Mahdi, I.M.; Riley, M.J.; Fereig, S.M.; Alex, A.P. A multi-criteria approach to contractor selection. Eng. Constr. Archit. Manag. 2002, 9, 29–37. [Google Scholar]
- El-Abbasy, M.S.; Zayed, T.; Ahmed, M.; Alzraiee, H.; Abouhamad, M. Contractor Selection Model for Highway Projects Using Integrated Simulation and Analytic Network Process. J. Constr. Eng. Manag. 2013, 139, 755–767. [Google Scholar] [CrossRef] [Scilit]
- Hassan, A.A.; Adnan, H. The problems and abuse of performance bond in the construction Industry. IOP Conf. Ser. Earth Environ. Sci. 2018, 117, 012044. [Google Scholar] [CrossRef] [Scilit]
- Yates, J.K. Design and Construction for Sustainable Industrial Construction. J. Constr. Eng. Manag. 2014, 140, B4014005. [Google Scholar] [CrossRef] [Scilit]
- Lapinski, A.R.; Horman, M.J.; Riley, D.R. Lean Processes for Sustainable Project Delivery. J. Constr. Eng. Manag. 2006, 132, 1083–1091. [Google Scholar] [CrossRef] [Scilit]
- Pheng Low, S.; Gao, S.; Lin Tay, W. Comparative study of project management and critical success factors of greening new and existing buildings in Singapore. Struct. Surv. 2014, 32, 413–433. [Google Scholar] [CrossRef] [Scilit]
- Książek, M.; Ciechowicz, P. Selection of the general contractor using the AHP method. Arch. Civ. Eng. 2016, 62, 105–116. [Google Scholar] [CrossRef] [Scilit]
- Krishna Rao, M.V.; Kumar, V.S.S.; Rathish Kumar, P. Optimal contractor selection in construction industry: The fuzzy way. J. Inst. Eng. Ser. A 2018, 99, 67–78. [Google Scholar] [CrossRef] [Scilit]
- Abidin, N.Z.; Pasquire, C.L. Revolutionize value management: A mode towards sustainability. Int. J. Proj. Manag. 2007, 25, 275–282. [Google Scholar] [CrossRef] [Scilit]
- Najafpoor, A.A.; Zarei, A.; Jamali-Behnam, F.; Vahedian-Shahroudi, M.; Zarei, A. A study identifying causes of construction waste production and applying safety management on construction site. Iran. J. Health Sci. 2014, 2, 49–54. [Google Scholar] [CrossRef] [Scilit]
- Khalafalla, O.; Pour-Ghaz, M.; ElSafty, A.; Rizkalla, S. Durability of CFRP strands used for prestressing of concrete structural members. Constr. Build. Mater. 2019, 228, 116756. [Google Scholar] [CrossRef] [Scilit]
- Al-Kasasbeh, M.; Abudayyeh, O.; Olimat, H.; Liu, H.; Al Mamlook, R.; Alfoul, B.A. A robust construction safety performance evaluation framework for workers’ compensation insurance: A proposed alternative to EMR. Buildings 2021, 11, 434. [Google Scholar] [CrossRef] [Scilit]
- Liang, H.; Zhang, S.; Su, Y. Using leading and lagging indicators to select safe contractors at the prequalification stage of construction projects. Int. J. Occup. Environ. Health 2018, 24, 61–74. [Google Scholar] [CrossRef] [Scilit] [PubMed]
- Asgari, S.; Song, X.; Odeh, I. Managing Greenhouse Gas Emissions in Civil Infrastructure Projects Using Green Performance Bond. In International Conference on Sustainable Infrastructure; ASCE: Reston, VA, USA, 2017; p. 243. [Google Scholar] [CrossRef] [Scilit]
- Wang, G.; Luo, T.; Luo, H.; Liu, R.; Liu, Y.; Liu, Z. A comprehensive review of building lifecycle carbon emissions and reduction approaches. City Built Enviro 2024, 2, 12. [Google Scholar] [CrossRef] [Scilit]
- Zhong, X.; Hu, M.; Deetman, S.; Steubing, B.; Lin, H.X.; Hernandez, G.A.; Harpprecht, C.; Zhang, C.; Tukker, A.; Behrens, P. Global greenhouse gas emissions from residential and commercial building materials and mitigation strategies to 2060. Nat. Commun. 2021, 12, 6126. [Google Scholar] [CrossRef] [Scilit]
- Sizirici, B.; Fseha, Y.; Cho, C.-S.; Yildiz, I.; Byon, Y.-J. A review of carbon footprint reduction in construction industry, from design to operation. Materials 2021, 14, 6094. [Google Scholar] [CrossRef] [Scilit]
- Wang, Y.; Jiang, Z.; Li, L.; Qi, Y.; Sun, J.; Jiang, Z. A Bibliometric and Content Review of Carbon Emission Analysis for Building Construction. Buildings 2023, 13, 205. [Google Scholar] [CrossRef] [Scilit]
- Knoth, K.; Fufa, S.M.; Seilskjær, E. Barriers, success factors, and perspectives for the reuse of construction products in Norway. J. Clean. Prod. 2022, 337, 130494. [Google Scholar] [CrossRef] [Scilit]
- Li, C.; Huang, M. Environmental Sustainability in the Age of Big Data: Opportunities and Challenges for Business and Industry. Environ. Sci Pollut Res 2023, 30, 119001–119015. [Google Scholar] [CrossRef] [Scilit]
- El-Sayegh, S.M.; Basamji, M.; Haj Ahmad, A.; Zarif, N. Key contractor selection criteria for green construction projects in the UAE. Int. J. Constr. Manag. 2021, 21, 1240–1250. [Google Scholar] [CrossRef] [Scilit]
- Rakhshan, K.; Morel, J.-C.; Alaka, H.; Charef, R. Components reuse in the building sector—A systematic review. Waste Manag Res 2020, 38, 347–370. [Google Scholar] [CrossRef] [Scilit]
- Akinade, O.O.; Oyedele, L.O.; Omoteso, K.; Ajayi, S.O.; Bilal, M.; Owolabi, H.A.; Alaka, H.A.; Ayris, L.; Looney, J.H. BIM-based deconstruction tool: Towards essential functionalities. Int. J. Sustain. Built Environ. 2017, 6, 260–271. [Google Scholar] [CrossRef] [Scilit]
- Jost, L. Entropy and diversity. Oikos 2006, 113, 363–375. [Google Scholar] [CrossRef] [Scilit]
- Gao, C.; Elzarka, H.; Yan, H.; Chakraborty, D.; Zhou, C. A Hybrid TOPSIS-Structure Entropy Weight Group Subcontractor Selection Model for Large Construction Companies. Buildings 2023, 13, 1535. [Google Scholar] [CrossRef] [Scilit]
- Brown, D.; Tokede, O.; Li, H.X.; Edwards, D. A systematic review of barriers to implementing net zero energy buildings in Australia. J. Clean. Prod. 2024, 467, 142910. [Google Scholar] [CrossRef] [Scilit]
- Tafazzoli, M.; Hazrati, A.; Shrestha, K.; Kisi, K. Enhancing Contractor Selection through Fuzzy TOPSIS and Fuzzy SAW Techniques. Buildings 2024, 14, 1861. [Google Scholar] [CrossRef] [Scilit]
- Wang, J.; Qin, Y.; He, P.; Yan, W. Research on Smart Construction Site Evaluation Model Based on DEMATEL-ANP Method. Buildings 2025, 15, 3077. [Google Scholar] [CrossRef] [Scilit]
- Yang, Z.; Tang, C.; Zhang, T.; Zhang, Z.; Doan, D.T. Digital Twins in Construction: Architecture, Applications, Trends and Challenges. Buildings 2024, 14, 2616. [Google Scholar] [CrossRef] [Scilit]
- Iqbal, F.; Mirzabeigi, S. Digital Twin-Enabled Building Information Modeling–Internet of Things (BIM-IoT) Framework for Optimizing Indoor Thermal Comfort Using Machine Learning. Buildings 2025, 15, 1584. [Google Scholar] [CrossRef] [Scilit]
- Yang, S.-W.; Lee, Y.; Kim, S.-A. Design and Validation of a Real-Time Maintenance Monitoring System Using BIM and Digital Twin Integration. Buildings 2025, 15, 1312. [Google Scholar] [CrossRef] [Scilit]
- Minhas, M.R.; Potdar, V. Decision Support Systems in Construction: A Bibliometric Analysis. Buildings 2020, 10, 108. [Google Scholar] [CrossRef] [Scilit]
- Almulhim, A.I.; Yigitcanlar, T. Understanding Smart Governance of Sustainable Cities: A Review and Multidimensional Framework. Smart Cities 2025, 8, 113. [Google Scholar] [CrossRef] [Scilit]
- Esteban-Narro, R.; Lo-Iacono-Ferreira, V.G.; Torregrosa-López, J.I. Urban Stakeholders for Sustainable and Smart Cities: An Innovative Identification and Management Methodology. Smart Cities 2025, 8, 41. [Google Scholar] [CrossRef] [Scilit]
- Kolotouchkina, O.; Ripoll González, L.; Belabas, W. Smart Cities, Digital Inequalities, and the Challenge of Inclusion. Smart Cities 2024, 7, 3355–3370. [Google Scholar] [CrossRef] [Scilit]
- Lim, S.B.; Yigitcanlar, T. Participatory Governance of Smart Cities: Insights from e-Participation of Putrajaya and Petaling Jaya, Malaysia. Smart Cities 2022, 5, 71–89. [Google Scholar] [CrossRef] [Scilit]
- Gao, Z.; Wang, S.; Gu, J. Public Participation in Smart-City Governance: A Qualitative Content Analysis of Public Comments in Urban China. Sustainability 2020, 12, 8605. [Google Scholar] [CrossRef] [Scilit]
- Geekiyanage, D.; Fernando, T.; Keraminiyage, K. Mapping Participatory Methods in the Urban Development Process: A Systematic Review and Case-Based Evidence Analysis. Sustainability 2021, 13, 8992. [Google Scholar] [CrossRef] [Scilit]
- Prebanić, K.R.; Vukomanović, M. Exploring Stakeholder Engagement Process as the Success Factor for Infrastructure Projects. Buildings 2023, 13, 1785. [Google Scholar] [CrossRef] [Scilit]
- Moradi, S.; Kähkönen, K.; Sormunen, P. Analytical and Conceptual Perspectives toward Behavioral Elements of Collaborative Delivery Models in Construction Projects. Buildings 2022, 12, 316. [Google Scholar] [CrossRef] [Scilit]
- De Guimarães, J.C.F.; Severo, E.A.; Felix Júnior, L.A.; Da Costa, W.P.L.B.; Salmoria, F.T. Governance and quality of life in smart cities: Towards sustainable development goals. J. Clean. Prod. 2020, 253, 119926. [Google Scholar] [CrossRef] [Scilit]
- Bahadorestani, A.; Naderpajouh, N.; Sadiq, R. Planning for sustainable stakeholder engagement based on the assessment of conflicting interests in projects. J. Clean. Prod. 2020, 242, 118402. [Google Scholar] [CrossRef] [Scilit]
- Yu, A.T.W.; Yevu, S.K.; Nani, G. Towards an integration framework for promoting electronic procurement and sustainable procurement in the construction industry: A systematic literature review. J. Clean. Prod. 2020, 250, 119493. [Google Scholar] [CrossRef] [Scilit]
- Tang, Z.W.; Ng, S.T.; Skitmore, M. Influence of procurement systems to the success of sustainable buildings. J. Clean. Prod. 2019, 218, 1007–1030. [Google Scholar] [CrossRef] [Scilit]
- Lu, K.; Jiang, X.; Yu, J.; Tam, V.W.Y.; Skitmore, M. Integration of life cycle assessment and life cycle cost using building information modeling: A critical review. J. Clean. Prod. 2021, 285, 125438. [Google Scholar] [CrossRef] [Scilit]
- Baghalzadeh Shishehgarkhaneh, M.; Keivani, A.; Moehler, R.C.; Jelodari, N.; Roshdi Laleh, S. Internet of Things (IoT), Building Information Modeling (BIM), and Digital Twin (DT) in Construction Industry: A Review, Bibliometric, and Network Analysis. Buildings 2022, 12, 1503. [Google Scholar] [CrossRef] [Scilit]
- Santos, R.; Costa, A.A.; Silvestre, J.D.; Pyl, L. Integration of LCA and LCC analysis within a BIM-based environment. Autom. Constr. 2019, 103, 127–149. [Google Scholar] [CrossRef] [Scilit]
- Bennett, A.W.; Müller Loose, S. User-Centered Development of an Online Dashboard Tool for Economic Sustainability for Small and Medium Enterprises. Sustainability 2024, 16, 557. [Google Scholar] [CrossRef] [Scilit]
- Bogatinoska, B.; Lansu, A.; Hugé, J.; Dekker, S.C. Participatory Design of Nature-Based Solutions: Usability of Tools for Water Professionals. Sustainability 2022, 14, 5562. [Google Scholar] [CrossRef] [Scilit]
- Dembski, F.; Wössner, U.; Letzgus, M.; Ruddat, M.; Yamu, C. Urban Digital Twins for Smart Cities and Citizens: The Case Study of Herrenberg, Germany. Sustainability 2020, 12, 2307. [Google Scholar] [CrossRef] [Scilit]
- Azadi, S.; Kasraian, D.; Nourian, P.; van Wesemael, P. What Have Urban Digital Twins Contributed to Urban Planning and Decision Making? From a Systematic Literature Review Toward a Socio-Technical Research and Development Agenda. Smart Cities 2025, 8, 32. [Google Scholar] [CrossRef] [Scilit]
- Mousavi, Y.; Gharineiat, Z.; Karimi, A.A.; McDougall, K.; Rossi, A.; Gonizzi Barsanti, S. Digital Twin Technology in Built Environment: A Review of Applications, Capabilities and Challenges. Smart Cities 2024, 7, 2594–2615. [Google Scholar] [CrossRef] [Scilit]
- Mahomed, A.S.; Saha, A.K. Unleashing the Potential of 5G for Smart Cities: A Focus on Real-Time Digital Twin Integration. Smart Cities 2025, 8, 70. [Google Scholar] [CrossRef] [Scilit]
- Moreno, J.V.; Machete, R.; Falcão, A.P.; Gonçalves, A.B.; Bento, R. Dynamic Data Feeding into BIM for Facility Management: A Prototype Application to a University Building. Buildings 2022, 12, 645. [Google Scholar] [CrossRef] [Scilit]
- Harode, A.; Ensafi, M.; Thabet, W. Linking BIM to Power BI and HoloLens 2 to Support Facility Management: A Case Study Approach. Buildings 2022, 12, 852. [Google Scholar] [CrossRef] [Scilit]
Figure 1.
Primary Evaluation Areas for Built Environment Project Outcomes.
Figure 1.
Primary Evaluation Areas for Built Environment Project Outcomes.
Figure 2.
Methodological framework.
Figure 2.
Methodological framework.
Figure 3.
Hierarchy of the decision problem.
Figure 3.
Hierarchy of the decision problem.
Figure 4.
Fuzzy AHP weight derivation and integration with the Fuzzy VIKOR process for ranking alternatives in Multi-Criteria Decision-Making.
Figure 4.
Fuzzy AHP weight derivation and integration with the Fuzzy VIKOR process for ranking alternatives in Multi-Criteria Decision-Making.
Figure 5.
Calculation steps of Fuzzy VIKOR.
Figure 5.
Calculation steps of Fuzzy VIKOR.
Figure 9.
Summary of normalized weighting.
Figure 9.
Summary of normalized weighting.
Figure 10.
Summary of the final result ranking.
Figure 10.
Summary of the final result ranking.
Figure 11.
Distribution of weightage. Evaluator 1.
Figure 11.
Distribution of weightage. Evaluator 1.
Figure 12.
Weightage distribution and evaluator rankings.
Figure 12.
Weightage distribution and evaluator rankings.
Figure 13.
Final ranking.
Figure 13.
Final ranking.
Figure 14.
Radar chart showing the sensitivity of the model for the criteria weightage.
Figure 14.
Radar chart showing the sensitivity of the model for the criteria weightage.
Figure 15.
User preference sensitivity for all scenarios.
Figure 15.
User preference sensitivity for all scenarios.
Table 1.
IPD values.
| IPD Values | Publication List |
|---|
| Procedural fairness and equitable treatment with a collaborative culture | A = [5] B = [17] D = [19] E = [20] F = [22] G = [23] I = [25] J = [37] K = [38] L = [39] M = [40] N = [41] O = [42] P = [43] Q = [44] R = [45] S = [46] T = [47] U = [48] V = [49] W = [50] |
| Pooled risk/reward with a target cost and an allowable cost ceiling | R = [45] V = [49] W = [50] X = [51] Y = [52] |
| Early stakeholder integration in planning and design | A = [5] B = [17] C = [18] I = [25] J = [37] K = [38] M = [40] N = [41] O = [42] P = [43] Q = [44] R = [45] T = [47] U = [48] Z = [53] |
| Lower change order incidence, compressed schedules, and reduced RFI volume | R = [45] T = [47] U = [48] V = [50] |
| Deliberate cultivation of relational trust among parties | B = [17] C = [18] D = [19] F = [22] G = [23] Z = [53] |
| Process efficiency gains with defect/error reduction | J = [37] P = [43] Q = [44] R = [45] W = [50] |
| Reduce schedule time | A = [5] D = [19] E = [20] K = [38] I = [25] M = [40] N = [41] O = [42] Q = [44] |
| Reduce waste | R = [45] E = [20] D = [19] O = [42] N = [41] J = [37] K = [38] I = [25] Q = [44] |
| Reduce project duration and liability by fast-tracking design and construction | A = [5] G = [23] Q = [44] R = [45] U = [48] |
| Shared cost, risk, reward, and responsibilities | B = [17] C = [18] D = [19] K = [38] L = [25] M = [44] M = [40] J = [37] Z = [53] E = [20] |
| Open communication/transparent information flow with rigorous schedule governance | D = [19] E = [20] F = [22] I = [25] K = [38] Q = [44] U = [48] AA = [54] |
| Multi-party agreement and noncompetitive bidding | A = [5] J = [37] K = [38] L = [25] M = [40] N = [41] O = [42] Q = [44] |
| Cross-functional decision-making for designs and shared design responsibilities | E = [20] M = [40] N = [41] O = [42] R = [45] T = [47] V = [49] |
| A = [5] B = [17] C = [18] D = [19] E = [20] F = [22] G = [23] I = [25] J = [37] K = [38] L = [39] M = [40] N = [41] O = [42] P = [43] Q = [44] R = [45] S = [46] T = [47] U = [48] V = [49] W = [50] X = [51] Y = [52] Z = [53] AA = [54] |
Table 2.
Technical sub-criteria list used in assessing sustainability.
Table 2.
Technical sub-criteria list used in assessing sustainability.
| Sub-Criteria | Description/Statement from Published Authors | Dimension | Authors |
|---|
| Communication and collaboration between project teams | The continual communication between the client and design team enables enhanced trust and facilitates knowledge sharing between participants, which is crucial to the continual development and technological trajectory of the construction industry in sustainable building [13]. | Qualitative | C = [13] D = [17] E = [19] F = [20] G = [22] L = [50] Q = [75] R = [76] S = [35] T = [77] U = [32] |
| Current workload | This criterion illustrates the current works undertaken by the contractor before starting the particular project. The net worth of a contractor and its current assets and capacity of bid reflects whether or not the contractor is capable of executing the next project [78]. | Qualitative | A = [5] K = [44] L = [51] M = [51] P = [60] V = [78] W = [79] |
| Construction approach and technology | Construction approach and technology establish the company’s capacity for technology and innovation for increasing the sustainability of both the construction process and its resultant assets [80]. | Qualitative | E = [19] H = [25] I = [37] J = [43] X = [80] Y = [81] |
| Qualification of personnel | Qualification of personnel establishes that the qualification and experience level of company staff, as well as their track record, are important in assessing candidate contractors’ abilities [82]. | Qualitative | B = [12] N = [52] Z = [82] AA = [83] |
| A = [5] B = [12] C = [13] U = [33] S = [36] I = [38] D = [17] E = [19] F = [20] G = [22] H = [26] J = [44] K = [45] L = [51] M = [52] N = [53] P = [61] Q = [76] R = [77] T = [78] V = [79] W = [80] X = [81] Y = [82] Z = [83] AA = [84] |
Table 3.
Social sub-criteria list used in assessing sustainability.
Table 3.
Social sub-criteria list used in assessing sustainability.
| Sub-Criteria | Description/Statement from Published Authors | Dimension | Author |
|---|
| Trust among project teams | Honest communication, reliance, and delivery of outcomes are the main factors that govern trust in the construction industry [30]. | Qualitative | A = [17] B = [18] C = [19] D = [22] F = [53] H = [35] I = [32] K = [30] L = [34] |
| Company image/reputation | The clients’ and consultants’ satisfaction and past awards measure the reputation. Certificates of appreciation awarded by different agencies can further measure this parameter, and it covers the types of complex projects successfully finished in the past [78]. | Qualitative | J = [78] M = [84] N = [85] O = [86] |
| Geographic familiarity | This inspects the familiarity of the contractor with the local environment of the site or area where the project is to be executed. Experience in a particular region helps contractors to know the current politics, environment, local government, local laborers, and suppliers [78]. | Qualitative | J = [78] Q = [87] R = [88] V = [89] |
| Claims and litigation history | Claims and litigation history is a critical sub-criterion under the social sub-criteria for assessing sustainability in water and wastewater Public–Private Partnership (PPP) projects. These projects involve various stakeholders and risks, including those related to investors, consultants, and external factors. Evaluating claims and litigation history helps address uncertainties, such as poor decision-making and operational disruptions, thereby promoting trust and mitigating conflicts, essential for the long-term success of sustainability initiatives [90]. | Qualitative | E = [42] S = [90] T = [91] U = [92] |
| A = [17] B = [18] C = [19] D = [22] K = [30] I = [32] L = [34] H = [35] E = [42] F = [53] J = [78] M = [84] N = [85] O = [86] Q = [87] R = [88] V = [89] S = [90] T = [91] U = [92] |
Table 4.
Economic sub-criteria list used in assessing sustainability.
Table 4.
Economic sub-criteria list used in assessing sustainability.
| Sub-Criteria | Description/Statement from Published Authors | Dimension | Author |
|---|
| Financial strength | The financial strength of the contractor is the degree to which the contractor can resist financial challenges without running into bankruptcy [79]. | Quantitative | J = [94] I = [79] K = [95] |
| Performance bond | The concept of a performance bond, guarantee, and any insurance-like scheme has been adapted into the construction contract as a financial mechanism to ensure project delivery [96]. | Quantitative | L = [96] E = [47] F = [52] A = [20] C = [42] B = [25] D = [44] |
| Cost management | Cost management can be defined as the management of cost-related activities achieved by collecting, analyzing, evaluating, and reporting cost information used for budgeting, estimating, forecasting, and monitoring costs [97]. | Qualitative | H = [77] N = [98] O = [99] G = [35] M = [97] |
| Financial liquidity | Bidder’s financial liquidity is the bidder’s ability to fulfil (repay) in due time the most chargeable (short-term) liabilities (e.g., related to the payment to business partners for products and services, payment of remuneration, etc.) [100]. | Quantitative
| P = [100] Q = [101] |
| A = [20] B = [25] C = [42] E = [47] F = [52] G = [35] H = [77] I = [79] J = [94] K = [95] L = [96] M = [97] N = [98] O = [99] P = [100] Q = [101] |
Table 5.
Environmental sub-criteria list used in assessing sustainability.
Table 5.
Environmental sub-criteria list used in assessing sustainability.
| Sub-Criteria | Description/Statement from Published Authors | Dimension | Author |
|---|
| Wastage in production | Identifying the causes of construction waste production will help us decide better how to control this sort of waste [103]. | Qualitative | A = [79] B = [103] |
| Contractor safety performance | Contractor safety performance among major selection criteria can ultimately bring significant improvements to the building industry’s safety [104]. | Qualitative | C = [104] D = [105] E = [106] |
| GHG emission containment | Growing concern about global warming and climate change, the construction industry, as a major contributor to greenhouse gas (GHG) emissions, has begun to realize its essential role in improving the environment by reducing emissions through the lifecycle of buildings and infrastructures [107]. | Quantitative | F = [107] G = [108] H = [109] I = [110] J = [111] |
| Reuse material | New research [112] establishes that the reuse of materials improves material efficiency across all economic sectors and represents the second-best choice after waste prevention to decrease resource consumption and carbon emissions and divert demolition waste from landfills [112]. | Quantitative | K = [112] L = [113] M = [114] N = [115] O = [116] |
| A = [79] B = [103] C = [104] D = [105] E = [106] F = [107] G = [108] H = [109] I = [110] J = [111] K = [112] L = [113] M = [114] N = [115] O = [116] |
Table 6.
Combined impact of IPD and QBS: a holistic and superior DSS.
Table 6.
Combined impact of IPD and QBS: a holistic and superior DSS.
| Feature | Traditional DSS | Proposed DSS (IPD + QBS) |
|---|
| Primary Selection Focus | Price, basic capability | Collaboration, sustainability, and qualifications |
| Contractor Involvement Timing | Post-design | Early (IPD-aligned) |
| Evaluation Depth | Technical specs only | Lifecycle, innovation, and sustainability criteria |
| Decision-Making Structure | Owner-led | Multi-criteria and stakeholder-inclusive |
| Bias Control and Objectivity | Limited | Enhanced via structured QBS + MCDM tools |
Table 7.
Prequalification checklist and mandatory submission requirements.
Table 7.
Prequalification checklist and mandatory submission requirements.
| Item No. | Prequalification List | Requirement |
|---|
| 1 | Acknowledgement of all addenda, if any | Mandatory |
| 2 | Evidence provided of general liability coverage for CAD 10 M and CCDC30 | Mandatory |
| 3 | Evidence provided for COR for Alberta and Saskatchewan | Mandatory |
| 4 | Evidence provided for WCB letters of clearance for AB and SK | Mandatory |
| 5 | Non-collusion affidavit | Mandatory |
| 6 | Equal employment opportunities employer affidavit | Mandatory |
| 7 | Team commitment and availability affidavit | Mandatory |
Table 8.
Comparison matrix for criteria weight derivation.
Table 8.
Comparison matrix for criteria weight derivation.
| | Criteria 1 | Criteria 2 | Criteria 3 | … | Criteria n |
|---|
| Criteria 1 | 1 | a12 | a13 | … | a1n |
| Criteria 2 | a21 | 1 | a23 | … | a2n |
| Criteria 3 | a31 | a32 | 1 | … | a3n |
| … | … | … | … | … | … |
| Criteria n | an1 | an2 | an3 | … | 1 |
Table 9.
Pairwise comparison of criteria.
Table 9.
Pairwise comparison of criteria.
| Importance Index | Definition of Importance Index |
|---|
| 1 | Equally Important Preferred |
| 2 | Equally to Moderately Important Preferred |
| 3 | Moderately Important Preferred |
| 4 | Moderately to Strongly Important Preferred |
| 5 | Strongly Important Preferred |
| 6 | Strongly to Very Strongly Important Preferred |
| 7 | Very Strongly Important Preferred |
| 8 | Very Strongly to Extremely Important Preferred |
| 9 | Extremely Important Preferred |
Table 10.
Importance index and fuzzy numbers.
Table 10.
Importance index and fuzzy numbers.
| Importance Index | Crisp Number | Fuzzy Number (l, m, n, p) |
|---|
| Extremely more important | 9 | 7, 8, 9, 10 |
| Very strongly more important | 7 | 5, 6, 7, 8 |
| Strongly more important | 5 | 3, 4, 5, 6 |
| Moderately more important | 3 | 1, 2, 3, 4 |
| Equal importance | 1 | 1, 1, 1, 1 |
| Moderately less important | 1/3 | 1/4, 1/3, 1/2, 1 |
| Strongly less important | 1/5 | 1/6, 1/5, 1/4, 1/3 |
| Very strongly less important | 1/7 | 1/8, 1/7, 1/6, 1/5 |
| Extremely less important | 1/9 | 1/10, 1/9, 1/8, 1/7 |
Table 11.
Study parameters.
Table 11.
Study parameters.
| Parameters | Details |
|---|
| Project location | Edmonton |
| Building type | Banquet Centre |
| Project Delivery Method | IPD |
| Contractor options | 4 |
| Building height | 20.2 s (m) |
| Number of floors | 2 |
| Gross floor area | 1798.26 m2 |
| Structural components considered | Columns and beams |
Table 12.
Details of the respondents who took part in the case study.
Table 12.
Details of the respondents who took part in the case study.
| Team | Role in the Case Study | Profession/Position | Company/Institution | Work Experience (Years) |
|---|
| Team 1 | Evaluator 1a | Construction Manager | Brook Atlantic | 25–30 |
| | Evaluator 2a | Quantity Surveyor | Stantec | 25–30 |
| | Evaluator 3a | Financial Analyst | Clark Builders | 20–25 |
| Team 2 | Evaluator 1b | Construction Manager | University of Alberta | 20–25 |
| | Evaluator 2b | Quantity Surveyor | ABMK Engineering | 30–35 |
| | Evaluator 3c | Financial Analyst | Bird Construction | 25–35 |
| Team 3 | Evaluator 1c | Construction Manager | University of Alberta | 25–25 |
| | Evaluator 2c | Quantity Surveyor | Chandos Construction | 25–30 |
| | Evaluator 3c | Financial Analyst | Alberta Masonry Council, Wood Works | 20–25 |
Table 13.
Linguistic term.
Table 13.
Linguistic term.
| Linguistic Term | Conversion Scale in Normalized Matrix |
|---|
| Very High | >0.89 |
| High | 0.80 to 0.89 |
| Medium | 0.70 to 0.79 |
| Low | 0.60 to 0.69 |
| Very Low | <60 |
Table 14.
Converted into a normalized matrix.
Table 14.
Converted into a normalized matrix.
| Alternatives | Current Workload (%/Week) | Financial Strength
(CAD/Project) | Performance Bond
(CAD/Project) | Cost Management
(CAD/Project) |
|---|
| Contractor 1 | 0.3216 | 0.2857 | 0.1724 | 0.3333 |
| Contractor 2 | 0.2807 | 0.2161 | 0.3275 | 0.3188 |
| Contractor 3 | 0.1754 | 0.1597 | 0.2758 | 0.0724 |
| Contractor 4 | 0.2222 | 0.3383 | 0.2241 | 0.2753 |
| Alternatives | Financial Liquidity (CAD/Project) | Contractor Safety Performance (CAD/Project) | Wastage in Production (CAD/Project) | GHG Emission Containment
(kg CO2 Equivalent/Sqm) |
| Contractor 1 | 0.2216 | 0.2857 | 0.1724 | 0.3333 |
| Contractor 2 | 0.2807 | 0.2422 | 0.3275 | 0.3188 |
| Contractor 3 | 0.1988 4 | 0.2511 | 0.1821 | 0.0812 |
| Contractor 4 | 0.2222 | 0.3383 | 0.2241 | 0.2753 |
Table 15.
Shannon diversity index.
Table 15.
Shannon diversity index.
| Alternatives | Current Workload (%/Project) | Financial Strength (CAD/Project) | Performance Bond (CAD/Project) | Cost Management (CAD/Project) |
|---|
| Shannon diversity index | 1.36 | 1.35 | 1.36 | 1.34 |
| Alternatives | Financial Liquidity (CAD/Project) | Contractor Safety Performance (CAD/Project) | Wastage in Production (CAD/Project) | Greenhouse Gas Emissions (kg CO2 Equivalent/sqm) |
| Shannon diversity index | 1.37 | 1.32 | 1.38 | 1.29 |
Table 16.
Shannon equitability index.
Table 16.
Shannon equitability index.
| Alternatives | Current Workload (CAD/Project) | Financial Strength (CAD/Project) | Performance Bond (CAD/Project) | Cost Management (CAD/Project) |
|---|
| Shannon equitability index | 0.995 | 0.997 | 1.00 | 0.999 |
| Alternatives | Financial Liquidity (CAD/Project) | Contractor Safety Performance (CAD/Project) | Wastage in Production (CAD/Project) | Greenhouse Gas Emissions (kg CO2 Equivalent/sqm) |
| Shannon equitability index | 1.00 | 0.986 | 0.992 | 0.99 |
Table 17.
Range determined.
Table 17.
Range determined.
| Linguistic Term | Conversion Scale in Normalized Matrix |
|---|
| Very High | >0.2750 |
| High | 0.2235 to 0.2750 |
| Medium | 0.1700 to 0.2235 |
| Low | 0.1225 to 0.1700 |
| Very Low | <0.12225 |
Table 18.
Output of the subjective result.
Table 18.
Output of the subjective result.
| Alternatives | Current Workload
(CAD/Project) | Financial Strength
(CAD/Project) | Performance Bond
(CAD/Project) | Cost Management
(CAD/Project) |
|---|
| Contractor 1 | Very High | Very High | Low | Very High |
| Contractor 2 | High | Medium | Very High | Very High |
| Contractor 3 | Low | Low | High | Very Low |
| Contractor 4 | Medium | Very High | Medium | High |
| Alternatives | Financial Liquidity (CAD/Project) | Contractor Safety Performance (CAD/Project) | Wastage in Production
(CAD/Project) | Greenhouse Gas Emission
(kg CO2 Equivalent/sqm) |
| Contractor 1 | Very High | High | Low | High |
| Contractor 2 | High | Medium | Very High | Very High |
| Contractor 3 | Medium | Medium | Very High | Low |
| Contractor 4 | High | Very High | Medium | High |
Table 19.
Pairwise comparison matrix.
Table 19.
Pairwise comparison matrix.
| Criteria | Fuzzy Normalized Weight | Weight-Based Rank of Criteria |
|---|
| Communication/collaboration | 0.0668 | 8 |
| Current workload | 0.0347 | 14 |
| Construction methodology | 0.0547 | 11 |
| Qualification of personnel | 0.07 | 10 |
| Financial strength | 0.0417 | 12 |
| Performance bond | 0.088 | 2 |
| Cost management | 0.070 | 7 |
| Financial liquidity | 0.0365 | 13 |
| Trust | 0.08 | 4 |
| Company image/reputation | 0.0844 | 3 |
| Geographic familiarity | 0.0274 | 15 |
| Claims and litigation history | 0.066 | 9 |
| Wastage in production | 0.074 | 6 |
| Contractor safety performance | 0.104 | 1 |
| GHG emission containment | 0.077 | 5 |
| Reuse of material | 0.0269 | 16 |
Table 20.
Ranking of alternatives for Team 3.
Table 20.
Ranking of alternatives for Team 3.
| | Qi (Evaluator 1) | Qi (Evaluator 2) | Qi (Evaluator 3) | Weighted Qi | Rank |
|---|
| Importance of Opinion | 0.4 | 0.3 | 0.3 | | |
| Contractor 1 | 1.000 | 1.000 | 1.000 | 1.000 | 4 |
| Contractor 2 | 0.948 | 0.699 | 0.854 | 0.845 | 3 |
| Contractor 3 | 0.000 | 0.000 | 0.000 | 0.040 | 1 |
| Contractor 4 | 0.634 | 0.663 | 0.796 | 0.692 | 2 |
Table 21.
The overall result of Fuzzy VIKOR for different teams.
Table 21.
The overall result of Fuzzy VIKOR for different teams.
| | Team 1 | Team 2 | Team 3 |
|---|
| Alternatives | Weighted Qi | Rank | Weighted Qi | Rank | Weighted Qi | Rank |
| Contractor 1 | 0.027 | 1 | 0.306 | 2 | 1.000 | 4 |
| Contractor 2 | 0.342 | 2 | 0.199 | 1 | 0.845 | 3 |
| Contractor 3 | 0.997 | 4 | 0.850 | 4 | 0.040 | 1 |
| Contractor 4 | 0.946 | 3 | 0.580 | 3 | 0.692 | 2 |
Table 22.
Scenario/situation assessment by sustainability pillars.
Table 22.
Scenario/situation assessment by sustainability pillars.
| Pillars of Sustainability | Criteria | Base Weight | Situation 1 (CW) | Situation 2
(CW) | Situation 3
(CW) | Situation 4
(CW) |
|---|
| Technical | Communication/collaboration | 0.05 | 0.10 | 0.05 | 0.05 | 0.05 |
| Current workload | 0.05 | 0.10 | 0.05 | 0.05 | 0.05 |
| Construction methodology | 0.05 | 0.10 | 0.05 | 0.05 | 0.0 |
| Qualification of personnel | 0.05 | 0.10 | 0.05 | 0.05 | 0.05 |
| Economic | Financial strength | 0.05 | 0.05 | 0.10 | 0.05 | 0.05 |
| Performance bond | 0.05 | 0.05 | 0.10 | 0.05 | 0.05 |
| Cost management | 0.05 | 0.05 | 0.10 | 0.05 | 0.05 |
| Financial liquidity | 0.05 | 0.05 | 0.10 | 0.05 | 0.05 |
| Social | Trust | 0.05 | 0.05 | 0.05 | 0.10 | 0.05 |
| Company image/reputation | 0.05 | 0.05 | 0.05 | 0.10 | 0.05 |
| Geographic familiarity | 0.05 | 0.05 | 0.05 | 0.10 | 0.05 |
| Claims and litigation history | 0.05 | 0.05 | 0.05 | 0.10 | 0.05 |
| Environmental | Wastage in production, contractor safety performance, GHG emission containment, and reuse of material | 0.05 | 0.05 | 0.05 | 0.05 | 0.10 |
| 0.05 | 0.05 | 0.05 | 0.05 | 0.10 |
| 0.05 | 0.05 | 0.05 | 0.05 | 0.10 |
| 0.05 | 0.05 | 0.05 | 0.05 | 0.10 |
Table 23.
CCi values for four situations.
Table 23.
CCi values for four situations.
| Situation 1 | Situation 2 |
|---|
| Contractor | Evaluator 1 | Evaluator 1 | Evaluator 1 | Overall | Rank | Evaluator 2 | Evaluator 2 | Evaluator 2 | Overall | Rank |
| C1 | 0.277 | 0.759 | 0.760 | 0.512 | 1 | 0.593 | 0.593 | 0.593 | 0.794 | 4 |
| C2 | 0.542 | 0.509 | 0.540 | 0.366 | 2 | 0.680 | 0.378 | 0.654 | 0.571 | 2 |
| C2 | 0.348 | 0.348 | 0.470 | 0.343 | 3 | 0.593 | 0.733 | 0.785 | 0.686 | 1 |
| C3 | 0.368 | 0.366 | 0.367 | 0.337 | 4 | 0.450 | 0.378 | 0.601 | 0.476 | 3 |
| Situation 3 | Situation 4 |
| Contractor | Evaluator 3 | Evaluator 3 | Evaluator 3 | Overall | Rank | Evaluator 1 | Evaluator 2 | Evaluator 3 | Overall | Rank |
| C1 | 0.478 | 0.449 | 0.538 | 0.488 | 3 | 0.402 | 0.502 | 0.724 | 0.543 | 2 |
| C2 | 0.568 | 0.431 | 0.618 | 0.539 | 2 | 0.323 | 0.458 | 0.786 | 0.522 | 3 |
| C3 | 0.333 | 0.303 | 0.789 | 0.475 | 4 | 0.647 | 0.338 | 0.493 | 0.493 | 4 |
| C4 | 0.659 | 0.572 | 0.754 | 0.662 | 1 | 0.388 | 0.722 | 0.777 | 0.629 | 1 |
Table 24.
Effective ratings for alternatives.
Table 24.
Effective ratings for alternatives.
| Criteria Category | Alternative 1 | Alternative 2 | Alternative 3 | Alternative 4 | Scenario |
|---|
| Technical Criteria | Very High (7, 8, 9, 10) | High (5, 6, 7, 8) | Medium (3, 4, 5, 6) | Low (1, 2, 3, 4) | Situation 1 |
| Economic Criteria | Low (1, 2, 3, 4) | Very High (7, 8, 9, 10) | High (5, 6, 7, 8) | Medium (3, 4, 5, 6) | Situation 1 |
| Social Criteria | Medium (3, 4, 5, 6) | Low (1, 2, 3, 4) | Very High (7, 8, 9, 10) | High (5, 6, 7, 8) | Situation 1 |
| Environmental Criteria | High (5, 6, 7, 8) | Medium (3, 4, 5, 6) | Low (1, 2, 3, 4) | Very High (7, 8, 9, 10) | Situation 1 |
| Technical Criteria | Very High (7, 8, 9, 10) | High (5, 6, 7, 8) | Medium (3, 4, 5, 6) | Low (1, 2, 3, 4) | Situation 2 |
| Economic Criteria | Low (1, 2, 3, 4) | Very High (7, 8, 9, 10) | High (5, 6, 7, 8) | Medium (3, 4, 5, 6) | Situation 2 |
| Social Criteria | Medium (3, 4, 5, 6) | Low (1, 2, 3, 4) | Very High (7, 8, 9, 10) | High (5, 6, 7, 8) | Situation 2 |
| Environmental Criteria | High (5, 6, 7, 8) | Medium (3, 4, 5, 6) | Low (1, 2, 3, 4) | Very High (7, 8, 9, 10) | Situation 2 |
| Beneficial Criteria | Very High (7, 8, 9, 10) | High (5, 6, 7, 8) | Medium (3, 4, 5, 6) | Low (1, 2, 3, 4) | Situation 3 |
| Cost Criteria | Low (1, 2, 3, 4) | Medium (3, 4, 5, 6) | High (5, 6, 7, 8) | Very High (7, 8, 9, 10) | Situation 3 |
| Beneficial Criteria | Very High (7, 8, 9, 10) | High (5, 6, 7, 8) | Medium (3, 4, 5, 6) | Low (1, 2, 3, 4) | Situation 4 |
| Cost Criteria | Low (1, 2, 3, 4) | Medium (3, 4, 5, 6) | High (5, 6, 7, 8) | Very High (7, 8, 9, 10) | Situation 4 |
Table 25.
Situation assessment by sustainability pillars.
Table 25.
Situation assessment by sustainability pillars.
| Scenario | Alternative | CCi | Rank | Best Alternative | Worst Alternative |
|---|
| Situation 1 | Alternative 1 | 0.5135 | 3 | | |
| Situation 1 | Alternative 2 | 0.5155 | 1 | ✔ | |
| Situation 1 | Alternative 3 | 0.5135 | 3 | | |
| Situation 1 | Alternative 4 | 0.5155 | 1 | ✔ | |
| Situation 2 | Alternative 1 | 0.3035 | 4 | | ✔ |
| Situation 2 | Alternative 2 | 0.5155 | 1 | ✔ | |
| Situation 2 | Alternative 3 | 0.4023 | 3 | | |
| Situation 2 | Alternative 4 | 0.4515 | 2 | | |
| Situation 3 | Alternative 1 | 0.998 | 1 | ✔ | |
| Situation 3 | Alternative 2 | 0.5023 | 2 | | |
| Situation 3 | Alternative 3 | 0.3035 | 3 | | |
| Situation 3 | Alternative 4 | 0.005 | 4 | | ✔ |
| Situation 4 | Alternative 1 | 0.08 | 4 | | ✔ |
| Situation 4 | Alternative 2 | 0.2035 | 3 | | |
| Situation 4 | Alternative 3 | 0.5023 | 2 | | |
| Situation 4 | Alternative 4 | 0.889 | 1 | ✔ | |
| Disclaimer/Publisher’s Note: The statements, opinions and data contained in all publications are solely those of the individual author(s) and contributor(s) and not of MDPI and/or the editor(s). MDPI and/or the editor(s) disclaim responsibility for any injury to people or property resulting from any ideas, methods, instructions or products referred to in the content. |