Abstract
This study focuses on the interplay between digital marketing and the F&B industry in Greece during the health crisis of COVID-19 in shaping consumer choices. The theoretical section discusses the most popular digital marketing methods and their importance, particularly during a crisis that confined most citizens to their homes and forced F&B stores to find new ways to attract customers. From an empirical perspective, a survey was conducted utilizing a structured questionnaire, involving 70 consumers in Athens, Greece. Participants expressed their views through closed-ended questions on the criteria for selecting F&B stores, the positive and negative aspects of digital marketing, and their preferences in general, as well as specifically for restaurants, bars, and cafés. The findings highlight that consumer confidence is a key priority (as the most important criterion for selecting F&B stores is the quality of the products) and that digital transformation of the F&B industry is essential as it can bolster resilience and drive growth in the F&B sector amid ongoing challenges.
1. Introduction
The COVID-19 pandemic profoundly altered consumer behaviors and reshaped traditional business models across industries. Among the most significantly affected was the Food and Beverage (F&B) industry, which faced unprecedented challenges due to lockdowns, social distancing measures, and changing customer preferences. In this context, digital marketing emerged as a critical tool for navigating these disruptions, enabling F&B stores (restaurants, bars, and cafés) to maintain customer engagement, adapt operations, and sustain revenue streams.
Digital marketing leverages online platforms such as social media, search engines, and email campaigns to connect businesses with their target audience. Its flexibility, cost-effectiveness, and data-driven capabilities have proven invaluable during the pandemic, allowing businesses to respond swiftly to dynamic market conditions. For the F&B industry, where customer interactions traditionally relied on in-person experiences, the transition to digital strategies became essential. F&B stores utilized digital tools not only to promote their offerings but also to communicate safety measures, foster trust, and enhance customer loyalty.
This paper examines the interplay between digital marketing and the F&B industry, especially during the health crisis of COVID-19. By exploring consumer preferences and perceptions of digital marketing, it highlights the evolving role of online engagement in shaping dining choices. Key areas of investigation include the criteria influencing F&B store selection, the advantages and drawbacks of digital marketing, and consumer tendencies in accessing digital content. The findings aim to provide insights into how digital marketing strategies can bolster resilience and drive growth in the F&B sector amid ongoing challenges. Furthermore, differences in selection criteria for different types of F&B stores, i.e., restaurants, bars, and cafés, are examined and critically evaluated.
Building upon this, the following sub-sections delve deeper into the specifics of digital marketing, exploring its tools, methods, and implications for businesses, particularly in the F&B industry. By examining various digital marketing strategies—ranging from social media engagement to search engine optimization—and their impact on customer relationships, the analytical sub-sections underscore how these tools enabled F&B stores to adapt, innovate, and maintain competitiveness amidst unprecedented challenges. This analysis provides a comprehensive understanding of the mechanisms through which digital marketing supported the F&B sector, setting the stage for the empirical findings of this study.
The paper is structured as follows: First, the literature review provides an overview of the subject. Next, the methodology employed is presented. Then, the results of the empirical analysis are presented and discussed. Finally, concluding remarks are offered alongside suggestions for further research.
2. Literature Review
2.1. Digital Marketing
Digital marketing has become even more important during the COVID-19 pandemic [1], as people spend more time online and businesses have had to adapt to new realities, such as lockdowns, social distancing, and reduced mobility. With people increasingly engaging with the internet, digital marketing provides businesses with a means to connect with their audience where they are. Channels like social media, email, and search engines have proven effective for targeting and interacting with customers [2].
Digital marketing is also often more cost-effective than traditional marketing, which has been disrupted by lockdowns or decreased consumer spending [3]. Businesses can leverage digital channels to reach their audience without incurring the high costs of traditional marketing campaigns. Additionally, digital marketing is flexible and adaptable, allowing businesses to quickly adjust messages or campaigns in response to changing conditions. For example, businesses can tailor their messaging to meet the needs of new customer segments or align with updated public health guidelines.
Moreover, digital marketing provides valuable data and insights into customers, which businesses can use to improve campaigns and make informed decisions. This is especially critical during the pandemic, as consumer behaviors and needs may shift rapidly.
With many businesses forced to close physical locations or limit in-person interactions, e-commerce has become increasingly vital. Digital marketing can drive customers to online stores and help businesses connect with customers who prefer shopping online. Overall, digital marketing has been essential for businesses during the COVID-19 pandemic, helping them stay connected with their customers and adapt to new challenges. Ref. [4] showed that the use of digital marketing in Greece was particularly boosted during COVID-19 and that Millennials and Generation X customers, possessing different digital skills, ended up developing different consumer preferences.
One of the markets most significantly impacted by the pandemic was the F&B industry. F&Bs faced multiple closures during 2020–2021, leading to severe financial difficulties for many owners, who were forced to become more inventive to attract customers, whether through takeaway options or encouraging visits during periods of reopening.
2.2. Digital Marketing Tools
Digital marketing is fundamentally driven by the use of tools, which are crucial for executing advertising initiatives aimed at increasing profits through the acquisition of new customers and the retention of existing ones. It is not a completely new marketing philosophy but rather an advanced channel in the communication mix shaped by technological advancements. These tools are broadly categorized into online and traditional (offline) methods [5].
Online tools include websites, which play a vital role in advertising products, facilitating purchases, and enabling direct communication with businesses. Email marketing is another essential tool, allowing companies to target specific audiences and build personal connections with both current and prospective customers. Social media platforms provide opportunities for businesses to promote their products, offer customer service, and establish communication channels that enhance customer engagement [6,7]. Similarly, blogs foster discussions and user interactions, allowing businesses to showcase products while benefiting from user reviews and feedback, which can significantly boost sales [6,8].
Search Engine Optimization (SEO) improves user experience on company websites, making them more visible on search engines and attracting new customers. Big data marketing involves collecting and analyzing consumer information to design personalized campaigns through strategies such as segmentation and feedback. Online advertising, a significant component of digital marketing, utilizes various paid methods, including banners, pop-ups, video ads, and Google AdWords, to promote goods and services effectively [6]. Visual marketing through video content, shared on platforms like YouTube, is another powerful tool for product promotion [5].
Mobile marketing taps into the ubiquity of smartphones and apps, offering engaging and tailored experiences that directly address consumer needs and preferences. Wearable technology, such as smart watches and glasses, allows businesses to analyze consumer behavior and design highly targeted marketing campaigns [5]. The transfer of consumer data has also become a robust strategy, enabling personalized marketing by providing direct Internet access to users, particularly in retail. Additionally, gamification integrates advertising into video games, leveraging players’ interests and behaviors to create impactful marketing strategies [6].
Offline tools, though predating digital methods, remain relevant and include television and radio advertising, mobile text messages, and digital billboards. These traditional methods complement online efforts, demonstrating the enduring value of non-digital approaches in a comprehensive marketing strategy.
In conclusion, digital marketing encompasses a wide range of tools, both online and offline, offering businesses diverse opportunities to engage with their audiences [6]. Internet-based advertising has gained significant prominence, enabling companies to adapt to evolving consumer behaviors and leverage data-driven insights to create effective campaigns.
2.3. Importance of Digital Marketing
This section provides a brief critical overview of the main factors of consumer preferences relating to digital marketing that could potentially have a key role in F&B sector growth and sustainability.
The first and most critical phase of sales promotion is establishing brand recognition. This has been achieved in the operations of companies by using a variety of marketing communication techniques. The truth is that digital marketing tools are an evolution of traditional advertising methods and have gained importance due to the interactivity they offer, both for customers and producers of products and services. By using these tools, customers become active participants in the marketing process, as opposed to traditional tools where they were merely spectators. Therefore, the methodical and planned use of digital marketing by companies and services has proven to help achieve competitive advantages [9]
Moreover, buyers now spend a significant amount of time browsing through materials on various social media platforms. Online marketing, therefore, can influence how consumers make decisions. Digital marketing has thus evolved into an essential element for businesses to obtain and utilize information about customers and subsequently assist customers in making purchasing decisions [9]. Through digital marketing, customers can connect with a company’s many products, and it has the capability to disseminate information quickly and widely.
To increase their competitive edge, many businesses are turning to digital marketing, as it enhances a company’s brand recognition while simultaneously increasing customer loyalty. Additionally, digital marketing provides the ability to save on advertising costs and boosts customer visits to the brand’s online pages, thereby improving the company’s visibility on search engines. The importance of using digital marketing in a business is also evident in the fact that it has fostered excellent relationships with customers while online social networks provide a strong and effective medium for advertising goods and services.
The fundamental strengths of digital marketing lie in its ability to gradually replace traditional methods, strategies, and tools of traditional marketing [9]. Specifically, its practical application enables businesses to:
- Open avenues for product and service differentiation and customization.
- Optimize communication with customers. Customers can ask questions and receive immediate answers through various channels, including social networks, internet services, and websites.
- Achieve higher accuracy in the strategies employed for promotion. Traditional advertising often yields uncertain and misleading results, whereas digital marketing results are quickly and accurately measurable (using advanced statistical methods) and available in real-time.
- Maximize productivity in gathering, preparing, analyzing, and interpreting information required for various operations.
- Increase accountability for tasks performed within the company.
- Develop new, wide-reaching methods to engage and retain customers for higher loyalty rates.
- Boost sales revenue and profits through digital marketing, as high-quality online ads and posts related to business functions increase consumer engagement and drive demand for products and services.
- Explore new business opportunities.
- Reduce the time required to bring new products/services to market.
- Lay the groundwork for better oversight and management of businesses.
- Improve the quality of goods and services through customer feedback.
- Increase personalization in digital advertisements by using online customer data to create tailored offers, meeting their needs and preferences effectively [9].
- Manage finances more effectively.
- Eliminate geographical barriers when attracting new customers.
- Create opportunities for cost optimization.
- Promote creativity and innovation in marketing products and services.
- Establish competitive advantages over similar businesses.
- Operate without spatial or temporal limitations while maintaining clear connectivity flows.
- Maintain high levels of economic efficiency and transparency in competitive companies’ actions.
- Build a broad daily electronic customer base willing to cover some costs.
- Respond quickly to customer needs.
- Offer opportunities to expand operations and improve service delivery processes.
- Foster entrepreneurial spirit and high standards.
For example, operators of digital marketing tools in promoting an F&B store can use strategies like Search Engine Optimization to enhance their website presence and access resources that help them appear at the top of search results, thus attracting more customers. Additionally, an F&B store owner can collect user information through digital marketing techniques at a relatively low cost. Research has shown that digital marketing significantly enhances organizational value by offering customers high-quality services [10].
However, as with all businesses, F&B stores must be fully aware of both the benefits and disadvantages of using information and communication technologies in real marketing campaigns. One major drawback of digital marketing is competitors’ ability to quickly and easily replicate others’ digital marketing efforts, making businesses an “open book” [6]. Competitors can copy business identities, such as trademarks and logos, and use them to deceive customers and gain a share of the market. They can also provide false information about competitors’ goods or services, harming a company’s reputation and leading to customer loss.
Additionally, as digital marketing requires building relationships between customers and companies, a deep understanding of online purchasing behavior psychology is necessary. Unfortunately, businesses often neglect this when creating digital advertising initiatives and rely on conventional customer behavior [6]. This oversight reduces campaign effectiveness, as it fails to consider unique consumer habits and online relationship development. Negative comments, such as bad reviews, can also harm a company’s online presence and result in customer loss.
Another disadvantage of using digital marketing tools is the potential loss of customer trust. The adoption of technologies in online marketing campaigns that track and collect customer information creates privacy challenges and concerns about protecting personal data [11]. A significant barrier to digital marketing growth is the widespread distrust of such marketing methods, often leading people to avoid participation. Thus, addressing online trust and its influence on digital marketing methods is crucial when designing an online campaign.
Moreover, digital marketing heavily relies on technology and technical methods. Designing online advertisements demands substantial expertise, which can result in various technical issues [11]. Common mistakes include broken links, ineffective data analysis techniques, and slow-loading websites, all of which hinder campaign success [11]. The rapid evolution of global communication technology also makes it challenging to maintain up-to-date data, as it quickly becomes outdated and requires frequent updates. Many businesses lack the mechanisms and tools to keep pace with this dynamism, resulting in inappropriate device and technique use.
In conclusion, while the use of digital tools offers numerous advantages for businesses in general and the hospitality sector in particular, it also presents significant challenges. For a marketing campaign to be successful and profitable, it must be carefully designed, targeted to the right audience, and employ suitable applications and tools [11]. It must respect customer privacy, foster personal relationships, align with business developments, provide clear accountability, and enhance customer engagement with the desired product.
2.4. Digital Marketing and the COVID-19 Pandemic
The F&B sector faced significant challenges during the COVID-19 pandemic between 2020 and 2023, particularly in adapting to digital and social media marketing strategies. The pandemic underscored the importance of safe food service practices, prompting many restaurants to close temporarily or rethink their product creation, promotion, and delivery methods. These adaptations emphasized the need for effective digital marketing strategies to maintain market share amidst a global crisis.
Consumer experiences in F&B stores are shaped by tangible aspects (like taste) and intangible factors, including service quality, hygiene, and price–value perceptions [12]. Digital marketing plays a crucial role in communicating these elements, particularly as consumers increasingly rely on online reviews and social media for decision-making. Social media platforms, in particular, have proven effective in building trust, increasing engagement, and fostering customer loyalty. The pandemic accelerated the adoption of online F&B delivery and mobile ordering systems. F&B stores leveraging these technologies managed to sustain or grow their sales volumes, while others struggled. Long-term implications include the continued importance of delivery systems and reduced physical interactions [12].
Adopting corporate social responsibility (CSR) practices, such as promoting hygiene and safety measures, has positively influenced customer perceptions. Sharing such efforts via digital channels has strengthened F&B stores’ reputations and contributed to socially conscious marketing.
In conclusion, the COVID-19 pandemic highlighted the shift towards online platforms for F&B stores’ marketing, customer interaction, and operational strategies [13]. Effective use of social media and digital marketing tools will remain critical for resilience and growth in the post-pandemic landscape.
One of the major challenges facing the F&B industry during the global pandemic is finding the right balance in using social media and digital marketing methods. Safe food service practices have been crucial in mitigating the spread of COVID-19. Many F&B stores were forced to shut down or rethink how they create, promote, and deliver their products to survive [14]. As the F&B sector remains one of the largest globally, with new entrants constantly joining the market, the long-term impacts of these changes will continue to unfold.
The experience concerning the F&B sector stores combines tangible and intangible factors, such as service quality, hygiene standards, and price–value perceptions. Adapting marketing strategies during such events is vital for F&Bs to stay competitive. Research highlights the importance of diversifying sales channels and incorporating strategies tailored to local and external conditions [3].
Consumer trust is influenced by intangible factors like hygiene and customer service, which are now communicated primarily through digital marketing and social media [15]. Studies suggest that positive online reviews significantly affect customer choices. Platforms like social media have become essential for promoting trust, increasing customer engagement, and supporting innovation. COVID-19 also boosted the use of online delivery options, fundamentally altering the F&B stores’ business model. The reliance on mobile apps and websites for orders grew, with some F&B stores thriving by integrating these systems. Adapting to this shift is critical for resilience against future disruptions.
Finally, the pandemic brought CSR to the forefront. By adopting and promoting health and safety measures, F&B stores have reinforced their accountability to the community. Socially conscious marketing not only enhances customer trust but also showcases a F&B store’s commitment to public well-being [15,16].
As industry evolves after COVID-19, F&B stores must prioritize innovative and responsive marketing strategies to navigate the post-pandemic era effectively. Ref. [17] assessed the perspectives for restaurants after the COVID-19 pandemic in the USA. Ref. [18] analyzed the results of restaurant managers’ behavior after COVID-19 in the Swedish F&B sector. Reference [19] studied various characteristics shaping consumer preferences after COVID-19 on restaurants in NY, L.A., Vancouver, and Toronto, while ref. [20] focused their relative study in South Korea. A very limited number of studies is published for Greece so far. Ref. [21] assessed COVID-19’s impact on Greek growth, and [22] focused his questionnaire on the marketing and communication strategy that restaurants in Municipality of Thermaikos in Greece developed and implemented after the pandemic, building on [23]’s study on digital strategy development issues in the F&B sector in Greece.
Further, ref. [24] studied the impact of the COVID-19 pandemic on companies operating in the hospitality sector in the Czech Republic, while ref. [25] studied it for Turkey and ref. [26] assessed the COVID-19 multiplier effects of tourism on the Greek economy.
3. Methods and Materials
The methodological approach chosen for this study is quantitative research based on a specially designed questionnaire. This type of research is suitable for the marketing and management sciences as it helps researchers identify trends and predict future outcomes. The impersonal nature of quantitative research makes it an ideal tool for such research questions, as it aids in gathering a larger number of responses [27]. The data collection tool used consisted of a structured questionnaire. The questionnaire was addressed to consumers regarding foodservice stores. Apart from the questions related to demographic information, which were multiple-choice, closed-ended questions using a 5-point Likert scale were primarily used, and consumers were asked to respond regarding consumer selection criteria and digital marketing. Before applying the questionnaire to the full sample, a test was sent to 25 consumers to assess its clarity and effectiveness. The questionnaire was overall tested by experienced researchers, who noted that it was too large, and consequently, we further reduced its size so as not to increase consumers’ discomfort.
A total of 70 individuals responded to the questionnaire that was originally sent to 293 individuals, all Athens residents. The low response rate was sufficiently justified by the negative psychological status of the respondents because of COVID-19’s effects. Despite our increased efforts of extending the submission deadline, we could not acquire more replies. As our main scope was to analyze consumer preferences as they were framed at that time span, since this was the first attempt to depict them in Greece, we decided to proceed as the state of these preferences could (and should) be altered as COVID-19 measures for the F&B industry were gradually relaxed. Further, it should be noted that no tourists were engaged in the study, as at that time, no transfers were permitted worldwide. Hence, the impact of tourism on the Greek F&B sector could not be properly assessed at that time.
In this study, we employed descriptive statistical analysis to provide an overview of consumer behavior and preferences related to F&B stores’ visits, including patterns before, during, and after the COVID-19 pandemic. Additionally, we utilized chi-square tests to examine the associations between key demographic variables—such as gender, age, education, and employment status—and various factors influencing dining behavior, including frequency of visits, reasons for visiting, and criteria for F&B store selection for three different categories of F&B stores, namely restaurants, bars, and cafés. This approach allowed us to identify statistically significant relationships, offering insights into how demographic characteristics shape consumer preferences and decision-making processes in the F&B industry and its categories. Regarding statistical processing, Microsoft Excel was used for data coding, and IBM SPSS Version 28.0 [28] was used for analysis and presenting results in the form of descriptive statistics tables and charts.
The demographic characteristics of this sample are presented in Figure 1 below. More specifically,
- -
- The participation of men and women was completely equal (35 males; 35 females).
- -
- The ages of the participants were mainly young, as 57% belonged to the 18–35 age group, as shown in the following table, while the most underrepresented group was the 51+ age group.
- -
- Regarding the educational level, most of the participants have pursued higher or postgraduate education, with 47.1%, while a large percentage (45.7%) hold a master’s or doctoral degree.
- -
- Finally, 91.4% of respondents reported that they are currently employed.

Figure 1.
Demographic characteristics.
4. Main Findings
Results on Digital Marketing Strategies
Initially, respondents were asked about their habits regarding visits to food service stores before, during, and after the health crisis. As shown in Figure 2 below, most participants (51.4%) frequently visited such stores before the pandemic, while 20% visited them very frequently. The pandemic altered this balance, with the majority shifting towards the response “Rarely” (61.4%). However, 33% stated that they continued to visit food service stores quite often. Regarding the period after the COVID-19 risk has been eliminated, 32.9% said they would go out frequently and 18.6% said they would do so very frequently. Nevertheless, these figures do not reach pre-pandemic levels, which perhaps indicates that some health concerns persist.
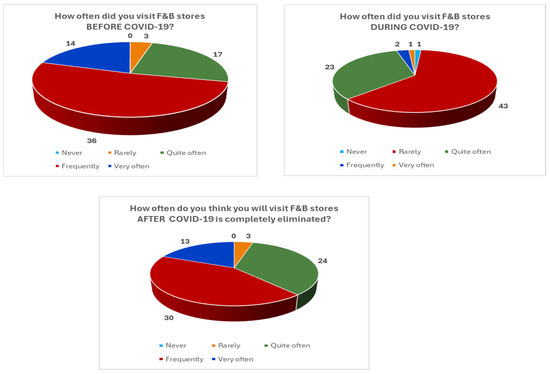
Figure 2.
Distribution of respondents’ visits to F&B stores before COVID-19, during COVID-19, and anticipated behavior after COVID-19 is eliminated.
Next, consumers were asked about the reasons for visiting F&B stores by category (see Table 1 below). Overall, participants indicated the following for each F&B store category:
- -
- Restaurants:
- a.
- Celebration: The average rating was 3.2, with most respondents finding it either quite (30%) or very (22.9%) important.
- b.
- Leisure outing: This was the most popular category, with 44.3% considering this reason for visiting to be very important, and an average rating of 3.97 was given.
- c.
- Less popular factors included quick meals and professional obligations, with an average rating of 2.2.
- -
- Bars:
- a.
- Celebration: The average rating was 3.2, suggesting that most consumers found it either quite (31.4%) or very (21.4%) important.
- b.
- Leisure Outing: This was again the most popular category, with 42.9% finding this reason for visiting very important, and the average score was 3.8.
- c.
- Less popular were the factors relating to quick meals (average score: 2.4), and even less popular were those relating to professional obligations (average score: 1.72). This is reasonable, given that bars are not commonly used for business meetings
- -
- Cafés:
- a.
- Celebration: Most consumers (60%) did not consider this to be an important factor when choosing a café to visit.
- b.
- Leisure outing: This was the most popular category, with an average score of 3.47 and 35.7% of consumers consider it important.
- c.
- The quick meal factor was popular in cafés (average score 3.18), but work obligations did not attract particularly high responses (average score 2.28). Nevertheless, it was more popular in cafés than in bars.

Table 1.
Consumers’ ratings of the alternative reasons for visiting F&B stores by category.
Table 1.
Consumers’ ratings of the alternative reasons for visiting F&B stores by category.
| Reasons for Visiting Restaurants | Reasons for Visiting Bars | Reasons for Visiting Cafés | |||||||||
|---|---|---|---|---|---|---|---|---|---|---|---|
| Frequency | % | Mean | Frequency | % | Mean | Frequency | % | Mean | |||
| Celebration | Not important | 1 | 9 | 12.90% | 3.22 | 10 | 14.30% | 3.20 | 42 | 60.00% | 1.74 |
| 2 | 11 | 15.70% | 8 | 11.40% | 14 | 20.00% | |||||
| 3 | 21 | 30.00% | 22 | 31.40% | 8 | 11.40% | |||||
| 4 | 13 | 18.60% | 15 | 21.40% | 2 | 2.90% | |||||
| Important | 5 | 16 | 22.90% | 15 | 21.40% | 4 | 5.70% | ||||
| Leisure outing | Not important | 1 | 3 | 4.30% | 3.97 | 10 | 14.30% | 3.80 | 11 | 15.70% | 3.47 |
| 2 | 5 | 7.10% | 3 | 4.30% | 9 | 12.90% | |||||
| 3 | 14 | 20.00% | 8 | 11.40% | 11 | 15.70% | |||||
| 4 | 17 | 24.30% | 19 | 27.10% | 14 | 20.00% | |||||
| Important | 5 | 31 | 44.30% | 30 | 42.90% | 25 | 35.70% | ||||
| Quick meal | Not important | 1 | 28 | 40.00% | 2.20 | 32 | 45.70% | 2.04 | 13 | 18.60% | 2.28 |
| 2 | 19 | 27.10% | 14 | 20.00% | 8 | 11.40% | |||||
| 3 | 8 | 11.40% | 17 | 24.30% | 19 | 27.10% | |||||
| 4 | 11 | 15.70% | 3 | 4.30% | 13 | 18.60% | |||||
| Important | 5 | 4 | 5.70% | 4 | 5.70% | 17 | 24.30% | ||||
| Professional obligation | Not important | 1 | 25 | 35.70% | 2.20 | 46 | 65.70% | 1.72 | 25 | 35.70% | 2.15 |
| 2 | 23 | 32.90% | 9 | 12.90% | 19 | 27.10% | |||||
| 3 | 11 | 15.70% | 7 | 10.00% | 11 | 15.70% | |||||
| 4 | 5 | 7.10% | 4 | 5.70% | 11 | 15.70% | |||||
| Important | 5 | 6 | 8.60% | 4 | 5.70% | 4 | 5.70% | ||||
| Other | Not important | 1 | 26 | 37.10% | 2.34 | 36 | 51.40% | 2.04 | 35 | 50.00% | 2.34 |
| 2 | 12 | 17.10% | 9 | 12.90% | 10 | 14.30% | |||||
| 3 | 21 | 30.00% | 17 | 24.30% | 12 | 17.10% | |||||
| 4 | 4 | 5.70% | 2 | 2.90% | 5 | 7.10% | |||||
| Important | 5 | 7 | 10.00% | 6 | 8.60% | 8 | 11.40% | ||||
Table 2 below presents customers’ responses on the selection criteria they applied for selecting F&B stores to visit by category. The main findings can be summarized as follows:
- -
- Restaurants: The most important criterion of all is the food quality (average score 4.34), followed by the type of food (3.85). Moderately important criteria are service (3.67), location (3.62), the surroundings (3.64), and also the hygiene measures taken to deal with the pandemic (3.54). Cost also appeared to be moderately important (3.3), while consumers did not seem to be very interested in celebrities’ presence (3.1), nor in the use of heavy advertising (2.2).
- -
- Bars: Quality still has a high average (3.82), but in bars the first criterion is the type of music (3.94) and the environment (3.87). Consumers do not seem to be interested in the presence of heavy advertising (average score close to 2.00). In contrast, hygiene conditions had an average score of 3.54, while location and service were rated as moderately important. Costs in bars seemed to be of less interest than in restaurants (2.78).
- -
- Cafés: The most important criterion appeared to be quality (3.77), followed by environment, variety, and location. Consumers scored social media and a strong advertising presence as low (around 2.00), while cost was rated lower than in bars and restaurants (2.59), which could be attributed to the fact that items in cafés are usually less expensive.
Table 2.
Consumers’ ratings of the alternative criteria for selecting F&B stores to visit by category.
Table 2.
Consumers’ ratings of the alternative criteria for selecting F&B stores to visit by category.
| Criteria for Selecting Restaurants | Criteria for Selecting Bars | Criteria for Selecting Cafés | |||||||||
|---|---|---|---|---|---|---|---|---|---|---|---|
| Frequency | % | Mean | Frequency | % | Mean | Frequency | % | Mean | |||
| Quality | Not important | 1 | 2 | 2.90% | 4.34 | 6 | 8.60% | 3.82 | 5 | 7.10% | 3.77 |
| 2 | 1 | 1.40% | 7 | 10.00% | 8 | 11.40% | |||||
| 3 | 7 | 10.00% | 13 | 18.60% | 13 | 18.60% | |||||
| 4 | 21 | 30.00% | 11 | 15.70% | 16 | 22.90% | |||||
| Important | 5 | 39 | 55.70% | 33 | 47.10% | 28 | 40.00% | ||||
| Cost | Not important | 1 | 4 | 5.70% | 3.32 | 122.78 | 17.10% | 2.78 | 17 | 24.30% | 2.59 |
| 2 | 9 | 12.90% | 19 | 27.10% | 18 | 25.70% | |||||
| 3 | 27 | 38.60% | 19 | 27.10% | 20 | 28.60% | |||||
| 4 | 20 | 28.60% | 12 | 17.10% | 7 | 10.00% | |||||
| Important | 5 | 10 | 14.30% | 8 | 11.40% | 8 | 11.40% | ||||
| Location | Not important | 1 | 2 | 2.90% | 3.62 | 3 | 4.30% | 3.65 | 6 | 8.60% | 3.59 |
| 2 | 7 | 10.00% | 11 | 15.70% | 9 | 12.90% | |||||
| 3 | 24 | 34.30% | 18 | 25.70% | 18 | 25.70% | |||||
| 4 | 19 | 27.10% | 13 | 18.60% | 12 | 17.10% | |||||
| Important | 5 | 18 | 25.70% | 25 | 35.70% | 25 | 35.70% | ||||
| Service | Not important | 1 | 3 | 4.30% | 3.67 | 6 | 8.60% | 3.28 | 6 | 8.60% | 3.39 |
| 2 | 4 | 5.70% | 15 | 21.40% | 11 | 15.70% | |||||
| 3 | 27 | 38.60% | 20 | 28.60% | 20 | 28.60% | |||||
| 4 | 15 | 21.40% | 11 | 15.70% | 16 | 22.90% | |||||
| Important | 5 | 21 | 30.00% | 18 | 25.70% | 17 | 24.30% | ||||
| Environment-Design-Space-Comfort | Not important | 1 | 1 | 1.40% | 3.64 | 2 | 2.90% | 3.87 | 4 | 5.70% | 3.64 |
| 2 | 9 | 12.90% | 6 | 8.60% | 7 | 10.00% | |||||
| 3 | 22 | 31.40% | 18 | 25.70% | 19 | 27.10% | |||||
| 4 | 20 | 28.60% | 17 | 24.30% | 20 | 28.60% | |||||
| Important | 5 | 18 | 25.70% | 27 | 38.60% | 20 | 28.60% | ||||
| Reputation | Not important | 1 | 7 | 10.00% | 3.11 | 8 | 11.40% | 3.00 | 21 | 30.00% | 2.61 |
| 2 | 16 | 22.90% | 18 | 25.70% | 15 | 21.40% | |||||
| 3 | 19 | 27.10% | 13 | 18.60% | 12 | 17.10% | |||||
| 4 | 18 | 25.70% | 22 | 31.40% | 14 | 20.00% | |||||
| Important | 5 | 10 | 14.30% | 9 | 12.90% | 8 | 11.40% | ||||
| Heavy advertising | Not important | 1 | 27 | 38.60% | 2.21 | 26 | 37.10% | 2.22 | 30 | 42.90% | 2.22 |
| 2 | 14 | 20.00% | 15 | 21.40% | 12 | 17.10% | |||||
| 3 | 19 | 27.10% | 16 | 22.90% | 15 | 21.40% | |||||
| 4 | 7 | 10.00% | 13 | 18.60% | 8 | 11.40% | |||||
| Important | 5 | 3 | 4.30% | 0 | 0.00% | 5 | 7.10% | ||||
| COVID-19 hygiene conditions | Not important | 1 | 5 | 7.10% | 3.54 | 30 | 42.90% | 2.10 | 31 | 44.30% | 2.10 |
| 2 | 13 | 18.60% | 14 | 20.00% | 14 | 20.00% | |||||
| 3 | 16 | 22.90% | 17 | 24.30% | 16 | 22.90% | |||||
| 4 | 11 | 15.70% | 7 | 10.00% | 5 | 7.10% | |||||
| Important | 5 | 25 | 35.70% | 2 | 2.90% | 4 | 5.70% | ||||
| Type of food | Not important | 1 | 2 | 2.90% | 3.85 | ||||||
| 2 | 4 | 5.70% | |||||||||
| 3 | 19 | 27.10% | |||||||||
| 4 | 22 | 31.40% | |||||||||
| Important | 5 | 23 | 32.90% | ||||||||
| Variety of choices | Not important | 1 | 9 | 12.90% | 3.14 | 5 | 7.10% | 3.47 | |||
| 2 | 10 | 14.30% | 10 | 14.30% | |||||||
| 3 | 25 | 35.70% | 18 | 25.70% | |||||||
| 4 | 14 | 20.00% | 21 | 30.00% | |||||||
| Important | 5 | 12 | 17.10% | 16 | 22.90% | ||||||
| Type of music | Not important | 1 | 3 | 4.30% | 3.94 | 10 | 14.30% | 2.97 | |||
| 2 | 7 | 10.00% | 17 | 24.30% | |||||||
| 3 | 11 | 15.70% | 20 | 28.60% | |||||||
| 4 | 19 | 27.10% | 11 | 15.70% | |||||||
| Important | 5 | 30 | 42.90% | 12 | 17.10% | ||||||
Table 3 below shows customers’ responses regarding the multiple advertising criteria applied for selecting F&B stores. Customers seem to pay particular attention to reviews uploaded by previous visitors or professional reviewers (3.72), as well as to photos and videos of the F&B stores (3.5). The touristic (or not) character/nature of the F&B store also appears to be a fairly popular criterion (3.05). A user-friendly website was also considered important (2.8) by several consumers. In contrast, little importance was placed on advertising through celebrities and influencers (1.72).
Table 3.
Customers’ responses regarding the multiple advertising criteria applied for selecting F&B stores.
Consumers today consult a variety of digital media to choose F&B stores they visit, as shown in Table 4 below. By far the highest scores appeared on Google (average: 3.94), Google Maps (3.67), and the stores’ own websites (3.17). In contrast, LinkedIn and Twitter scored particularly low (1.30), as these platforms are not typically suited for this purpose.
Table 4.
Consumer preferences on digital media consulted to choose F&B stores to visit.
Regarding F&B stores’ digital promotional activities, consumers indicated that most of them do not receive significant attention from them, as presented in Table 5 below. Apart from privileged appearance in search engines (average: 2.92) and posts on social media (average: 2.77), consumers seem to pay little interest in advertising by celebrities, email messages, or advertisements on third-party websites.
Table 5.
Consumers’ rating of various F&B stores’ promotional digital activities.
As far as the use of digital media is concerned, consumers rated from 1 to 5 the frequency of use in their daily life (excluding working time); as shown in Table 6 below, most consumers (59.4%) prefer to use their mobile phones more frequently, as their average score is 4.34. The use of the computer/laptop is lower, with an average score of 3.33.
Table 6.
Consumers’ rating of everyday use of digital media.
Table 7 below presents consumers’ assessment of the appeal of alternative digital marketing techniques. They are mainly affected by the online presentation of the F&B stores (with averages above 3.5), as it may differ from reality. Additionally, spam messages and intrusive advertisements seem to be very annoying, while the Internet is often considered unreliable.
Table 7.
Consumers’ rating of F&B stores’ digital promotional activities.
Regarding reservation methods at F&B stores, most participants prefer to make reservations by phone (average = 4.06), while fewer prefer F&B stores that do not make reservations at all, as shown in Table 8 below.
Table 8.
Consumers’ rating of different methods for making reservations at F&B stores.
Advertising on digital platforms often raises concerns related to personal data issues and therefore is currently considered among the main issues of debate. Summary results obtained on this topic are presented in Table 9 below. F&B consumers slightly prefer promotion via email (average ranking 2.64 compared to 2.37 and 2.32), while they seem more cautious about providing details for the purpose of personalized advertisements (38.6% find it completely irrelevant).
Table 9.
Consumer preferences of digital ads related to personal data issues.
Finally, consumers’ assessments related to digital media use during the pandemic is presented in Table 10 below. It is evident that 26.1% stated that using digital media for visiting F&B stores during COVID-19 was important, with an average of 3.33. At the same time, an average of 3.74 was reported for using digital media during COVID-19 for other searches. Most survey participants (over 70%) seem to be quite affected by an F&B store’s lack of online presence. Similarly, nearly 90% believe that campaigns supporting the F&B industry during the pandemic were moderately to highly effective.
Table 10.
Assessment of digital media use during COVID-19.
The results of association tests obtained between various factors influencing consumer preferences in the F&B industry and key demographics using the X2 test are presented in Table 11 below. The chi-square analysis revealed significant relationships between demographic factors and various aspects of consumer behavior, preferences, and digital marketing considerations in the context of visits to F&B stores. More specifically,
- -
- Gender differences were significant for preferences related to food type (p = 0.015) and restaurant location (p = 0.026), suggesting the need for tailored geographic and menu-based marketing strategies in restaurants. In addition, gender differences related to service influence visits to bars (p = 0.017), while gender differences affect leisure visits to cafés (p = 0.030). Gender also influenced the use of digital platforms, particularly Instagram (p = 0.022) and user-friendly websites (p = 0.013), highlighting the importance of gender-specific approaches in online marketing and user experience design in F&B stores. Furthermore, gender differences related to the increased use of digital media during COVID-19 for other reasons than visiting F&B stores (p = 0.007) suggest broader gender-related digital behavior variations.
- -
- Age was a significant factor affecting dining habits before (p = 0.001) and after (p = 0.006) the COVID-19 pandemic, reflecting generational differences in risk perception and motivations to dine out. Restaurant cost considerations were also significantly associated with age (p = 0.024), indicating that pricing strategies could effectively target these groups. As far as visits to bars are concerned, age was evidenced to be significantly associated with leisure and celebration outings (p = 0.018 for both) and with stores’ social media activity (p = 0.048), while for visits to cafés, age is related to reputation (p = 0.004) and to heavy advertising (p = 0.016). Age significantly influenced digital behaviors related to F&B stores’ visits, such as the use of Google (p = 0.015), Instagram (p = 0.000), Google Maps (0.001), and LinkedIn (p = 0.009), and engaging with social media posts (p = 0.012), emphasizing the importance of generational segmentation in digital marketing efforts. Age-related concerns about spam and unsolicited digital messages (p = 0.009) further underscore the need for restrained and targeted communication strategies in the F&B industry. Furthermore, age is significantly related to concerns about personal data use of email promotions (p = 0.039) and to campaigns that affect visits to F&B stores (p = 0.005).
- -
- Educational background significantly shaped consumer preferences on visiting F&B stores, particularly regarding visual media reliance, such as photos and videos (p = 0.027). Additionally, the importance of user-friendly websites (p = 0.040) also varied with educational level, indicating the need for accessible and intuitive digital platforms to cater to diverse educational segments. Furthermore, the use of Google Maps (p = 0.013) and Instagram (p = 0.032) for F&B store selection was significantly associated with education, reflecting differences in information-seeking behavior. Finally, educational differences seem to be significantly associated with visits to cafés due to professional obligation (p = 0.042) and visits to bars due to the type of music (p = 0.013).
Table 11.
Chi-square tests results for the association between consumers’ perceptions and demographic characteristics.
Table 11.
Chi-square tests results for the association between consumers’ perceptions and demographic characteristics.
| Consumers | Gender | Age | Education | Employment | |||||
|---|---|---|---|---|---|---|---|---|---|
| χ2 Test | p-Value | χ2 Test | p-Value | χ2 Test | p-Value | χ2 Test | p-Value | ||
| Frequency of visiting F&B stores | Before COVID-19 | 1.260 | 0.739 | 23.175 | 0.001 | 8.058 | 0.234 | 2.755 | 0.431 |
| During COVID-19 | 4.067 | 0.397 | 11.479 | 0.176 | 2.678 | 0.953 | 4.121 | 0.390 | |
| After COVID-19 | 5.469 | 0.456 | 18.025 | 0.006 | 6.826 | 0.337 | 4.505 | 0.212 | |
| Reasons for visiting Restaurants | Celebration | 3.647 | 0.456 | 6.530 | 0.588 | 8.792 | 0.360 | 4.440 | 0.350 |
| Leisure outing | 6.658 | 0.155 | 12.704 | 0.122 | 12.663 | 0.124 | 5.188 | 0.269 | |
| Quick meal | 6.640 | 0.156 | 7.022 | 0.534 | 7.101 | 0.526 | 1.821 | 0.769 | |
| Professional obligation | 6.189 | 0.185 | 9.616 | 0.293 | 12.015 | 0.151 | 4.711 | 0.318 | |
| Other | 3.201 | 0.525 | 6.267 | 0.617 | 6.002 | 0.647 | 4.714 | 0.318 | |
| Reasons for visiting Bars | Celebration | 1.348 | 0.853 | 18.408 | 0.018 | 8.839 | 0.356 | 4.120 | 0.390 |
| Leisure outing | 5.440 | 0.245 | 18.495 | 0.018 | 6.303 | 0.613 | 8.218 | 0.084 | |
| Quick meal | 3.215 | 0.523 | 6.645 | 0.575 | 8.235 | 0.411 | 3.200 | 0.525 | |
| Professional obligation | 0.254 | 0.993 | 9.287 | 0.319 | 6.237 | 0.621 | 3.424 | 0.490 | |
| Other | 6.307 | 0.177 | 7.812 | 0.452 | 13.226 | 0.104 | 0.923 | 0.921 | |
| Reasons for visiting Cafés | Celebration | 6.500 | 0.165 | 10.489 | 0.232 | 2.921 | 0.939 | 1.944 | 0.746 |
| Leisure outing | 10.736 | 0.030 | 7.532 | 0.480 | 2.130 | 0.977 | 3.583 | 0.465 | |
| Quick meal | 0.265 | 0.992 | 5.823 | 0.667 | 9.256 | 0.321 | 6.256 | 0.181 | |
| Professional obligation | 3.585 | 0.465 | 4.236 | 0.835 | 16.048 | 0.042 | 3.541 | 0.472 | |
| Other | 4.162 | 0.385 | 13.148 | 0.107 | 4.863 | 0.772 | 9.175 | 0.057 | |
| Selection Criteria for visiting Restaurants | Quality | 3.597 | 0.463 | 6.056 | 0.641 | 2.549 | 0.959 | 5.216 | 0.266 |
| Cost | 5.800 | 0.215 | 17.674 | 0.024 | 8.983 | 0.344 | 25.173 | 0.000 | |
| Location | 11.061 | 0.026 | 3.058 | 0.931 | 7.967 | 0.437 | 2.616 | 0.624 | |
| Service | 2.018 | 0.732 | 11.347 | 0.183 | 7.353 | 0.499 | 4.483 | 0.345 | |
| Environment-Design-Space-Comfort | 4.093 | 0.394 | 3.991 | 0.858 | 7.610 | 0.472 | 2.776 | 0.596 | |
| Reputation | 8.024 | 0.091 | 22.859 | 0.004 | 10.306 | 0.244 | 13.955 | 0.007 | |
| Heavy advertising | 11.008 | 0.026 | 14.560 | 0.068 | 3.096 | 0.928 | 3.179 | 0.528 | |
| COVID-19 hygiene conditions | 3.070 | 0.546 | 8.432 | 0.392 | 14.863 | 0.062 | 7.358 | 0.118 | |
| Type of food | 12.355 | 0.015 | 6.924 | 0.545 | 7.707 | 0.463 | 2.872 | 0.579 | |
| Selection Criteria for visiting Bars | Quality | 2.350 | 0.672 | 11.904 | 0.156 | 2.121 | 0.977 | 2.911 | 0.573 |
| Variety of choices | 3.084 | 0.544 | 7.136 | 0.522 | 7.142 | 0.521 | 3.095 | 0.542 | |
| Cost | 2.702 | 0.609 | 10.150 | 0.255 | 5.056 | 0.752 | 6.366 | 0.173 | |
| Location | 1.491 | 0.828 | 6.065 | 0.640 | 6.445 | 0.597 | 3.295 | 0.510 | |
| Service | 12.053 | 0.017 | 2.415 | 0.966 | 2.485 | 0.962 | 5.309 | 0.257 | |
| Environment-Design-Space-Comfort | 1.455 | 0.835 | 5.948 | 0.653 | 7.140 | 0.522 | 1.402 | 0.844 | |
| Reputation | 1.485 | 0.829 | 11.592 | 0.170 | 7.846 | 0.449 | 2.652 | 0.618 | |
| Social Media Activity | 0.144 | 0.986 | 12.699 | 0.048 | 3.494 | 0.745 | 1.994 | 0.574 | |
| Heavy advertising | 4.634 | 0.327 | 11.615 | 0.169 | 2.845 | 0.944 | 2.806 | 0.591 | |
| COVID-19 hygiene conditions | 2.126 | 0.713 | 9.691 | 0.287 | 11.630 | 0.168 | 7.474 | 0.113 | |
| Type of music | 0.753 | 0.945 | 16.686 | 0.034 | 19.447 | 0.013 | 4.206 | 0.379 | |
| Selection Criteria for visiting Cafés | Quality | 1.170 | 0.883 | 6.194 | 0.625 | 5.942 | 0.654 | 3.306 | 0.508 |
| Variety of choices | 1.279 | 0.865 | 9.051 | 0.338 | 3.742 | 0.880 | 4.059 | 0.398 | |
| Cost | 0.424 | 0.980 | 1.825 | 0.986 | 9.038 | 0.339 | 5.935 | 0.204 | |
| Location | 6.111 | 0.191 | 6.738 | 0.565 | 8.818 | 0.358 | 5.758 | 0.218 | |
| Service | 1.066 | 0.900 | 6.305 | 0.613 | 5.410 | 0.713 | 3.543 | 0.471 | |
| Environment–Design–Space–Comfort | 5.359 | 0.252 | 9.821 | 0.278 | 5.333 | 0.721 | 1.228 | 0.873 | |
| Reputation | 5.933 | 0.204 | 22.526 | 0.004 | 9.267 | 0.320 | 1.200 | 0.878 | |
| Social Media Activity | 4.733 | 0.316 | 15.225 | 0.055 | 9.451 | 0.306 | 5.135 | 0.274 | |
| Heavy advertising | 4.776 | 0.311 | 18.837 | 0.016 | 10.470 | 0.234 | 3.875 | 0.423 | |
| COVID-19 hygiene conditions | 1.249 | 0.870 | 8.102 | 0.424 | 7.211 | 0.514 | 5.317 | 0.256 | |
| Type of music | 0.550 | 0.968 | 1.234 | 0.996 | 5.642 | 0.687 | 5.460 | 0.243 | |
| Social media used before visiting F&B stores | Website | 4.006 | 0.405 | 5.678 | 0.683 | 8.280 | 0.407 | 7.118 | 0.130 |
| 1.216 | 0.875 | 18.934 | 0.015 | 12.053 | 0.149 | 2.476 | 0.649 | ||
| 11.406 | 0.022 | 33.765 | 0.000 | 16.857 | 0.032 | 0.310 | 0.989 | ||
| 5.493 | 0.240 | 10.987 | 0.202 | 4.049 | 0.853 | 2.464 | 0.651 | ||
| Google Maps | 3.234 | 0.519 | 25.431 | 0.001 | 19.378 | 0.013 | 4.653 | 0.325 | |
| 6.562 | 0.161 | 14.200 | 0.077 | 6.291 | 0.615 | 1.358 | 0.852 | ||
| 3.333 | 0.504 | 20.356 | 0.009 | 10.586 | 0.226 | 1.094 | 0.895 | ||
| Other | 4.758 | 0.313 | 9.066 | 0.337 | 10.968 | 0.203 | 2.959 | 0.565 | |
| Criteria applied before visiting F&B stores | Website presence | 3.860 | 0.425 | 10.309 | 0.244 | 9.155 | 0.329 | 4.743 | 0.315 |
| User-friendly website | 12.722 | 0.013 | 10.238 | 0.249 | 16.159 | 0.040 | 2.985 | 0.560 | |
| Photos/Videos | 4.938 | 0.294 | 10.799 | 0.213 | 17.321 | 0.027 | 6.332 | 0.176 | |
| Written communication | 2.451 | 0.653 | 5.749 | 0.675 | 9.394 | 0.310 | 1.767 | 0.778 | |
| Celebrities and influencers | 4.284 | 0.369 | 10.133 | 0.256 | 7.225 | 0.513 | 2.600 | 0.627 | |
| Reviewer comments | 4.898 | 0.298 | 2.509 | 0.961 | 11.451 | 0.177 | 2.461 | 0.652 | |
| Advertisement in other sector | 0.599 | 0.897 | 7.967 | 0.241 | 6.228 | 0.398 | 1.436 | 0.697 | |
| Touristic nature | 7.773 | 0.100 | 6.416 | 0.601 | 10.897 | 0.208 | 2.276 | 0.685 | |
| Promotional activities | Social media posts | 8.465 | 0.076 | 19.588 | 0.012 | 8.947 | 0.347 | 3.341 | 0.503 |
| Advertising by celebrities and influencers | 6.266 | 0.099 | 7.729 | 0.259 | 5.485 | 0.483 | 3.383 | 0.336 | |
| Newsletter/e-mail | 3.010 | 0.556 | 9.291 | 0.318 | 2.732 | 0.950 | 2.633 | 0.621 | |
| Banner on e-shop or third-party websites | 1.150 | 0.765 | 4.503 | 0.609 | 1.743 | 0.942 | 1.813 | 0.612 | |
| Shown first in search engine | 0.168 | 0.997 | 7.154 | 0.520 | 1.313 | 0.995 | 4.022 | 0.403 | |
| Frequency of use | Mobile | 0.902 | 0.825 | 5.960 | 0.428 | 3.295 | 0.771 | 2.683 | 0.443 |
| PC/Laptop | 1.970 | 0.741 | 5.427 | 0.711 | 3.027 | 0.933 | 2.393 | 0.664 | |
| Concerns about using digital marketing | Differences from reality | 3.141 | 0.534 | 12.607 | 0.126 | 14.558 | 0.068 | 3.281 | 0.512 |
| Personal data | 0.397 | 0.983 | 10.365 | 0.240 | 5.496 | 0.703 | 5.977 | 0.201 | |
| Review unreliability | 1.200 | 0.878 | 13.055 | 0.110 | 9.699 | 0.287 | 5.849 | 0.211 | |
| No digital presence | 1.996 | 0.736 | 10.463 | 0.234 | 4.570 | 0.802 | 12.079 | 0.017 | |
| Insufficient information | 4.912 | 0.296 | 10.216 | 0.250 | 5.804 | 0.669 | 3.132 | 0.536 | |
| Security of payments | 3.069 | 0.546 | 5.975 | 0.650 | 3.897 | 0.866 | 1.091 | 0.896 | |
| Insufficient knowledge/training of digital media use | 2.297 | 0.681 | 4.778 | 0.781 | 7.213 | 0.514 | 2.085 | 0.720 | |
| Access speed | 5.210 | 0.266 | 12.788 | 0.119 | 13.059 | 0.110 | 1.394 | 0.845 | |
| Annoying ads | 6.515 | 0.164 | 10.689 | 0.220 | 8.014 | 0.432 | 4.550 | 0.337 | |
| Spam/trash messages | 5.396 | 0.249 | 20.419 | 0.009 | 6.773 | 0.561 | 5.385 | 0.250 | |
| Reduced human contact | 4.432 | 0.351 | 7.094 | 0.527 | 9.894 | 0.273 | 2.191 | 0.701 | |
| Internet unreliability | 0.029 | 0.999 | 5.861 | 0.439 | 5.955 | 0.428 | 0.855 | 0.836 | |
| Increased competiton | 4.579 | 0.333 | 4.206 | 0.838 | 4.720 | 0.787 | 4.364 | 0.359 | |
| Reservations | By phone | 2.772 | 0.597 | 7.786 | 0.455 | 4.325 | 0.827 | 3.464 | 0.483 |
| Through digital platform | 7.056 | 0.133 | 18.736 | 0.016 | 11.854 | 0.158 | 0.684 | 0.953 | |
| No reservation policy | 1.516 | 0.824 | 5.692 | 0.682 | 9.338 | 0.315 | 12.082 | 0.017 | |
| Concerns about personal data use | Personalized advertising based on personal data | 1.748 | 0.782 | 5.641 | 0.687 | 7.354 | 0.499 | 2.385 | 0.665 |
| Less data, less personalization | 7.267 | 0.122 | 9.193 | 0.326 | 3.492 | 0.900 | 2.579 | 0.631 | |
| Promotions only in the email | 2.105 | 0.716 | 16.216 | 0.039 | 8.265 | 0.408 | 4.425 | 0.352 | |
| COVID-digital media | For F&B stores visits | 7.600 | 0.180 | 6.990 | 0.726 | 9.560 | 0.480 | 9.388 | 0.095 |
| For other topics | 14.071 | 0.007 | 10.598 | 0.226 | 8.991 | 0.343 | 1.708 | 0.789 | |
| Factors affecting visits to F&B stores | Digital media | 0.732 | 0.947 | 7.886 | 0.445 | 10.345 | 0.242 | 1.722 | 0.787 |
| Campaigns | 3.729 | 0.444 | 21.762 | 0.005 | 9.696 | 0.287 | 3.631 | 0.458 | |
Employment status significantly influenced cost sensitivity (p < 0.001) and perceptions of factors such as restaurant reputation (p = 0.007) and no-reservation policies (p = 0.017). These findings suggest that pricing and service policies should consider the time and financial constraints of employed individuals. Concerns about the absence of a digital presence were also more pronounced among employed consumers (p = 0.017), underscoring the necessity of maintaining an active online presence to attract this demographic.
Overall, the results underscore the critical role of demographic factors in shaping consumer behavior and preferences in the F&B industry. By considering these significant relationships, as evidenced by the p-values, restaurants and marketers can develop targeted strategies to enhance customer engagement, optimize digital marketing, and address the diverse needs of their clientele effectively. These findings emphasize the importance of demographic segmentation in creating more personalized and impactful consumer experiences.
5. Discussion and Conclusions
This paper examines the role of digital marketing in the F&B industry during the COVID-19 health crisis. In carrying this out, a structured questionnaire survey was conducted. Participants provided feedback through closed-ended questions regarding their criteria for choosing F&B stores (customized for restaurants, bars, and cafés), their perceptions on the advantages and disadvantages of digital marketing, and their overall consumer preferences.
According to the findings of the paper, before the pandemic, a significant portion of respondents frequently (51.4%) or very frequently (20%) visited F&B stores, indicating a vibrant culture in Athens, Greece. However, during the pandemic, there was a dramatic shift, with 61.4% of respondents stating they rarely went out to such stores. This finding underscores the substantial impact of COVID-19 restrictions and heightened health concerns on consumer behavior. Interestingly, 33% continued to visit restaurants quite often, suggesting some resilience or adaptation among a portion of the population [29].
Post-pandemic projections indicate a partial recovery in Greek F&B store visit habits, with 42.9% of respondents expecting to visit F&B stores frequently and 18.6% very frequently. However, these figures fall short of pre-pandemic levels, reflecting lingering caution and the potential long-term behavioral impact of the crisis. This cautious optimism could suggest opportunities for F&B stores to rebuild consumer confidence, perhaps through enhanced safety measures, promotions, and targeted digital marketing campaigns to address lingering concerns.
The reasons for visiting F&B stores show an interesting hierarchy of motivation: For restaurants, leisure outings emerged as the most significant reason, with the highest average score (3.97) by 44.3% of respondents rating it as very important, followed by celebrations (average = 3.2) at 22.9%, while quick meals and professional obligations were deemed relatively unimportant (average = 2.2 for both). The same pattern applies to bars as well, as leisure outings were evidenced again as the most significant, with the highest average score (3.8) by 42.9% of respondents rating it as very important, followed by celebrations (average = 3.2) by 21.4%, while quick meals and professional obligations were ranked relatively unimportant (average= 2.4 and 1.72, respectively). Finally, the pattern appears slightly modified for cafés as leisure outing is again considered the most significant by 35.7% of respondents (average = 3.47), but celebration is not considered significant, while quick meals were considered significant (average = 3.18), and professional obligations were rated as non-significant as well.
These findings suggest that the F&B industry in the city of Athens, Greece, predominantly serves as a space for leisure and socializing rather than purely functional purposes. Post-pandemic strategies might benefit from focusing on experiences that enhance leisure and celebratory outings, such as ambiance, live entertainment, or unique dining themes. Similarly, ref. [30] also underscores the role of innovation, such as reimagining dining experiences, in navigating challenges and seizing opportunities in a transformed F&B market.
The criteria respondents consider when selecting an F&B store also offer critical insights. For restaurants, the quality of food ranked highest, with an average score of 4.34, and over half (55.7%) of respondents deemed it very important. This finding reaffirms that culinary excellence remains the cornerstone of restaurant success. The type of food (average =3.85) also holds substantial sway, indicating a demand for diverse and appealing menu offerings. Moderately important factors such as service (average = 3.67), location (average = 3.62), surrounding environment (average = 3.64), and cost (average = 3.32) suggest that while operational efficiency and value for money are relevant, they are not the primary drivers of consumer decisions. Notably, hygiene measures to address the pandemic (average = 3.54) were also moderately important, signifying the lasting relevance of health safety considerations. Less important criteria, including advertising (average = 2.2) and celebrity associations (average = 3.1), indicate that traditional promotional strategies might have a limited impact. Instead, digital marketing strategies that emphasize food quality, safety, and unique dining experiences may resonate more effectively with the target audience.
For bars, quality still evidenced significant (average = 3.82), but the type of music (average = 3.94) and the environment (average = 3.87) ranked even higher. Consumers seemed not to be influenced by heavy advertising (average = 2.00), while hygiene conditions were evidenced as significant (average = 3.54), while location and service were rated less important. Costs in bars seemed to be of less interest than in restaurants (average = 2.78). For cafés, the most important criterion appeared to be quality (3.77), followed by environment (average = 3.64), location (average = 3.59), and variety (average = 3.47). Consumers scored social media and strong advertising presence low (average around 2.00), while cost in cafés was rated lower than in bars and restaurants (average = 2.59), which could be attributed to the fact that items in cafés are usually less expensive.
These findings underscore a dual challenge for the F&B industry in Greece. First, rebuilding consumer confidence post-pandemic requires addressing heightened health concerns and fostering trust. For instance, studies emphasize the importance of visible safety measures and hygienic practices to reassure customers and encourage their return [31]. Second, aligning offerings with the key drivers identified above per category (restaurants, bars, and cafés) remains critical for competitiveness. Digital marketing strategies can play a pivotal role in navigating this landscape. By leveraging tools to highlight them, F&B stores can effectively communicate value and trust to their audience. Research suggests that a robust online presence, coupled with personalized marketing campaigns, significantly influences customer retention and satisfaction in the post-pandemic era [31]. F&B stores that successfully blend traditional strengths like quality food with innovative approaches, including digital engagement and experiential offerings, are well-positioned to thrive in the evolving market [31]. In summary, while the pandemic has altered consumer habits, it has also created opportunities for the F&B industry in Athens to innovate and cater to changing preferences. By leveraging these insights, F&B stores can position themselves to thrive in a recovering market.
Next, the data reveals that Google (average = 3.94) and Google Maps (average = 3.67) are the preferred tools for selecting F&B stores, followed by the stores’ own websites (average = 3.17). These findings align with studies highlighting Google’s dominance as a search engine and its integration with mapping services, which makes it convenient for users to locate and assess food stores [32]. Social media platforms like Instagram (average = 2.90) hold moderate influence, while platforms like LinkedIn and Twitter (average = 1.30 and 1.28, respectively) are less relevant, likely due to their professional or news-oriented nature rather than their focus on lifestyle or consumer decisions.
These patterns highlight the role of accessible and detailed information, as well as visual cues, in influencing consumer decisions. Previous research emphasizes the importance of visual platforms like Instagram in promoting lifestyle brands, including F&B stores, by leveraging high-quality images [33].
Next, participants placed significant weight on reviews (average = 3.72) and visual content such as photos and videos (average = 3.50), consistent with the literature on the role of user-generated content in shaping consumer trust and decisions [34]. Touristic or non-touristic nature (average = 3.05) and website usability (average = 2.89) were moderately important, suggesting that both functional and experiential factors influence consumer choices.
Interestingly, celebrity endorsements (average = 1.72) had minimal impact, indicating a preference for authenticity over aspirational or external validation. This aligns with studies that find consumers skeptical of influencer marketing in sectors requiring trust, such as the F&B sector [35].
As concerns promotional activities, it is found that likes appearing in search engines (average = 2.92) and social media posts (average = 2.77) had moderate importance, while advertisements by celebrities (average = 1.90) and banners on third-party websites (average = 1.74) were rated as less effective. This suggests that consumers prioritize organic, functional, and context-relevant promotions over intrusive or broad-reaching advertisements. These findings echo the argument that personalized and non-intrusive advertising strategies are more effective in modern digital marketing [36].
In addition, concerns such as differences between online presentation and reality (average = 3.54), spam messages (average = 3.85), and review unreliability (average = 3.47) were prominent. These results align with research highlighting issues of mistrust and dissatisfaction with digital marketing in industries where sensory experience is critical [37]. Notably, knowledge of digital tools (average = 2.52) was a minor concern, indicating that digital literacy is not a significant barrier for these consumers.
Regarding the issue of reservations and contact preferences, participants overwhelmingly preferred making reservations by phone (average = 4.06), while digital reservation platforms (average = 3.24) were moderately favored. The preference for human interaction reflects findings from research on service industries, where human connection is often equated with reliability and personalized service [38].
The pandemic significantly influenced digital behaviors, with participants increasing their use of digital platforms for general searches (average = 3.74) and food-service-related purposes (average = 3.33). Moreover, stores without digital presence (average = 3.32) were seen as less accessible, reinforcing the importance of online visibility during crises. These findings align with studies that highlight digital transformation in response to COVID-19, particularly in consumer-facing industries [39].
Finally, as concerns implications for the F&B stores, the results underscore the need for stores to optimize their digital presence through platforms like Google and user-friendly websites. Additionally, they should focus on generating authentic reviews and leveraging visual content. To address concerns, transparency in marketing and efforts to align online presentations with physical experience are essential.
The chi-square analysis revealed significant demographic influences on consumer behavior and preferences in F&B store visits. Gender shaped restaurant selection criteria related to food type and location and bar selection criteria related to service, while gender differences affected leisure visits to cafés. Furthermore, gender influenced digital platform use, including Instagram and user-friendly websites for F&B stores. Age impacted dining habits before and after COVID-19, cost sensitivity, dining cost consideration, leisure and celebration outings to bars, and reputation and heavy advertising of cafés. Age significantly influenced digital behaviors related to F&B stores’ visits, such as using Google, Instagram, Google maps, and LinkedIn, and engaging with social media posts. Education influenced preferences for visual media and navigation tools such as Google Maps. Further, education influenced visits to cafés due to professional obligation, and bar visit selection criteria as related to the type of music. Employment status influenced cost considerations and reputation for selecting restaurants to visit and shaped concerns about F&B stores’ digital presence. These findings highlight the need for demographic-specific strategies to enhance customer engagement and optimize digital marketing efforts in the F&B industry.
This research highlights that the Greek F&B sector should upgrade its digital transformation in order to survive and find ways to restore stability in a changing business environment. Policy implications from the findings suggest a need to advance the use of digital marketing, prioritizing consumer confidence through visible safety measures and hygiene standards, which could be promoted through targeted campaigns or certifications. Supporting digital transformation in the F&B industry, especially for small stores, is essential, with a focus on optimizing their presence on digital platforms and leveraging high-quality, transparent content. Innovation in dining experiences, such as offering unique themes or live entertainment, could enhance the appeal of restaurants as spaces for leisure and celebration. Professionals in the Greek F&B industry have an opportunity to explore the competitive advantages that arise from implementing integrated digital strategies, thereby contributing to local and national economic development, as also pointed out for the Greek tourism industry [40].
They can also gain an understanding of the greater importance of having the right human resources in a business than having high marketing budgets.
Furthermore, encouraging authenticity in marketing through guidelines or partnerships with trusted local influencers can help reinforce consumer trust. Finally, fostering digital literacy among operators and addressing consumer feedback regularly can ensure the F&B industry’s resilience and adaptation in a post-pandemic landscape.
Future research could explore how demographic variables, such as age and digital literacy, influence these preferences, as well as the effectiveness of emerging technologies like augmented reality in bridging the gap between online presentations and in-person experiences. Suggestions for future research could also focus on specific segments of the F&B sector and case studies of businesses that have either succeeded or failed to survive the crisis using digital tools.
Author Contributions
Conceptualization, P.B. and P.C.; Methodology, P.B. and P.C.; Software, C.M.; Formal analysis, P.C., K.T. and C.M.; Investigation, C.M. and A.S.; Resources, A.S.; Data curation, P.C. and A.S.; Writing—original draft, P.B., K.T. and C.M.; Writing—review and editing, K.T., C.M. and A.S.; Supervision, P.B., K.T. and A.S. All authors have read and agreed to the published version of the manuscript.
Funding
This research received no external funding.
Institutional Review Board Statement
Ethical review and approval were waived for this study by the Institution Committee due to GDPR, since questionnaires were designed to gather subjective valuations and perceptions from participants, and no personal or sensitive data were collected.
Informed Consent Statement
Informed consent for participation was obtained from all subjects involved in the study.
Data Availability Statement
The original contributions presented in this study are included in the article material. Further inquiries can be directed to the corresponding author.
Conflicts of Interest
The authors declare no conflicts of interest.
References
- Mythili, D. A study on impact of COVID-19 on digital marketing: Paradigm shift in consumer behaviour. Int. J. Multidiscip. Res. Mod. Educ. 2021, 7, 24–27. [Google Scholar] [CrossRef]
- Wild, A.M.M.; Ortega-Gutierrez, J. Digital Marketing: Strategies, Challenges, and Opportunities in the Digital Technology. Glob. J. Econ. Bus. 2025, 15, 40–52. [Google Scholar] [CrossRef]
- Erwanda, Y.T.; Doli, E.R. Comparative Study of Digital and Traditional Marketing Strategies in Increasing Product Sales. Smart Int. Manag. J. 2024, 1, 14–20. [Google Scholar] [CrossRef]
- Koutsautaki, A.; Boufounou, P.; Toudas, K.; Malesios, C. Digital transformation in Greece during COVID: A case-study on digital marketing strategies’ effectiveness. In Proceedings of the 9th ICBE-HOU (International Conference on Business and Economics—Hellenic Open University), Athens, Greece, 27–28 September 2024; Available online: https://eproceedings.epublishing.ekt.gr/index.php/ICBE-HOU/article/view/7358 (accessed on 15 February 2024).
- Klimin, A.; Tikhonov, D.; Efimov, A.M. Evaluation of the effectiveness of marketing communications in Russian business using the example of St. Petersburg enterprises. In Proceedings of the 30th International Business Information Management Association Conference, IBIMA 2017—Vision 2020: Sustainable Economy, Madrid, Spain, 8–9 November 2017; ISBN 9781713812395. [Google Scholar]
- Fejling, T.; Torosyan, E.; Tsukanova, O.; Kalinina, O. Special aspects of digital technology-based brand promotion. IOP Conf. Ser. Mater. Sci. Eng. 2019, 497, 012027. [Google Scholar] [CrossRef]
- Pai, P.; Arnott, D.C. User adoption of social networking sites: Eliciting uses and gratifications through a means–end approach. Comput. Hum. Behav. 2013, 29, 1039–1053. [Google Scholar] [CrossRef]
- Cetină, J.; Maria-Cristiana, M.; Rădulescu, V. Psychological and Social Factors that Influence Online Consumer Behavior. Procedia—Soc. Behav. Sci. 2012, 62, 184–188. [Google Scholar] [CrossRef]
- Sonar, H.C.; Khanzode, V.; Akarte, M. A conceptual framework on implementing additive manufacturing technology towards firm competitiveness. Int. J. Glob. Bus. Compet. 2020, 15, 121–135. [Google Scholar] [CrossRef]
- Yasmin, A.; Tasneem, S.; Fatema, K. Effectiveness of digital marketing in the challenging age: An empirical study. Int. J. Manag. Sci. Bus. Adm. 2015, 1, 69–80. [Google Scholar] [CrossRef]
- Krasnov, A.; Chargaziya, G.; Griffith, R.; Draganov, M. Dynamic and static elements of a consumer’s digital portrait and methods of their studying. In Proceedings of the International Scientific Conference “Digital Transformation on Manufacturing, Infrastructure and Service”, Saint-Petersburg, Russia, 21–22 November 2018. [Google Scholar] [CrossRef]
- Berman, B.; Thelen, S. Planning and implementing an effective omnichannel marketing program. Int. J. Retail Distrib. Manag. 2018, 46, 598–614. [Google Scholar] [CrossRef]
- Talpau, A.; Boscor, D. Customer-Oriented Marketing—A Strategy that Guarantees Success, Starbucks and McDonald’s. In Bulletin of the Transylvania University of Brasov, Economic Sciences; Transilvania University Press: Braşov, Romania, 2011; Volume 4, pp. 51–58. Available online: https://webbut.unitbv.ro/index.php/Series_V/article/view/6275/4816 (accessed on 25 February 2024).
- Bartik, A.W.; Bertrand, M.; Cullen, Z.B.; Glaeser, E.L.; Luca, M.; Stanton, C.T. How Are Small Businesses Adjusting to COVID-19? Early Evidence from a Survey; National Bureau of Economic Research: Cambridge, UK, 2020. [Google Scholar] [CrossRef]
- Harris, L.; Ezeh, C. Servicescape and Loyalty Intentions: An Empirical Investigation. Eur. J. Mark. 2008, 42, 390–422. [Google Scholar] [CrossRef]
- Ashaari, M.J.; Daud, S. The Effects of Cleaner Production and Resource Efficiency on Corporate Sustainability Performance. Ind. J. Sci. Technol. 2018, 22, 364–383. [Google Scholar] [CrossRef]
- Brizek, M.G.; Frash, R.E.; McLeod, B.M.; Patience, M.O. Independent restaurant operator perspectives in the wake of the COVID-19 pandemic. Int. J. Hosp. Manag. 2021, 93, 102766. [Google Scholar] [CrossRef]
- Kunde, B.L.; Morgan, I.; Genov, M. The Impact of COVID-19 on Restaurants and Consumer Behaviour Within Jönköping Region. Bachelor Thesis, Jönköping University, Jönköping, Sweden, 2022. Available online: https://www.diva-portal.org/smash/get/diva2:1667190/FULLTEXT01.pdf (accessed on 25 February 2024).
- Gultek, M.; Heroux, L.; Gottschall, R. Digital and Social Media Marketing Strategies of American and Canadian Restaurants in a Pandemic. J. Mark. Manag. 2021, 9, 50–58. [Google Scholar] [CrossRef]
- Kim, J.; Lee, J.C. Effects of COVID-19 on preferences for private dining facilities in restaurants. J. Hosp. Tour. Manag. 2020, 45, 67–70. [Google Scholar] [CrossRef]
- Economides, G.; Philippopoulos, A. The macroeconomic impact of COVID-19 on the Greek economy and policies from now on. In The Economic Impact of COVID-19 in Greece, GreeSE Pap; Monastiriotis, V., Katsinas, P., Eds.; Hellenic Observatory, London School of Economics and Political Science: London, UK, 2020; pp. 7–18. Available online: https://www.lse.ac.uk/Hellenic-Observatory/Assets/Documents/Publications/GreeSE-Papers/GreeSE-Special-Issue-2.pdf#page=8 (accessed on 15 April 2024).
- Kranias, G. Communication Between Businesses in the Catering Sector and Consumers in the Municipality of Thermaikos During the Pandemic. Master’s Thesis, University of Macedonia, Thessaloniki, Greece, 2022. Available online: https://dspace.lib.uom.gr/handle/2159/27583 (accessed on 25 February 2024).
- Tsimonis, G.; Dimitriadis, S. Brand strategies in social media. Mark. Intell. Plan. 2014, 32, 328–344. [Google Scholar] [CrossRef]
- Horák, J.; Mlsová, K.; Machová, V. Impact of the coronavirus pandemic on the tertiary sector. Littera Scr. 2021, 14, 28–39. [Google Scholar] [CrossRef]
- Uğur, N.G.; Akbıyık, A. Impacts of COVID-19 on global tourism industry: A cross-regional comparison. Tour. Manag. Perspect. 2020, 36, 100744. [Google Scholar] [CrossRef]
- Mariolis, T.; Rodousakis, N.; Soklis, G. The COVID-19 multiplier effects of tourism on the Greek economy. Tour. Econ. 2021, 27, 1848–1855. [Google Scholar] [CrossRef]
- Bacon-Shone, J. Introduction to Quantitative Research Methods; University of Hong Kong: Hong Kong, China, 2015; ISBN 9789881281302. [Google Scholar]
- IBM. SPSS Statistics for Windows; Version 28.0; IBM Corp: Armonk, NY, USA, 2021; Available online: https://www.ibm.com/products/spss (accessed on 25 April 2024).
- Zhang, C.; Park, J.; Bonn, M.A.; Cho, M. Understanding Customer Responses to Service Failures during the COVID-19 Pandemic for Sustained Restaurant Businesses: Focusing on Guanxi. Sustainability 2021, 13, 3581. [Google Scholar] [CrossRef]
- Jiang, Y.; Lau, A.K.W. Effect of restaurant consumers’ anticipated emotions on perceived value and behavioral intention in the COVID-19 context. Front. Psychol. 2022, 13, 1013209. [Google Scholar] [CrossRef]
- Liu, W.; Choi, T.-M.; Niu, X.; Zhan, M.; Fan, W. Determinants of Business Resilience in the F&B industry During the COVID-19 Pandemic: A Textual Analytics Study on an O2O Platform Case. IEEE Trans. Eng. Manag. 2024, 71, 10427–10440. [Google Scholar] [CrossRef]
- Karimi, S.; Papamichail, K.N.; Holland, C.P. The effect of prior knowledge and decision-making style on the online purchase decision-making process: A typology of consumer shopping behaviour. Decis. Support Syst. 2018, 108, 101–115. [Google Scholar] [CrossRef]
- Tseng, P.-Y.; Lee, S.-F. The Impact of Web Visual Aesthetics on Purchase Intention. In Proceedings of the 2019 IEEE Eurasia Conference on IOT, Communication and Engineering (ECICE), Yunlin, Taiwan, 3–6 October 2019; pp. 28–31. [Google Scholar] [CrossRef]
- Filieri, R.; Alguezaui, S.; McLeay, F. Why do travelers trust TripAdvisor? Antecedents of trust towards consumer-generated media and its influence on recommendation adoption. Tour. Manag. 2015, 51, 174–185. [Google Scholar] [CrossRef]
- De Veirman, M.; Cauberghe, V.; Hudders, L. Marketing through Instagram influencers: The impact of number of followers and product divergence on brand attitude. Int. J. Advert. 2017, 36, 798–828. [Google Scholar] [CrossRef]
- Lamberton, C.; Stephen, A.T. A thematic exploration of digital, social media, and mobile marketing: Research evolution from 2000 to 2015 and an agenda for future inquiry. J. Mark. 2016, 80, 146–172. [Google Scholar] [CrossRef]
- Pantano, E.; Pizzi, G.; Scarpi, D.; Dennis, C. Competing during a pandemic? Retailers’ ups and downs during the COVID-19 outbreak. J. Bus. Res. 2020, 116, 209–213. [Google Scholar] [CrossRef]
- Chathoth, P.K.; Ungson, G.R.; Harrington, R.J.; Chan, E.S.W. Co-creation and higher order customer engagement in hospitality and tourism services. Int. J. Contemp. Hosp. Manag. 2014, 26, 1041–1060. [Google Scholar] [CrossRef]
- McKinsey & Co. The Quickening: How COVID-19 Is Accelerating Digital Transformation in Companies. 2020. Available online: https://www.mckinsey.com/capabilities/strategy-and-corporate-finance/our-insights/how-covid-19-has-pushed-companies-over-the-technology-tipping-point-and-transformed-business-forever (accessed on 18 March 2024).
- Velentza, A.; Metaxas, T. The role of digital marketing in tourism businesses: An empirical investigation in Greece. Businesses 2023, 3, 272–292. [Google Scholar] [CrossRef]
Disclaimer/Publisher’s Note: The statements, opinions and data contained in all publications are solely those of the individual author(s) and contributor(s) and not of MDPI and/or the editor(s). MDPI and/or the editor(s) disclaim responsibility for any injury to people or property resulting from any ideas, methods, instructions or products referred to in the content. |
© 2025 by the authors. Licensee MDPI, Basel, Switzerland. This article is an open access article distributed under the terms and conditions of the Creative Commons Attribution (CC BY) license (https://creativecommons.org/licenses/by/4.0/).