


Abstract
Sustainable Cities and Communities within the European Union (EU) are crucial for achieving Sustainable Development Goal (SDG) 11, which aims to make cities and human settlements inclusive, safe, resilient, and sustainable. This goal is particularly pertinent to the EU due to challenges such as urbanization, climate change, infrastructure demands, transport issues, and natural resource management. The implementation of SDG 11 across Europe shows varying levels of success among countries and regions, highlighting the need for tailored, local strategies for sustainable urban development. The primary goal of this paper is to employ the Multi-Criteria Method Integrating Distances to Ideal and Anti-Ideal Points to determine the Sustainable Cities and Communities Index (SCCI). Using Eurostat data, this method provides a comprehensive evaluation and ranking of EU countries based on their performance in achieving SDG 11 in EU countries in 2015 and 2020. By integrating various indicators related to urban sustainability—such as access to public transport, air quality, land use, and housing conditions—the SCCI offers a nuanced understanding of how different countries perform relative to one another. The SCCI facilitates the identification of best practices and areas requiring improvement by comparing each country’s performance to ideal and anti-ideal points. This comparison allows policymakers to develop more targeted and effective strategies. Additionally, it highlights disparities between countries and regions, which is essential for fostering regional cooperation and ensuring equitable progress towards sustainable urban development across the EU. This study confirmed significant disparities among EU countries in the realization of SDG 11 in 2015 and 2020, revealing that Italy achieved the most substantial progress, while Spain experienced the greatest regress during the analyzed period.
1. Introduction
The concept of Sustainable Development (SD) has gained widespread recognition as a critical objective for human society in the 21st century. It has evolved significantly over time, driven by challenges such as environmental degradation, population growth, and social inequality. While the initial focus was primarily on ecological protection, SD has expanded to include social and economic dimensions. Today, it seeks to achieve a balanced integration of three core pillars: environmental protection, social equity, and economic stability [1,2,3,4]. The primary goal is to meet the present generation’s needs without compromising future generations’ ability to satisfy their own. This approach encourages balanced decision-making considering natural resources, human well-being, and economic growth, ensuring long-term responsibility for future generations.
The growing recognition of SD as a global priority has led to adopting frameworks like the 2030 Agenda for Sustainable Development, which includes the 17 Sustainable Development Goals (SDGs). These goals address issues related to people, prosperity, the planet, partnerships, and peace to build a more sustainable world. The SDGs emphasize the importance of strategic implementation to achieve a better future by focusing on areas that significantly impact human well-being. They target key challenges such as poverty, inequality, climate action, and urban development. Halkos and Gkampoura [5] provide a comprehensive literature review regarding SDG goals and targets, while Diaz-Lopez et al. [6] analyze the scientific evolution of the Sustainable Development Goals through a systematic, extensive literature review of bibliographic records on the SDGs.
One of these goals, Goal 11: Sustainable Cities and Communities, seeks to make cities inclusive, safe, resilient, and sustainable. It should be emphasized that cities are becoming increasingly prominent as focal points for social and economic activity. The urban environment is becoming the primary location for individuals to establish their place of residence. In mid-2023, it was estimated that approximately 4.6 billion of the world’s more than 8 billion people resided in urban areas, representing 57% of the global population. By 2030 and 2050, this proportion is projected to reach 60% and 68%, respectively [7]. These statistics are even more pronounced in the European Union, where it is estimated that 76% of the population will live in urban areas by 2023 and around 80% by 2050. The overall urban population is set to increase in 15 EU Member States, ranging from +2.3% in Croatia to +35.4% in Malta [8]. Additionally, it is projected that the level of urbanization all over Europe will reach approximately 83.7% by 2050. It is also noteworthy that cities generate over 80% of the global GDP yet simultaneously consume approximately two-thirds of the world’s energy. Responsible for a significant proportion of worldwide energy consumption, which generates approximately 70% of global greenhouse gas emissions, urban areas are also particularly vulnerable to the impacts of climate change. Furthermore, cities worldwide generate over 720 billion tons of waste annually. Over 70% of waste generated worldwide still goes to landfills or waste dumps, which harms the environment and potentially threatens public health [9,10]. All these circumstances highlight the urgent need for sustainable solutions for cities since a sustainable city reduces energy consumption, protects the environment, promotes urban density, eases traffic congestion, mitigates urban heat island effects, supports urban agriculture, recycles waste, ensures clean water, and expands green spaces. Additionally, sustainable cities foster walkable neighborhoods, local employment, human well-being, civic engagement, and efficient information management [11,12,13]. Therefore, sustainable urban development is essential to achieving long-term social and environmental well-being [14,15,16]. Given the wide range of factors involved, from energy efficiency and waste management to green spaces and social well-being, a multidimensional assessment is crucial for effective policymaking and urban planning.
Kumar [17] conducted a comprehensive review of publication and citation trends, sources, trending topics, thematic evolution, and a thematic map using metadata extracted from the Scopus database to assess the published literature on SDG 11. The paper of Caprotti et al. [18] discusses key opportunities and challenges for policy and practice related to SDG 11, while Nabiyeva et al. [19] analyze SDG good practices data collected by the UN globally between 2018 and 2021 to understand how SDG 11 is being implemented. The analysis is structured around five critical criteria: geographic distribution of good practices, actors involved in addressing SDG 11, progress toward SDG 11 targets, areas of implementation focus, and the scale of actions taken. A total of 86 of the 193 countries that endorsed the 2030 Agenda reported at least one good practice related to SDG 11. The findings highlight disparities in reporting between developed and developing countries and suggest the need for improved reporting, increased public sector involvement, and a greater focus on social equity in urban sustainability efforts. Ionescu et al. [20] assess the progress of EU Member States in achieving the goals of SDG 11 from the 2030 Agenda based on an analysis of crucial indicators published by Eurostat.
Effectively implementing SDGs requires continuous monitoring to assess progress and inform policy decisions. To facilitate this, indicator-based systems, such as those used by Eurostat, have been developed to track advancements toward the SDGs [21]. The complexity of each country’s path toward sustainable development cannot be fully captured by a single ranking indicator [22,23,24]. Thus, multi-criteria decision-making (MCDM) has become an established method in the literature for assessing sustainable performance [25,26,27,28,29]. Lindfords [26] reviewed the use of multi-criteria methods in sustainability assessments, highlighting the need for transparency in methodological choices. El Gibari et al. [27] review the post-2002 literature from leading JCR-indexed journals to identify and classify MCDM methods for aggregating single indicators into composite ones, categorized into five types: elementary methods, value- and utility-based methods, outranking approaches, data envelopment analysis, and distance functions. Diaz-Balteiro et al. [28] analyzed 271 papers from the ISI Web of Science, finding that the most common methods were the Analytic Hierarchy Process (AHP) and Weighted Arithmetic Mean (WAM). Similarly, Sousa et al. [29] examined 143 studies from the Scopus database on Multi-Criteria Decision-Making (MCDM) techniques for advancing the SDGs, identifying popular methods such as the AHP and Technique for Ordering Preferences by Similarity to Ideal Solution (TOPSIS).
MCDM allows for the integration of different perspectives and criteria, enabling the creation of aggregate measures that provide a more nuanced understanding of progress across various dimensions of sustainability. This approach is fundamental when assessing complex SDGs, such as Sustainable Cities and Communities. Considering the diverse factors at play, including pollution, waste management, transport, land use, and social well-being, a comprehensive assessment is essential for effective urban development policy. The multidimensional evaluation issue in SDG 11 was addressed by Berisha et al. [30], who proposed a set of procedural, instrumental, and financial indicators to assess the quality of spatial governance and planning to make cities and territories more sustainable. Also, the paper of Lami et al. [31] proposes new indicators to monitor SDG 11 targets on affordable housing and inclusive urbanization to support urban policymaking.
A multi-criteria approach has been applied to evaluate the implementation of SDG 11 in the European Union Member States [32,33,34]. Bartniczak and Raszkowski [32] utilized Hellwig’s method to assess the progress toward achieving SDG 11 in the EU countries between 2005 and 2020. Wątróbski et al. [33] employed a method combining the MCDA approach with the Data vARIability Assessment Technique for Order of Preference by Similarity to Ideal Solution (DARIA-TOPSIS) to evaluate the issue of sustainable cities and communities across 26 European countries. In another study, Wątróbski et al. [34] proposed the Temporal VIKOR method, which, combined with the measurement of data variability, enables the aggregation of alternative efficiencies over time. The practical utility of this approach was demonstrated through a temporal evaluation of sustainable cities and communities in alignment with the UN’s SDG 11 framework. In turn, Górecka and Roszkowska [35] proposed a novel multi-criteria approach for evaluating and ranking countries’ progress towards achieving the Sustainable Development Goals, particularly SDG 11 on Sustainable Cities and Communities. Their framework incorporates various types of reference points (individual and whole sets) and uses modified TOPSIS and BIPOLAR methods. It was applied to assess 27 EU countries in two years, namely 2015 and 2019. Pricope et al. [36] introduced the European Development Scoreboard for SDG 11 at the European level, utilizing 15 sustainability indicators. Their study analyzed the progress of EU Member States from 2010 to 2022 to SDG 11. The findings highlight significant disparities among countries in their capacity to meet the SDG 11 targets, reflecting varied approaches and outcomes in urban development across Europe during this period.
The main aim of this study is to propose a Sustainable Cities and Communities Index (SCCI) based on a Multi-Criteria Method that integrates Distances to Ideal and Anti-Ideal Points (MIDIA) [37]. This method is designed to rank and compare EU countries in terms of the level of implementation of SDG 11, and thereby, it provides an opportunity to comprehensively measure progress toward achieving Goal 11 of the Sustainable Development Goals (SDGs) in EU Member States.
Firstly, incorporating indicators from Eurostat allows for a detailed and standardized assessment of various aspects of urban sustainability. Eurostat’s comprehensive data covers various topics, including air quality, waste management, land use, housing conditions, and public transport accessibility. This extensive dataset enables a thorough evaluation of urban environments across multiple dimensions, ensuring that the index reflects diverse and relevant aspects of sustainability.
Secondly, the MIDIA method offers several advantages for aggregating these indicators. Using coefficients of distance importance, MIDIA balances the significance of proximity to both the ideal and anti-ideal solutions in country evaluations [37]. The ideal point represents a theoretical best-case scenario, where each criterion achieves its maximum possible value for benefit criteria and minimum possible value for cost criteria. Conversely, the anti-ideal point represents a theoretical worst-case scenario, where each criterion achieves its minimum possible value for benefit criteria and maximum possible value for cost criteria. This approach allows for flexible adjustments according to specific priorities and objectives, providing a nuanced understanding of each country’s performance across multiple criteria. The MIDIA method thus enhances decision-making by offering a detailed comparison based on well-defined reference points. It is worth noting that the MIDIA approach can be viewed as an extension of Hellwig’s approach, designed to facilitate the ranking of alternatives based on these two reference points [38,39,40].
Thirdly, the application of the dynamic MIDIA method, based on the common ideal and anti-ideal points, enabled the ranking of countries and a comparative assessment of the magnitude and direction of changes in the realization of SDG 11 in EU countries, observed both in individual years and throughout the entire period under study.
The results of the analysis enabled us to address the following research questions:
- Q1: What are the differences in achieving SDG 11 between EU countries in 2015 and 2020?
- Q2: What is the ranking of the EU countries in terms of their achievement of SDG 11 in 2015 and 2020?
- Q3: How does the parameter affect the ranking of countries in the Sustainable Cities and Communities Index (SCCI)?
- Q4: What are the differences in achieving SDG 11 between EU countries during the studied years?
- Q5: Which countries have demonstrated the most significant progress in achieving SDG 11 in 2020 compared to 2015?
- Q6: Which countries have experienced the most significant declines in their progress towards achieving SDG 11 in 2020 compared to 2015?
- Q7: Which indicators have the most significant impact on changes in the ranking positions of countries concerning SDG 11?
The article is organized as follows. Section 2 introduces the indicators related to SDG 11, providing detailed descriptions of their characteristics, and outlines the methodology applied for further analysis. Section 3 analyzes the results obtained using the Sustainable Cities and Communities Index to rank EU countries, followed by an in-depth discussion of the findings. The paper concludes with a summary of key insights and a discussion of this study’s limitations.
2. Materials and Methods
2.1. Materials
This section demonstrates the indicators that will be employed in subsequent phases of the research, accompanied by their statistical analysis.
Table A1 in Appendix A presents a set of nine indicators, accompanied by brief descriptions, which are utilized in the 2024 edition of the EU SDG monitoring report. Compared to the 2023 edition, the indicator Soil sealing index [sdg_11_32] has been relocated from SDG 15 and replaced the previous indicator, Settlement area per capita [sdg_11_31]. The indicators in Table A1 are organized into three domains: Quality of life in cities and communities (indicators C1–C4), Sustainable mobility (indicators C5 and C6), and Environmental impacts (indicators C7–C9). The metadata for all indicators can be accessed on the Eurostat website [41].
The research sample consisted of eight SDG 11 indicators (C1–C8) for all EU Member States, employing statistical data sourced from Eurostat for the years 2015 and 2020 (Eurostat, [41]). The indicator C9, which measures the proportion of the population connected to at least secondary wastewater treatment [sdg_06_20], was excluded from further analysis. The decision was necessitated by the presence of data gaps. Concerning the years 2015 and 2020, data for Luxembourg and Portugal were unavailable. Furthermore, data for the year 2015 were not available for Cyprus and Slovakia, while Malta had a value of zero for this year. For the year 2020, data for Germany and Italy were missing.
It is important to note that the Eurostat database, at the time of download, contained data for some indicators up to 2023. These included the Population living in households considering that they suffer from noise [sdg_11_20] and the Population reporting the occurrence of crime, violence, or vandalism in their area by poverty status [sdg_16_20]. Nevertheless, a comprehensive dataset could only be assembled for the year 2020. This was achievable for all countries except Poland, where the values for indicators C1, C2, and C4 were replaced with 2019 figures due to data deficiencies.
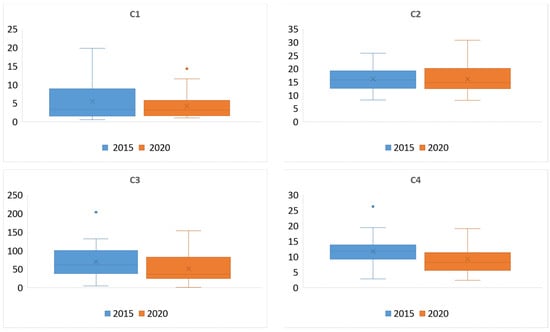
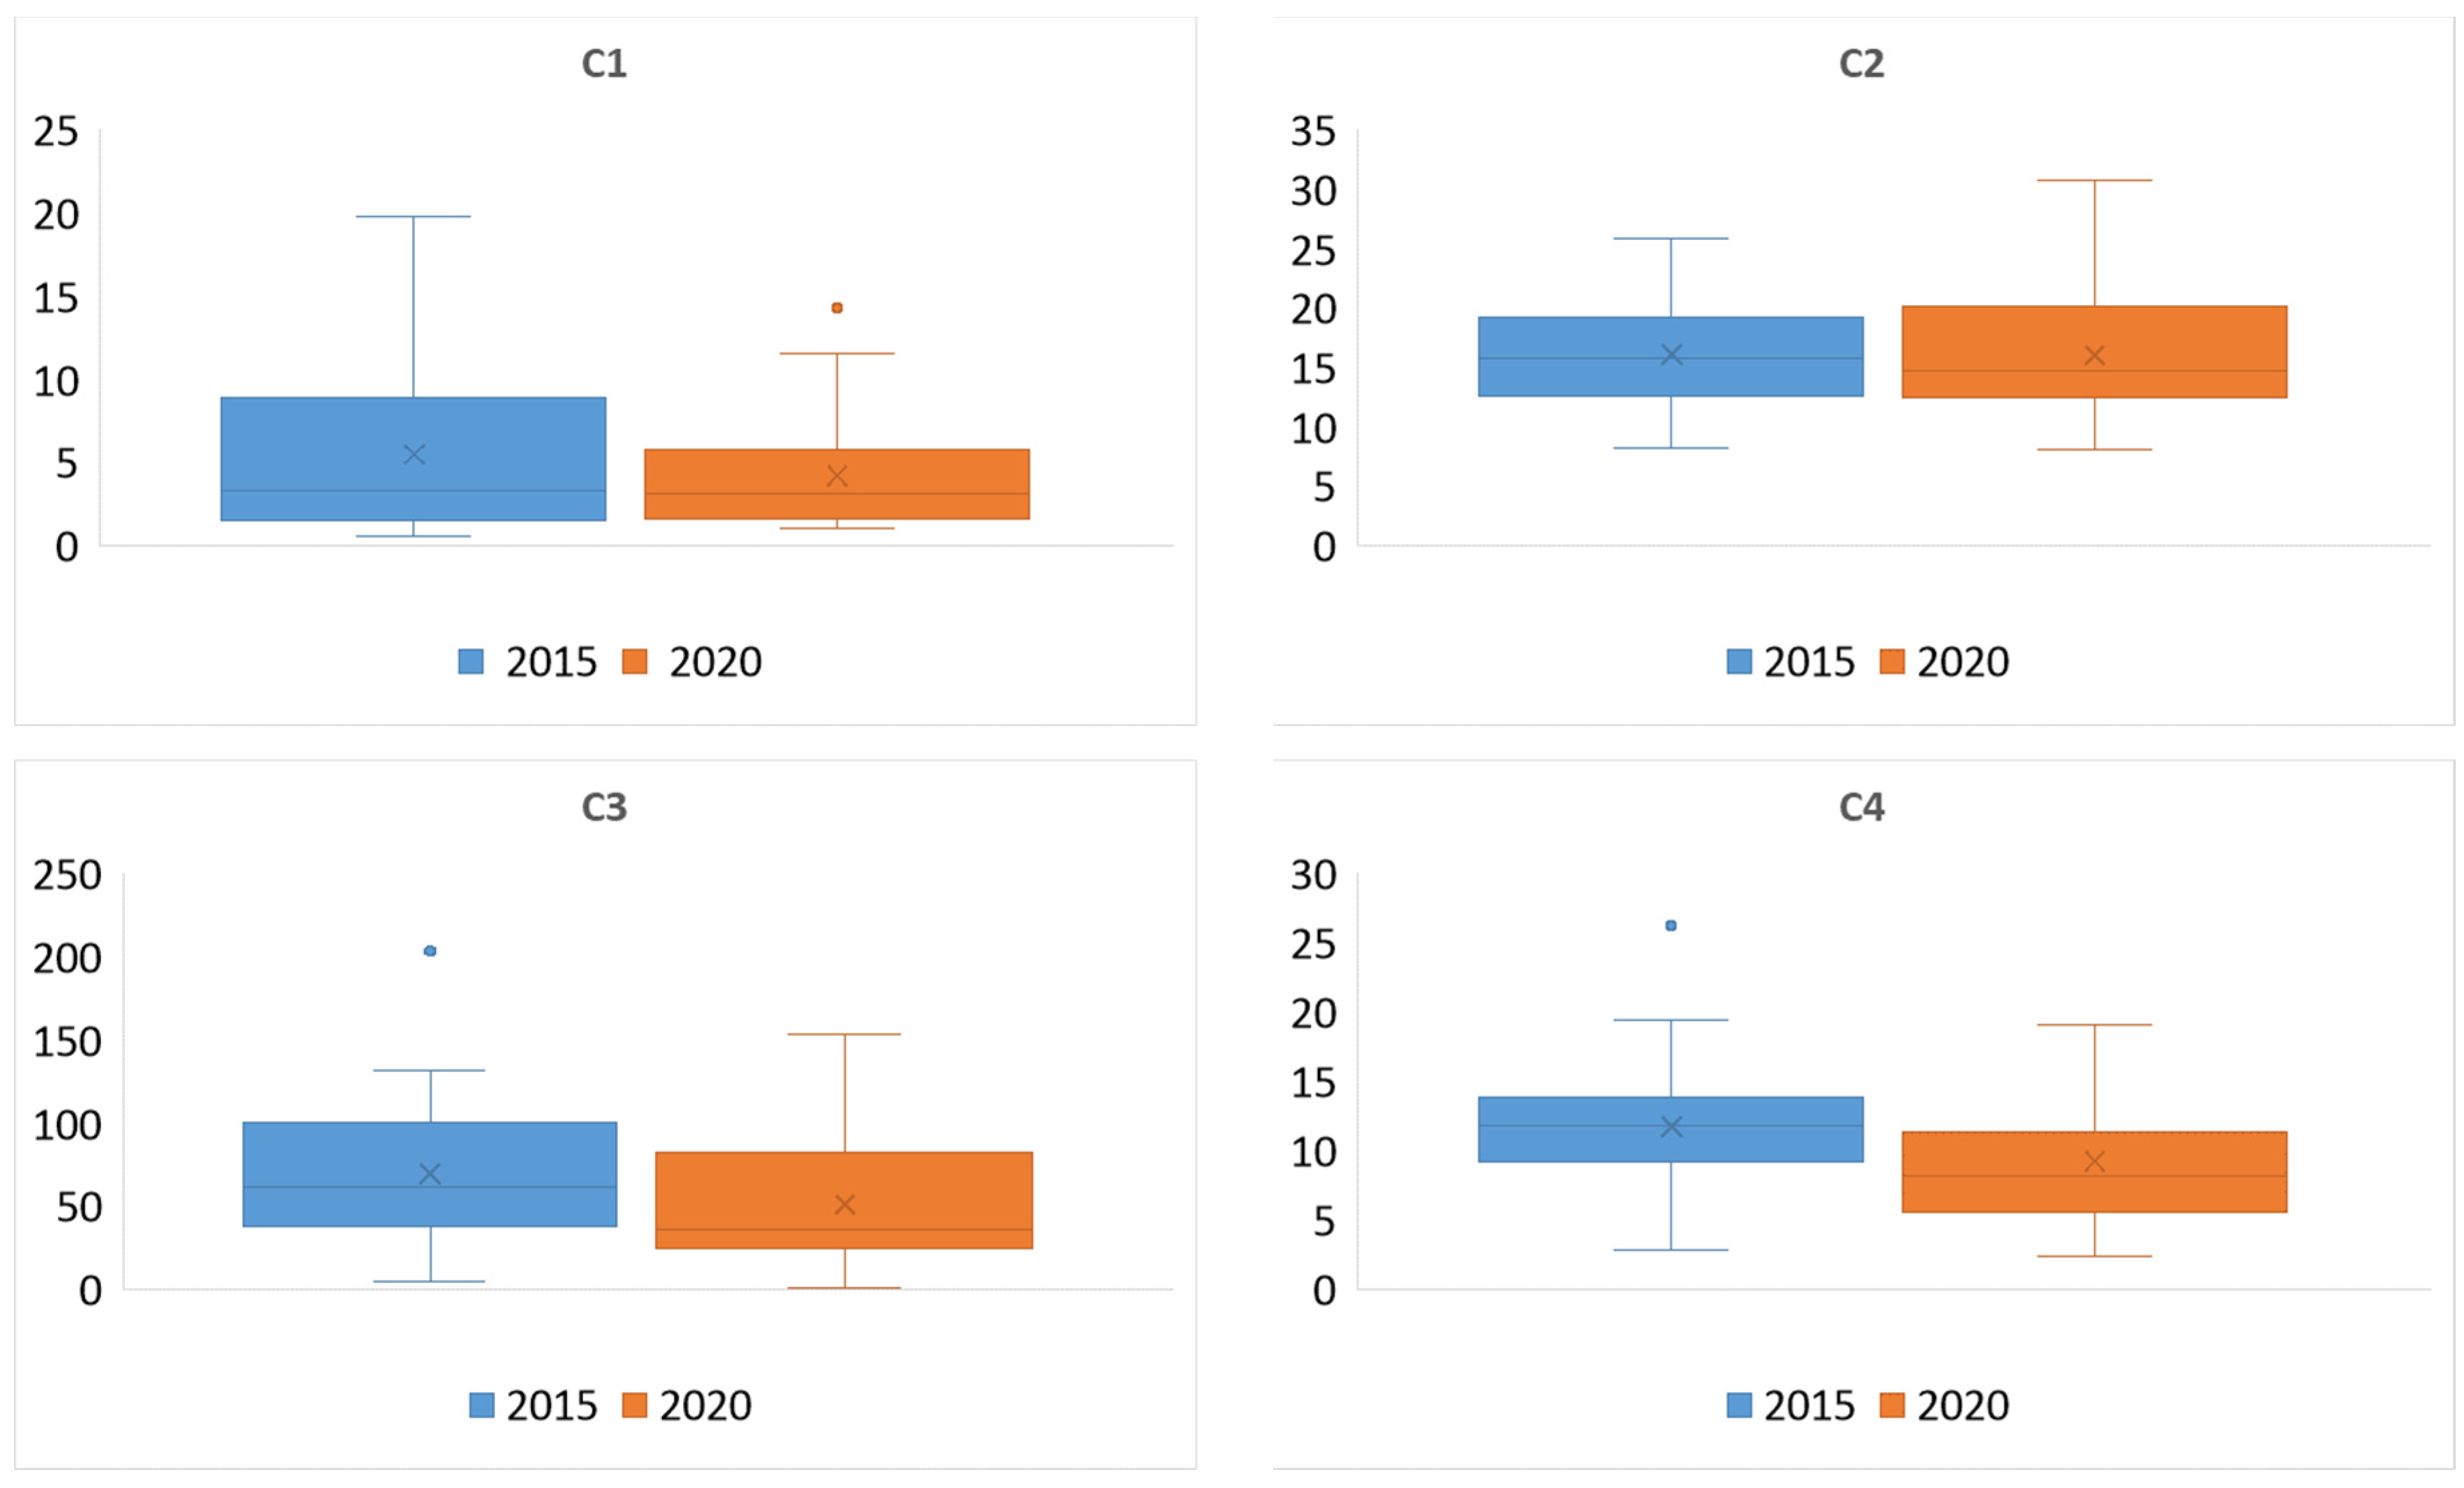
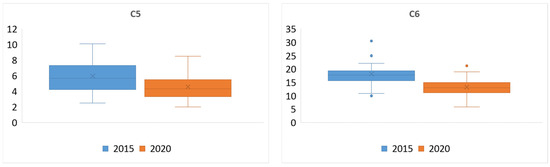
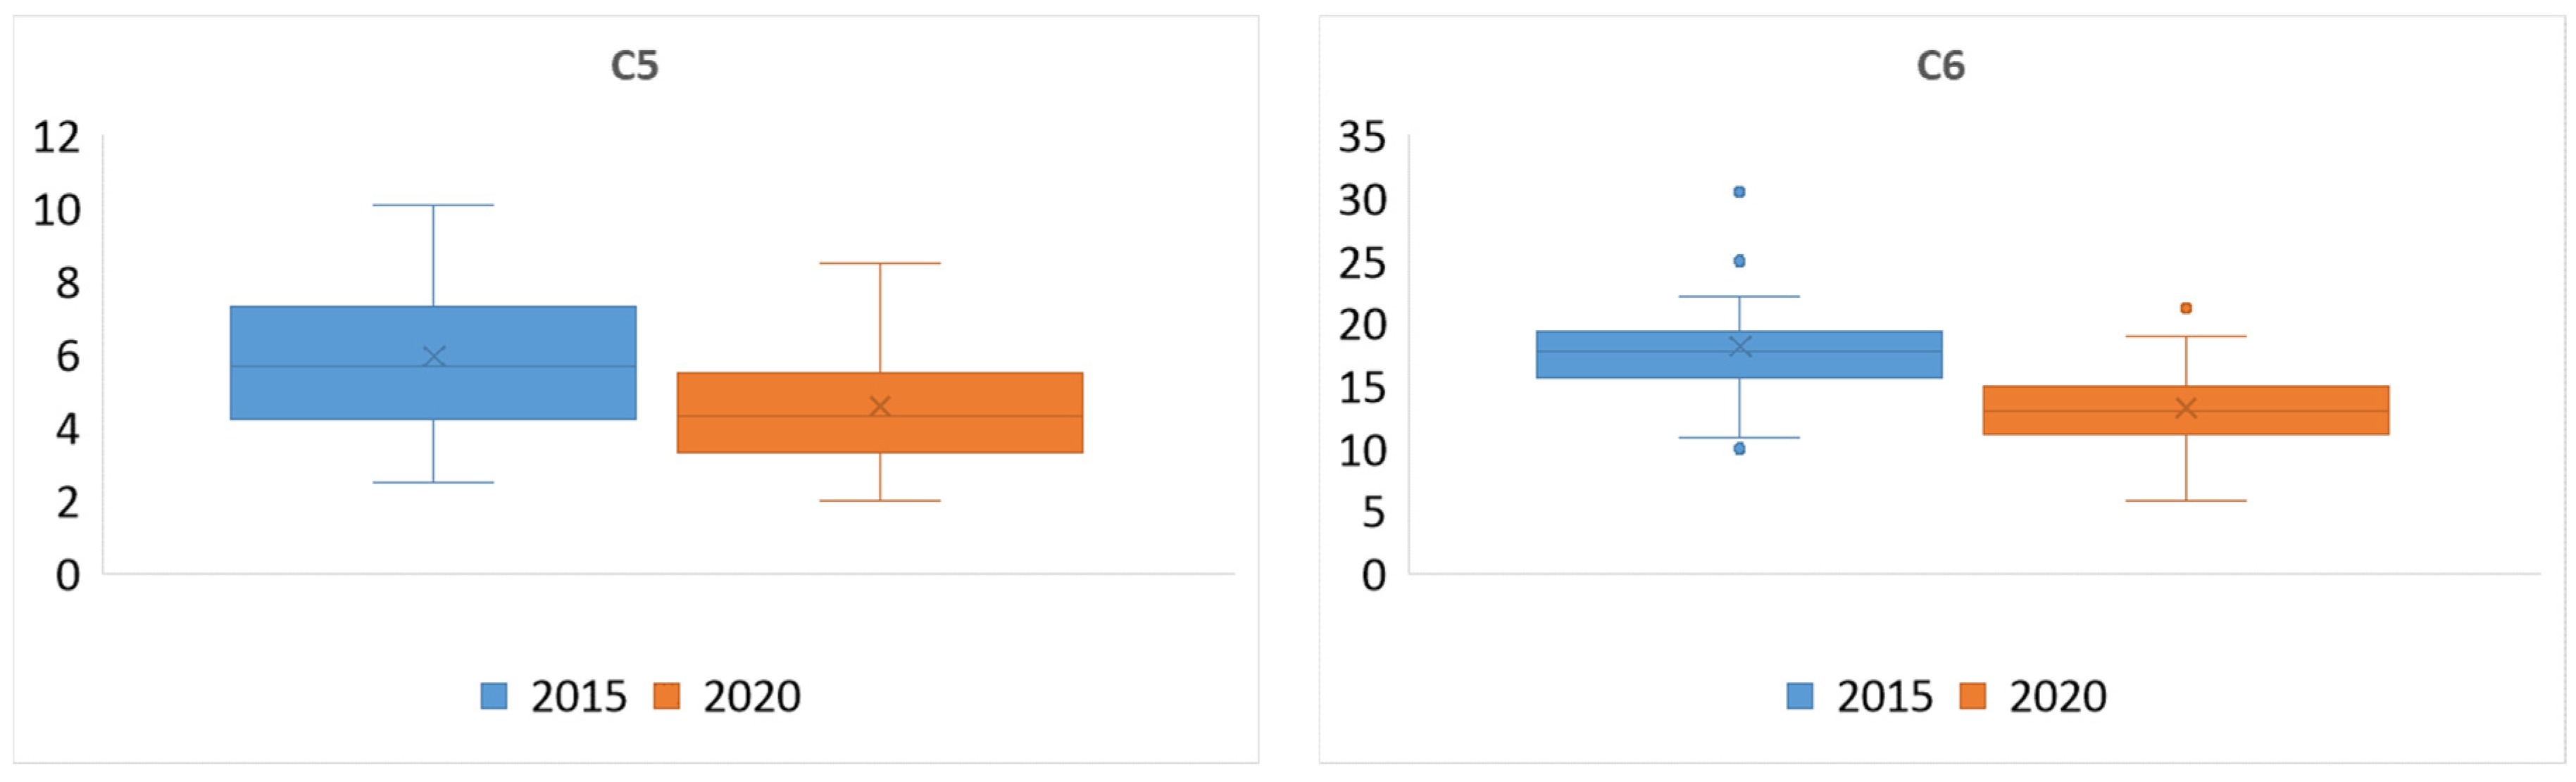
Table 1 and Table 2 present basic descriptive statistics of the SDG 11 indicators for 2015 and 2020, while Figure 1, Figure 2 and Figure 3 show the graphical representations of their distribution in the form of boxplots.
Table 1.
The descriptive statistics for the SDG 11 indicators in 2015.
Table 2.
The descriptive statistics for the SDG 11 indicators in 2020.
Figure 1.
The boxplots of the SDG 11 indicators from the domain of Quality of life in cities and communities in the years 2015 and 2020.
Figure 2.
The boxplots of the SDG 11 indicators from the domain of Sustainable mobility in the years 2015 and 2020.
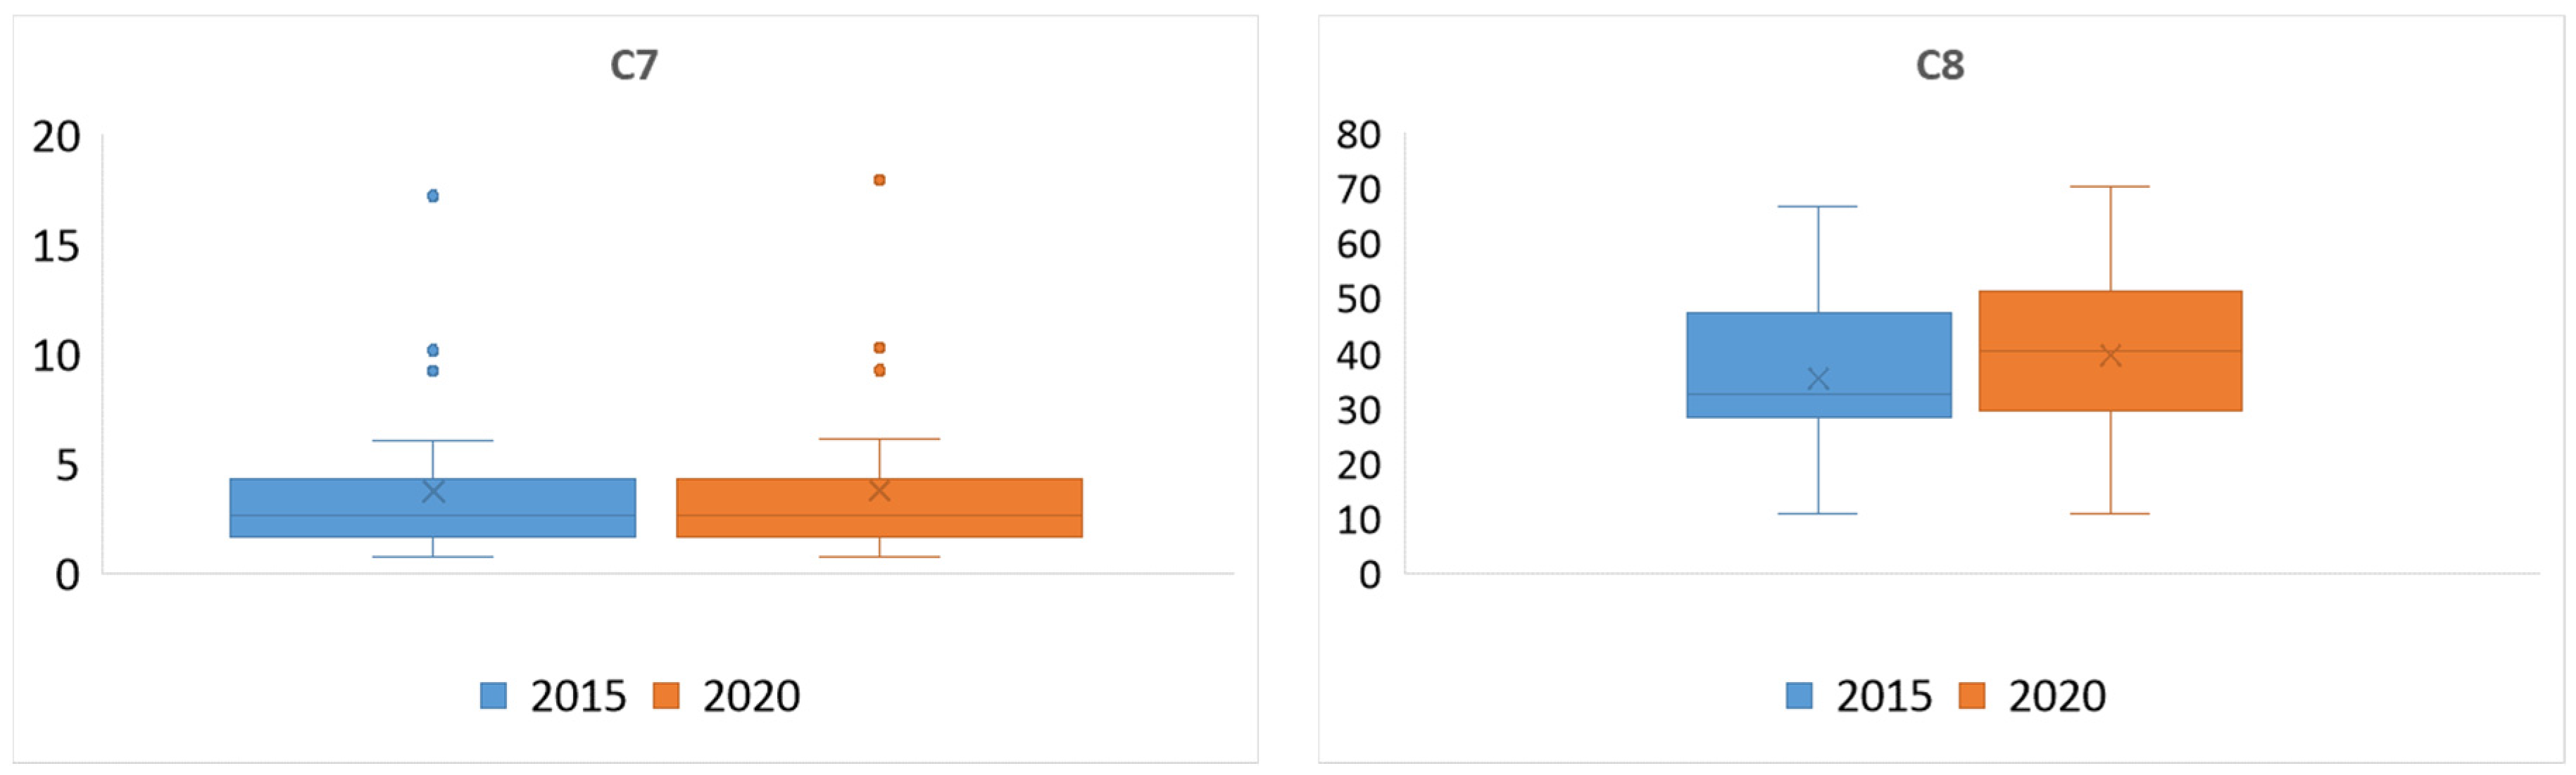
Figure 3.
The boxplots of the SDG 11 indicators from the domain of Environmental impacts in the years 2015 and 2020.
In 2015, the indicators C1 and C7 exhibited high variation, with values of 93.24 and 93.93, respectively. The smallest variation (23.53) was observed for indicator C6 (Table 1). The countries with the best performance were Cyprus (C1), Ireland (C2), Finland (C3), Croatia (C4), Malta (C5), Hungary (C6), Sweden (C7), and Germany (C8). Conversely, the most concerning situations were noted in Romania (C1), Germany (C2), Bulgaria (C3, C4, C5), Portugal (C6), and Malta (C7, C8).
Table 2 indicates that in 2020, the variation was the highest for C7 (95.55) and the lowest for C6 (25.88). The leading countries for the C3, C4, C6, C7, and C8 indicators remained the same as in 2015. Malta and Finland excelled in C1, Estonia led in C2, and Sweden performed best in C5. The countries in the worst positions were Romania due to C1 and C5, Malta due to C2, C7, and C8, Bulgaria due to C3 and C4, and Lithuania for C6.
Figure 1, Figure 2 and Figure 3 display the distribution of SDG 11 indicators across three areas: Quality of life in cities and communities, Sustainable mobility, and Environmental impacts, in the form of boxplots. Based on the results presented in Table 1 and Table 2, these visualizations provide a clear overview of key statistics such as medians, quartiles, and potential outliers. By comparing 2015 and 2020, the boxplots reveal trends indicating both progress and setbacks across countries. This representation highlights changes in central tendencies and data spreads, offering valuable insights into the EU country’s performance and progress in achieving SDG 11.
Considering the mean in the domain of Quality of life in cities and communities, there is progress in all indicators, the most significant in C3 and the least significant in C2. The variation decreased for C1 and increased for C2, C3, and C4. Moreover, there are outliers for indicators C3 and C4 in 2015 (Bulgaria) and C1 in 2020 (Romania).
In the domain of Sustainable mobility, there is progress in the mean value of indicator C5 and regress in C6. The variation decreased slightly for C5 and increased for C6. Furthermore, outliers can be observed for indicator C6 in 2015 (Hungary, Slovakia, Czechia, and Portugal) and 2020 (Hungary).
Changes in the values of indicator C7 in the domain of Environmental impacts were slight (Figure 3). Moreover, outliers can be observed for both years analyzed (Malta, Netherlands, Belgium). For C8, there was progress in the mean level and a decrease in variation.
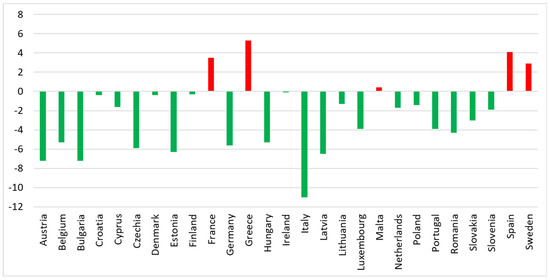
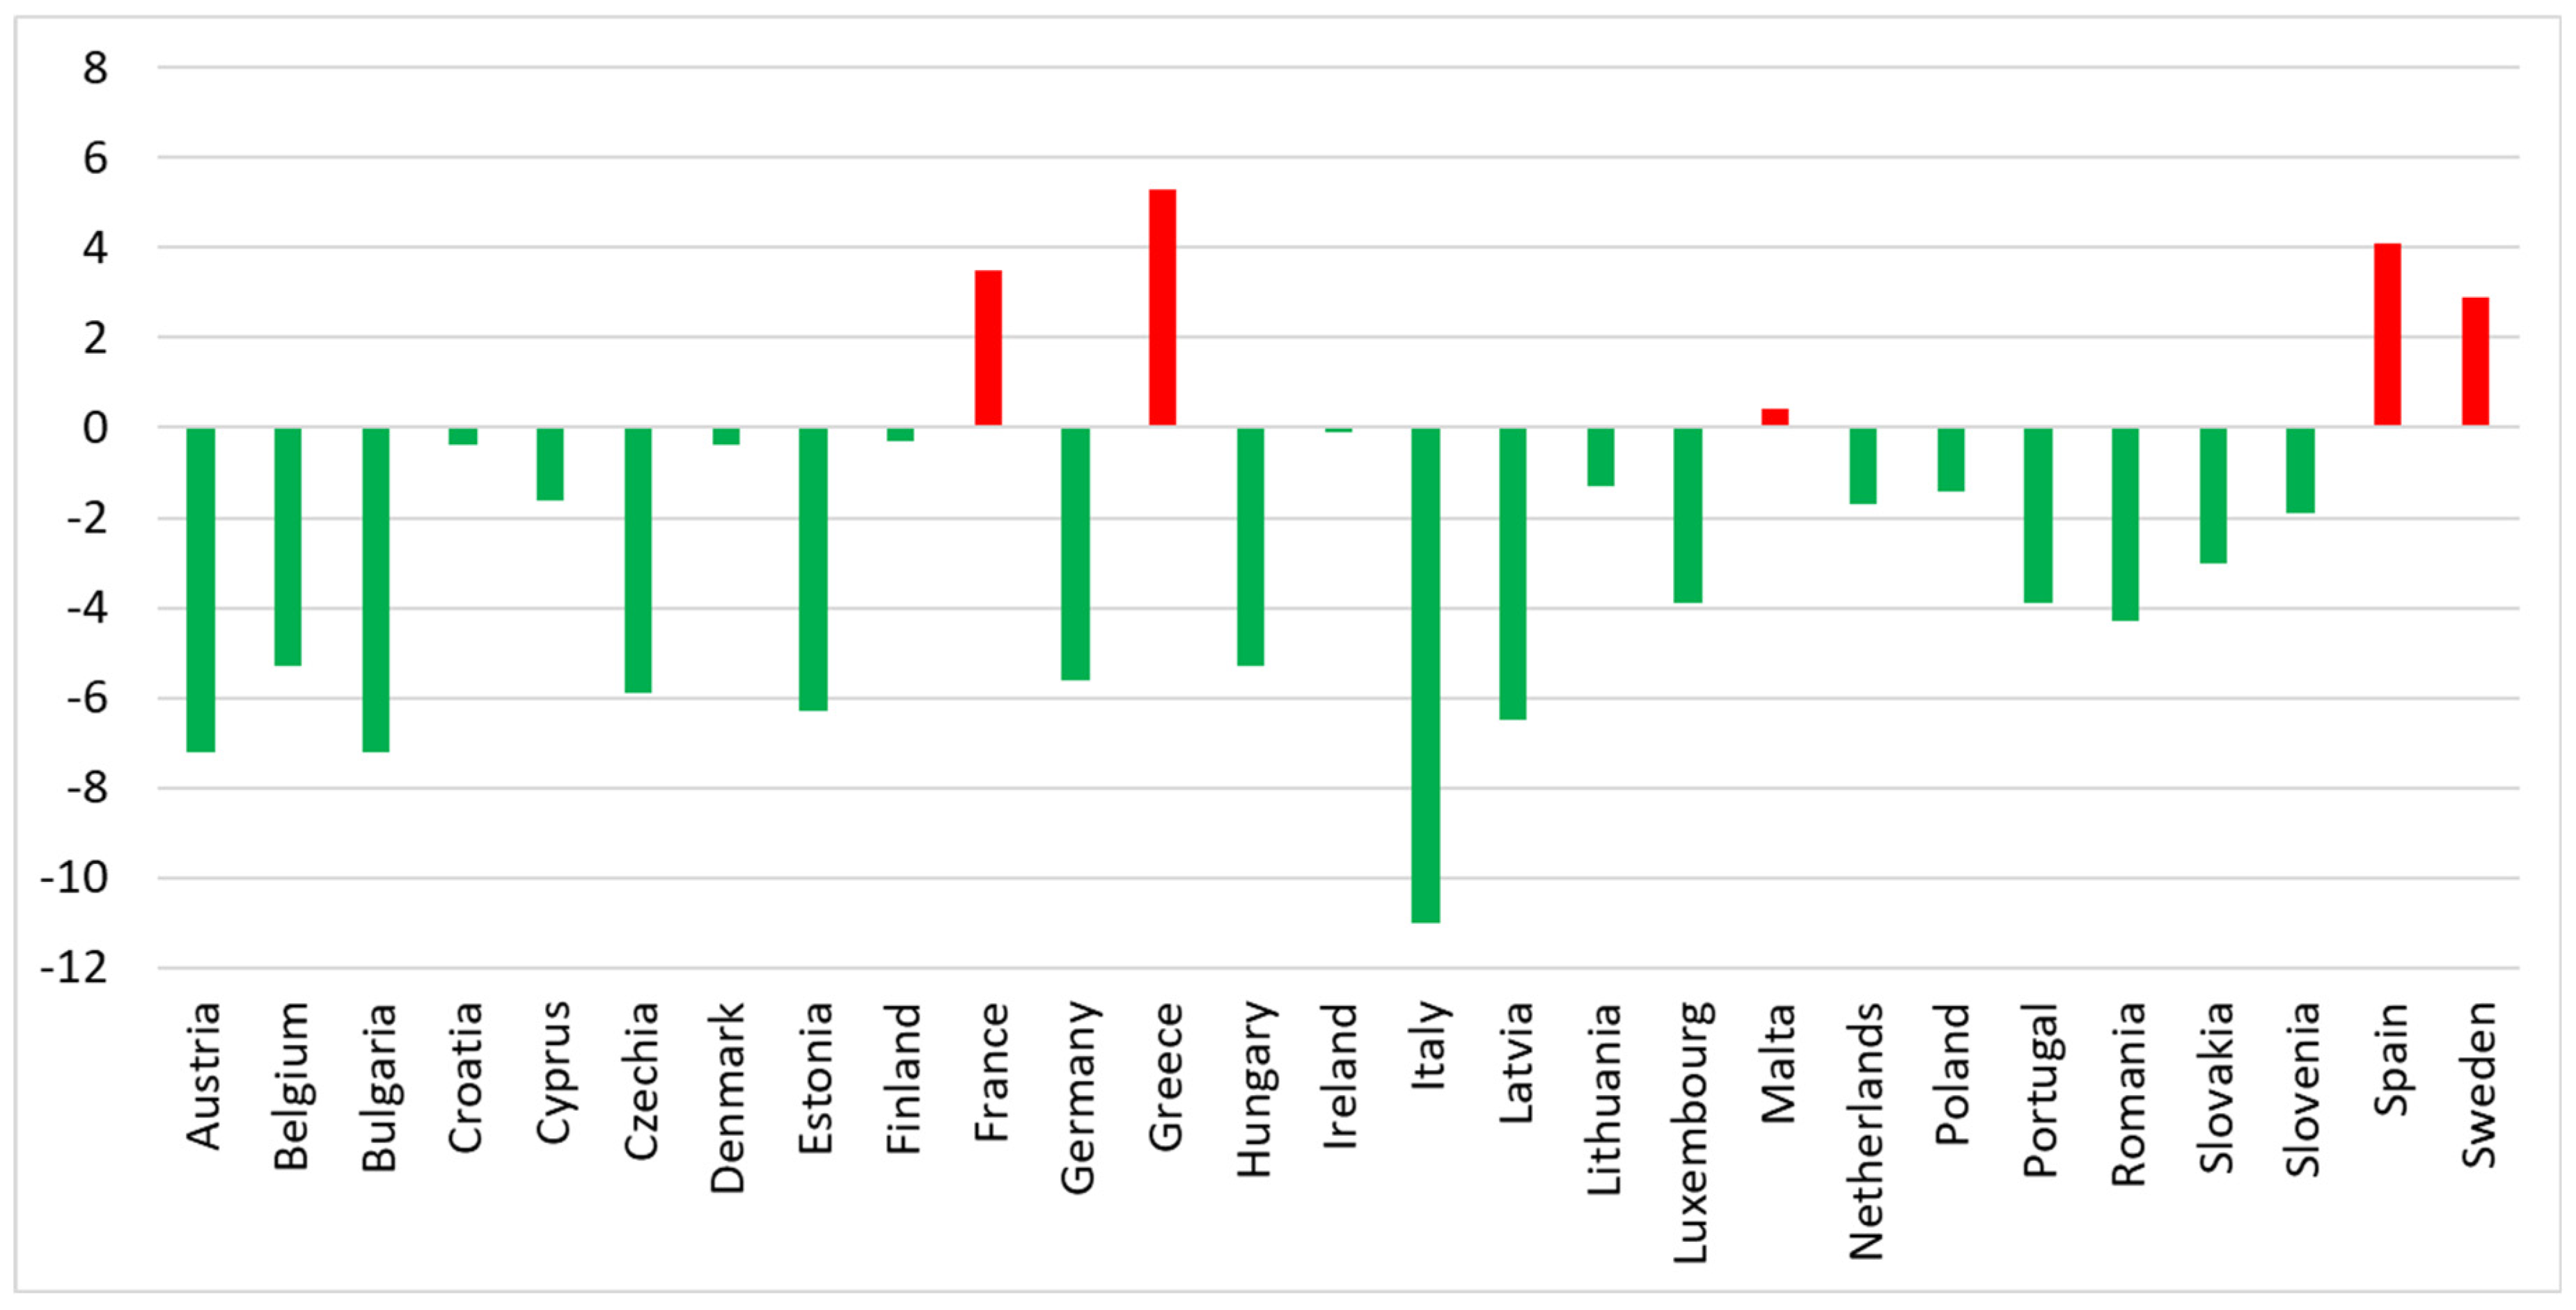
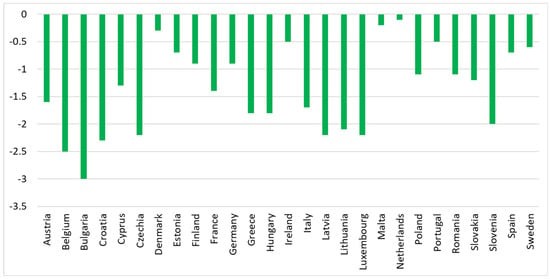
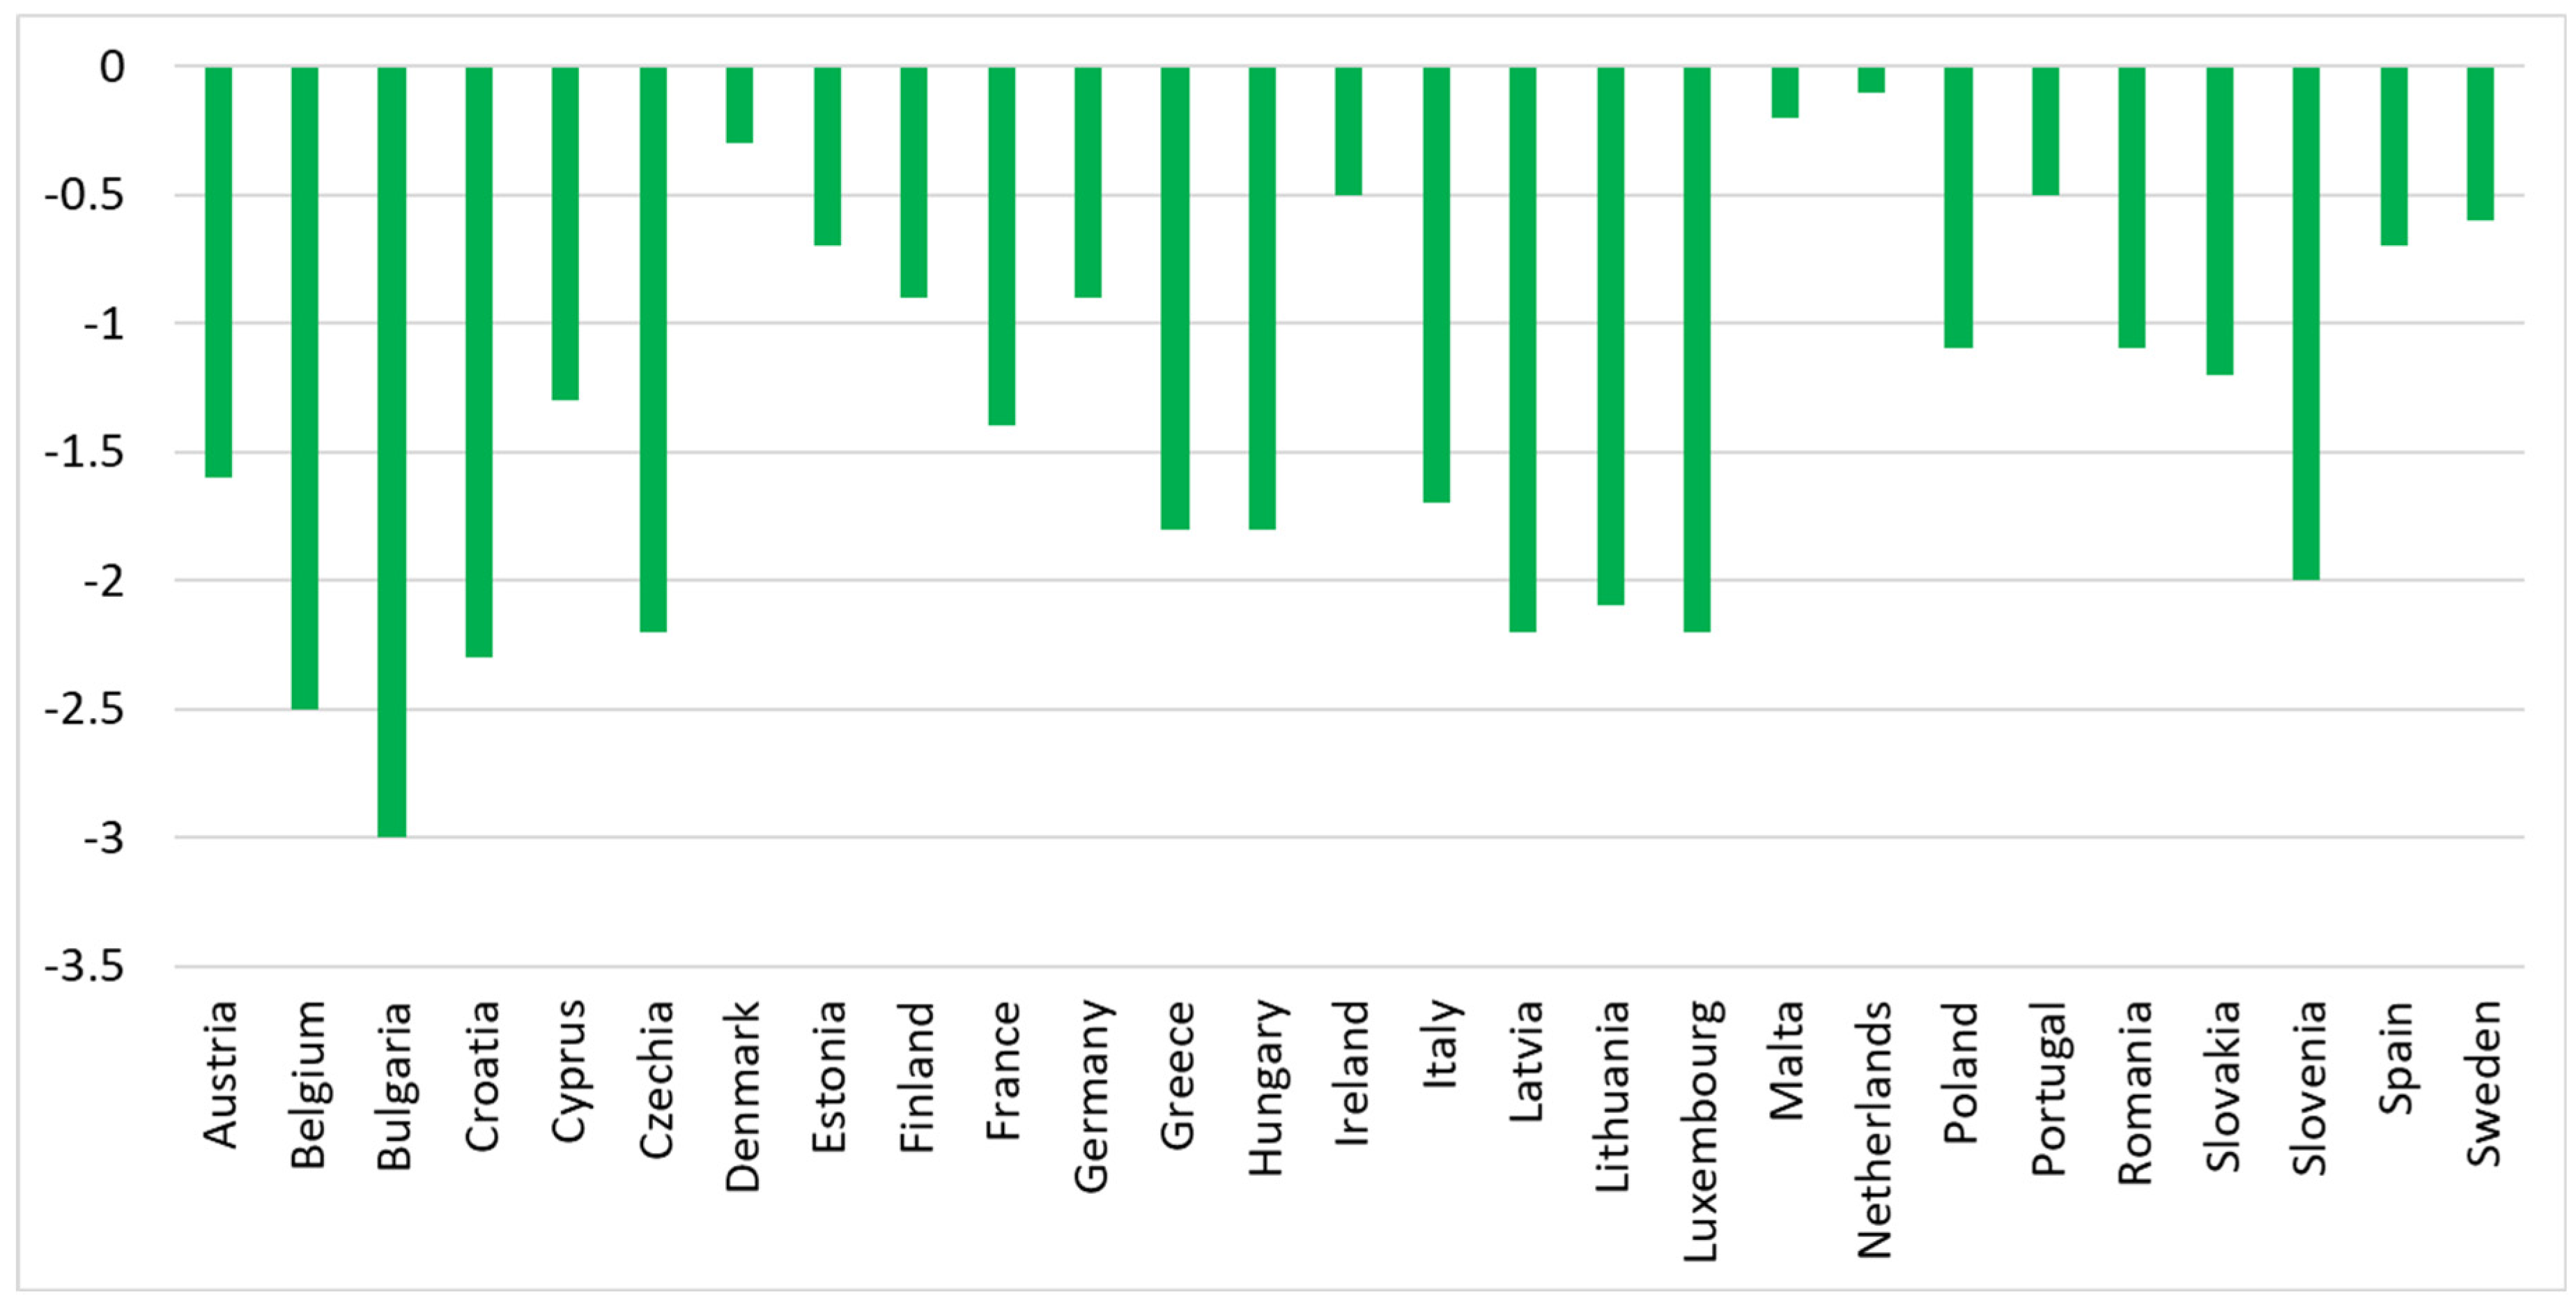
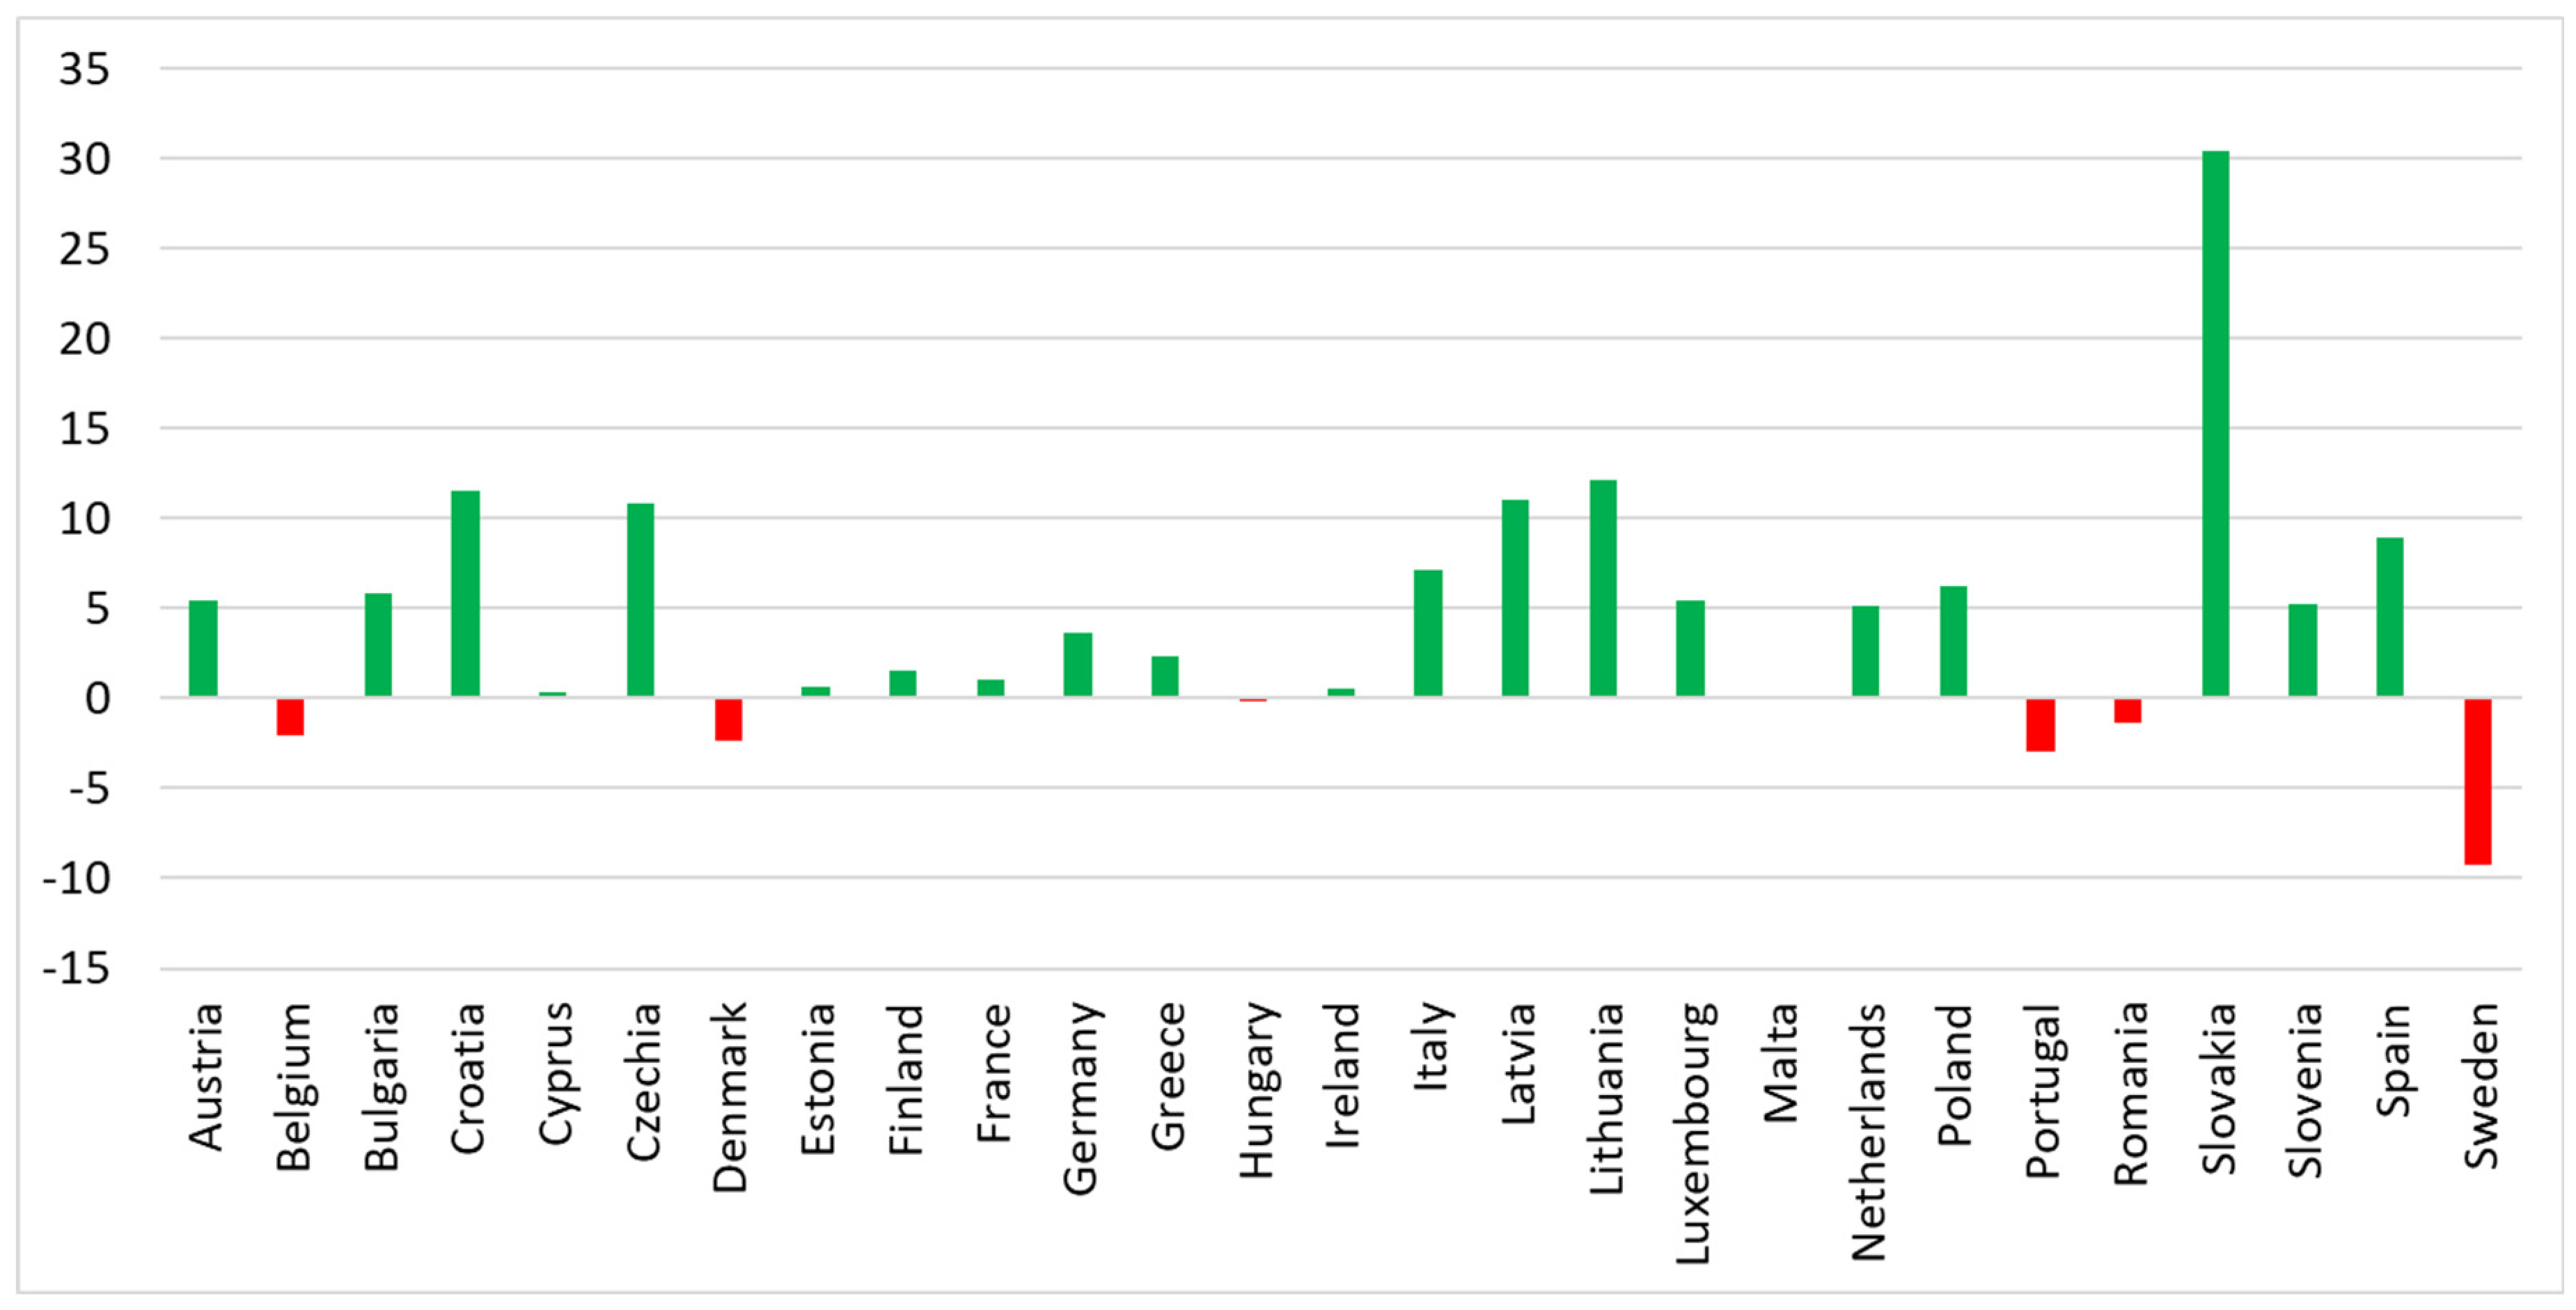
The implementation of SDG 11 in the domain of Quality of life in cities and communities was monitored through four indicators (C1–C4). In 2020, compared to 2015, some countries made progress within each indicator, while others experienced a decline. The changes varied in magnitude and direction, reflecting different levels of achievement and value (Figure 4, Figure 5, Figure 6 and Figure 7).
Figure 4.
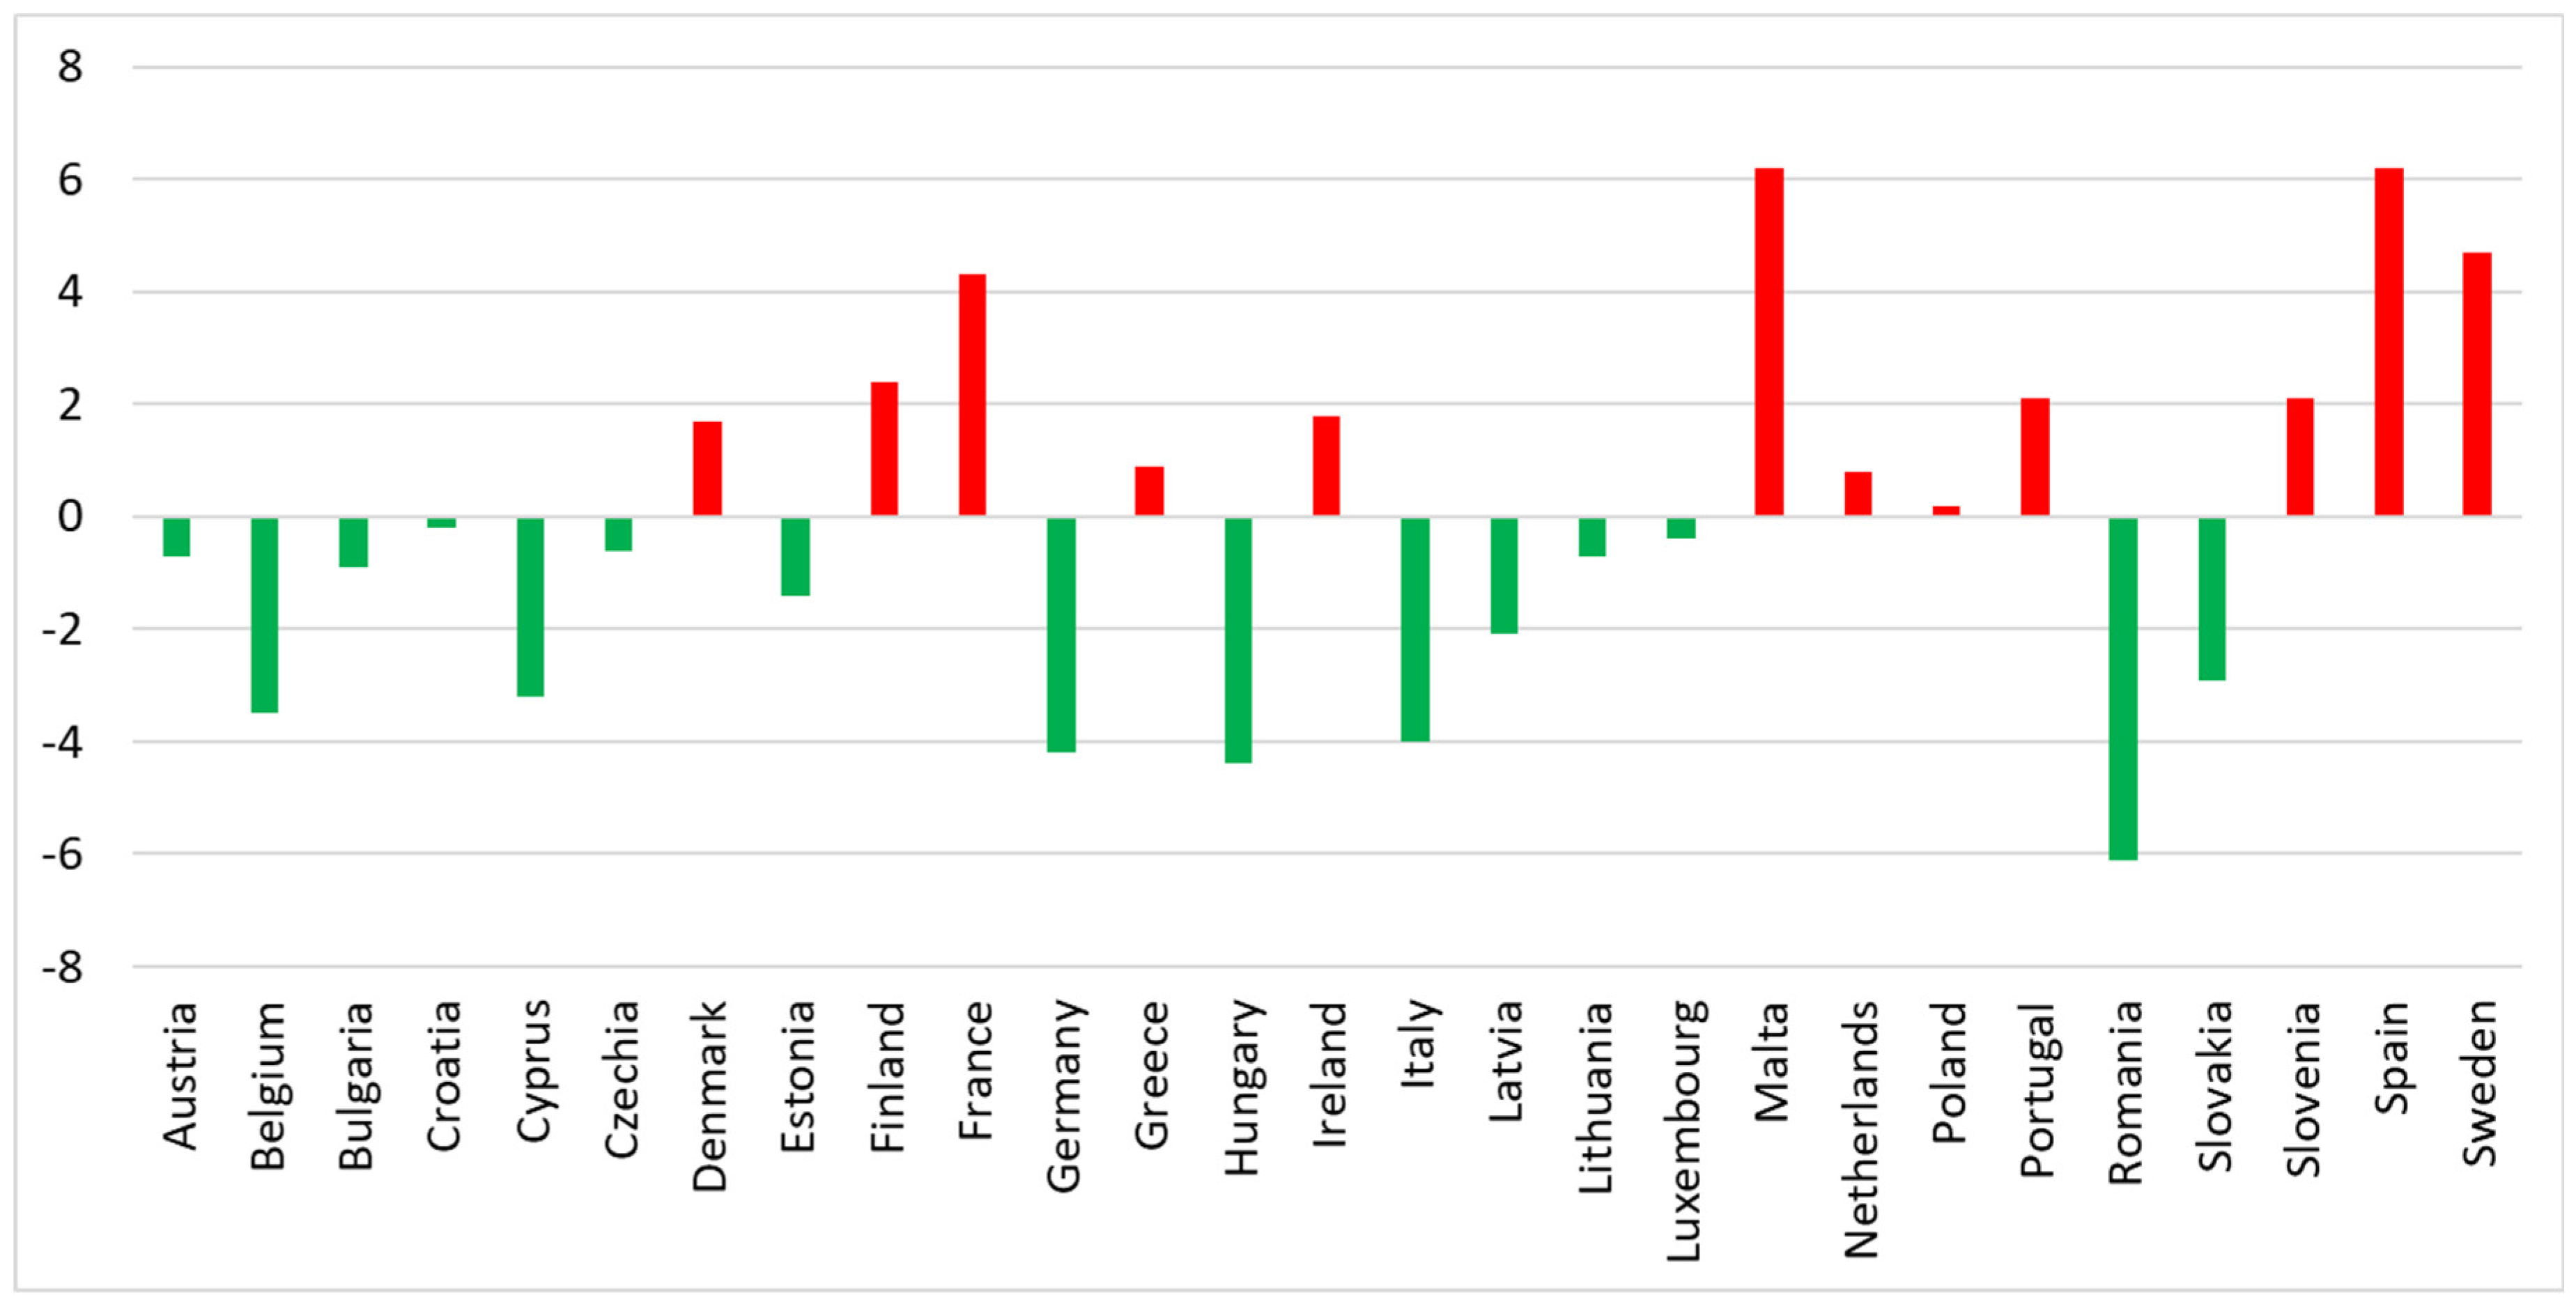
Changes in the value of indicator C1 (destimulant) in 2020 compared to 2015. Green: progress; red: regress.
Figure 5.
Changes in the value of indicator C2 (destimulant) in 2020 compared to 2015. Green: progress; red: regress.
Figure 6.
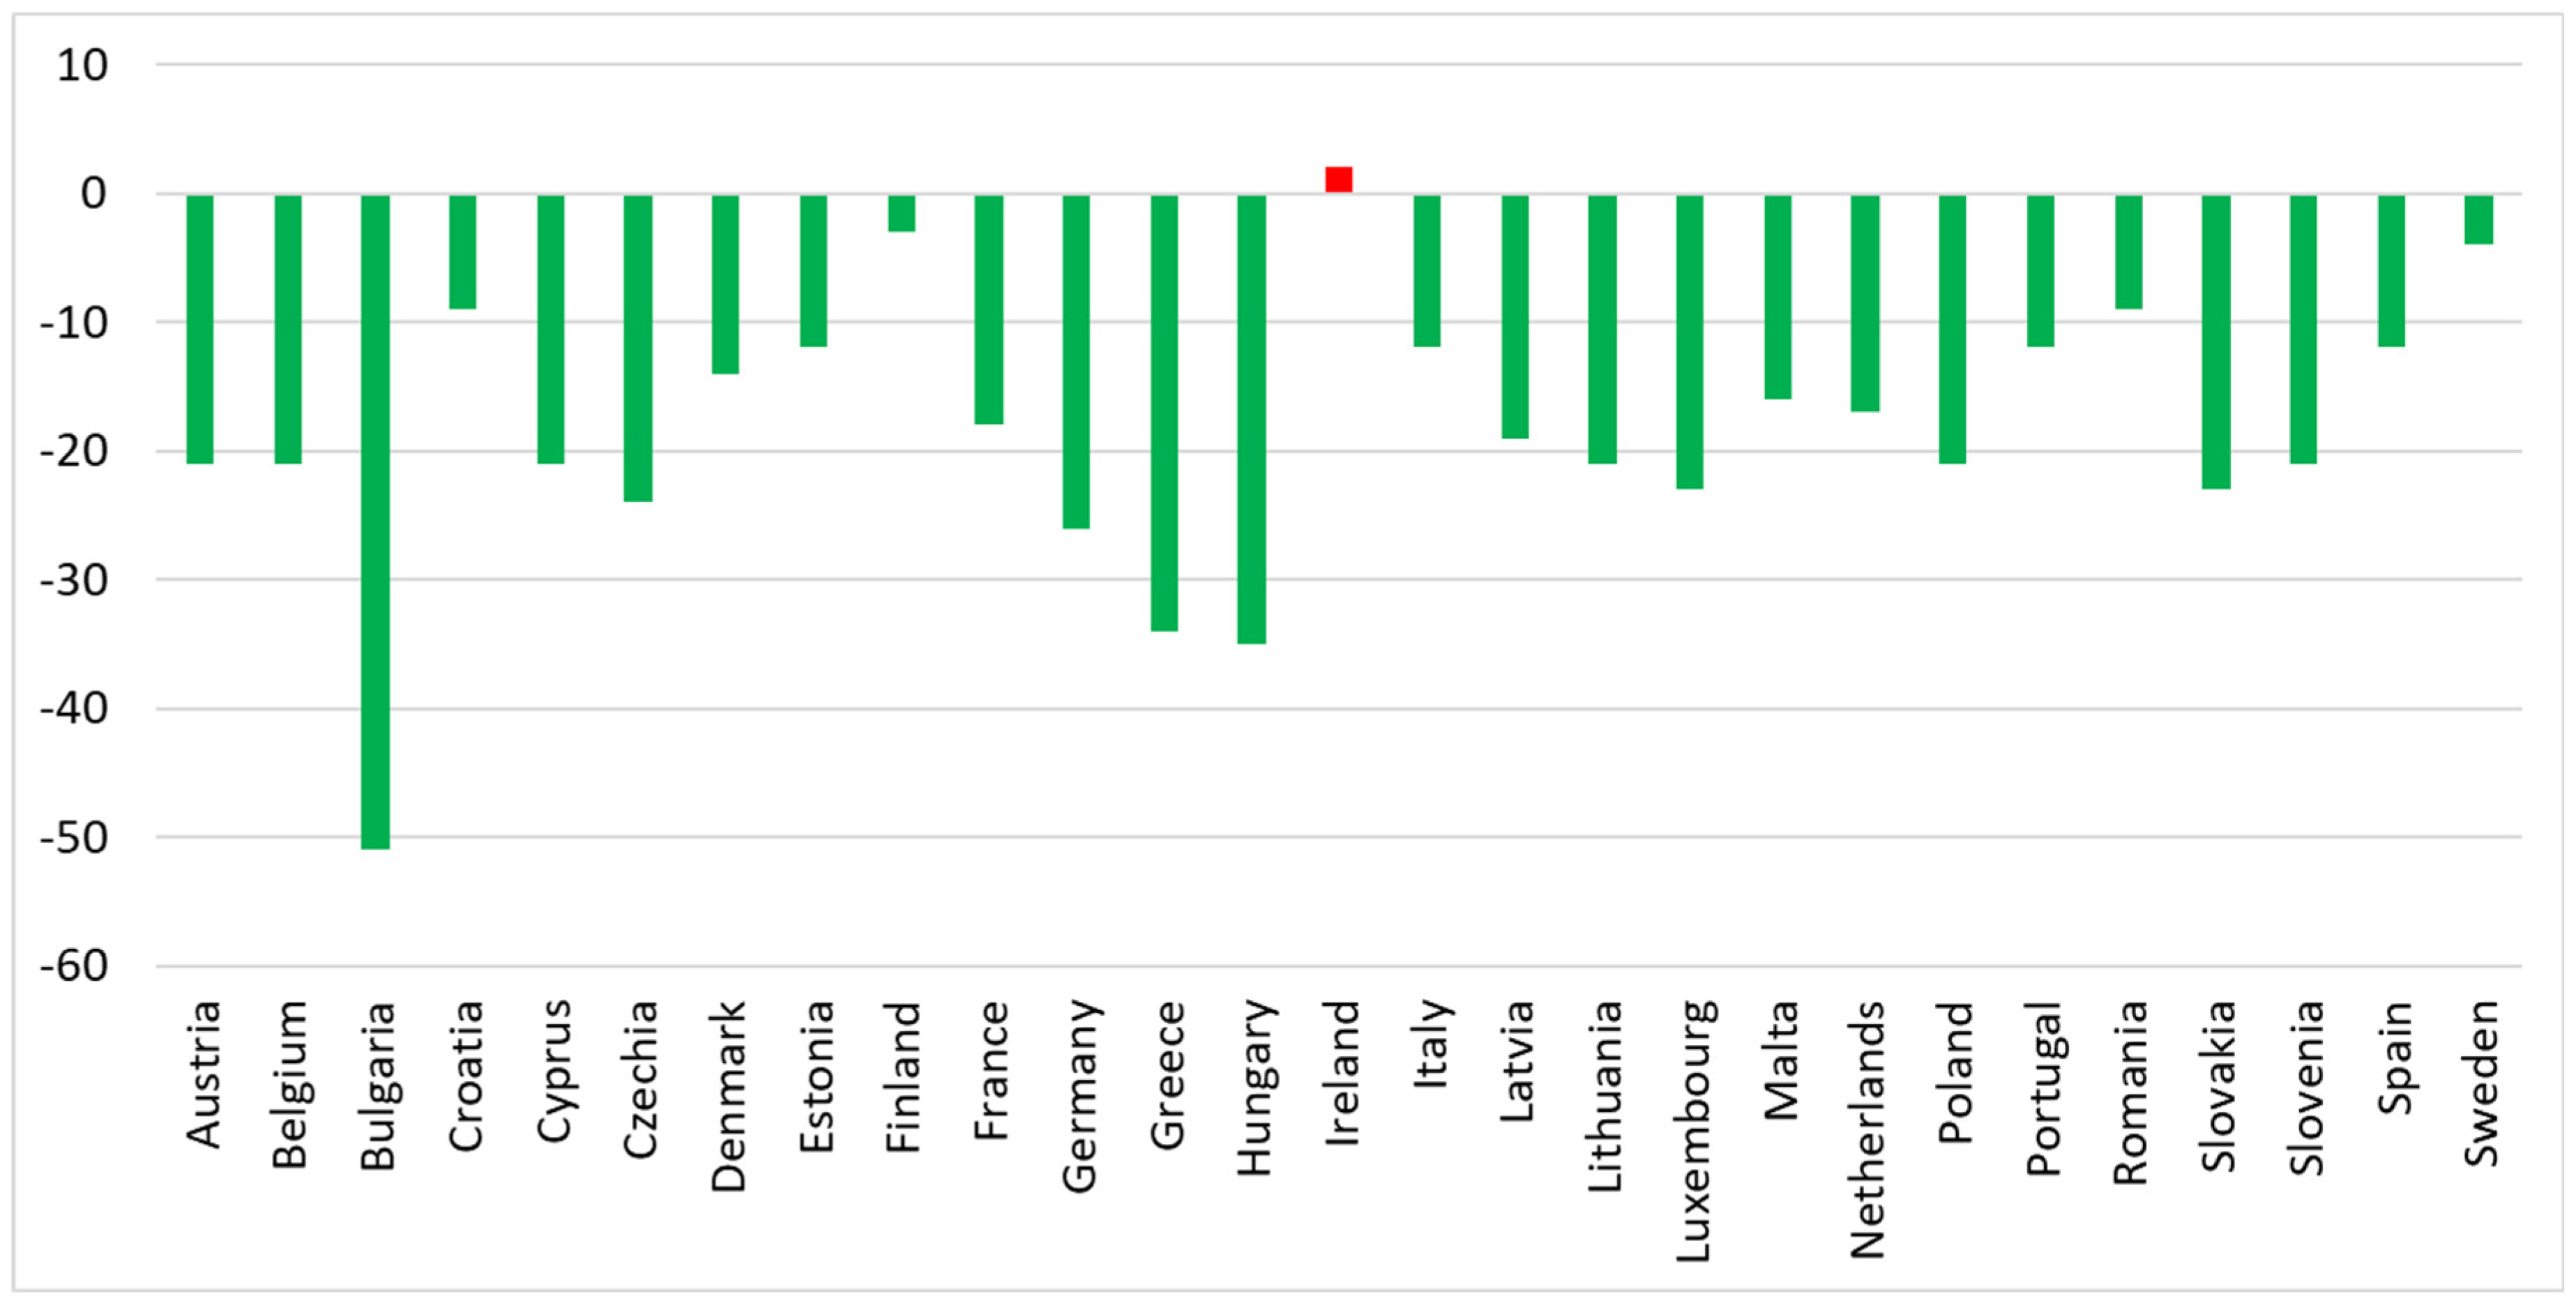
Changes in the value of indicator C3 (destimulant) in 2020 compared to 2015. Green: progress; red: regress.
Figure 7.
Changes in the value of indicator C4 (destimulant) in 2020 compared to 2015. Green: progress; red: regress.
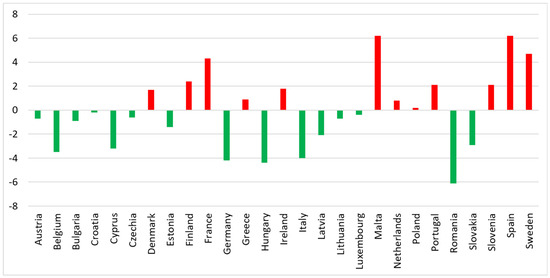
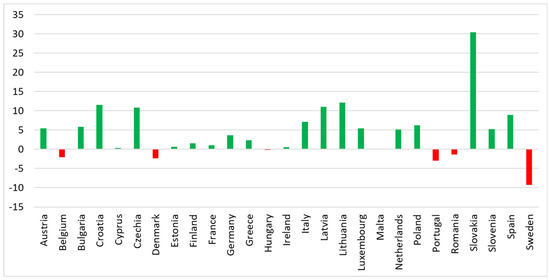
Regarding the Severe housing deprivation rate by poverty status (C1), progress was observed in 19 countries in 2020 compared to 2015, with the greatest improvements in Hungary, Romania, and Latvia and the smallest in Luxembourg and Sweden. The remaining countries experienced a decline (except for Denmark, where the value did not change), with the most significant regress seen in Spain, Belgium, and France.
Regarding the Population living in households considering that they suffer from noise, by poverty status (C2), progress was observed in 15 countries in 2020 compared to 2015, while the remaining countries experienced a decline. The greatest improvements were noted in Romania, Hungary, Germany, and Italy, and the smallest in Croatia and Luxembourg. Conversely, the most significant regress was recorded in Malta, Spain, Sweden, and France, with the smallest declines seen in Poland, the Netherlands, and Greece.
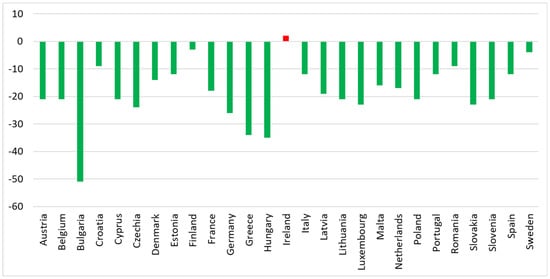
In terms of Premature deaths due to exposure to fine particulate matter (PM2.5) (C3), an improvement was observed in all countries except for a slight regress in Ireland. The greatest progress in 2020 compared to 2015 was noted in Bulgaria, Hungary, and Greece, while the smallest improvements were seen in Finland and Sweden, where the situation for this indicator was already very good in 2015.
In 2020, compared to 2015, 22 countries reported improvements in the Population reporting the occurrence of crime, violence, or vandalism in their area by poverty status (C4), while 5 countries experienced a decline. The most notable progress was seen in Italy, Austria, Bulgaria, and Latvia, whereas the smallest and least significant gains were found in Ireland, Finland, Denmark, and Croatia. Conversely, Greece and Spain faced the most significant deterioration, with Malta experiencing only a slight decline.
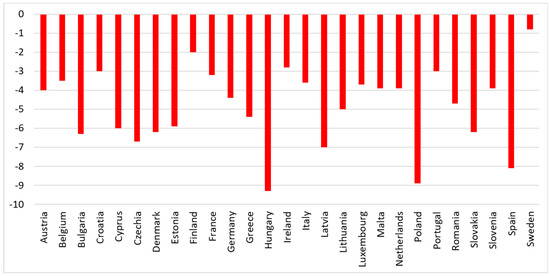
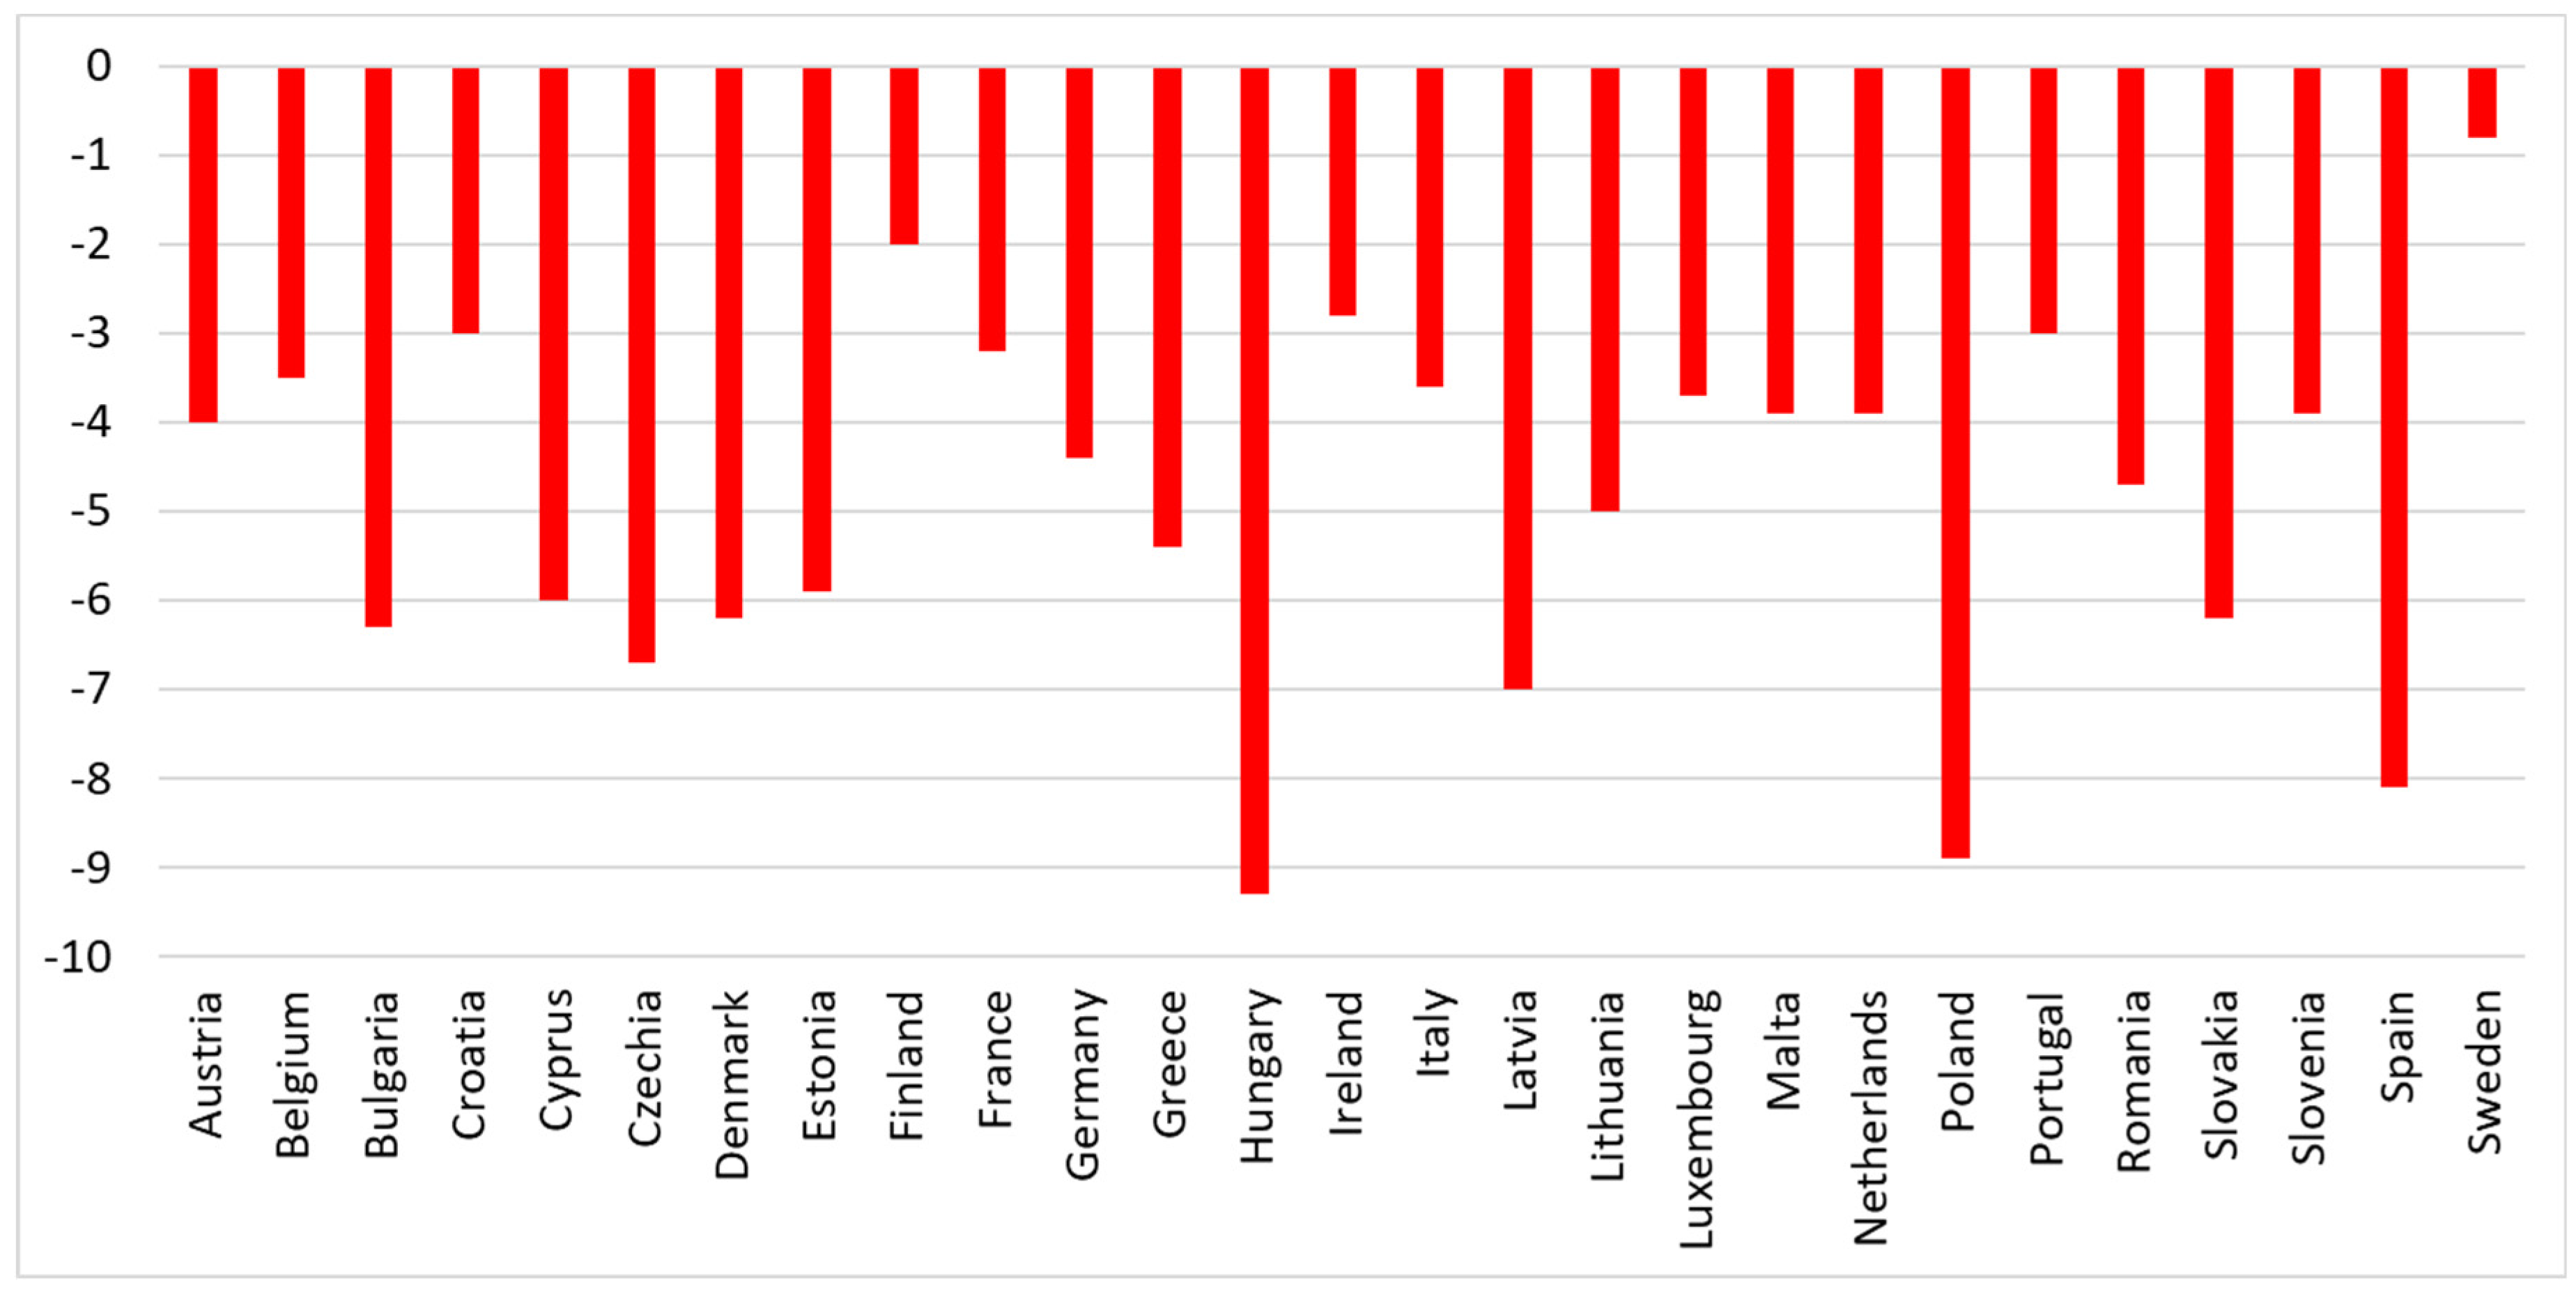
The implementation of SDG 11 in the area of Sustainable mobility was monitored through two indicators (C5-C6). An interesting trend emerges when comparing 2020 to 2015: while all countries showed improvements in their standing concerning C5, they experienced a decline in C6 during the same period. Additionally, the fluctuations in the values of these indicators revealed varying degrees of intensity for both of them (Figure 8 and Figure 9).
Figure 8.
Changes in the value of indicator C5 (destimulant) in 2020 compared to 2015. Green: progress.
Figure 9.
Changes in the value of indicator C6 (stimulant) in 2020 compared to 2015. Red: regress.
During the studied period, all countries reported progress regarding Road traffic deaths, by type of roads, with the most significant improvements observed in Bulgaria and Belgium, while the smallest improvements were noted in the Netherlands and Malta. In turn, in the case of the Share of buses and trains in inland passenger transport, all countries reported regress during the studied period. The most significant decline was observed in Hungary, Poland, and Spain, while the smallest decrease was noted in Sweden.
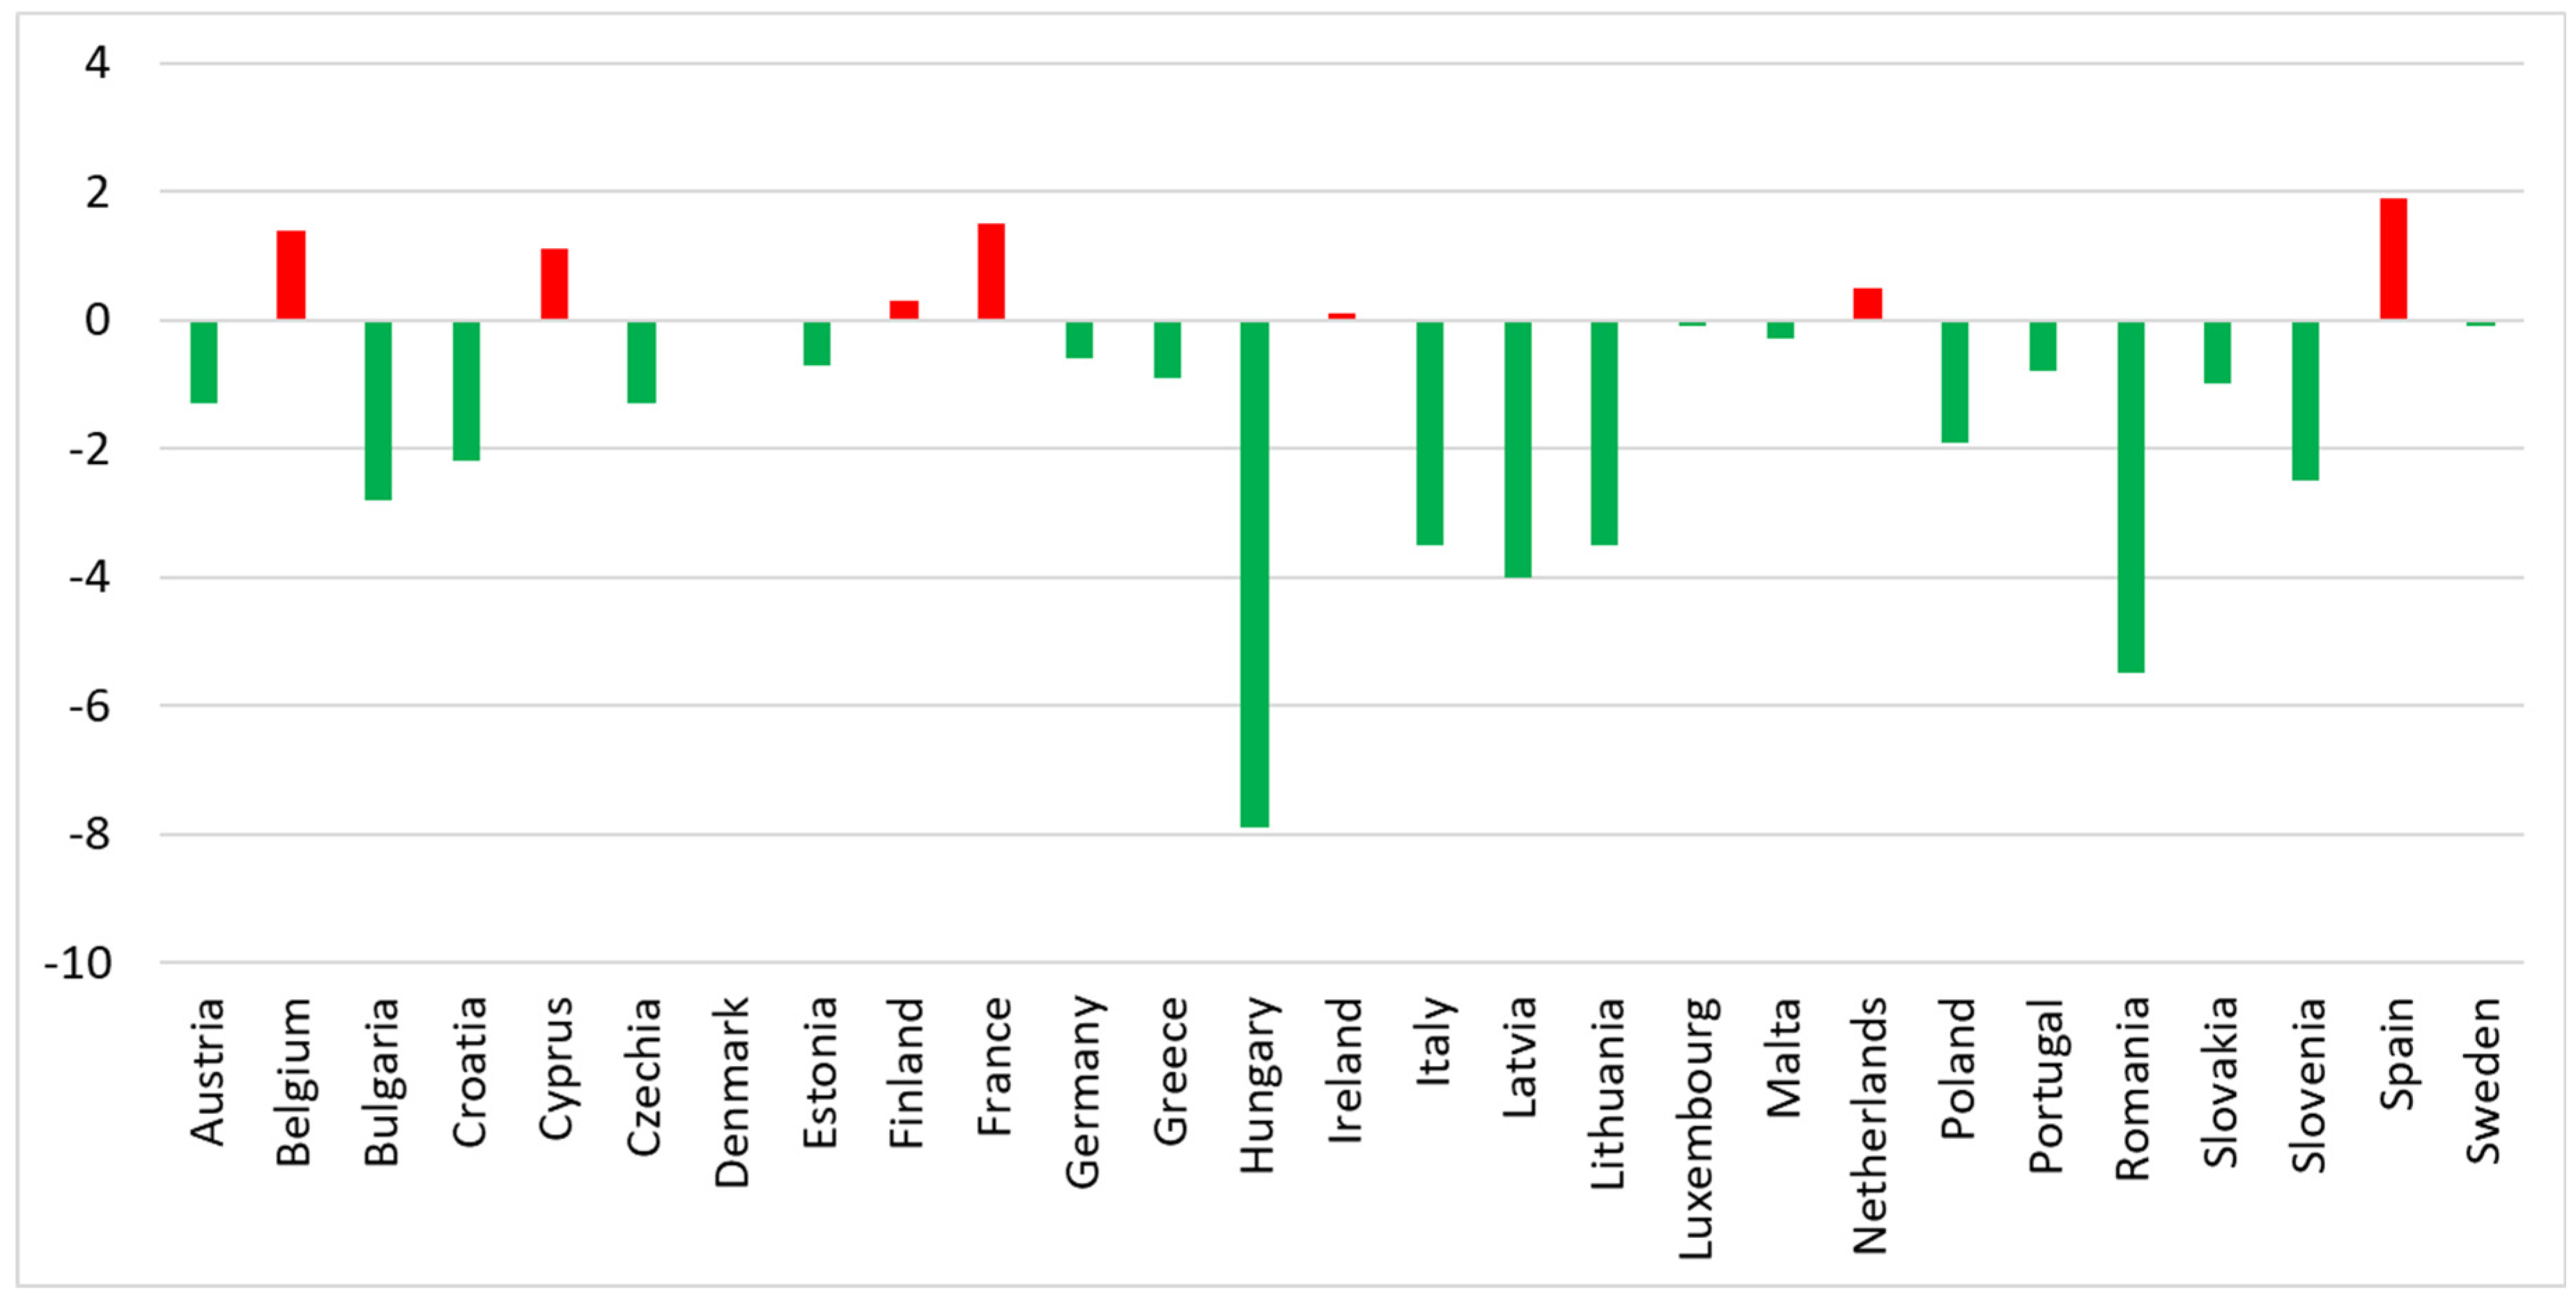
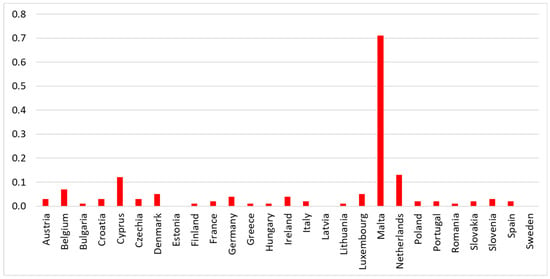
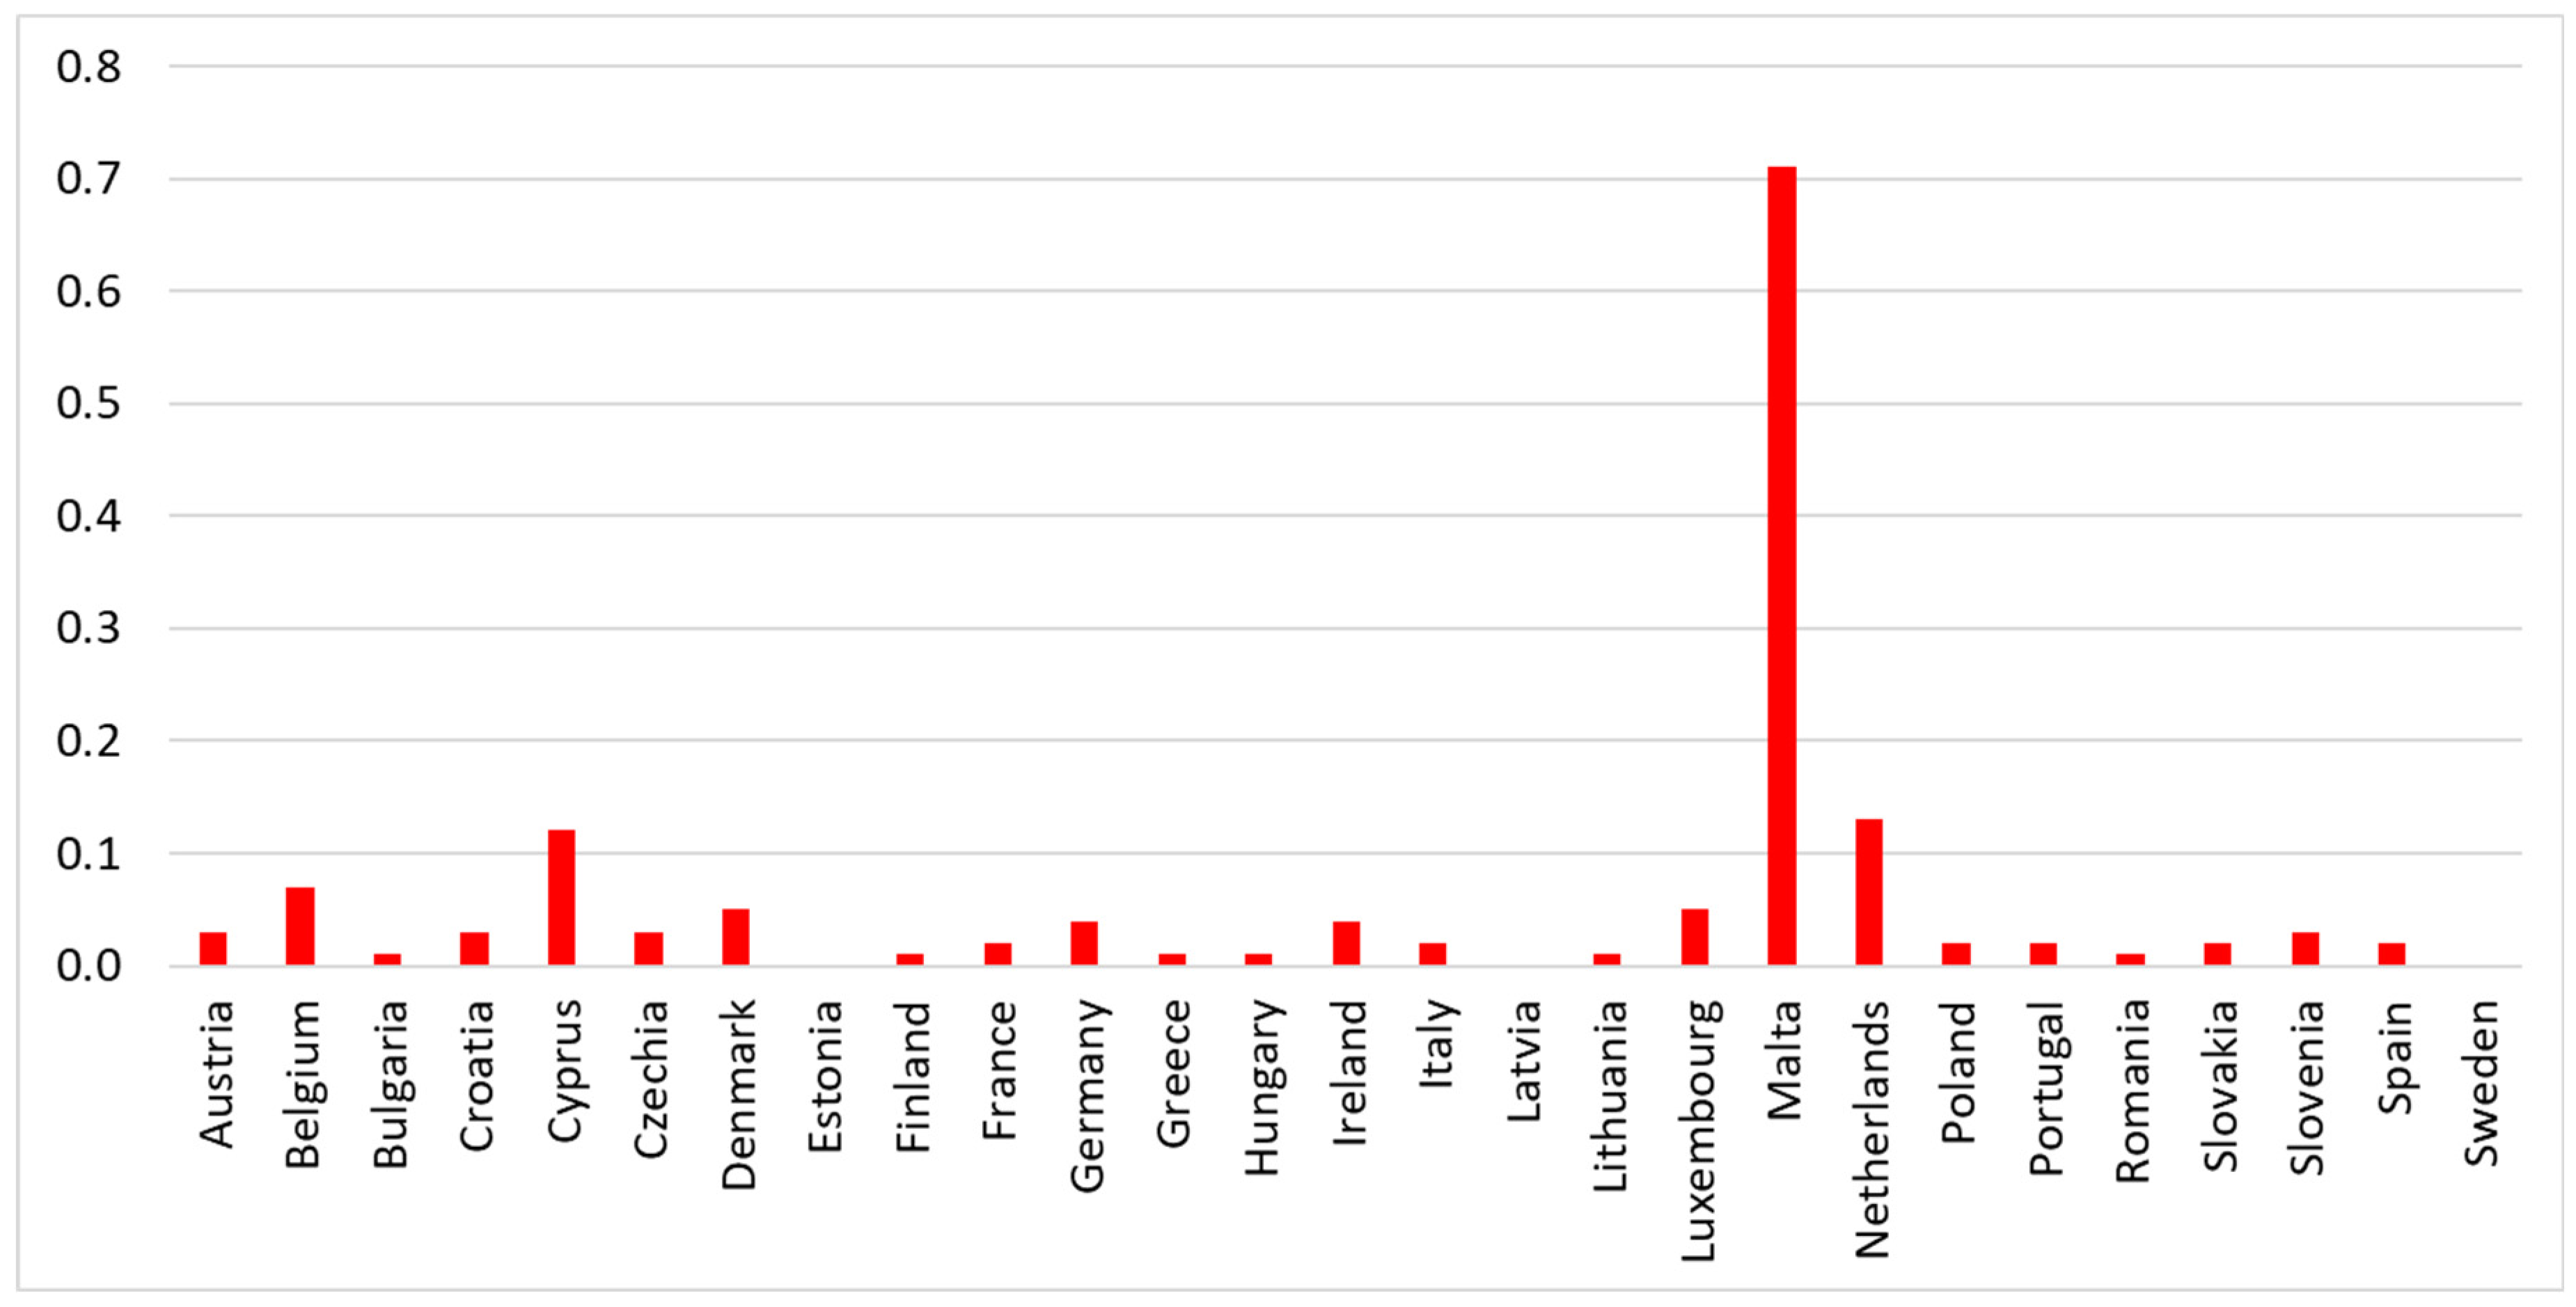
Finally, implementing SDG 11 in the area of Environmental impacts was monitored through two indicators (C7-C8). In 2020, compared to 2015, no country experienced progress in C7, while most countries demonstrated progress in C8 (Figure 10 and Figure 11).
Figure 10.
Changes in the value of indicator C7 (destimulant) in 2020 compared to 2015. Red: regress.
Figure 11.
Changes in the value of indicator C8 (stimulant) in 2020 compared to 2015 Green: progress; red: regress.
When comparing 2020 to 2015, almost all countries reported regress regarding the Soil sealing index (Figure 10). Malta experienced an extremely high level of regress, while Cyprus, the Netherlands, and Belgium noted moderate declines. In contrast, the remaining countries exhibited only a slight decrease, while the values for Estonia, Latvia, and Sweden remained unchanged.
In 2020, in comparison to 2015, 20 countries demonstrated an improvement in the Recycling rate of municipal waste, whereas six countries exhibited a decline. The most notable progress was observed in Slovakia, with moderate improvements in Croatia, Czechia, Latvia, and Lithuania. Conversely, the most minor gains were found in Cyprus, Estonia, Ireland, and France. Sweden, in turn, experienced the most significant deterioration. The value of the Recycling rate of municipal waste in Malta remained unchanged.
2.2. Methods
The assessment of Goal 11: Sustainable Cities and Communities requires a multidimensional analysis that utilizes multiple indicators to capture the complexity of this issue. In this study, we will apply a Multi-Criteria Method Integrating Distances to Ideal and Anti-Ideal Points (MIDIA) method [37] to develop a Sustainable Cities and Communities Index (SCCI).
The MIDIA method was selected due to its capability to comprehensively evaluate the implementation of SDG 11 across EU countries, leveraging distances to ideal and anti-ideal reference points. By considering coefficients of distance importance from the ideal solution, the method enables a balanced assessment of proximity to both best-case and worst-case scenarios, ensuring a nuanced and flexible comparison of sustainability progress across multiple dimensions.
Let be a set of objects (countries), a set of n indicators (criteria), and represent the sets of stimulants and destimulants , respectively, and denotes the value of indicator for country (where The construction of the Sustainable Cities and Communities Index (SCCI), based on the MIDIA approach, involves several steps [37]:
First, construct the decision matrix:
where each entry represents the value of the j-th criterion for the i-th object.
Next, determine the vector of weights
with for , and the sum of weights .
There are three main types of methods for determining weights: subjective, objective, and integrated [42,43,44,45]. Subjective weights rely on expert judgment, objective weights are based on the statistical properties of the data, and integrated methods combine both approaches. In socio-economic multi-criteria analysis, weight assignment often involves subjective decisions, as no universally accepted method exists. Weights are typically determined based on factors such as economic relevance, data reliability, and availability and can greatly affect the results [46,47,48]. Among these approaches, studies [47,48] show that equal weighting is the most commonly used in practice. This method is often chosen because of its simplicity, the assumption that all criteria hold equal importance, or when there is insufficient data to justify different weights.
In the next step, build the ideal point:
where is defined as the maximum value for stimulant criteria and the minimum value for destimulant criteria across all objects.
Conversely, build the anti-ideal point
where is the minimum value for stimulant criteria and the maximum value for destimulant criteria.
The next step is to normalize the decision matrix to create
using the standardization formula:
where is the standard deviation for the j-th criterion.
This normalization process standardizes the range of different criteria to a uniform scale, facilitating comparison and integration in the overall evaluation (, .
Build the weighted normalized matrix:
where each entry (, .
Then, calculate the distances of each object from the ideal point using the Euclidean distance measure:
where are weighted normalized values and , respectively.
Similarly, calculate the distances from the anti-ideal point
where are weighted normalized values and , respectively.
Next, determine the closeness measure of each object to the ideal point:
and the closeness measure to the anti-ideal point:
where is the distance between ideal and anti-ideal solutions.
Finally, calculate the overall measure for each object:
Here, represents the weight assigned to the distance from the ideal solution, while is the weight assigned to the distance from the anti-ideal solution. These values of and determine the balance between the importance of proximity to both the ideal and anti-ideal solutions.
Setting means that only the distance to the ideal solution is considered when evaluating alternatives, which corresponds to Hellwig’s method [37,38]. On the other hand, setting means that only the distance to the anti-ideal solution is considered. Values of between 0 and 1 represent a balance between the importance of both distances. If both are equally important, is set to 0.5.
The objects are ranked in descending order based on the values of A higher value corresponds to a higher-ranking position for the respective alternative.
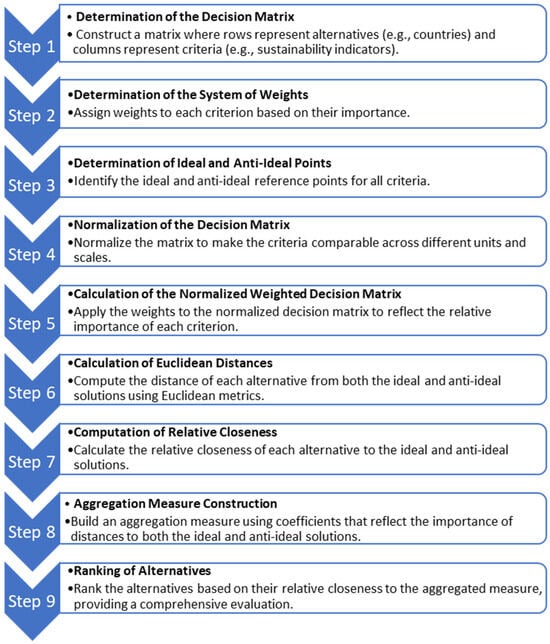
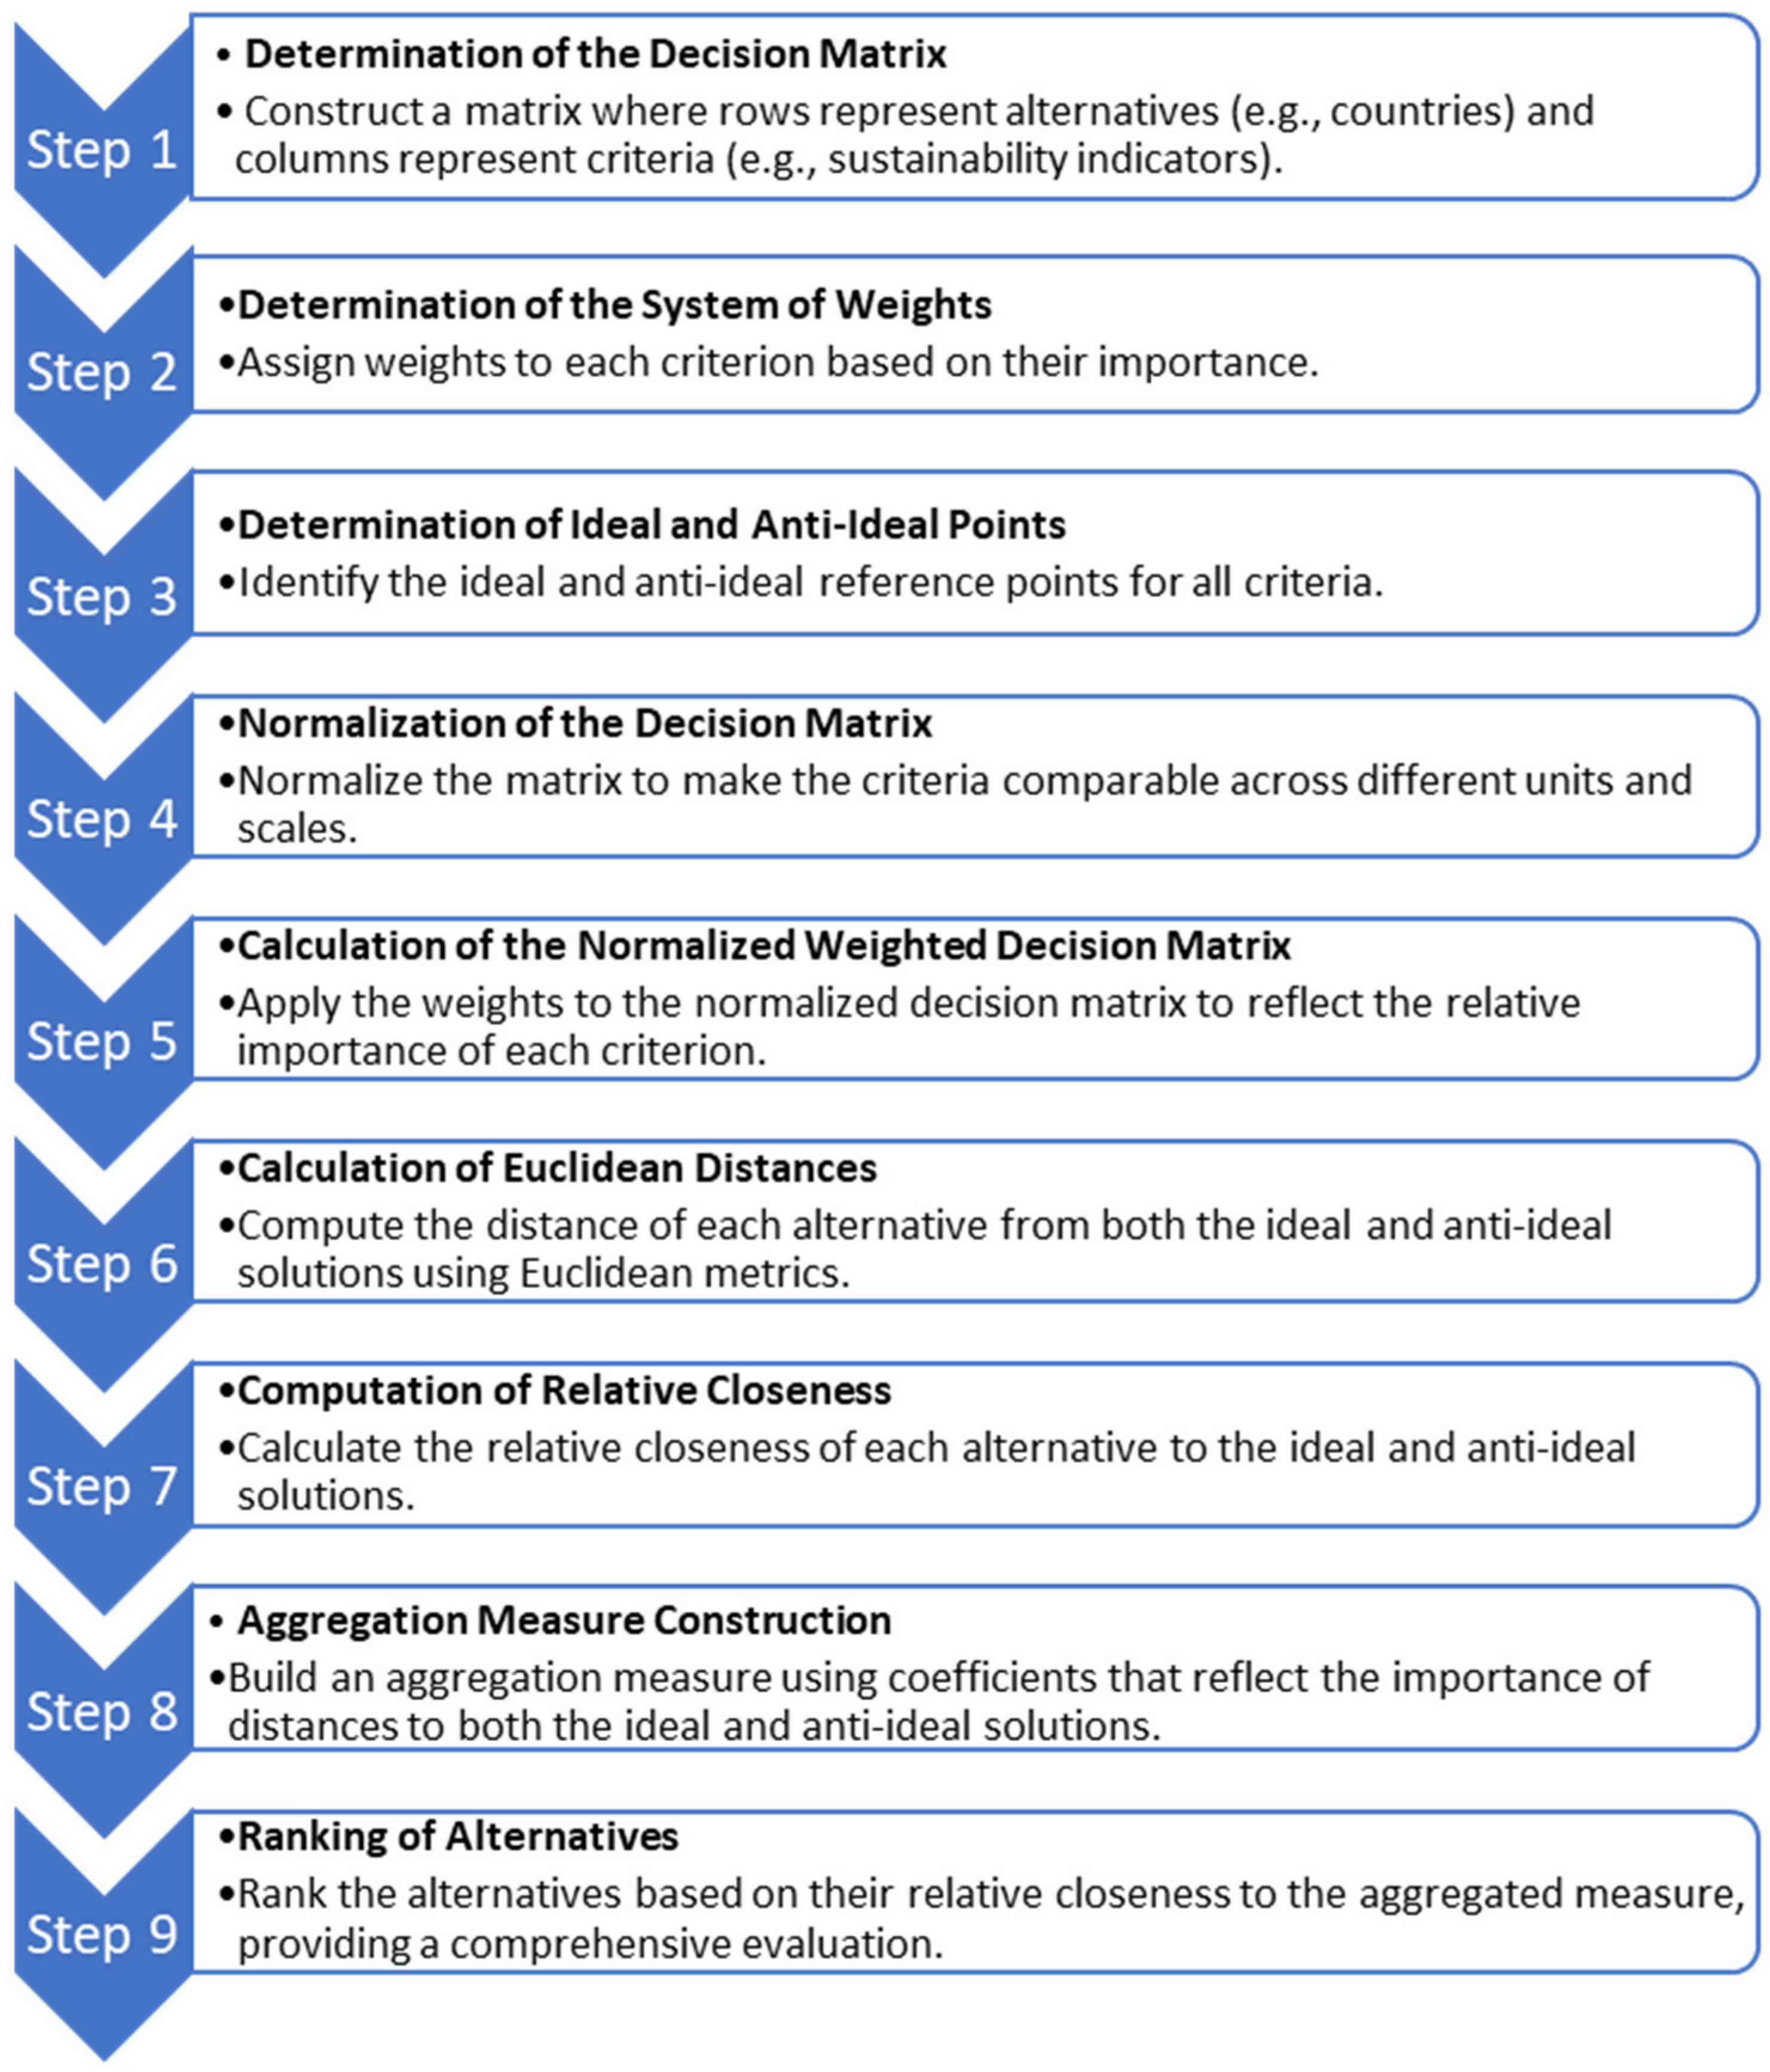
The MIDIA method can be summarized in nine sequential steps (see Figure 12):
Figure 12.
Steps of MIDIA method.
This study applied a modified dynamic version of the MIDIA method by determining the “global” or common ideal and anti-ideal points for each feature, using the maximum and minimum values over the entire study period. Instead of yearly values, the distance was calculated using the feature’s minimum and maximum across the whole period, i.e., common ideal or anti-ideal. This dynamic approach enabled the creation of a country ranking and a comparative assessment of the scale and direction of changes in SDG 11 over both individual years and the entire period.
3. Results and Discussion
In the assessment of SDG 11, we constructed the SCCI for 2015 and 2020, with ten variants and equal weights. Studies [46,49] indicate that equal weighting is the most commonly used approach. This is often due to the belief that all criteria are equally important, its simplicity, or a lack of understanding of causal relationships between indicators. It is also applied when there is no consensus on alternative methods, when decision-makers have differing views, or when data are insufficient to justify differentiated weights. Adopting this perspective, in our case, equal weights were used to ensure that each criterion contributes equally to the overall evaluation, treating all aspects represented by the indicators as equally important in the assessment of SDG 11.
Firstly, according to Formulas (3) and (4), the ideal and anti-ideal points based on max and min values, taking into account the data for 2015 and 2020 from the Eurostat database [41], and criterion type were determined:
Subsequently, the common ideal and anti-ideal points were established based on the maximum and minimum values, considering the data for both 2015 and 2020 as well as the criterion type.
Following the next steps of the SCCI procedure, the data for 2015 and 2020 from the Eurostat database [41] were normalized and weighted using Formulas (5)–(7). Then, the Euclidean distances between the objects and the common ideal or anti-ideal solutions were calculated using Formulas (8) and (9). After that, the values of and measures for all EU countries in 2015 and 2020 were computed by applying Formulas (10) and (11). Finally, the values of the were determined by Formula (12) for . The results for 2015 and 2020 are presented in Table 3 and Table 4.
Table 3.
The values of for EU countries in 2015 with different coefficients .
Table 4.
The values of for EU countries in 2020 with different coefficients .
Based on the results from Table 3 for 2015, the highest SCCI (ranked first—see also Table 5) was recorded for Ireland (α = 0) and Denmark (α = 0.9, 1), with Sweden achieving the highest ranking for the remaining α values. The lowest SCCI (ranked last—see also Table 5) was observed for Romania at α = 0 and α = 0.1 and for Bulgaria at the other α values. For 2020, as shown in Table 4, the highest SCCI (ranked first—see also Table 6) was achieved by Finland for α = 0 and Austria for the remaining α values. The lowest SCCI (ranked last—see also Table 6) was found for Greece at α = 0, Malta at α = 0.9 and α = 1, and Bulgaria for the other α values.
Table 5.
The rankings of EU countries obtained by in 2015 for different coefficients .
Table 6.
The rankings of EU countries obtained by in 2020 for different coefficients .
To begin with, we conducted an analysis that allowed us to answer research question Q1 regarding the differences in achieving SDG 11 between EU countries separately for each analyzed year, 2015 and 2020.
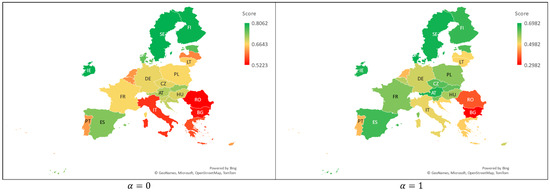
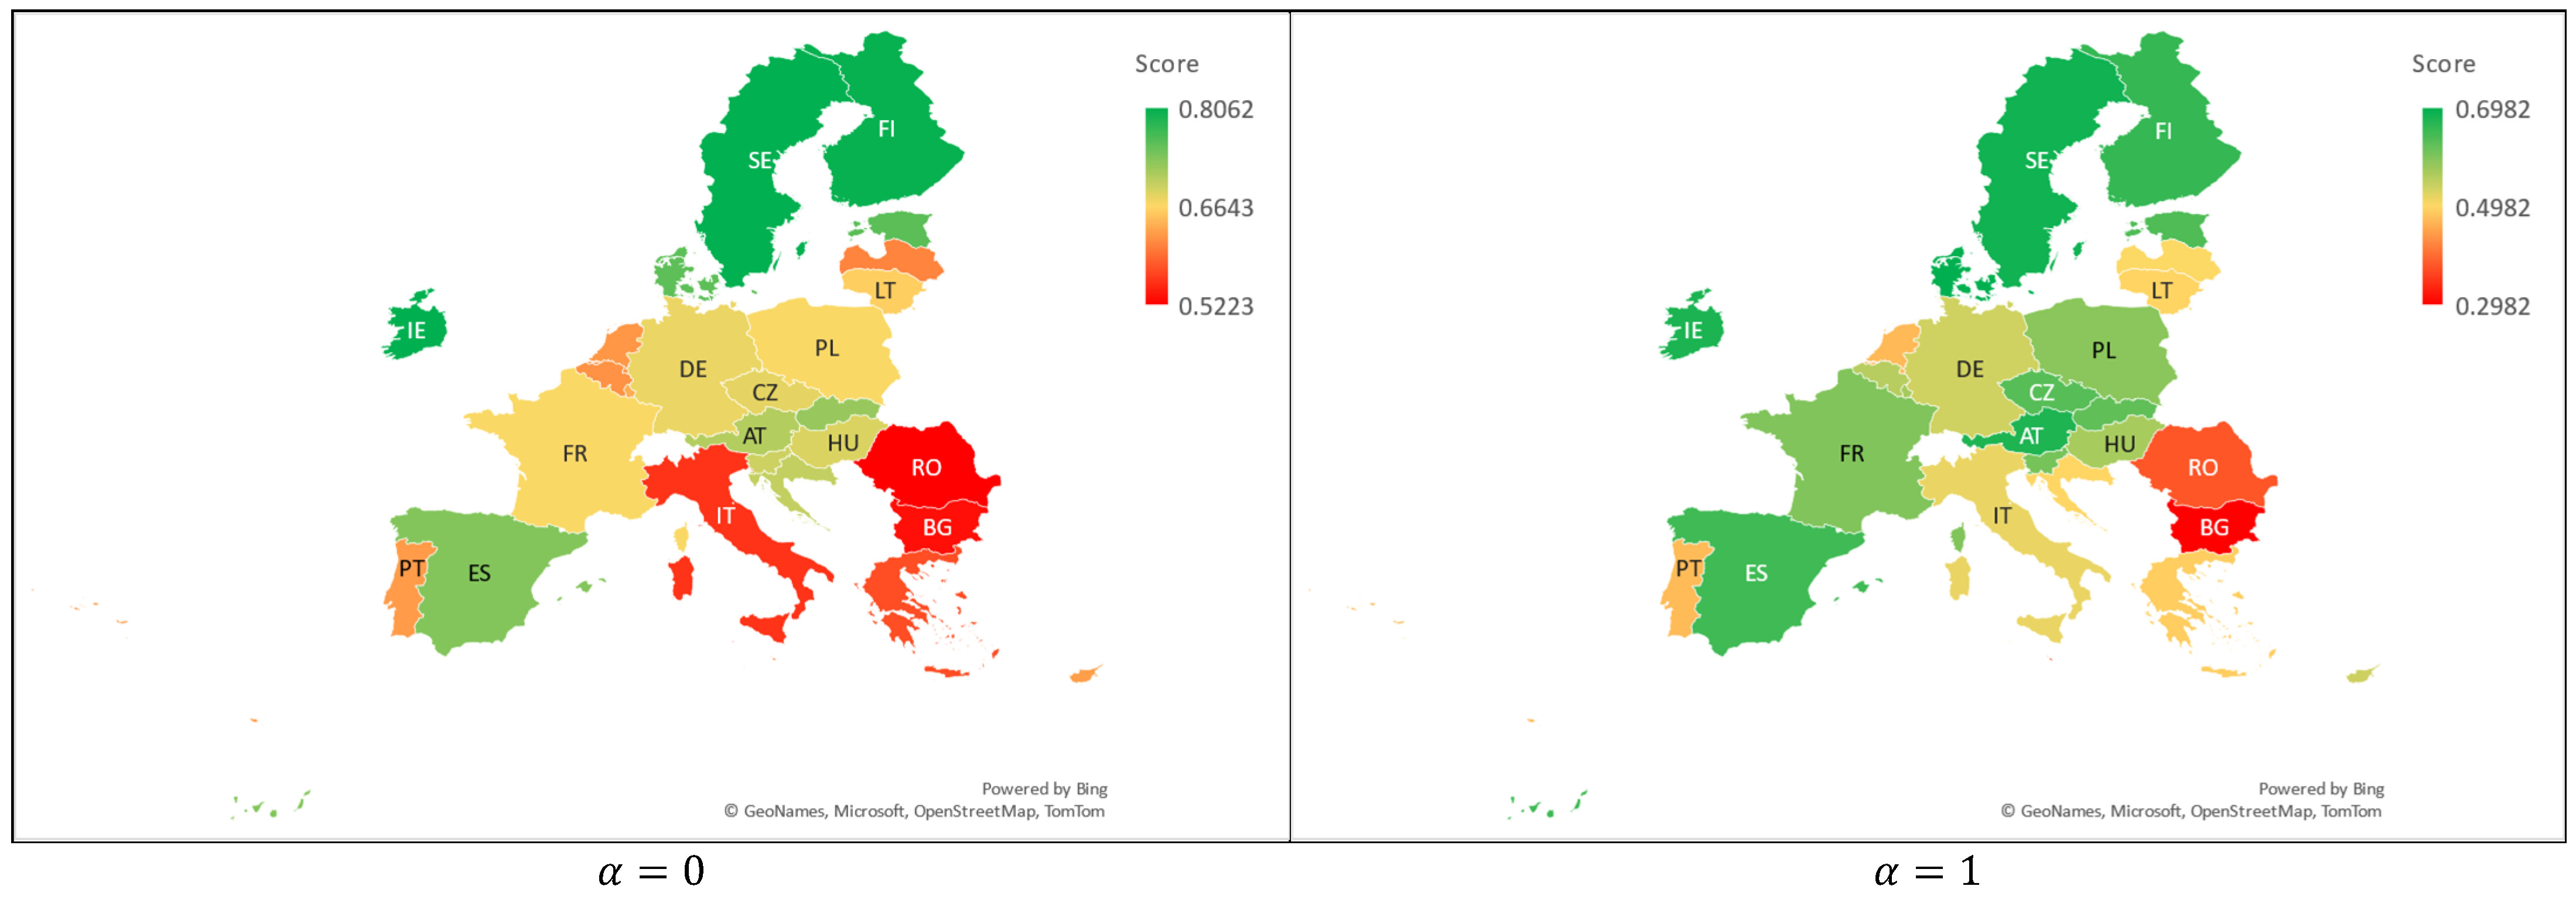
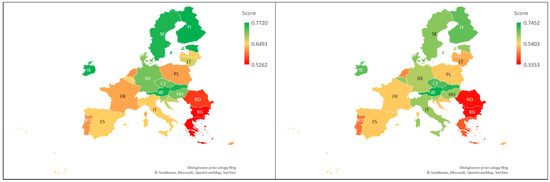
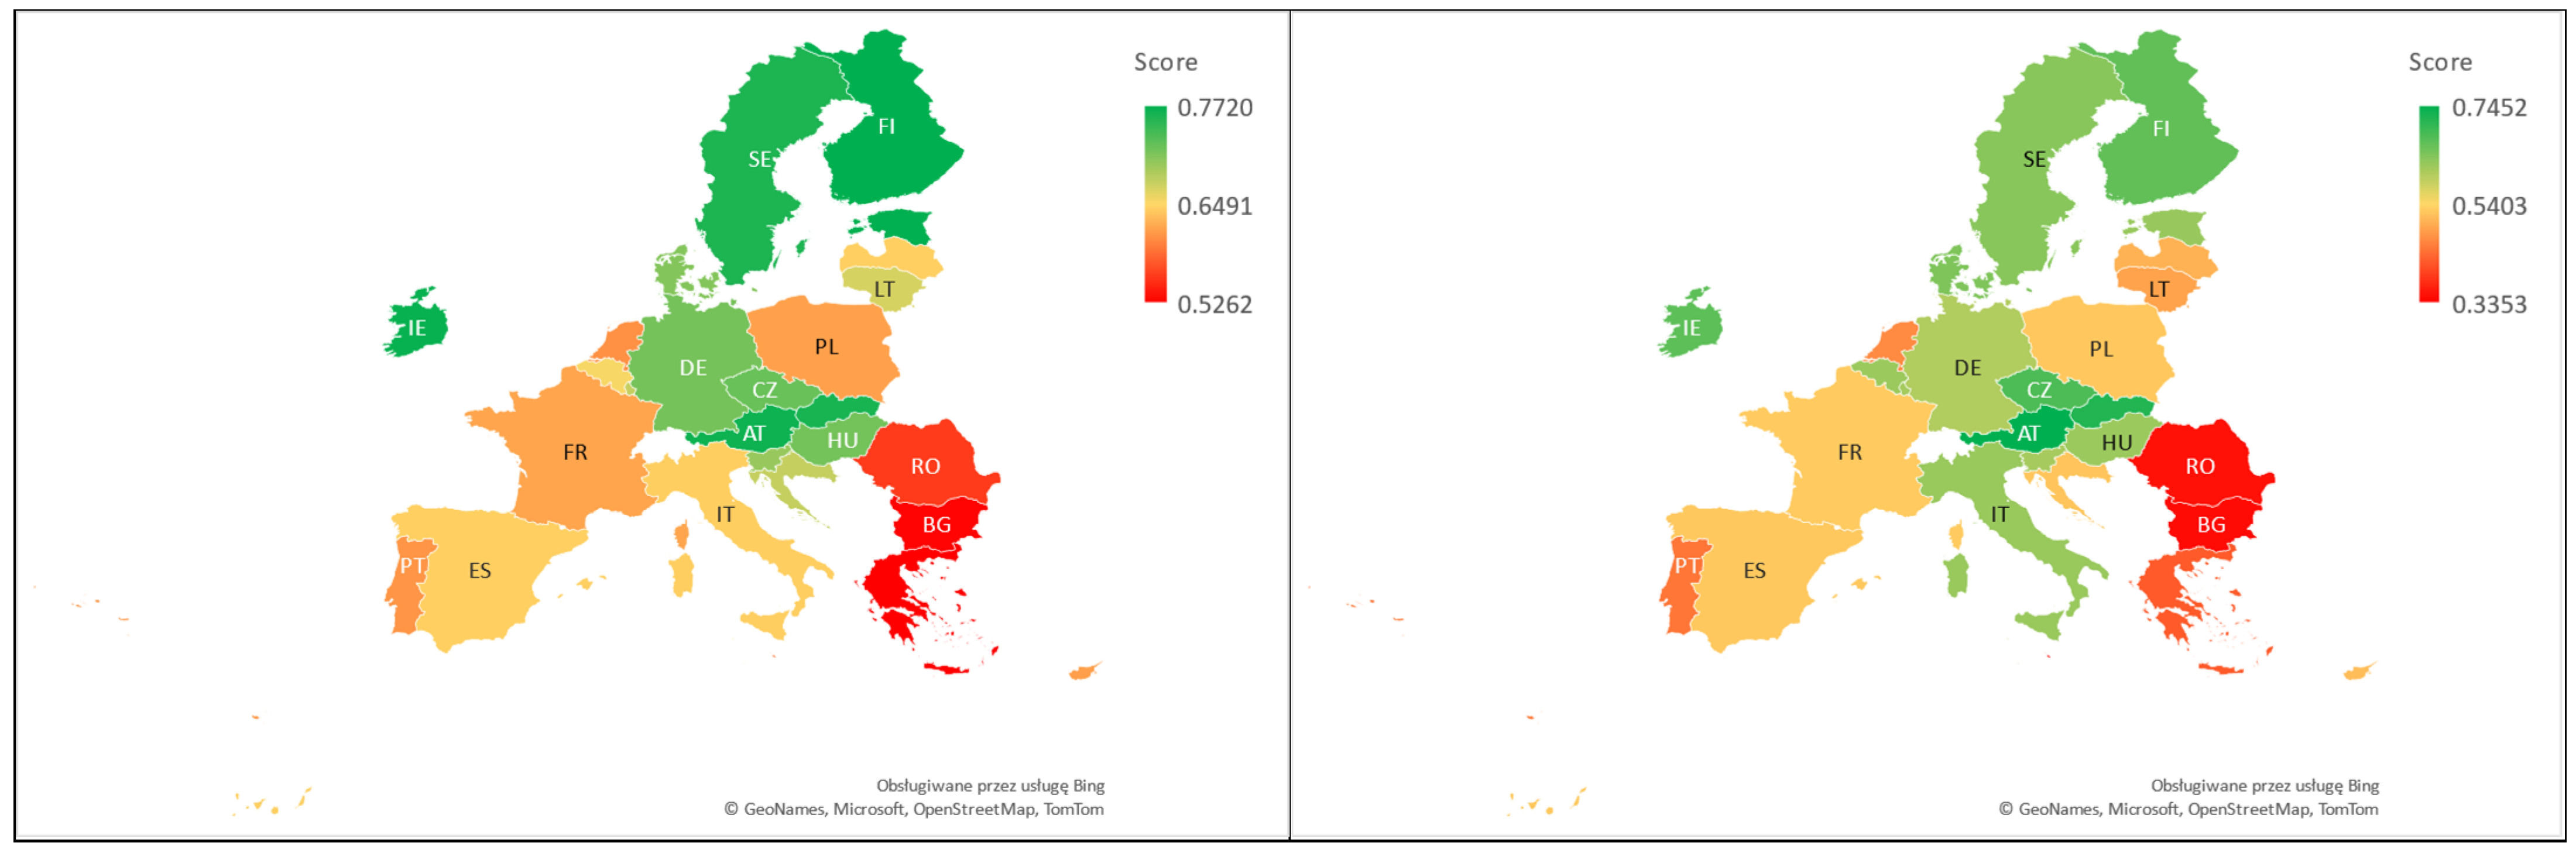
Analyzing the SCCI coefficient values in Table 3 and Table 4, we can observe that they range from 0.298 to 0.806 for 2015 and from 0.335 to 0.772 for 2020.
The largest differences in SCCI values in 2015, due to the adopted level, occur for Bulgaria (0.234; a change from 0.532 for = 0 to 0.298 for = 1) and Malta (0.225; a change from 0.612 for = 0 to 0.387 for = 1). In 2020, the largest differences concern Malta (0.258; a change from 0.594 for = 0 to 0.335 for = 1) and Romania (0.208; a change from 0.560 for = 0 to 0.352 for = 1).
The largest difference in SCCI values between EU countries in 2015 occurred for = 1 and equaled 0.400. Denmark had the highest SCCI(1) = 0.698, while Bulgaria had the lowest SCCI(1) = 0.298. Similarly, in 2020, the largest difference, equal to 0.410, was observed for = 1 (SCCI(1) = 0.745 for Austria and SCCI(1) = 0.335 for Malta). The smallest differences in SCCI between Member States in both years (2015 and 2020) occurred for . It is also worth noting that SCCI(0) took on higher values compared to other values ( in 2015, and in 2020). The SCCI values for = 0 and = 1 in the years 2015 and 2020 are presented in Figure 13 and Figure 14.
Figure 13.
The values of for and in 2015.
Figure 14.
The values of for and in 2020.
We will address question Q2 by presenting the rankings of EU countries based on their progress in achieving SDG 11 in 2015 and 2020. This comparison will highlight the relative performance of each country in terms of Sustainable Cities and Communities development during these years.
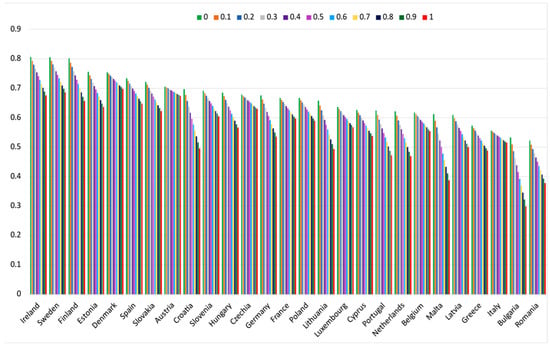
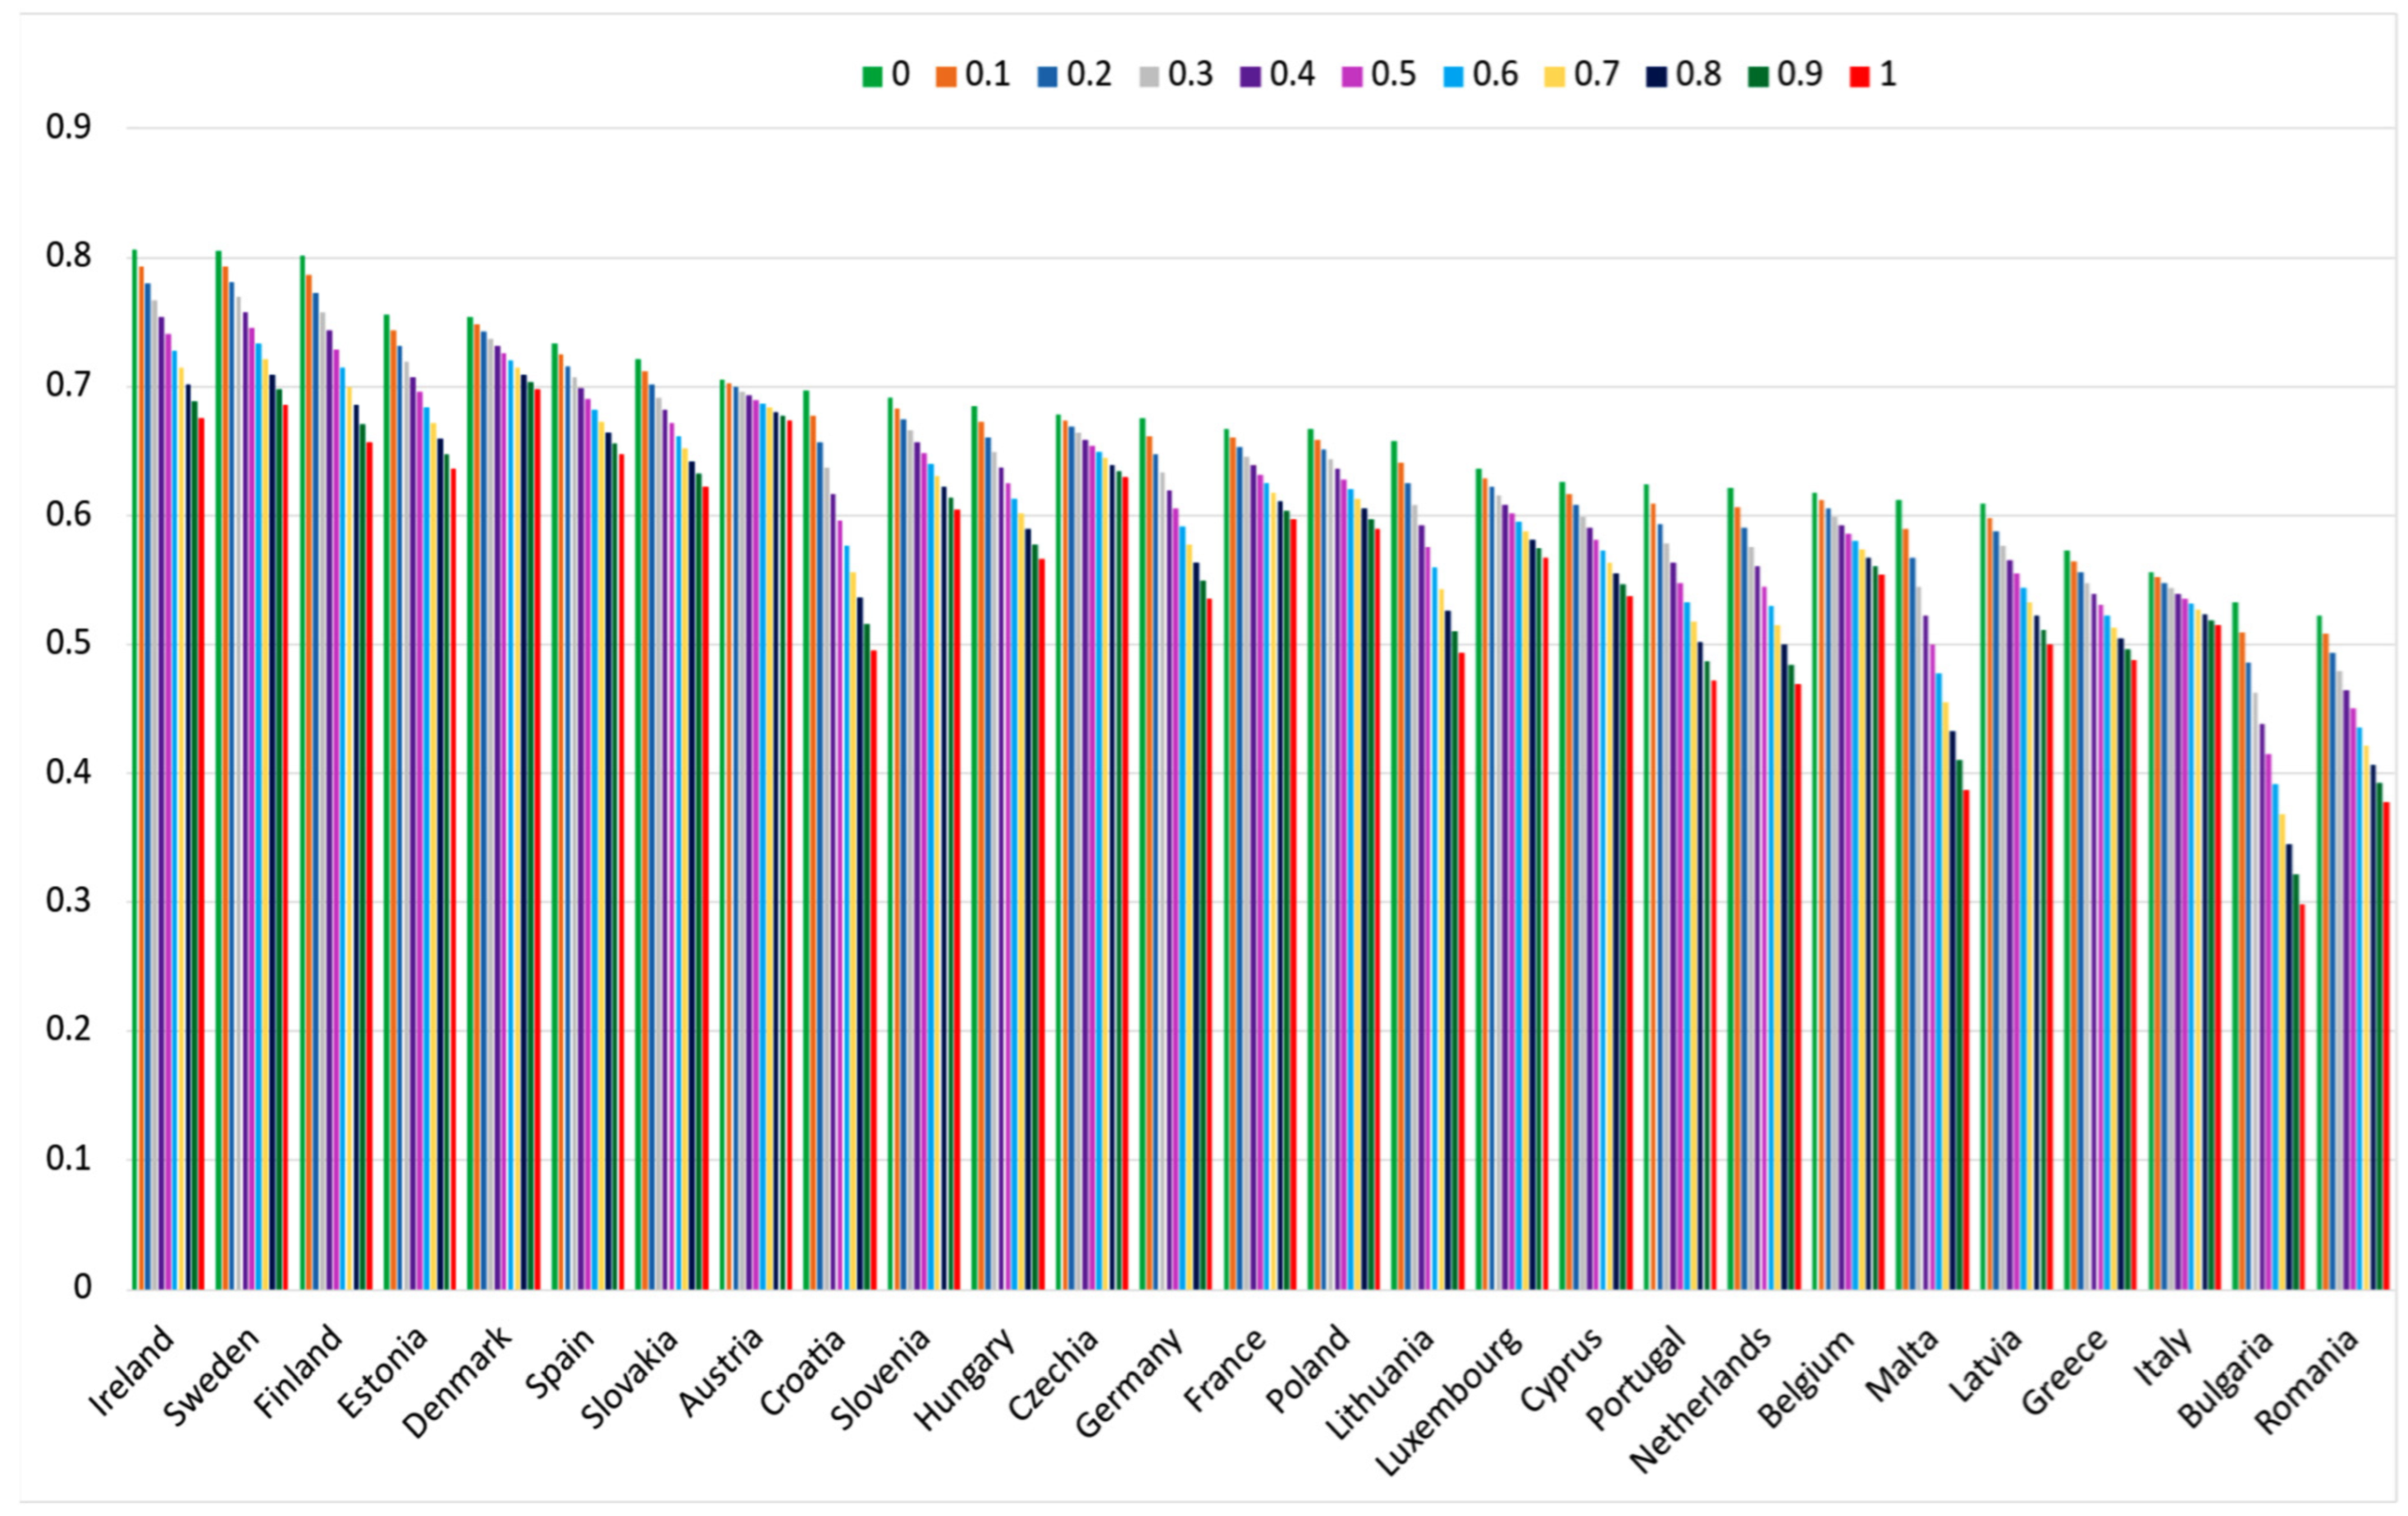
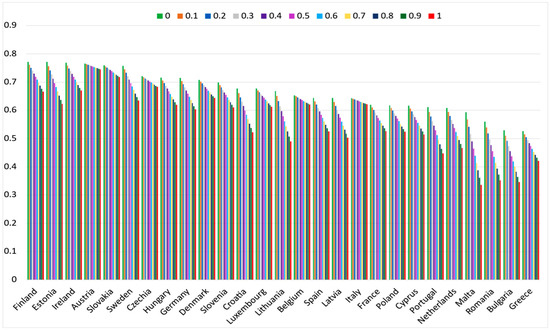
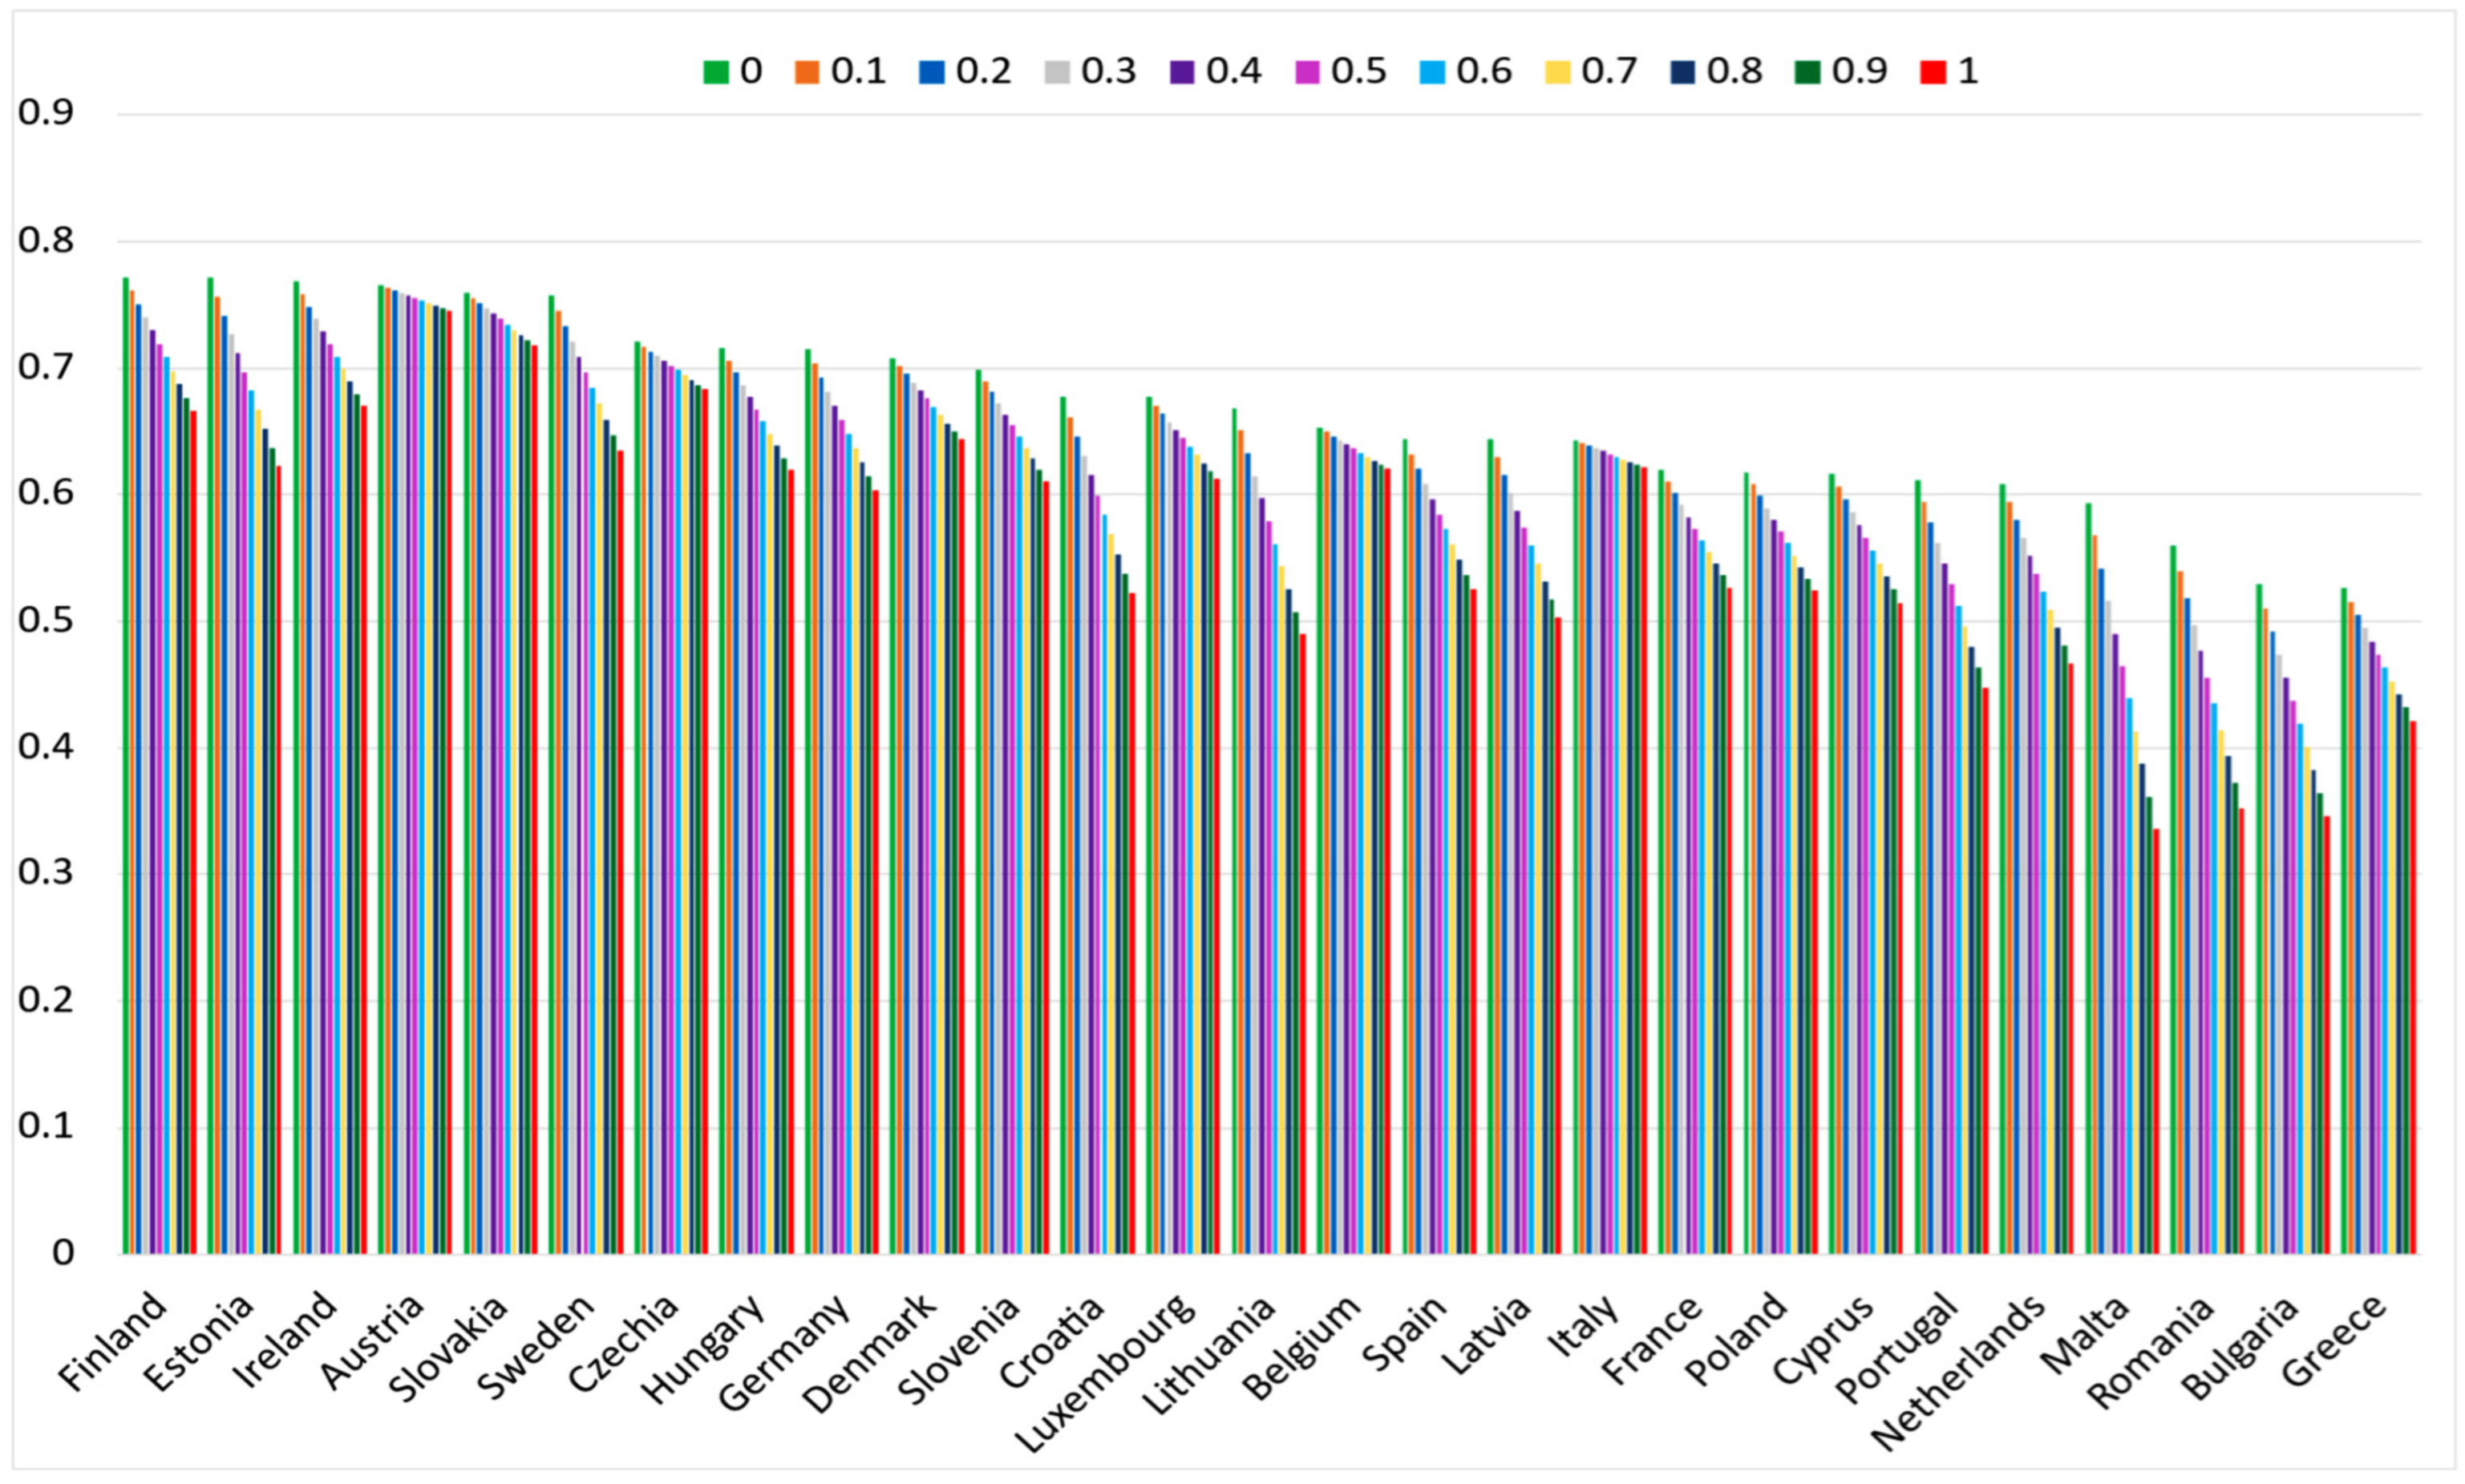
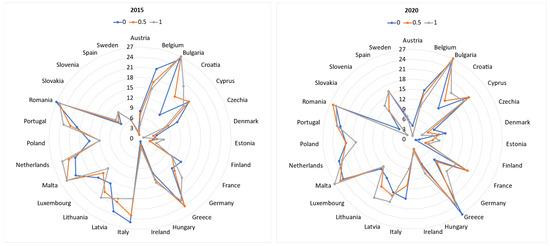
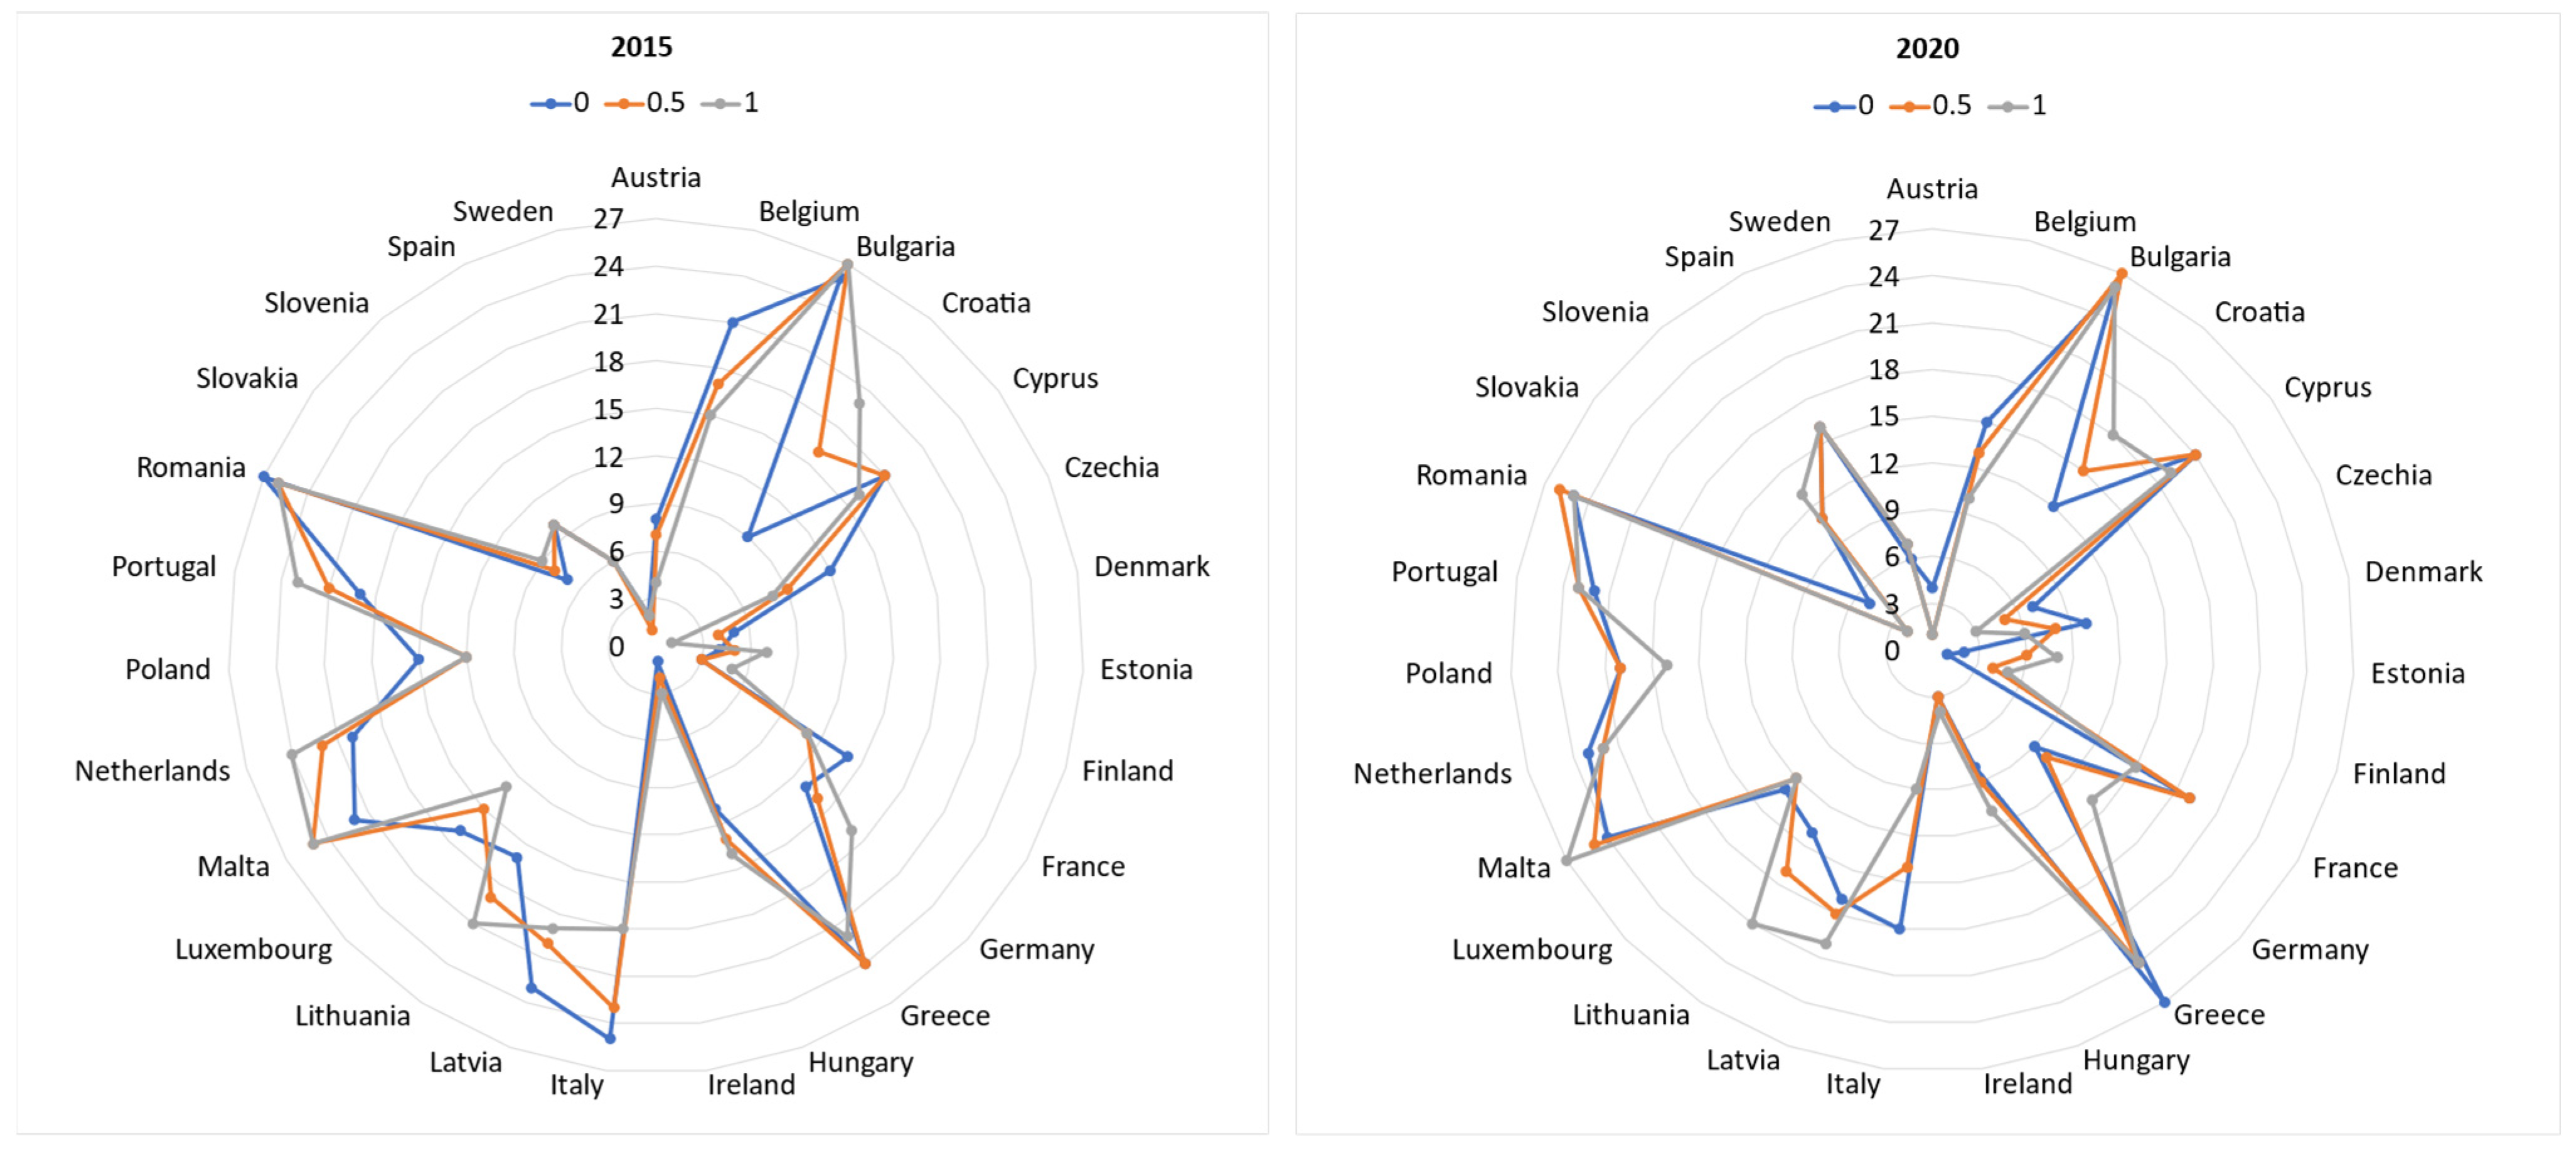
Figure 15 and Figure 16 show a graphical representation of the values of the in the area of Sustainable Cities and Communities in 2015 and 2020 obtained using different values of coefficients .
Figure 15.
Graphical representation of for EU countries for SDG 11 in 2015 obtained for different coefficients .
Figure 16.
Graphical representation of for EU countries for SDG 11 in 2020 obtained for different coefficients .
Figure 15 and Figure 16 illustrate the impact of the coefficient on the SCCI value. In both years, a clear decreasing trend in the influence of the coefficient on the value can be observed. Typically, the SCCI value is highest for an and lowest for an , with the differences between these values varying across countries. Furthermore, in both 2015 and 2020, the largest differences in the SCCI value based on the coefficient were observed in Malta, while the smallest differences were noted in Austria. The complete rankings of EU countries for both years based on the values of the SCCI are shown in Table 5 and Table 6.
Figure 15 and Figure 16 show that none of the EU countries in 2015 and 2020 maintained the same ranking positions for all coefficients . From these figures, it appears that, in some cases, tiny differences in SCCI values determined the ranking positions. The top positions in the ranking in 2015, regardless of the adopted value of the coefficients, were taken by Sweden, Ireland, Finland, and Denmark, while Romania and Bulgaria occupied the lowest positions. In 2020, Austria, Slovakia, Finland, and Ireland ranked highest, while Bulgaria, Romania, Malta, and Greece were at the bottom.
The subsequent analysis will address question Q3 regarding the influence of the parameter on the ranking of countries in the Sustainable Cities and Communities Index (SCCI) in 2015 and 2020.
From Table 5, we can observe that in 2015, the greatest change in position depending on the chosen coefficient was observed for Croatia, which changed its ranking positions by as much as eleven places (from the 9th position for to the 20th position for ). The next notable shifts (in rank by seven and six positions) occurred for Italy and Belgium, respectively. Italy was ranked 25th for , while for , it was ranked 18th. Belgium, in turn, was ranked 21st for and 15th for . The most minor changes (by just one position depending on the considered) affected five Member States: Bulgaria and Romania, which switched between 26th and 27th positions, Spain, which ranked 7th for and 6th for other values, as well as Slovenia, which ranked 9th for and 10th for other values, and Sweden, which ranked 2nd for , and 1st for other values.
In Table 7, Spearman’s rank correlation coefficients between the for different values in 2015 are presented. These values indicate a strong correlation between the rankings. The lowest values are observed when comparing the rankings obtained using SCCI(1) with SCCI(0) (0.870), SCCI(0) with SCCI(0.9) (0.885), and SCCI(1) with SCCI(0.1) (0.898).
Table 7.
The Spearman coefficient for and different coefficients in 2015.
Table 6 illustrates that in 2020, Italy experienced the most significant rank shift based on the selected alpha coefficient, altering its position by nine places—from 18th for to 9th for . Next, Lithuania changed its position by seven places (from the 14th position for to the 21st position for ), while Croatia and Estonia changed six places. Croatia ranked 12th for and 18th for , and Estonia was the 2nd for and 8th for . In 2020, taking into account considered values , seven countries changed positions by one place: Bulgaria (from 26th for to 27th for others ), Ireland (from 3rd for to 4th for other ), Netherlands (from 23rd for to 22nd for other ), Portugal (from 22nd for to 23rd for other ), Romania (from 26th for to 25th for other ), Spain (from 17th for to 16th for other ), and Sweden (from 7th for to 6th for other ).
Table 8 presents Spearman’s rank correlation coefficients for across various α values in 2020. These coefficients reveal a strong correlation among the rankings. The lowest correlations were found between the rankings derived from SCCI(1) and SCCI(0) (0.880), SCCI(0) and SCCI(0.9) (0.905), as well as SCCI(1) and SCCI(0.1) (0.907).
Table 8.
The Spearman coefficient for and different coefficients in 2020.
It is worth noting that in 2015 and 2020, a similar trend was observed regarding the Spearman correlation coefficient. Strong Spearman correlation values were found for the measure and the coefficients, which varied by 0.1. As the difference between these coefficients increases, the Spearman correlation value gradually declines, ultimately reaching its minimum when comparing the and measures.
Finally, by comparing the results obtained for 2015 and 2020, we will address the research questions Q4–Q7 posed in this study and assess the changes in the implementation of SDG 11 by EU countries. In particular, we will identify which countries have demonstrated the most significant progress in achieving SDG 11 in 2020 compared to 2015 and which have experienced the most notable declines during the same period. Furthermore, we will examine which specific indicators had the most substantial impact on the shifts in ranking positions for these countries concerning SDG 11.
Analyzing the results in Table 9 and Table 10, we can observe the differences between 2015 and 2020 in the values of measures and positions in the rankings of EU countries obtained based on these differences for different values of The highest increase in in 2020 compared to 2015 (Table 9) for varying values of the coefficient was observed in Italy, with a range of [0.087, 0.107]. This was due to a change in the ranking from 25th and 18th place for extreme alpha values (, respectively) in 2015 to 18th and 9th place in 2020 (Table 5 and Table 6). Such significant progress in achieving SDG 11 in Italy in 2020 compared to 2015 can be attributed to substantial improvements in C2 (Population living in households considering that they suffer from noise, by poverty status) and C4 (Population reporting the occurrence of crime, violence, or vandalism in their area by poverty status), and moderate advancements in C1 (Severe housing deprivation rate by poverty status), C3 (Premature deaths due to exposure to fine particulate matter (PM2.5)), C5 (Road traffic deaths, by type of roads), and C8 (Recycling rate of municipal waste). At the same time, there was a moderate regress concerning C6 (Share of buses and trains in inland passenger transport) and a very slight decline related to C7 (Soil sealing index). It is crucial to recall (Figure 9 and Figure 10) that all countries, including Italy, exhibited a decreasing trend in relation to C6 and nearly all of them (though not all) in the case of C7. Significant progress in achieving SDG 11 in 2020 compared to 2015 has also been observed for Austria, Czechia, and Germany. All these countries demonstrated advancement in relation to C1, C2, C3, C4, C5, and C8. However, the degree of progress observed was less substantial than that observed in Italy. Furthermore, in line with other countries, they experienced a regress regarding C6 and C7 (see Figure 4 and Figure 11).
Table 9.
The values of the differences in for EU countries in 2020 compared to 2015, using different coefficients .
Table 10.
The rankings of EU countries obtained based on differences in in 2020 compared to 2015 (Table 9) for different coefficients .
In turn, the most significant decrease in the SCCI measure, regardless of the value chosen, occurred in Spain, where the difference ranged [−0.122, −0.089], leading to a drop of 10 positions in the ranking in 2020 compared to 2015 (from 7th place for and 6th place for other values to 17th place for , and 16th place for the remaining values) (Table 5 and Table 6). For Spain, progress was observed only for C3, C5, and C8. However, for both C3 and C5, progress was recorded for all countries except one (Ireland), while for C8, no progress was recorded for seven countries. On the other hand, in Spain, there was a regress for the remaining indicators, i.e., C1, C2, C4, C6, and C7, with significant declines observed for C2 and C6 (Figure 4 and Figure 11). A notable regress in the attainment of SDG 11 in 2020 compared to 2015 has also been observed in Greece, Poland, and France. All these countries have experienced a decline in C2, C6, and C7, with Greece additionally regressing in C4 and France in C1 and C4 (Figure 4 and Figure 11).
The most minor SCCI difference is observed for Lithuania with (0.001) and (−0.001), Romania with (−0.001), Estonia with (0.001), and Croatia with (−0.001). In the case of Croatia and Romania, the ranking positions remained unchanged (26th place for Romania and 15th place for Croatia), while in other cases, there was a slight change (up to a maximum of two places).
For twenty-one countries, a consistent trend in the changes in the measure was observed, regardless of the coefficient. Ten countries made progress in achieving SDG 11, namely Austria, Belgium, Czechia, Germany, Hungary, Italy, Latvia, Luxembourg, Slovakia, and Slovenia. Conversely, eleven countries experienced regress: Cyprus, Denmark, France, Greece, Ireland, Malta, the Netherlands, Poland, Portugal, Spain, and Sweden. For the remaining countries, the differences in the SCCI measures for 2020 and 2015 exhibited both positive and negative values. However, it is important to note that these differences were not very significant.
In Figure 17, the rankings of EU countries in 2015 and 2020 based on SCCI for three values are presented.
Figure 17.
Graphical representation of ranking of EU countries for the SDG 11 in 2015 and 2020 for = 0, = 0.5, = 1 in SCCI.
For a clearer interpretation of the comparison between the years 2015 and 2020, we will focus on three selected alpha levels: 0, 0.5, and 1. The results in Table 5 and Table 6 and Figure 17 indicate that Italy showed the most remarkable progress, improving by nine positions for and and by seven positions for . This improvement was driven by significant advancements in nearly all indicators (except for C6 and C7; Figure 4 and Figure 11). Apart from Italy, seven other countries improved their ranking positions in 2020 compared to 2015, considering and . A major change occurred for Slovakia, which moved from 8th place for and 9th for to 2nd place in both cases in 2020. Additionally, Austria saw a notable rise, improving by six places for , achieving a leading position in the 2020 ranking. Similarly, Belgium improved its ranking by six places in 2020 compared to 2015 for , moving up from 21st to 15th position.
The largest decline (by 10 positions for and ) was observed for Spain, which dropped from 6th place in 2015 to 16th in 2020. According to Figure 4 and Figure 11, Spain’s indicator values in 2020 were lower than in 2015 in five areas (C1, C2, C4, C6, C7), with the most significant differences in C2 and C6. Moreover, Poland and France experienced a substantial drop of eight positions for , moving from 12th and 11th places in 2015 to 20th and 19th places, respectively, in 2020. Denmark and Sweden also saw a decline in rankings across all three alpha levels. It is important to highlight that these countries ranked at the top in 2015—Sweden in 1st or 2nd place, depending on the alpha level, and Denmark in 1st place for . In 2020, however, Sweden dropped to 6th or 7th place, and Denmark to 6th for . These decreases were largely influenced by significant drops in the values of their indicators. Sweden’s biggest change from 2015 to 2020 was in the C8 indicator, along with C2, C4, and C6. In the case of Denmark, the regress was in indicators C2, C6, C7, and C8.
In discussing the results of this study, it is evident that the SCCI index, developed using the MIDIA method, provided a robust framework for evaluating the implementation of SDG 11 in EU countries. By utilizing Eurostat indicators, we ensured a standardized evaluation of various aspects of urban sustainability, allowing us to capture essential trends and changes over time. The analysis demonstrated significant disparities in progress among EU Member States from 2015 to 2020, highlighting both advancements and setbacks in urban sustainability. Our study revealed substantial variations in the progress of different countries, addressing critical research questions about SDG 11 implementation.
This study employed the MIDIA approach [37] based on the concepts of ideal and anti-ideal solutions, to develop an SCCI measure for monitoring progress toward SDG 11. Notably, SDG 11 has also been analyzed using other methodologies, such as Hellwig’s method [32], Temporal VIKOR [34], DARIA-TOPSIS [33], modified TOPSIS [35], and the modified BIPOLAR method [35]. Despite utilizing different techniques to aggregate individual indicators, those methodologies share common features by relying on reference points such as ideal and anti-ideal solutions. They enable not only the comparison of the studied objects but also the assessment of their quality, of what is considered perfect in a given case and what is considered bad or highly undesirable. Unlike previous research, this study [20] departs from the use of reference points and is founded on a distinct methodological concept. It presents an innovative approach to constructing the European Development Scoreboard for SDG 11, utilizing principal analysis and 15 sustainability indicators. This framework provides a comprehensive assessment of the progress made by European Member States toward SDG 11 during the period from 2010 to 2022.
Each approach provides valuable insights into sustainable development within the scope of Sustainable Cities and Communities. All of the studies utilized data from Eurostat, though they differed in terms of the temporal scope, the selection of countries examined, and the set of indicators employed based on data availability. While equal weights for indicators were applied in some studies [32,35], others, such as DARIA-TOPSIS [33], adopted a CRITIC-based approach for weight determination, and Temporal VIKOR [34] utilized entropy-based weights. Across all studies, the findings reveal significant disparities among EU countries in their progress toward achieving SDG 11. In all compared studies, Eastern European countries show lower positions compared to Western European countries. Regardless of the methodology or year, a group of countries consistently ranks at the top, demonstrating a high level of achievement in SDG 11. This group includes northern countries such as Sweden, Finland, Ireland, Denmark, and Estonia. Conversely, southern countries such as Bulgaria, Romania, and Greece consistently appear among those with the lowest levels of SDG 11 performance.
Given the variety of approaches available for assessing the level of implementation of SDG 11 in European countries, it is advisable to employ the MAMIMCA (Multiple Assessment, Multiple Importance, Multiple Criteria Analysis) methodology [49]. This approach allows for the integration of diverse techniques, indicators, and weighting schemes, thereby facilitating a comprehensive understanding of the pivotal factors for each methodology and identifying the most balanced country in terms of sustainable cities and communities. This represents a promising direction for further research.
4. Conclusions
This study evaluated the level of development of EU countries in relation to Sustainable Development Goal 11, which focuses on creating sustainable cities and communities. By applying the Multi-Criteria Method Integrating Distances to Ideal and Anti-Ideal Points, the Sustainable Cities and Communities Index () was developed to comprehensively assess and rank EU Member States’ progress in achieving SDG 11 for the years 2015 and 2020. The method, through its weighted system, allows for a balanced evaluation of countries based on their distances from ideal and anti-ideal reference points. The coefficient is used to combine the importance of both the ideal (best performance) and anti-ideal (worst performance) objects. When , only the distance to the ideal point is considered, while when , only the distance to the anti-ideal point is considered. The use of common ideal and anti-ideal points across the analyzed years enabled consistent comparisons over time.
This study successfully quantified the progress of EU countries in achieving SDG 11, addressing the key research questions and highlighting significant disparities across regions. The method, using indicators from the Eurostat database, effectively captured the differentiation of EU countries’ performance concerning the SDG 11 goal.
The analysis conducted has enabled us to answer all the questions outlined in the Introduction. This study showed that in both 2015 and 2020, the range of values systematically increased with higher coefficients. For example, in 2015, the range between the highest and lowest values was 0.284 for , increasing to 0.400 for . Similarly, in 2020, the range expanded from 0.246 for to 0.410 for This indicates that as increased, countries became more differentiated in their progress toward achieving SDG 11, with a greater emphasis on proximity to the ideal point.
Differentiation in progress toward SDG 11 was observed across the studied years, regardless of the coefficient. However, no single country consistently ranked as the best or worst across all indicators used in the composite index In 2015, according to the top-performing SGD 11 goal countries were Ireland, Sweden, and Finland, while Italy, Bulgaria, and Romania ranked lowest. For Denmark, Sweden, and Ireland were the top performers, with Malta, Romania, and Bulgaria at the bottom. A similar trend emerged in 2020, where Finland, Estonia, and Ireland led for and Austria, Slovakia, and Czechia ranked highest for . Romania, Bulgaria, and Greece occupied the lowest positions for ), while Romania, Bulgaria, and Malta occupied the lowest positions for .
This study also revealed significant ranking shifts for certain EU countries depending on the coefficient. For example, Croatia dropped from 9th place ( to 20th place (α = 1) in 2015, while Lithuania fell from 14th ( to 21st place (α = 1) in 2020, according to the SCCI measure. In contrast, countries like Slovenia, Spain, Sweden, Bulgaria, and Romania in 2015, and Bulgaria, Romania, Ireland, the Netherlands, Portugal, Spain, and Sweden in 2020 showed minimal ranking changes—shifting by only one position—regardless of .
Overall, the results showed that Italy demonstrated the strongest performance, while Spain showed the strongest regress in achieving SDG 11 during the analyzed years. Italy showed progress when analyzing all criteria except for the Soil sealing index. Conversely, Spain demonstrated improvements only in three out of eight specific criteria: Road traffic deaths by type of roads, Premature deaths due to exposure to fine particulate matter, and the Recycling rate of municipal waste.
The findings of this study present a valuable framework for policymakers, highlighting the necessity for customized strategies to tackle the diverse levels of progress in sustainable urban development among EU countries. Additionally, the results invite a broader reflection on their implications for policy and practice. Countries that have made significant strides can serve as exemplary models, providing insights into effective governance, public engagement, and innovative solutions to urban sustainability challenges. In contrast, nations that have encountered setbacks may gain from a deeper understanding of the obstacles they face, such as economic limitations or infrastructure deficits. Ultimately, this study not only underscores the advancements made toward achieving SDG 11 but also reinforces the importance of ongoing evaluation and adaptive policymaking to foster sustainable urban development throughout the EU.
Despite the strengths of this study, several limitations should be noted. First, it relies on available Eurostat data, which may not capture all aspects of urban sustainability, and some data were unavailable for certain countries. It is important to note that, due to these data gaps, the analysis was limited to the years 2015 and 2020. Second, while the method is robust, it depends on the chosen values, which could influence the rankings. Future research could explore alternative aggregating methods and incorporate additional indicators to present a more comprehensive sustainability assessment. Expanding the analysis to include more recent data could also provide broader insights into SDG 11, especially since the COVID-19 pandemic, which broke out in 2020, caused significant changes in all spheres, including cities. The transformation of the quality of life in urban areas included the role of transportation and land use, the presence of urban nature, the availability of public space, the provision of facilities and services, housing options, and information and communication technology (ICT) [50]. Moreover, regional disparities within countries could be analyzed in future studies, offering a more granular view of progress toward sustainable cities and communities.
Author Contributions
Conceptualization, E.R. and M.F.-C.; methodology, E.R. and M.F.-C.; software, E.R., M.F.-C., D.G. and E.M.; validation, E.R., M.F.-C., D.G. and E.M.; formal analysis, E.R., M.F.-C., D.G. and E.M.; investigation, E.R., M.F.-C., D.G. and E.M.; resources, E.R., M.F.-C., D.G. and E.M.; data curation, E.R., M.F.-C., D.G. and E.M.; writing—original draft preparation, E.R., M.F.-C., D.G. and E.M.; writing—review and editing, E.R., M.F.-C., D.G. and E.M.; visualization, E.R., M.F.-C., D.G. and E.M.; supervision, E.R.; project administration, E.R. All authors have read and agreed to the published version of the manuscript.
Funding
For Ewa Roszkowska and Marzena Filipowicz-Chomko, the contribution was supported by the grant WZ/WI-IIT/2/22 from Bialystok University of Technology and founded by the Ministry of Education and Science. For Dorota Górecka, this research was funded by Nicolaus Copernicus University in Torun. For Elżbieta Majewska, this research was funded by University of Bialystok.
Institutional Review Board Statement
Not applicable.
Informed Consent Statement
Not applicable.
Data Availability Statement
Data are contained within the article or [41].
Conflicts of Interest
The authors declare no conflicts of interest.
Abbreviations
The following abbreviations are used in this manuscript:
| AHP | Analytic Hierarchy Process |
| DARIA-TOPSIS | Data vARIability Assessment Technique for Order of Preference by Similarity to Ideal Solution |
| MCDM | Multi-criteria decision-making |
| MAMIMCA | Multiple Assessment, Multiple Importance, Multiple Criteria Analysis |
| MIDIA | A Multi-Criteria Method Integrating Distances to Ideal and Anti-ideal Points |
| SCCI | Sustainable Cities and Communities Index |
| SD | Sustainable Development |
| SDG | Sustainable Development Goal |
| TOPSIS | Technique for Ordering Preferences by Similarity to Ideal Solution |
| EU | European Union |
| VIKOR | VlseKriterijumska Optimizacija I Kompromisno Resenje |
Appendix A
Table A1.
Indicators measuring progress on SDG 11 in the EU from the Eurostat database.
References
- Report of the World Commission on Environment and Development Our Common Future (The Brundtland Report) 1987. Available online: https://digitallibrary.un.org/record/139811?v=pdf (accessed on 26 September 2024).
- Hajian, M.; Kashani, S.J. Evolution of the Concept of Sustainability. From Brundtland Report to Sustainable Development Goals. In Sustainable Resource Management; Elsevier: Amsterdam, The Netherlands, 2021; pp. 1–24. [Google Scholar]
- Purvis, B.; Mao, Y.; Robinson, D. Three Pillars of Sustainability: In Search of Conceptual Origins. Sustain. Sci. 2019, 14, 681–695. [Google Scholar] [CrossRef] [Scilit]
- Sneddon, C.; Howarth, R.B.; Norgaard, R.B. Sustainable Development in a Post-Brundtland World. Ecol. Econ. 2006, 57, 253–268. [Google Scholar] [CrossRef] [Scilit]
- Halkos, G.; Gkampoura, E.-C. Where Do We Stand on the 17 Sustainable Development Goals? An Overview on Progress. Econ. Anal. Policy 2021, 70, 94–122. [Google Scholar] [CrossRef] [Scilit]
- Diaz-Lopez, C.; Martin-Blanco, C.; De la Torre Bayo, J.J.; Rubio-Rivera, B.; Zamorano, M. Analyzing the Scientific Evolution of the Sustainable Development Goals. Appl. Sci. 2021, 11, 8286. [Google Scholar] [CrossRef] [Scilit]
- The Largest Cities Worldwide 2023. Available online: https://www.destatis.de/EN/Themes/Countries-Regions/International-Statistics/Data-Topic/Population-Labour-Social-Issues/DemographyMigration/UrbanPopulation.html (accessed on 28 September 2024).
- Population Projections: Urban Growth, Rural Decline. Available online: https://ec.europa.eu/eurostat/web/products-eurostat-news/-/ddn-20210520-1 (accessed on 28 September 2024).
- World Bank Open Data. Available online: https://data.worldbank.org (accessed on 28 September 2024).
- Urbanisation in Europe: Knowledge for Policy. Available online: https://knowledge4policy.ec.europa.eu/foresight/topic/continuing-urbanisation/urbanisation-europe_en (accessed on 28 September 2024).
- Trindade, E.P.; Hinnig, M.P.F.; da Costa, E.M.; Marques, J.S.; Bastos, R.C.; Yigitcanlar, T. Sustainable Development of Smart Cities: A Systematic Review of the Literature. J. Open Innov. Technol. Mark. Complex. 2017, 3, 1–14. [Google Scholar] [CrossRef] [Scilit]
- Ismagiloiva, E.; Hughes, L.; Rana, N.; Dwivedi, Y. Role of Smart Cities in Creating Sustainable Cities and Communities: A Systematic Literature Review. In ICT Unbounded, Social Impact of Bright ICT Adoption; Dwivedi, Y., Ayaburi, E., Boateng, R., Effah, J., Eds.; IFIP Advances in Information and Communication Technology; Springer International Publishing: Cham, Switzerland, 2019; Volume 558, pp. 311–324. ISBN 978-3-030-20670-3. [Google Scholar]
- Berishvili, N. Agenda 2030 and the EU on Sustainable Cities and Communities. In Implementing Sustainable Development Goals in Europe; Edward Elgar Publishing: Cheltenham, UK; Northampton, MA, USA, 2020; pp. 150–161. ISBN 978-1-78990-997-5. [Google Scholar]
- Klopp, J.M.; Petretta, D.L. The Urban Sustainable Development Goal: Indicators, Complexity and the Politics of Measuring Cities. Cities 2017, 63, 92–97. [Google Scholar] [CrossRef] [Scilit]
- Roszkowska, E.; Wachowicz, T. Smart Cities and Resident Well-Being: Using the BTOPSIS Method to Assess Citizen Life Satisfaction in European Cities. Appl. Sci. 2024, 14, 11051. [Google Scholar] [CrossRef] [Scilit]
- Kusterka-Jefmańska, M.; Roszkowska, E.; Jefmański, B. The Intuitionistic Fuzzy Synthetic Measure in a Dynamic Analysis of the Subjective Quality of Life of Citizens of European Cities. Ekon. I Sr. 2024, 88, 1–16. [Google Scholar] [CrossRef] [Scilit]
- Kumar, D.; Shandilya, A.K.; Varghese, S.G. Mapping Sustainable Cities and Communities (SDG 11) Research: A Bibliometric Review. Eng. Proc. 2023, 59, 125. [Google Scholar] [CrossRef] [Scilit]
- Caprotti, F.; Cowley, R.; Datta, A.; Broto, V.C.; Gao, E.; Georgeson, L.; Herrick, C.; Odendaal, N.; Joss, S. The New Urban Agenda: Key Opportunities and Challenges for Policy and Practice. Urban Res. Pract. 2017, 10, 367–378. [Google Scholar] [CrossRef] [Scilit]
- Nabiyeva, G.N.; Wheeler, S.M.; London, J.K.; Brazil, N. Implementation of Sustainable Development Goal 11 (Sustainable Cities and Communities): Initial Good Practices Data. Sustainability 2023, 15, 14810. [Google Scholar] [CrossRef] [Scilit]
- Ionescu, G.H.; Firoiu, D.; Manda, A.-M.; Pîrvu, R.; Jianu, E.; Antoniu, M.-E. Progress towards the 2030 Sustainable Development Goals for EU Urban Communities (SDG11). Sustainability 2024, 16, 4513. [Google Scholar] [CrossRef] [Scilit]
- Hák, T.; Janoušková, S.; Moldan, B. Sustainable Development Goals: A Need for Relevant Indicators. Ecol. Indic. 2016, 60, 565–573. [Google Scholar] [CrossRef] [Scilit]
- Sciarra, C.; Chiarotti, G.; Ridolfi, L.; Laio, F. A Network Approach to Rank Countries Chasing Sustainable Development. Sci. Rep. 2021, 11, 15441. [Google Scholar] [CrossRef] [Scilit] [PubMed]
- Ricciolini, E.; Rocchi, L.; Cardinali, M.; Paolotti, L.; Ruiz, F.; Cabello, J.M.; Boggia, A. Assessing Progress Towards SDGs Implementation Using Multiple Reference Point Based Multicriteria Methods: The Case Study of the European Countries. Soc. Indic. Res. 2022, 162, 1233–1260. [Google Scholar] [CrossRef] [Scilit] [PubMed]
- Sessa, M. Measuring and Monitoring the Achievements of the Millennium Development Goals through Dynamic Composite Indices. Soc. Indic. Res. 2016, 127, 469–503. [Google Scholar] [CrossRef] [Scilit]
- Cinelli, M.; Coles, S.R.; Kirwan, K. Analysis of the Potentials of Multi Criteria Decision Analysis Methods to Conduct Sustainability Assessment. Ecol. Indic. 2014, 46, 138–148. [Google Scholar] [CrossRef] [Scilit]
- Lindfors, A. Assessing Sustainability with Multi-Criteria Methods: A Methodologically Focused Literature Review. Environ. Sustain. Indic. 2021, 12, 100149. [Google Scholar] [CrossRef] [Scilit]
- El Gibari, S.; Gómez, T.; Ruiz, F. Building Composite Indicators Using Multicriteria Methods: A Review. J. Bus. Econ. 2019, 89, 1–24. [Google Scholar] [CrossRef] [Scilit]
- Diaz-Balteiro, L.; González-Pachón, J.; Romero, C. Measuring Systems Sustainability with Multi-Criteria Methods: A Critical Review. Eur. J. Oper. Res. 2017, 258, 607–616. [Google Scholar] [CrossRef] [Scilit]
- Sousa, M.; Almeida, M.F.; Calili, R. Multiple Criteria Decision Making for the Achievement of the UN Sustainable Development Goals: A Systematic Literature Review and a Research Agenda. Sustainability 2021, 13, 4129. [Google Scholar] [CrossRef] [Scilit]
- Berisha, E.; Caprioli, C.; Cotella, G. Unpacking SDG Target 11.a: What Is It about and How to Measure Its Progress? City Environ. Interact. 2022, 14, 100080. [Google Scholar] [CrossRef] [Scilit]
- Lami, I.M.; Abastante, F.; Gaballo, M.; Mecca, B.; Todella, E. Fostering Sustainable Cities through Additional SDG11-Related Indicators. Valori Valutazioni 2023, 32, 45–61. [Google Scholar] [CrossRef] [Scilit]
- Bartniczak, B.; Raszkowski, A. Implementation of the Sustainable Cities and Communities Sustainable Development Goal (SDG) in the European Union. Sustainability 2022, 14, 16808. [Google Scholar] [CrossRef] [Scilit]
- Wątróbski, J.; Bączkiewicz, A.; Ziemba, E.; Sałabun, W. Sustainable Cities and Communities Assessment Using the DARIA-TOPSIS Method. Sustain. Cities Soc. 2022, 83, 103926. [Google Scholar] [CrossRef] [Scilit]
- Wątróbski, J.; Bączkiewicz, A.; Ziemba, E.; Sałabun, W. Temporal VIKOR—A New MCDA Method Supporting Sustainability Assessment. In Advances in Information Systems Development; Silaghi, G.C., Buchmann, R.A., Niculescu, V., Czibula, G., Barry, C., Lang, M., Linger, H., Schneider, C., Eds.; Lecture Notes in Information Systems and Organisation; Springer International Publishing: Cham, Switzerland, 2023; Volume 63, pp. 187–206. ISBN 978-3-031-32417-8. [Google Scholar]
- Górecka, D.; Roszkowska, E. Enhancing Spatial Analysis through Reference Multi-Criteria Methods: A Study Evaluating EU Countries in Terms of Sustainable Cities and Communities. Netw. Spat. Econ. 2024. [Google Scholar] [CrossRef] [Scilit]
- Pricope, L.N.; Antohi, V.M.; Meca, A.; Buboi, A.; Fortea, C.; Zlati, M.L. The New European Development Scoreboard for SDG11 at the European Level. Sustainability 2024, 16, 7736. [Google Scholar] [CrossRef] [Scilit]
- Roszkowska, E.; Filipowicz-Chomko, M. A Multi-Criteria Method Integrating Distances to Ideal and Anti-Ideal Points. Symmetry 2024, 16, 1025. [Google Scholar] [CrossRef] [Scilit]
- Hellwig, Z. Multivariate Comparative Analysis and Its Application in Multi-Criteria Research of Economic Objects. In Economic-Mathematical Methods and Models in the Improvement of Socialist Economy Management; PWE: Warszawa, Poland, 1981; pp. 46–68. (In Polish) [Google Scholar]
- Roszkowska, E.; Filipowicz-Chomko, M.; Łyczkowska-Hanćkowiak, A.; Majewska, E. Extended Hellwig’s Method Utilizing Entropy-Based Weights and Mahalanobis Distance: Applications in Evaluating Sustainable Development in the Education Area. Entropy 2024, 26, 197. [Google Scholar] [CrossRef] [Scilit]
- Roszkowska, E. A Comprehensive Exploration of Hellwig’s Taxonomic Measure of Development and Its Modifications—A Systematic Review of Algorithms and Applications. Appl. Sci. 2024, 14, 10029. [Google Scholar] [CrossRef] [Scilit]
- Database—Eurostat. Available online: https://ec.europa.eu/eurostat/web/sdi/database (accessed on 26 September 2024).
- da Silva, F.F.; Souza, C.L.M.; Silva, F.F.; Costa, H.G.; da Hora, H.R.M.; Erthal, M., Jr. Elicitation of Criteria Weights for Multicriteria Models: Bibliometrics, Typologies, Characteristics and Applications. Braz. J. Oper. Prod. Manag. 2021, 18, 1–28. [Google Scholar] [CrossRef] [Scilit]
- Zardari, N.H.; Ahmed, K.; Shirazi, S.M.; Yusop, Z.B. Weighting Methods and Their Effects on Multi-Criteria Decision Making Model Outcomes in Water Resources Management; Springer: Cham, Switzerland; Berlin/Heidelberg, Germany; New York, NY, USA; Dordrecht, The Netherlands; London, UK, 2015. [Google Scholar]
- Odu, G.O. Weighting Methods for Multi-Criteria Decision Making Technique. J. Appl. Sci. Environ. Manag. 2019, 23, 1449–1457. [Google Scholar] [CrossRef] [Scilit]
- Ayan, B.; Abacıoğlu, S.; Basilio, M.P. A Comprehensive Review of the Novel Weighting Methods for Multi-Criteria Decision-Making. Information 2023, 14, 285. [Google Scholar] [CrossRef] [Scilit]
- Greco, S.; Ishizaka, A.; Tasiou, M.; Torrisi, G. On the Methodological Framework of Composite Indices: A Review of the Issues of Weighting, Aggregation, and Robustness. Soc. Indic. Res. 2019, 141, 61–94. [Google Scholar] [CrossRef] [Scilit]
- Gan, X.; Fernandez, I.C.; Guo, J.; Wilson, M.; Zhao, Y.; Zhou, B.; Wu, J. When to Use What: Methods for Weighting and Aggregating Sustainability Indicators. Ecol. Indic. 2017, 81, 491–502. [Google Scholar] [CrossRef] [Scilit]
- Decancq, K.; Lugo, M.A. Weights in Multidimensional Indices of Wellbeing: An Overview: Econometric Reviews. Econom. Rev. 2013, 32, 7–34. [Google Scholar] [CrossRef] [Scilit]
- Górecka, D. Selecting the Right Football Club to Sponsor: Multi-Criteria Analysis. J. Phys. Educ. Sport 2020, 20, 2867–2874. [Google Scholar]
- Mouratidis, K. How COVID-19 Reshaped Quality of Life in Cities: A Synthesis and Implications for Urban Planning. Land Use Policy 2021, 111, 105772. [Google Scholar] [CrossRef] [Scilit] [PubMed]

Disclaimer/Publisher’s Note: The statements, opinions and data contained in all publications are solely those of the individual author(s) and contributor(s) and not of MDPI and/or the editor(s). MDPI and/or the editor(s) disclaim responsibility for any injury to people or property resulting from any ideas, methods, instructions or products referred to in the content. |
© 2024 by the authors. Licensee MDPI, Basel, Switzerland. This article is an open access article distributed under the terms and conditions of the Creative Commons Attribution (CC BY) license (https://creativecommons.org/licenses/by/4.0/).