


Abstract
Risk management represents a challenge for organizations, as it includes environmental, social, and governance (ESG) issues that can negatively impact organizations’ investments. This article shows a general approach for prioritizing organizational risks focused on sustainability, which is applied in a particular case. Based on the analysis of global reports such as the “Global Sustainable Development Report”, “Enterprise Risk Management-Integrating with Strategy and Performance”, and the “Global Risk Report”, five typologies of organizational risks with a focus on sustainability (geopolitical, economic, social, technological, and environmental) that support the concern for sustainability in organizations are characterized, taking into account viability and equitability. Additionally, some sub-risks are proposed for each characterized typology of risk. Subsequently, the application of paired surveys assigned to a group of experts formed by executives from the service sector, auditing and consulting firms, the oil and gas sector, the manufacturing sector, and the financial sector is carried out; the responses obtained are consolidated and used in this study as input for the application of DEMATEL and AHP methods to prioritize risks and sub-risks, respectively. The result obtained via the DEMATEL method is the following risk prioritization: (1) economic, (2) geopolitical, (3) social, (4) technological, and (5) environmental. Using the AHP method, the sustainability sub-risks with the highest level of prioritization for each typology of risk are (1) massive data fraud or theft incident (technological risk), (2) deficit in economic growth (economic risk), (3) water depletion (environmental risk), (4) lack of ethics in the conduct of business (geopolitical risk), and (5) chemical safety (social risk). The sensitivity analysis presents positive and negative values, indicating that the positive results do not generate substantial changes between the characterized sub-risks. On the other hand, the negative results indicate a notable decrease in the relative importance of the sub-risks. It is crucial to highlight that the observed variations remain within realistic limits and reflect the uncertainty inherent in decision-making in a dynamic environment.
1. Introduction
According to the research conducted by Amir and Seddik (2023) [1], operational excellence (OE) represents a holistic, comprehensive, systematic, and collaborative approach that drives cultural change in organizations in order to optimize operations, providing efficient functioning and achieving the fulfillment of strategic objectives. A management system that is sustainable over time and that additionally provides confidence and profitability allows process leaders to demonstrate that they are adequately managing their assets [2]. Several organizations are pursuing or exploring the operational excellence management system (OEMS) concept; however, for many it has been an elusive goal [3]. Additionally, it is essential to bring this implementation to the next level by following up on international regulations related to the assurance of environmental, social, and governance (ESG) issues in order to reinforce the models for the proper management of organizational risks with a focus on sustainability, supported by the assurance of sustainability reports, since they significantly reduce the pressures exerted by the stakeholders of the organizations [4]. This is an integrated approach where requirements defined by various stakeholders are addressed jointly, which has three main components: (i) operational elements and scope, (ii) change management and delivery of results, and (iii) continuous performance improvement [1,3,5]. Meanwhile, to ensure that an organization is sustainable over time; that it contributes economic, environmental, and social value in the short and medium term; and that it promotes the well-being and progress of all its stakeholders, it must implement the best available practices, including the treatment of environmental, social, and governance (ESG) factors in its strategy, transformation, process organization, and assurance reporting [6].
According to the “Enterprise Risk Management: applying enterprise risk management to environmental, social and governance-related risks” report [7], which compares sustainability risk disclosures, it was found that 35% of the 170 organizations examined did not disclose any of these risks. Additionally, surveys show that more than 70% of risk and sustainability management professionals feel that risk management practices do not adequately address organizational risks with a sustainability focus [7]. In response to this challenge, an OEMS system has emerged as a valuable tool for organizations to address these risks proactively through early identification, implementation of monitoring controls, continuous improvement, and alignment with corporate strategy. The proper implementation of an OEMS supports organizations in achieving operational excellence, maintaining results, ensuring the protection of their employees and the environment, and reinforcing the sustainability and quality of their operations [3].
The control stage compares actual execution with planned execution, seeking compliance with the objectives defined in the previous stages. Effective control goes beyond pointing out deviations, since it becomes a means or guide to reorient action when necessary, ensuring the achievement of objectives. It is essential to understand that, with the definition of objectives, control is meaningful and that with actions its value as a tool for improving management is preserved. Therefore, all efforts must be focused on taking action so that all phases of risk management are developed appropriately to achieve the expected results [8,9].
In monitoring control, previously defined risk limits are used to assess an organization’s performance. Via a matrix detailing risks, key performance measures, and limits, top management can verify whether the risks align with the established tolerances. This process promotes conversations about strategic adjustments and reviews of decisions and should also be seen from a proactive perspective where resilience to future changes and disruptions is strengthened. Effective monitoring controls include (i) key performance indicators, (ii) audits and compliance checks, (iii) data analysis and reporting, and (iv) a risk register [7]. The related literature on risk treatment highlights the need for sustainable approaches to risk management from academic, professional, and governmental perspectives. The risk treatment strategy, which focuses on reducing the probability or impact of risks, stands out as crucial in managing unavoidable situations or situations beyond the direct control of organizations. The effective implementation of specific measures is the key to achieving successful risk treatment [10,11]. In this context, ensuring the effective operation of the OEMS in organizations begins with planning to mitigate risks and sub-risks, followed by monitoring control to ensure the correct implementation of planned activities. This provides transparency and accountability, which allows for real-time adjustments.
Organizational risk management focusing on sustainability often goes unnoticed in organizations despite representing significant importance to their operation, so the necessity of developing a solid methodology to assess and prioritize risks is evident. In the current dynamics, there is a growing trend towards sustainability, so evaluating organizational risks with a focus on sustainability provides an excellent decision-making tool. Sustainability assessment is a topic that has become very popular. Its objective is to provide decision-makers with a comprehensive assessment of sustainability [12].
Additionally, it is essential to highlight the importance of the 17 Sustainable Development Goals (SDGs) proposed by the United Nations; these goals focus on a master plan to achieve a sustainable future for all. The research by Heras-Saizarbitoria et al. (2021) [13], when referring to the integration of the Sustainable Development Goals (SDGs) in corporate sustainability reports, highlights a remarkable growth trend. In their research, most companies analyzed showed a lack of transparency in addressing their overall objective for or motivation towards the SDGs, with less than 10% of cases highlighting them. This pattern could contradict expectations, considering the Global Reporting Initiative (GRI) principle of the materiality of information and the increasing incorporation of the SDGs into corporate sustainability reports. Additionally, it is noted that very few organizations explicitly acknowledged potential conflicts of interest and tensions in balancing the SDGs with corporate objectives. This perspective highlights the critical need to assess net impact to determine whether an industry contributes positively or negatively to social and development goals. For their part, Cernev and Fenner (2020) [14] emphasized the importance of the synergistic interaction of all SDGs to move towards desired outcomes and reduce levels of risk. They also highlight the complexity of connecting the SDGs given the many interactions involved. This view reinforces that collaboration among the SDGs by acting together is essential for the global system’s progress towards sustainable goals and the mitigation of increasing risks.
As highlighted previously, it is pertinent to use multi-criteria methods to reflect the complexity of the assessment for decision-makers to holistically address sustainability risks (economic, environmental, geopolitical, social, and technological) [15,16,17]. The proposed methodology starts from a characterization of risks and sub-risks supported by international organizations. Then, a group of experts in the area of interest is formed, and surveys are administered to assess these risks and sub-risks. Finally, multi-criteria decision-making techniques are applied to structure, order, and give meaning to the information gathered.
Different researchers have implemented the combined analytic hierarchy process (AHP)–decision-making assessment and testing laboratory (DEMATEL) model. Among them are the studies by Zheng, Shen, Zhou, and Lyu (2022) [18], where the authors evaluated risks associated with flooding, showing the importance of DEMATEL together with AHP to effectively identify those critical risk areas more effectively than with the fuzzy analytical hierarchical process (FAHP); by Gökler and Boran (2023) [19], who studied a supplier selection model and highlighted that the proposed combined AHP and DEMATEL model does not present any major effects due to subjective evaluations, as it was demonstrated to be a robust method in the case study; and Balsara, Kumar Jain, and Ramesh (2019) [20], who evaluated strategies to mitigate climate change in the cement industry based on the use of the integrated AHP and DEMATEL methods and proposed that the model can be applied to other industries in several countries. It is important to highlight that the study by Fargnoli et al. (2018) [21] shows the complexity from the point of view of accidents in the construction industry, which makes hazard analysis and safety management difficult. The proposed MCDM method integrates quality function deployment (QFD) and analytical network methods, which allows for correlating work activities, hazardous events, and potential consequences. This contributes to improved decision-making and reduces the misrepresentation of qualitative assessment criteria. Additionally, the research by Fargnoli, Lombardi, and Haber (2018) [22] presents a QFD-based safety methodology design focused on identifying and analyzing specific occupational hazards effectively. Extending QFD with Delphi methods and fuzzy logic reduces subjectivity and increases consistency in risk assessment. This approach is implemented and validated, demonstrating its effectiveness in the comprehensive and exhaustive analysis of occupational hazards and risks in the agricultural sector. The authors emphasize the need for validation in different contexts. These two studies propose innovative approaches to improve safety management by implementing MCDM methods. These studies were intended to determine the importance and/or relevance of their respective criteria. However, implementing this hybrid model depends exclusively on experts’ judgment. It is important to highlight that the related literature on the prioritization of organizational risks with a focus on sustainability is practically nonexistent. Due to this lack of information, it is pertinent to address and fill this knowledge gap.
In particular, according to Tzeng and Huang (2011) [23], selecting the members of a group of experts has a critical role due to the nature of the issues involved and the need to implement the appropriate multi-criteria decision-making (MCDM) technique. This need is based on the fact that the selected experts must have a deep understanding of the specific field of analysis, allowing them to effectively evaluate and weigh the multiple criteria involved in the decision-making. Sustainability professionals have a broad and highly accurate understanding of stakeholder expectations, potential risks and opportunities associated with sustainable development, and how best to avoid or take advantage of those opportunities. They work in collaboration with organizational risk management professionals with a focus on sustainability who have extensive knowledge and skills in identifying, assessing, and prioritizing risks; this allows them to address the risk by unifying efforts in a relevant way, as well as developing and implementing responses and monitoring the effectiveness of the process of prioritizing them [7].
As studied by Moravčík et al. (2013) [24], the analysis of perspectives via the use of multi-criteria decision models and methods highlights that they will be of interest for generating the proposal of new indicators that consider decision-making, taking into account the benefits of the identified opportunities and their associated costs, as well as the approach to organizational risks with a focus on sustainability that allow their prioritization and related controls to be identified. As highlighted above, since there are several sources of uncertainty, it is appropriate to use MCDM methods where the opinions of the selected group of experts provide the necessary information to reflect the complexity of the evaluation for decision-making. In this way, organizational risks with a focus on sustainability are covered holistically, and thus, the most assertive solution is chosen among the options based on both qualitative and quantitative factors, ensuring high accuracy and reliability of MCDM methods in solving real-world problems [15,25,26].
As highlighted above, this study is divided into five parts: (i) a definition of the methodology to be developed throughout the research; (ii) an analysis of the characterization of organizational risks and sub-risks, with a focus on sustainability; (iii) elaboration and development of a survey to prioritize risks through DEMATEL and five surveys to prioritize sub-risks through AHP; (iv) data processing using the theoretical equations of the proposed MCDM methodologies (DEMATEL and AHP), resulting in the prioritization of risks and sub-risks, respectively; and finally, (v) the development of a sensitivity analysis to reduce uncertainty and provide stability in the results.
2. Proposed Methodology
Organizations seek to implement a sustainable development model, for which it is important to identify, evaluate, prioritize, and control the interactions between organizational risk factors, with a focus on sustainability. To carry out this process, it is necessary to recognize the risks and how they can be prioritized. Starting from this, organizations can define the controls that they need to implement according to their respective economic sectors. Similarly, value judgments must be incorporated into the risk assessment to verify and analyze the proposed model along with the results obtained, thus finding the appropriate controls to avoid the materialization of risks [16]. The methodology proposed for this case study is explained below:
Global reports provide an initial collection of risks, which are used as a starting point for the characterization of organizational risks with a focus on sustainability. For example, in the “Enterprise Risk Management: applying enterprise risk management to environmental, social and governance-related risks” report, three risks are considered (environmental, social, and governance). In the “Global Sustainable Development Report 2019: The Future is Now—Science for Achieving Sustainable Development,” five risks are framed, as in the Global Risk Report, so the proposed characterization ensures that all sub-risks are duly considered both in the characterization process and when applying the DEMATEL and AHP models, which allows an analysis to be elaborated in greater detail and with a global perspective for different organizational cases, since any risk and sub-risk can have a significant impact on the organizations where this model is applied.
Following the definition of risk typologies and risk subcategories (sub-risks), a group of experts is established. This is a decisive step, as they play a crucial role in applying the AHP method, which is an approach that helps to make complex decisions in cases where MCDM techniques are applied. By building a solid group of experts, the quality and reliability of the results obtained are ensured. First, it is essential to identify experts with knowledge in the specific area being evaluated, as they must understand the criteria and sub-criteria involved and be up to date on the relevant literature, be impartial, and have no conflicts of interest that could bias the decision-making process. It is essential to have a diverse range of perspectives with opinions from experts with different backgrounds, approaches, and experiences, which enriches the assessment and provides a global view of the situation [23].
Starting from a macro view of society, many problems must be addressed from the perspective of group decisions where two approaches exist: The first is a convergent approach that is descriptive and focused in nature and dedicated to examining the causes of the problem in detail, making use of systematic methods and techniques to discover pragmatic solutions. It is often referred to as a rationality-based approach to problem solving.
Furthermore, the second is a divergent approach characterized by its sensitivity and imagination; it seeks to represent varied perspectives. It uses innovative and creative techniques, promoting extensive feedback from the parties involved in the problem [27,28].
The problems related to group decision-making (GDM) focus on the ability to generate collective solutions from the combination of the individual opinions of the participants, whether they are experts or consulted stakeholders.
This process involves a complex dynamic in which individual perspectives are intertwined, and the interaction between them can be crucial to reaching an optimal decision. It is important to note that GDM addresses not only the consolidation of individual opinions but also the understanding of the relationships that exist between those opinions. Considering these interpersonal dynamics is essential to achieving an effective approach to collective decision-making and ensuring that the resulting solutions are representative and appropriate to the challenges at hand. The reduction aggregation process is defined by Equation (1).
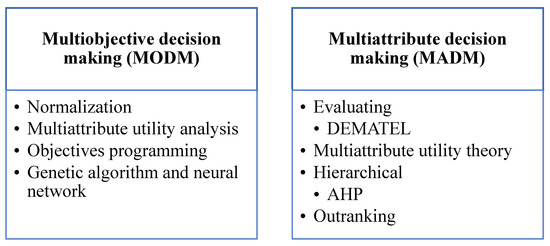
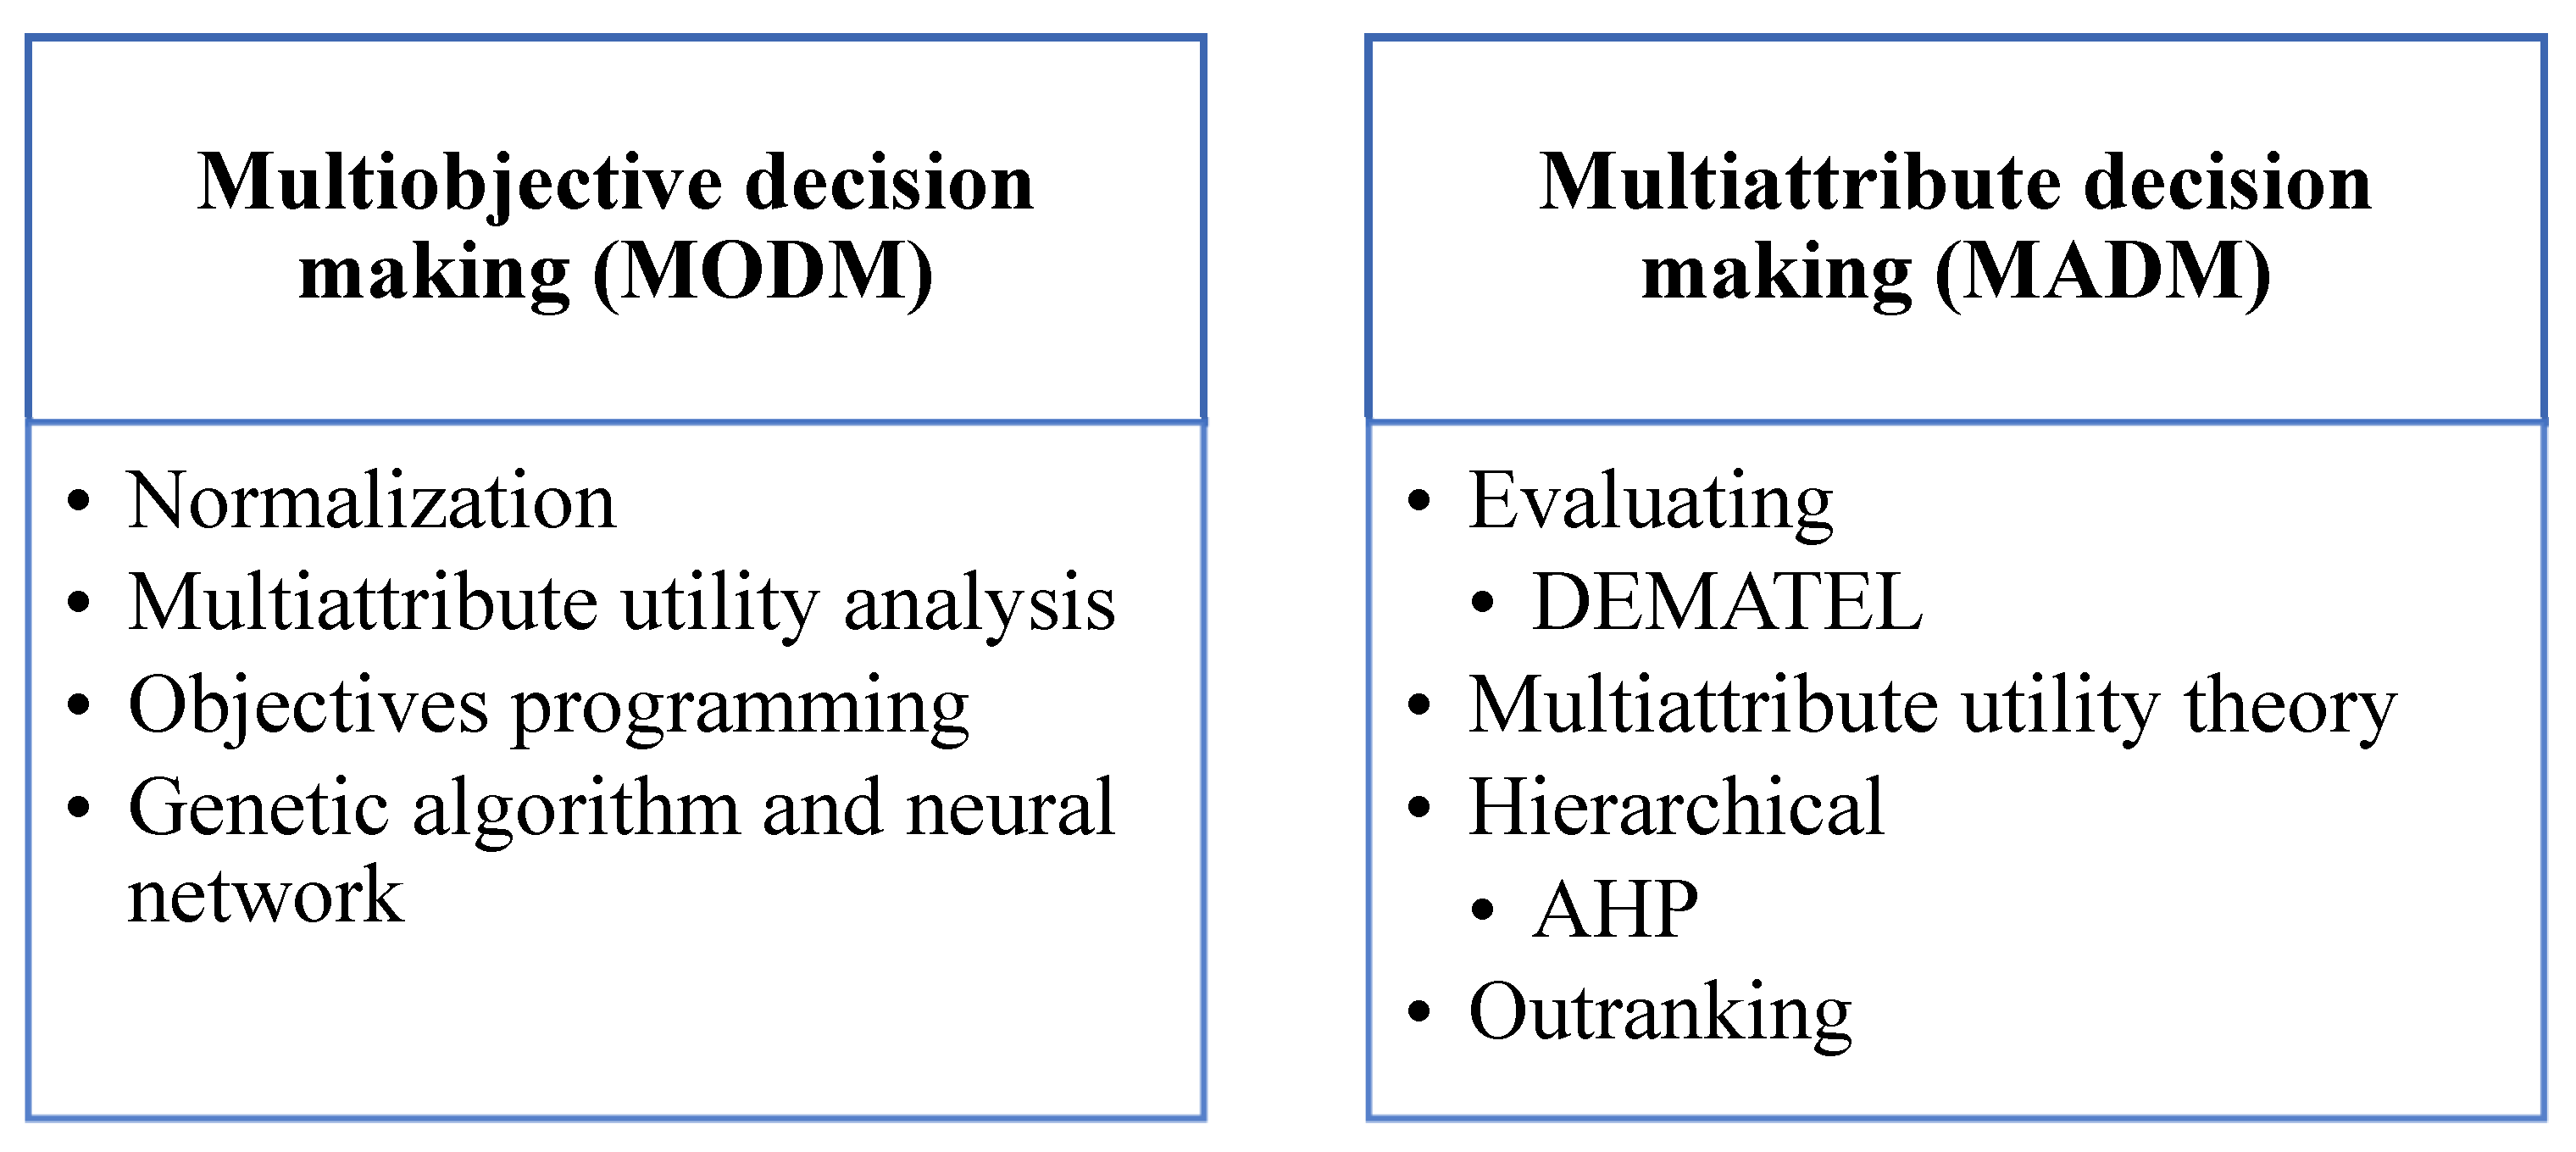
where the set op = {op1, op2,..., opn} gives rise to the opinions generated by the n participants—in this case, the experts or stakeholders consulted in making essential decisions for the problem, resulting in the collective preference opc [29]. Decision-making regarding organizational risks with a focus on sustainability involves complex interactions between the different stakeholders, requiring the participation of all stakeholders; therefore, using MCDM techniques positively supports decision-making [30]. This is completed in the presence of multiple criteria, especially those of tactical and strategic origin, as multiple conflicting objectives and attributes are involved, which provides support to decision-makers who are challenged by numerous and conflicting alternatives. Figure 1 shows the general approaches to MCDM [23,31].
S (op1, op2,..., opn) = opc,
Figure 1.
Approaches to multi-criteria decision-making [32,33].
For this research, it was proposed to implement the MCDM method, focusing on multi-attribute decision-making models (MADM), which allows preferential decisions to be made about the available alternatives, which are generally multiple, usually conflicting attributes. That is, MADM models are applicable in cases such as evaluations, prioritizations, and selections, which allowed for its implementation for the development of this case [31]. The MADM models selected were (i) DEMATEL for risk prioritization, a technique that considers the specific characteristics of specific topics, confirming the interdependence between variables/attributes and generating a restriction in the relationship that reflects these characteristics addressed through an essential system and a development trend [34] and (ii) AHP, with the objective of prioritizing sub-risks. AHP is a powerful approach to multi-criteria decision-making that breaks down a complex problem into a hierarchical structure of criteria and alternatives [35]. The AHP model is a very useful technique in the systematization and structuring of decision-making since it uses pairwise comparisons based on a numerical scale. According to Dos Santos et al. (2019) [30], several studies have implemented AHP models both in isolation and in combination with other techniques for decision-making on topics related to sustainability; in the model, a weight is established for the study criteria through the creation of a comparison matrix to identify the frequency at which one criterion is more important than another [36].
Finally, a sensitivity analysis is an essential tool for assessing the stability of priorities in the decision-making process. Since weightings are often dependent on subjective judgments, it is necessary to test the prioritization in terms of variations in the weightings of the different criteria. This method provides valuable insight into the stability of the prioritization. If the prioritization is highly sensitive to minimal changes in the criteria weightings, it indicates the need to review the criteria weightings carefully. In addition, it is advisable to consider the inclusion of additional criteria, as the prioritization may be highly susceptible to being influenced by a set of criteria that is currently weak in its discriminating capacity. The application of a sensitivity analysis provides modelers and decision-makers with a guide to identifying the inputs that most influence the results [37,38,39].
3. Results
The methodology introduced in Section 2 is applied below.
3.1. Characterization of Organizational Risk with a Focus on Sustainability
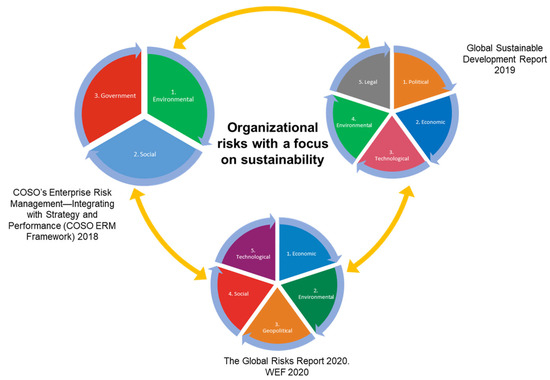
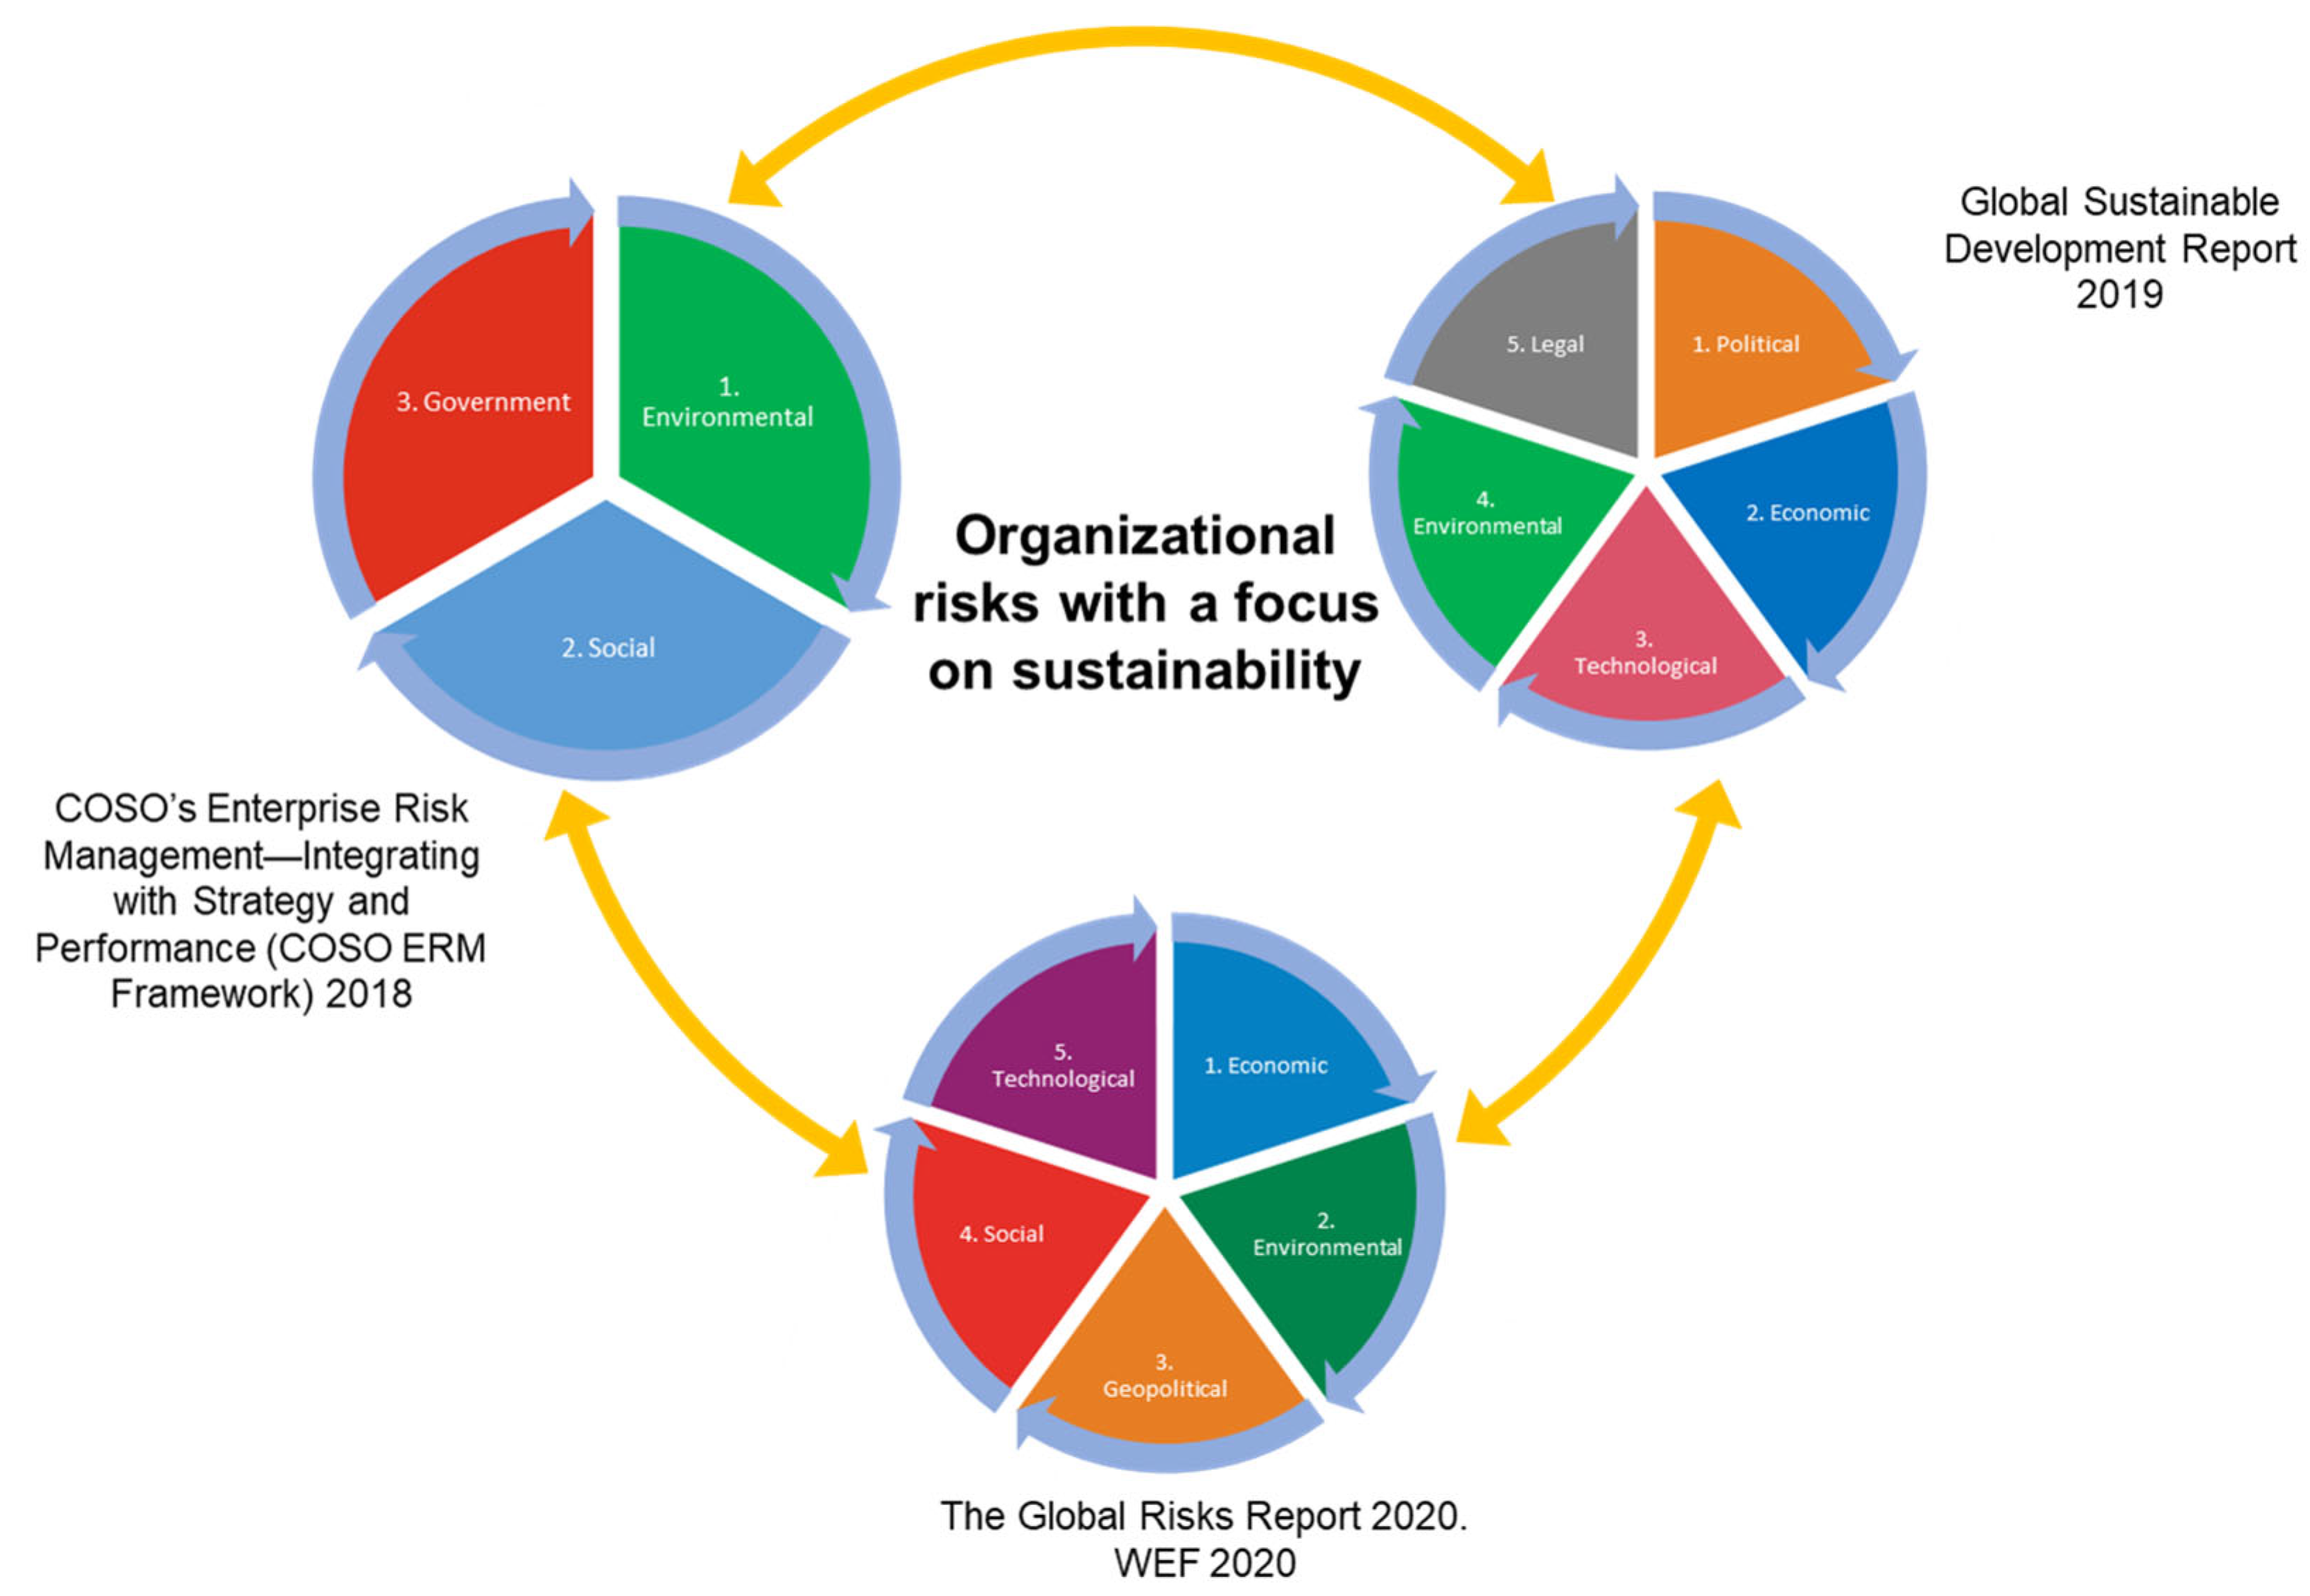
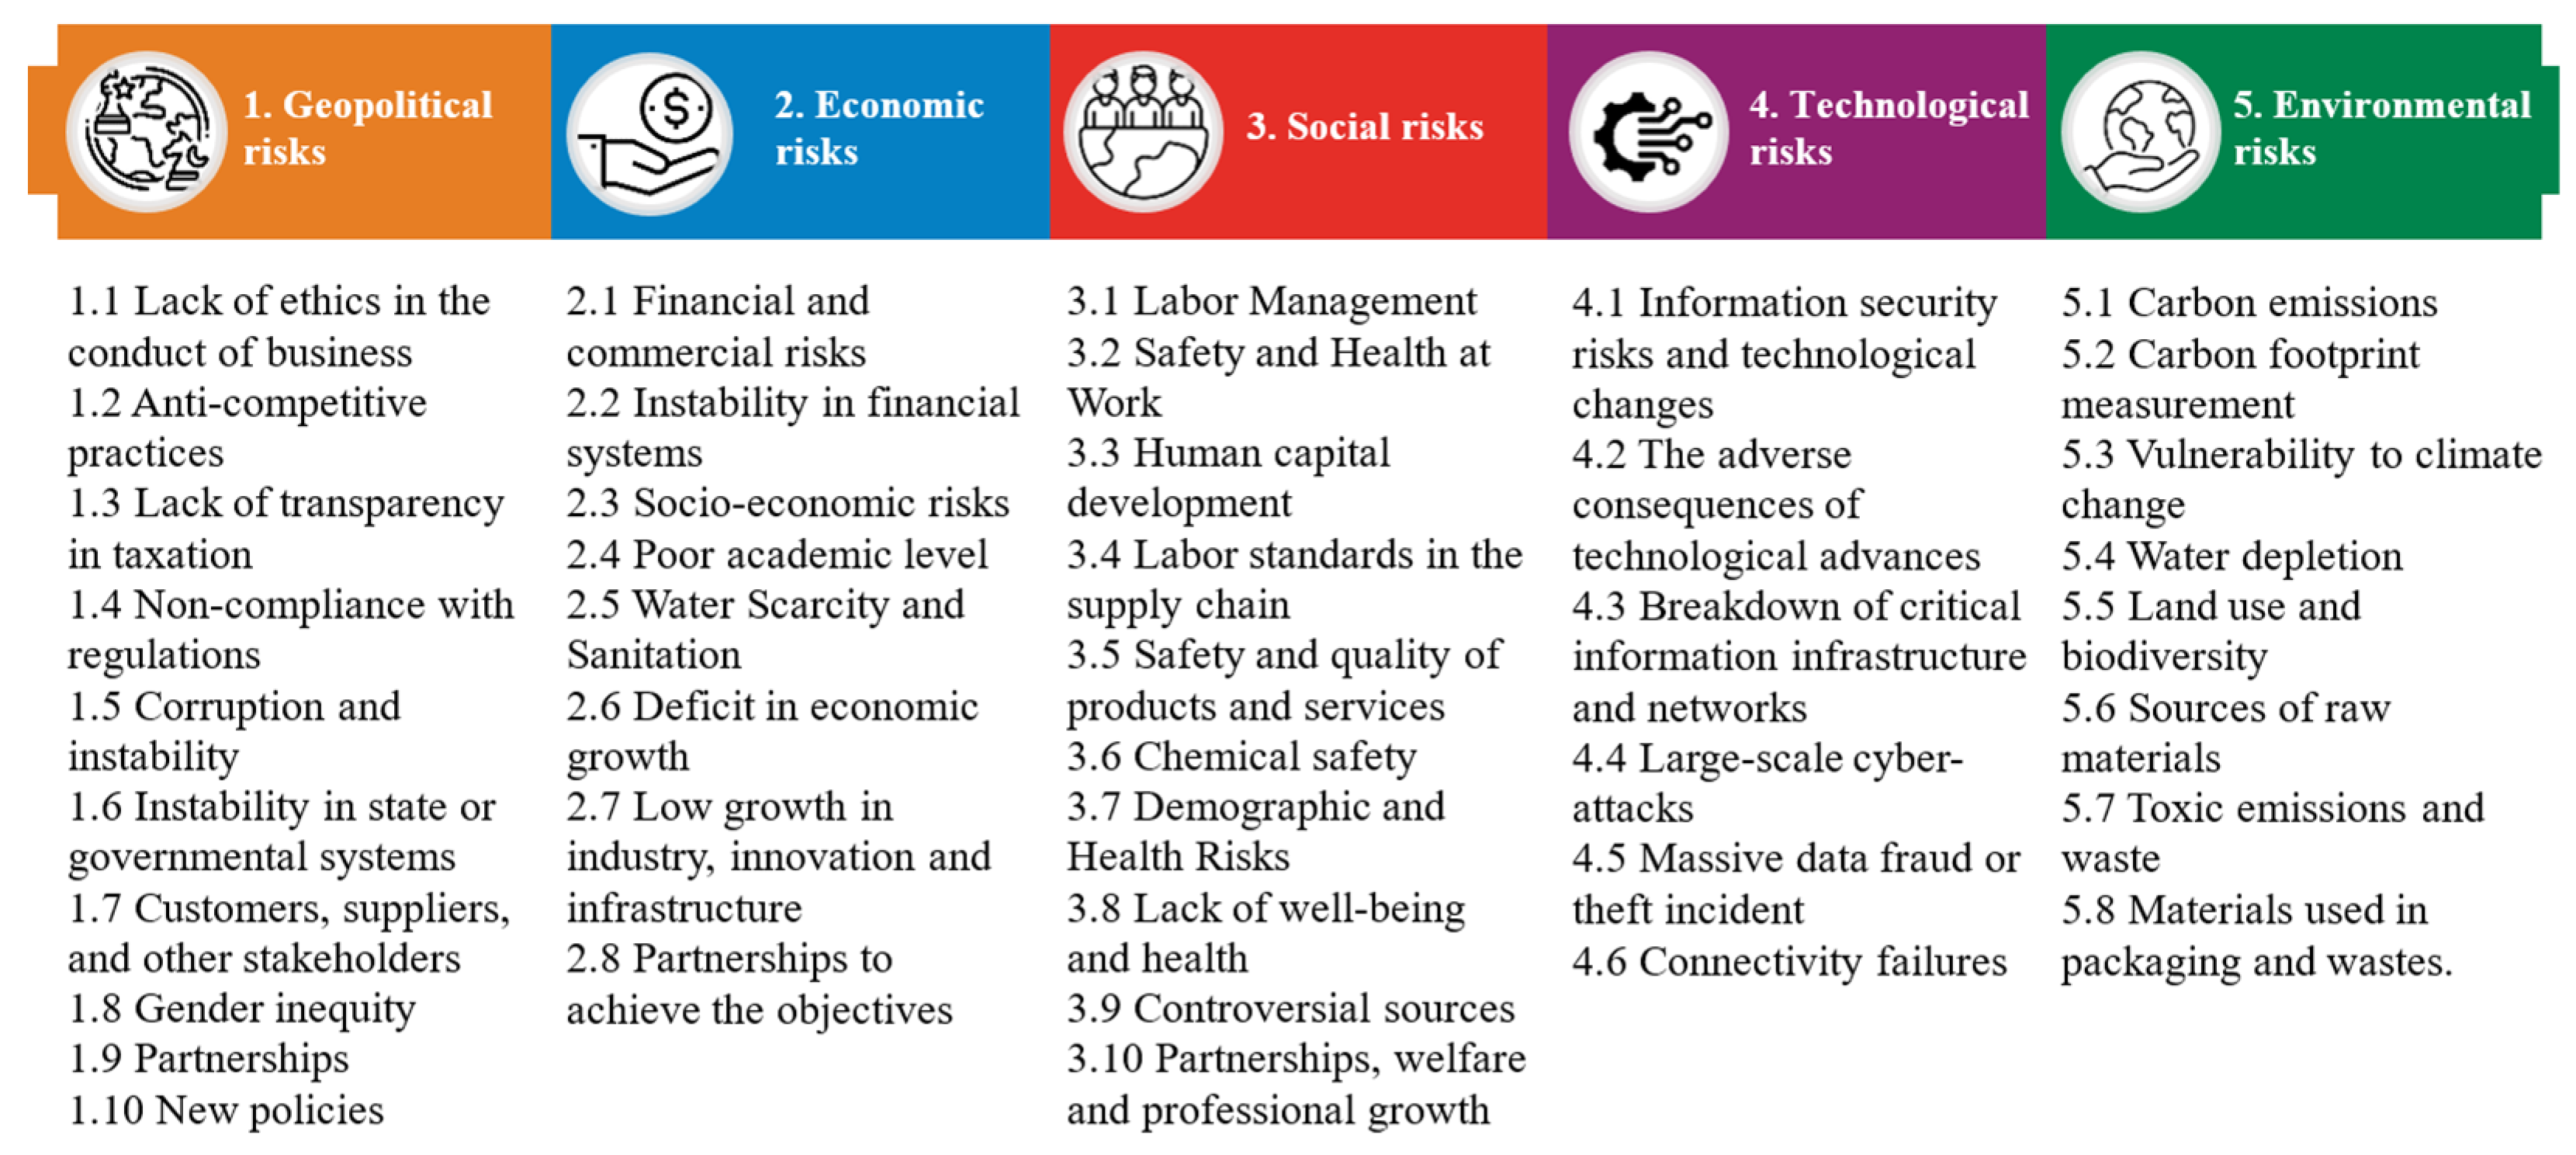
The reports by the WBCSD and COSO (2018) [7], the independent group of scientists appointed by the secretary general (2019), and the WEF (World Economic Forum) (2022) [25] (see Figure 2), were used as a basis for the characterization of organizational risks with a focus on sustainability. Likewise, objectivity was supported by international standards related to ESG assurance [4]. The five typologies of organizational risks focused on sustainability, with their respective associated sub-risks, are shown in Figure 2 and Figure 3.
Figure 2.
Correlation of organizational risks with a focus on sustainability.
Figure 3.
Proposed characterization of typologies of organizational risks and sub-risks with a focus on sustainability.
It is important to note that the correlation of risks shown in Figure 2 started with identifying the most common risks reflected in reports based on ESG (environmental, social, and governance) principles. Additionally, Figure 3 provides the proposed characterization of organizational risks focused on sustainability, which were the essential pillars in the development of this research.
After reviewing each of the organizational risks focused on sustainability, a segmentation proposal was suggested as follows: sub-risk ID and specific sub-risk ID for each of the risks defined in this case—geopolitical, economic, social, technological, and environmental (see Table 1)—taking into account that the reports by the WBCSD and COSO (2018) [7], the independent group of scientists appointed by the secretary general (2019) [40], and the WEF (World Economic Forum) (2022) [25] were used. In the state-of-the-art research, there was no evidence of a study showing a global reference framework aligned with the previously mentioned reports. Therefore, the details of this characterization corresponding to the sub-risk ID and the specific sub-risk ID can be consulted in annexes A1 to A5. It is important to emphasize that the organizational risk characterization with a focus on sustainability did not have prior prioritization, but this was conducted through the DEMATEL method. This study provides a general methodology for organizations to obtain an adequate prioritization of their organizational risks with a focus on sustainability. The results of the case study are shown below, taking into account that the organizations surveyed belong to different economic sectors.
Table 1.
Details of the proposed characterization of the sustainability risks.
3.2. Group of Experts
The selection of the members of the group of experts consulted is very relevant to the definition and evaluation of the problem posed. In this case, the problem was organizational risks with a focus on sustainability, and the MCDM technique was considered [23]. Experts can be selected based on their experience, the quality of their work, their recognition, or suggestions from group members or others. However, even the most qualified expert may have only some knowledge [41].
The group of experts for this research comprised profiles of high-level executives from organizations in the service sector, auditing and consulting firms, the oil and gas sector, the manufacturing sector, and the financial sector. The professionals consulted for this study included CEOs, department directors, and senior managers at the country level, with the diverse professions described in Table 2. As they had several years of experience in the execution of their professional activities, the answers obtained were compiled based on their professional judgement and according to their experience in the materialization of risks in the industries in which they worked. This group was formed by considering that the professionals were experts in organizational risks with a focus on sustainability (economic, environmental, geopolitical, social, technological) and corporate risk factors in business governance. When analyzing each risk or sub-risk, a different probability and impact assessment was obtained depending on the expert consulted and the type of industry to which he or she belonged. However, with the selection of this group of experts, the purpose was to obtain different levels of prioritization of the five typologies of sustainability risks consulted using the DEMATEL methodology; in the case of AHP, the purpose was to obtain the prioritization of the sub-risks in order to obtain a holistic overview of the methodologies applied in this research. Similarly, the previously mentioned professionals were leading decision-makers in the organization of this research and ultimately responsible for managing its risks. It is important to mention that the developer of the proposed DEMATEL and AHP methods is a professional in industrial engineering, a specialist, and has a master’s degree. They have extensive experience in the development of models associated with MCDM models and were in charge of processing the data collected through the 1AK survey (one-click survey), which collected the opinions of the experts consulted.
Table 2.
Group of experts.
Surveys were designed to consolidate the responses of the group of experts associated with the prioritization of organizational risks with a focus on sustainability, for which it was decided to use the 1AK (one-click survey) tool. Taking into account the area of expertise of the professionals surveyed, information was collected with the appropriate guidance according to their level of exposure and risk management in their daily work. The formulated surveys asked the group of experts to select the level of influence and relevance of the characterized organizational risks and sub-risks with a focus on sustainability, taking into account the scale in Table 3. The respondent indicated the level that he/she considered to be in accordance with the paired comparison first between the risks for the DEMATEL case and subsequently between the sub-risks for the AHP case.
Table 3.
Linguistic comparison scale for DEMATEL and AHP methods.
The DEMATEL and AHP methods were used to solve problems in GDM. This began with the collection of the opinions of each expert. Each expert assigned ratings to the options considering the linguistic scale (see Table 3), and the data were collected through the 1AK survey (one-click survey). Once the survey was completed, the comparison matrix was constructed, which was the result of comparing the risk typologies (geopolitical, economic, social, environmental, and technological) with each other. At the same time, a comparison of sub-risks belonging to the same risk typology was carried out. These comparisons provided values that indicated relative preferences, reflecting the importance of one element compared to another. Finally, matrix calculations were used to obtain the vectors and eigenvalues, which allowed the relative weightings of criteria and options to be determined, generating as a result the hierarchy of the risk typologies and the hierarchy of the sub-risks of the same typology and reflecting the collective opinions of the group of experts. This approach provided details on the entire process generated during decision-making based on the data obtained.
It should be clarified that the data were provided by the group of experts through a process of mutual evaluation. By means of the paired survey, the experts used the linguistic comparison scale to assess the degree of mutual influence between the different risk typologies. Additionally, they assessed the mutual influence relationships between the sub-risks belonging to the same typology. These data were collected and used to construct matrices that reflected the influencing relationships between risk typologies and respective sub-risks. Within this framework, to carry out the appropriate aggregation of the information collected with the survey, the construction of individual comparison matrices was carried out as follows:
For each pair of factors (i) and (j), where i and j represent the risk and sub-risk typologies (of the same risk typology), respectively, a comparison matrix (Cij) was constructed for this purpose using the values assigned by the 79 experts:
Each element Cij was computed through the utilization of the geometric mean method (GMM), which involved the opinions of the 79 experts [42]:
where p refers to the assessment of each of the experts. In accordance with Equation (3), this process was iterative, comparing the different types of risks and sub-risks. The next step corresponds to the summation of all the individual comparison matrices to obtain a total matrix .
Finally, the total matrix () was normalized by dividing each element by the sum of the elements in its row in order to prepare the information to perform the analysis in the AHP and DEMATEL methods.
This approach allowed the experts to provide their opinions in the form of scores in a structured manner, facilitating the risk hierarchy. The following sections explain the development of the proposed methods in greater detail.
3.3. Application of DEMATEL
This method represents the interrelationships and effects between cause-and-effect groups by obtaining a visual representation according to the opinions of the surveyed experts [43,44]. The method can be divided into the following steps:
Step 1: Develop an initial matrix described by scores (see Table 3). The described scales of influence should be established as follows: 0 (no influence), 1 (low influence), 2 (medium influence), 3 (high influence), and 4 (very high influence). Ask the group of expert respondents to make paired comparisons according to the influence and direction between the criteria—in this case, the five characterized risks (see Figure 3). Once these paired comparisons are obtained, the direct relationship matrix is constructed, in which aij is denoted as the degree of influence on the criterion that i has on j; then, the average matrix is obtained [45].
Table 4.
Initial influence matrix.
Step 2: Normalize the relationship matrix, which is denoted by M and is obtained with Equations (6) and (7), taking into account that all the main elements of the diagonals are equal to zero [45,46].
Based on the initial direct ratio matrix in Table 4, the normalized direct ratio matrix in Table 5 is obtained using the DEMATEL model, considering Equations (6) and (7).
Table 5.
Normalized direct relationship matrix.
Step 3: To obtain the total ratio matrix once the normalized direct ratio matrix M is obtained, derive Equations (8) and (9), where I is denoted as the identity matrix (see Table 6) [45,46].
Table 6.
Total relationship matrix.
Step 4: To calculate the dispatcher group and receiver group, use the values denoted as (D − R) and (D + R), where R is denoted as the sum of the columns and D is the sum of the rows in the matrix S, as described in Equation (10). The level of influence for others and the level of relationship with others are defined as shown in Equations (11) and (12), respectively [34,45,47]. For some of the criteria with positive values (D − R), the conclusion is that they have a more significant influence on themselves and therefore have higher priority. These are called dispatchers, and others with negative values (D − R) receive greater inclusion by others. Therefore, it is concluded that they have lower priority and are called receivers. Thus, the (D + R) value indicates the degree of relationship of each criterion with the others, and criteria with higher values of (D + R) and lower values of (D + R) have less of a relationship with the others [45,46].
The total relationship matrix described in Table 6 is obtained using Equation (8) (Appendix B.1). Then, by applying Equations (10) and (11), the diagram describing influence and relevance is calculated using the data set (D + R, D − R).
Step 5: Set a threshold value, obtain the impact digraph map, and set a threshold value for the level of influence. For the elements whose influence level in the S-matrix is higher than the threshold that can be chosen and converted into the impact digraph map, the threshold value should be defined by the decision-maker or expert group [48]. To finally obtain the impact digraph map, the horizontal axis (D + R) and vertical axis (D − R) should be set according to the data obtained with (D + R, D − R) [47].
All organizational risks with a focus on sustainability described in the characterization, such as geopolitical, economic, social, technological, and environmental risks, with a positive value (D + R) are in the relevant group, whereas risks with a negative value (D − R) are in the influence group, which means that those risks are affected or influenced by other factors, adjusting to the actual conditions. Finally, the weighting matrix is created. Table 7 shows the prioritization of organizational risks with a focus on sustainability.
Table 7.
Final DEMATEL weightings for each set of risks.
However, as mentioned in Section 3.1, in order for organizations to provide global assurance of all their organizational risks with a focus on sustainability, it is important to take into account the five risks characterized in Figure 3, as it allows the most common risks to be highlighted from a holistic perspective and from a global level and provides a complete overview of the essential controls that mitigate their materialization by the most representative changes in the global scenario. In addition, it is important to mention that the risks were studied with DEMATEL from an assessment perspective that was oriented to the organization of this case study to understand its main organizational risks with a focus on sustainability. For this reason, in Section 3.4, an AHP model is developed with the five risks studied throughout this research in order to show their globality.
3.4. Aplication of AHP
The essential steps of the AHP model according to Saaty (1980) [35] are described below, together with the key equations and formulas involved in its implementation. Taking into account the results obtained with the DEMATEL model, an AHP model was applied to prioritize the sub-risks corresponding to each risk, as defined in Table 1. To identify and prioritize the sub-risks according to their potential impact on the organization and their probability of occurrence, the AHP model was applied, taking into account Equations (13) to (16).
Step 1. Definition of hierarchy: The first stage in the application of the AHP involves the construction of a hierarchy representing the criteria and alternatives involved in the decision. If there are “n” criteria, the hierarchy will consist of “n + 1” levels, including the top level for the overall goal and subsequent levels for the criteria and alternatives. The formula for calculating the total number of elements in the hierarchy is given by:
where N is the total number of elements in the hierarchy (the characterized risks) and mi is the number of alternatives at level i (each of the characterized sub-risks).
Step 2. Criteria comparison matrix (CM): The experts compared the relative importance of the criteria, in this case the characterized sub-risks (see Figure 3), and positive values were assigned in the criterion comparison matrix CM, a square matrix of size n × n. Each element CM(i,j) represents the importance relationship between criteria i and j. For example, if CM(i,j) = 3, it means that criterion i is three times more important than criterion j.
Table 8, Table 9, Table 10, Table 11 and Table 12 show the comparison matrices created by the experts, where they compared the relative importance of each of the risks and their respective sub-risks and assigned values to the comparative relationships. The comparison matrix of each expert was then averaged (see Appendix B.1, Appendix B.2, Appendix B.3, Appendix B.4, Appendix B.5 and Appendix B.6). These values represent the importance of one criterion compared to another. Comparisons were made using a numerical scale, e.g., 1 to 9, where 1 means equal importance and 9 means that one is extremely more important. These comparisons were recorded in a CM matrix, which is a symmetric square matrix.
Table 8.
Average geopolitical comparison matrix.
Table 9.
Average economic comparison matrix.
Table 10.
Average social comparison matrix.
Table 11.
Average technological comparison matrix.
Table 12.
Average environmental comparison matrix.
Step 3. Calculation of eigenvectors and eigenvalues: The next step involves calculating the eigenvectors and eigenvalues of the CM matrix. To do this, the eigenvalue problem is solved:
where v is the eigenvector and λ is the corresponding eigenvalue. Then, the eigenvector v is normalized by dividing each element by the sum of the elements of the vector. The consistency ratio (CI) is calculated using:
where λmax is the maximum eigenvalue and n is the number of criteria.
Step 4. Alternative comparison matrices: For each criterion i, for this particular case, an alternative comparison matrix Ai was constructed. Similar to the CM matrix, experts compared alternatives based on criterion i and assigned positive values in Ai.
Step 5. Calculation of weightings: The weightings of the criteria are calculated by averaging the normalized eigenvectors of the Ai matrices. The normalized weightings wi of the criteria are obtained by:
where vij is the element i,j of the normalized eigenvector vi.
Step 6. Verification of consistency: The consistency ratio (CR) is calculated. This ratio is designed so that values exceeding 0.10 are a sign of inconsistent judgments; it is likely that in these cases the decision-maker will want to reconsider and modify the original values of the paired comparisons matrix. Consistency ratio values of 0.10 or less are considered to signal a reasonable level of consistency in paired comparisons. In order to obtain the total priority of all network elements, the total score for each criterion is calculated, with the highest being considered the best option. Table 13 shows a compilation of the priority matrices for each of the organizational risks with a focus on sustainability, including the respective consistency indices (CIs).
Table 13.
Prioritization matrix and consistency index.
Step 7. Sensitivity analysis: Sensitivity analysis is an essential tool for assessing the robustness and stability of AHP model results. This section explores how sensitivity analysis is performed and how variations in the results are interpreted.
Step 7.1. Modification of comparison matrices: To perform the sensitivity analysis, the comparison matrices of criteria and alternatives are modified in a controlled manner. Each element of these matrices is adjusted by a certain percentage to reflect changes in the original comparisons.
Step 7.2. Recalculation of modified weightings and priorities: With the modified comparison matrices, the weightings and priorities of the criteria and alternatives are recalculated using the same procedure as in Step 1. This provides new results based on the modified inputs.
Step 7.3. Interpretation of the sensitivity analysis results: Variations in weightings and priors between the original and modified results are interpreted to assess the sensitivity of the AHP model. The main points to consider include:
- Sensitivity criteria: Identify the criteria showing the highest variations in weightings and priorities. These criteria are more sensitive to change and may require special attention in decision-making.
- Trends in variations: Analyze whether there are consistent trends in the variations of weightings and priorities. This can reveal how certain inputs affect overall results.
- Stability: Evaluate whether variations are acceptable and whether inputs changes lead to reasonable and consistent results.
4. Discussion
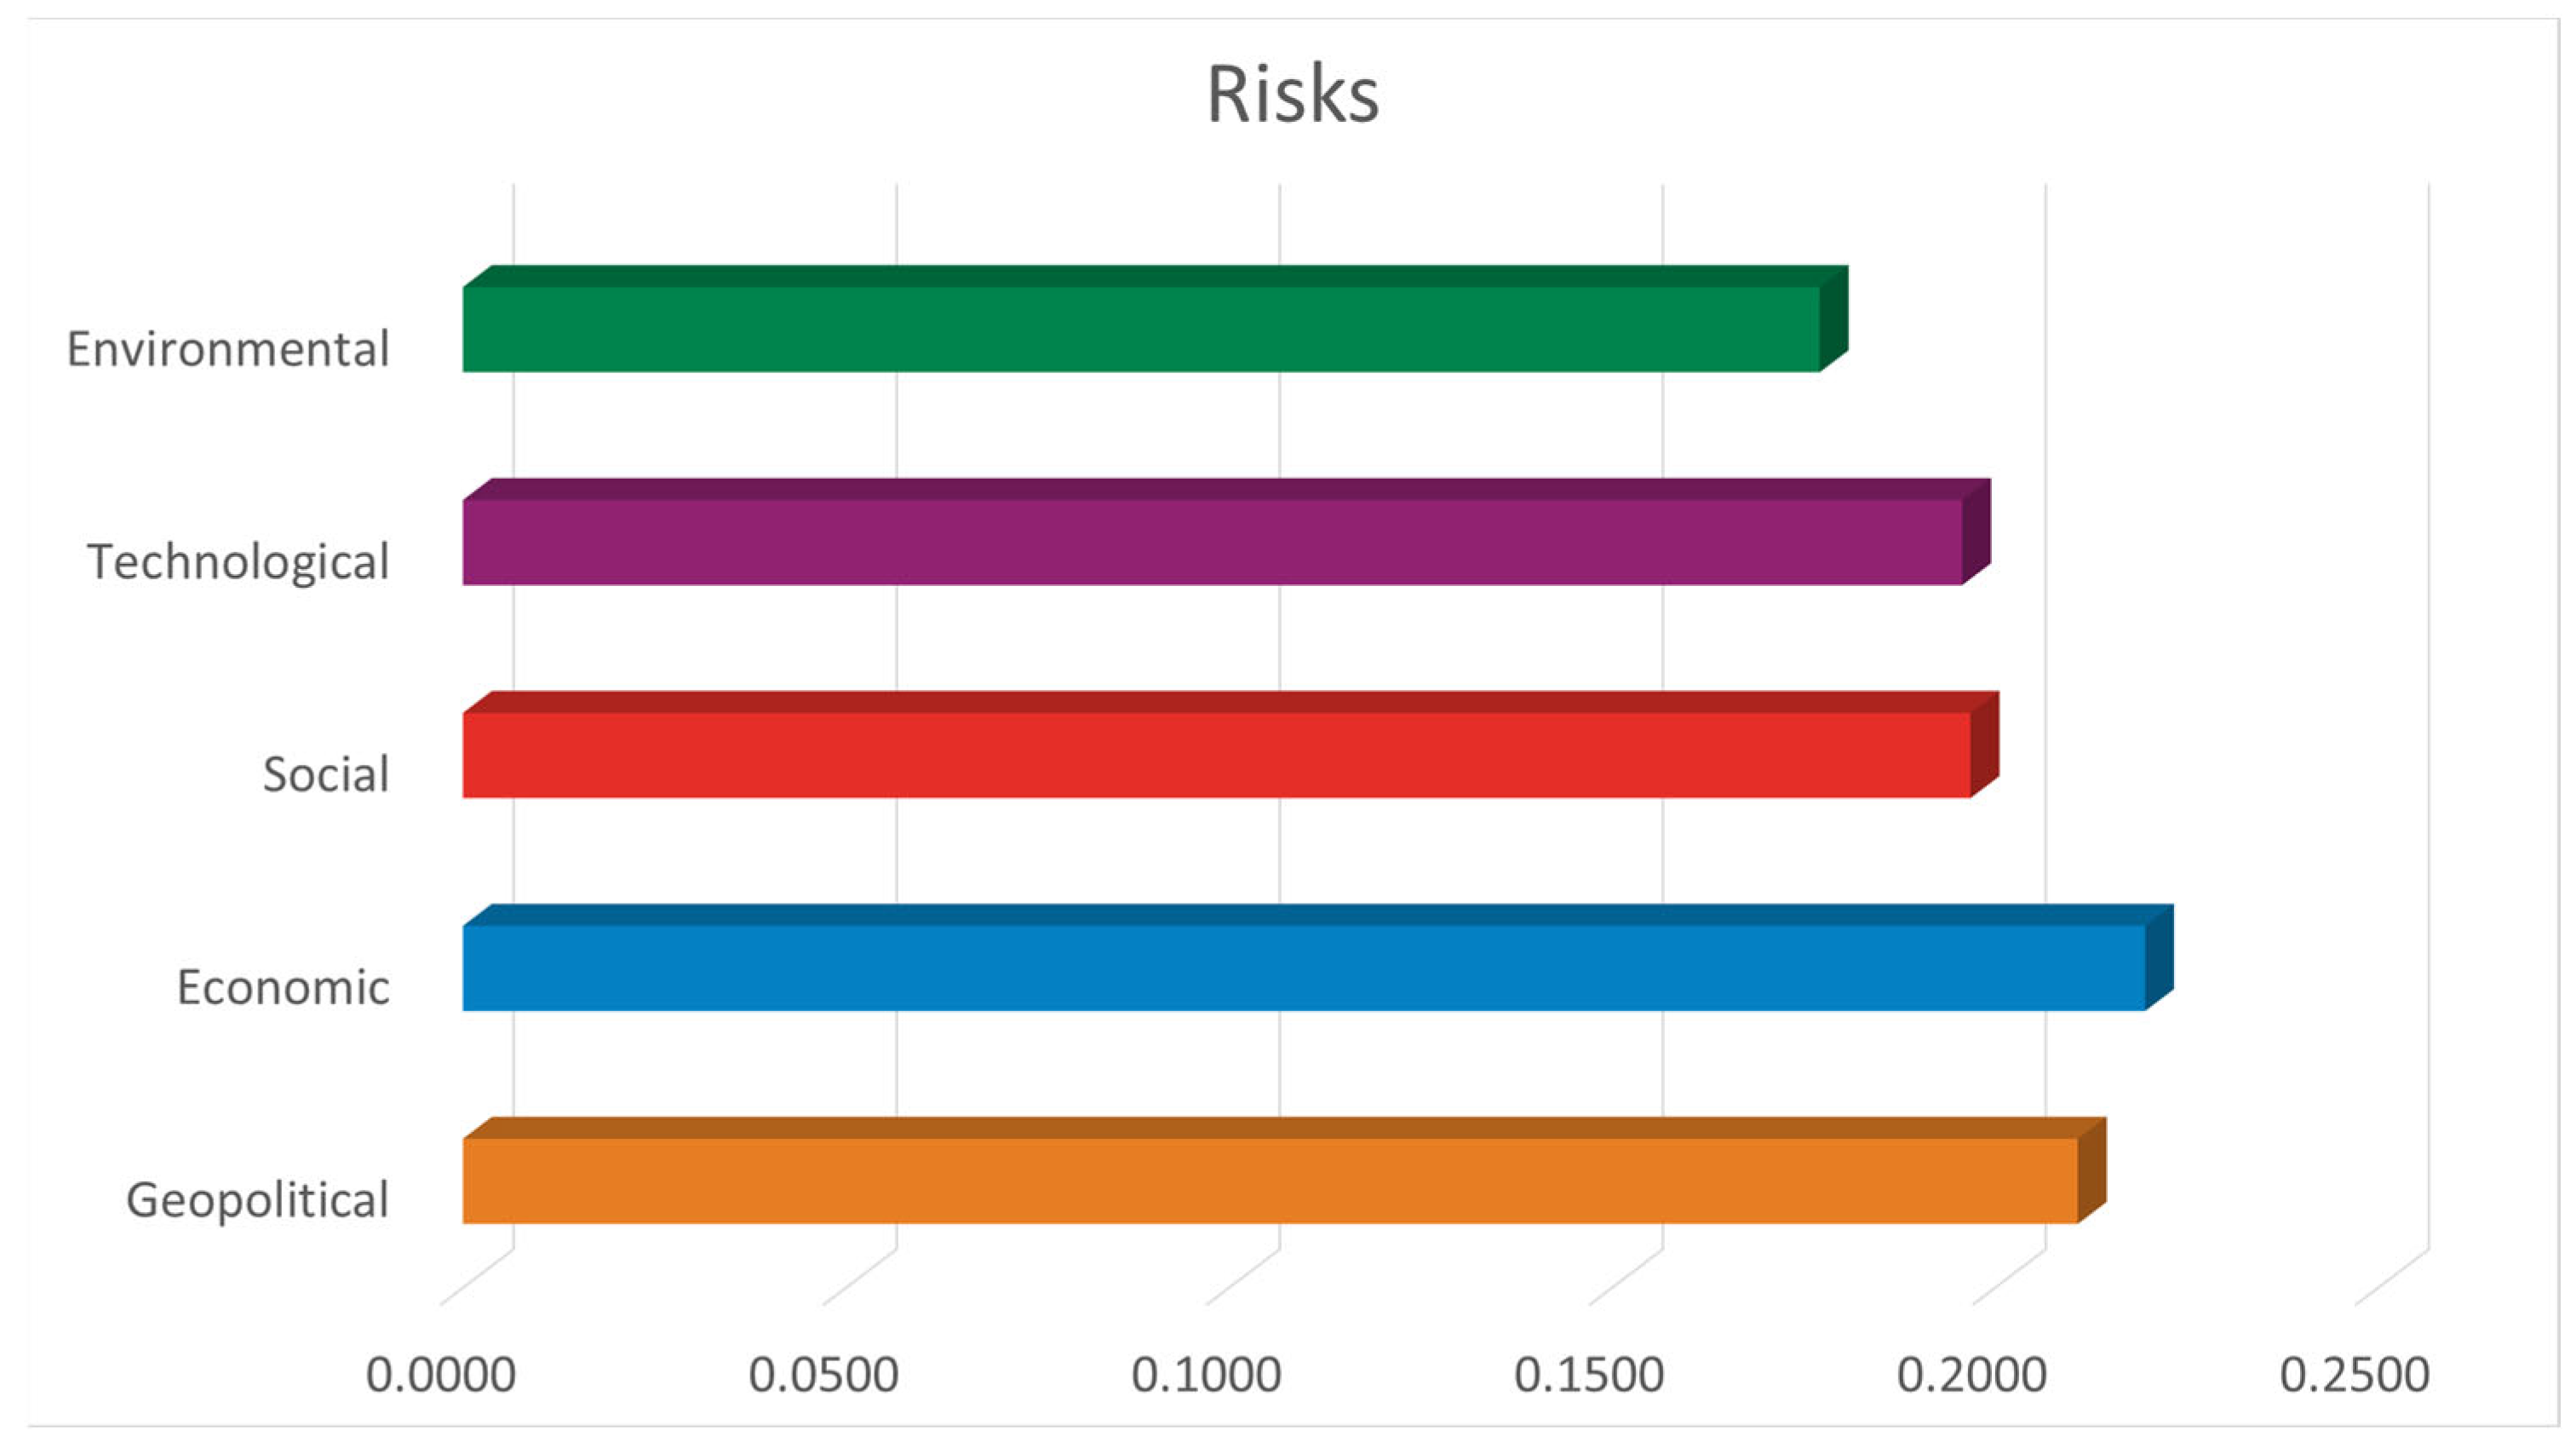
The results presented in this research, considering the characterization of the proposed organizational risks focused on sustainability and through the application of the DEMATEL method, show that taking into account the expert opinions consulted allowed for an analysis of the structure of the components of each of the geopolitical, economic, social, technological, and environmental risks in this case. As part of the presentation of the results, the final DEMATEL weightings for each risk typology were obtained, as shown in Figure 4.
Figure 4.
Weightings obtained with the DEMATEL method.
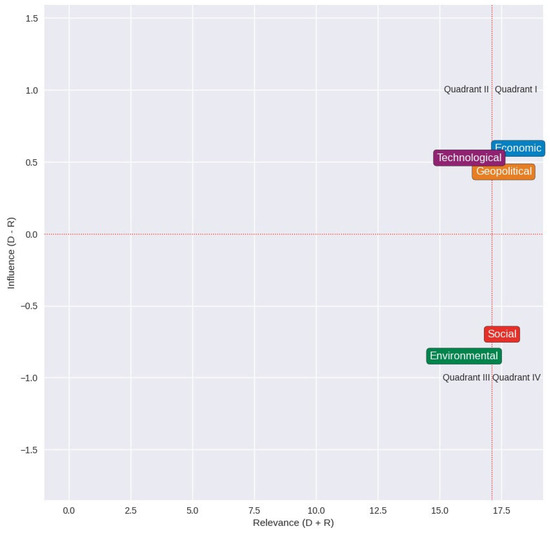
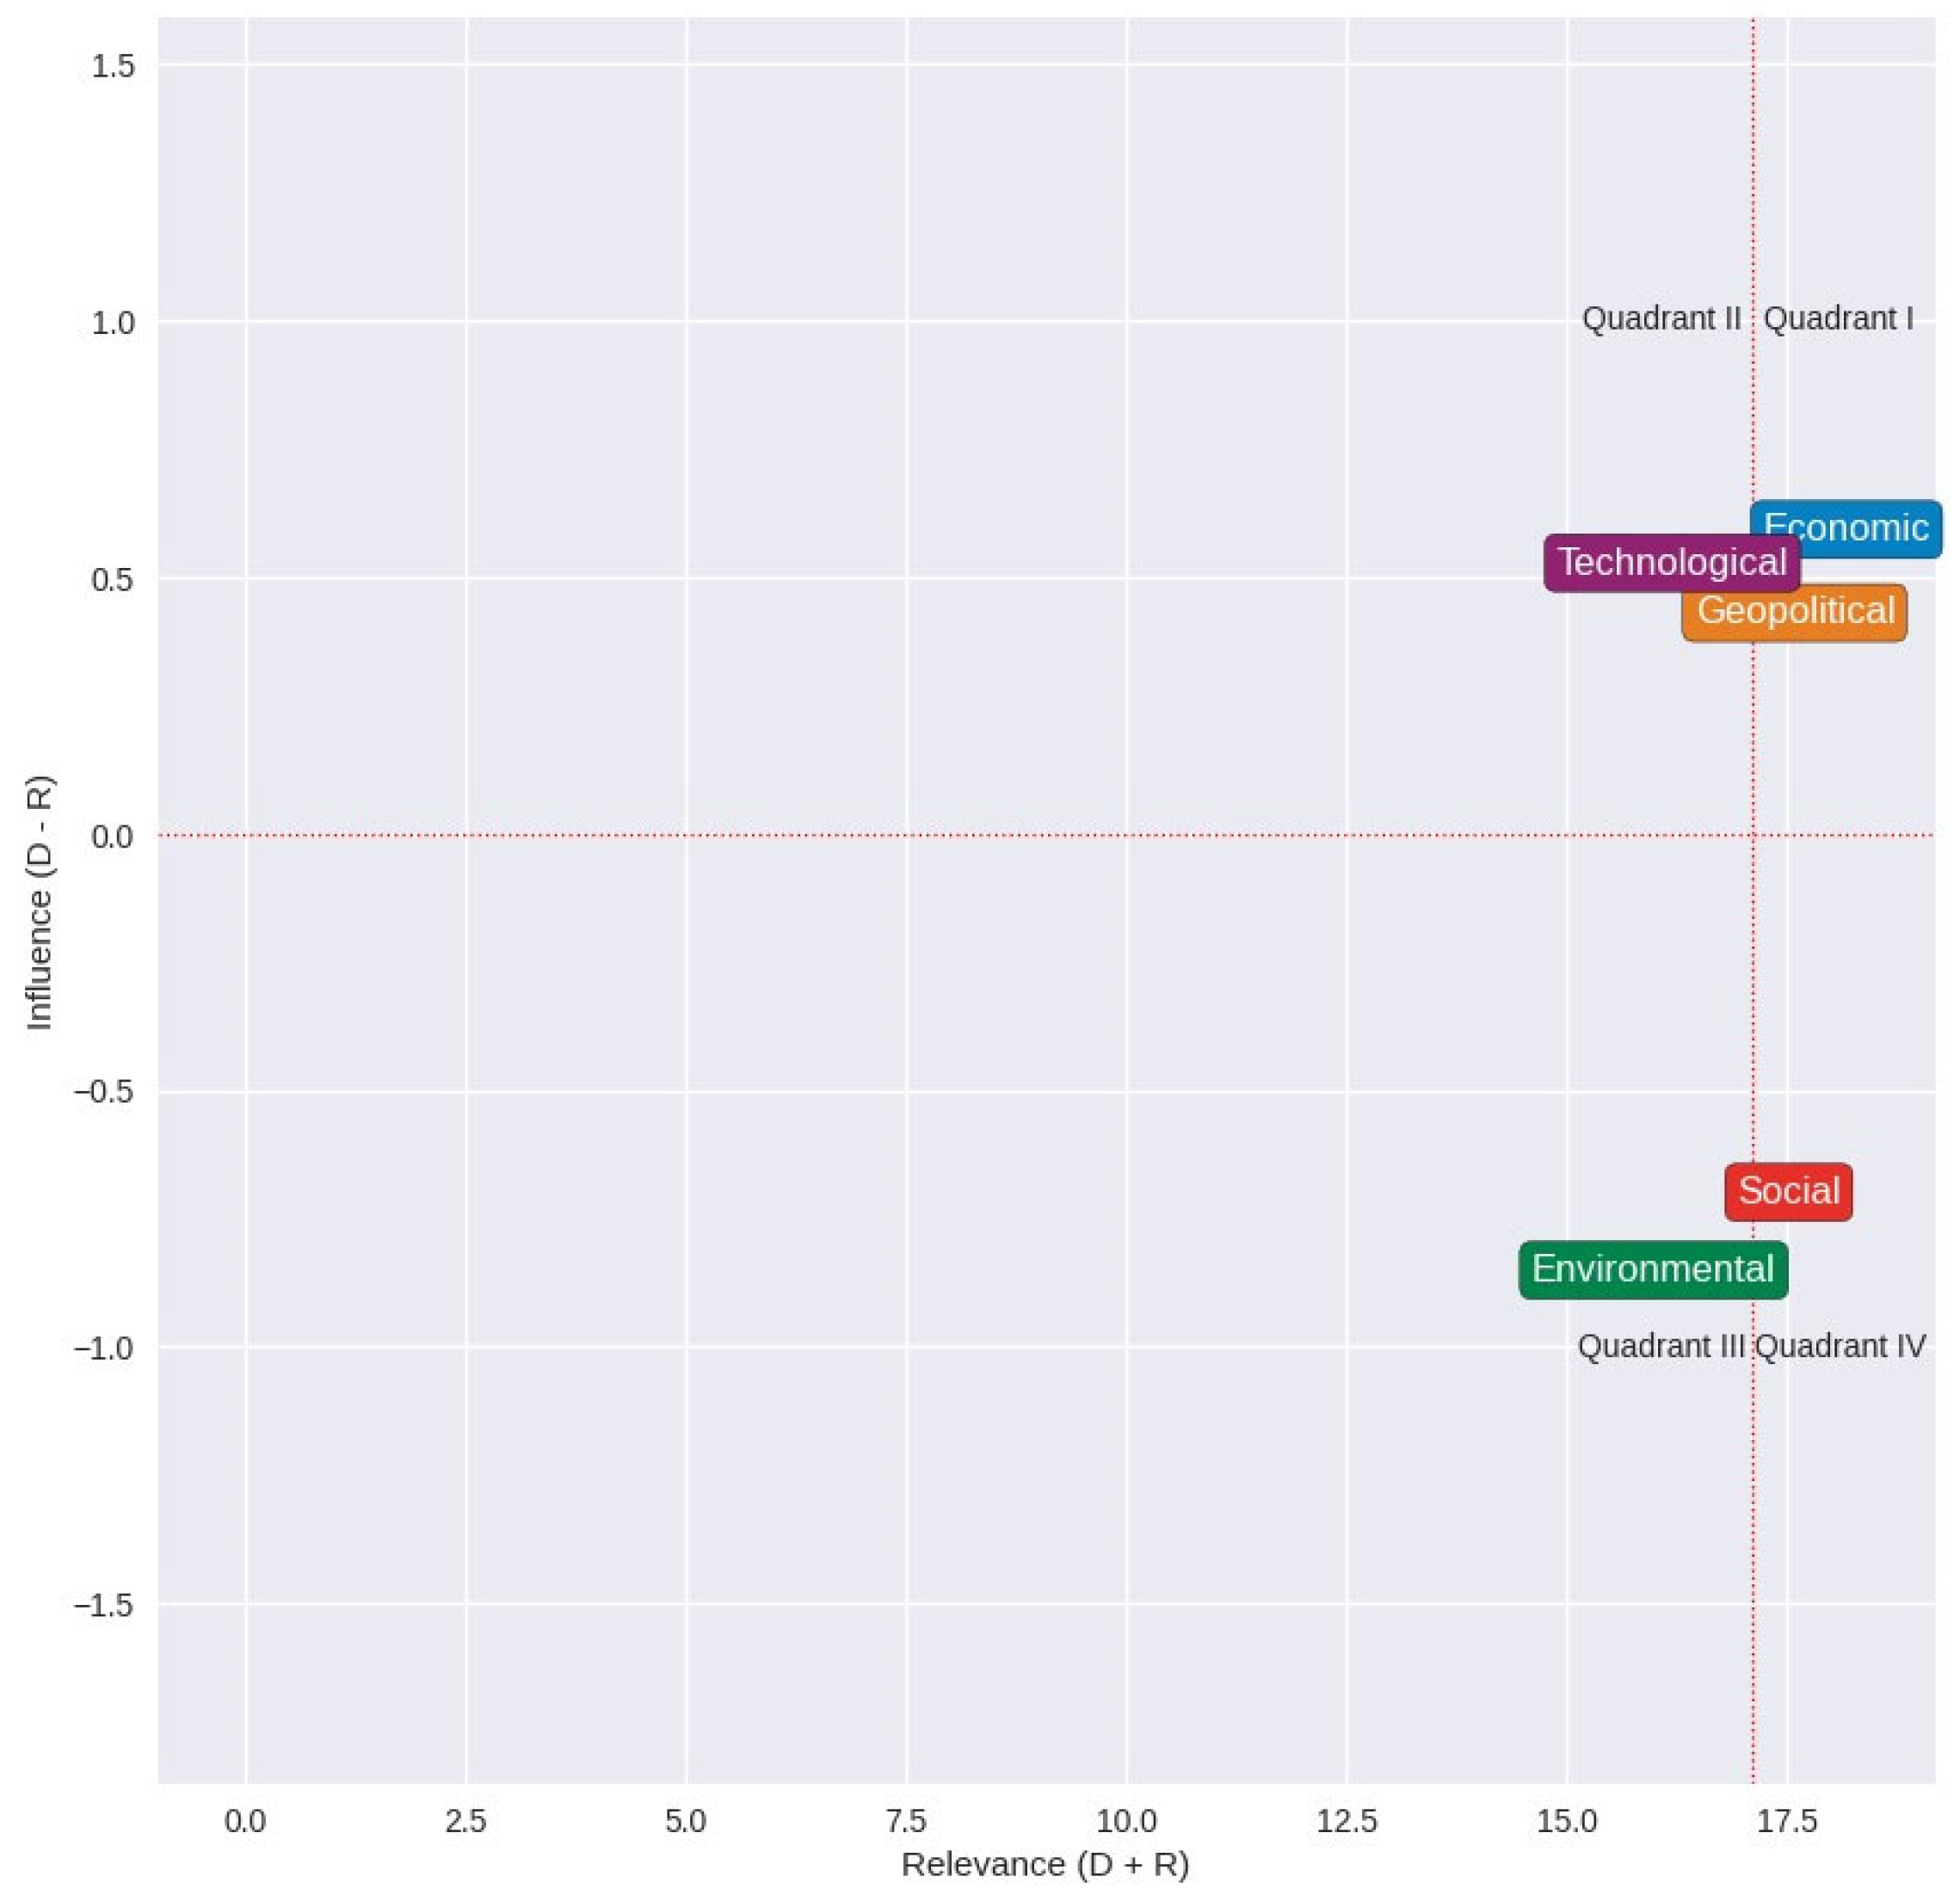
Additionally, there was a presentation and analysis showing the direction and intensity of the direct and indirect relationships that generated influence between the risks that were initially presumed to be well defined in the process of characterizing organizational risks with a focus on sustainability. Figure 5 shows a graph of influence and relevance divided into four quadrants using the DEMATEL model. The elements in the upper right quadrant (I) are those with high influence and relevance. Those are the critical aspects that require priority attention, and as a result, they represent a hierarchy of sustainability risk typologies that need to be addressed, based on the opinions of the experts consulted. The elements in the upper left quadrant (II) have high influence but less relevance, whereas the elements in the lower right quadrant (IV) have high relevance but lower influence. The elements in the lower left quadrant (III) have low influence and relevance. Given the above, it is essential to reinforce efforts in strategic decision-making for the elements in the upper right quadrant and thus address organizational risks effectively.
Figure 5.
Diagram describing the influence and relevance of the typologies of sustainability risks.
Using the AHP method, the best alternatives among the alternatives considered were evaluated and selected. With this method, a hierarchical structure was provided, which allowed the prioritization of the sub-risks for each organizational risk focusing on sustainability that was prioritized with the DEMATEL model (geopolitical, economic, and social) to be broken down and identified. The prioritization of the five organizational risks with a focus on sustainability that were characterized is presented (see Table 13), as is the presentation and sensitivity analysis, so that controlled variations in the input values, such as the values in the comparison matrices, could be performed in order to observe the variation in the results. This allowed for an evaluation of the stability of the decisions made through the AHP and an understanding of whether the most preferred choices remained consistent in different scenarios.
Based on the results obtained from the AHP model (see Table 13), the following sub-risk prioritizations were obtained:
- -
- The sub-risks with the highest prioritization in the geopolitical field were (1.1) lack of ethics in the conduct of business, (1.5) corruption and instability, and (1.4) non-compliance with regulations.
- -
- The sub-risks with the highest priority in the economic field were (2.6) deficit in economic growth; (2.7) low growth in industry, innovation, and infrastructure; and (2.5) water and sanitation shortage.
- -
- The sub-risks with the highest prioritization in the social field were (3.6) chemical safety, (3.7) demographic and health risks, and (3.8) lack of well-being and health.
- -
- The most highly prioritized sub-risks in the technological field were (4.5) massive data fraud or theft incident, (4.4) large-scale cyber-attacks, and (4.1) information security risks and technological changes.
- -
- The most highly prioritized sub-risks in the environmental field were (5.4) water depletion, (5.7) toxic emissions and waste, and (5.1) carbon emissions.
In the calculation of the sensitivity analysis, the first step was to define the relevant variables that would influence the AHP model. Once identified, the ranges of variation for each variable were established. This involved deciding whether to increase or decrease percentages or fixed amounts associated with these variables. The parameters of the AHP model were then modified according to the established variations and the results were recalculated. The next phase consisted of meticulously recording the results obtained for each modified scenario.
This sensitivity analysis was used to evaluate the stability of the results obtained through the AHP. Among the advantages of implementing this analysis were (i) the identification of criteria with higher criticality, which assisted decision-makers with better focusing controls against risks; (ii) an analysis of the robustness of the decisions against changes in the values or conditions of the criteria, which allowed the resistance to uncertainty and variations to be determined; and (iii) improved decision-making since, when combined with MCDM techniques, it provided the consideration of multiple criteria and scenarios and more informed decisions, taking into account the complexity of the criteria [49]. The values of the average comparison matrix for each risk were taken into account, and these values re increased by 10% to evaluate how changes in these matrices would affect the selection of the preferred alternative. The values of the comparison matrices for criteria and alternatives were adjusted to assess how changes in these matrices would affect the selection of the most preferred alternative.
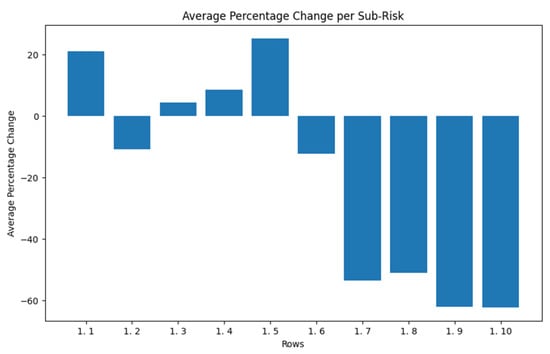
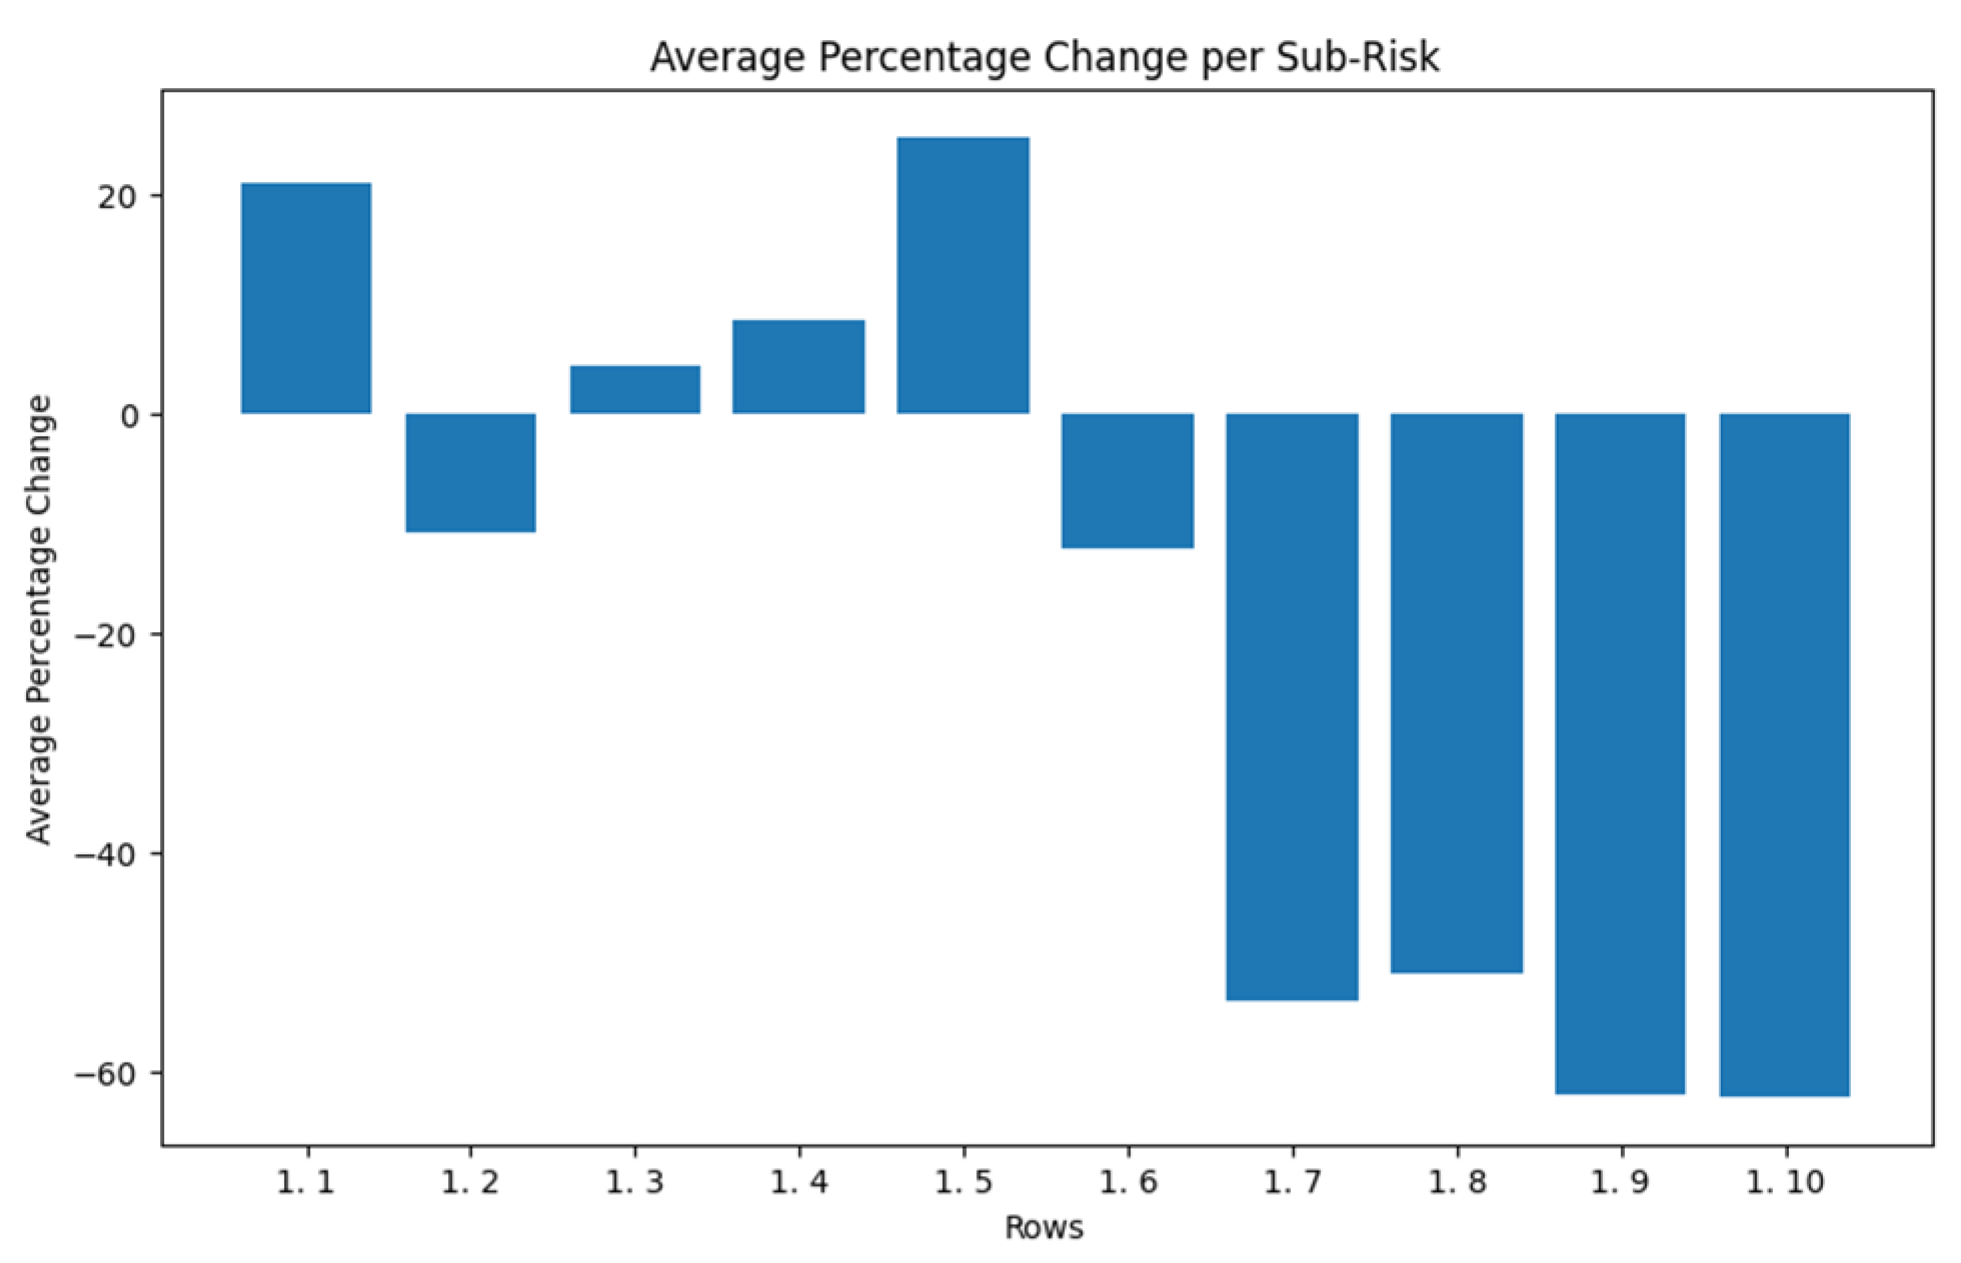
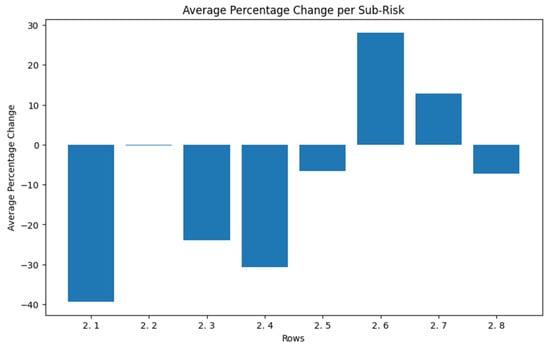
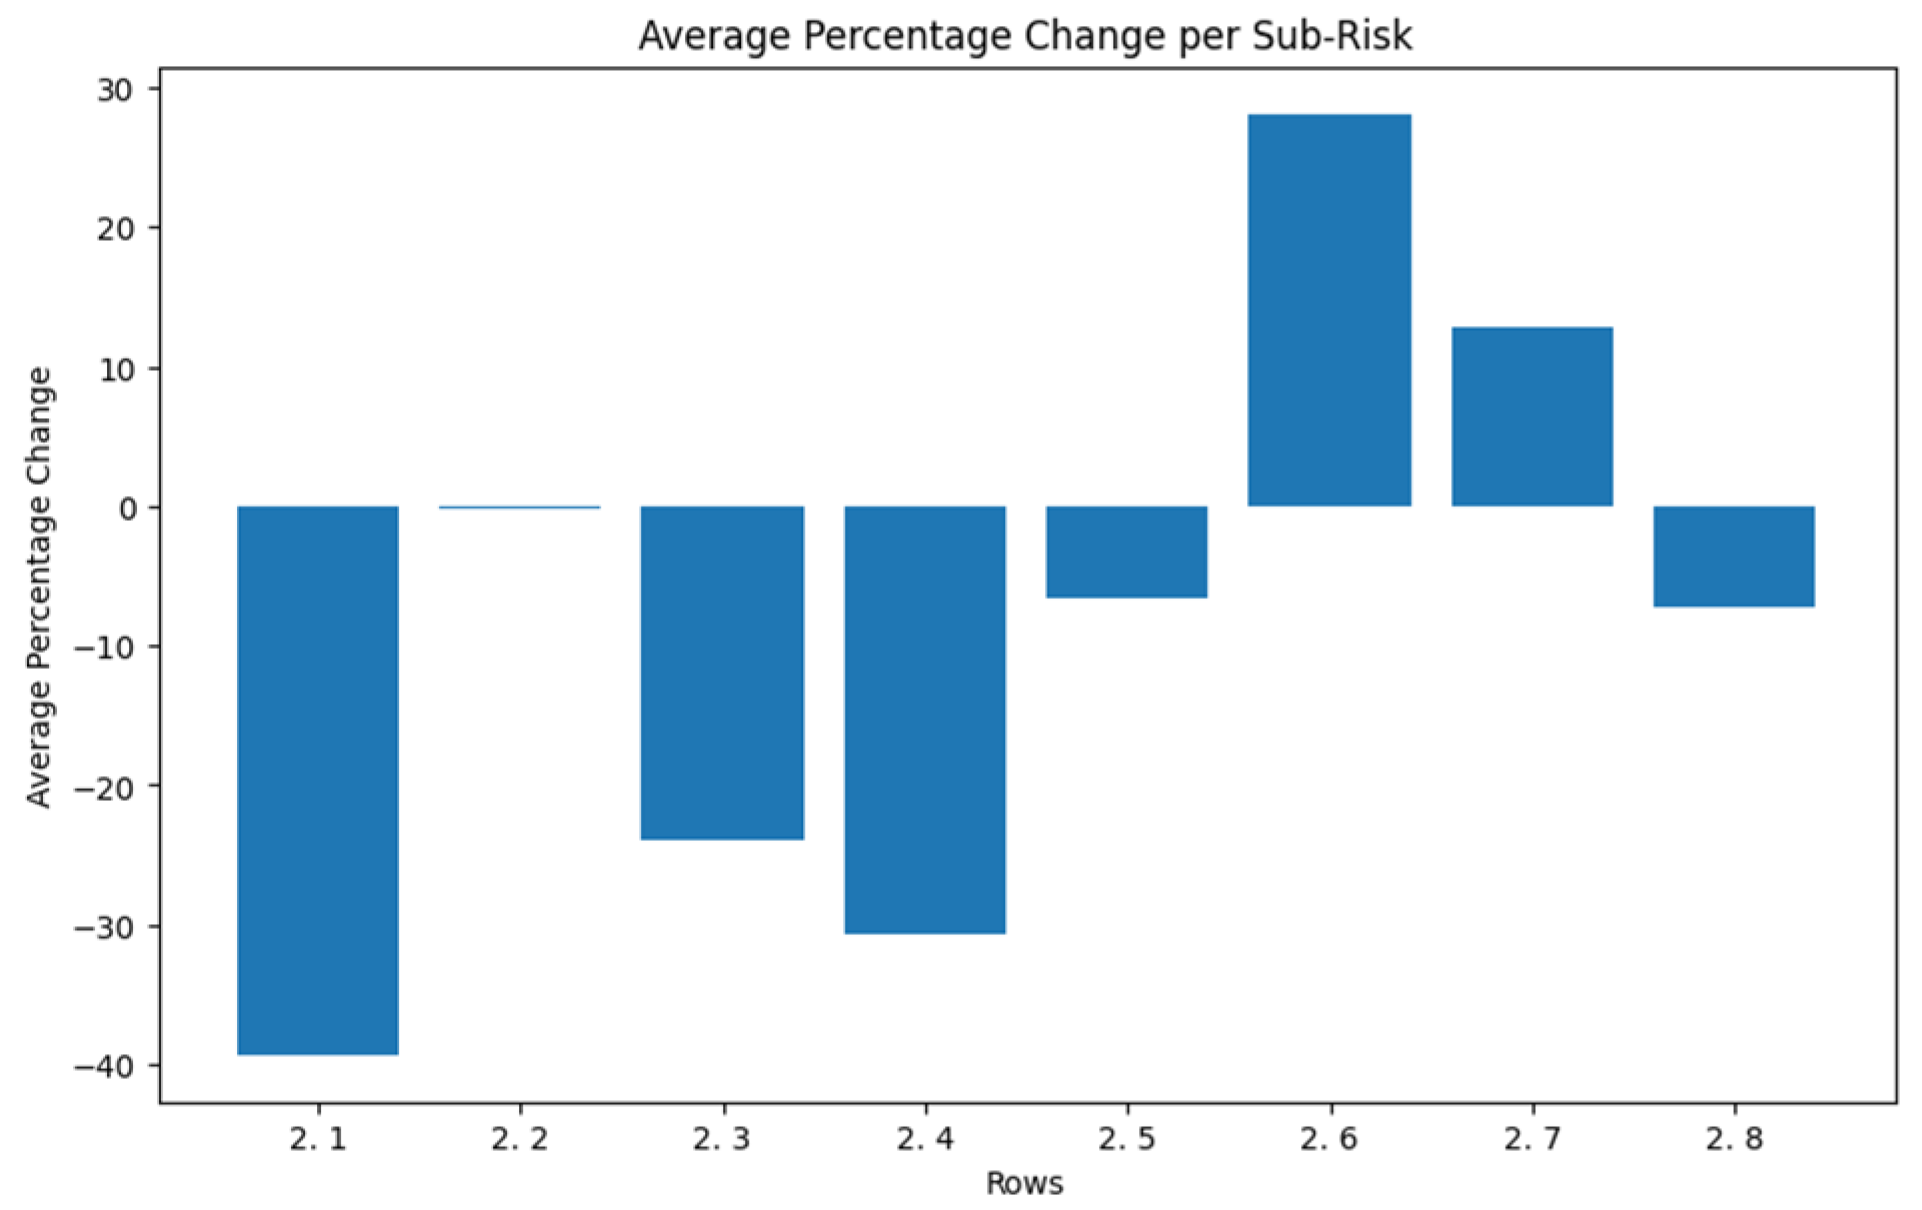
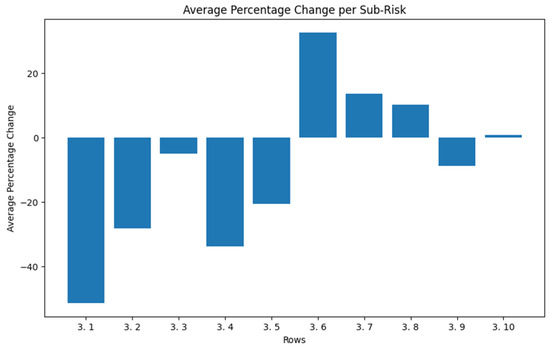
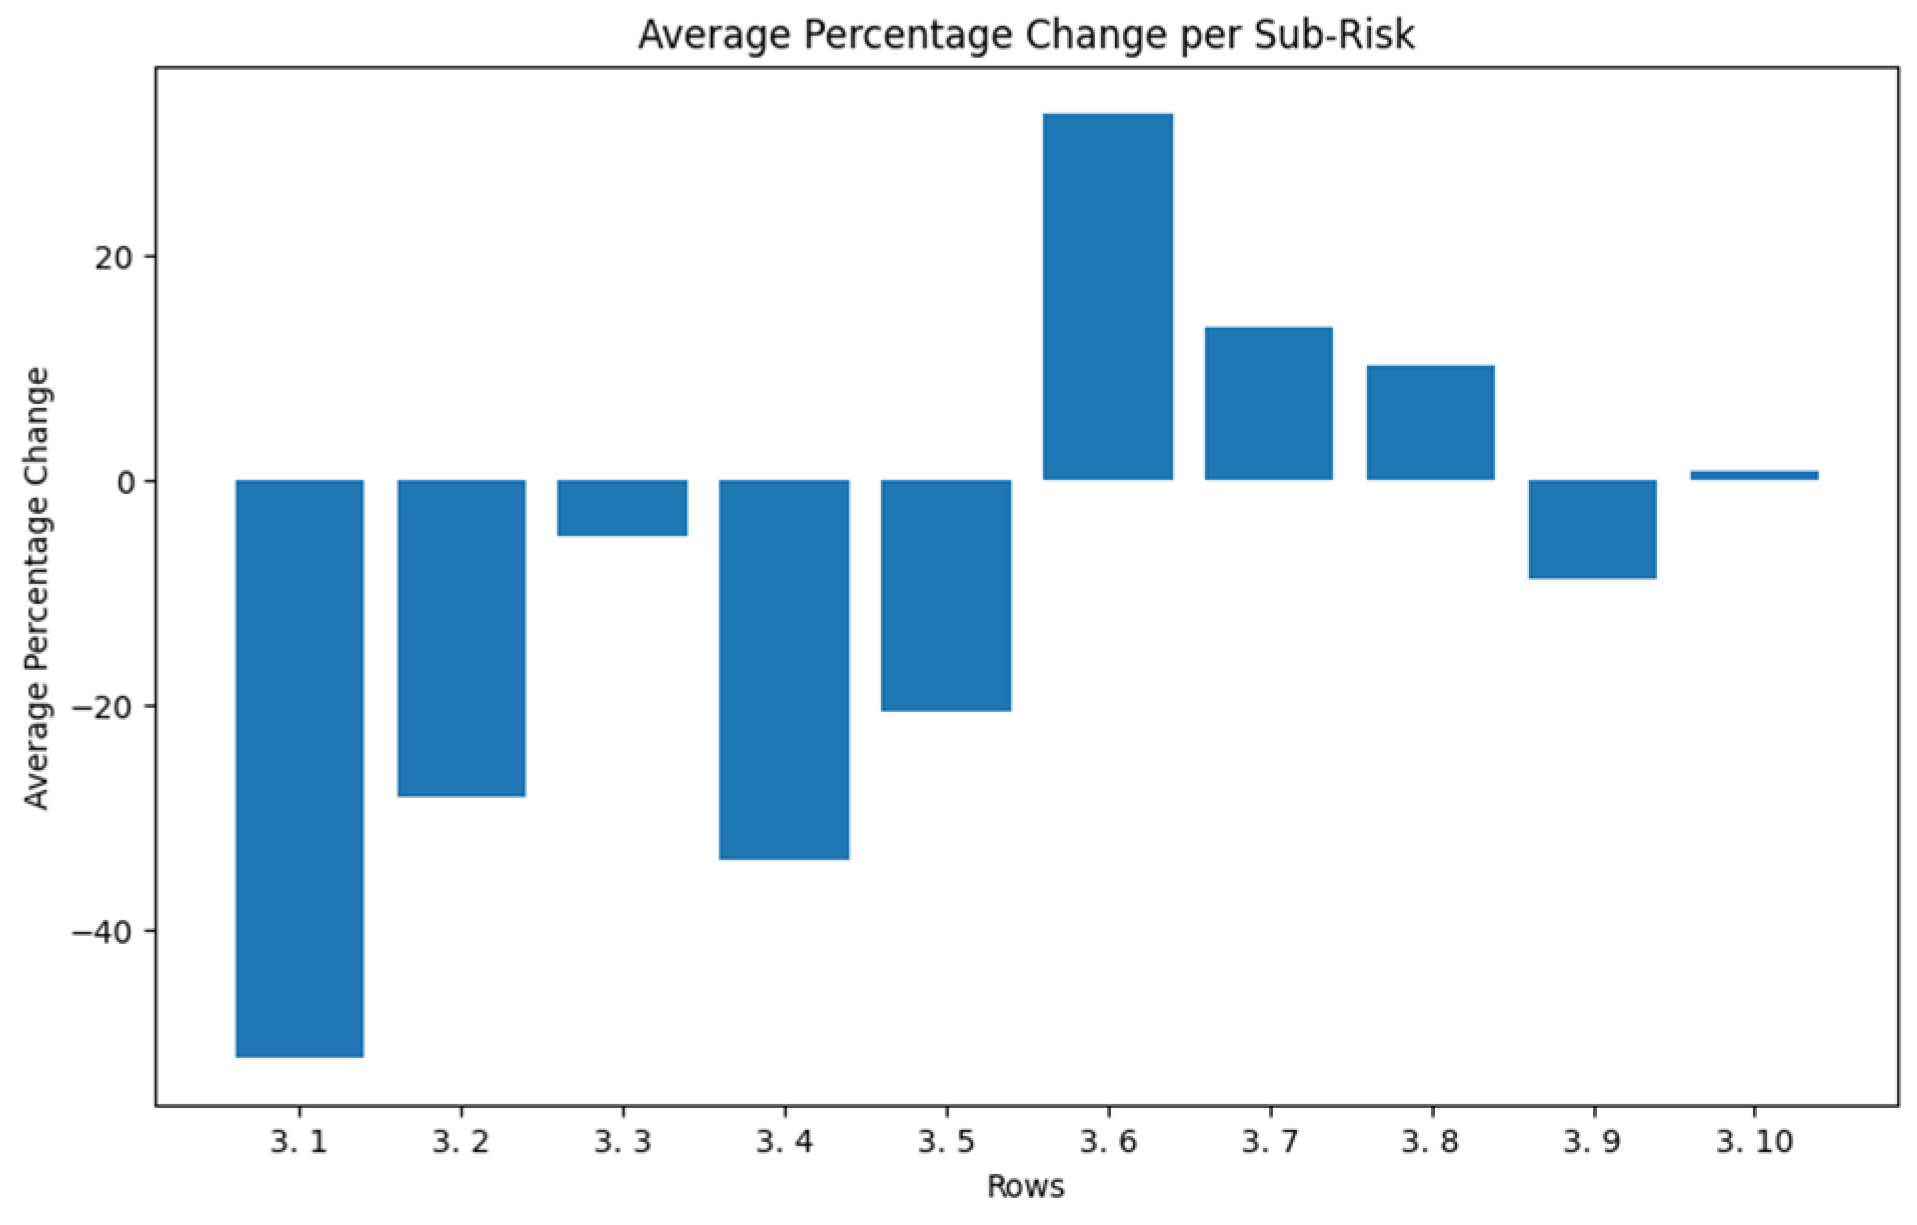
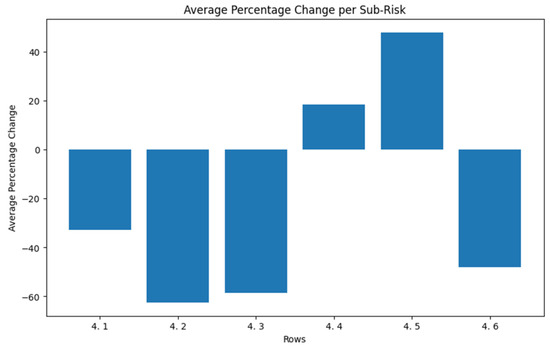
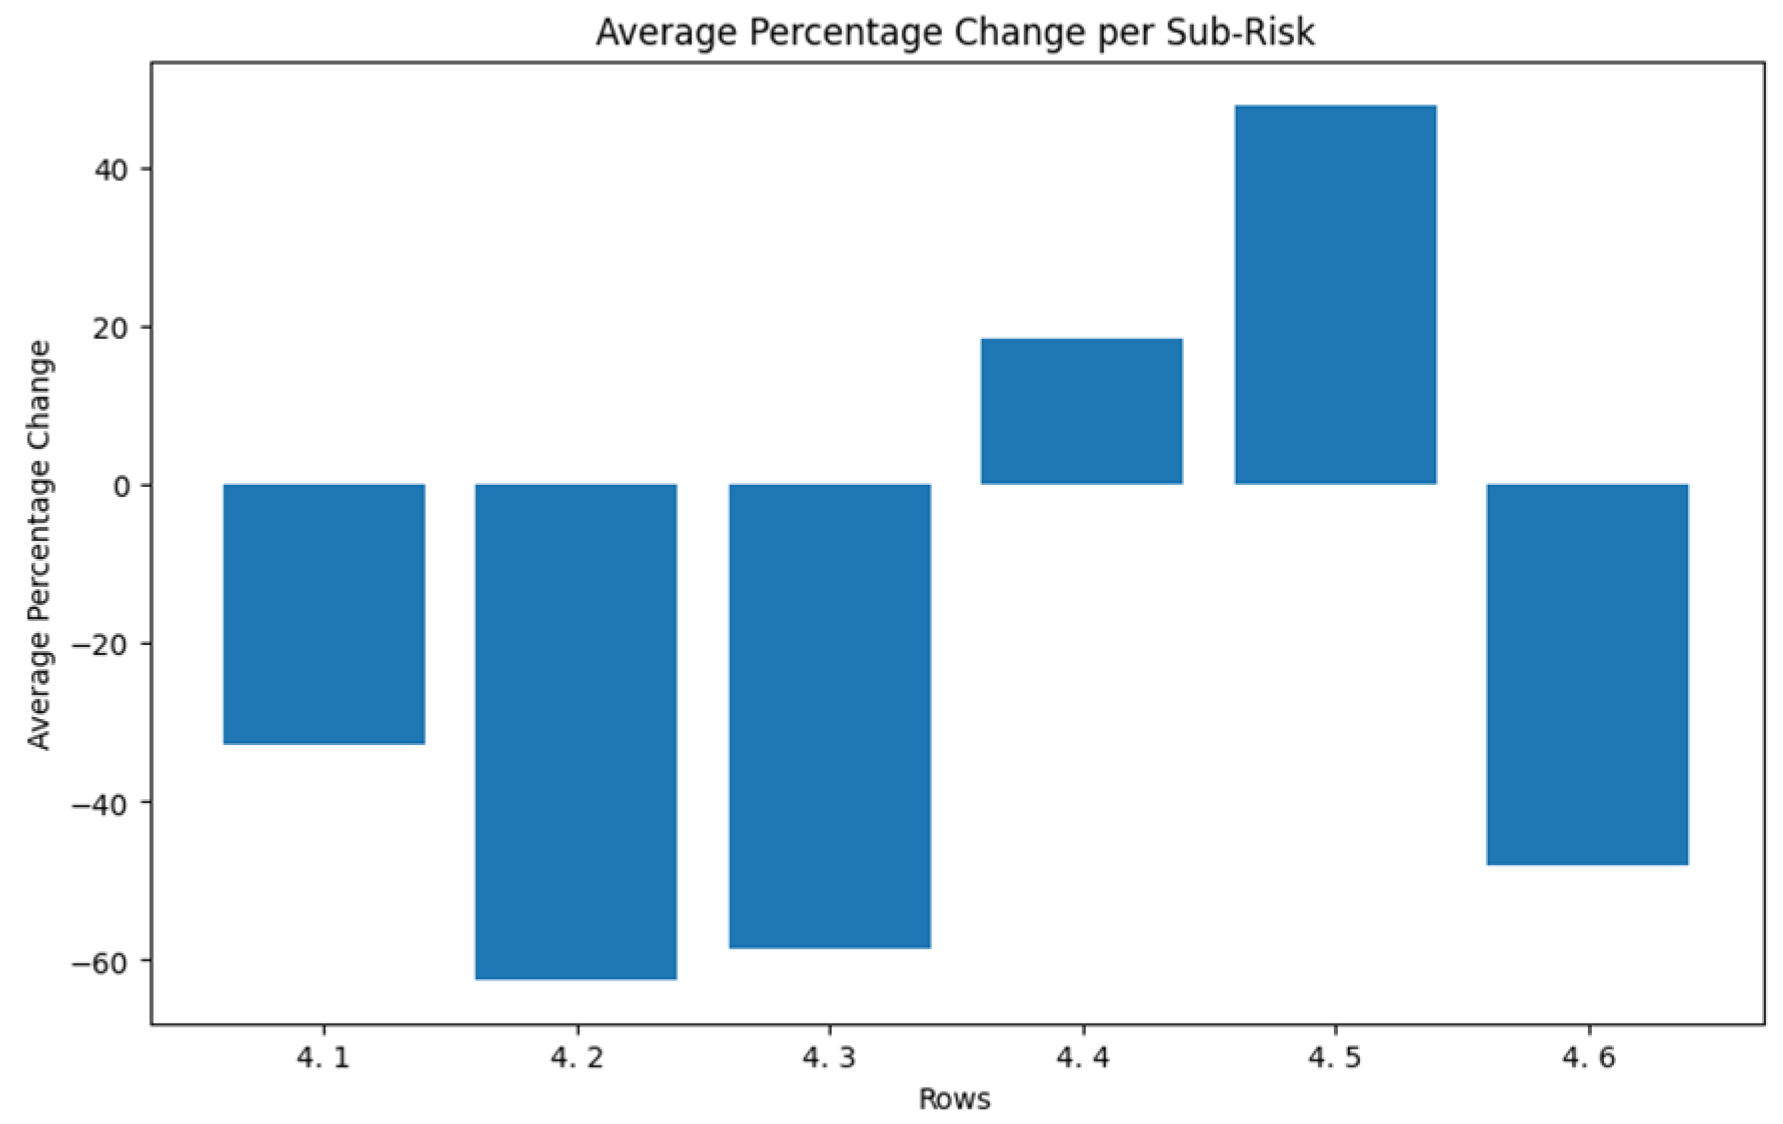
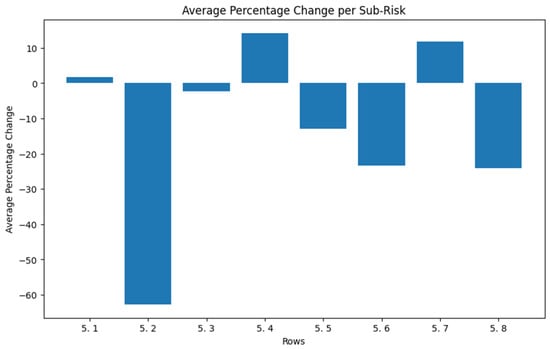
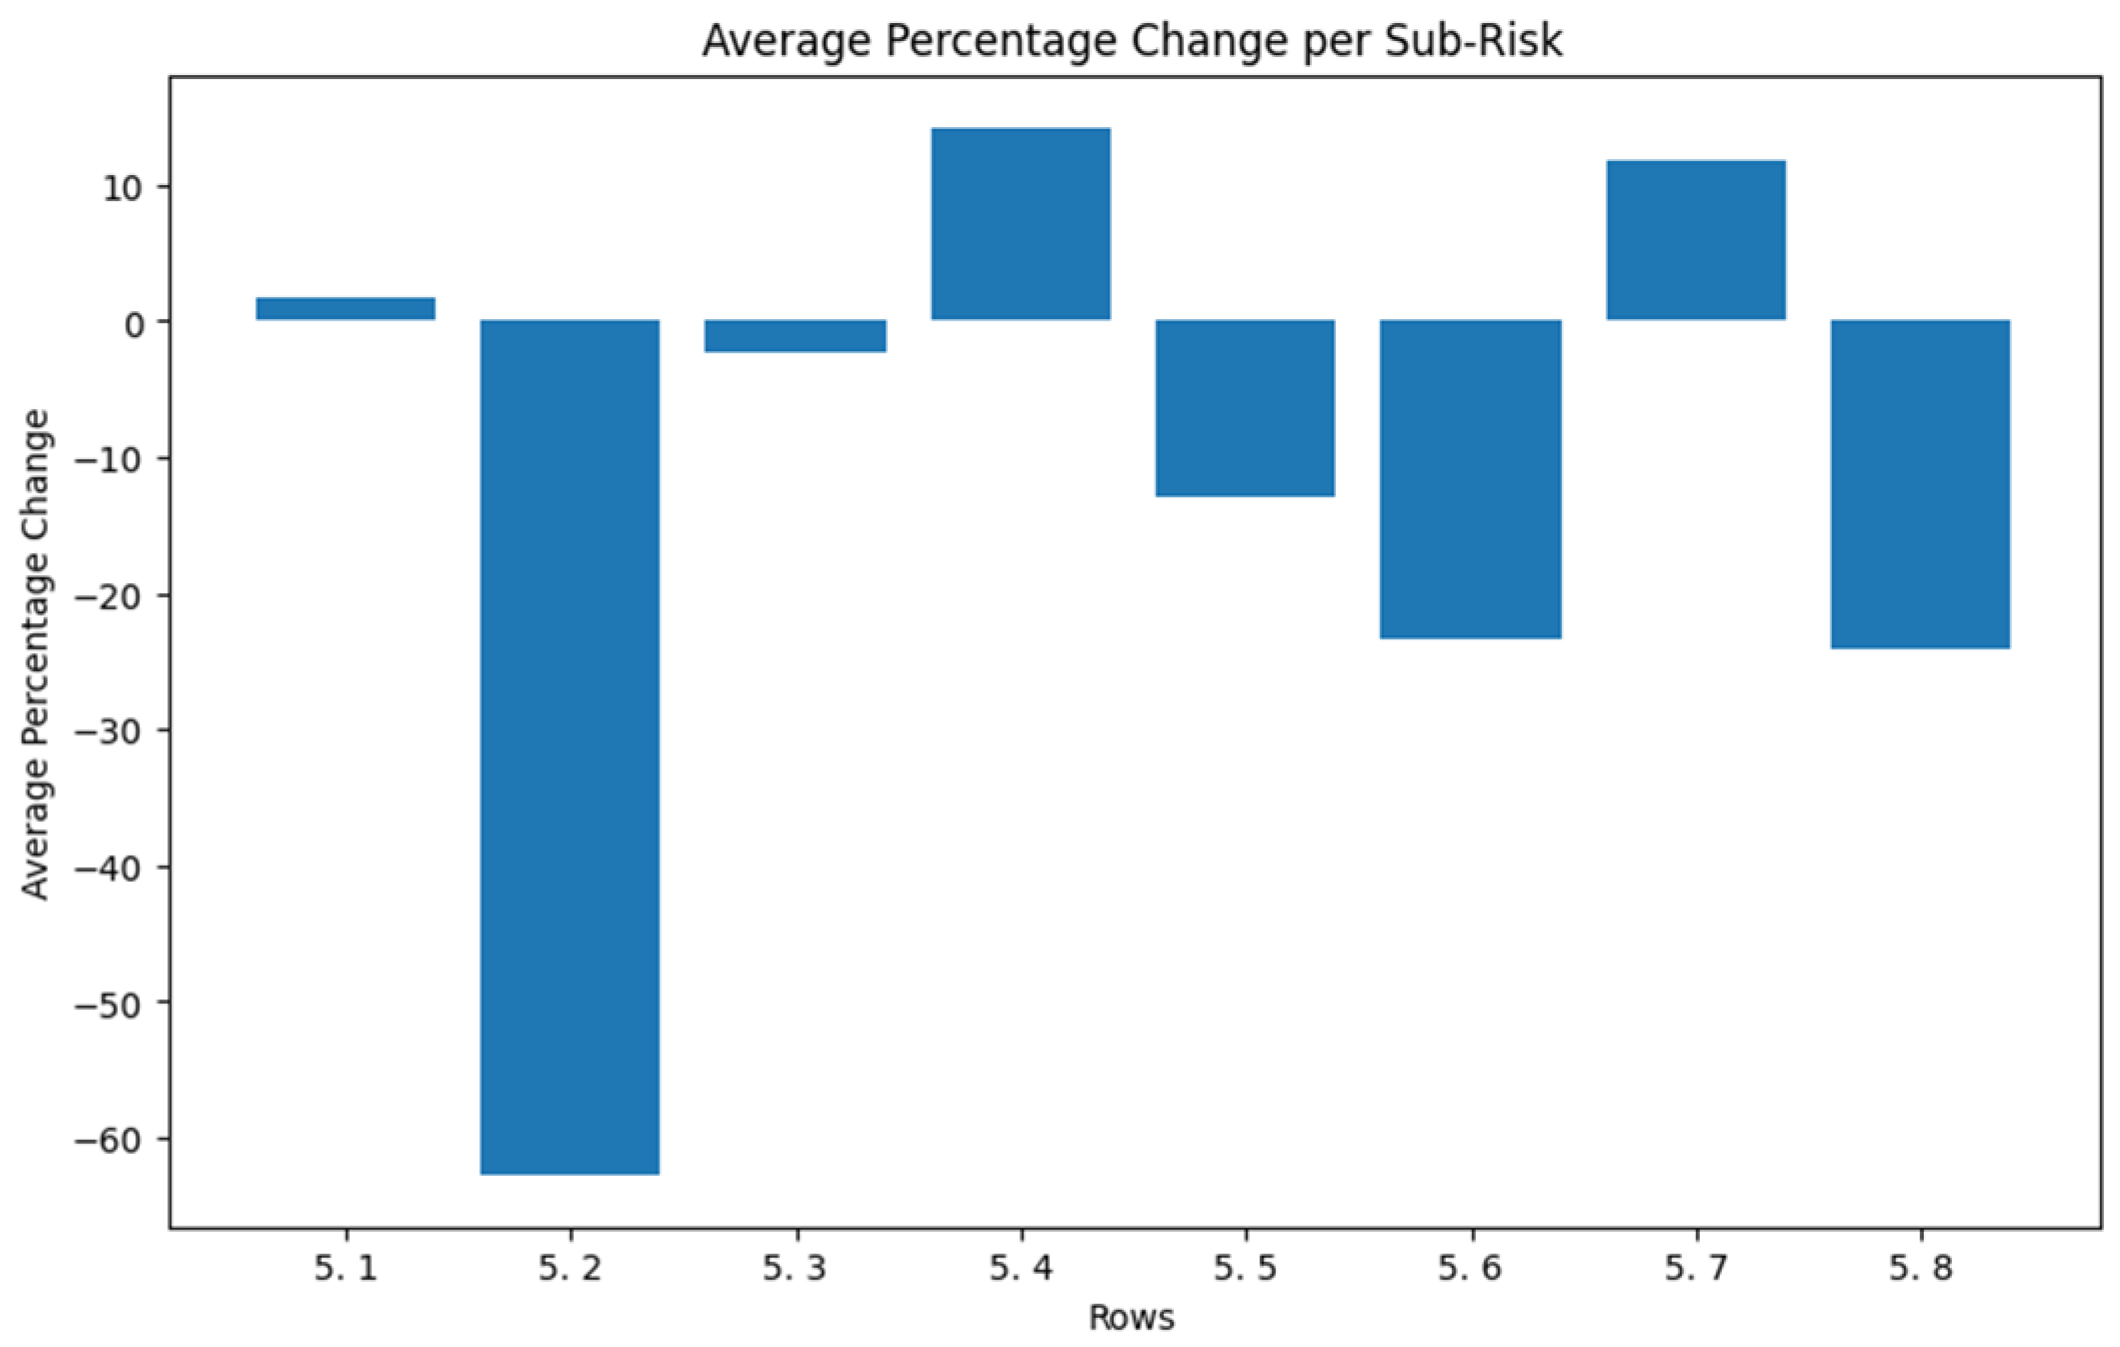
The sensitivity analysis was specifically designed to explore how variations in input data can affect decisions, which is a common practice in risk management. In representing these results, bar or line graphs are used. Each bar or dot on the graph represents the result corresponding to a specific variation in the variables. This visual representation allows for easy interpretation of how changes in the sub-risk variables affected the results of the AHP model, providing a clear and accessible perspective for sensitivity analysis (see Figure 6, Figure 7, Figure 8, Figure 9 and Figure 10).
Figure 6.
Bar chart depicting variations in geopolitical sub-risks.
Figure 7.
Bar chart depicting variations in economic sub-risks.
Figure 8.
Bar chart depicting variations in social sub-risks.
Figure 9.
Bar chart depicting variations in technological sub-risks.
Figure 10.
Bar chart depicting variations in environmental sub-risks.
The sensitivity analysis of the AHP model generated a wide range of results, showing how fluctuations in key variables influence risk prioritization. Values close to zero indicate sub-risks with low sensitivity to the variations introduced. These components maintained a relatively constant and stable contribution across different scenarios. Although their influence was minor compared to others, their stability suggests consistency in decision-making. Positive variations of up to 40% indicate that, in certain scenarios or with specific modifications, the sub-risk had a positive impact. This sub-risk was less sensitive to adverse changes compared to others, which might suggest greater stability under various conditions. In contrast, negative variances of up to −60% indicate that changes in the input values significantly influenced the model results, yielding significant negative changes in the relative priorities of the criteria. This indicates that certain changes in the input values induced a noticeable decrease in the relative importance of some criteria in relation to their original weights. It is important to note that, although variations in the results were identified through the sensitivity analysis, these should not undermine the robustness of the conclusions drawn. The variations observed were within realistic ranges and reflected the uncertainty inherent in decision-making in a dynamic environment. The recommendations were robust, and the proactive approach to addressing variability in the data ensured more informed decision making and resilience in the face of possible changes in model input conditions.
This research provides the reader with a significant contribution to the field of sustainability risk management, especially when considering the breadth of challenges it encompasses, taking into account the five typologies of risks characterized and their respective sub-risks. It was possible to determine the most relevant risk typologies through the DEMATEL method and the most relevant sub-risks through the AHP method for adequate decision-making in the organizations regarding their treatment and controls. The results obtained highlight the relevance of sustainability risks typified as economic, social, geopolitical, environmental, and technological. This provides valuable guidance for various organizations. From a methodological point of view, the appropriate application of the DEMATEL and AHP models indicates the effectiveness of these tools in the prioritization of risks and sub-risks. The above takes into account that the opinions of a group of experts from different sectors have the same weighting and avoid biases of opinions without taking into consideration the industry in which each expert works. This study not only deepens in the identification of key risks but also highlights the importance of sensitivity analysis in decision-making, offering a realistic and contextualized view of the results obtained.
Among the limitations of this study, it was found that, in the characterization proposed in Table 1 of specific sub-risks, it would be exciting to continue with the analysis proposed from the approach of risk prioritization and deepen the analysis through the application of other MCDM methodologies.
According to the OEMS and the literature consulted in this regard, it would be very relevant to continue investigating how to propose a model that addresses, from the perspective of risk management obtained in this research, an approach to establish a control strategy for each of the elements analyzed.
The results obtained with the applied methodology not only strengthen consistency in decision-making but also contribute to more objective and accurate risk management. Overall, this methodology adapts in a versatile way to the organizational environment, providing a comprehensive and accurate approach to efficiently identify and hierarchize risks in a variety of contexts.
5. Conclusions
This investigation considered the opinions of a group of experts to conclude the relevance and preference of the proposed organizational risk characterization with a focus on sustainability by using MCDM models for decision-making that allow the prioritization to be determined via the DEMATEL analytical method with the following categories: (1) economic, (2) geopolitical, (3) social, (4) technological, and (5) environmental, with which it was possible to obtain the consensus of the opinions collected, having gained enough clarity on those opinions. Additionally, based on the proposed characterization of sustainability risks and considering their risk assessment, the calculation results were obtained through the model generated in Google Colab, and the opinions addressed are presented rationally.
Additionally, based on the AHP method, the sub-risks were prioritized for each typology of risk characterized—in this case, economic, geopolitical, social, technological, and environmental—obtaining the following:
- The geopolitical sub-risks with the highest prioritization were (1.1) lack of ethics in the conduct of business (0.1611), (1.5) corruption and instability (0.1491), and (1.4) non-compliance with regulations (0.1368).
- The economic sub-risks with the highest prioritization were (2.6) deficit in economic growth (0.1683); (2.7) low growth in industry, innovation, and infrastructure (0.1577); and (2.5) water scarcity and sanitation (0.1315).
- The social sub-risks with the highest prioritization were (3.6) chemical safety (0.1541), (3.7) demographic and health risks (0.1216), and (3.8) lack of well-being and health (0.1173).
- The technological sub-risks with the highest prioritization were (4.5) massive data fraud or theft incident (0.3172), (4.4) large-scale cyber-attacks (0.2638), and (4.1) information security risks and technological changes (0.1365).
- The environmental sub-risks with the highest prioritization were (5.4) water depletion (0.1645), (5.7) toxic emissions and waste (0.1575), and (5.1) carbon emissions (0.1527).
Based on the consultation with the experts in this research, it can be concluded that the application of sensitivity analysis to the AHP model revealed that changes in the comparison matrices impacted risk prioritization. Negative variations of up to -60% were identified, which had a negative impact on the weightings of certain criteria. Positive variations of up to 40% indicated a positive impact on the weighting of certain sub-risks under certain conditions, suggesting that these elements have a favorable impact on identifying strategic decisions. For sub-risks with low sensitivity close to zero and stable contributions were maintained under various scenarios and had consistent results. The proactive approach to data variability ensures informed decisions and resilience to change.
It is important to consider the significant relevance of the adequate characterization of organizational risks with a focus on sustainability, as it is a key factor for the planning of all strategies at the organizational level, to ensure adequate treatment of them and to make the best decisions in the organizations regarding how to manage them adequately.
Through the prioritization of risks established in this research using the DEMATEL and ANP methods, organizations can find a structured reference based on the group of experts consulted on organizational risks with a focus on sustainability. A comprehensive and detailed approach to the typified risks is provided, along with a clear vision of the risks, which thus enables organizations to focus on really effective controls. This depends on the risks and sub-risks defined in each business sector that requires the implementation of this methodology.
In accordance with the scope of the research, some issues must still be addressed, for which it is suggested to extend the proposed analysis, starting with the characterization of the organizational risks with a focus on sustainability (risks and sub-risks) in the present study. It is suggested to extend the prioritization analysis by applying other MCDM methodologies to identify variations in the prioritization of risks and sub-risks. Furthermore, it is proposed that detailed comparisons be carried out to determine the most representative risks and sub-risks. Finally, it is recommended that, based on this research, the information on monitoring controls associated with the prioritized risks and sub-risks be expanded, thus contributing to organizational risk management with a focus on sustainability.
Author Contributions
Conceptualization, E.J.Y.-C.; methodology, E.J.Y.-C., J.A.H.-C. and A.I.; software, E.J.Y.-C.; validation, E.J.Y.-C., J.A.H.-C. and A.I.; formal analysis, E.J.Y.-C.; investigation, E.J.Y.-C.; data curation, E.J.Y.-C.; writing—original draft preparation, E.J.Y.-C.; supervision, J.A.H.-C. and A.I. All authors have read and agreed to the published version of the manuscript.
Funding
This research received no external funding.
Institutional Review Board Statement
Not applicable.
Informed Consent Statement
Not applicable.
Data Availability Statement
All data regarding the results of this research are available upon request from the authors.
Acknowledgments
Special thanks to Jorge Eliécer Moreno for considering the relevance of this research and actively contributing to the participation of the technical experts consulted along with the case studies analyzed.
Conflicts of Interest
The authors declare no conflicts of interest.
Appendix A
Table A1.
Characterization of geopolitical sub-risks.
Table A2.
Characterization of economic sub-risks.
Table A3.
Characterization of social sub-risks.
Table A4.
Characterization of technological sub-risks.
Table A5.
Characterization of environmental sub-risks.
Appendix B
Appendix B.1
- https://drive.google.com/file/d/15wPs7XTsdv0cm-uWLLrn3iotLw1rAc7n/view?usp=drive_link (accessed on 20 September 2023).
Appendix B.2
- Geopolitical: https://colab.research.google.com/drive/16n8D0-RC-l5kfSdwtVu-OEGrkMCckGVp?usp=drive_link (accessed on 20 September 2023).
Appendix B.3
- Economical: https://colab.research.google.com/drive/19aWGpUrwbaMKN3tD3brMxS-kyW15oafC?usp=drive_link (accessed on 20 September 2023).
Appendix B.4
- Social: https://colab.research.google.com/drive/1OnlIyhaV7Wmdnr2QQMgWCe5Gw1oTtNvE?usp=drive_link (accessed on 20 September 2023).
Appendix B.5
- Technological: https://colab.research.google.com/drive/1AJo72yFSzeXVYeJu3kpo_AUNgXbIzad1?usp=drive_link (accessed on September 2023).
Appendix B.6
- Environmental: https://colab.research.google.com/drive/1DrzOd4SHG2pumqucFwwPE3PLOPZuv3UT?usp=drive_link (accessed on 20 September 2023).
References
- Amir, A.; Seddik, S. Harnessing the Power of Operational Excellence to Cope with the Upcoming Perfect Storm of Energy Transition and Diversification. In Proceedings of the Gas & Oil Technology Showcase and Conference, Dubai, United Arab Emirates, 13–15 March 2023. [Google Scholar] [CrossRef] [Scilit]
- McCreery, J.; Phillips, E.; Cigala, F. Operational Excellence: The Imperative for Oil and Gas Companies; Bain & Company: Boston, MA, USA, 2013. [Google Scholar]
- Lutchman, C.; Lutchman, K.; Akula, R.; Lyons, C.; Hashmi, W. Operations Excellence Management System (OEMS): Getting It Right the First Time; Routledge: London, UK, 2019. [Google Scholar]
- Pozzoli, M.; Pagani, A.; Paolone, F. The impact of audit committee characteristics on ESG performance in the European Union member states: Empirical evidence before and during the COVID-19 pandemic. J. Clean. Prod. 2022, 371, 133411. [Google Scholar] [CrossRef] [Scilit]
- Leon, D. Enhancing an IATF 16949 Based Quality Management System to Promote Performance Excellence. Master’s Thesis, The California State University, Bakersfield, CA, USA, 2019. [Google Scholar]
- Yılmaz, A.; Flouris, T. Managing corporate sustainability: Risk management process-based perspective. Afr. J. Bus. Manag. 2010, 4, 162–171. [Google Scholar]
- WBCSD; COSO. Enterprise Risk Management Applying Enterprise Risk Management to Environmental, Social and Governance-Related Risks. 2018. Available online: https://docs.wbcsd.org/2018/10/COSO_WBCSD_ESGERM_Guidance.pdf (accessed on 1 July 2023).
- Dextre Flores, J.; Del Pozo Rivas, R. ¿Control de gestión o gestión de control? Contab. Negoc. 2012, 7, 69–80. [Google Scholar] [CrossRef] [Scilit]
- Pérez-Carballo Veiga, J. Control de Gestión Empresarial; ESIC: Madrid, Spain, 2013. [Google Scholar]
- Doria Parra, A.; López Benavides, L.; Bonilla Ferrer, M.; Parra Cera, G. Metodología para la implementación de la gestión de riesgo en un sistema de gestión de calidad. Signos 2020, 12, 123–135. [Google Scholar] [CrossRef] [Scilit]
- Menoni, S.; Margottini, C. Inside Risk: A Strategy for Sustainable Risk Mitigation; Springer: Berlin/Heidelberg, Germany, 2011. [Google Scholar]
- Reina-Usuga, L.; De Haro Giménez, T.; Parra-López, C. Análisis mediante el Proceso Analítico en Red (ANP) de criterios de sostenibilidad de los canales cortos de comercialización frente a la gran comercialización alimentaria en Bogotá, Colombia. Rev. Española Estud. Agrosoc. Pesq. 2018, 250, 161–189. [Google Scholar]
- Heras-Saizarbitoria, I.; Urbieta, L.; Boiral, O. Organizations’ engagement with sustainable development goals: From cherry-picking to SDG-washing? Corp. Soc. Responsib. Environ. Manag. 2021, 29, 316–328. [Google Scholar] [CrossRef] [Scilit]
- Cernev, T.; Fenner, R. The importance of achieving foundational Sustainable Development Goals in reducing global risk. Futures 2020, 115, 102492. [Google Scholar] [CrossRef] [Scilit]
- Martín-Gamboa, M.; Iribarren, D.; García-Gusano, D.; Dufour, J. A review of life-cycle approaches coupled with data envelopment analysis within multi-criteria decision analysis for sustainability assessment of energy systems. J. Clean. Prod. 2017, 150, 164–174. [Google Scholar] [CrossRef] [Scilit]
- WEF World Economic Forum, The Global Risks Report; WEF: Cologny, Switzerland, 2023; Available online: https://www3.weforum.org/docs/WEF_Global_Risks_Report_2023.pdf (accessed on 1 July 2023).
- Boiral, O.; Talbot, D.; Brotherton, M. Measuring sustainability risks: A rational myth? Bus. Strategy Environ. 2020, 29, 2557–2571. [Google Scholar] [CrossRef] [Scilit]
- Zheng, Q.; Shen, S.-L.; Zhou, A.; Lyu, H.-M. Inundation risk assessment based on G-DEMATEL-AHP and its application to Zhengzhou flooding disaster. Sustain. Cities Soc. 2022, 86, 104138. [Google Scholar] [CrossRef] [Scilit]
- Gökler, S.; Boran, S. A novel resilient and sustainable supplier selection model based on D-AHP and DEMATEL methods. J. Eng. Res. 2023, in press. [Google Scholar] [CrossRef] [Scilit]
- Balsara, S.; Kumar Jain, P.; Ramesh, A. An integrated approach using AHP and DEMATEL for evaluating climate change mitigation strategies of the Indian cement manufacturing industry. Environ. Pollut. 2019, 252, 863–878. [Google Scholar] [CrossRef] [Scilit] [PubMed]
- Fargnoli, M.; Lombardi, M.; Haber, N.; Guadagno, F. Hazard function deployment: A QFD-based tool for the assessment of working tasks—A practical study in the construction industry. Int. J. Occup. Saf. Ergon. 2018, 26, 348–369. [Google Scholar] [CrossRef] [Scilit] [PubMed]
- Fargnoli, M.; Lombardi, M.; Haber, N. A fuzzy-QFD approach for the enhancement of work equipment safety: A case study in the agriculture sector. Int. J. Reliab. Saf. 2018, 12, 306–326. [Google Scholar] [CrossRef] [Scilit]
- Tzeng, G.-H.; Huang, J.-J. Multiple Attribute Decision Making: Methods and Applications; CRC Press: Boca Raton, FL, USA, 2011. [Google Scholar]
- Moravčík, O.; Sekera, B.; Beňo, R.; Sakál, P.; Šmida, L. Perspectives for Utilization of Multicriteria Decision Methods AHP/ANP to Create a National Energy Strategy in Terms of Sustainable Development. Adv. Mater. Res. 2013, 616, 1585–1590. [Google Scholar] [CrossRef] [Scilit]
- WEF World Economic Forum, The Global Risks Report; WEF: Cologny, Switzerland, 2022; Available online: https://www3.weforum.org/docs/WEF_The_Global_Risks_Report_2022.pdf (accessed on 1 July 2023).
- Hashemkhani Zolfani, S.; Görener, A.; Toker, K. A hybrid fuzzy MCDM approach for prioritizing the solutions of resource recovery business model adoption to overcome its barriers in emerging economies. J. Clean. Prod. 2023, 413, 137362. [Google Scholar] [CrossRef] [Scilit]
- Dong, Y.; Xu, J. Consensus Building in Group Decision Making; Springer: Singapore, 2015. [Google Scholar]
- Acevedo Borrego, A.; Cachay Boza, O.; Linares Barrantes, C. Los estilos convergente y divergente para resolución de problemas. La perspectiva de los sistemas blandos en el aprendizaje por experiencias. Prod. Gestión 2016, 19, 49–58. [Google Scholar] [CrossRef] [Scilit]
- Ervural, B.; Kabak, Ö. A taxonomy for multiple attribute group decision making literature. In Proceedings of the IEEE International Conference on Fuzzy Systems (FUZZ-IEEE), Istanbul, Turkey, 2–5 August 2015; pp. 1–8. [Google Scholar]
- Dos Santos, P.; Neves, S.; Ornaghi Sant’Anna, D.; de Oliveira, C.; Duarte Carvalho, H. The analytic hierarchy process supporting decision making for sustainable development: An overview of applications. J. Clean Prod. 2019, 212, 119–138. [Google Scholar] [CrossRef] [Scilit]
- Lu, J.; Zhang, G.; Ruan, D.; Wu, F. Multi-Objective Group Decision Making Methods, Software and Applications with Fuzzy Set Techniques; Imperial College Press: London, UK, 2007. [Google Scholar]
- Hosseinzadeh, M.; Kamaran Hama, H.; Yassin Ghafour, M.; Masdari, M.; Hassan Ahmed, O.; Khezri, H. Service Selection Using Multi-criteria Decision Making: A Comprehensive Overview. J. Netw. Syst. Manag. 2020, 28, 1639–1693. [Google Scholar] [CrossRef] [Scilit]
- Castro, D.; Silv Parreiras, F. A review on multi-criteria decisionmaking for energy efficiency in making for energy efficiency in automotive engineering. Appl. Comput. Inform. 2021, 14, 53–78. [Google Scholar] [CrossRef] [Scilit]
- Hori, S.; Shimizu, Y. Designing methods of human interface for supervisory control systems. Control. Eng. Pract. 1999, 7, 1413–1419. [Google Scholar] [CrossRef] [Scilit]
- Saaty, T. The Analytic Hierarchy Process: Planning, Priority Setting, Resource Allocation; McGraw-Hill: New York, NY, USA, 1980; Volume 1. [Google Scholar]
- Aguilera Sánchez, Y.; Plasencia Soler, J.; Marrero Delgado, F. Procedimiento para determinar el impacto de la gestión de riesgos en la sostenibilidad de las organizaciones. Dir. Organ. 2021, 73, 39–49. [Google Scholar] [CrossRef] [Scilit]
- Chang, C.-W.; Wu, C.-R.; Lin, C.-T.; Chen, H.-C. An application of AHP and sensitivity analysis for selecting the best slicing machine. Comput. Ind. Eng. 2007, 52, 296–307. [Google Scholar] [CrossRef] [Scilit]
- Chen, Y.; Yu, J.; Khan, S. The spatial framework for weight sensitivity analysis in AHP-based multi-criteria decision making. Environ. Model. Softw. 2013, 48, 129–140. [Google Scholar] [CrossRef] [Scilit]
- Banda, W. An integrated framework comprising of AHP, expert questionnaire survey and sensitivity analysis for risk assessment in mining projects. Int. J. Manag. Sci. Eng. Manag. 2019, 14, 180–192. [Google Scholar] [CrossRef] [Scilit]
- Independent Group of Scientists appointed by the Secretary-General. Global Sustainable Development Report 2019: The Future is Now—Science for Achieving Sustainable Development; United Nations: Geneva, Switzerland, 2019. [Google Scholar]
- Saaty, T.; Peniwati, K. Group Decision Making: Drawing Out and Reconciling Differences; RWS Publications: Pittsburgh, PA, USA, 2013. [Google Scholar]
- Kułakowski, K. On the Geometric Mean Method for Incomplete Pairwise Comparisons. Mathematics 2020, 8, 1873. [Google Scholar] [CrossRef] [Scilit]
- Kao, F.-C.; Huang, S.-C.; Lo, H.-W. A Rough-Fermatean DEMATEL Approach for Sustainable Development Evaluation for the Manufacturing Industry. Int. J. Fuzzy Syst. 2022, 24, 3244–3264. [Google Scholar] [CrossRef] [Scilit]
- Tseng, M.-L.; Tan, P.; Jeng, S.-Y.; Remen Lin, C.-W.; Negash, Y.; Darsono, S. Sustainable Investment: Interrelated among Corporate Governance, Economic Performance and Market Risks Using Investor Preference Approach. Sustainability 2019, 11, 2108. [Google Scholar] [CrossRef] [Scilit]
- Chiu, Y.; Chen, H.; Tzeng, G.; Shyu, J. Marketing strategy based on customer behaviour for the LCD-TV. Int. J. Decis. Mak. 2006, 7, 143–165. [Google Scholar] [CrossRef] [Scilit]
- Hung, Y.; Chou, S.; Tzeng, G. Using a fuzzy group decision approach-knowledge management adoption. In Proceedings of the APRU DLI 2006 Conference, Tokyo, Japan, 8–10 November 2006. [Google Scholar]
- Wu, W.; Lee, Y. Developing global managers’ competencies using the fuzzy DEMATEL method. Expert Syst. Appl. 2007, 32, 499–507. [Google Scholar] [CrossRef] [Scilit]
- Tzeng, G.; Chiang, C.; Li, C. Evaluating intertwined effects in e-learning programs: A novel hybrid MCDM model based on factor analysis and DEMATEL. Expert Syst. Appl. 2007, 32, 1028–1044. [Google Scholar] [CrossRef] [Scilit]
- Adams, B.; Bohnhoff, W.; Dalbey, K.; Ebeida, M.; Eddy, J.; Eldred, M.; Hooper, R.; Hough, P.; Hu, K.; Jakeman, J.; et al. Dakota, A Multilevel Parallel Object-Oriented Framework for Design Optimization, Parameter Estimation, Uncertainty Quantification, and Sensitivity Analysis; Version 6.13 User’s Manual; U.S. Department of Energy Office of Scientific and Technical Information: Oak Ridge, TN, USA, 2020. [Google Scholar] [CrossRef] [Scilit]

Disclaimer/Publisher’s Note: The statements, opinions and data contained in all publications are solely those of the individual author(s) and contributor(s) and not of MDPI and/or the editor(s). MDPI and/or the editor(s) disclaim responsibility for any injury to people or property resulting from any ideas, methods, instructions or products referred to in the content. |
© 2024 by the authors. Licensee MDPI, Basel, Switzerland. This article is an open access article distributed under the terms and conditions of the Creative Commons Attribution (CC BY) license (https://creativecommons.org/licenses/by/4.0/).