


Abstract
The Rural Revitalization Strategy is an important policy enacted by the Chinese government, aimed at bridging the disparity between urban and rural areas while enhancing economic, cultural, and social development levels in rural areas. Research evaluating return-to-hometown entrepreneurship policies is pivotal for facilitating the sustained flow and comprehensive sustainable development of capital, technology, and talent to rural areas within the Rural Revitalization Strategy framework. This study employs NVivo12 and the policy modeling consistency (PMC) index to analyze trends, characteristics, and policy tool utilization quantitatively, as well as regional differences or commonalities in 55 return-to-hometown entrepreneurship policies of 16 provinces and autonomous regions in China from 2013 to 2023. The content analysis of these policy texts reveals trends characterized by multistakeholder participation, an increasing emphasis on technology integration, and increased efforts toward talent retention. Overall, the results of the PMC model analysis indicate that the scores for return-to-hometown entrepreneurship policies across 16 provinces (municipalities and autonomous regions) are relatively high in terms of the indices of policy field, policy content, and policy tools, whereas the scores are comparatively low in terms of the indices of policy nature and policy timeliness. The remaining indices present moderate scores with slight differences. When examining the average scores between the eastern and central-western regions, it is observed that there is only a very slight difference in the index of policy timeliness and policy implementation. Additionally, the performance of eastern regions is superior in terms of the index of policy issuer, policy functions, and policy content. However, central-western regions demonstrate higher scores in the indices of policy nature, policy field, policy tools, and policy evaluation.
1. Research Background
In recent years, China’s policy stance toward the countryside has activated rural resources, and many people have returned to their hometowns to become entrepreneurs, which is a rare phenomenon in the rest of the world [1]. Returning home for entrepreneurship represents one of the most important ways to effectively revitalize the rural economy, promote rural construction and governance, and achieve rural revitalization [2].
With the long-term encouragement and promotion of a series of national policies (see Table 1), the total number of entrepreneurs returning to their hometowns in China had reached 11.2 million by March 2022, doubling from 5.7 million in 2016. Henan and Hunan Provinces, which are prominent labor export provinces in China, are taken as examples. By the end of 2020, approximately 0.57 million people had returned to their hometowns and started businesses in 21 pilot counties (cities) in Henan Province, and approximately 0.39 million market entities had been established. In 19 pilot counties of Hunan Province, more than 0.11 million people had returned to their hometowns to start businesses, and approximately 0.1 million market entities had been established. In January 2022, the Ministry of Agriculture and Rural Affairs gave a notice on the issuance of the “14th Five Year Plan for the Construction and Development of Agricultural and Rural Talent Teams” [3], which set clear goals to support more than 1 million leaders in rural industrial revitalization and more than 15 million entrepreneurs returning to their hometowns by 2025, including 1 million rural entrepreneurial leaders.
Table 1.
List of home start-up policies.
Currently, return-to-hometown entrepreneurship is an important way for China’s large-scale rural population to achieve modernization and live in harmony with nature. This is a new topic linked to China’s urban–rural economic integration and social structure transformation, which is highly important for advancing the path to modernization for China. Scholars have put forward policy suggestions from various perspectives on the “determinants of returning entrepreneurs” [4] and “returning entrepreneur groups” [5,6], and some studies have also used relevant management tools [7,8]. However, there currently exists a gap in rigorous quantitative assessments of return-to-hometown entrepreneurship policies. Additionally, the research on the establishment of a scientific, rational, and comprehensive policy support framework in this area remains lacking. Quantitative policy analysis enables policymakers to comprehend the essence of policy initiatives, discern their limitations, and render scientific and unbiased judgments, thereby facilitating the optimization and realignment of policy orientations.
This study presents content analysis and quantitative evaluation research on the return-to-hometown entrepreneurship policies issued by governments or departments at the provincial level in 16 provinces (municipalities) in eastern and central-western China since 2013. The objectives of this research are to answer the following questions: (1) What are the evolutionary principles and trends of return-to-hometown entrepreneurship policies within the context of China’s rural revitalization strategy? (2) What are the characteristics, similarities, and differences among the return-to-hometown entrepreneurship policies implemented in the eastern and central-western regions of China? (3) Are there any inadequacies in the formulation of related policy tools, and what content should be updated or improved? Based on the analytical conclusions, a comprehensive evaluation of policies is conducted, and suggestions for improvement are proposed. The findings are intended to serve as a reference for the subsequent formulation and modification of return-to-hometown entrepreneurship policies that embody Chinese characteristics in the new era.
2. Literature Review
2.1. Definition of Related Concepts
Returning home to start a business is a highly distinctive phenomenon of population migration and employment in China, and various scholars have attempted to define it. It is generally agreed that returning home refers to returning to the village, township or county where one’s hometown is located [9]. Some migrant workers who have returned to their hometowns after a period of employment outside their home villages have used the knowledge, skills, capital, and information gained from such work to start businesses, develop industrial and commercial services, and invest in commercial agriculture in their home villages and small towns. This phenomenon is known as migrant workers returning to their hometowns to start businesses [10]. Wei and Zhu refined the definition of returning to the hometown for entrepreneurship as the behavior of farmers using the funds, skills, and information accumulated from working outside to return to their hometowns, establish enterprises, develop service industries, and invest in commodity agriculture in rural areas, small towns or county towns [11].
2.2. Research on Global Return-to-Hometown Entrepreneurship
Currently, there is a growing body of research examining the phenomenon of return migration and entrepreneurship globally. For example, studies have highlighted the positive effects of returning immigrants in Albania on employment and economic development in their home countries [12]. Investigations utilizing Egyptian data have explored the relationship between returning migrants and entrepreneurship, emphasizing the critical role of credit for returning entrepreneurs in developing countries [13]. Analyses have assessed how the return of Albanian migrants from Greece affects nonimmigrant labor markets [14]. Discussions from a sustainable livelihood perspective have examined behaviors among various groups, including women and youth in rural areas of underdeveloped countries [15]. Some studies have identified key factors influencing returning home entrepreneurship, focusing primarily on human capital [16], capital accumulation, and the entrepreneurial environment [17,18]. Furthermore, studies assessing the performance of returning home entrepreneurship often investigate metrics for measuring success as well as its determinants [19], such as access to credit capital [20], migrant work experience [21], and social capital [22], and evaluate its impact on local communities [23] in terms of economic growth outcomes [24,25] and job creation [26].
Many studies [27,28] have focused mostly on migrant workers who were born and raised in the countryside and who returned to their hometowns to start businesses, such as in terms of the driving factors [29,30], migrant worker experience and entrepreneurial behavior [31], characteristics and functions [28], influencing factors [32,33,34], and education and training systems [35]. In the Chinese context, with continuous updates and improvements in national policies, the target group of those returning to their hometowns has expanded to include young college graduates [6,36], entrepreneurs [5], and various talented individuals. In light of these findings, it is imperative that we pay more comprehensive attention to the needs of various groups in reality for policies advocating return-to-hometown entrepreneurship.
2.3. Research on the Return-to-Hometown Entrepreneurship Policy in Rural Revitalization
Studies have shown that the regional economic development level, government support, tax revenue, infrastructure construction, individual characteristics, family resource endowment, employment pressure, level of access to market information, and own risk tolerance all significantly affect the entrepreneurial behavior of returning populations [37]. Government policies, as important factors influencing the performance of such return-to-home entrepreneurship, have long been subjects of scholarly attention [29,38,39]. Especially in developing countries, government support greatly inspires entrepreneurial confidence among returning entrepreneurs, which can help or encourage them in facing issues related to credit, information, policies, etc. [11]. In addition, studies also consider how to measure and improve the performance of returning home for entrepreneurship [40]. Most researchers believe that policy support is beneficial for improving the performance of returning entrepreneurs, but the impact varies among entrepreneurs at different stages, with a greater impact on starting entrepreneurs and a smaller impact on entrepreneurs whose businesses already operate very well. Among them, enterprises lacking economic, human, and political capital benefit more significantly from policy support in terms of performance improvement [38,39].
Moreover, the process of return-to-hometown entrepreneurship in the new era of China has new characteristics, such as the volatility and uncertainty of results, the complexity of the subject, and the ambiguity of the business format. Solving this complex social issue requires the support of relevant industries, coordination of government policies, and efficient cooperation among multiple government departments. Therefore, the policy content itself has an important impact on the measurement and improvement of the performance of return-to-home entrepreneurs, especially in developing countries.
But current research on return-to-hometown entrepreneurship has focused mostly on influencing factors, such as regional prosperity [37], government support, tax level, and transportation facilities [38]. However, the government policies themselves, as the primary influencing factors, have not been fully discussed. It is essential to conduct a thorough analysis of the content encompassed within the return-to-home entrepreneurship policy because such a policy in China comprises not an isolated measure but rather a comprehensive policy system that integrates various policy tools, involves numerous government departments, spans different policy tiers, and extends over a long period. Clarifying the policy objectives, policy tools, functional intensity, coordination mechanism, and other policy content elements of China’s return-to-home entrepreneurship policy has significant practical importance for optimizing the allocation of policy resources, facilitating policy implementation, and enhancing the effectiveness, efficiency, and impact of such policies. Consequently, this study intends to undertake a comprehensive and scientific evaluation of the content of China’s return-to-hometown policy.
2.4. Quantitative Evaluation Research on Policy
Most of these quantitative evaluations on policy have involved text interpretation [41]. Libecap used the evolution of mining rights and land privatization in the mining area of Nevada, USA, as an example to code the newly added privatization legislation and court rulings from 1858 to 1895, initiating quantitative research on policy content [42]. At present, the evaluation of policy text content is an indispensable part of the policy-making process. The quantitative evaluation in this paper refers to the quantitative evaluation of the policy content.
Much research related to the evaluation of policy text content has concentrated on qualitative analysis or the examination of policy impacts [43]. Commonly used policy evaluation methods both domestically and internationally include the entropy weight technique for order of preference by similarity to an ideal solution (TOPSIS) method [44], the latent Dirichlet allocation (LDA) thematic model [45,46,47], the difference-in-differences model [48,49,50], and the policy model consistency (PMC) index model [51,52,53,54]. In 2010, scholars began to adopt the PMC index model as a quantitative evaluation method for single-policy text [55]. With the advancement of policy evaluation methodologies, quantitative policy evaluation research methods have become a hot topic of attention in the current policy research field [56]. Among them, the PMC index model is a quantitative model proposed by Estrada based on the Omnia Mobilis hypothesis to evaluate policy texts in detail [57,58]. Compared with other methods, the PMC index model has several advantages. First, it can be used not only quantitatively to evaluate a single policy but also to analyze the consistency between multiple policies. Second, the setting of variables at all levels is based mostly on text analysis, which is objective and scientific. Third, the evaluation indicators are diverse, and the PMC surface chart provides an intuitive display of the policy evaluation results. The PMC index can be used not only to analyze the internal heterogeneity, advantages, and disadvantages of policies from multiple dimensions but also to compare policies in different regions horizontally, making it easier to identify weak points in policy tools [47]. The variable settings of this model rely mainly on the high-frequency policy words and internal logic of policy samples extracted from text mining, which increases the objectivity and pertinence of evaluation. Therefore, the main difference in the construction of PMC index models for different research fields and policy samples lies in the variable settings [58]. For example, Zhang and Ying constructed 10 unitary indicators and 44 binary indicators for 10 entrepreneurship and innovation policies in 2017 with the PMC index model and completed the quantitative evaluation with a curve chart, which has certain reference significance [59].
At present, quantitative research on China’s return-to-home entrepreneurs predominantly collects data through questionnaires. These studies focus on the theme of migrant workers returning to their hometowns to start businesses [60], the determinants of their willingness to start businesses [61,62,63,64], and the variables that impact their entrepreneurial performance [65]. However, quantitative evaluations of return-to-home policy are still lacking. Therefore, we draw on previous quantitative evaluation methods of China’s policies, including but not limited to scientific and technological achievements, transformation policies [66], land protection policies [51], policies affecting the pork industry [52], science and sustainable development policies [67], employment promotion policies [68], waste classification and management policies [69], and so on, to conduct quantitative research on the policy of return-to-home entrepreneurs. Existing research has revealed that an excess degree of reliance is placed on supply-side and environmental policy, whereas demand-side policy tools are significantly underutilized. Consequently, the integration and optimization of these policy tools still needs further refinement [70]. Moreover, in the actual research process, policy implementation in a region is often affected by the continuous influence of multiple policies. Therefore, the analysis and evaluation of a single policy tend to lack sufficient practical guidance. In addition, under the same provincial policy, it is imperative to investigate whether there exist differences or commonalities in return-to-hometown entrepreneurship policies between economically developed regions and their less-developed counterparts.
To fill the abovementioned research gaps, this study selects 16 provinces and autonomous regions in China and carries out PMC index evaluation analysis and comparative study on the return-to-hometown entrepreneurship policies of each province and autonomous region from 2013 to 2023. Furthermore, this work innovatively introduces “policy tools” as an independent evaluation dimension, allowing for a more detailed and precise analysis of various policy tools. In addition, the PMC index model is used to compare and analyze the policies issued by the economically developed eastern region and the relatively underdeveloped central-western regions of China. In summary, this study explores the theoretical framework and practical construction of a quantitative evaluation of policy content to support return-to-home entrepreneurs. The outcomes of this study hold profound theoretical and practical implications for fostering the high-quality development of entrepreneurial returnees and for the holistic realization of China’s Rural Revitalization Strategy.
3. Research Design
3.1. Data Sources
All policy texts in this study were selected from provincial-level policy documents on return-to-hometown entrepreneurship in eastern and western provinces from 2013 to 2023. During the initial policy search, over 400 relevant policy documents were retrieved via the Chinese keyword “returning home” on the official websites of various provincial-level departments. To ensure the representativeness and effectiveness of the samples, all policy samples were screened manually according to the following criteria. First, it was ensured that all the policy texts are at provincial level. Second, policy documents that are actually related to return-to-hometown entrepreneurship were retained, and policies of other themes were excluded. Third, notification-related work documents, such as application notices, research notices, approvals, and lists, were excluded, and normative and guiding documents, such as implementation opinions and work plans, were retained. A total of 55 policy documents were selected as samples for this study, covering a time span of 11 years (see Table 2).
Table 2.
Policy sample table.
3.2. Research Methods
In this study, Nvivo 12 Plus software and the PMC policy index model are taken as tools to analyze the policy texts. NVivo12 software is used for two main purposes. One purpose is to statistically and visually present the publication date and quantity of policy samples and summarize the publication rules and development trends of return-to-hometown entrepreneurship policies. The second purpose is to extract and quantify keywords and high-frequency words from the policy texts, select sample variables and identification parameters, and provide a basis for determining indicators in the PMC index model policy text evaluation system in the following section. The PMC policy model is subsequently used to analyze the overall quality of policies for returnee entrepreneurship and the differences in policy formulation between the eastern and central-western regions of China.
4. Overview of Policy Text
4.1. Policy Measurement Statistics
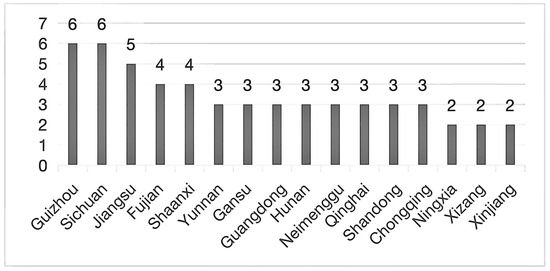
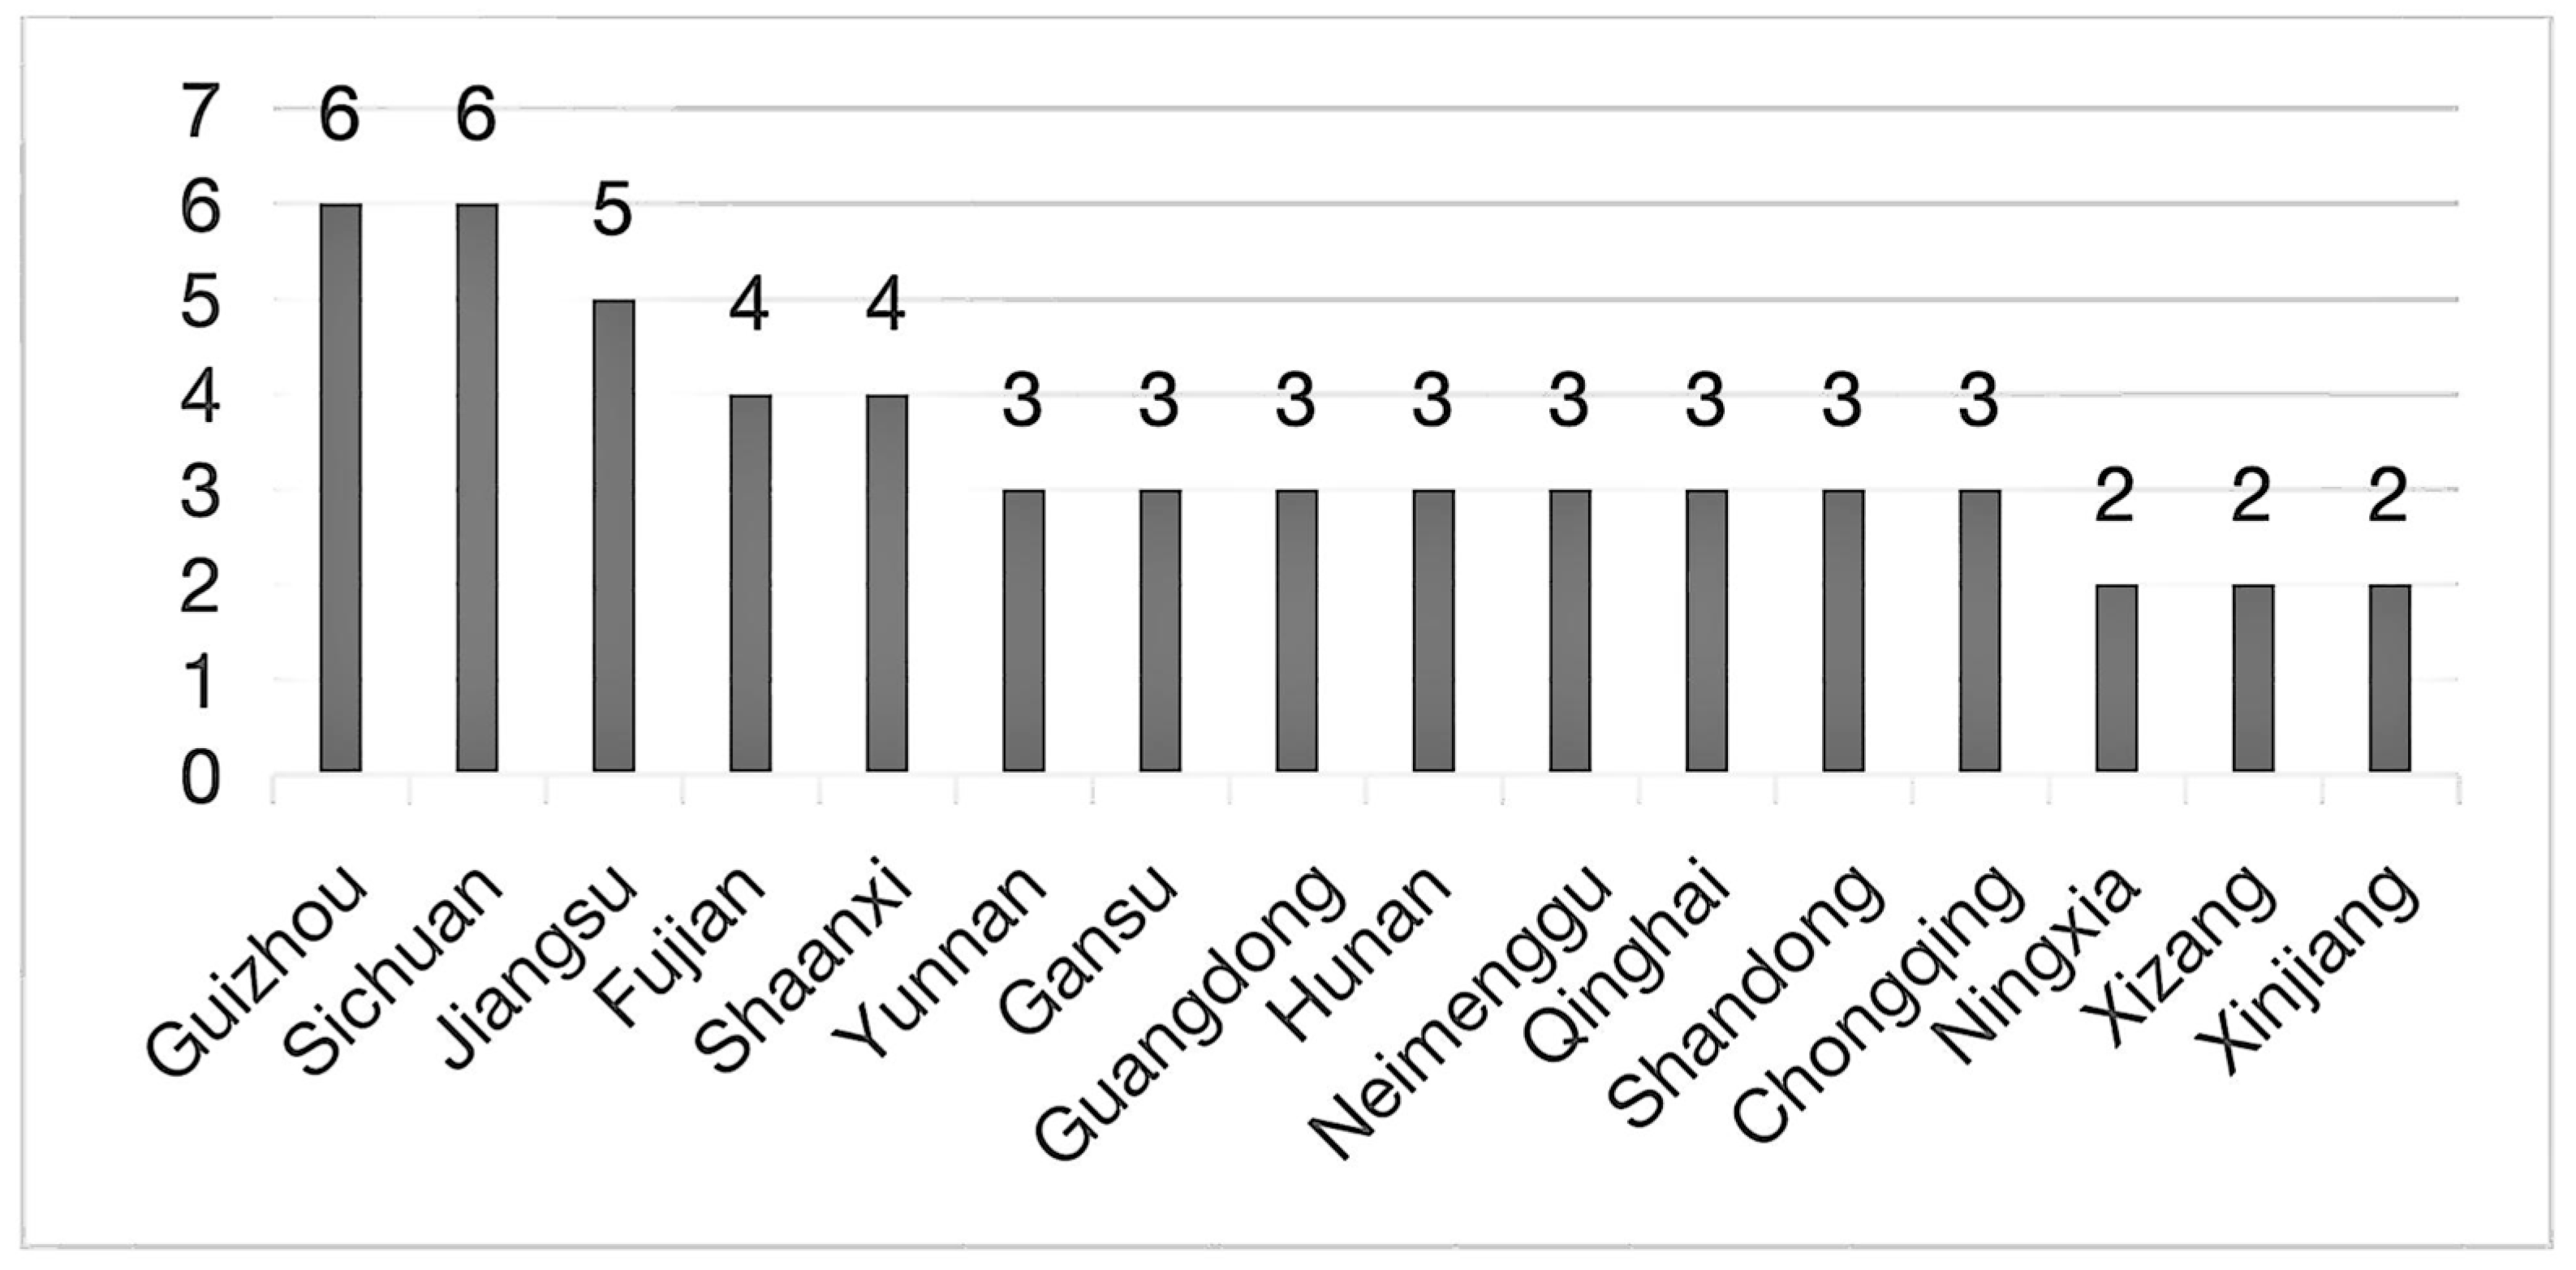
The policy samples were issued by a total of 16 provinces. According to the statistics of the number of publications from eastern and central-western provinces (see Figure 1), Guizhou and Sichuan Provinces issued the majority of provincial-level policy texts over the decade, with a total of six each. According to the sample, 12 provinces in the west contributed 40 samples, accounting for more than 70% of the whole sample. Among the four eastern provinces, Jiangsu and Fujian issued five and four provincial-level policy documents, respectively, while the other provinces in the eastern region did not issue many policies to promote returnee entrepreneurship. This difference also indicates that the central-western region, as a labor export area, remains the main location in the country for promoting entrepreneurship among people returning home from large cities. The revitalization and development of rural areas rely mainly on the labor force. However, the long-term trend of many rural laborers flowing from rural areas to cities and from the central and western regions to the eastern regions in China has led to a series of problems in rural development, such as low population density, serious rural population aging, and a lack of vitality in the rural economy. To address these issues, policies for returning home and starting businesses in the central-western provinces of China are aimed at reducing the enormous degree of imbalance in population mobility, attracting talent and resources back to rural areas, and achieving new breakthroughs in rural revitalization.
Figure 1.
Numbers of publications from 16 provinces.
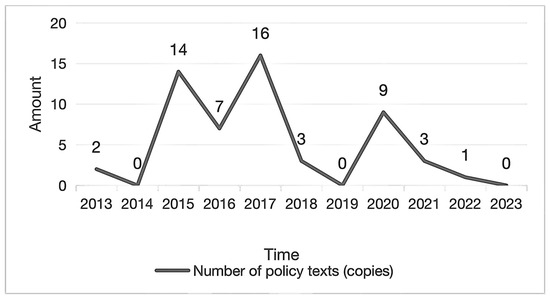
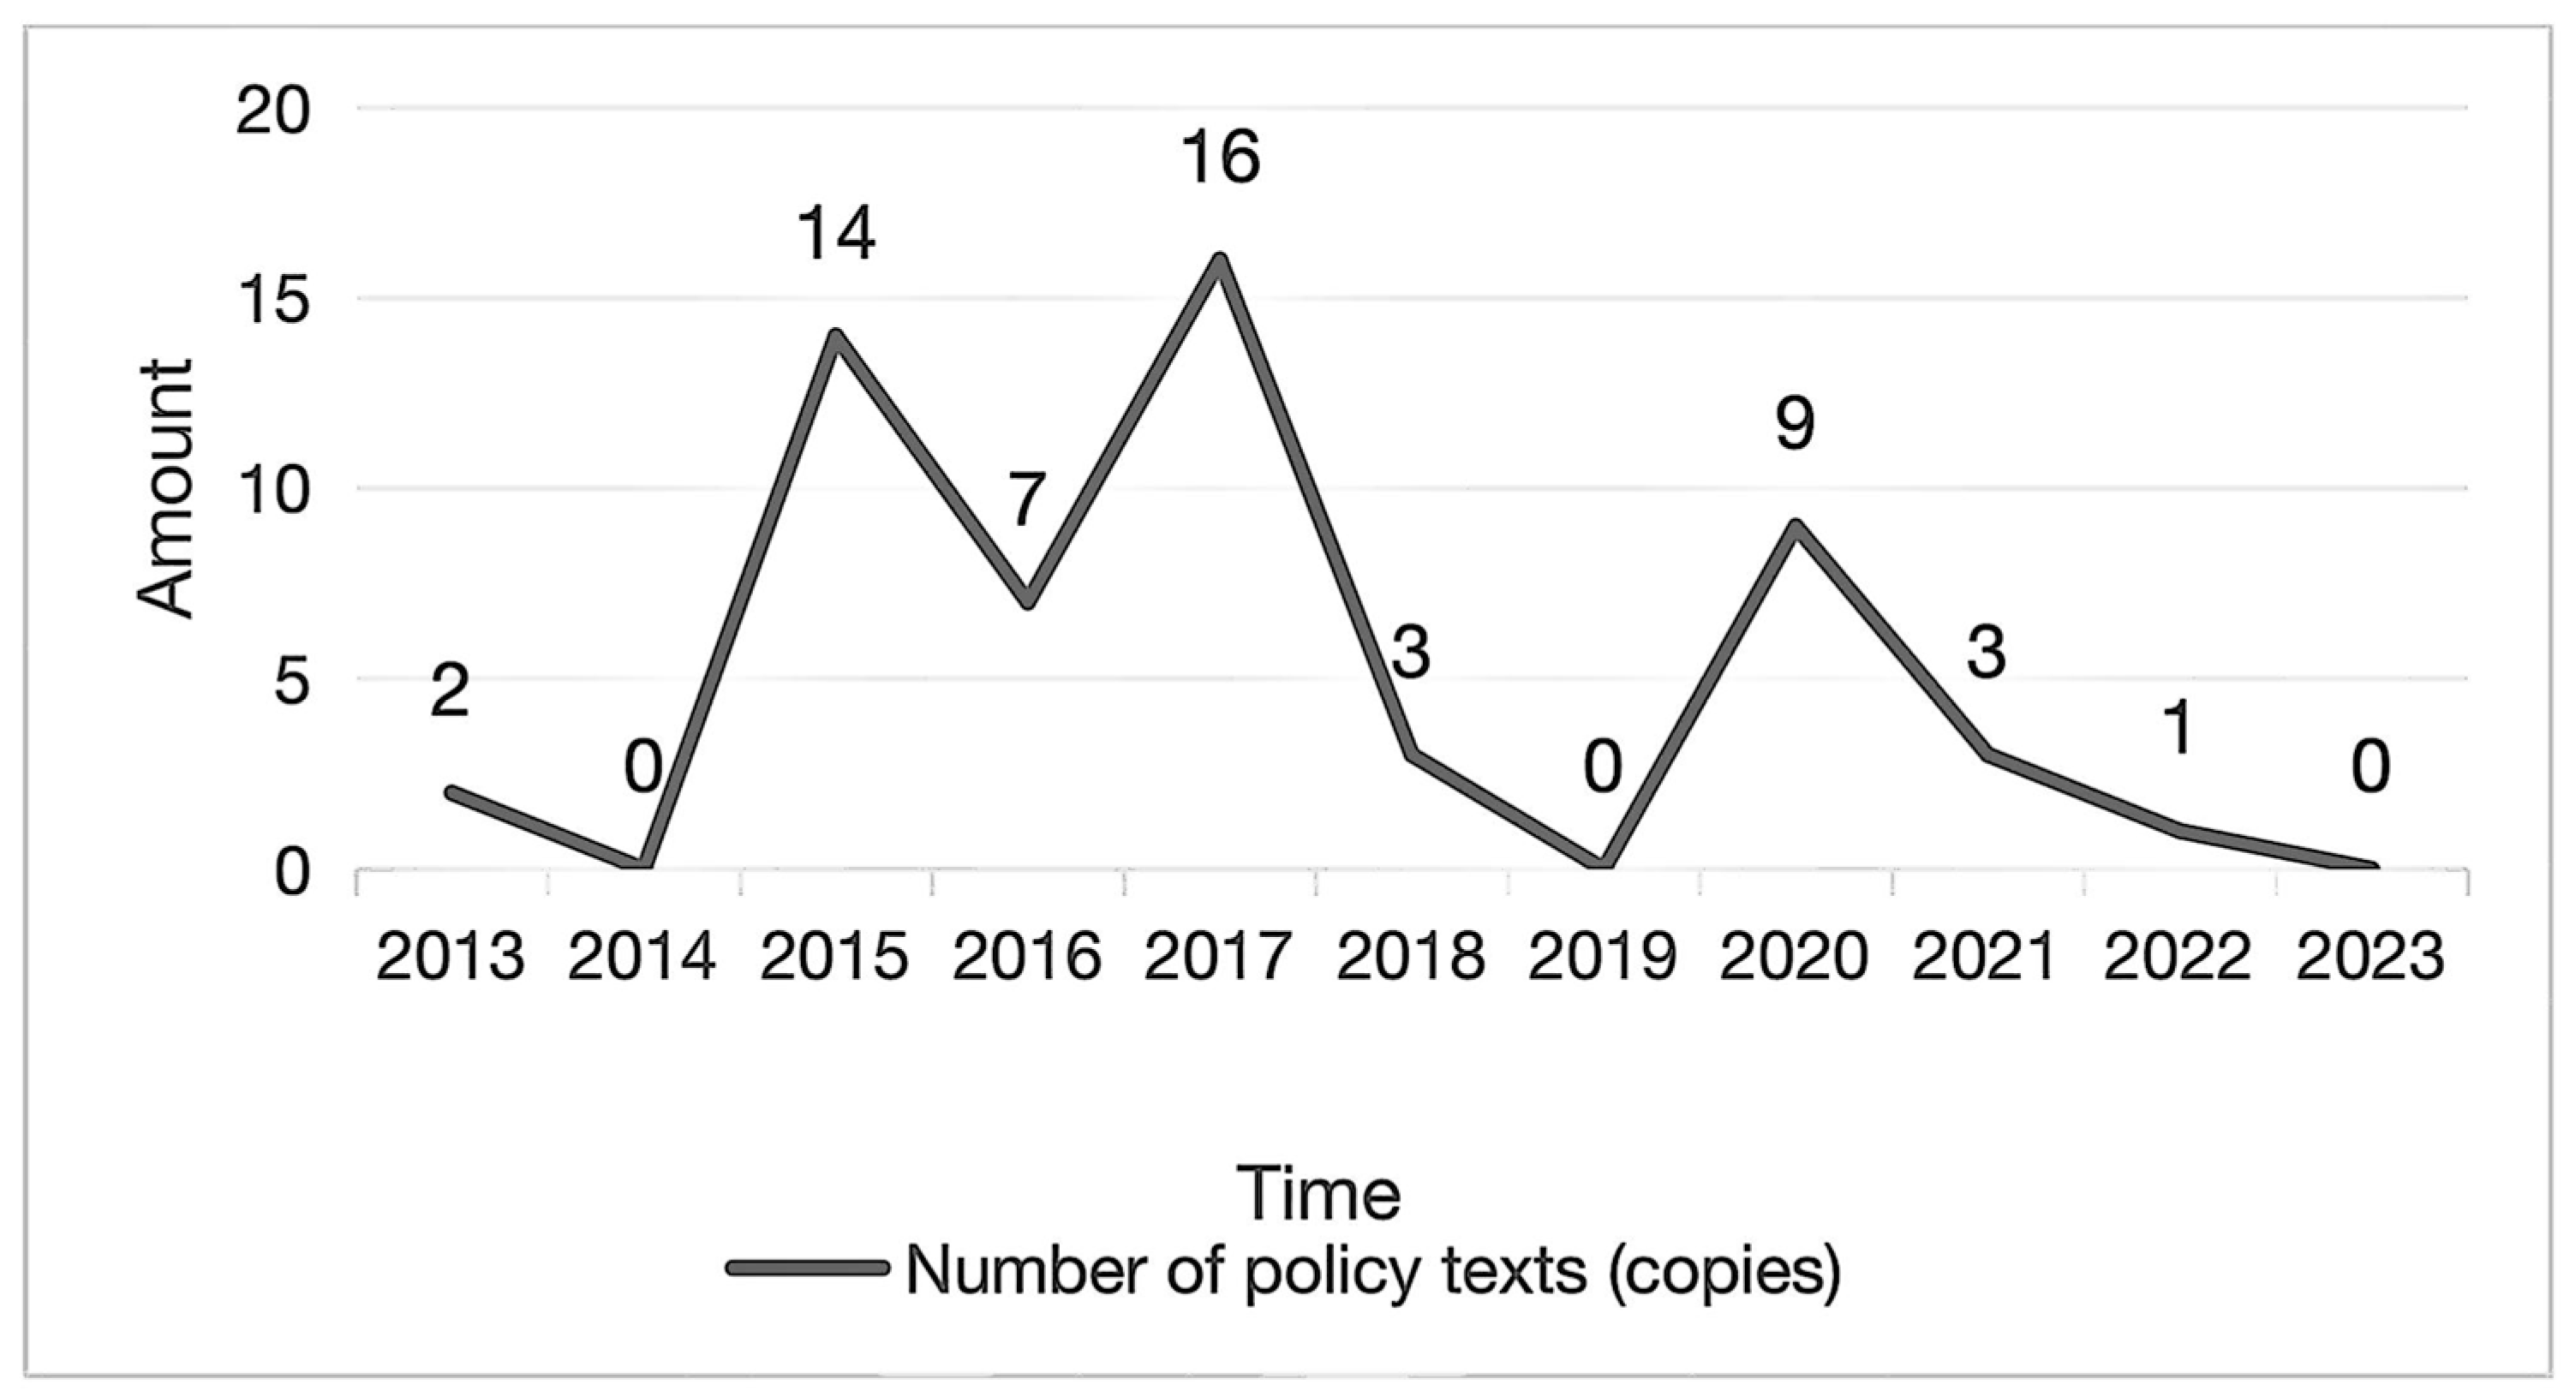
According to the overall trend, there have been three peak periods regarding the release of policy since 2013 (see Figure 2), with fourteen cases in 2015, sixteen cases in 2017 and, in 2020, accounting for more than 70% of all policy samples. A retrospective comparison of policy texts over these three years reveals that the three policy issuance peaks were closely related to the release of national-level guidance documents. In 2015, after the State Council issued the “Opinions of the General Office of the State Council on Supporting Migrant Workers and Other Personnel to Return to Their Hometowns for Entrepreneurship”, various provinces and autonomous regions actively responded and successively issued action plans and implementation opinions for practical action. At the end of 2016, the State Council issued the “Opinions of the General Office of the State Council on Supporting Entrepreneurs and Innovators Returning to the Countryside to Promote the Integrated Development of the Primary, Secondary and Tertiary Industries in Rural Areas”. The Opinions provided a basis for the provincial implementation of policies supporting entrepreneurs and innovators returning to the countryside to promote the integrated development of the primary, secondary, and tertiary industries. In 2020, 19 departments, including the National Development and Reform Commission, the Ministry of Education, and the Ministry of Science and Technology, jointly issued the “Opinions on Promoting the High-Quality Development of Returning Home and Entering Rural Areas for Entrepreneurship”. Shortly afterwards, various provinces issued more specific policy implementation opinions.
Figure 2.
Trend of policy text issuance.
The release of provincial-level policy texts promoting entrepreneurship in rural areas still relies heavily on central guidance documents. There are two main implications of this trend. On the one hand, it reflects the active promotion of provincial departments in response to national policy documents; on the other hand, it reveals a lack of autonomy and creativity in promoting innovation and entrepreneurship in rural areas.
4.2. Analysis of Policy Text Content
In this study, Nvivo12 software was used to mine, analyze, and compare keywords in the sample policy texts. Through word frequency analysis, the key content and changes in key nodes before and after the promotion of entrepreneurship policies in the eastern and central-western provinces of China were presented. This provided a basis for creating policy analysis frameworks and establishing parameters for the subsequent PMC model evaluation.
4.2.1. Overall Word Frequency Analysis
The Nvivo12 word frequency query function was used to extract keywords from all 55 policy texts on return-to-hometown entrepreneurship. By merging synonyms such as “strengthen” and “carry out”, which do not have practical meaning, a keyword cloud map was output (see Figure 3), and the 40 words with the highest frequency of occurrence were extracted (see Table 3).
Figure 3.
Word cloud diagram of policy texts.
Table 3.
Statistics of high-frequency words in the policies regarding return-to-hometown entrepreneurship.
The high-frequency keywords represent three basic characteristics of the policy texts. First, agriculture is the core market of return-to-hometown entrepreneurship, and rural areas remain the main battlefield. Second, industrial construction, enterprise development, and innovation are the main themes. Third, policy support, multi-subject participation, the establishment of cooperation platforms, resource allocation, financial support, technological support, and the improvement in social security are the key policy tools for promoting the movement of people from cities to their hometowns in rural areas to start businesses or find jobs.
4.2.2. Rules and Trends of Policy Development
The proposal of the rural revitalization strategy at the 19th National Congress of the Communist Party of China in October 2017 was taken as a key time point for further study. Changes in word frequency in the policies on return-to-hometown entrepreneurship before and after this date were considered (see Table 4) for comparison and analysis. The following four new trends were observed.
Table 4.
Word frequency statistics in returnee entrepreneurship policies before and after issuance of the rural revitalization strategy.
Diversification of policy subjects. In the early stage, “migrant workers” were the main policy target; however, with the passage of time, professional talent, scientists and technicians, college graduates, and entrepreneurs were attributed as playing increasingly important roles in policies. This reflects the characteristics of diversified and popularized policy subjects for return-home entrepreneurship since the implementation of the rural revitalization strategy and the continued expansion of the scope of included groups.
Technology as a driving factor. In policies released after 2018, the frequency of words such as “technology”, “majors”, and “universities” increased significantly, indicating that the return-to-hometown entrepreneurship policy is gradually promoting the more scientific, cutting-edge, and sustainable development of rural industries and truly stimulating the vitality of rural development.
Talent attraction and motivation. The term “talent” jumped to the top 20 in the frequency ranking of the related policy texts after the proposal of the rural revitalization strategy. A reverse search was performed via NVivo12 to locate the position where the word “talent” appears. By considering the semantics before and after this point, it was found that the policy texts emphasized invitation and incentive measures for technical talent and high-level management talent. To be specific, policy tools used to strengthen and retain talent in rural areas were found to be more specific and operable compared to other policy tools.
Enhancement of identity recognition among returnee entrepreneurs. The frequency of the phrase “getting down to the countryside” ranked seventh in policy documents before 2018 but presented a sharp decline after that, dropping out of the top 30 in terms of frequency. In Chinese, the phrase “go down to the countryside” represents a shift from upper strata to lower strata and strongly reflects an urban–rural binary structure. However, this term was gradually replaced by words such as “returning home” and “entering the countryside” in documents issued after 2018. This change reflects the blurring of urban–rural boundaries at the policy level, enhances the subjectivity and identity recognition of the returning entrepreneurial group, and is beneficial for the integrated development of urban and rural areas through the rural revitalization strategy.
To sum up, between 2013 and 2023, the number of provincial-level return-to-hometown entrepreneurship policies obviously fluctuated in response to national policies. The sample policies provide support and management for return-to-hometown entrepreneurship from multiple areas such as the economy, technology, and culture. Policy content includes but is not limited to promoting industrial development, building platforms and bases, and implementing specific projects. Moreover, the provision of investment, financial subsidies, education and training, infrastructure construction, and social security are common tools used in policies. These policies function in terms of the following aspects: overall planning, coordinated promotion, publicity and guidance, the systematic improvement of policies, etc. Furthermore, with the passage of time, the policies have exhibited trends of multisubject participation, the increasing role of technology and talent, and the gradually enhanced policy cultural attributes.
5. Analysis of Returnee Entrepreneurship Policy Based on the PMC Index
5.1. Variable Selection and Parameter Configuration
This study draws on the PMC model employed by previous scholars in their policy evaluation analyses and adapts it to the specific characteristics of the returnee entrepreneurship policy [4,55,70,71]. A total of nine primary variables are identified for inclusion in the PMC evaluation model. Based on the results from a semantic induction and frequency analysis of high-frequency words in 55 policy documents from 16 provinces (municipalities and autonomous regions) using Nvivo12, as well as the key research areas and directions proposed by earlier scholars [36,72], 49 secondary variables are established. The criteria for evaluating each secondary variable are interpreted in detail, as shown in Table 5, to ensure the optimal accuracy of the results.
Table 5.
Evaluation index of 16 provinces (municipalities) and autonomous regions.
5.2. Establishing a Multi-Input–Output Table
In accordance with the PMC model, a binary approach to parameter setting is adopted. Specifically, equal weights are assigned to all secondary variables associated with a given primary variable. When the content of a policy document aligns with the criteria of a secondary variable, a value of 1 is assigned; otherwise, a value of 0 is applied. Owing to space limitations, only the X1 policy attribute is illustrated as an example (see Table 6). The methodology for the remaining variables follows the same logic.
Table 6.
Multi-input–output table.
5.3. PMC Index Calculation
The calculation of the PMC index involves four steps [57]:
First, the nine primary variables and the 49 secondary variables are input into the multi-input–output table.
Second, values are assigned to each secondary variable on the basis of the content of the policy documents, following the principles outlined in Formulas (1) and (2).
Third, the values of all secondary variables under each primary variable are aggregated by summing them and calculating the arithmetic mean, as specified in Formula (3), to determine the value of each primary variable.
Fourth, the values of all primary variables are aggregated to obtain the final PMC index, as specified in Formula (4).
According to the grading criteria for the PMC index established by Estrada [57], the PMC index can be classified into four categories, “poor”, “acceptable”, “good”, and “perfect”, ranging from low to high. The corresponding score ranges are [0,4], [4,6], [6,8], and [8,9], respectively. The value of each primary variable, PMC scores and ratings for return-to-hometown entrepreneurship policies across 16 provinces (municipalities) and autonomous regions are shown in Table 7.
Table 7.
The value of each primary variable, PMC scores and ratings for return-to-hometown entrepreneurship policies across 16 provinces (municipalities) and autonomous regions.
5.4. Construction of the PMC Surface Plot
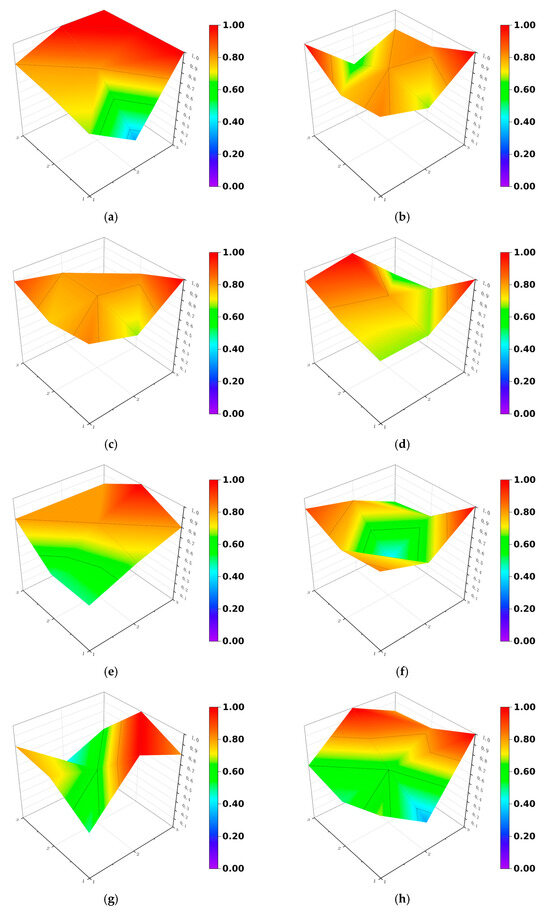
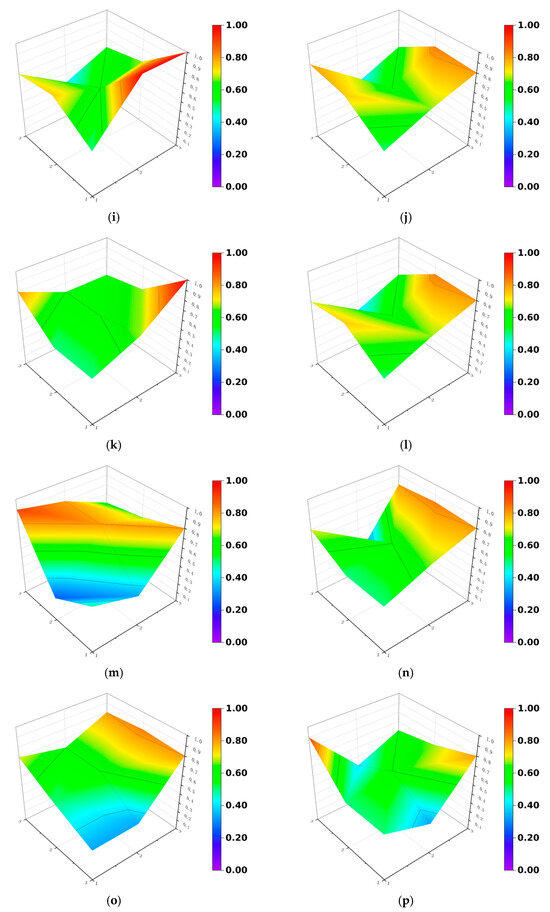
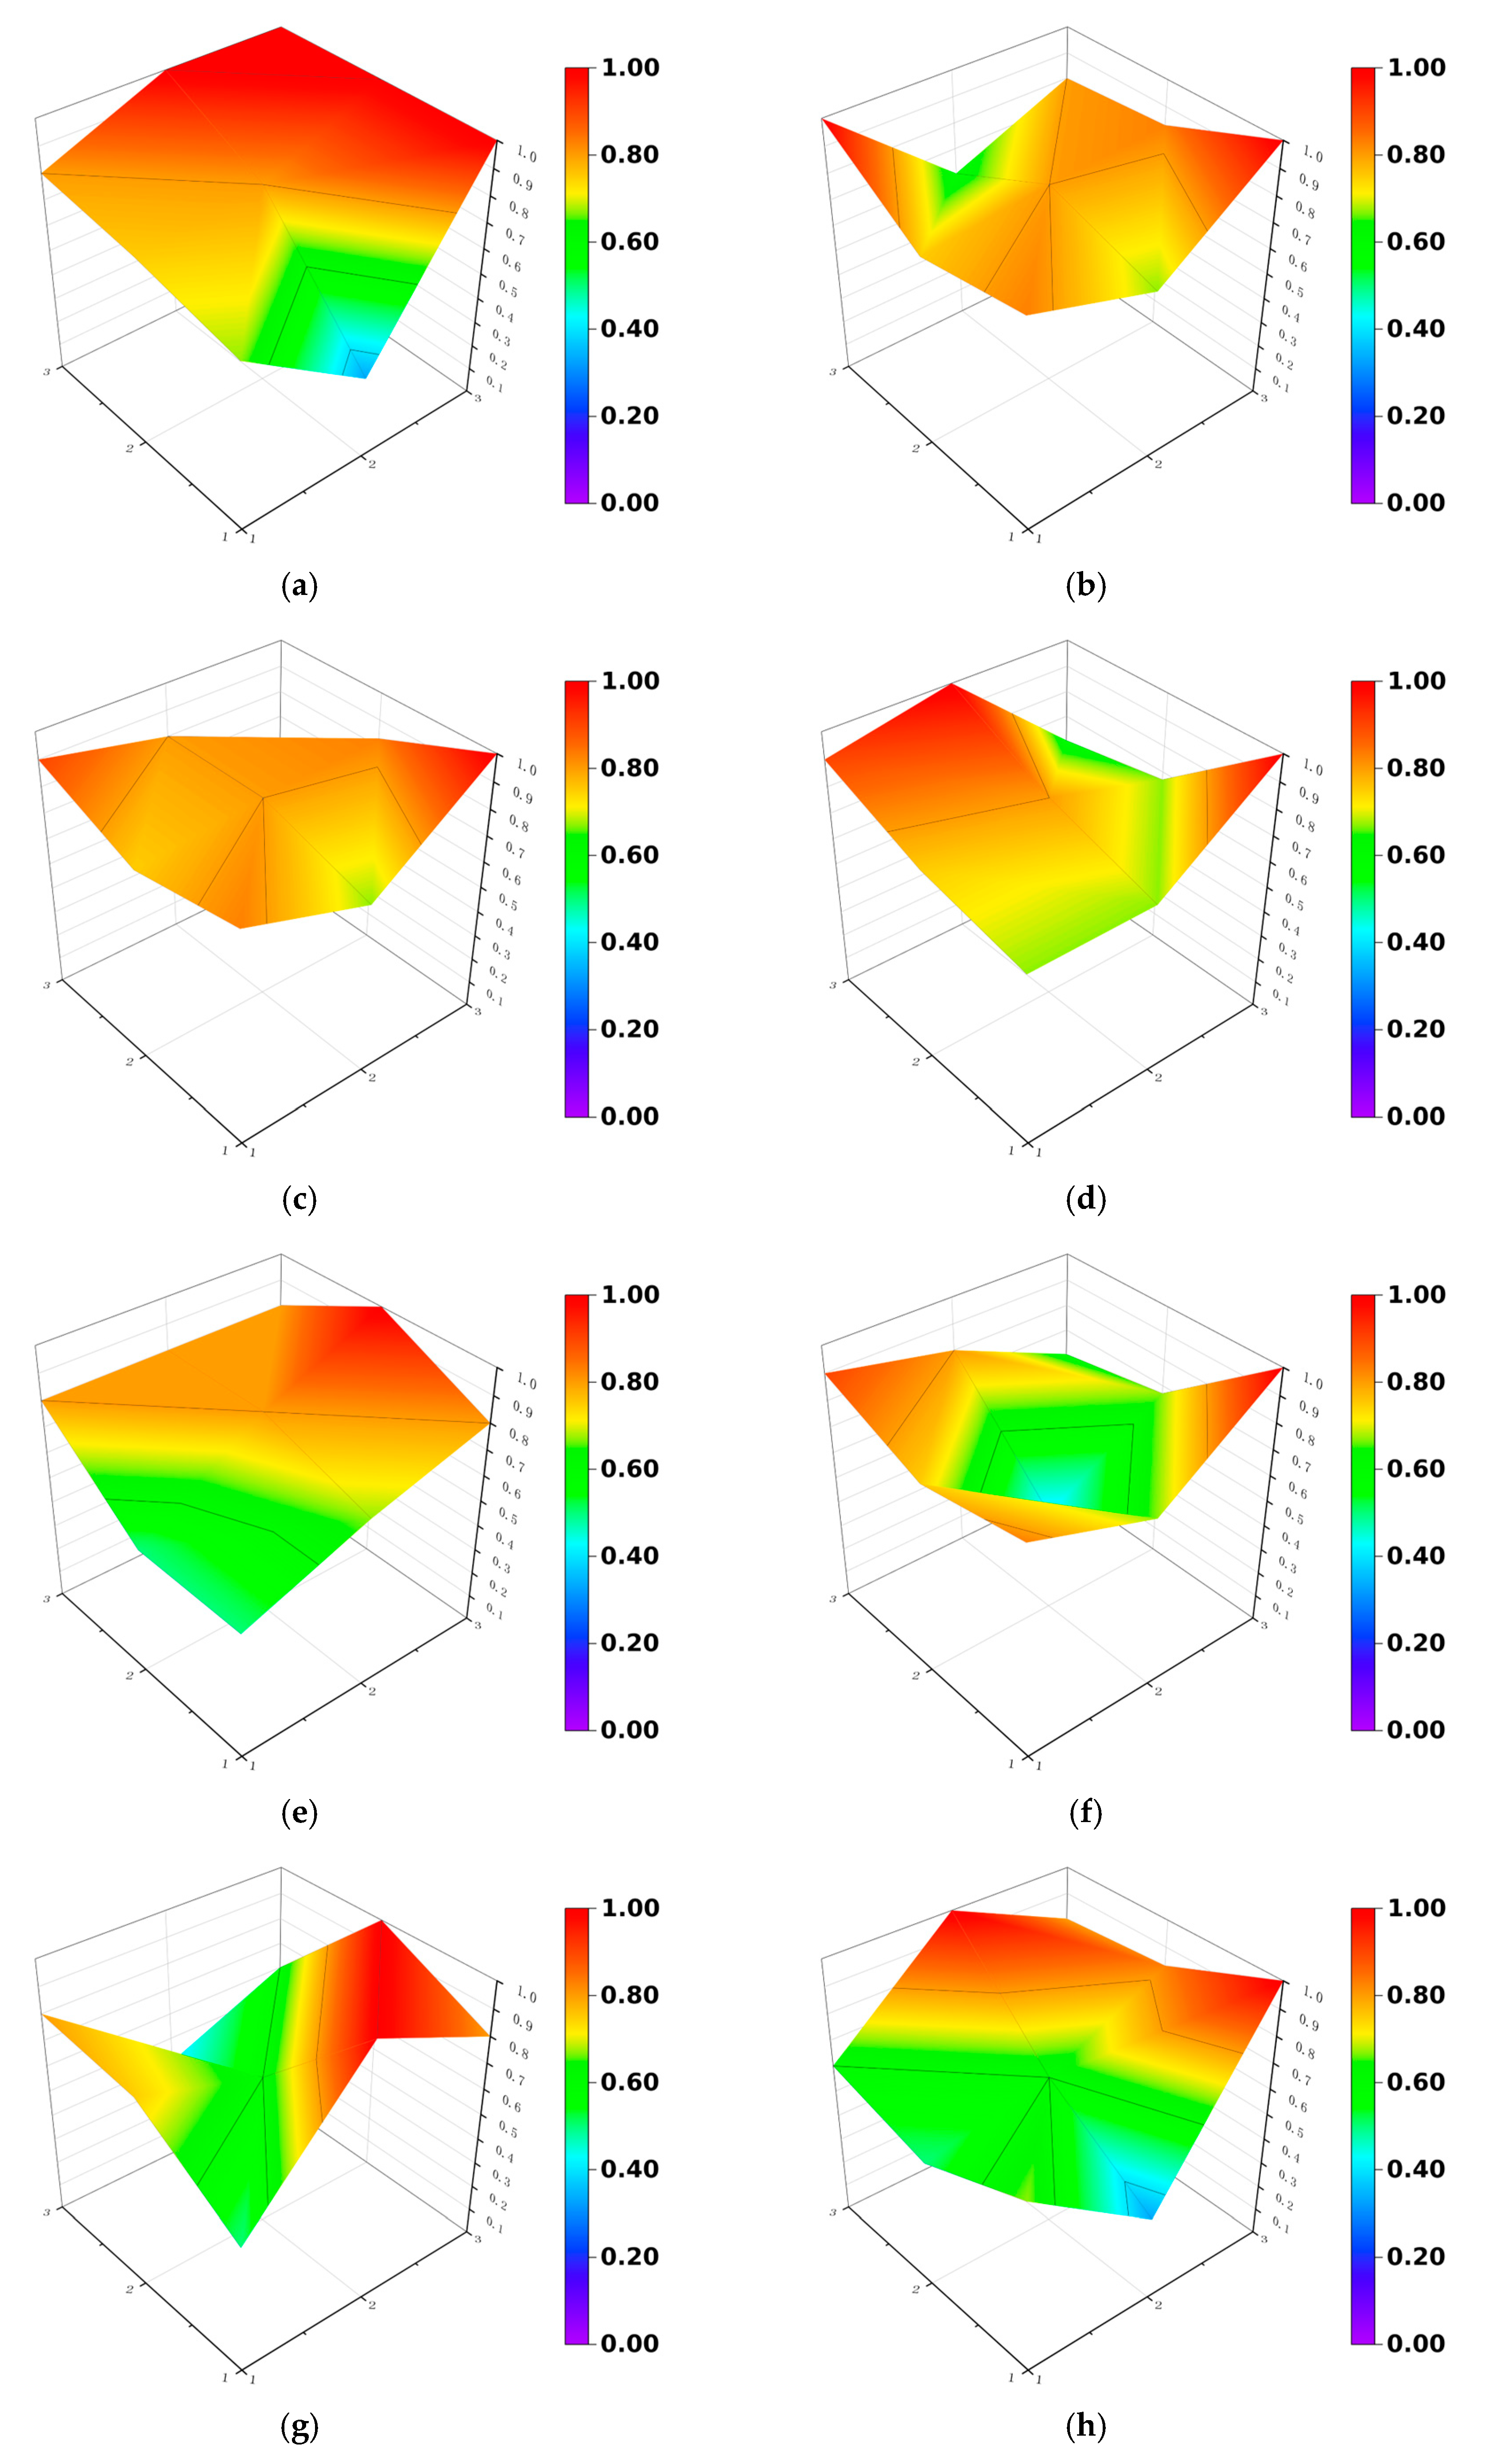
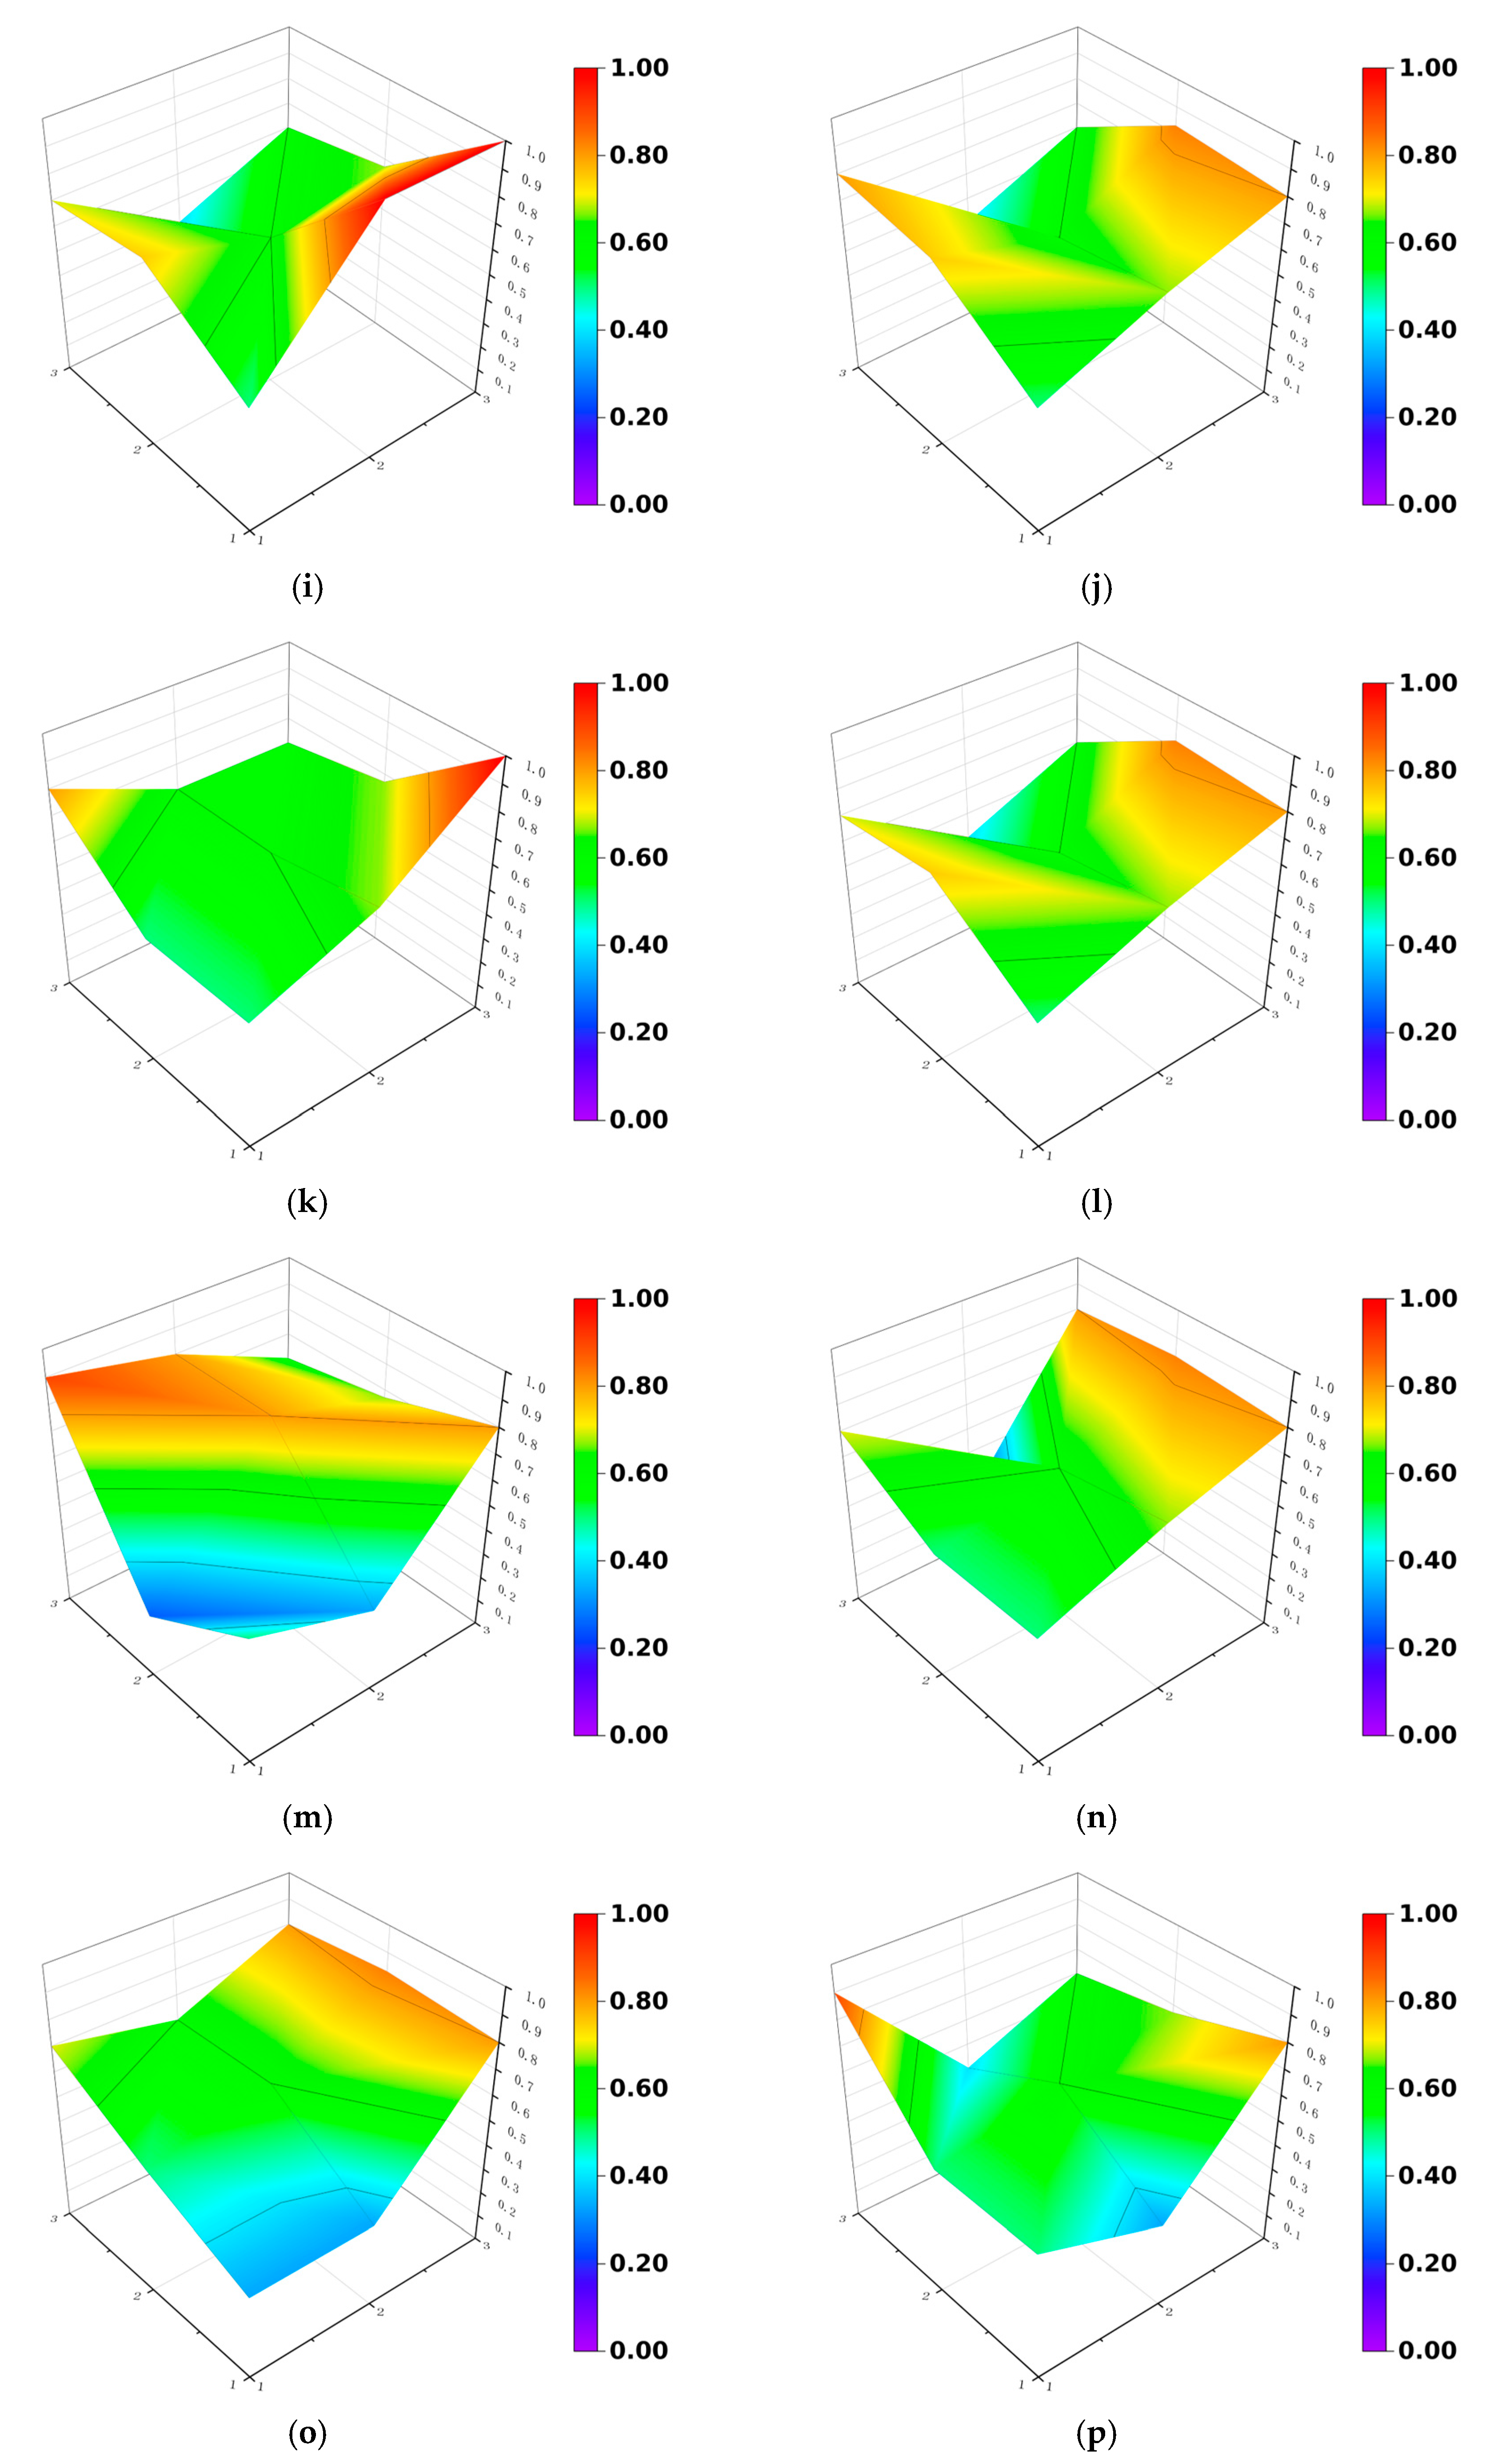
The PMC surface plot visually represents the scores of a policy across nine dimensions in three-dimensional space through protrusions or depressions in the surface. Protrusions indicate higher scores according to the evaluation criteria, while depressions indicate lower scores. By incorporating the primary variable values from the PMC scores of the returnee entrepreneurship policies for each province (municipality) and autonomous region, a third-order matrix is constructed according to Formula (5). Surface plots are then generated for each province’s policy PMC scores. For ease of analysis, the surface plots are arranged in descending order of the PMC values, as illustrated in Figure 4a–p.
Figure 4.
(a) Fujian PMC surface plot of return-to-hometown entrepreneurship policies. (b) Sichuan PMC surface plot of return-to-hometown entrepreneurship policies. (c) Shanxi PMC surface plot of return-to-hometown entrepreneurship policies. (d) Yunnan PMC surface plot of return-to-hometown entrepreneurship policies. (e) Qinghai PMC surface plot of return-to-hometown entrepreneurship policies. (f) Gansu PMC surface plot of return-to-hometown entrepreneurship policies. (g) Hunan PMC surface plot of return-to-hometown entrepreneurship policies. (h) Guizhou PMC surface plot of return-to-hometown entrepreneurship policies. (i) Chongqing PMC surface plot of return-to-hometown entrepreneurship policies. (j) Jiangsu PMC surface plot of return-to-hometown entrepreneurship policies. (k) Xinjiang PMC surface plot of return-to-hometown entrepreneurship policies. (l) Shandong PMC surface plot of return-to-hometown entrepreneurship policies. (m) Xizang PMC surface plot of return-to-hometown entrepreneurship policies. (n) Guangdong PMC surface plot of return-to-hometown entrepreneurship policies. (o) Ningxia PMC surface plot of return-to-hometown entrepreneurship policies. (p) Inner Mongolia surface plot of returnee entrepreneurship policies.
5.5. Result Analysis
5.5.1. Overall Result Analysis
According to the PMC index results, nine provinces (56% of the whole sample) have scores within the range of [6,8], which corresponds to the “good” policy level. Seven provinces (44% of all samples) have PMC scores in the range of [4,6], indicating the “acceptable” policy level. Notably, there are no scores above 8 or below 4, which means that no province achieved a “perfect” level, nor did any fall into the “poor” category. This finding shows that the return-to-hometown entrepreneurship policies of 16 provinces (municipalities) and autonomous regions have basic elements and content, but there remains potential for improvement [70].
The average PMC index of the whole sample is 6.31, reflecting an overall “good” level of policy performance. The highest PMC score is observed in Fujian Province at 7.35, while the lowest is recorded in Ningxia at 5.3, revealing a disparity of 2.05 points, which reflects the fact that there are some differences across individual provinces.
Horizontally, on the basis of the mean scores, the nine primary evaluation indices for these policies rank from best to worst as follows: policy field, policy tools, policy content, policy function, policy implementation, policy evaluation, policy issuer, policy timeliness, and policy nature.
Vertically, among the primary indices, policy evaluation and policy timeliness have the two greatest score differences, with gaps of 0.8 and 0.67, respectively. This indicates significant variability in policy evaluation, policy timeliness, and policy issuers among the provinces. In contrast, policy domain and policy content are the two indices with the smallest score differences, with gaps of 0.2 and 0.33, respectively, suggesting minimal variation in policy domain and content across the 16 provinces.
Policy instruments are typically categorized into demand tools, supply tools, and environmental tools [73]. The corresponding secondary variables and their average values in the input–output table are presented in Table 8.
Table 8.
Categorization of policy instruments and their average values of the secondary index in the input–output table.
According to Table 7, the scores of all samples for the primary variable “policy instruments” are in the range of 0.6–1.0, reflecting a relatively narrow overall disparity. Nevertheless, as evidenced in Table 8, the average value for demand tools is markedly lower than that for supply and environmental tools, indicating that demand tools are less frequently incorporated into policies than are supply and environmental tools [70,74]. Moreover, within the three secondary indices of demand tools, all provinces utilize typical incentive mechanisms to stimulate and foster return-to-hometown entrepreneurship. However, the policies in only one-quarter of the provinces address the specific index of investment promotion and market advantages.
5.5.2. Analysis of Rating and Classification Results
(1) Analysis of “good” policy results
A total of nine provinces present policies reaching scores over 6, which can be categorized as “good”. Among these provinces, Fujian, Sichuan, Shanxi, and Yunnan provinces have PMC indices above 7. The PMC surface plots for these provinces clearly show that the majority of the surface area is situated in the upper region of the graph. In particular, Fujian Province presents high values across all primary indices, with scores of 0.67 or above. However, the value for policy timeliness is notably lower at 0.33, resulting in a visible depression in the surface plot. This low score for policy timeliness is identified as the primary factor preventing Fujian’s policies from obtaining an “excellent” rating.
The surface plots for the remaining three provinces—Sichuan, Shaanxi and Yunnan—are flatter but still exhibit varying degrees of minor depressions. For these provinces, the minimum values for the primary index are all 0.6. Specifically, Shaanxi and Yunnan have the lowest scores in the policy functions indicator, while Sichuan’s lowest score is in the policy evaluation indicator.
The PMC indices of the provinces of Qinghai, Gansu, Hunan, Guizhou, and Chongqing are in the range of 6–7. Among them, Qinghai presents values equal to or greater than 0.5 for all primary indicator scores, resulting in the flattest surface plot, with the lowest points at the policy nature and policy issuer indices. In contrast, the lowest primary indicator score of Gansu, Hunan, and Chongqing is 0.4. Gansu’s lowest score concerns the policy execution indicator, while Hunan’s and Chongqing’s lowest scores appear in the policy evaluation indicator. Guizhou has a minimum primary indicator score of 0.33, reflected in the policy timeliness indicator.
Overall, in the “good” policy category, the indices that prevent the total score from reaching a higher level include policy nature, policy timeliness, policy issuer, policy execution subject, policy evaluation, and policy functions. Among these, policy evaluation and policy timeliness are particularly notable. The policy evaluation indicator comprises five secondary indices. According to the input–output table, provinces with lower scores often face issues such as nonspecific objectives, a lack of performance assessments, and ineffective policy adaptation to local conditions. The policy timeliness indicator includes only three secondary indices. In other words, if a province’s policy documents pertain to only one period and there are no subsequent related documents, this will result in a low score of 0.33. Fujian and Guizhou present this situation as well.
(2) Analysis of “acceptable” policy results
The PMC indices for the provinces of Jiangsu, Xinjiang, Shandong, Guangdong, Xizang, Ningxia, and Inner Mongolia fall within the range of 5–6, such that their policies are classified as “acceptable”. Several key pieces of information are revealed through index and plot analysis. First, all seven provinces have indices with scores above 0.8, indicating that their policies have some high-scoring aspects. Second, the surface plots for these provinces are mostly positioned between heights of 0.5 and 0.6, with the lowest points ranging from 0.2 to 0.5. Specifically, Guangdong, Jiangsu, and Shandong have the lowest points in the policy evaluation indicator, with scores of 0.2, 0.4, and 0.4, respectively; Inner Mongolia and Ningxia have the lowest points in the policy timeliness indicator, with a score of 0.33; and Xinjiang has the lowest point in the policy nature indicator, with a score of 0.5. When these findings are compared with those for the policies reaching “good” level, the reasons for the low scores are similar. All “acceptable” policies have scores of 0.5 or below for the policy nature indicator. An examination of the secondary index for the policy nature indicator in the input–output table shows that, except for Jiangsu, the other six provinces lack detailed content related to the policy nature.
Additionally, all provinces rated “acceptable” lack content related to forecasting and diagnosis.
In summary, it can be found that both “acceptable” and “good” policies exhibit similar “dimensional valleys” in their formulation, with the former showing more pronounced shortcomings, particularly in the area of policy nature.
5.5.3. Regional Score Comparison Analysis
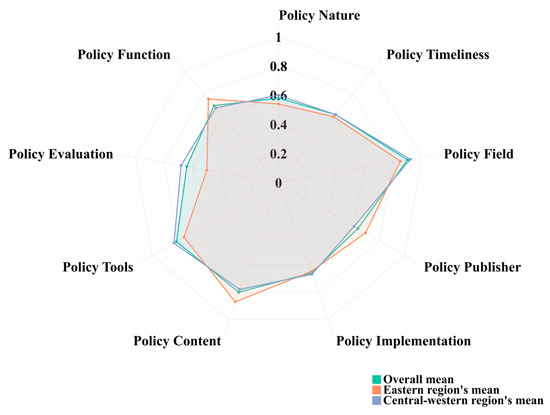
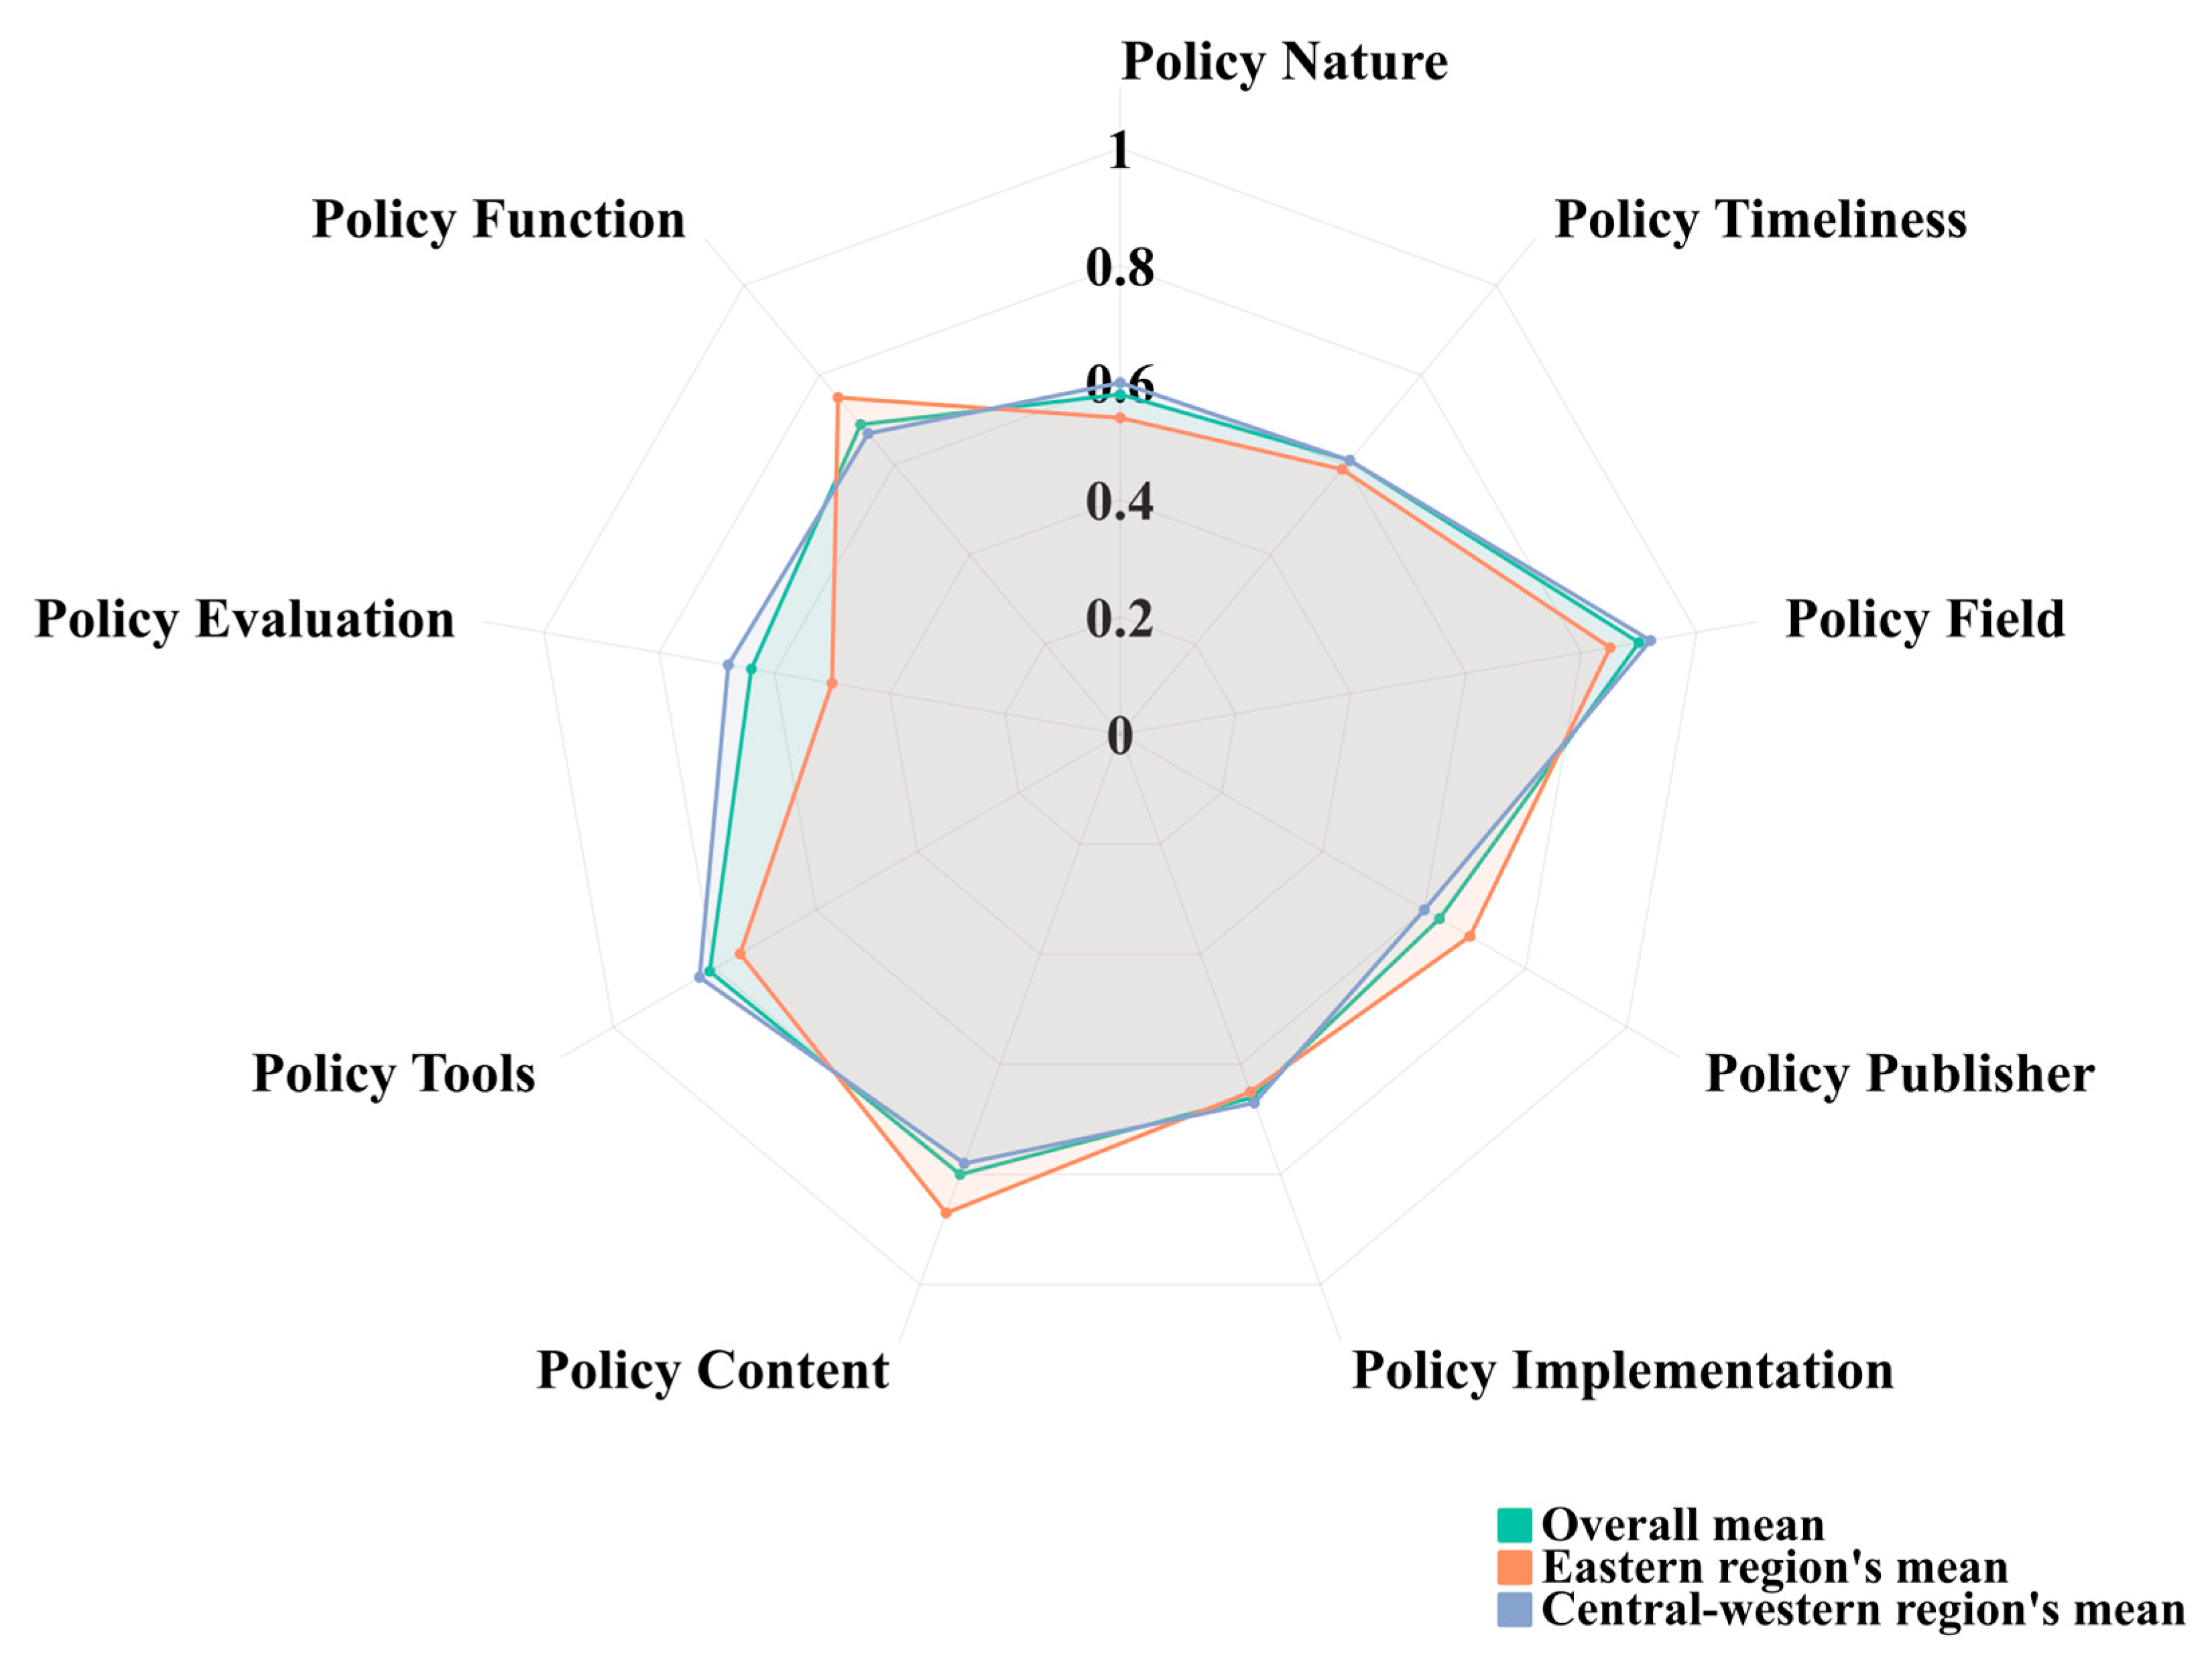
To explore the differences in the formulation of returnee entrepreneurship policies between regions with varying levels of economic development, this study divides the 16 provinces (municipalities and autonomous regions) into two categories for comparative analysis. Four economically developed eastern provinces (the “eastern region”) are grouped into one category, while twelve relatively less-developed central and western provinces (“central-western region”) are grouped into another category. Specifically, the arithmetic mean of each primary indicator for the four eastern provinces and the twelve central-western provinces is calculated and compared against the overall average of each primary indicator across the 16 provinces (municipalities and autonomous regions) (see Table 9). This comparison helps reveal the impact of regional economic development differences on the level of returnee entrepreneurship policy formulation. Based on Table 9, a radar chart is created to compare the primary indicators and PMC index of the eastern and central-western regions with the overall averages (see Figure 5).
Table 9.
Primary index and PMC index for the eastern and central-western regions compared with the overall mean.
Figure 5.
Radar chart of the primary index and PMC indicator for the eastern and central-western regions compared with the overall mean.
Overall, the mean PMC indicator for the eastern region is slightly lower than that for the central-western region, indicating that the comprehensive performance of policies in the central-western region is superior to that in the eastern region to some extent. This finding partially corroborates the abovementioned observation that the central-western region is the major labor-exporting area and remains a key battleground for the country to promote return-to-hometown entrepreneurship.
Horizontally, the rankings of primary indices in the eastern region are arranged from high to low scores as follows: policy content, policy field, policy function and policy tools (tied), policy issuer, policy timeliness, policy nature, and policy evaluation. In contrast, the ranking for the central-western region is as follows: policy field, policy tools, policy content, policy evaluation, policy implementation and policy function (tied), policy timeliness, and policy nature and policy issuer (tied).
Vertically, the eastern region outperforms the central-western region in three primary index scores: policy issuer, policy content, and policy function. For the remaining six indices, the central-western region demonstrates superior performance. Among the nine primary indices, the differences in scores between the eastern and central-western regions, from largest to smallest, are as follows: policy evaluation, policy issuer and policy content (tied), policy tools and policy function (tied), policy field, policy nature, and policy timeliness and policy implementation (tied).
Analysis of the secondary index from the input–output table reveals that, in the policy evaluation, all eastern provinces except Fujian fail to link policy implementation outcomes with assessments and lack context-specific policies. Additionally, Jiangsu and Shandong do not provide specific and quantitative descriptions of policy goals. In terms of policy issuer, policies in the eastern region feature a greater number of joint issuers. With respect to policy content, project cooperation is included in all policies in the eastern region, while it is included in only 42% of the policies in the central-western region. In terms of policy function, eastern policies more frequently emphasize institutional improvement and technological innovation than central-western policies do. In the policy field, all eastern provinces except Fujian fail to mention any information related to ecological areas. Regarding policy nature, eastern policies present less emphasis on prediction, diagnosis, and requirements than do central-western policies.
In summary, the differences between the eastern and central-western regions in terms of policy timeliness and policy implementation are minor. Additionally, the performance of eastern regions is superior in terms of the indices of policy issuer, policy function, and policy content. However, central-western regions demonstrate higher scores in the indices of policy nature, policy field, policy tools, and policy evaluation.
6. Discussion and Conclusions
The innovative aspects of this study are reflected primarily in the following three areas:
First, unlike previous PMC policy evaluation analyses that focus on individual policies, this study evaluates and analyzes all relevant policies issued by 16 provinces within a certain period as a single research unit. This approach offers greater practical significance and applicability, creating conditions for future studies to compare policy evaluation results with policy implementation outcomes.
Second, in light of the specific characteristics of returnee entrepreneurship policies, this research innovatively introduces “policy tools” as an independent evaluation dimension (primary indicator). Within this dimension, multiple secondary indicators are established for the following three types of policy tools: demand-based, supply-based, and environment-based policy tools. This approach enables a more detailed analysis of the application of various policy tools, thereby enhancing the scientific rigor and accuracy of the policy evaluation.
Finally, the study conducts a comparative analysis between China’s more economically developed eastern regions and its comparatively less developed central-western region, offering a preliminary exploration of the differences in policy formulation between developed and underdeveloped areas.
From this research, the following findings are obtained.
Overall, the scores for the return-to-hometown entrepreneurship policies across 16 provinces (municipalities and autonomous regions) are relatively high in terms of the indices of policy field, policy content, and policy tools, whereas the scores are comparatively low in terms of the indices of policy nature and policy timeliness. The remaining indices present moderate scores with slight differences. Specifically, in terms of policy nature, there is a general lack of the forecasting, description, and diagnosis of policies. In terms of policy timeliness, most policies lack a coherent set of short-, medium-, and long-term measures. Additionally, policy-issuing bodies tend to be singular, with few policies being jointly issued by multiple agencies. Furthermore, there is an imbalance in the application of policy tools, with supply- and environment-based tools dominating, whereas demand-based tools, such as investment promotions and market competition advantages, are underutilized.
There are also some differences in the indices of return-to-hometown entrepreneurship policies between the eastern and central-western regions. According to the average scores between the eastern and central-western regions, there is only a very slight difference in the indices of policy timeliness and policy implementation. Additionally, the performance of eastern regions is superior in terms of the indices of policy issuer, policy function, and policy content. However, central-western regions demonstrate higher scores in the indices of policy nature, policy field, policy tools and policy evaluation.
Specifically, from the perspective of indices with similar regional scores, the eastern and central-western regions show a high degree of similarity in the primary indices of policy implementation and policy timeliness within their returning entrepreneurship policies, with differences of only 0.02. However, further distinctions emerge when examining the PMC scores of these two indices across provinces.
The policy implementation indices indeed demonstrate greater similarity across the 16 provinces, with scores of 0.6 or 0.8 for both eastern and western provinces, except for Gansu. This similarity can be partly attributed to the top-down uniformity and coordination in China’s policy implementation process for entrepreneurial return, particularly at the macro level of the national strategy with unified guidance and deployment. In both the eastern and central-western regions, government departments serve as the primary implementing bodies, supported by local public institutions and relevant enterprises. This broad structure of implementing entities highlights the role of the government as the central coordinator and administrator in advancing China’s returning entrepreneurship policies, overseeing policy implementation and supervision. Moreover, local enterprises, public institutions, and social organizations play crucial complementary roles in the specific execution of these policies.
With respect to the policy timeliness index, while the eastern and central-western regions present relatively close average levels, significant variations exist in the specific scores among provinces within each region. This finding suggests that differences in policy timeliness scores are widespread within both regions. In other words, the substantial variation in provincial scores on this index is consistently observed across both the eastern and central-western regions.
Regarding the index being more significant in the two regions, the eastern region, compared with the central-western region, involves a greater range of institutions and organizations in policy issuance and has more comprehensive policy content. Additionally, the eastern region demonstrates superior performance in terms of policy function, particularly in terms of institutional refinement and technological advancements. In contrast, the central-western region pays more attention to the ecological field, providing more specific policy descriptions and requirements; this region also introduces more incentive policies based on local conditions and a variety of policy tools and sets more stringent standards for achieving policy objectives. Given these distinctions, we suggest that government departments in the eastern region exhibit greater collaboration capacity and resource integration advantages, featuring a greater number of high-level, newly developed initiatives in their policy content. This likely stems from the eastern region’s economic and technological advantages, which traditionally make it a talent hub in China [75], reducing the pressure to implement return policies and allowing for a more progressive, coordinated approach to policy design. Conversely, the central-western region, owing to longstanding constraints in productivity, talent, and cultural resources, faces a more pressing need for entrepreneurship policies, prompting more specific requirements, practical plans, and incentive mechanisms to foster entrepreneurship. Additionally, with the western region’s sustained strengths in terms of the natural environment and resources, its policy content more frequently emphasizes ecological aspects.
On the basis of these findings, the following practical suggestions are offered for future return-to-hometown entrepreneurship policymakers.
From an overall perspective, given the relatively low scores in the indices of policy nature and policy timeliness, 16 provinces should focus on collecting and utilizing relevant information to support subsequent policy formulation and ensure the consistent timing of such policy. Regarding those indices with relatively high scores—policy field, policy content, and policy tools—provinces should strive to keep these areas up-to-date to maintain comprehensive coverage. Additionally, there remains a shortage of demand-oriented policy tools; thus, increasing investment in and emphasis on these tools could fundamentally drive the practical outcomes of returning entrepreneurship efforts.
Considering regional differences, the eastern region should address its shortcomings in terms of policy evaluation by enhancing local research efforts and creating more context-specific policies. These should define clear responsibilities, rights, and assessment conditions for policy implementers, ensuring effective implementation. For the central-western region, where policy functionality and issuers are weaker, a multiagency and multidepartment approach should be employed; in addition, this region should build on its strengths in strict policy execution by pursuing technical and content-based innovations in policy formulation. This approach includes continuously refining institutional frameworks within entrepreneurship policies, thus increasing the overall level of policy design for returning entrepreneurship.
7. Limitations and Future Research Directions
This study has certain limitations. On the one hand, the policy evaluation system has a certain degree of time sensitivity. The evaluation index system constructed in this work may need to be adjusted in response to changes in the broader environment and national policy directions. Future updates and revisions may be necessary in line with emerging policy trends. On the other hand, the research focuses primarily on the policy formulation stage, lacking an in-depth exploration of the issues related to the policy implementation process.
To address the limitations of the current study, future quantitative evaluations using the PMC model should prioritize timely updates by regularly incorporating new policy content to adjust and refresh the policy index, ensuring its continued relevance. Alternatively, by incorporating the latest policy texts and practical implementation data, researchers could attempt to develop a more flexible index system on the basis of a greater volume of consistent policy content, thereby enhancing the accuracy of policy evaluations over time. Additionally, expanding the use of other research methods, such as case studies or field interviews (with both policymakers and entrepreneurs), would enable the analysis of the obstacles and successes in policy implementation across regions, providing more direct insights to inform policy optimization.
Future research could proceed in the following two main directions: first, greater attention should be given to the actual implementation of policies, investigating the gap between policy outcomes and policy objectives to provide a more direct basis for policy improvement through long-term tracking and dynamic analysis. Second, future studies could integrate both policy formulation evaluation and policy implementation effectiveness evaluation in the same work, allowing for a comparative analysis that enhances the scientific rigor of policy formulation assessments.
Author Contributions
Conceptualization, M.L., Y.L. and L.Z.; Data curation, M.L. and L.Z.; Formal analysis, M.L., Y.L. and L.Z.; Funding acquisition, Y.L., Investigation, M.L., Y.L. and L.Z.; Methodology, M.L. and J.H.; Project administration, Y.L.; Software, M.L. and J.H.; Supervision, Y.L.; Validation, M.L.; Visualization, L.Z. and J.H.; Writing—original draft, review, and editing, M.L., Y.L. and L.Z. All authors have read and agreed to the published version of the manuscript.
Funding
(1) National Natural Science Foundation of China—“Local Sense Construction of Rural Tourism Entrepreneurs in Homestay-type Rural Tourism Destinations from the Perspective of Community Building” (42061032); (2) China Engineering Academy Strategic Research and Consulting Project—“Path Research for Rural Comprehensive Revitalization in Western Region of China” (2023-PP-03); and (3) “Xingdian Excellent Talent Support Plan” of Yunnan Province, China—Youth Talent Support (XDYC-QNRC-2023-0410).
Data Availability Statement
The data that support the finding in this paper is openly available in https://www.pkulaw.com (accessed on 20 February 2024).
Conflicts of Interest
The authors declare no conflicts of interest.
References
- Zhang, Y.; Yang, C.; Yan, S.; Wang, W.; Xue, Y. Alleviating relative poverty in rural China through a diffusion schema of returning farmer entrepreneurship. Sustainability 2023, 15, 1380. [Google Scholar] [CrossRef] [Scilit]
- Démurger, S.; Xu, H. Return migrants: The rise of new entrepreneurs in rural China. World Dev. 2011, 39, 1847–1861. [Google Scholar] [CrossRef] [Scilit]
- Ministry of Agriculture and Rural Affairs of China. 14th Five Year Plan for the Construction and Development of Agricultural and Rural Talent Teams. 2022. Available online: https://www.hld.gov.cn/zwgk/fdzdgknr/zdmsxx/tpgj/fpzc/202203/P020220323381525975894.pdf (accessed on 20 February 2024).
- Li, L.; Liu, Y.; Luo, W.; Jiang, X. Does Urban Innovation Promote Rural Entrepreneurship? Quasi-Natural Experimental Evidence from Microdata on New Agricultural Subjects. Sustainability 2024, 16, 3981. [Google Scholar] [CrossRef] [Scilit]
- Zhang, S.; Yang, J.; Shen, Y.; Li, Z. How Do Digital Capabilities Impact the Sustained Growth of Entrepreneurial Income: Evidence from Chinese Farmer Entrepreneurs. Sustainability 2024, 16, 7522. [Google Scholar] [CrossRef] [Scilit]
- Meng, D.; Shang, Y.; Zhang, X.; Li, Y. Does Entrepreneurship Policy Encourage College Graduates’ Entrepreneurship Behavior: The Intermediary Role Based on Entrepreneurship Willingness. Sustainability 2023, 15, 9492. [Google Scholar] [CrossRef] [Scilit]
- Rothwell, R.; Zegveld, W. Reindustrialization and Technology; Longman Group Limited: London, UK, 1985; p. 282. [Google Scholar]
- Zhi, Q.; Sun, H.; Li, Y.; Xu, Y.; Su, J. China’s solar photovoltaic policy: An analysis based on policy instruments. Appl. Energy 2014, 129, 308–319. [Google Scholar] [CrossRef] [Scilit]
- Wang, Z.C.; Yang, W.G. Self-employment or wage-employment? On the occupational choice of return migration in rural China. China Agric. Econ. Rev. 2013, 5, 231–247. [Google Scholar] [CrossRef] [Scilit]
- Han, J. Strategic Research on China’s Migrant Workers; Shanghai Far East Publishers: Shanghai, China, 2009. [Google Scholar]
- Wei, X.; Zhu, H. Return migrants’ entrepreneurial decisions in rural China. Asian Popul. Stud. 2020, 16, 61–81. [Google Scholar] [CrossRef] [Scilit]
- Matloob Piracha, M.; Vadea, F. Return migration and occupational choice: Evidence from Albania. World Dev. 2010, 38, 1141–1155. [Google Scholar] [CrossRef] [Scilit]
- Wahba, J.; Zenou, Y. Out of sight, out of mind: Migration, entrepreneurship and social capital. Reg. Sci. Urban Econ. 2012, 42, 890–903. [Google Scholar] [CrossRef] [Scilit]
- Hausmann, R.; Nedelkoska, L. Welcome home in a crisis: Effects of return migration on the non-migrants’ wages and employment. Eur. Econ. Rev. 2018, 101, 101–132. [Google Scholar] [CrossRef] [Scilit]
- Tabares, A.; Londoño-Pineda, A.; Cano, J.A.; Gómez-Montoya, R. Rural entrepreneurship: An analysis of current and emerging issues from the sustainable livelihood framework. Economies 2022, 10, 142. [Google Scholar] [CrossRef] [Scilit]
- Hu, F. Return to education for China’s return migrant entrepreneurs. World Dev. 2015, 72, 296–307. [Google Scholar] [CrossRef] [Scilit]
- Mesnard, A.; Ravallion, M. The wealth effect on new business startups in a developing economy. Economica 2006, 73, 367–392. [Google Scholar] [CrossRef] [Scilit]
- McCormick, B.; Wahba, J. Overseas work experience, savings and entrepreneurship amongst migrants to LDCs. Scott. J. Political Econ. 2001, 48, 164–178. [Google Scholar] [CrossRef] [Scilit]
- Marchetta, F. Return migration and the survival of entrepreneurial activities in Egypt. World Dev. 2012, 40, 1999–2013. [Google Scholar] [CrossRef] [Scilit]
- Ma, Z. Social-capital mobilization and income returns to entrepreneurship: The case of return migration in rural China. Environ. Plan. A Econ. Space 2002, 34, 1763–1784. [Google Scholar] [CrossRef] [Scilit]
- Kveder, C.L.M.; Flahaux, M.L. Returning to Dakar: A mixed methods analysis of the role of migration experience for occupational status. World Dev. 2013, 45, 223–238. [Google Scholar] [CrossRef] [Scilit]
- Bensassi, S.; Jabbour, L. Beyond experience and capital: Is there a return migration? J. Dev. Stud. 2022, 58, 730–751. [Google Scholar] [CrossRef] [Scilit]
- Zhu, Y.; Wang, W.W.; Lin, L.; Shen, J.; Ren, Q. Return migration and in situ urbanization of migrant sending areas: Insights from a survey of seven provinces in China. Cities 2021, 115, 103242. [Google Scholar] [CrossRef] [Scilit]
- Stockdale, A. Migration: Pre-requisite for rural economic regeneration? J. Rural Stud. 2006, 22, 354–366. [Google Scholar] [CrossRef] [Scilit]
- He, X. Digital entrepreneurship solution to rural poverty: Theory, practice and policy implication. J. Dev. Entrep. 2019, 24, 1950004. [Google Scholar] [CrossRef] [Scilit]
- Murphy, R. How Migrant Labor Is Changing Rural China; Cambridge University Press: Cambridge, UK, 2002. [Google Scholar]
- Zhang, S.; Qiu, L.; Zhao, D. Technological diffusion, migration and entrepreneurship in China. J. Asian Econ. 2021, 75, 101322. [Google Scholar] [CrossRef] [Scilit]
- Yan, Y.J.; Wang, C.Y. Analysis on characteristics and functions of the peasant workers’ returning home for venturing in Shaanxi province. Asian Agric. Res. 2010, 2, 38–42. [Google Scholar]
- Chen, Z.; Wang, Y.; Li, H.; Zhang, K.; Yu, K. Driving factors and regional differences of migrant workers returning home to start business. Econ. Geogr. 2022, 42, 186–192. [Google Scholar]
- Li, S. Research on the driving factors and countermeasures of migrant workers returning home to start their own businesses. Res. Contin. Educ. 2020, 1, 91–96. [Google Scholar]
- Wu, C.; Fu, Q.; Gu, J.; Shi, Z. Does migration pay off? Returnees, family background, and self-employment in rural China. China Rev. 2018, 18, 59–78. [Google Scholar]
- Chen, W.; Chen, W.; Jiang, L. Analysis of the influencing factors of migrant workers returning home to start their own businesses. China Popul. Sci. 2014, 2, 96–105. [Google Scholar]
- Wassink, J. International migration experience and entrepreneurship: Evidence from Mexico. World Dev. 2020, 136, 105077. [Google Scholar] [CrossRef] [Scilit]
- Krasniqi, B.A.; Williams, N. Migration and intention to return: Entrepreneurial intentions of the diaspora in post-conflict economies. Post-Communist Econ. 2019, 31, 464–483. [Google Scholar] [CrossRef] [Scilit]
- Zhang, Y.; Zhang, M.; Sun, J. Construction of education and training system for returning migrant workers: Based on the survey of five provinces and cities in China. High. Agric. Educ. 2013, 10, 116–119. [Google Scholar]
- Chen, H. Research on the Employment Problems of College Students Returning to Hometowns and Solutions in the Background of Rural Revitalization. Front. Bus. Econ. Manag. 2022, 6, 229–234. [Google Scholar] [CrossRef] [Scilit]
- Yin, J.; Huang, X.; Dong, Y.; Zhao, M.; Tan, W. Dual-level impact of regional context and individual attributes on entrepreneurship among return migrants in China. Growth Chang. 2021, 52, 1099–1116. [Google Scholar] [CrossRef] [Scilit]
- Williams, N.; Plakoyiannaki, E.; Krasniqi, B.A. When forced migrants go home: The journey of returnee entrepreneurs in the post-conflict economies of Bosnia & Herzegovina and Kosovo. Entrep. Theory Pract. 2022, 47, 430–460. [Google Scholar]
- Coniglio, N.D.; Brzozowski, J. Migration and development at home: Bitter or sweet return? Evidence from Poland. Eur. Urban Reg. Stud. 2018, 25, 85–105. [Google Scholar] [CrossRef] [Scilit]
- Sihombing, N.S.; Sihombing, A. The effect of business environment and innovation spirit on competitive advantages and implications on marketing performance of ulos weaving in North Sumatra. J. Environ. Manag. Tour. 2019, 9, 1782–1788. [Google Scholar] [CrossRef] [Scilit]
- Jenkins-Smith, H.; Krutz, J.; Carlson, N.; Weible, C. The 2019 Public Policy Yearbook: Tracking a Decade of Trends in Public Policy Research. Policy Stud. J. 2019, 47, S6–S16. [Google Scholar] [CrossRef] [Scilit]
- Libecap, G.D. Economic variables and the development of the law: The case of western mineral rights. J. Econ. Hist. 1978, 38, 338–362. [Google Scholar] [CrossRef] [Scilit]
- Ma, X.; Ruan, Y.; Yang, Q. Evaluating China’s Common Prosperity Policies against the Background of Green Development by Using the PMC Model. Sustainability 2023, 15, 7870. [Google Scholar] [CrossRef] [Scilit]
- Qin, M.; Yue, C.; Du, Y. Evolution of China’s marine ranching policy based on the perspective of policy tools. Mar. Policy 2020, 117, 103941. [Google Scholar] [CrossRef] [Scilit]
- Blei, D.M.; Ng, A.Y.; Jordan, M.I. Latent dirichlet allocation. J. Mach. Learn. Res. 2003, 3, 993–1022. [Google Scholar]
- Heinrich, G. Parameter Estimation for Text Analysis; Technical report; Fraunhofer IGD: Darmstadt, German, 2005; pp. 1–32. [Google Scholar]
- Song, C.; Guo, J.; Gholizadeh, F.; Zhuang, J. Quantitative analysis of food safety policy—Based on text mining methods. Foods 2022, 11, 3421. [Google Scholar] [CrossRef] [Scilit] [PubMed]
- Doudchenko, N.; Imbens, G.W. Balancing, Regression, Difference-in-Differences and Synthetic Control Methods: A Synthesis (No. w22791); National Bureau of Economic Research: Darmstadt, Germany, 2016. [Google Scholar]
- Imbens, G.W.; Wooldridge, J.M. Recent developments in the econometrics of program evaluation. J. Econ. Lit. 2009, 47, 5–86. [Google Scholar] [CrossRef] [Scilit]
- Hrynaszkiewicz, I.; Simons, N.; Hussain, A.; Grant, R.; Goudie, S. Developing a research data policy framework for all journals and publishers. Data Sci. J. 2020, 19, 5. [Google Scholar] [CrossRef] [Scilit]
- Kuang, B.; Han, J.; Lu, X.; Zhang, X.; Fan, X. Quantitative evaluation of China’s cultivated land protection policies based on the PMC-Index model. Land Use Policy 2020, 99, 105062. [Google Scholar] [CrossRef] [Scilit]
- Li, Y.; He, R.; Liu, J.; Li, C.; Xiong, J. Quantitative evaluation of China’s pork industry policy: A PMC index model approach. Agriculture 2021, 11, 86. [Google Scholar] [CrossRef] [Scilit]
- Dai, S.; Zhang, W.; Lan, L. Quantitative evaluation of China’s ecological protection compensation policy based on PMC index model. Int. J. Environ. Res. Public Health 2022, 19, 10227. [Google Scholar] [CrossRef] [Scilit]
- Xiong, Y.; Zhang, C.; Qi, H. How effective is the fire safety education policy in China? A quantitative evaluation based on the PMC-index model. Saf. Sci. 2023, 161, 106070. [Google Scholar] [CrossRef] [Scilit]
- Liu, Y.; Li, J.; Xu, Y. Quantitative evaluation of high-tech industry policies based on the PMC-Index model: A case study of China’s Being-Tianjin-Hebei region. Sustainability 2022, 14, 9338. [Google Scholar] [CrossRef] [Scilit]
- Cusack, C.; Cohen, B.; Mignone, J.; Chartier, M.J.; Lutfiyya, Z. Participatory action as a research method with public health nurses. J. Adv. Nurs. 2018, 74, 1544–1553. [Google Scholar] [CrossRef] [Scilit]
- Estrada, M.A.R. Policy modeling: Definition, classification and evaluation. J. Policy Model. 2011, 33, 523–536. [Google Scholar] [CrossRef] [Scilit]
- Estrada, M.A.R.; Yap, S.F.; Nagaraj, S. Beyond the ceteris paribus assumption: Modeling demand and supply assuming omnia mobilis. Int. J. Econ. Res. 2007, 2, 185–194. [Google Scholar]
- Zhang, Y.; Ying, H. Research on quantitative evaluation of ‘mass entrepreneurship and innovation’ policy: A case study of 10 entrepreneurship and innovation policy intelligence in 2017. Intell. Mag. 2018, 3, 45–56. [Google Scholar]
- Shen, P.; Zhu, L. Investigation and countermeasure analysis of the employment status of returning migrant workers nearby: Based on the questionnaire survey of 897 returning migrant workers in Guizhou. Res. World 2014, 9, 31–35. [Google Scholar]
- He, W.; Qiu, L. Research on the influence of human capital and social capital on the entrepreneurial willingness of the new generation of migrant workers: Based on 1109 survey data in Sichuan Province. Northwest Popul. 2016, 37, 37–44. [Google Scholar]
- Lu, C. Analysis of influencing factors of migrant workers’ willingness to return home to start a business: Based on the survey data of 482 migrant workers returning home in Hunan Province. Search 2016, 9, 139–143. [Google Scholar]
- Xiong, Z.; Wang, Z. An empirical study on the influencing factors of migrant workers’ willingness to return home to start a business: Based on the survey data of 262 migrant workers returning home to start a business in Jiangxi Province. Stat. Inf. Forum 2011, 26, 103–108. [Google Scholar]
- Zhu, H. Empirical analysis of the relationship between external environment and migrant workers’ willingness to return home to start a business: Based on the survey data of 1145 migrant workers in Jiangxi Province. Explor. Econ. Issues 2011, 6, 59–64. [Google Scholar]
- Zhu, H.; Kang, L. An empirical analysis of migrant workers’ entrepreneurial motivation and its impact on entrepreneurial performance: Based on a sample of 438 migrant workers returning home from 15 counties and cities in Jiangxi Province. J. Nanjing Agric. Univ. (Soc. Sci. Ed.) 2013, 5, 59–66. [Google Scholar]
- Davies, J.K.; Sherriff, N.S. Assessing public health policy approaches to level-up the gradient in health inequalities: The Gradient Evaluation Framework. Public Health 2014, 128, 246–253. [Google Scholar] [CrossRef] [Scilit]
- Dai, S.; Zhang, W.; Zong, J.; Wang, Y.; Wang, G. How effective is the green development policy of China’s Yangtze River Economic Belt? A quantitative evaluation based on the PMC-index model. Int. J. Environ. Res. Public Health 2021, 18, 7676. [Google Scholar] [CrossRef] [Scilit]
- Chen, T.; Rong, J.; Peng, L.; Yang, J.; Cong, G.; Fang, J. Analysis of social effects on employment promotion policies for college graduates based on data mining for online use review in China during the COVID-19 pandemic. Healthcare 2021, 9, 846. [Google Scholar] [CrossRef] [Scilit] [PubMed]
- Liu, F.; Liu, Z. Quantitative evaluation of waste separation management policies in the Yangtze River Delta Based on the PMC index model. Int. J. Environ. Res. Public Health 2022, 19, 3815. [Google Scholar] [CrossRef] [Scilit] [PubMed]
- Gao, X.; Zhang, R. A Study on Startup Policy Toolkit of Off-Farm Workers Returning Hometown in China. Agric. Rural Stud. 2023, 1, 0014. [Google Scholar] [CrossRef] [Scilit]
- Zhang, Y.; Wang, T.; Wang, C.; Cheng, C. Quantitative evaluation of China’s CSR policies based on the PMC-index model. Sustainability 2023, 15, 7194. [Google Scholar] [CrossRef] [Scilit]
- Huang, P.; Sun, Z.; Li, L.; Li, J. Has the Integrated Medical Insurance System promoted return-to-hometown entrepreneurship among migrant workers? Evidence from China. Front. Public Health 2024, 12, 1323359. [Google Scholar] [CrossRef] [Scilit]
- Rothwell, R. Reindustrialization and technology: Towards a national policy framework. Sci. Public Policy 1985, 12, 113–130. [Google Scholar] [CrossRef] [Scilit]
- Yu, F.; Niyomyaht, S.; Kalyanamitra, K.; Siriphornwut, N. Characteristics and Mechanisms of China’s Pilot Models in Policy Diffusion: A Case Study of the Return Migrant Workers Entrepreneurship Policy. Int. J. Sociol. Anthropol. Sci. Rev. 2024, 4, 65–74. [Google Scholar] [CrossRef] [Scilit]
- Hu, B.; Liu, Y.; Zhang, X.; Dong, X. Understanding regional talent attraction and its influencing factors in China: From the perspective of spatiotemporal pattern evolution. PLoS ONE 2020, 15, e0234856. [Google Scholar] [CrossRef] [Scilit]



Disclaimer/Publisher’s Note: The statements, opinions and data contained in all publications are solely those of the individual author(s) and contributor(s) and not of MDPI and/or the editor(s). MDPI and/or the editor(s) disclaim responsibility for any injury to people or property resulting from any ideas, methods, instructions or products referred to in the content. |
© 2024 by the authors. Licensee MDPI, Basel, Switzerland. This article is an open access article distributed under the terms and conditions of the Creative Commons Attribution (CC BY) license (https://creativecommons.org/licenses/by/4.0/).