


Abstract
In this study, the catchment hydrology cycle analysis tool (CAT) model was used to conduct a comprehensive hydrological analysis of the water balance of agricultural reservoirs. Data from 2010 to 2017, including precipitation, water level data in the reservoir, groundwater usage, and wastewater discharge, were collected and compiled for the upper reaches of the Hantan River Dam. The current conditions and content curves of the 11 reservoirs within the watershed were investigated and recorded. The results were analyzed by simulating three scenarios: treating the entire watershed as 1 unit, dividing the watershed into 5 sub-watersheds according to the standard watershed criteria, and further subdividing it into 27 watersheds, taking into account the presence of agricultural reservoirs. In cases where watershed information is lacking, it is deemed that subdividing the watershed can enhance efficiency. The highest model efficiency was observed in the 27 sub-basins, particularly when accounting for agricultural reservoirs. This study proposed an efficient method for hydrological analysis of watersheds including ungauged areas.
1. Introduction
In Korea, the frequency of local floods and droughts has increased, primarily attributed to the recent abnormal climate change. This increase in extreme weather events has highlighted vulnerabilities in water usage and flood management [1,2,3,4,5]. Regional variations in precipitation present challenges in securing an adequate water supply for effective water management. This leads to imbalances in water usage during the dry seasons of winter and spring [6,7]. Domestic water resources are predominantly sourced from stream water, dams, reservoirs, and groundwater. However, a significant reliance on dam water and river water is evident. As water resource policies shift from focusing solely on water management and flood control to encompassing sustainable water management, including river environments, the availability of water becomes constrained [8]. Ensuring a stable water supply remains a concern, particularly in areas that rely on groundwater and small- to medium-sized rivers as water sources. During extreme drought situations, efficient utilization of existing water resource facilities through effective water management and the digitization of water resource data has become a crucial task for ensuring the stability of the local water supply.
To achieve this, the reliable prediction of outflow from available water resources requires prior identification of the actual water use system and factors related to hydrological environmental characteristics [9,10] conducted a sub-basin analysis that considered dams, reservoirs, and irrigation plans within the Gediz basin in western Turkey. The semi-distributed land use-based runoff processes (SLURP) model was applied to the Mekong River to assess the environmental and water resource impacts of water distribution, land use, climate change, and dam construction. Reference [11] used the SLURP model to assess the influence of agricultural reservoirs’ retention effects in Giheung, Idong, Gosam, and Geumgang on the downstream area within the Anseongcheon watershed. References [12,13] conducted a comparison and analysis of outflow patterns, considering whether the reservoirs were included in the model utilized the SWAT model [14] to assess the impact of water storage and irrigation system water supply on river outflow and to analyze river outflow patterns while considering the presence or absence of reservoirs. Reference [15] evaluated the water supply of agricultural repair facilities using MODSIM [16] focusing on the Geumgang area, and [17,18] analyzed the regression rate in agricultural areas using data such as inflow through irrigation channels from the upstream watershed of Yongdam Dam and downstream drainage areas. Reference [19] improved the reliability of simulation results for long-term outflows of agricultural watersheds by considering the impact of agricultural reservoirs using the catchment hydrological cycle assessment tool (CAT).
The CAT model combines the advantages of existing conceptual parameter-based centralized hydrological models and physical parameter-based distributed hydrological models. It serves as a hydrologic cycle analysis model designed to quantitatively assess both long-term and short-term runoff characteristics of a watershed. The CAT model supports the evaluation and efficient design of hydrologic cycle improvement facilities, including storage and infiltration structures. The model can simulate the runoff process in freshwater rice paddies, analyze the water balance of storage facilities, and has proven its applicability to various new town development areas and natural watersheds in South Korea [20]. Furthermore, the CAT model has been utilized to assess the impact of land use changes resulting from urbanization in the United Kingdom on rainfall runoff [21].
This research begins with the drought events that occurred in Korea from 2022 to 2023. Commencing in March, preceding the 2022 sowing season, water supply warnings were issued in the Seomjin River and Yeongsan River basins, both major agricultural areas in Korea. Various policies were implemented to maintain water supply for residential, industrial, and agricultural purposes as part of drought response measures. These measures were in effect until March 2023, lasting for one year. While meticulous distribution of stored quantities in major dams and conserved amounts from other basins prevented damage before the onset of drought, it was forecasted that if the drought persisted for over a month, there would be disruptions in water supply for approximately one million people in urban areas and the largest industrial area in Korea, also affecting seeding activities in March. Consequently, the need for in-depth research on drought became apparent in Korea. In particular, this study aimed to establish a methodology for water resource management, including small reservoirs, as part of information construction for the agricultural sector based on extensive reservoir data. Additionally, it aimed to evaluate its application in the Hantan River basin, an area highly vulnerable to drought.
To accurately simulate and understand the characteristics of runoff, a comprehensive analysis of water resource information according to the characteristics of water usage and the management subject of the water source is necessary. Accordingly, in this study, the detailed actual water use system of the watershed was identified and the outflow characteristics of small and medium-sized rivers were evaluated using the CAT model. We intended to identify the detailed water use system and reliable hydrological characteristics of the upper waterways of the Hantan River Dam in the Han River basin and use it as basic data for future water use plans. In the case of the Hantan River Dam basin, the inclusion of North Korea makes it challenging to obtain data on water use and watershed characteristics. Therefore, in this study, we proposed an approach to build a water use system considering agricultural reservoirs based on simulations for watersheds including ungauged watersheds.
2. Materials and Methods
2.1. The Target Watershed
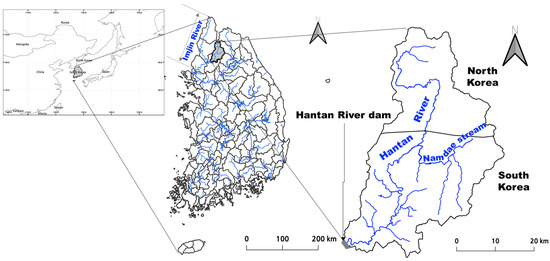
Most of the upstream basin of the Hantan River Dam is located north of the armistice line, and the basin area is 1285.73 Km2, and the highest elevation in the basin is 1172.52 m. The main stream, the Hantan River, joins Namdaecheon Stream, the first tributary, and changes flow path to the southwest. The Hantan River merges with the Imjin River and flows into the main stream of the Imjin River, and the Imjin River flows into the Han River (Figure 1).
Figure 1.
Location of Hantan River basin.
The Hantan River watershed is an area where flood damage occurs repeatedly during the rainy season and drought damage occurs during the dry season. The upper reaches of the watershed belong to North Korea, posing challenges for South Korea in managing the river’s flow and water quality in the downstream areas. In the Imjin River basin, which the Hantan River watershed belongs to, 2/3 of the entire basin is located upstream in North Korea, making river management in South Korea difficult. As shown in Figure 1, the Hantangang River is a river shared between North and South Korea. Additionally, persistent droughts since 2000 have led to discussions about the installation of new dams. Therefore, it is considered one of the most crucial watersheds in water management in South Korea.
The Hantan River Dam serves as a crucial flood control structure, boasting a remarkable storage capacity of 270 million tons. Its primary purpose is to mitigate flood-related damages in the Imjin River watershed. In normal conditions, the dam is intentionally designed to maintain the natural flow of the river. Notably, a significant portion of the basin falls within the border region, and the majority of vital water resource facilities are situated downstream, particularly after the convergence of Namdaecheon Stream, the river’s first tributary.
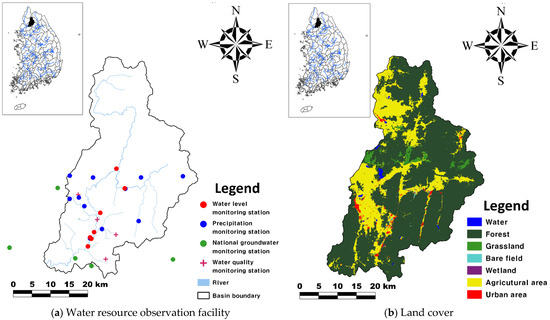
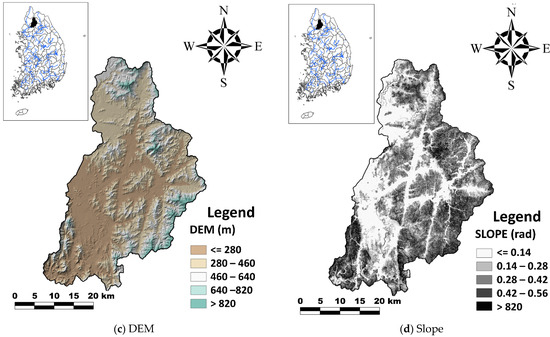
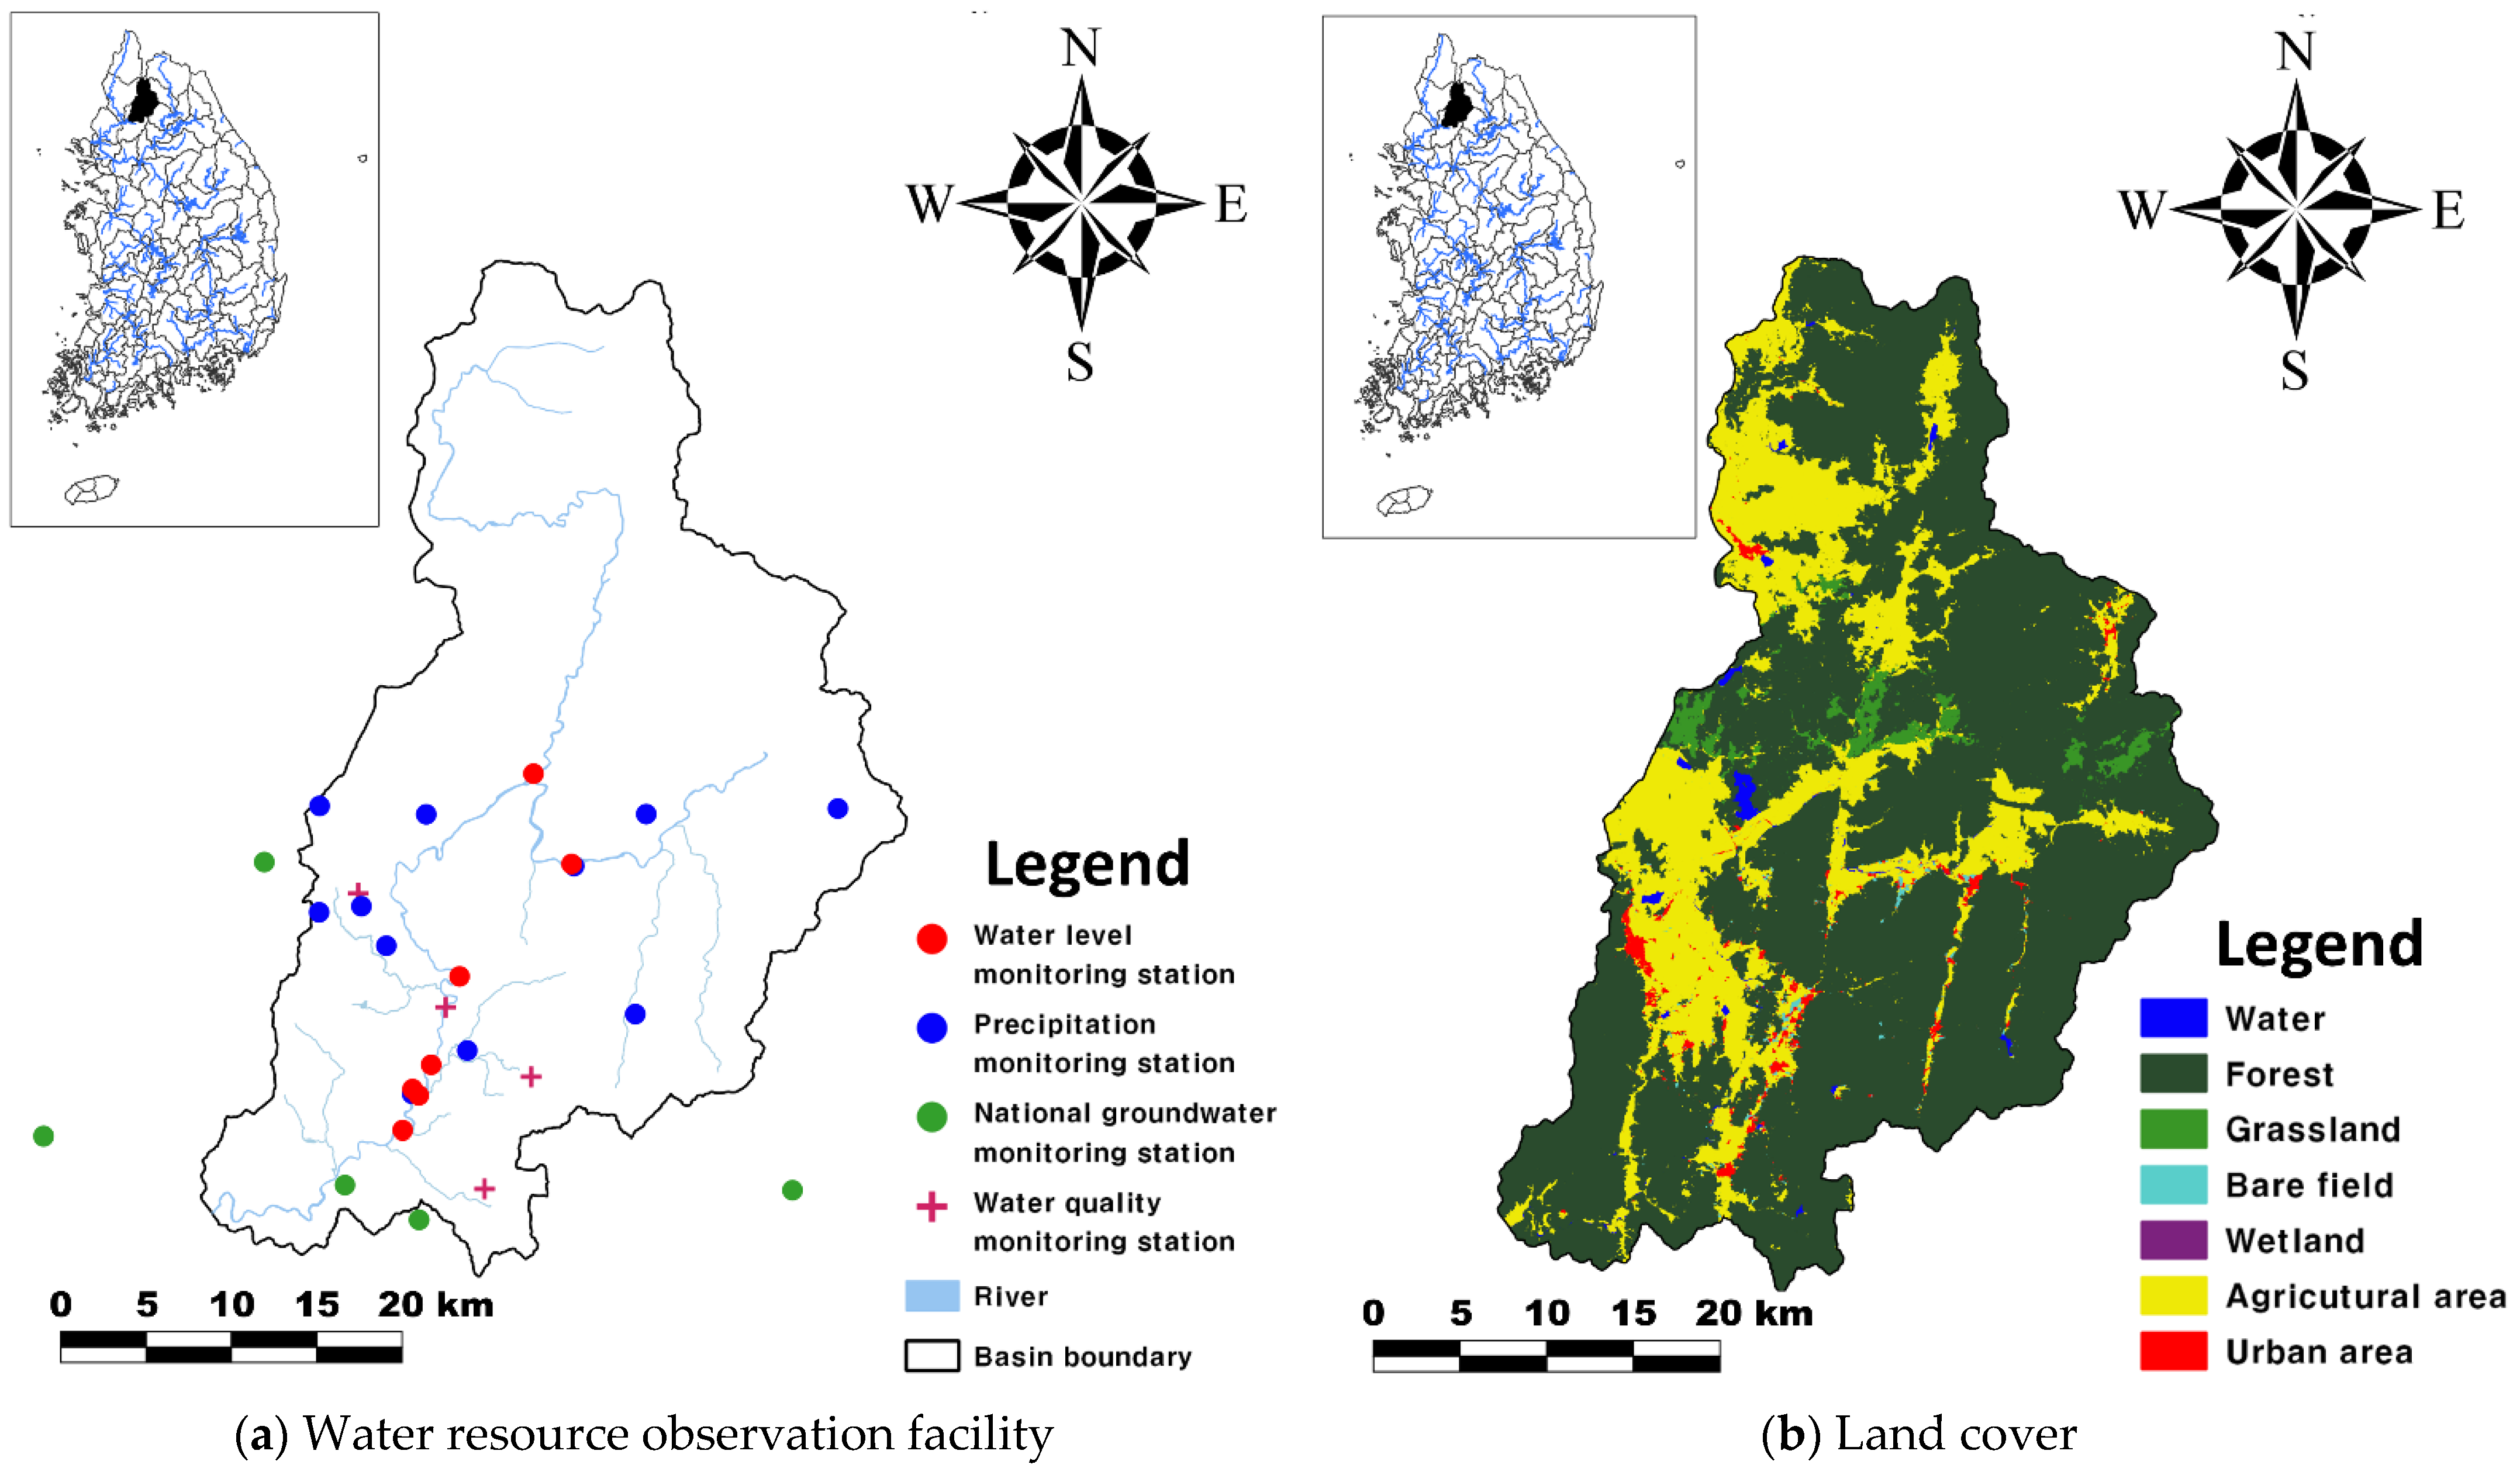
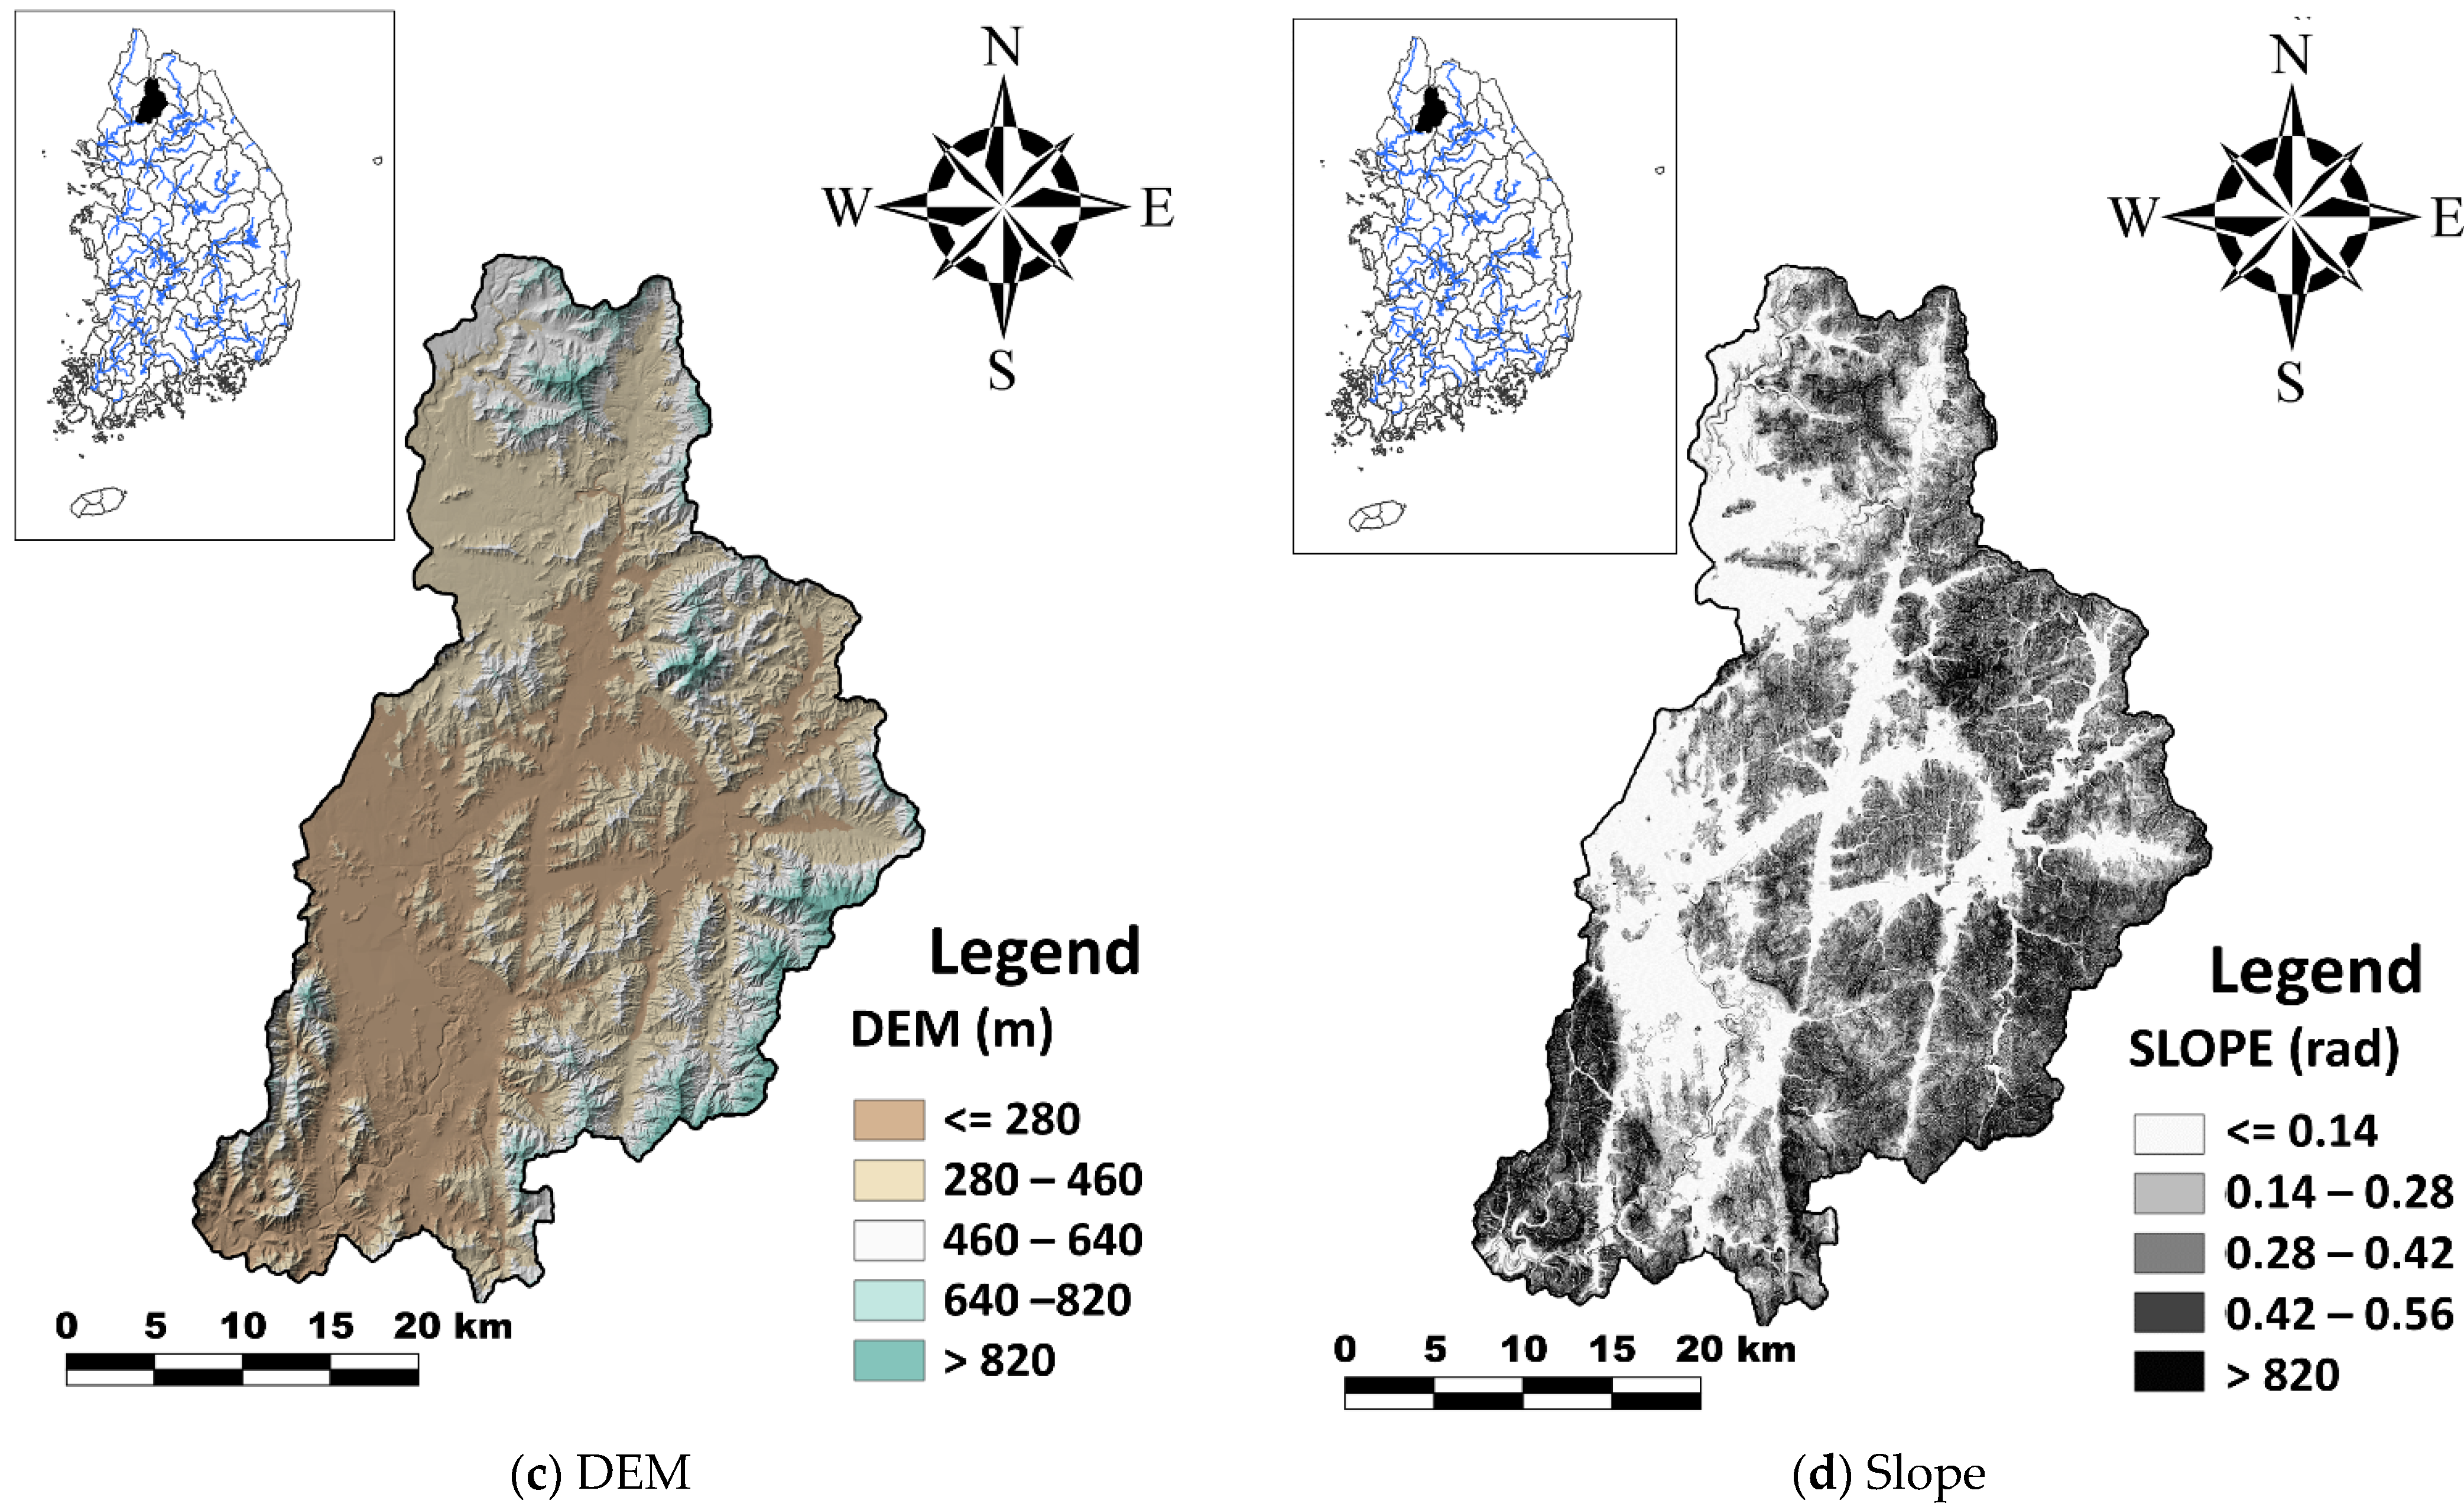
As for the current water resource observation facilities, there are 7 water level observation stations and 11 precipitation observation stations, as shown in Figure 2a. The land use status, depicted in Figure 2b, is primarily based on the Ministry of Environment’s 2010 land cover map, using Landsat7 images. The upper reaches of the watershed, mostly located in North Korea, comprise 68% forest areas and 24% agricultural land. If we categorize urbanized dry areas as impermeable surfaces, the impermeable area within the watershed is 26.33 Km2, accounting for 2% of the total area. The average elevation stands at EL.423.49 m, with an average slope of 20.94%, which is higher than the mid-region of the Hantan River and exhibits a lower slope (Figure 2c,d) ([22] as of 2011).
Figure 2.
Hantan River basin GIS construction status.
2.2. CAT Model Overview
The CAT model divides the hydrologic cycle process into two distinct areas: permeable and impermeable. It enables the simulation of infiltration, evaporation, and groundwater flow at the level of each spatial unit. Both the soil layer and aquifer are represented as single layers in the model. Groundwater intake from the aquifer is considered [19,23,24].
The CAT model encompasses various hydrologic cycle analysis modules, including evapotranspiration, infiltration, watershed runoff, groundwater retention, and stream channel tracking. Potential evapotranspiration can be computed externally or selected using the Penman–Monteith method [25]. For modeling infiltration, the CAT model offers multiple methods, including the Rainfall Excess [26,27], Green and Ampt [28], and Horton methods [29]. In addition, groundwater movement between adjacent watersheds can be considered, and analysis methods such as Muskingum, Muskingum–Cunge, and Kinematic wave methods are provided for stream channel tracking. The watershed was divided into a permeable area and an impermeable area, and the outflow process from rice paddies, one of the characteristics of outflow in Korea, was reflected. Water supply from the outside and leakage from the water supply network were also considered. The water permeable area was composed of one soil layer and one unconfined aquifer, and the watershed could be divided into an outflow contributing area and a recharge area, and the flow of groundwater could be calculated through the aquifer. The CAT model also offers a range of options for hydrologic cycle improvement facilities, allowing for comprehensive simulations that consider infiltration and storage facilities vital for urban watershed hydrologic cycle analysis.
2.3. Establishing Input Data
In this study, a hydrological simulation was conducted from 2010 to 2017 to evaluate the outflow behavior, reflecting the watershed characteristics by constructing a CAT model. Spatial data of the upstream watershed of the Hantan River Dam, precipitation input data, and flow data construction status required for calibration are presented in Table 1. The soil map was created after the confluence of Hwagang and Daegyocheon streams. Areas without data, such as North Korean border areas and military facilities, were approximated using area ratios for input. In the reservoir watershed, the most widely distributed land use is agricultural land, except for mountainous areas. Flow data for calibration was obtained from seven water level observation stations, including Hantan Bridge.
Table 1.
Assessment criteria used to investigate the field drought conditions in this study.
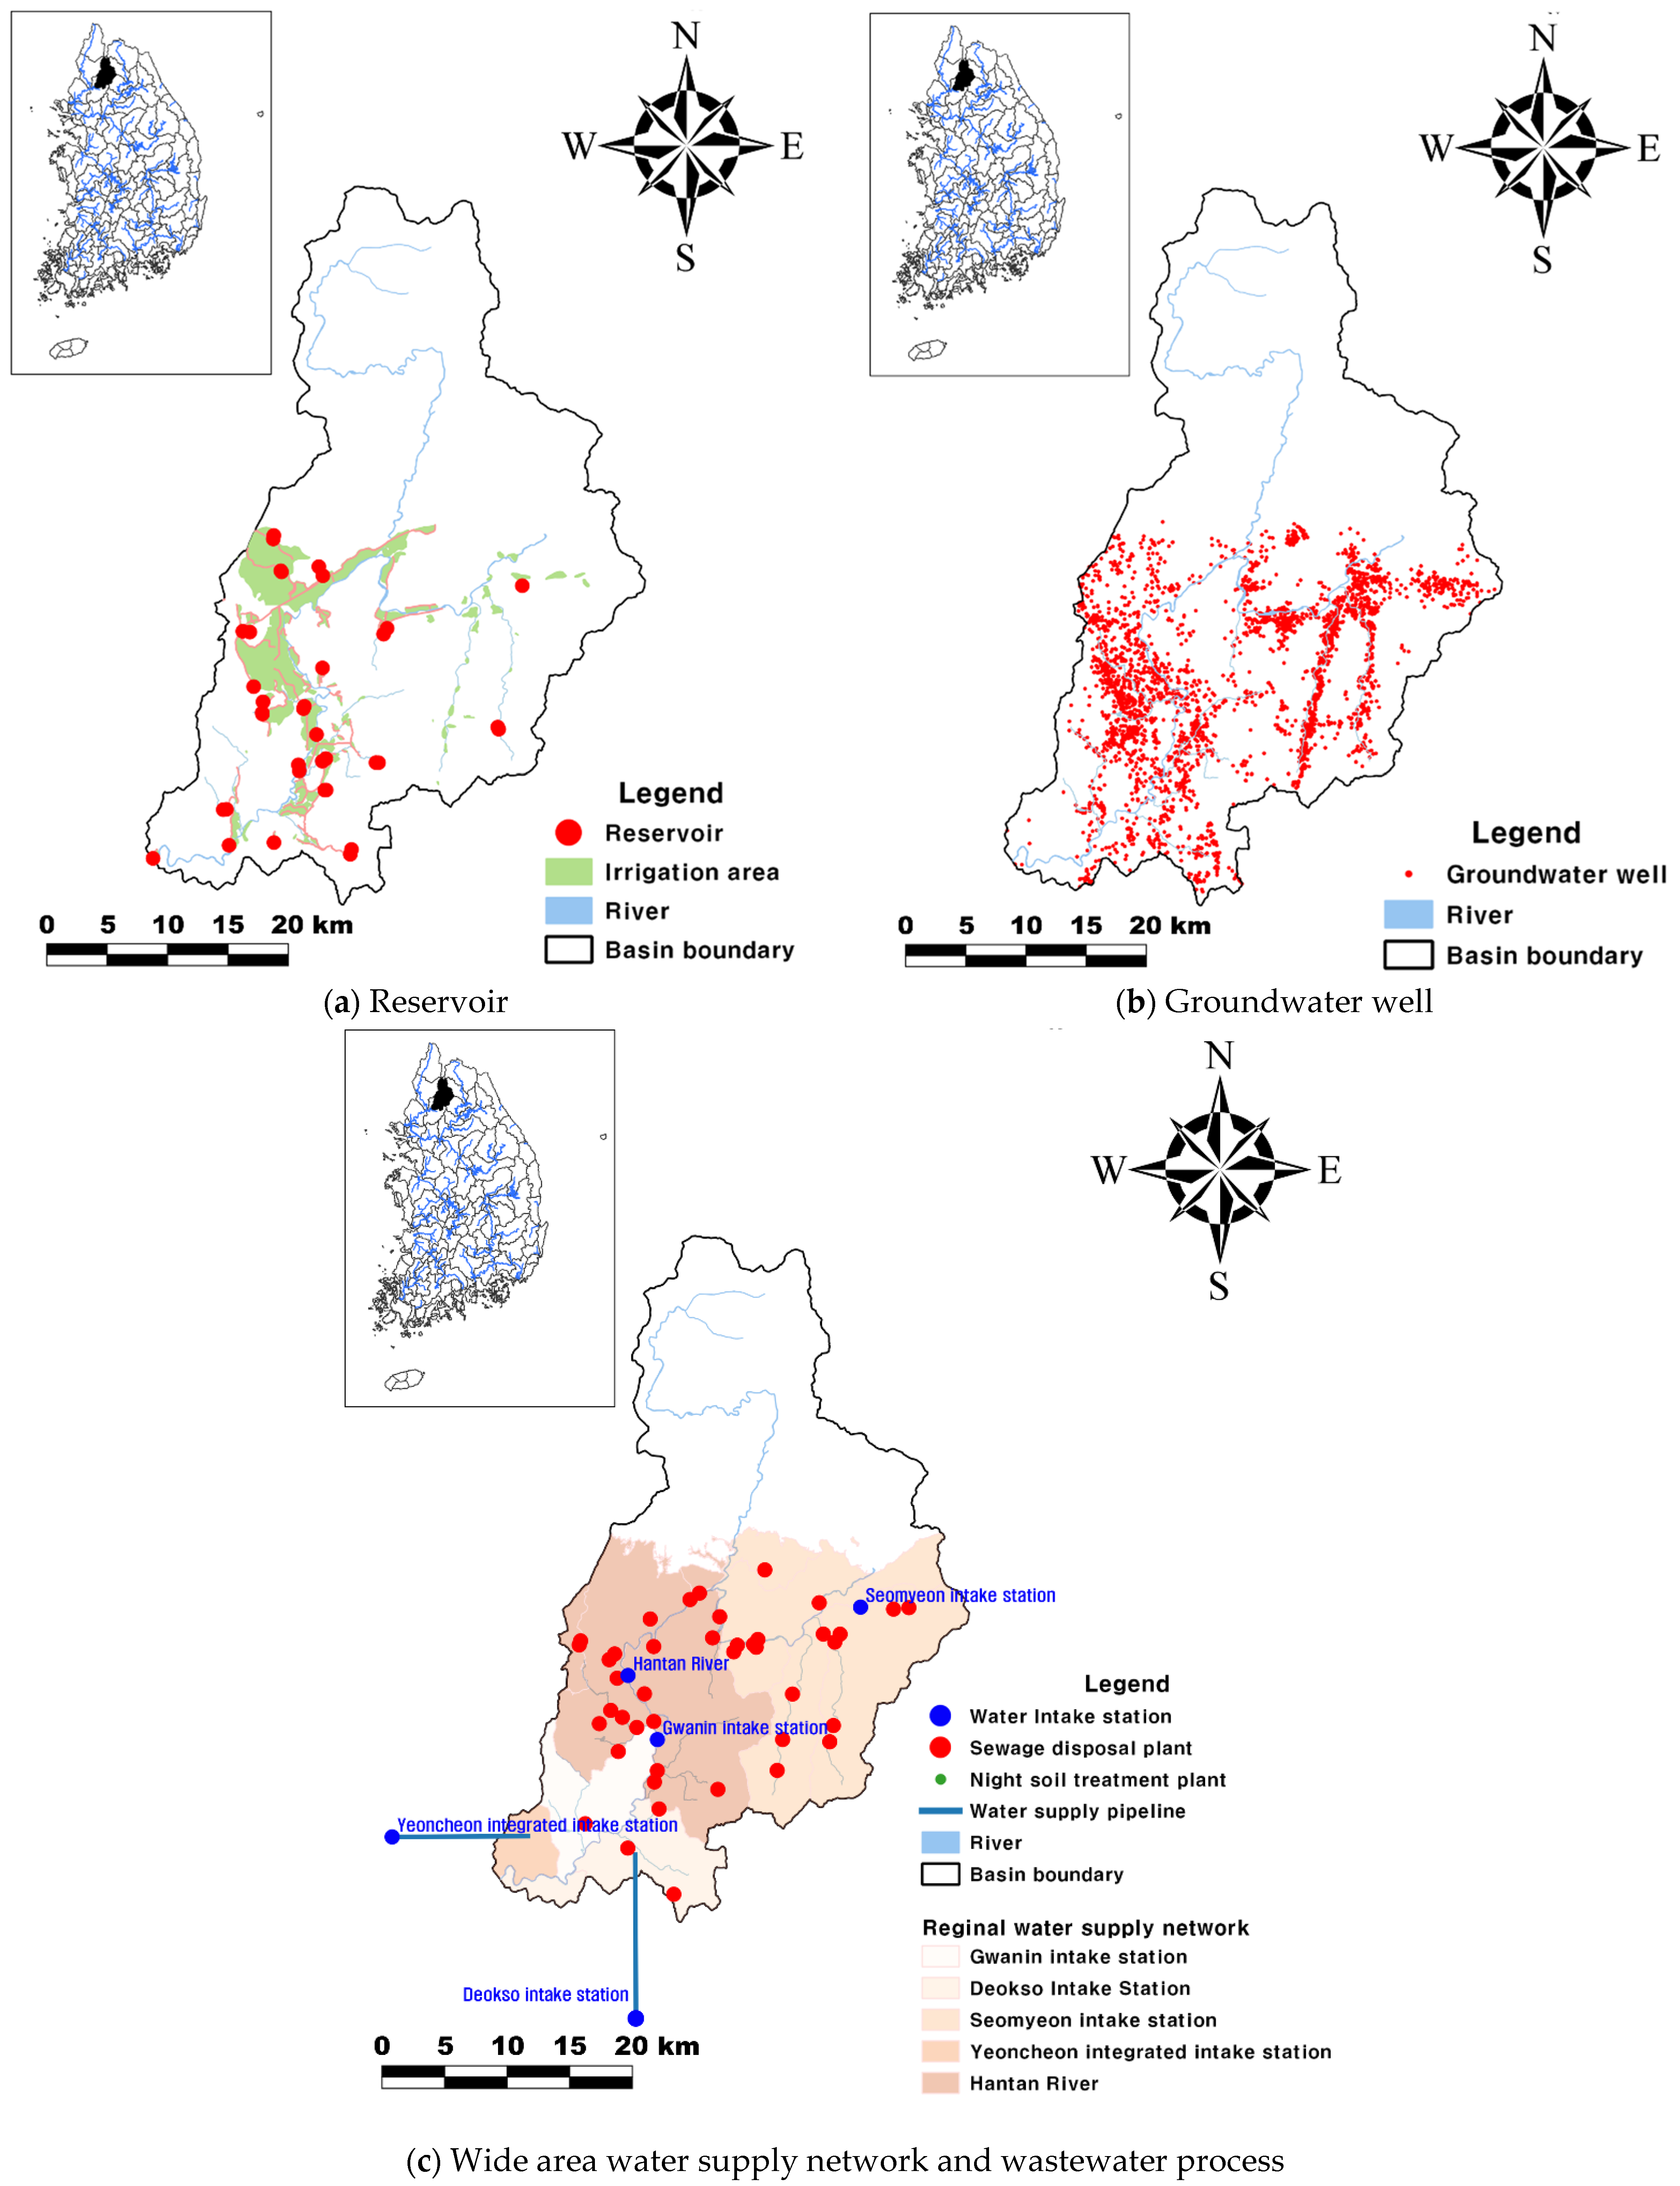
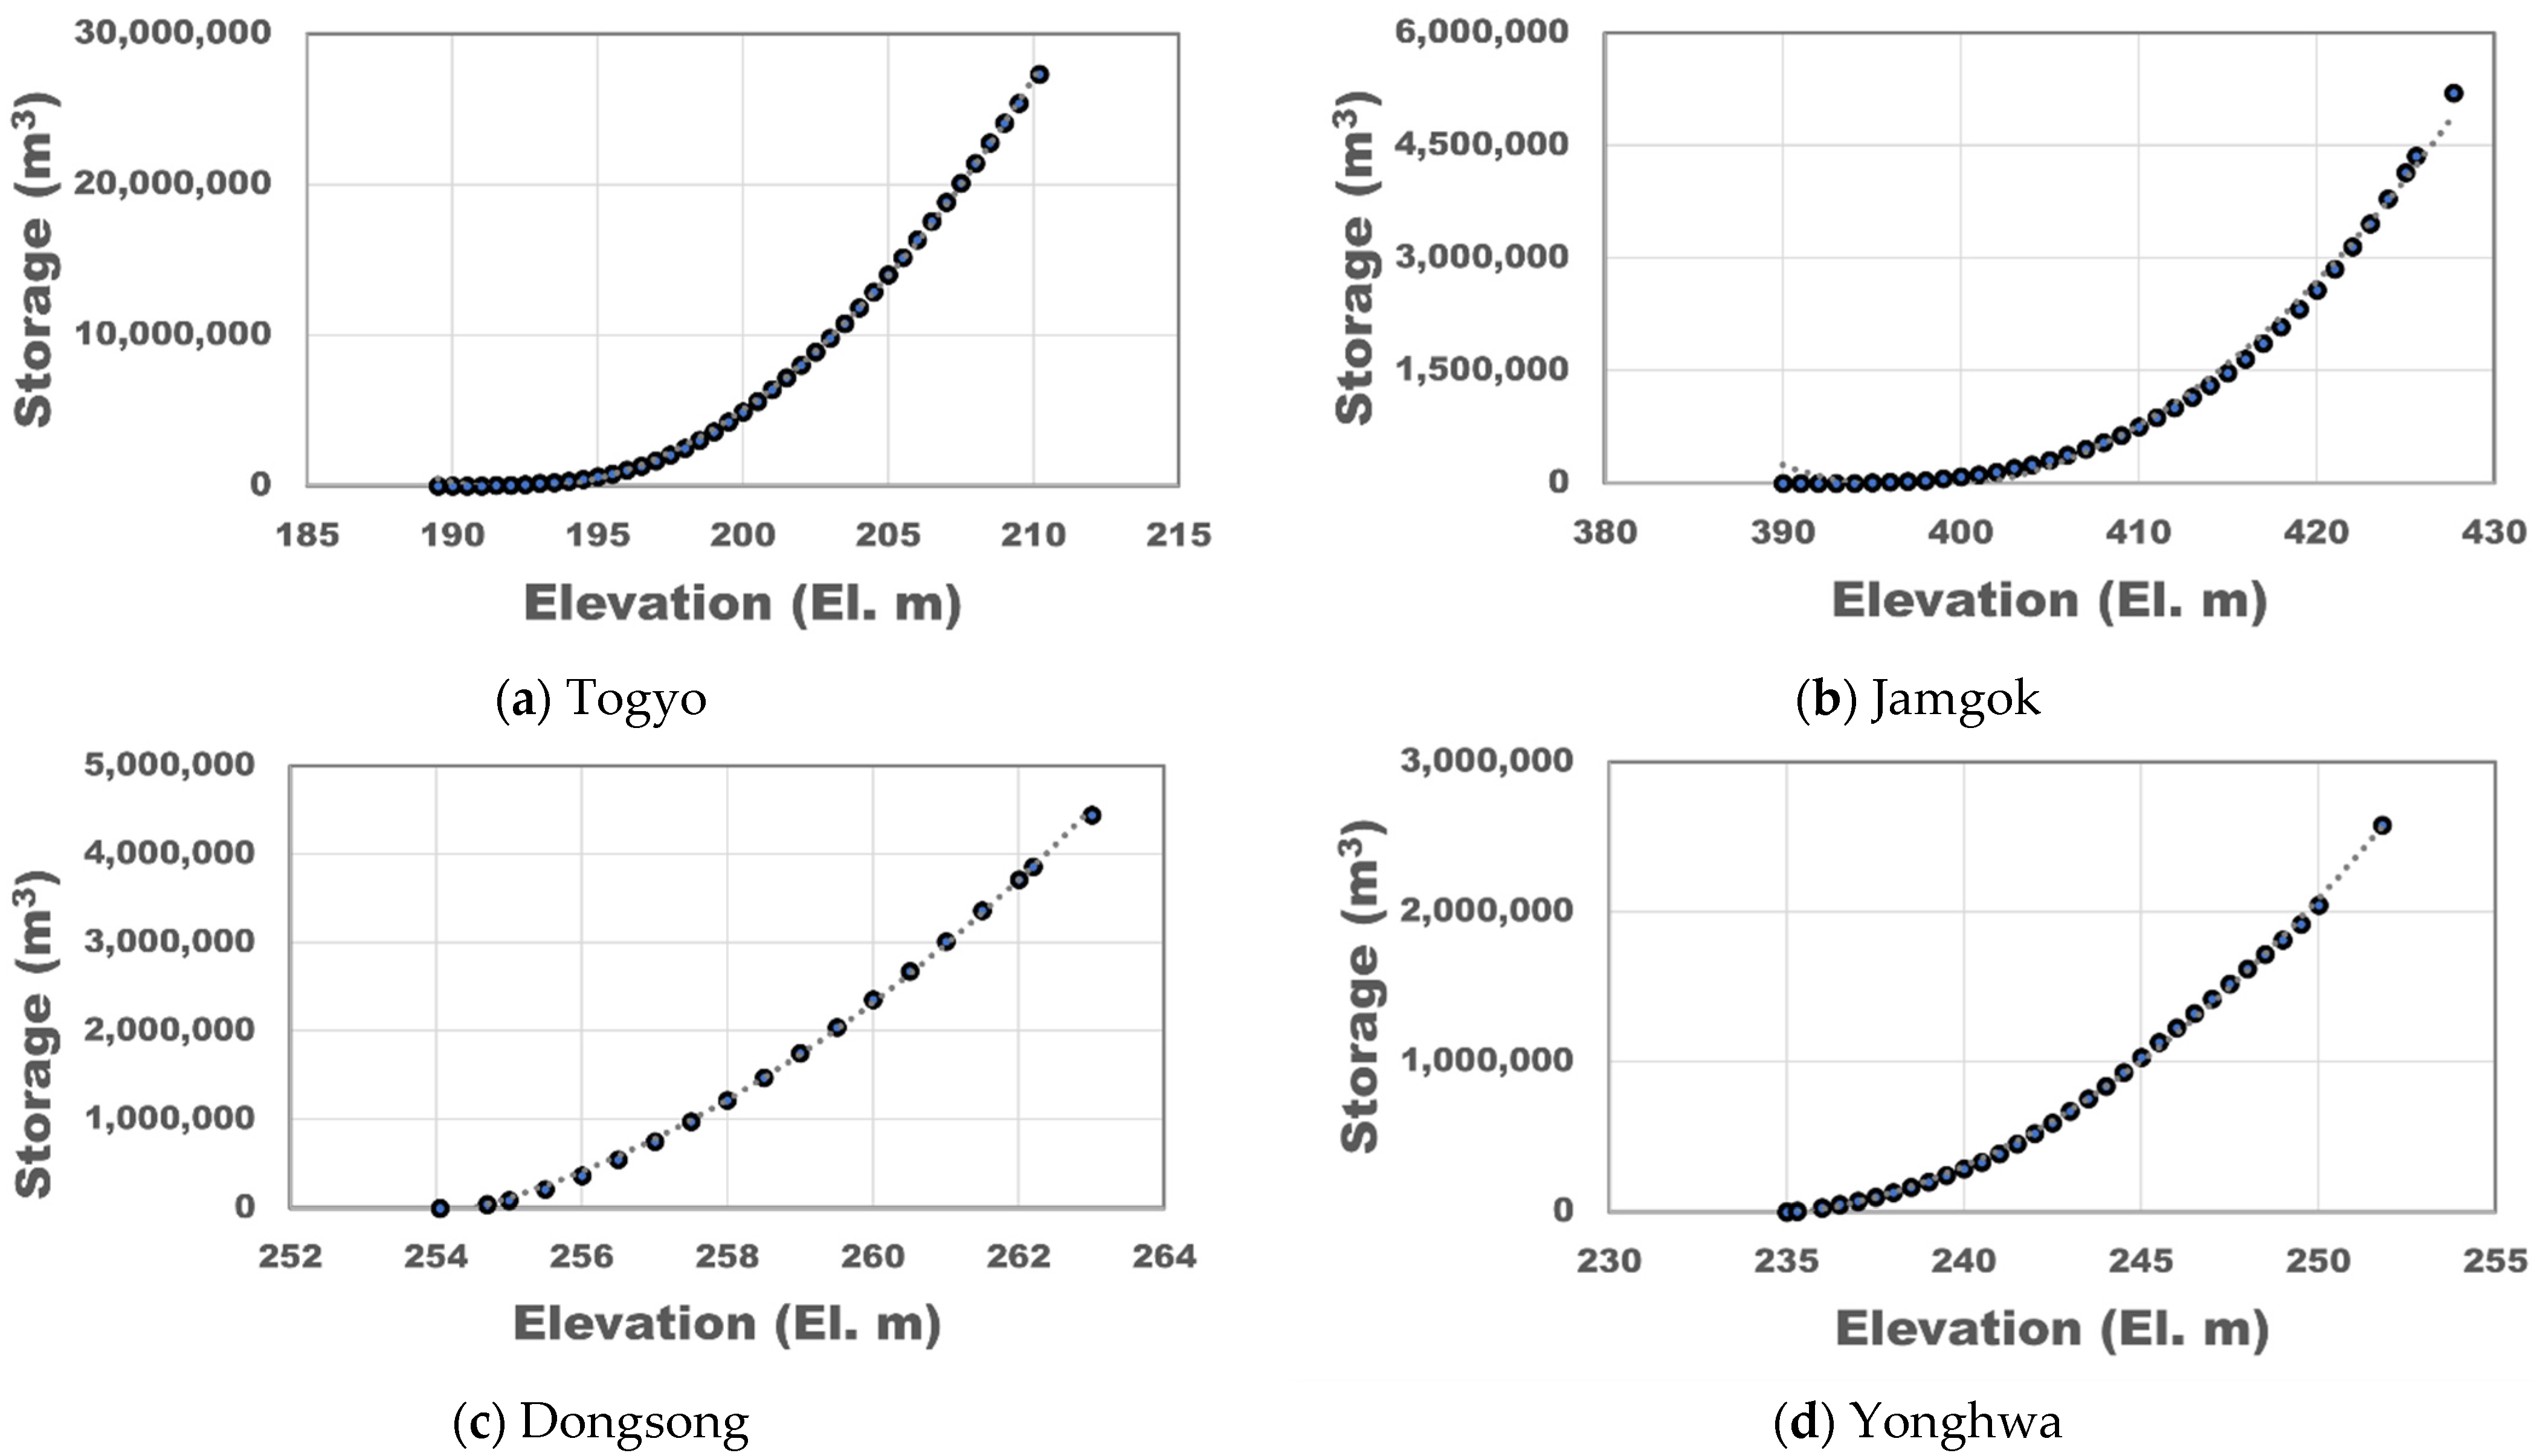
For accurate water balance simulation, 11 agricultural reservoir specifications, such as water intake status, groundwater usage, and wastewater processing volume, were used as basic input data (Figure 3). Table 2 shows the specifications of agricultural reservoirs input into the model. Since the proportion of agricultural land in the basin is high, agricultural reservoirs are crucial input data. As depicted in Figure 1, the water reserve rate (%) was converted into reservoir level (m) using the content curves of 11 reservoirs from 2010 to 2017. The height of overflow was assessed through field surveys at points with varying specifications, compared to the highest water level of the agricultural reservoir for the year. Following the field review, discrepancies between the water overflow height and the field survey results were observed based on the specifications of the Jail reservoir. Therefore, the field survey results were used as input.
Figure 3.
Current status of water use facilities.
Table 2.
Current status of reservoirs under the jurisdiction of Korea Rural Community Corporation.
Groundwater usage is managed and collected by the National Groundwater Information Center in accordance with Groundwater Act Article 5-2 Informatization of Groundwater Conservation and Management [30]. Most organizations calculate annual groundwater usage by indirect estimation. For domestic and industrial water usage, measurements are taken directly or estimated using data from groundwater usage charges or sewage usage fees, as well as daily intake plans during irrigation development. Other groundwater sources, such as spring water and hot springs, are managed by the relevant department. The quantity of groundwater used for daily purposes is determined by multiplying the coefficient assigned by each local government for specific usage categories based on the water supply population. The annual usage is then calculated by multiplying the daily usage by the number of days. In the groundwater tube well Figure 2b of the upstream watershed of the Hantan River Dam), there were 34,811 data collected from 3133 tube wells between 2007 and 2016, with 4498 (13%) being reported. Data on underground water use were collected and managed by administrative districts. Out of the total 34,811 records, 30,313 (87%) lacked location information about areas outside the watershed, or were closed, and were therefore classified as unacceptable data. Out of the 3133 locations with reported usage data, 86% are for household water (2676 locations), and 12% are for agricultural water (384 locations). The use of underground water in the upper watershed of the Hantan River Dam has been reported since 2015, with 4881 thousand tons used in 2015 and 1802 thousand tons in 2016. Table 3 shows the groundwater usage for the standard watershed, with an annual consumption of 13.33 million tons. The amount of wastewater discharged was incorporated into the model by constructing data, as demonstrated in Table 4, and the average annual wastewater discharge amounted to 4.67 million tons.
Table 3.
Groundwater usage by standard basin (unit: ton/day).
Table 4.
Sewage water discharge volume by standard basin (unit: ton/day).
3. Results and Discussion
3.1. Model Calibration Results
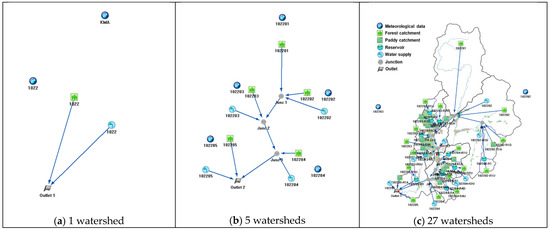
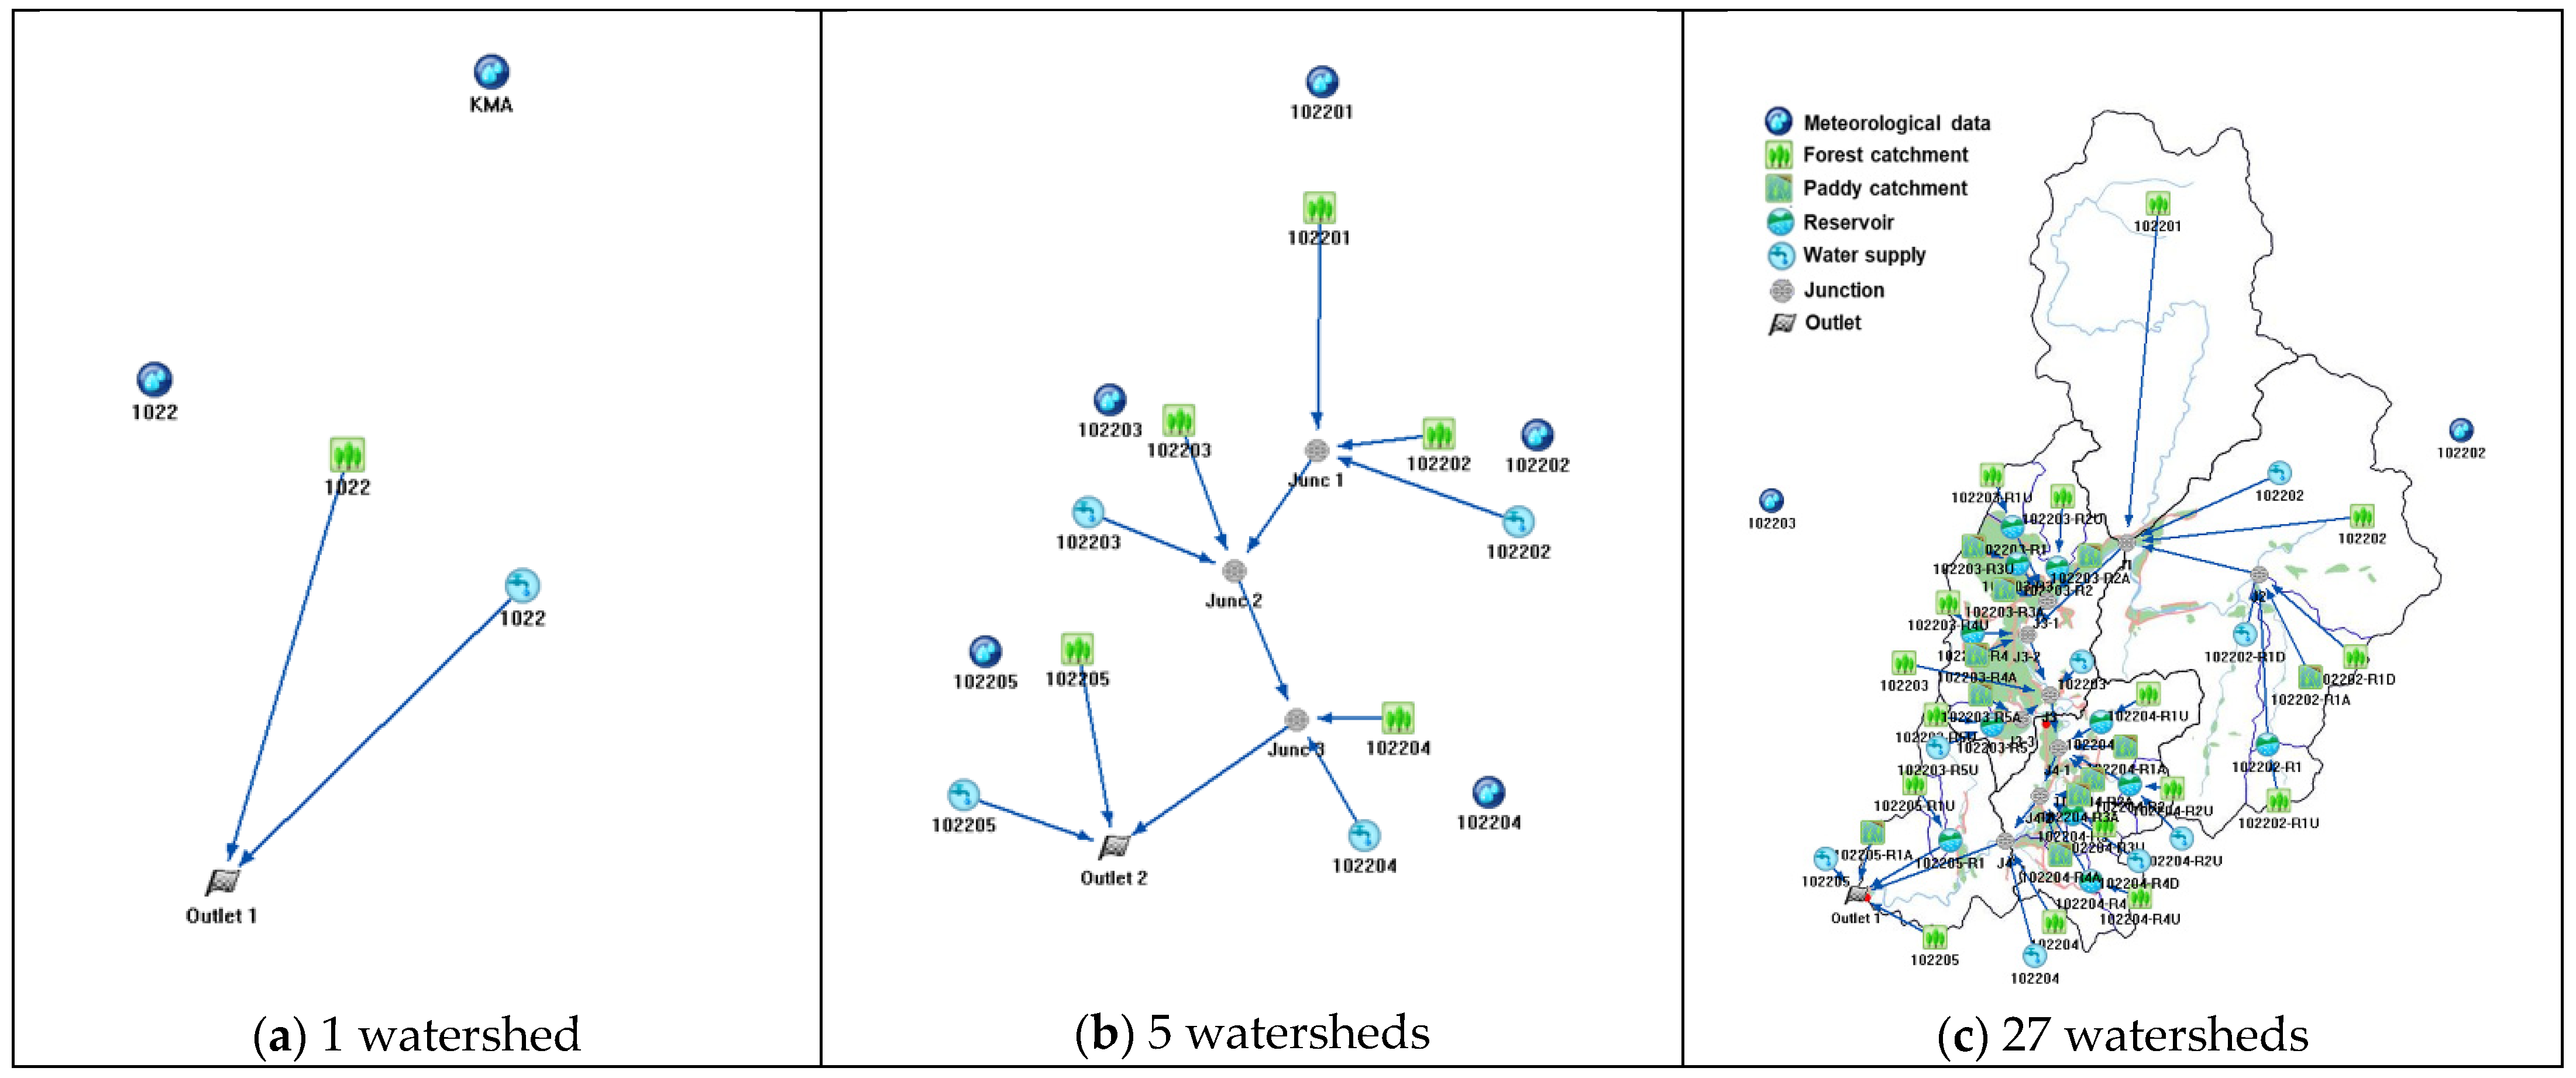
Given the complexity of the water use system in the upstream watershed of the Hantan River Dam, three watershed division scenarios were established. For the optimal watershed division, as illustrated in Figure 4, we considered 1 main watershed, 5 sub-watersheds, including the standard watershed, and an additional 27 watersheds based on the presence of agricultural water storage facilities (including 11 under the jurisdiction of the Korea Rural Community Corporation). During the model calibration process, parameter adjustments were made by inputting four types of water usage data in the three watershed division scenarios.
Figure 4.
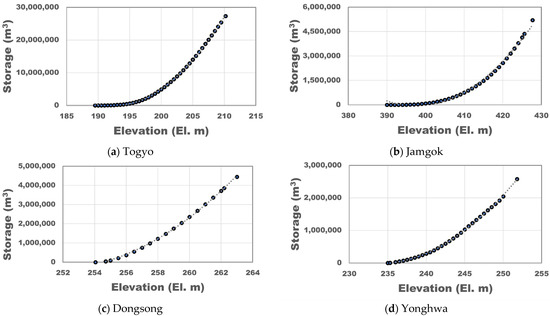
Stage-Storage Curve in Irrigation Reservoirs (top 4 effective storage capacity levels).
The parameters were calibrated by inputting data related to groundwater usage, wastewater discharge, sewage usage, and wastewater processing volume. The NSE (Nash–Sutcliffe Efficiency) of runoff was calculated using data from groundwater usage and wastewater discharge.
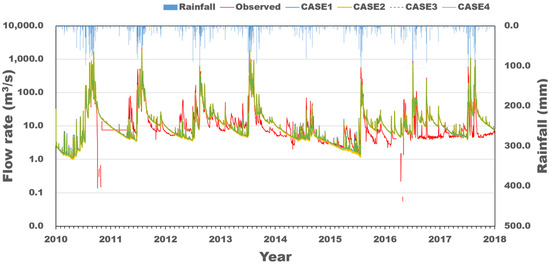
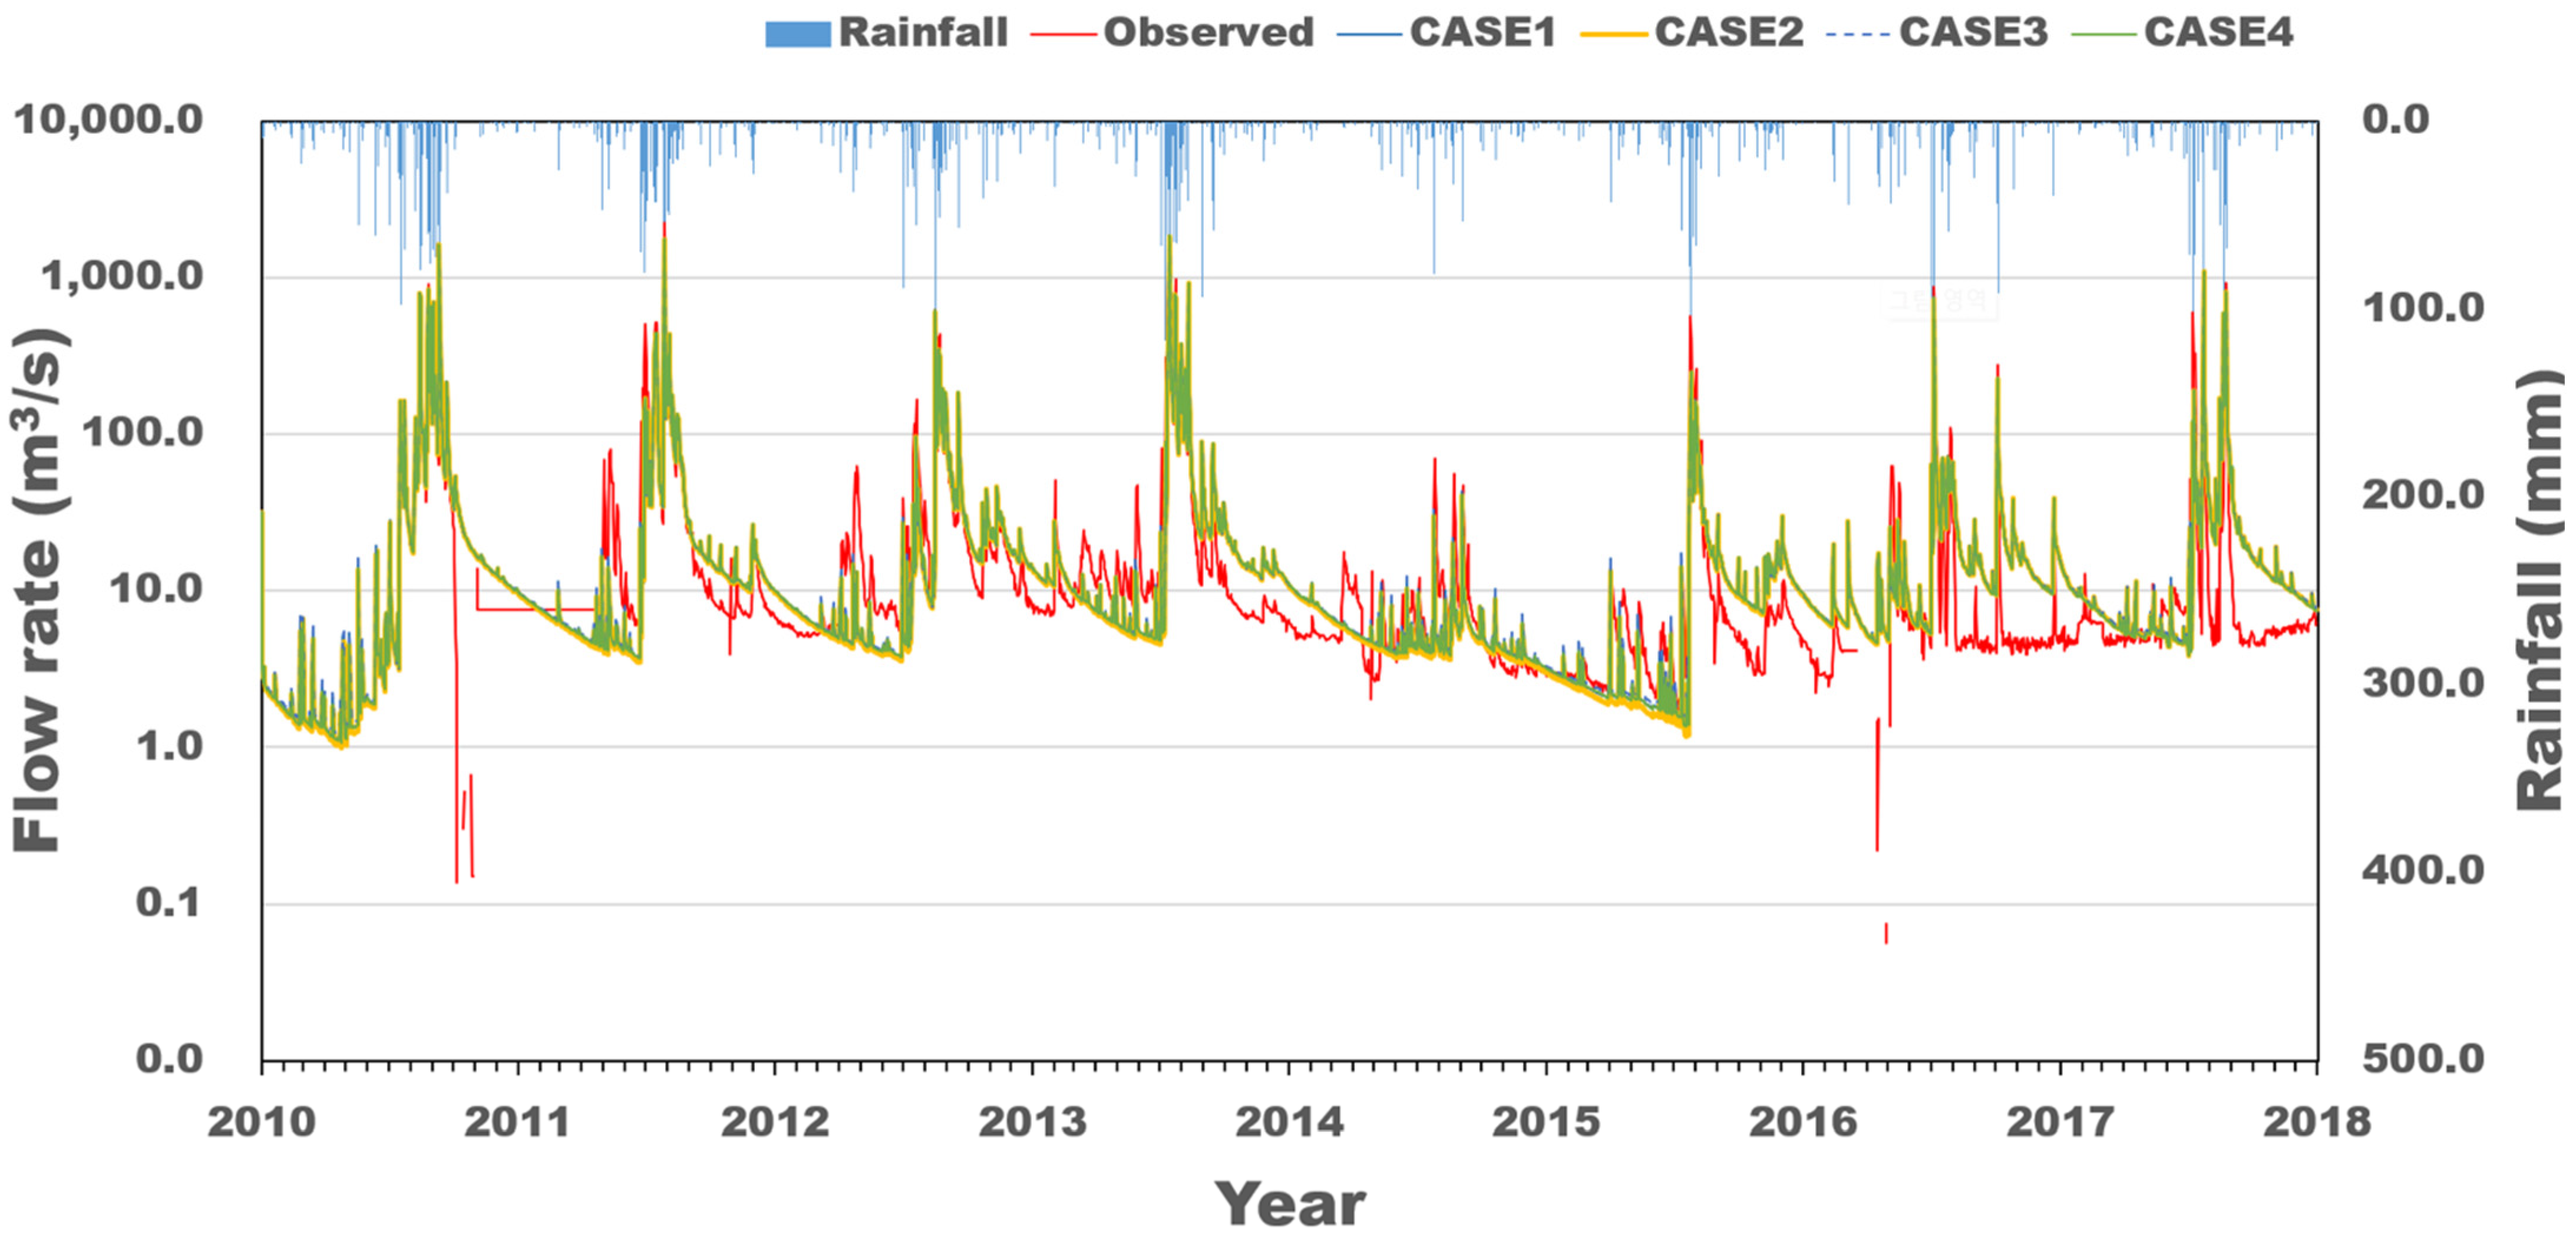
As a result of the model calibration, when the watershed was divided into 27 sub-watersheds, the average model efficiency for the entire period was 0.837, compared to 0.731 in a single watershed and 0.829 in the case of 5 watersheds (Table 5). In 2014, during the drought period, all three watershed division scenarios exhibited the lowest annual model efficiency, ranging from 0.107 to 0.207. The results from the five watershed divisions did not show significant differences from the simulation results of a single watershed. However, an increase in model efficiency was observed when using 27 sub-basins, especially when wastewater discharge was included as an input. In addition, the simulation results for the entire period by input data exhibited minimal differences. Figure 5 displays the outflow simulated in the 27 watersheds when wastewater discharge was included as an input.
Table 5.
Efficiency of runoff by scenario.
Figure 5.
Hantan River upper basin division scenario.
3.2. Reservoir Water Level Simulation Results
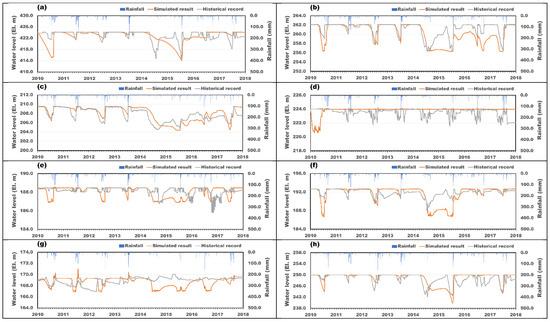
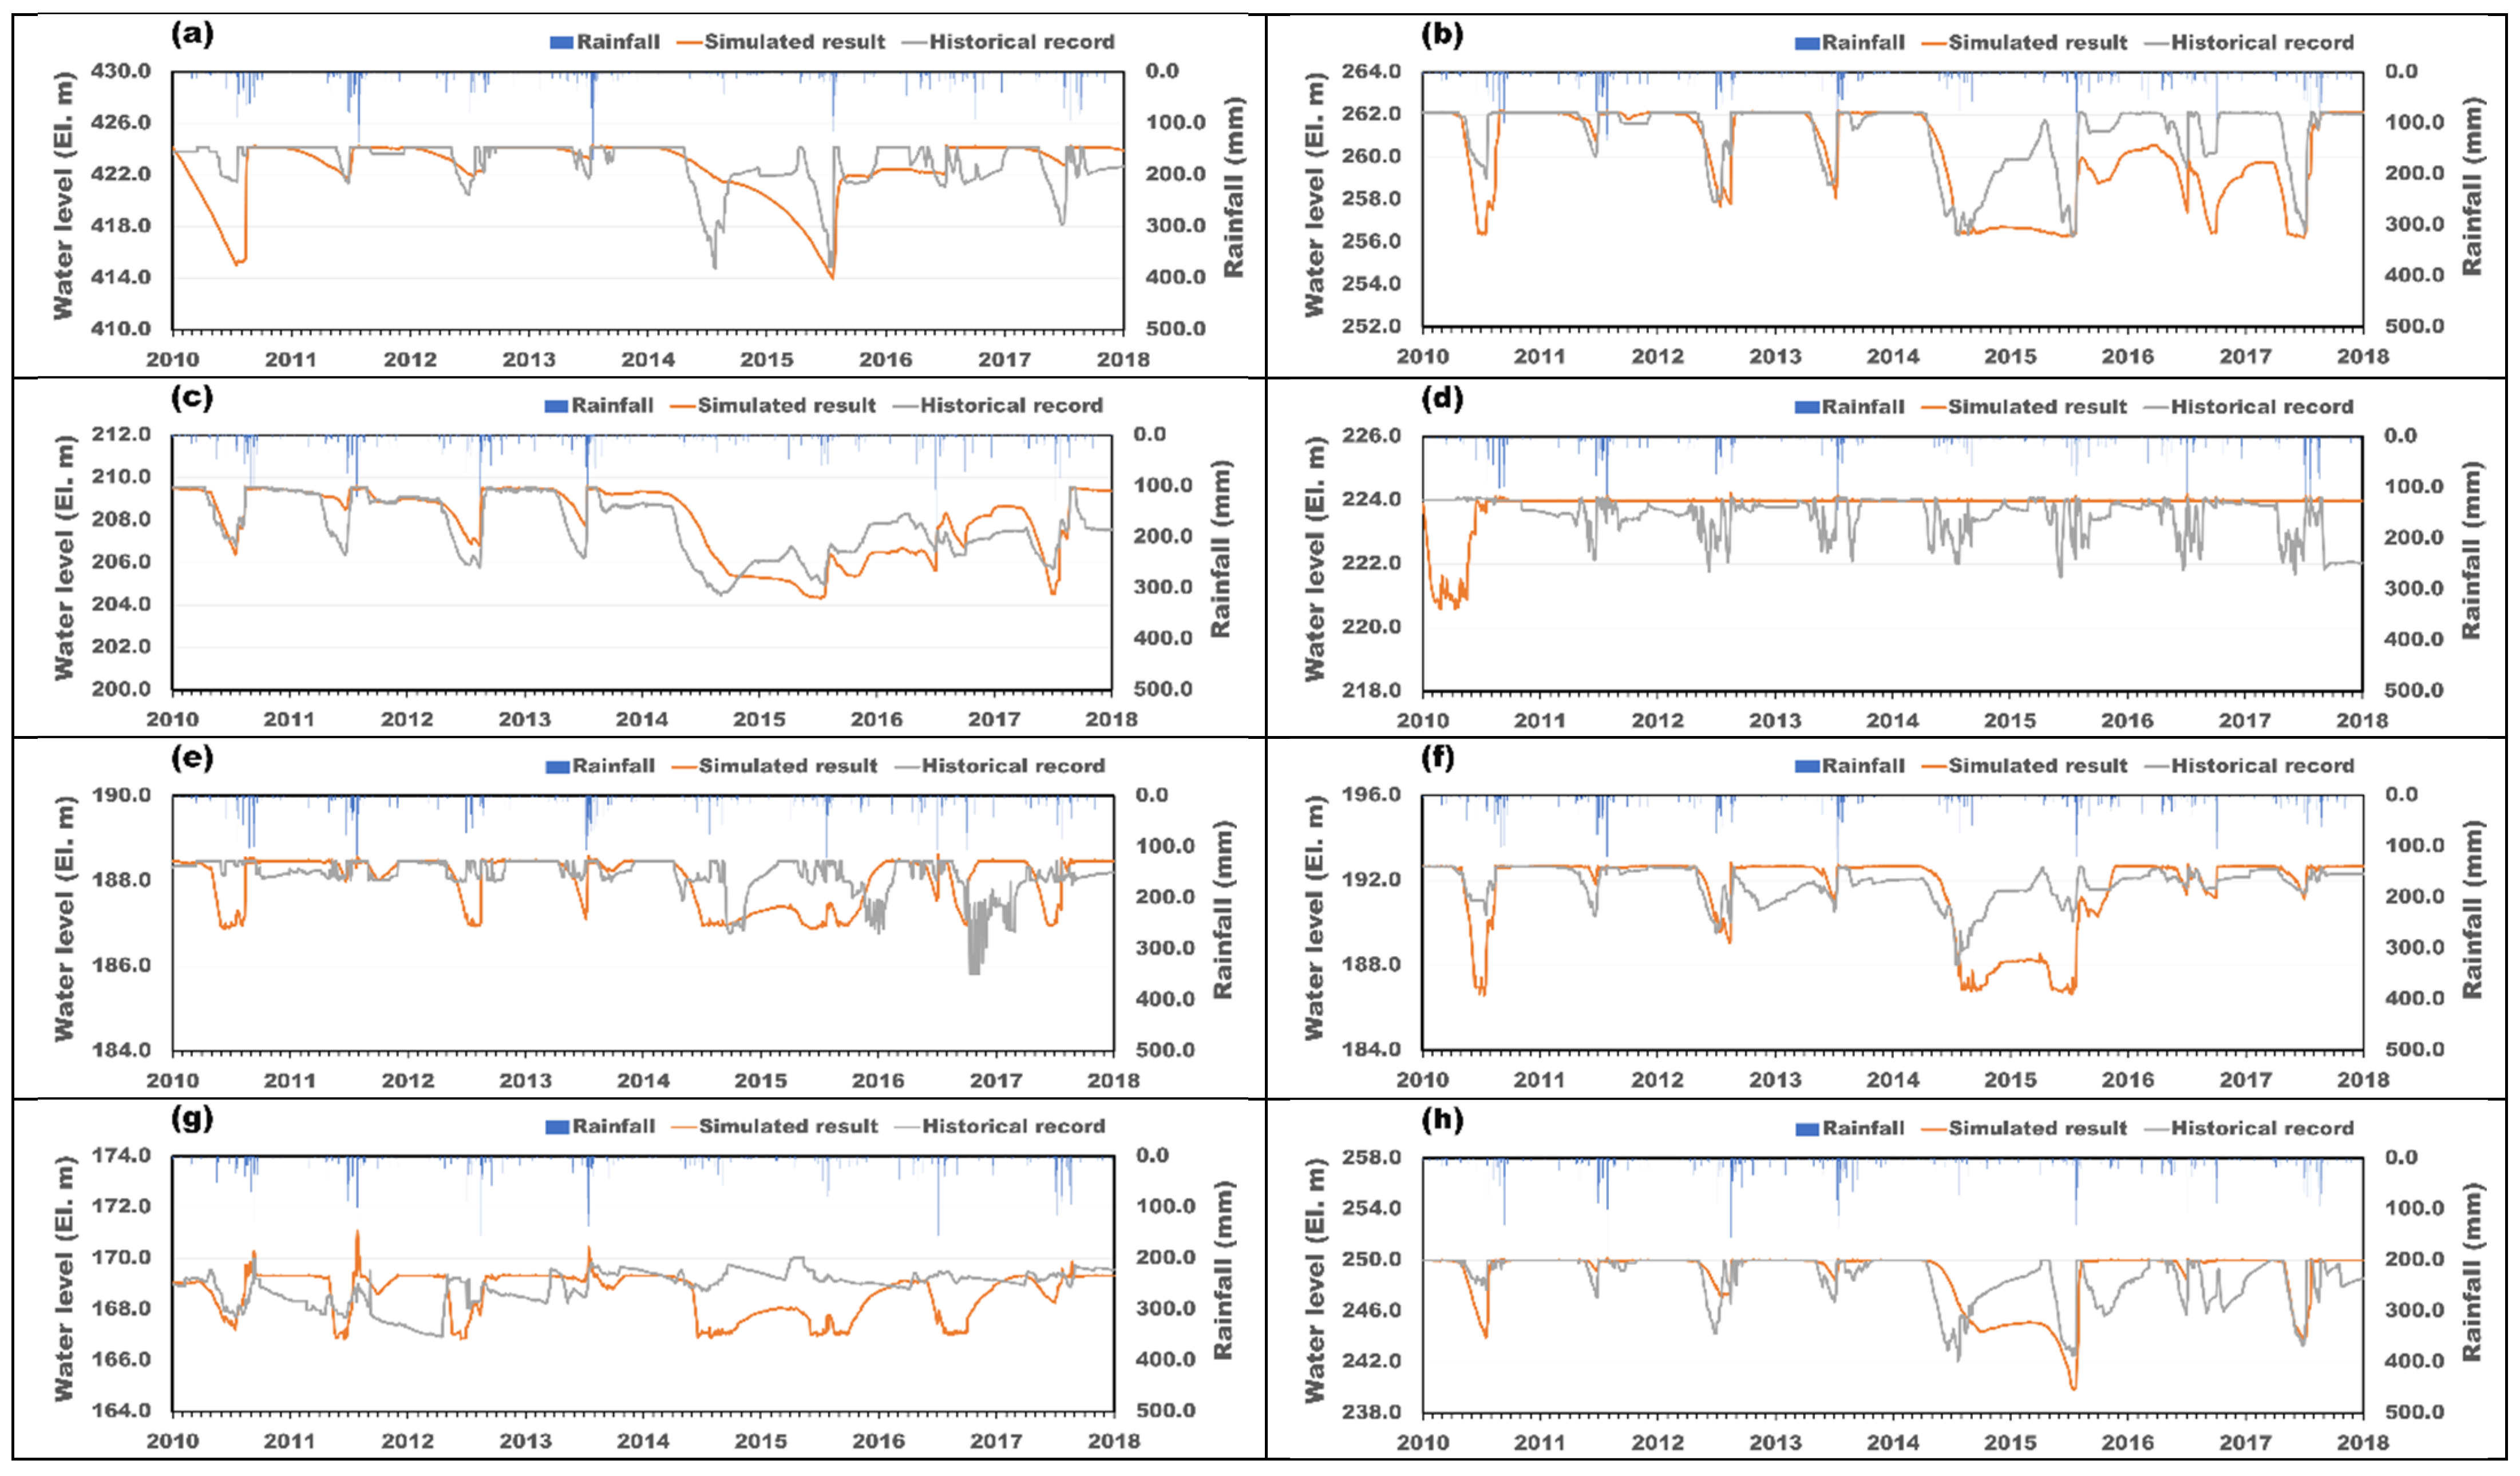
Figure 6 shows the results of the water level simulation from 2010 to 2017 of agricultural water storage facilities managed by the Korea Rural Community Corporation. Most observed and simulated reservoir water levels show similar patterns, but the simulated water level during a drought in 2014 shows different results. In particular, Hagal Reservoir, which receives water from the Togyo and Dongsong reservoirs via the main irrigation canal, does not align with the observed reservoir water level trend. This discrepancy is due to the substantially higher water supply compared to the effective reservoir capacity. Hak Reservoir and Naengjeong Reservoir, which utilize stream water as their water source, exhibited varying results due to simulation limitations, primarily stemming from the absence of data on the pumping station’s usage (Figure 7).
Figure 6.
The simulation results by year.
Figure 7.
Simulation results of low water level in agricultural reservoirs in the upper basin of Hantan River Dam ((a) Jamgok, (b) Dongsong, (c) Togyo, (d) Hagal reservoir, (e) Hak reservoir, (f) Geumyeon reservoir, (g) Naengjeong reservoir, (h) Yonghwa reservoir, (i) Jamil reservoir, (j) Sanjeong reservoir).
Since the drought in 2014, the reservoir’s water level has consistently remained significantly lower than the observed level, which is believed to be a result of external water supply, especially given that the observed water level tends to rise during periods of no rainfall.
Drawing a comparison between the quantitative data and the Hantan River Dam inflow data, as presented in Table 6, the amount of loss since 2014 has increased significantly compared to the rainfall due to the characteristics of water movement caused by the external supply of water storage facilities during drought. In particular, the change in the freshwater volume of the reservoir increased significantly to 11.05 million tons in 2014. However, this increase was relatively small compared to the amount of loss, leading to the conclusion that water movement outside the watershed may have occurred. In particular, the inflow into the Hantan River Dam was 221.90 million tons in 2014, which was significantly lower than the average of 778.31 million tons from 2011 to 2017. Compared to precipitation, the average sum of wastewater, reservoir use, and groundwater use is 52.34 million tons, which demonstrates quantitatively insignificant results compared to the overall usage. As of the first day of each month, there was an 11.05-million-ton change in water storage capacity in the reservoir based on the freshwater level in 2014 during a severe drought. However, this change was relatively small compared to the average inflow of the Hantan River Dam, and it is insufficient to explain the relationship between water usage and inflow. As shown in Table 7, the net outflows from January to March were consistently higher than the inflows, except for 2014, when a severe drought occurred. This difference is attributed to the effect of melting snow and inflow from outside the watershed.
Table 6.
Hantan River Da upstream water balance by year (unit: ×10⁶ m3).
Table 7.
Comparison of monthly water balance in the upstream basin of Hantan River Dam.
4. Conclusions
The hydrological simulation, considering the water use system in the upstream watershed of the Hantan River Dam, indicated that dividing the watershed into smaller units improved the efficiency of the outflow model for the entire period from 2010 to 2017. Based on the Korea Rural Community Corporation’s 11 agricultural water storage facilities, the average model efficiency of the 27 subdivided watersheds was 0.837, which was higher than 0.731 in 1 watershed and 0.829 in 5 watersheds, indicating that the model efficiency improved as the watershed was subdivided.
The simulation results of entering the wastewater discharge showed that overall model efficiency improved after the 2014 drought, but there was no significant improvement in the model efficiency for each scenario considering groundwater and wastewater discharge. It is judged that the characteristics of water movement in the upstream watershed of the Hantan River Dam are complex and that there is an out-of-basin supply through main irrigation canals and the main river stream. The net outflow rate from January to March exceeded 100% for the entire period, except for 2014. This suggests that an out-of-watershed inflow is occurring. In addition, it was found that a large amount of net inflow occurred in February and March due to melting snow.
Since the Hantan River Dam inflow data shows a change in the hydrological response curve after a drought in 2014, it is believed that further analysis should be conducted by securing the current status of water movement outside the watershed and observed data from the sub-watershed in the future.
In this study, we used the CAT model to verify watershed delineation and conducted reservoir level simulations in the Hantan River watershed in South Korea, yielding scientific results. Due to the complexity of water usage in the Hantan River, we will further discuss the scientific findings, considering future water movements beyond the watershed.
The Hantan River watershed is a river shared between North and South Korea, and it is important to establish a cooperative system between North and South Korea for water security. However, if South Korea’s water use system is evaluated as in this study and a basic framework for research on unmeasured areas is established, water management will be more effective.
Author Contributions
Conceptualization, H.S. and H.L. (Hyeokjin Lim); methodology, H.L. (Hyeokjin Lim) and J.L.; software, H.S. and S.K.; validation, H.S. and G.L.; formal analysis, G.L. and C.-s.L.; investigation, H.L., S.K. and J.L.; resources, S.L., H.L. (Heesung Lim) and Y.J.; data curation, H.L. (Hyeokjin Lim) and S.L.; writing—original draft preparation, H.S., H.L. (Heesung Lim) and J.L.; writing—review and editing, S.L., Y.J., H.L. (Hyeokjin Lim) and C.-s.L.; visualization Y.J. and H.L. (Heesung Lim); supervision, H.S. and C.P.; project administration, H.S. and J.L.; funding acquisition, H.S. and C.P. All authors have read and agreed to the published version of the manuscript.
Funding
This work was supported by Korea Environment Industry & Technology Institute (KEITI) through Water Management Program for Drought Project, funded by Korea Ministry of Environment (MOE) (2022003610002). This work was supported by Korea Institute of Planning and Evaluation for Technology in Food, Agriculture and Forestry (IPET) through Agricultural Foundation and Disaster Response Technology Development Program, funded by Ministry of Agriculture, Food and Rural Affairs (MAFRA) (3210070-4).
Institutional Review Board Statement
Not applicable.
Informed Consent Statement
Not applicable.
Data Availability Statement
Data are contained within the article.
Conflicts of Interest
The authors declare no conflicts of interest.
References
- Jo, D.; Son, I.; Choi, H. Development of a New Flood Index for Local Flood Severity Predictions. J. Korea Water Resour. Assoc. 2013, 46, 47–58. [Google Scholar] [CrossRef] [Scilit]
- Kim, S.; Lee, T.; Shin, Y. Estimation of high-resolution soil moisture based on Sentinel-1A/B SAR sensors. J. Korean Soc. Agric. Eng. 2019, 61, 89–99. [Google Scholar] [CrossRef]
- Chikamoto, Y.; Wang, S.; Yost, M.; Yocom, L.; Gillies, R. Colorado River water supply is predictable on multi-year timescales owing to long-term ocean memory. Commun. Earth Environ. 2020, 1, 26. [Google Scholar] [CrossRef] [Scilit]
- Lee, H.; Nam, W.; Yoon, D.; Hong, E.; Kim, T.; Park, J. Percentile approach of drought severity classification in Evaporative Stress Index for South Korea. J. Korean Soc. Agric. Eng. 2020, 62, 63–73. [Google Scholar] [CrossRef]
- Jeon, M.; Nam, W.; Yang, M.; Mun, Y.; Hong, E.; Ok, J.; Hwang, S.; Hur, S. Assessment of upland drought using soil moisture based on the water balance analysis. J. Korean Soc. Agric. Eng. 2021, 63, 1–11. [Google Scholar] [CrossRef]
- Knox, K. Climate Justice in the UK: Reconciling Climate Change and Equity Issues in Policy and Practice in a Developed Country Contex. In Routledge Handbook of Climate Justice; Jafry, T., Ed.; Routledge: London, UK, 2019; pp. 114–127. [Google Scholar] [CrossRef] [Scilit]
- Korea Environment Institute (KEI). A Study on Impoving Policy for Actieving Climate Justice; Korea Environment Institute (KEI): Sejong, Republic of Korea, 2019; pp. 13–15. [Google Scholar]
- Korea Research Institute for Human Settlements (KRIHS). Policy Direction of Water Resources Considering Efficiency and Acceptability; Korea Research Institute for Human Settlements (KRIHS): Sejong, Republic of Korea, 2019; pp. 19–43. [Google Scholar]
- Kite, G. Using a basin-scale hydrological model to estimate crop transpiration and soil evaporation. J. Hydrol. 2000, 229, 59–69. [Google Scholar] [CrossRef] [Scilit]
- Kite, G. Modeling the mekong: Hydrological simulation for environmental impact studies. J. Hydrol. 2001, 253, 1–13. [Google Scholar] [CrossRef] [Scilit]
- Kim, B.; Kim, B.; Kwon, H. Impact assessment of agricultural reservoir on streamflow simulation using semi-distributed hydrologic model. J. Korean Soc. Civ. Eng. 2009, 29, 11–22. [Google Scholar] [CrossRef]
- Kim, D.; Park, K.; Jo, J. Analysis of characteristics for irrigation reservoir using SWAT model. In Proceedings of the Korea Water Resources Association Conference; 2008; pp. 810–817. Available online: https://www.kwra.or.kr/publication/proceeding/detail/?chk=5426 (accessed on 12 November 2023).
- Lee, Y.; Park, M.; Park, K.; Kim, S. Analysis of hydrologic behavior including agricultural reservoir operation using SWAT model. J. Korean Assoc. Geogr. Inf. Stud. 2008, 11, 20–30. [Google Scholar]
- Arnold, J.; Allen, P.; Bernhardt, G. A comprehensive surface groundwater flow model. J. Hydrol. 1993, 142, 47–69. [Google Scholar] [CrossRef] [Scilit]
- Ahn, S.; Park, G.; Shin, Y.; Kim, S. Assessment of the Potential Water Supply Rate of Agricultural Irrigation Facilities Using MODSIM: For Geum River Basin. J. Korea Water Resour. Assoc. 2009, 42, 825–843. [Google Scholar] [CrossRef] [Scilit]
- Labadie, J. MODSIM: River basin management decision support system. In Watershed Models; CRC Press: Boca Raton, FL, USA, 2005. [Google Scholar]
- Lee, H.; Kim, Y.; Yang, J.; Koh, D. Water Balance Analysis at Yongdam Testing Basin. In Proceedings of the Korea Water Resources Association Conference; 2008; pp. 1884–1888. Available online: https://www.kwra.or.kr/publication/proceeding/detail/?chk=5650 (accessed on 12 November 2023).
- Lee, S.; Kim, J.; Noh, J. Long Term Runoff Simulation for Water Balance at Daecheong Basin. J. Environ. Sci. 2010, 19, 1211–1217. [Google Scholar] [CrossRef] [Scilit]
- Jang, C.; Kim, H.; Kim, J. Prediction of Reservoir Water Level using CAT. J. Korean Soc. Agric. Eng. 2012, 54, 27–38. [Google Scholar] [CrossRef] [Scilit]
- Kim, H.; Noh, S.; Jang, C. Development and Application of the Water Cycle Analysis Model for the Urban Catchment; Korea Institute of Construction Technology: Goyang, Gyeonggi, Repubic of Korea, 2011; pp. 71–174. [Google Scholar]
- Miller, J.D.; Kim, H.; Kjeldsen, T.R.; Packman, J.; Grebby, S.; Dearden, R. Assessing the impact of urbanizaztion on storm runoff in a peri-urban catchment using historical change in impervious cover. J. Hydrol. 2014, 515, 59–70. [Google Scholar] [CrossRef] [Scilit]
- Han River Flood Control Office (HRFCO). Available online: http://www.wamis.go.kr/ (accessed on 12 November 2023).
- Kim, H.; Jang, C.; Noh, S. Development and Application of the Catchment Hydrologic Cycle Assessment Tool Considering Urbanization (I)—Model Development. J. Korea Water Resour. Assoc. 2012, 45, 203–215. [Google Scholar] [CrossRef] [Scilit]
- Park, S.; Kim, H.; Jang, C. Analysis of Streamflow Characteristics of Boryeong-dam Watershed using Global Optimization Technique by Infiltraion Methods of CAT. J. Korea Acad. Ind. 2019, 20, 412–424. [Google Scholar] [CrossRef]
- Smith, M.; Allen, R.; Periera, L.; Raes, D. Crop evapotranspiration: Guidelines for computing crop requirements. In Irrigation and Drainage Paper 56; Food and Agriculture Organization of the United: Roma, Italy, 1998. [Google Scholar]
- Ministry of Land, Infrastructure, Transport and Tourism (MLIT). River Environment Division, River Bureau, SHER Model User’s Manual (Draft); 2001; Japan. pp. 3–13. Available online: https://arsit.or.jp/sher_download (accessed on 12 November 2023).
- Maidment, D. Handbook of Hydrology; McGraw-Hill, Inc.: New York, NY, USA, 1992; pp. 127–174. [Google Scholar]
- Green, W.; Ampt, G. Studies on Soil Physics. Part I. The Flow of Air and Water through Soils. J. Agric. Sci. 1911, 4, 1–24. [Google Scholar]
- Horton, R. The role of infiltration in the hydrologic cycle. Am. Geophys. Union Trans. 1933, 14, 446–460. [Google Scholar]
- Ministry of Land, Infrastructure and Transport. Available online: https://www.molit.go.kr/english/intro.do (accessed on 12 November 2023).



Disclaimer/Publisher’s Note: The statements, opinions and data contained in all publications are solely those of the individual author(s) and contributor(s) and not of MDPI and/or the editor(s). MDPI and/or the editor(s) disclaim responsibility for any injury to people or property resulting from any ideas, methods, instructions or products referred to in the content. |
© 2024 by the authors. Licensee MDPI, Basel, Switzerland. This article is an open access article distributed under the terms and conditions of the Creative Commons Attribution (CC BY) license (https://creativecommons.org/licenses/by/4.0/).