


Abstract
The modification of land use is a crucial factor in the dysfunction of ecosystems. It greatly influences the hydrological cycle of basins. This study focused on the Oueme basin, which represents almost half of the total area of Benin, and aimed to describe the current and future evolution of its land cover using the maps of the Land Use Land Cover Dynamics project (1975, 2000, and 2013). A temporal analysis of the surface states was performed with QGIS, and the potential land cover in 2025, 2050, and 2085 was estimated using the Markov chain algorithm in the IDRISI software. The results showed that the Oueme basin was predominantly savanna (77.70% in 1975, 66.29% in 2000, and 57.10% in 2013). Forest areas, which represented the second class in 1975 with a total proportion of 13.34%, gradually decreased to 8.66% and 6.89%, respectively, in 2000 and 2013. Conversely, cultivated areas had more than tripled in 2000 and quadrupled in 2013. Residential areas increased rapidly in the southern part of the basin, with an acceleration in the recent period (6% between 2000 and 2013, against 2% between 1975 and 2000). This probably led to the lower stability rate in this zone (56%) compared to Oueme upper (74%). The recent period was more affected by changes in the surface conditions, and these changes are likely to be amplified in the future (probable total disappearance of forested areas by 2085). We recommend clarifying the impacts that each land use category generates/will generate on the hydrological cycle of this basin.
1. Introduction
The land, which is the support of all other elements of biodiversity, has undergone many changes in recent decades. These include changes due to anthropogenic actions, which are increasing with population growth, and modernization, which aims to solve humanitarian problems in general and especially to cope with the global food and financial crisis [1]. Since the beginning of the 21st century, mapping studies have helped to identify environmental transformations globally. The consensus is that the global forest loss has been significantly reduced.
However, this is not true everywhere. In Benin, for instance, deforestation has increased [2]. The evolution of land use categories in the country presents a worrying situation. For example, forest areas can be suddenly transformed into cultivated or residential areas, with extensions happening in record time [3,4].
The dynamics of land use in Benin have been studied on several occasions (e.g., [4,5,6]. However, it is still difficult to distinguish and characterize areas of great change (e.g., between north and south). This is partly due to differences in the methodologies used to process and analyze the primary data, usually satellite images in previous studies. In addition, the output images that resulted from post-processing of the primary data are of different spatial resolutions. Moreover, the diversity of the spatial resolution of the maps produced previously, added to differences in the analysis periods of previous studies, complicate their exploitation for long-term hydrological studies. These issues do not facilitate a critical analysis of the evolution of surface conditions in Benin. Additional studies are thus needed to highlight the environments that have undergone large transformations.
The dynamic land cover map (LULCD) of West Africa provides a unique opportunity to address the challenge described above. It was produced with the care of several experts to present the surface states of West Africa as closely as possible to reality [7]. This map has been used to show that West Africa’s water cycle has been significantly altered over the last four decades due hunting, bushfires, agriculture, and urbanization (https://eros.usgs.gov/westafrica/atlas-overview, accessed on the 30 Decembre 2021). It is, thus, potentially suited for studies contributing to a better understanding of the evolution of the surface states in the basins of Benin [8].
One of the major basins in Benin is the Oueme basin. To better present the causes of the changes in the hydrological cycle in the Oueme basin, it will be necessary to understand its land use transformations. This would enable decision makers to develop effective plans for the development of the basin. Previous studies have shown that the hydrological cycle in the basin has experienced disruptions (e.g., [9,10]). However, these studies did not give any predictions on what might happen at the end of the century. This is likely due to the poor understanding of the future surface conditions of this basin at the end of the century.
Therefore, the main aim of the present study was to provide a basis for hydrologists to explore the impact of land used changes on the hydrological cycle up to the end of the century. This will be helpful regarding the use distributed models for hydrological impact studies in the Oueme basin. Using the dynamic land cover map, critically analyzed the current land used dynamics in the Oueme basin and determined potential transformations occurring up to the end of the century. We also provide a comparison of the changes in the northern (upper Oueme) and southern (Oueme delta) parts of the basin.
In what follows, we present the working methodology, including the data and tools used, followed by the results and conclusions.
2. Materials and Methods
2.1. Study Region
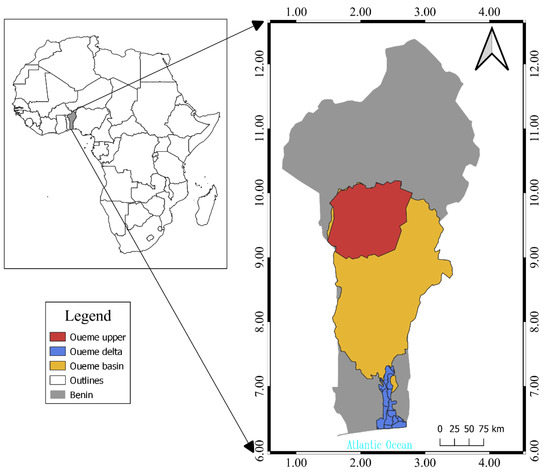
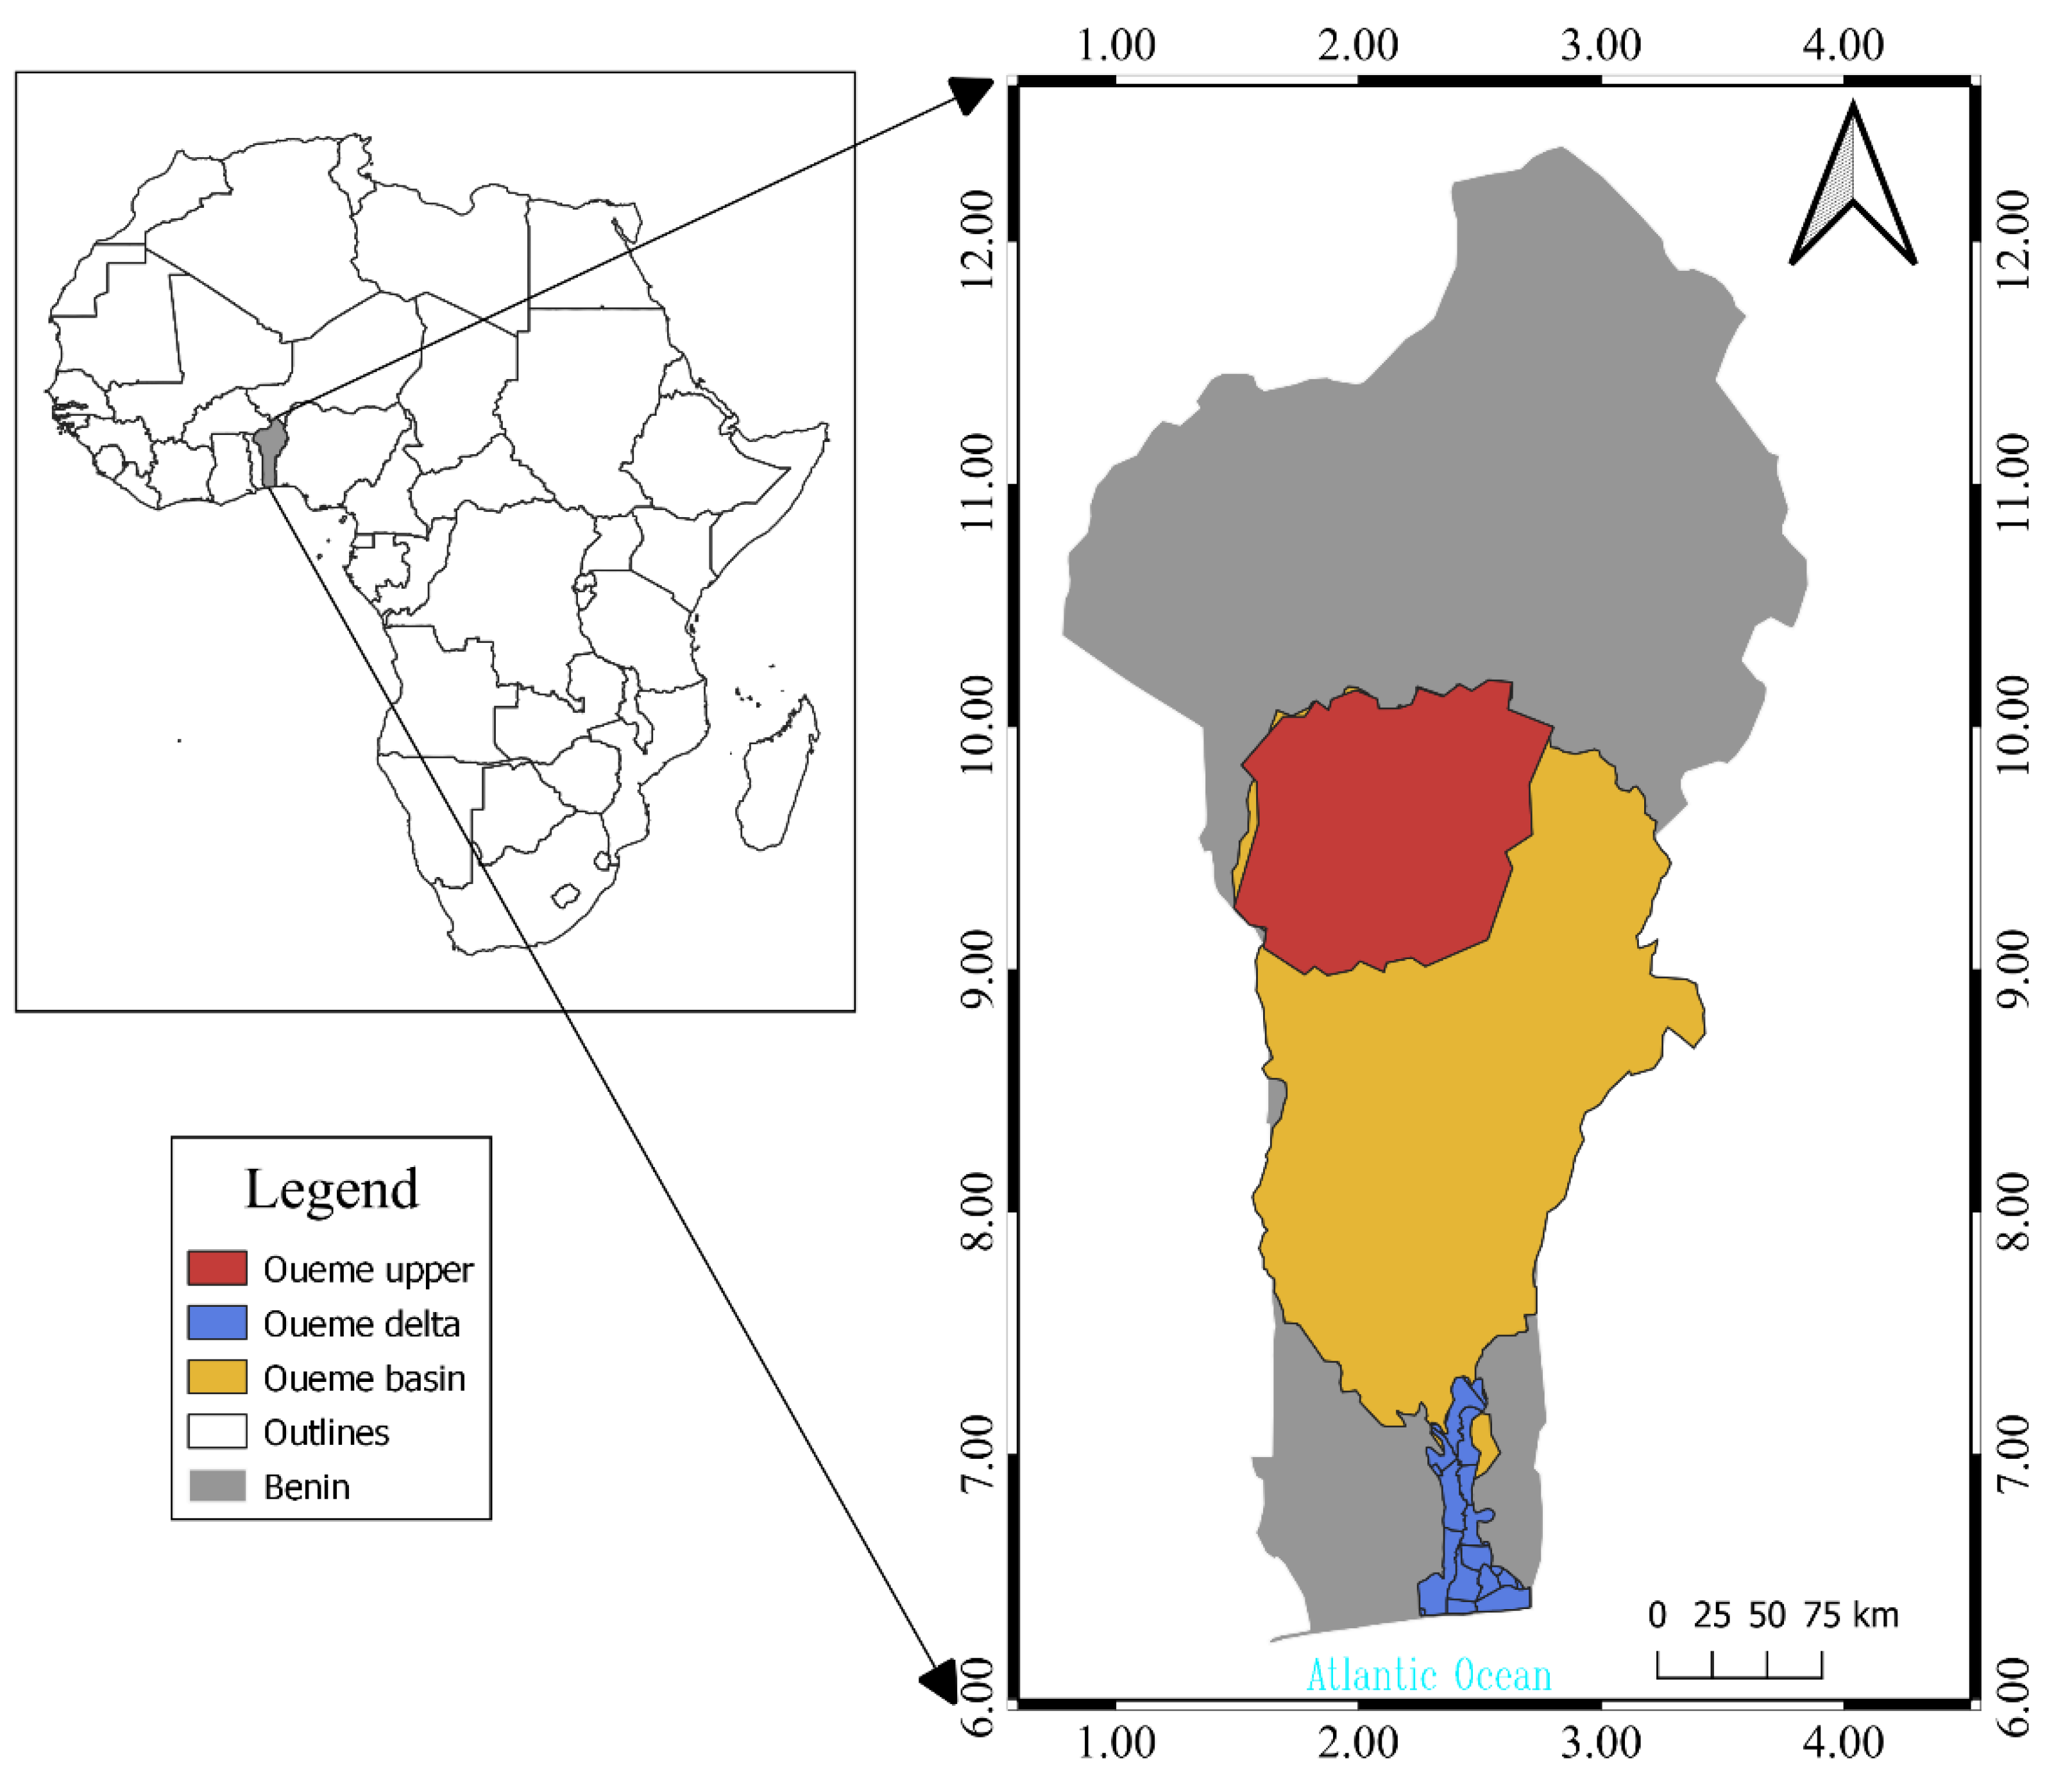
The present study was carried out in the Oueme basin (Figure 1). Located in the Republic of Benin, this basin represents almost half of the total area of the country, which is about 114,000 km2. It has a humid tropical climate, characterized by two rainy seasons in the south and one in the north [11]. Benin is bordered to the south by the Atlantic Ocean, to the east by Nigeria, to the west by Togo, and to the north by Burkina Faso and Niger.
Figure 1.
Study area.
2.2. Data
Land use maps from the years 1975, 2000, and 2013 were produced as part of the “Dynamics of Land Use in West Africa” [7,12]. These are maps already classified by the project team with the Rapid Land Cover Mapper (RLCM) tool. RLCM has been used by foresters since the 1970s to facilitate the selection and assignment of land cover classes (https://eros.usgs.gov/westafrica/mapping-land-use-land-cover, accessed on the 10 June 2020). The team collected satellite imagery from orbits hundreds of kilometers from the earth (https://eros.usgs.gov/westafrica/, accessed on the 10 June 2020). Geographical knowledge of the region, field experiments, and observations were then utilized to realize a 2 km resolution precision for the maps. For this, the team considered the period of acquisition of the images and the bases of interpretation of the images (size, shape, color, pattern, tone, shadows, texture). Map interpretation relied primarily on the use of guidelines including written and illustrated definitions of all land cover and land use classes. Verification of the accuracy of the maps was performed using recent high-resolution satellite images (Landsat) viewed in Google Earth and several aerial photographs taken by the project team.
The project map shows several classes in the Oueme basin. Among these are: forest (1), savanna (2), grassland (3), plantation (6), cultivated area, mangrove (7), (8), water bodies (9), rocky land, sandy surfaces (10), rocky land (11), dwelling (13), irrigated crops (14), gallery forest and riparian formation (15), degraded forest (21), open forest (25), cultivation and fallow under oil palm (27), swamp forest (28), and herbaceous savanna (31). The numbers in parentheses correspond to each class.
In this study, the classes were left unchanged, with no further reclassification. However, similar colors were assigned to similar classes. Note that similar classes can be merged into a single unit during hydrological simulations.
For more details regarding the map, see the article by [8].
2.3. Software
QGIS 3.14 was used to extract and present the land cover characteristics of the study area over the last four decades (1975 to 2013) and to describe the evolution of land use using statistical analysis tools for raster layers. This software also allowed an analytic study of the temporal evolution of land use in the Oueme basin. Idrisi software, recognized and supported by the National Scientific Research Center, was used to describe the future evolution of the land use. Its ability to simulate surface states in Benin has also been recognized [6,8,13]. It integrates the Markov chain, which is a stochastic model based on the following four assumptions:
- The whole past of the system is summarized in the state at the last moment we know it. Otherwise, the classes that disappeared during the historical period have no chance of reappearing.
- This is a discrete process; for example, the cultivated areas extend within the boundaries of the model.
- This is a homogeneous process over time. Thus, the increase/decrease of each land use class evolves at the same rate in the future as in the past.
- The number of possible states of the system is finite.
In addition, the Markov chain uses constraints and factors to ensure the best description of surface states in the future. One of these constraints is that forests never gain space in agricultural areas or cities. As for the factors, one example is that areas near rivers or water bodies are more exposed to agricultural production in a context where farmers need water to irrigate their crops. This presents the random distribution of the different categories of land use (see more details in [14,15,16].
2.4. Data Analysis
The average annual change in km2/year, as well as the conversion and stability rates of the different land use units were obtained using the following formulas, respectively:
with = average annual change in unit i
= area of unit i in the most recent year (y);
= area of unit i in the least recent year (x);
= the area of unit i remained stable (located on the diagonal).
Tc = conversion rate; Ts = Stability rate;
Note that we can switch from a transition matrix presented in probability to a transition matrix presented on the surface. The following equation describes the relationship between these two matrices.
with being the area of row ième and column jème for year x;
= the area of row ith and column jth for year x;
= total area of unit i, at date y.
3. Results
3.1. Spatial Analysis of the Dynamics of the Current Surface State
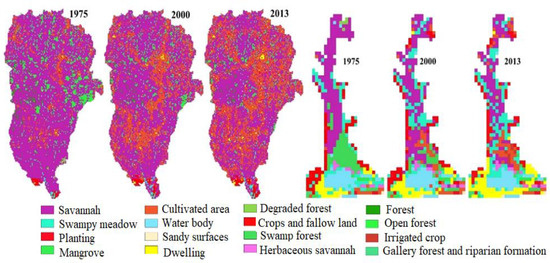
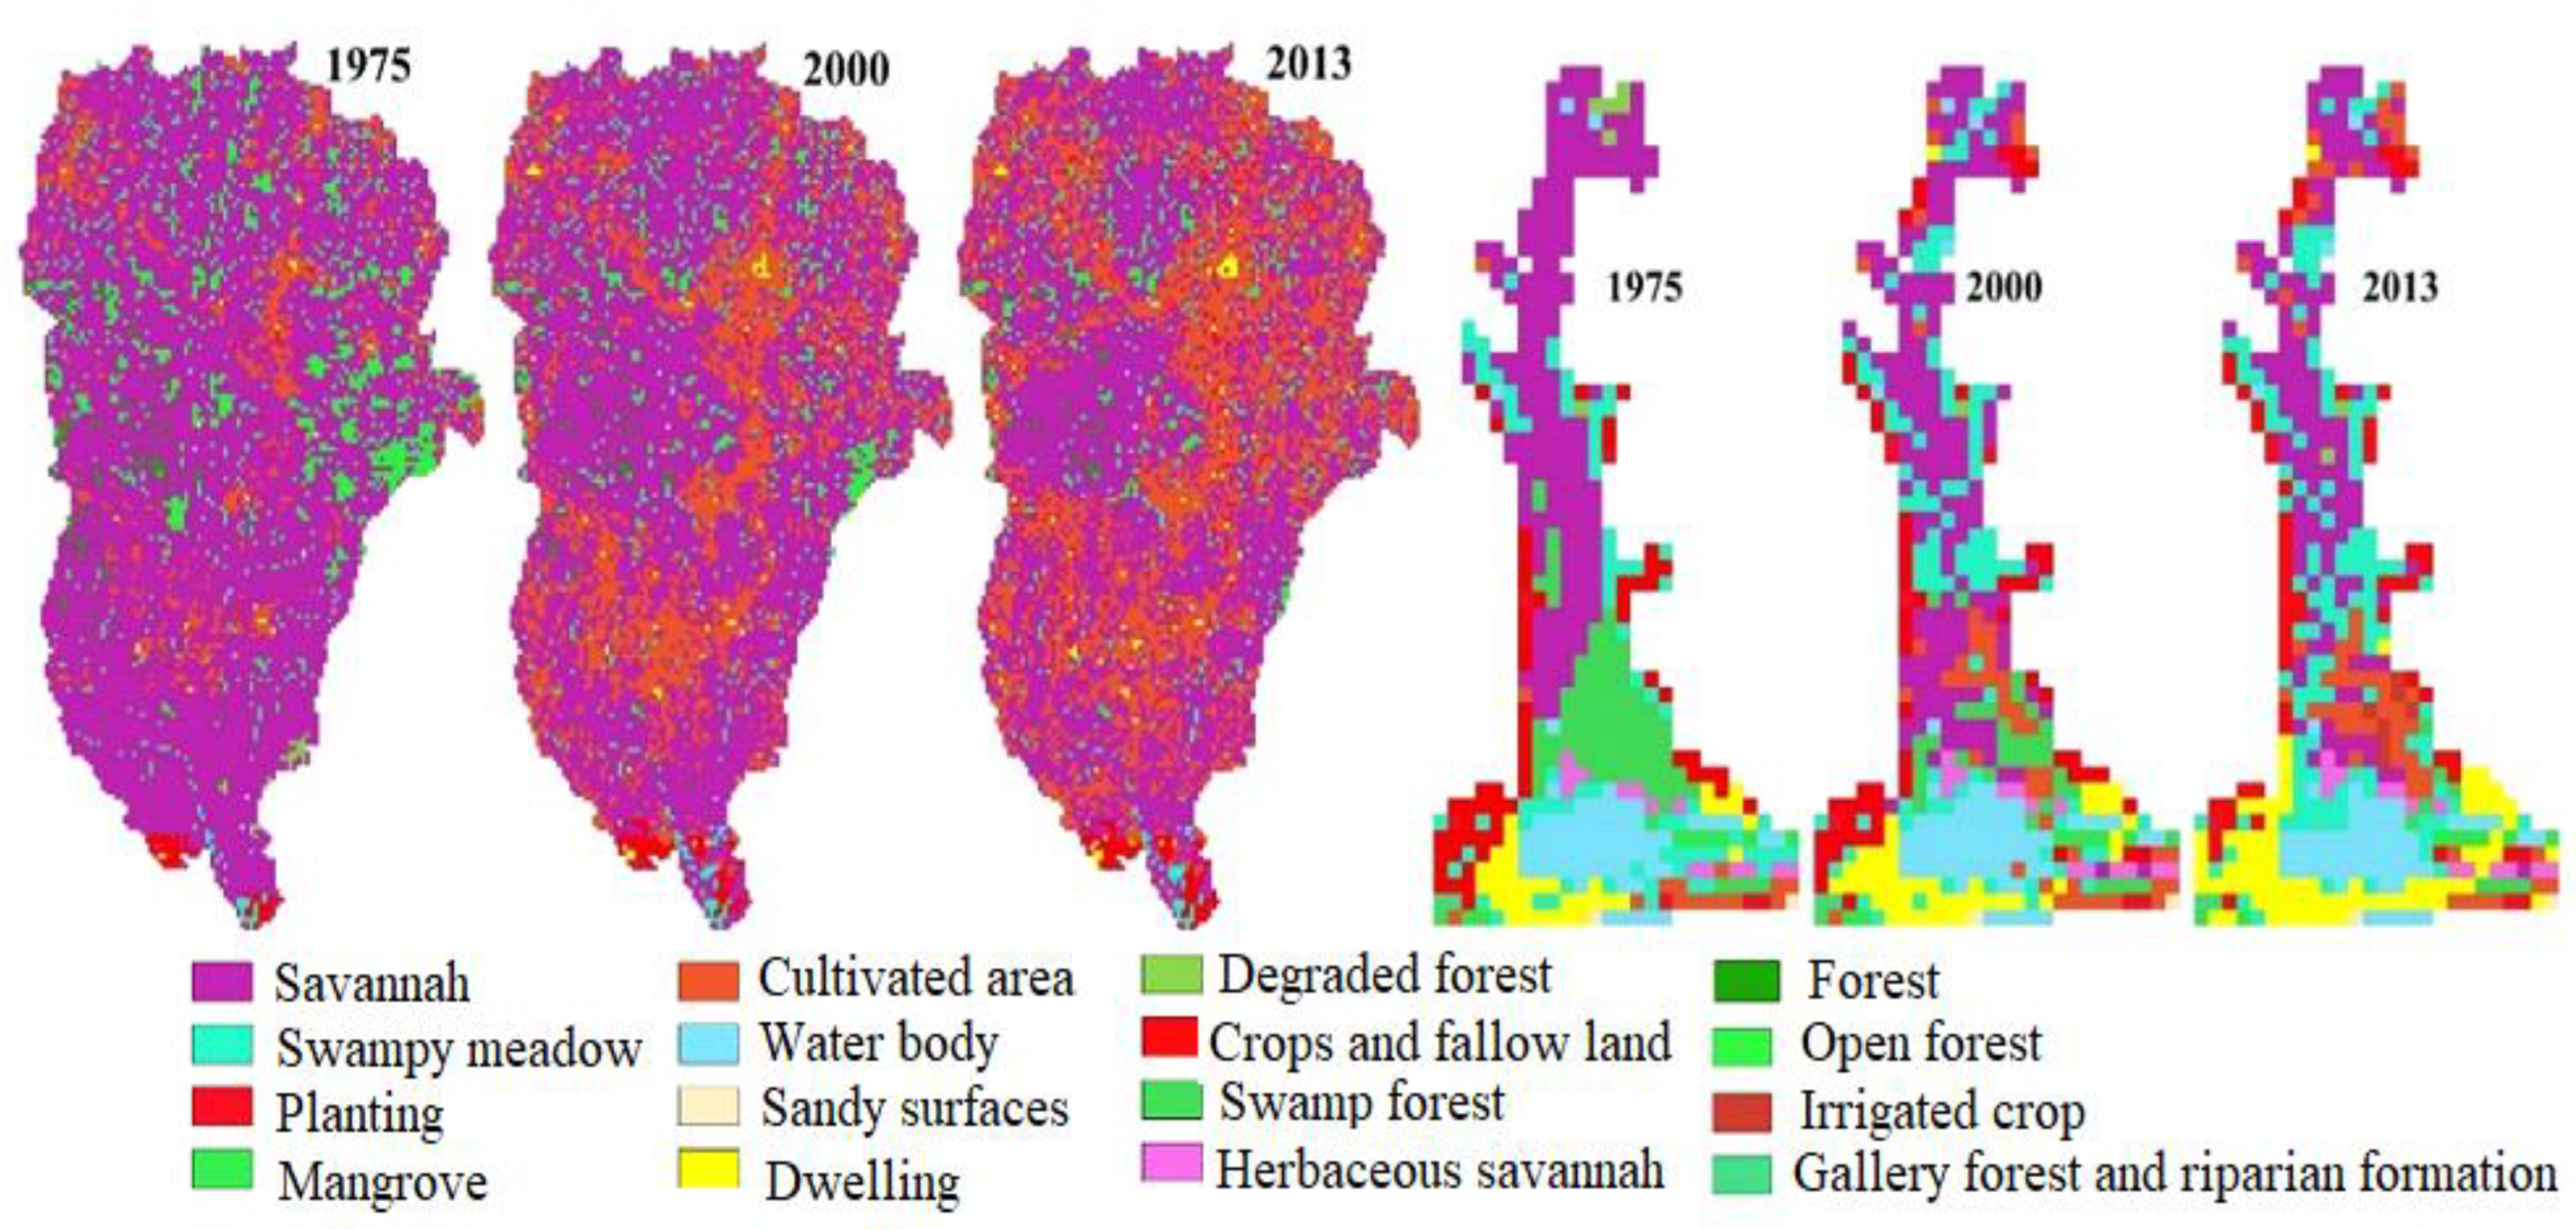
Figure 2 shows the surface conditions in 1975, 2000, and 2013 for the entire Oueme basin (the first three) and the Oueme delta (the last three).
Figure 2.
Land use dynamics in the Oueme basin. The first three for the entire Oueme basin and the last three for its southern part.
In the Oueme basin, we noted the establishment and/or development of agricultural zones in some areas. Furthermore, a decrease of forests areas was seen. This situation could be observed throughout the entire basin. In the upper Oueme, the residential areas (in yellow) are less developed and well dispersed. However, there was a remarkable development of agricultural areas. Forest areas (in green) are decreasing and being replaced by cultivated and planted areas (in red).
In the Oueme delta, there is strong urbanization pressure on the water bodies. Residential areas are being developed around the water bodies. Additionally, cultivated areas and plantations can been seen in unexpected environments, sometimes even within the water bodies (potentially on islands). In contrast, grasslands and water bodies (blue) occupy larges areas scattered throughout the delta.
3.2. Analysis of the Temporal Evolution of the Different Land Use Classes
3.2.1. Average Annual Evolution of Each Class
Table 1 presents the evolution of each land use unit in the Oueme basin. Savanna occupied 77.7%, 66.29%, and 57.10% in 1975, 2000, and 2013, respectively, in the Oueme basin. Forest areas (forest, gallery forest and riparian formation, degraded forest, and open forest), which occupied the second place in 1975 with a total proportion of 13.34%, have been replaced by cultivated areas. They occupied only 8.66% and 6.89% of the total area in 2000 and 2013, respectively, while cultivated areas increased from 7.50% in 1975 to 22.87% and 31.79% in 2000 and 2013, respectively. These units, especially the Savanna and the cultivated areas, have experienced drastic changes. In the savanna, there was an average annual regression of more than 250 km2/year between 1975 and 2013. However, the cultivated areas recorded an average annual increase of the same order (309.4 km2/year). There is a good correlation between the evolution of the savanna and that of the cultivated area. An increase of cultivated areas, thus, leads to a decrease of savanna. Over the sub-period 2000–2013, settlement areas had an average annual increase of 2.77%. If the rate of regression remains the same as that observed between 2000 and 2013, forests will disappear in 2053, savanna in 2094, gallery forests and riparian formations in 2023, degraded forests in 2039, and open forest in 2059.
Table 1.
Evolution of land use units in the Oueme basin in Bonou. The percentage that the area of each class represents in each year in yellow color.
Analysis of the evolution of the upper Oueme (Table A1) shows that savanna occupied 74.95% in 1975 in this zone. However, it decreased to 69.77% in 2000 and 59.47% in 2013. At this rate, the upper Oueme savannah will completely disappear before 2085, compared to 2094 for the entire Oueme basin. We noted a regression of all forest/savanna surfaces in favor of cultivated surfaces, which increased from 9.85% in 1975 to 18.58 and 28.85% in 2000 and 2013; i.e., an average annual change of −49.9 km2/year and −111.1 km2/year for the 1975–2000 and 2000–2013 sub-periods, respectively.
In the Oueme delta (Table 2), housing areas have increased drastically. They increased from 2% during the 1975–2000 sub-period to 6% between 2000 and 2013. This increase represents eight-times (between 1975 and 2000) and sixteen-times (between 2000 and 2013), respectively, the observed change in the Oueme basin. Similarly, this change was ten- (between 1975 and 2000) and twenty-one-times (between 2000 and 2013) that observed in the upper Oueme.
Table 2.
Evolution of land use units in the Oueme Delta. The percentage that the area of each class represents in each year in yellow color.
The inhabitants of the Oueme delta previously mainly did not settle in the wetlands. They have, however, exploited such areas for agricultural, construction, and domestic purposes in recent years. This is shown by the average annual progression (+10.2 km2/year) of residential areas against the regression of the water bodies (−2.2 km2/year) over the period 2000–2013. Crop irrigation in the same area started in the second decade of the 21st century, despite the high availability of water noted in 1975 and 2000 (more than 11%). There is a strong presence of water-stress-resistant crops, such as oil palm (see next section for more details). The evolution of land use units in the upper Oueme is shown in the Appendix A (Table A1).
3.2.2. In-Depth Analysis of Dominant and Sensitive Categories
A class is designated under the dominant and sensitive category if the land use unit represents at least 2% of the total area studied and has not remained stable.
In the Oueme basin, as well as in its upper part, there are four dominant and sensitive classes, namely: cultivated zone, savanna, open forest, and gallery forest and riparian formation. In the south, there are two classes that are common to the others: cultivated area and savanna. In addition to these two classes, there are other classes such as water and habitat.
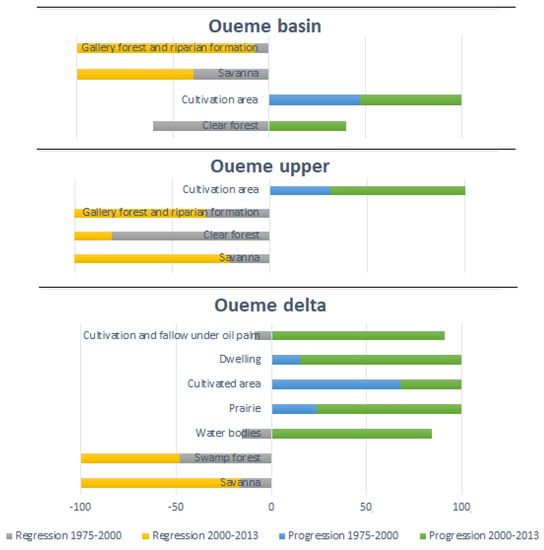
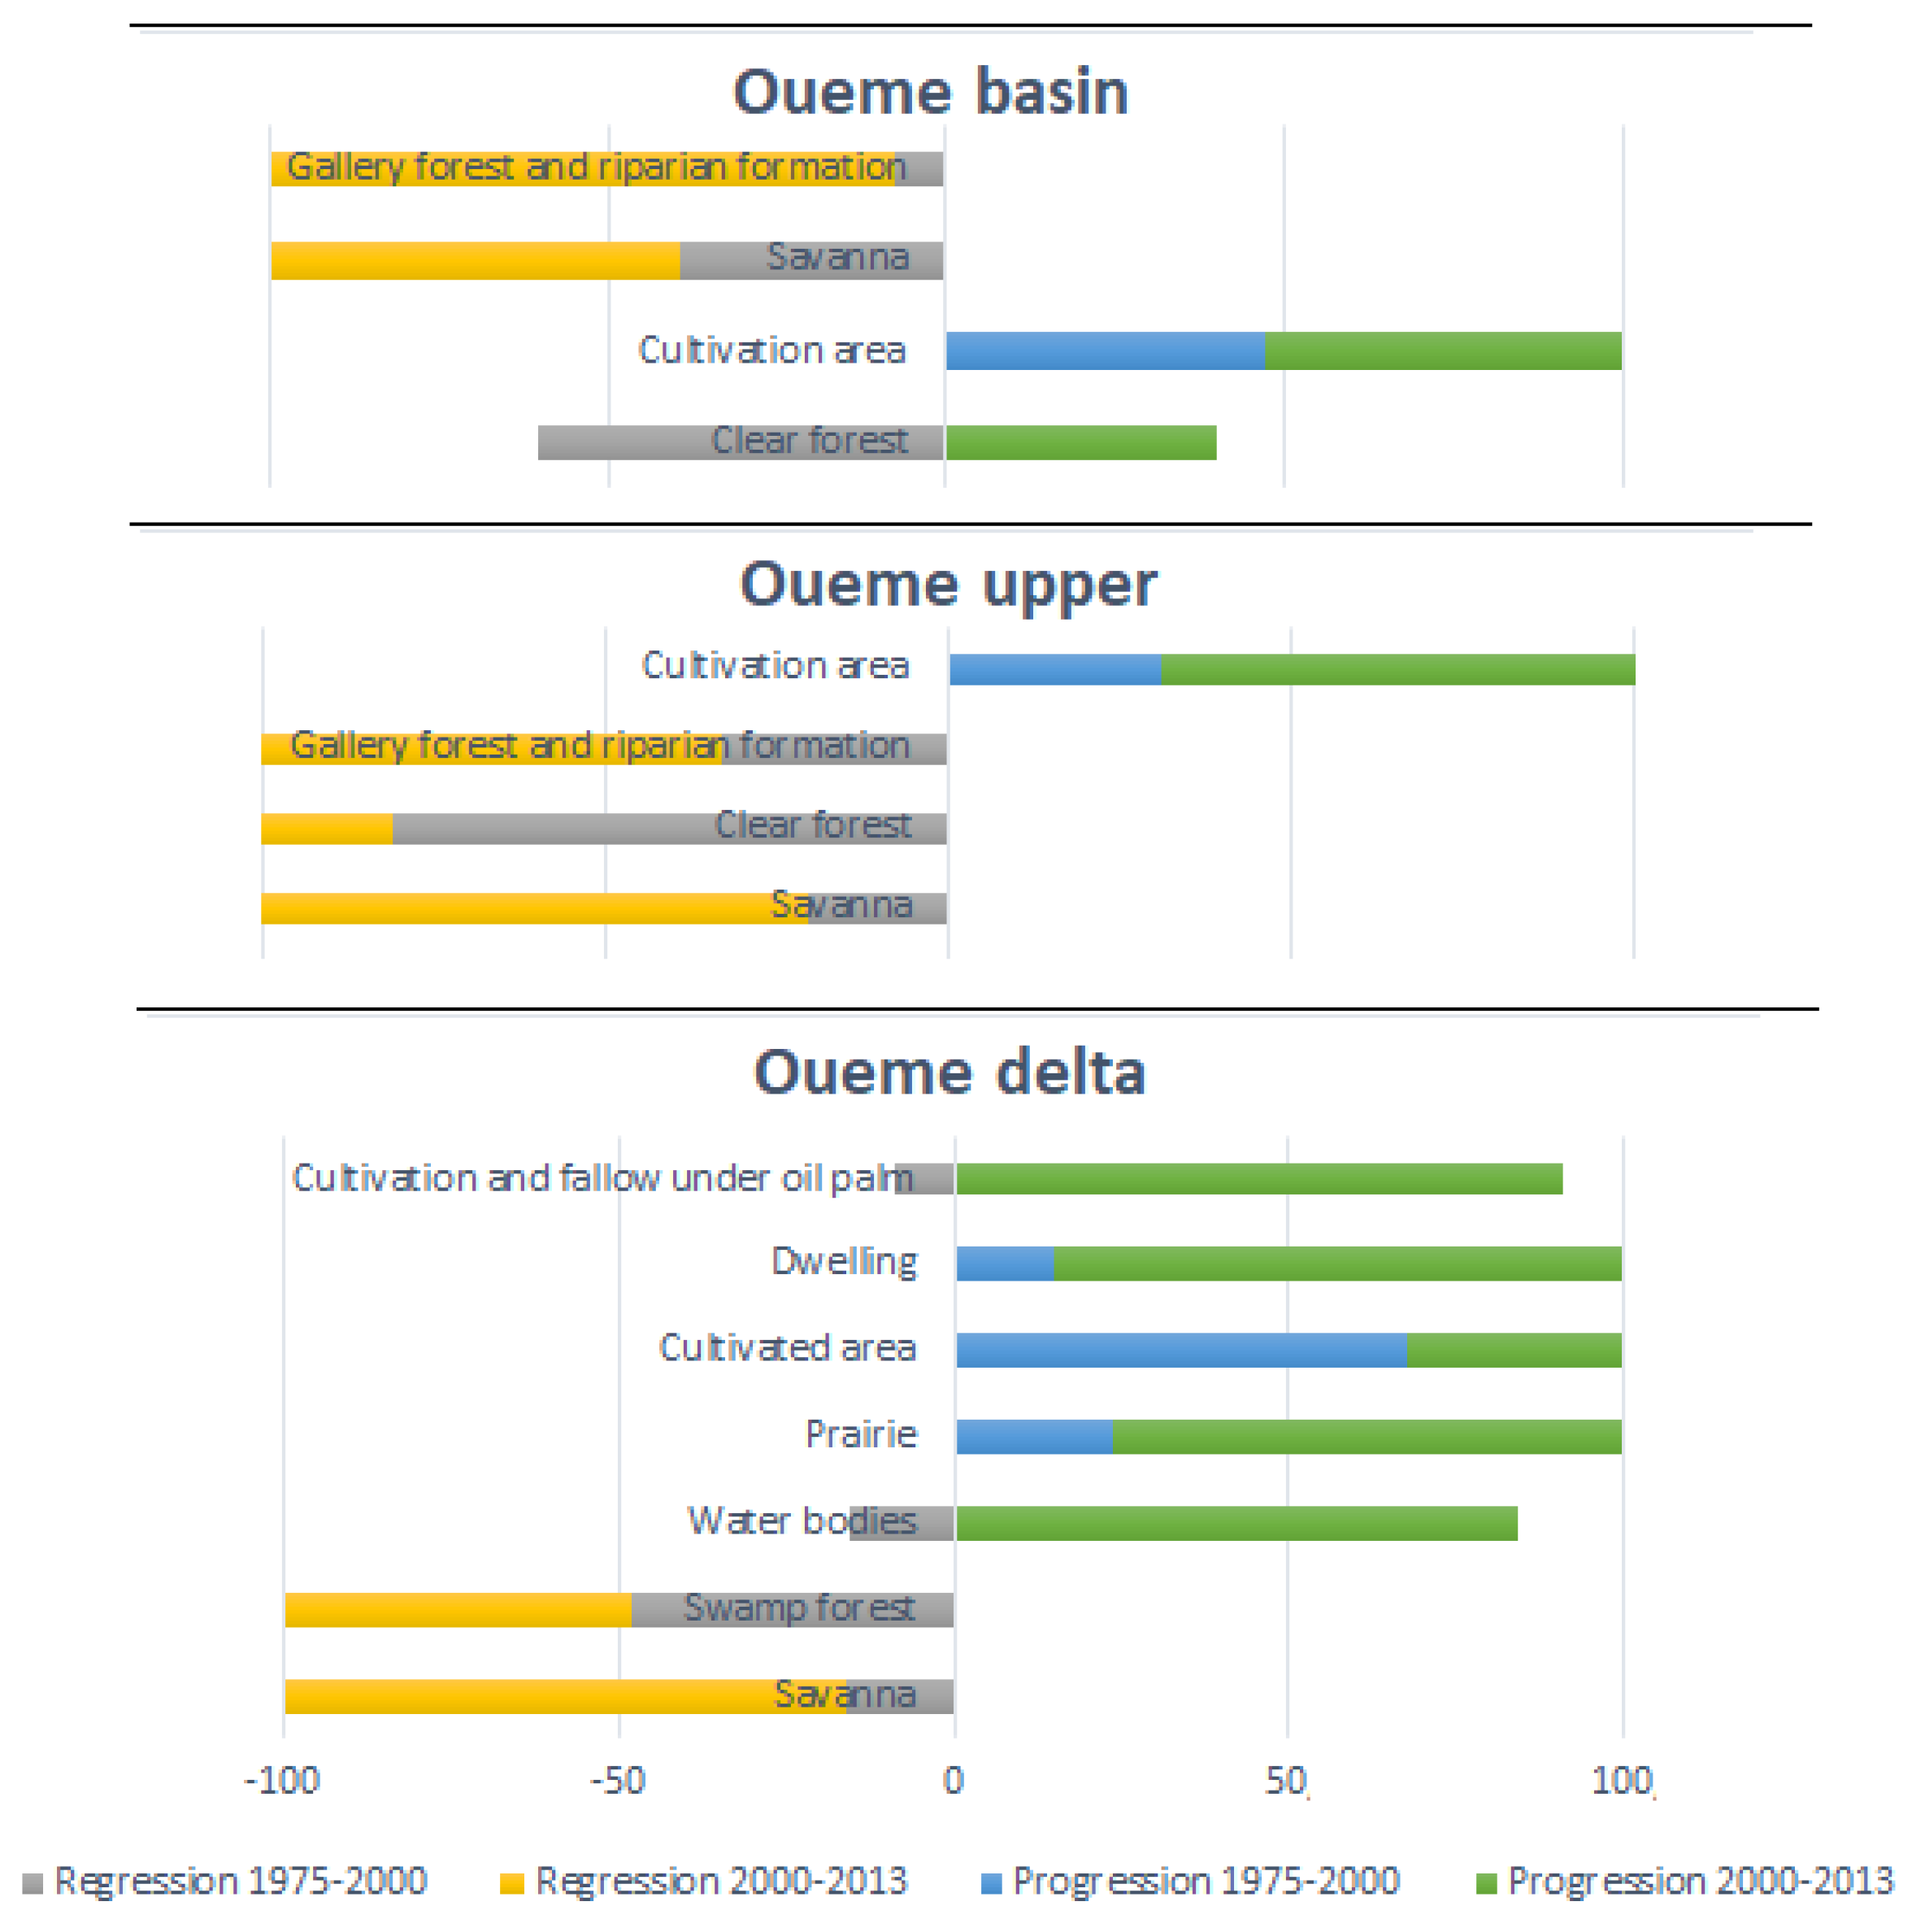
Our results (Figure 3) show that among these two common classes, savanna has experienced a continuous regression over time. This regression was very intense during the recent period (2000–2013). However, the cultivated areas have continuously progressed, although this was less pronounced in the recent period in Oueme delta (32.05% in the recent sub-period, against 67.95% in the previous sub-period). In contrast, cultivated areas in the upper Oueme have strongly regressed in recent years (69% between 2000 and 2013). The slight increase in the delta is likely related to the low transformation of wetlands for agricultural purposes. Residential areas have strongly increased in the Oueme delta, and this is likely due to the wealth it contains. The increase of water bodies in this area over the recent period could have been due to the recovery of rainfall.
Figure 3.
Evolution of important categories in the study environment.
3.3. Diachronic and Analytical Studies of Land Use
Table 3 shows that between 1975 and 2000, 76.48% of savanna (Class 2) remained stable. Of the 23.52% converted to other land use units, crop and fallow areas (Class 8) occupied 93.31%. For open forests (Class 25), there was a stability rate of 40.3% and a conversion rate of 59.7%. These findings are similar in the basin over the period 2000–2013 (Table A2). During this period, 78.36% of the savanna remained stable and 21.64% was converted to other land use units, with a representation of 91.47% for crop and fallow areas. In gallery forests and riparian formations, there was a stability rate of 87.7%, while the rate of conversion to other units was 12.3%, of which 25.30% was for cultivated areas. The open forests showed a stability rate of 56.25% and a 43.75% conversion rate, of which cultivated areas contributed 3.75%.
Table 3.
Transition matrix of the Oueme basin in Bonou between 1975 and 2000. The numerical values indicated in the table represent the surfaces in Km2.
The analysis of the upper Oueme (Table A4 and Table A5) shows a stability rate for the savanna of 82.97% between 1975 and 2000 and 79.06% between 2000 and 2013. Cultivated areas contributed 97.59% and 95.40% to the conversion rates of the two periods, respectively. On the other hand, gallery forests and riparian formations had a stability rate of 89.31% and 87.18% for the two periods, respectively, with a contribution of 14.29% and 23.33% of cultivated areas to their conversion rates.
The Oueme delta has a special status. During the first sub-period (Table 4), a slightly lower rate of stability was observed for the savanna (70.39%). While 20.75% of the conversion rate constituted cropping and fallow land under oil palm (class 27), 18.87% was used the cultivation areas. In swamp forests (class 28), we noted a stability rate of 38.27% and 61.73% conversion to other units, with 20% of that being converted to grasslands and 40% to cultivated areas. Meanwhile we noted stability rates of 68%, 80%, 100%, 100%, and 77%, respectively, for grasslands, cultivated areas, water bodies (Class 9), housing areas (Class 13), and crops and fallow land under oil palm. This trend was similar for the sub-period 2000–2013 (Table A3). Over this sub-period, 69.28% of the savanna remained stable, while 30.72% was converted to other land use units, of which 47.06% was grasslands, 29.41% was cultivated areas, 7.84% was residential areas, and 13.73% was crops and fallow under oil palm. In swamp forests, there was a stability rate of 23.53% and 76.47% conversion to other units, with a representation of 46.15% for grassland and 19.23% for cultivated areas.
Table 4.
Transition matrix of the Oueme Delta between 1975 and 2000. The numerical values indicated in the table represent the surfaces in Km2.
Overall, the stability rate was 56% in the Oueme delta compared to 74% in Oueme upper.
3.4. Predictive Evolution of the Different Land Use Units
3.4.1. Ability of the IDRIS Model to Predict Land Use
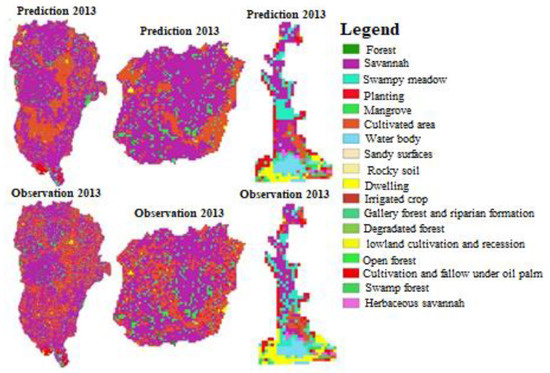
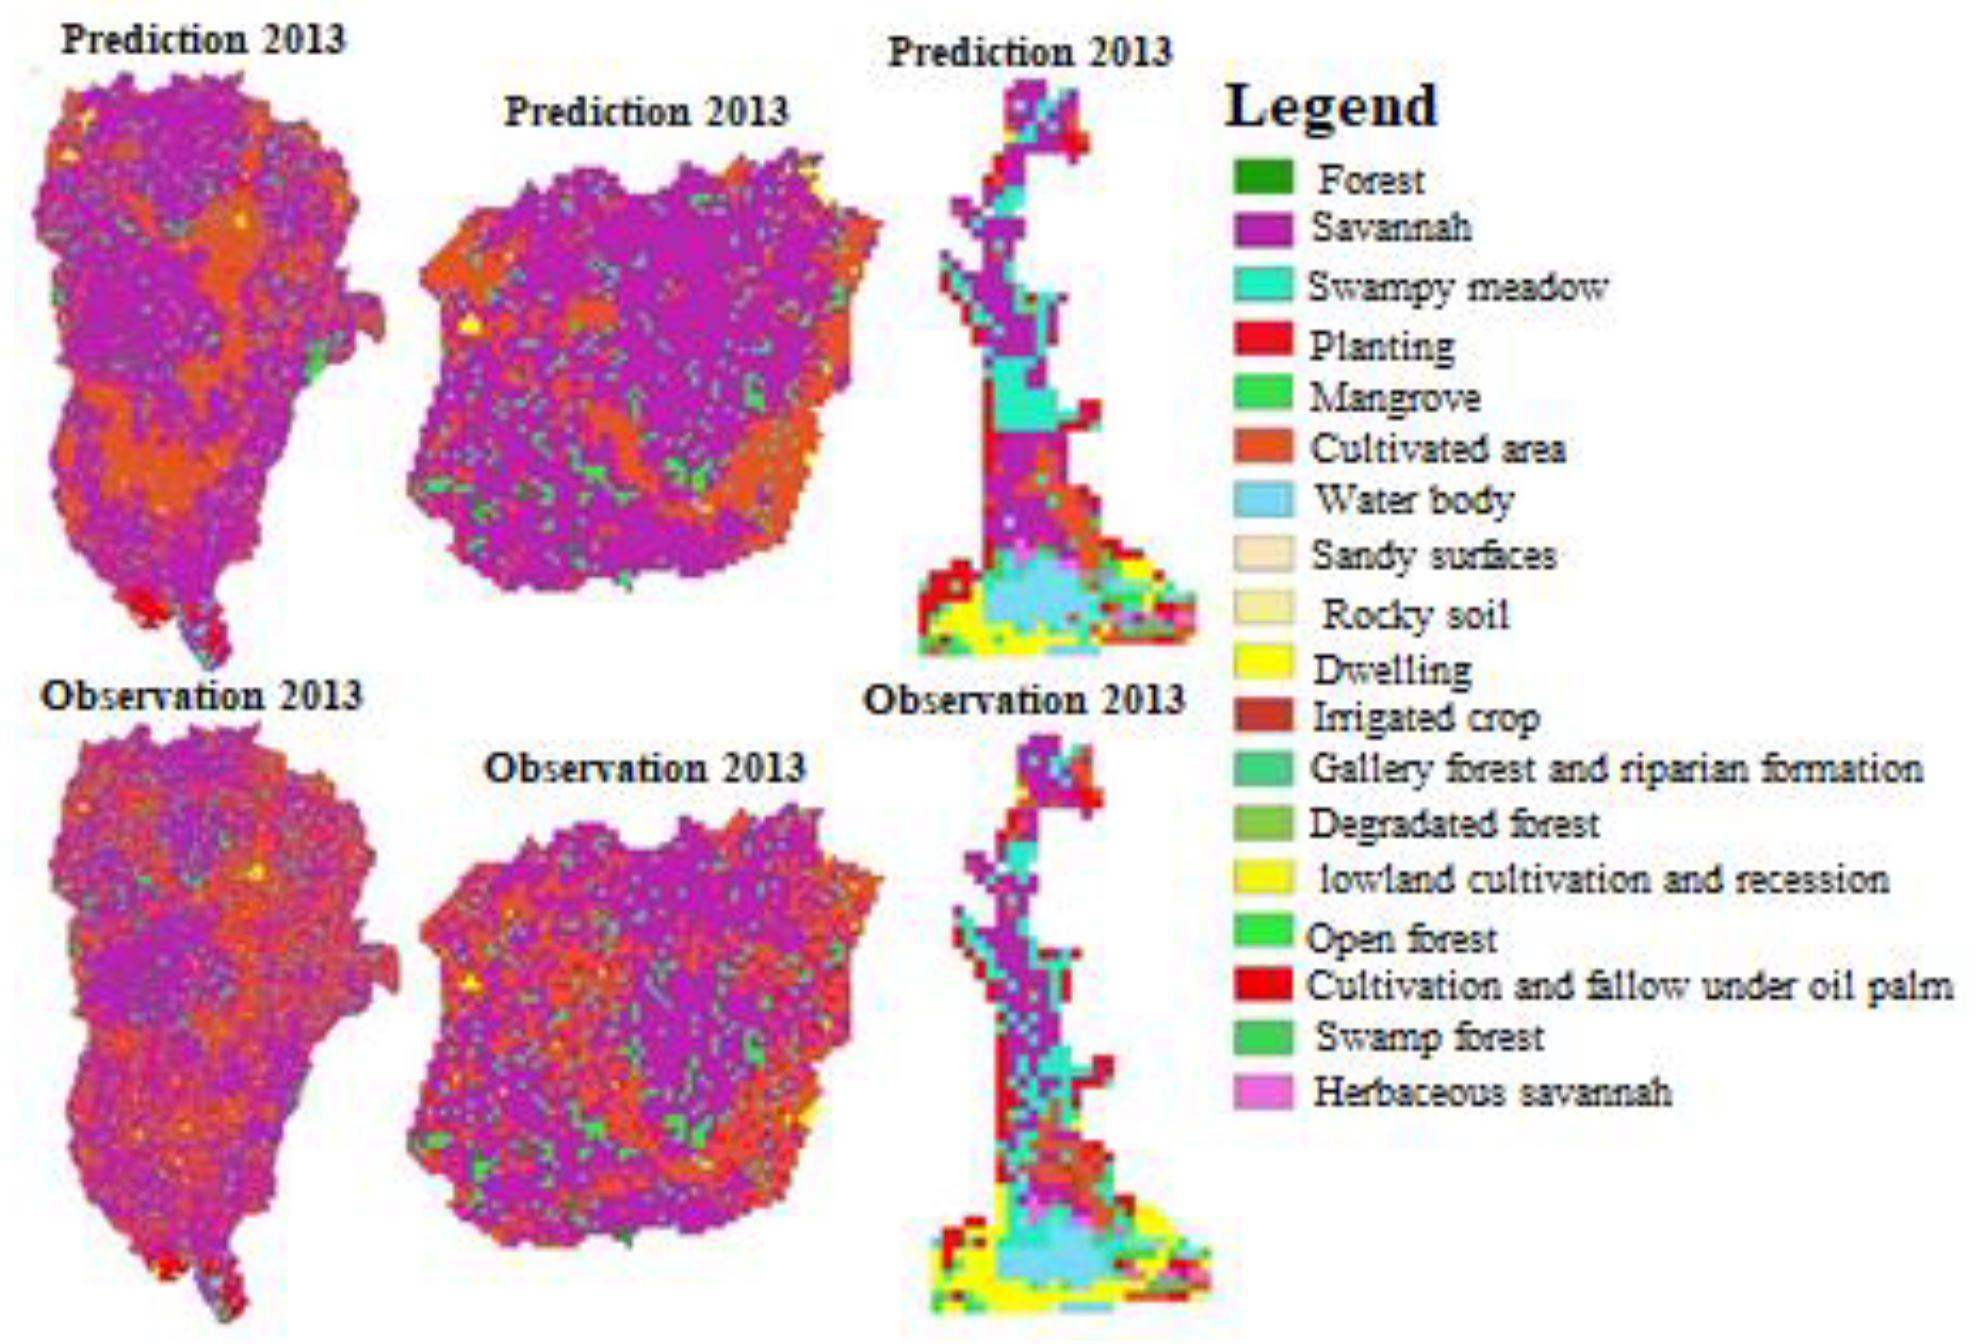
To test the validity of the IDRISI software, it was used to simulated the 2013 land use map and compared to observations (Figure 4). The correlation between the observed areas per class and those simulated was 99.3%, 99.6%, and 95.3% for the Oueme basin, the upper Oueme, and the Oueme delta, respectively.
Figure 4.
Spatial predictive capacity of land uses.
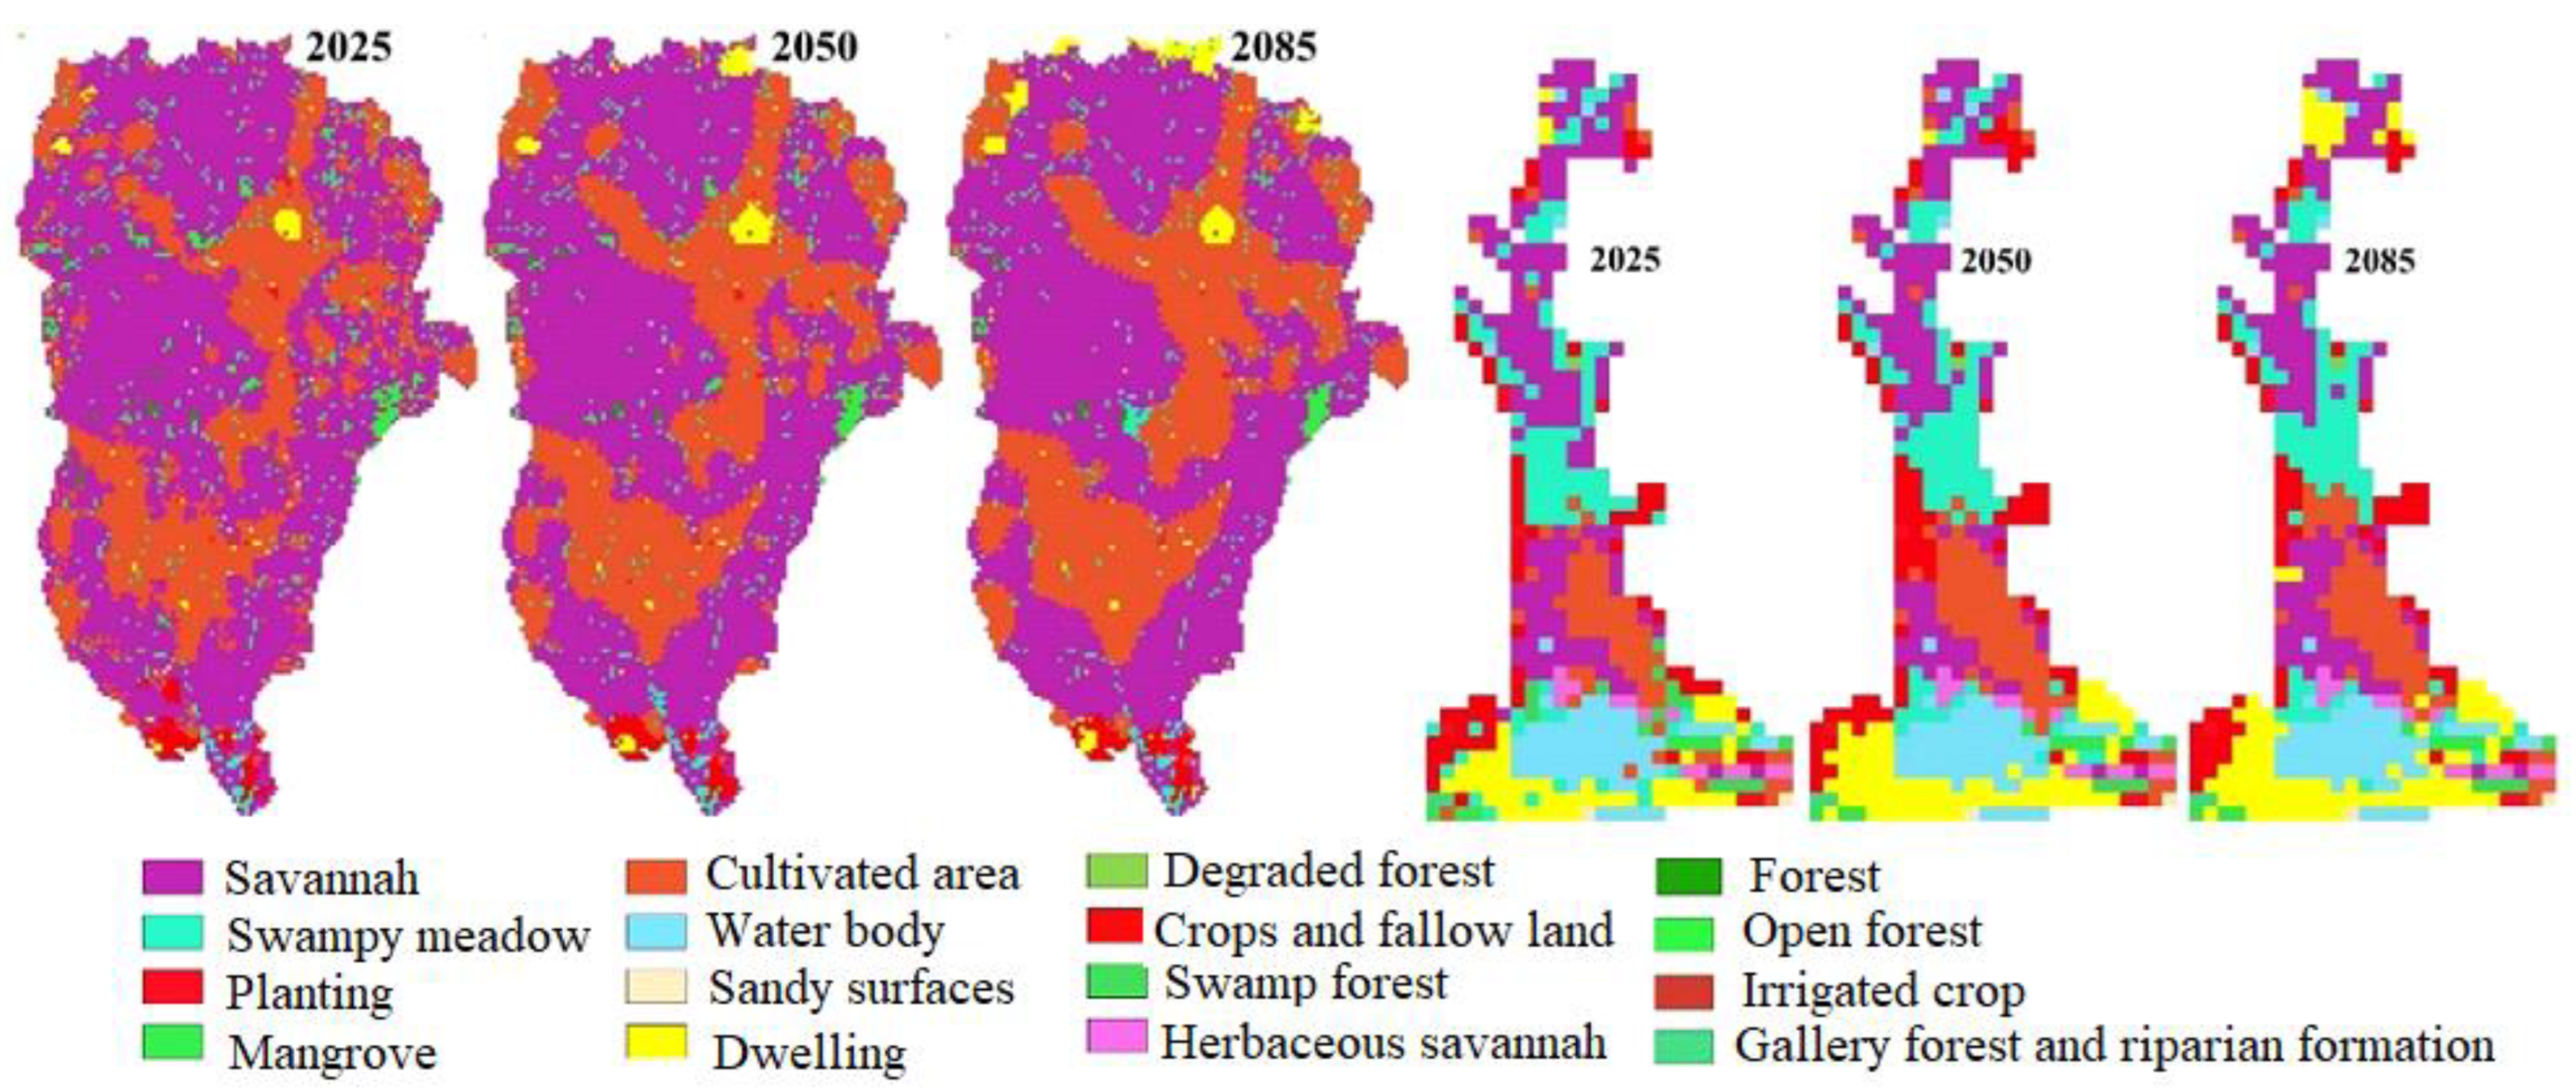
3.4.2. Future Surface Conditions in the Oueme Basin
Figure 5 presents the projected evolution of the different land use units in the Oueme basin, in the context of a return to the least aggravating evolution (1975–2000). Within the framework of the hypotheses of this study, it can be projected that the forest areas would almost disappear by 2085, with a considerable decrease by 2025 and 2050. The Oueme basin and its northern and southern parts will likely remain dominated by savanna. Residential areas will move into crop lands, with the latter projected to undergo significant development over the different time horizons (2025, 2050, and 2085). Furthermore, the Markov probability matrix (Table A6. In Appendix A) shows that the forest (class 1) will have very little chance of remaining over the different horizons: 57.46%, 33.02%, and 14.63% in the Oueme basin, 75% 56.25%, and 37.34% in the upper Oueme basin at the 2025, 2050, and 2085 horizons, respectively. The savanna (Class 2) has a 76.48%, 66.67%, and 61.24% chance of remaining in the Oueme basin, compared to 82.97%, 75.56%, and 71.30% in the upper Oueme. The probability is lower in the south, with a 68%, 48.38%, and 32.07% chance of remaining there over each of the three horizons. Cultivated areas (Class 8) and water bodies (Class 9) have very high chances of remaining stable over all the horizons considered. Residential areas (Class 13) on the other hand will not change to other land use types. They have a 100% chance of remaining stable over all horizons and all zones of the study area.
Figure 5.
Predictive land use evolution in 2025, 2050, and 2085.
4. Discussion
The results show that the Oueme basin in general, including the upper Oueme and Oueme delta, is dominated by savanna. This is consistent with the work of [7,12], who used the same land use maps to note that most of West Africa is dominated by savanna. Compared to the Oueme delta, the upper Oueme basin has a high vegetation cover. We also found that settlement areas have developed slightly faster in the Oueme Delta than the upper Oueme. This agrees with the findings of [17], which showed that southern Benin is undergoing complete human development. Indeed, the Oueme delta is a wetland whose water availability attracts a good number of farmers in a country where the rural population represents more than 50% of the total [18]. Scattered islands are sometimes exploited for agricultural purposes, and sometimes considered as living areas for producers who seek land to develop their activities (https://eros.usgs.gov/westafrica/agriculture-expansion, accessed on the 30 Decembre 2021).
The results also showed that the savanna regressed over the two periods (1975–2000 and 2000–2013). Similarly, forest areas also reduced over the entire study area. On the other hand, agricultural areas are increasing. These results agree with the works of [5,6,19] carried out in the northern, central, and southern parts of Benin, respectively. These studies noted the regression of forest/savanna areas and the progression of cultivated areas over the same study periods. We note that residential areas had an average annual progression of 2.77% in the entire Oueme basin over the period 2000–2013. This rate follows the same trend as the average annual growth rate of the population of Benin, which was estimated at 3.52% between 2002 and 2013 [20].
In the Oueme delta, a more significant change was observed. This is linked to the permanent availability of water resources in this area, a source of motivation for people seeking to leave the country. The disappearance of forest areas projected for the next few years is consistent with the studies of [21]. The aforementioned study revealed that dense forests and forest galleries in the Mekrou and Sota basins, two other basins in Benin, will completely disappear within thirteen years. The increase in water masses in the Oueme delta between 1975 and 2000, compared to its regression between 2000 and 2013, could be linked to the rainfall recovery of the late 1990s in southern Benin [22]. According to the latter, the 1970s were a dry period, while the 1990s were recognized as a wet period. This change in rainfall is likely a consequence of the increase in water bodies in this area. Furthermore, the high demand for water resources from the ever-increasing population, coupled with their motivation to produce in the dry season to maximize their income, could justify the introduction of irrigation in this locality (irrigated crop class introduced in 2000). This is what the study of [23] attempted to demonstrate; i.e., crop irrigation becomes essential in the dry season to compensate for the rainfall deficit. Our study also showed a high proportion of land being occupied by oil palm in the Oueme delta, a category that is almost non-existent in the upper Oueme basin. This result indicates that the climatic and hydrodynamic conditions of the soils in southern Benin are more favorable to this crop. Furthermore, the decline of this unit could be linked to the establishment of other more economically profitable crops.
Our results on the average annual evolution of land use types show that the Oueme basin is marked by the progression of crop/agricultural land and the regression of forest and savanna. It was also shown that this evolution was accentuated over the recent period (2000–2013). These results agree with those of [3], who revealed in the Oueme to Bétérou basin that there was a faster average annual progression in the recent period for crop and fallow areas (+82 km2/year and +364 km2/year); whereas savannah areas experience an average annual decrease (−32 km2/year and −63 km2/year) for the same sub-periods (1979–1998 and 1998–2010). However, this is contrary to the findings from a study by [24], conducted in the Ouénou-Bénou classified forest (northern Benin). This contradiction could be related to the relatively better protection of this area than the Oueme basin over the period 2000–2013. The small increase in cultivated areas in the delta between 2000 and 2013 compared to 1975–2000 could be due to the increase in water bodies. This result is consistent with the studies of [25], which identified 2010, 2012, and 2013 as flood years, when crops were submerged in the lower Oueme valley.
For both sub-periods, the Oueme basin showed a high stability rate of savanna, gallery forest, and riparian formations. This result is contrary to those obtained by [26], which showed that the Sudano-Guinean zone of Benin had 53.5% of forest and that less than 16% remained unchanged. The low rate of stability presented in this study is likely related to the lack of protection of forest areas in this zone. The lack of protection facilitates deforestation for charcoal and timber production. The work of [27], conducted with a 6 m resolution point data, showed a stability rate of 99.89% for swamp forests and savannas in southern Benin. [28] presented approximate values for savanna (86%) in the upper Oueme basin. This shows the good performance of the maps used in our study. We noted in the Oueme basin, and especially in the north, that more than 90% of the converted savanna area hosted crop and fallow land, whether in the first sub-period (1975–2000) or in the second sub-period (2000–2013). This result shows that the main source of conversion of forest/savanna areas was the increase in agricultural areas, in agreement with the studies of [19,29,30].
Analysis of the predictive evolution results suggests that cultivated areas may increase throughout the basin. However, forest areas are expected to decrease. These results agree with the work of [5], who modeled the land use dynamics in this area. Using a similar methodology as that of the present work, the authors predicted that by 2010 and 2020, fields and human settlements would increase, while forest areas would decrease. This work does not present results for 2020, but based on the 2000–2013 trends discussed above, it appears to confirm the predictive work of [5]. In addition, their analyses showed that the rate of stability of each of the land uses types would decrease over time, indicating an overall increase in cover variability. This result confirms the modeling studies of the spatio-temporal dynamics of land uses in the Lama territory (southern Benin) by [6], which showed that the slow changes observed today will increase, while the areas of stability decrease.
5. Conclusions
The present study makes a contribution to the understanding of the evolution of land use categories in the Oueme basin. It provides a solid basis for hydrologists who seek to present the consequences of the current evolution of the water cycle. At the same time, the study presents what can be expected if the variations in surface conditions evolve at the same rates until the end of the century. This allows exploring the consequences of development policies on the hydrological cycle and consequently on the water resources of this basin.
Our results show that the Oueme basin was, and remains, dominated by savanna. Overall, in the northern part of the basin (designated the Upper Oueme) as well as in the south (Oueme Delta), the areas of forest, savanna, gallery forest and riparian formation, and degraded forest decreased in the past. This decrease could also be observed in the future periods covered by this study (2025, 2050, and 2085). On the other hand, land use categories such as cultivated areas, crops, and fallow land under oil palm are expected to increase over time, as is the case for residential areas. Furthermore, the Oueme delta has undergone very strong transformations, especially in the recent period, compared to the upper Oueme basin. The current and projected maps are recommended to hydrologists, to determine disturbances to the future water cycle. It is important to make the results of our investigations available to decision makers, to facilitate effective development policies that will preserve natural resources for future generations. The impact of current changes in surface conditions on water resources must be assessed, in order to deepen the understanding of the consequences of anthropogenic actions on the Oueme basin.
Author Contributions
Conceptualization, R.B. and; Methodology, R.B.; Software, R.B.; Validation, R.B. and D.K.D.; Formal analysis, R.B.; Resources, R.B.; Data curation, R.B. and D.K.D.; Writing—original draft, R.B. and F.C.; Visualization, R.B. and F.C.; Supervision, R.B. All authors have read and agreed to the published version of the manuscript.
Funding
This research was initiated and funded by “Institut National de l’Eau (INE) de l’Université d’Abomey-Calavi (UAC-Bénin). Adresse: BP:526 Cotonou-Bénin. CEA 2023 budget.
Data Availability Statement
The land use data used in this study are freely available at: https://eros.usgs.gov/westafrica/land-cover/land-use-and-land-cover-trends-west-africa (accessed on 10 June 2020).
Conflicts of Interest
The authors declare no conflict of interest.
Appendix A
Table A1.
Evolution of land use units in the Oueme upper. The percentage that the area of each class represents in each year in yellow color.
Table A2.
Transition matrix of the Oueme basin between 2000 and 2013.
Table A3.
Transition matrix of the Oueme delta between 2000 and 2013.
Table A4.
Transition matrix of the Oueme upper between 1975 and 2000.
Table A5.
Transition matrix of the Oueme upper between 2000 and 2013.
Table A6.
Probability of stability of the different units in 2025, 2050 and 2085. The area of each class that remained unchanged is colored yellow and the years in blue.
References
- Orekan, V.; Tenté, B.; Houndagba, C.J.; Abdoulaye, D. nd. Year. Utilisation des Terres au Bénin. pp. 152–162. Available online: https://www.uni-frankfurt.de/47671063/Generic_47671063.pdf (accessed on 10 June 2020).
- FAO. Global Forest Resources Assessment 2020, Key Findings; FAO: Rome, Italy, 2020. [Google Scholar] [CrossRef] [Scilit]
- Akognongbe, A.; Abdoulaye, D.; Vissin, E.W.; Boko, M. Dynamique de l’occupation du sol dans le bassin versant de l’Oueme à l’exutoire de Bétérou (Bénin). Afr. Sci. 2014, 10, 228–242. [Google Scholar]
- Avakoudjo, J.; Mama, A.; Toko, I.; Kindomihou, V.; Sinsin, B. Dynamique de l’occupation du sol dans le Parc National du W et sa périphérie au nord-ouest du Bénin’. Int. J. Bio. Chem. Sci. 2014, 8, 2608–2625. [Google Scholar] [CrossRef] [Scilit]
- Oloukoi, J.; Mama, V.J.; Agbo, F.B. Modélisation de la dynamique de l’occupation des terres dans le département des Collines au Bénin. Contemp. Publ. Int. 2007, 6, 305–323. Available online: https://www.researchgate.net/publication/279851907 (accessed on 10 June 2020).
- Tchibozo, E.A.M. Modeling spatial-temporal dynamics of land use and analysis of changes in llama territory in Benin. Eur. Sci. J. 2020, 16, 500–524. [Google Scholar] [CrossRef] [Scilit]
- Cotillon, S.E. West Africa Land Use and Land cover Time Series; US Geological Survey Fact Sheet: Reston, VA, USA, 2017. [CrossRef] [Scilit]
- Djan’na, H.K.; Diekkrüger, B.; Näschen, K.; Adounkpe, J.; Atchonouglo, K. Impact of the Accuracy of Land Cover Data Sets on the Accuracy of Land Cover Change Scenarios in the Mono River Basin, Togo, West Africa. Int. J. Adv. Remote. Sens. GIS 2019, 8, 3073–3095. [Google Scholar] [CrossRef] [Scilit]
- Sintondji, L.O.; Zokpodo, B.; Ahouansou, D.M.; Vissin, W.; Agbossou, K.E. Modelling the water balance of Oueme catchment at the Savè outlet in Benin: Contribution to the sustainable water resource management. Int. J. AgriSci. 2014, 4, 74–88. [Google Scholar]
- Houngue, R. Impacts of Climate Change on the Hydrodynamic Functioning of the Oueme Delta (Benin). Ph.D. Thesis, The University of Abomey-Calavi, Abomey-Calavi, Benin, 2020. [Google Scholar]
- Bodjrènou, R.; Cohard, J.M.; Hector, B.; Lawin, E.A.; Chagnaud, G.; Danso, D.K.; M’po N'tcha, Y.; Badou, F.D.; Ahamidé, B. Climate Change from 1980 to present and performance of ERA5 and MERRA2 datasets for hydrological modelling purposes in Benin: Lessons learnt. In Proceedings of the First OZCAR TERENO International Conference, Strasbourg, France, 5–7 October 2021; p. 19. Available online: https://ozcartereno2020.sciencesconf.org/ (accessed on 10 June 2020).
- Tappan, G.G.; Cushing, W.M.; Cotillon, S.E.; Mathis, M.L.; Hutchinson, J.A.; Herrmann, S.M.; Dalsted, K.J. West Africa Land Use Land Cover Time Series; U.S. Geological Survey Data Release: Reston, VA, USA, 2016. [CrossRef] [Scilit]
- Sieza, Y.; Gomgnimbou, A.P.K.; Serme, I.; Belem, A. Etude de la variabilité climatique sur la dynamique d’occupation et d’utilisation des terres à des fins agro-pastorales dans la zone sud-soudanienne du Burkina Faso. Int. J. Biol. Chem. Sci. 2019, 13, 1980–1994. [Google Scholar] [CrossRef] [Scilit]
- Ladet, S. Spatialized Markov chains as simulation tools: Uses, advantages and limitations. Int. J. Geomat. 2005, 15, 159–173. [Google Scholar] [CrossRef] [Scilit]
- Brooks, S.P. Markov chain Monte Carlo method and its application. J. R. Stat. Soc. Ser. D (Stat.) 1998, 47, 69–100. [Google Scholar] [CrossRef] [Scilit]
- Tierney, L. Markov Chains for Exploring Posterior Distributions. Ann. Stat. 1994, 22, 1701–1728. Available online: http://www.jstor.org/stable/2242477 (accessed on 10 June 2020). [CrossRef] [Scilit]
- Gaye, K.J.G. Croissance Urbaine, Migrations Et Population Au Benin; CEPED: Paris, France, 1992. [Google Scholar]
- Mueller, V.; Thurlow, J. Youth and Jobs in Rural Africa; Oxford University Press: Oxford, UK, 2019. [Google Scholar] [CrossRef] [Scilit]
- Imorou, I.T.; Arouna, O.; Zakari, S.; Djaouga, W.; Djaouga, W.; Thomas, O.; Kinmadon, G. Assessment of deforestation and forest degradation in protected areas and village lands in the cotton basin of Benin. In Proceedings of the OSFACO Conference: Satellite Images for Sustainable Land Management in Africa, Cotonou, Benin, 13–15 March 2019; pp. 1–25. Available online: https://hal.science/hal-02189556/document (accessed on 10 June 2020).
- INSAE. Rgph4: What to Remember about the Population Numbers in 2013? National Institute of Statistics and Economic Analysis: Cotonou, Benin, 2015; p. 10. [Google Scholar]
- Vissin, E. Impact of Climate Variability and Surface State Dynamics on Runoff in the Benin River Niger Basin. 2007. Available online: https://tel.archives-ouvertes.fr/tel-00456097 (accessed on 10 May 2020).
- Amoussou, E.; Camberlin, P.; Mahé, G. Impact of climate variability and the Nangbéto dam on the hydrology of the Mono-Couffo system (West Africa) hydrologie du système Mono-Couffo (Afrique de l’Ouest). Hydrol. Sci. J. 2012, 57, 805–817. [Google Scholar] [CrossRef] [Scilit]
- Nonvide, G.M.A. Effect of irrigation adoption on rice yield in Malanville commune, Benin. Afr. Dev. Rev. 2017, 29, 109–120. [Google Scholar] [CrossRef] [Scilit]
- Biaou, S.; Biaou, S.; Houeto, F.; Gouwakinnou, G.; Biaou, S.S.H.; Awessou, B.; Tovihessi, S.; Tete, R. Dynamique spatio-temporelle de l’occupation du sol de la forêt classée de Ouénou-Bénou au Nord Bénin. In Proceedings of the OSFACO International Scientific Conference, Cotonou, Benin, 13–15 March 2019; pp. 13–32. [Google Scholar]
- Adjakpa, T.T. Gestion Des Risques Hydro-Pluviometriques Dans La Vallee Du Niger Au Benin: Cas Des Inondations Des Années 2010, 2012 et 2013 dans les Communes de Malanville et de Karimama. Ph.D. Thesis, Université d’Abomey-Calavi, Abomey-Calavi, Benin, 2014. [Google Scholar]
- Mama, A.; Bamba, I.; Sinsin, B.; Bogaert, J.; De Cannière, C. Deforestation, savanization and agricultural development of savanna-forest landscapes in the Sudano-Guinean zone of Benin. Bois For. Trop. 2014, 68, 65–75. [Google Scholar] [CrossRef] [Scilit]
- Orekan, V.; Plagbeto, H.; Edea, E.; Sossou, M. Current Evolution of Mangrove Ecosystems in the Benin Coast. In Proceedings of the OSFACO Conference: Satellite Images for Sustainable Land Management in Africa, Cotonou, Benin, 13–15 March 2019; Available online: https://hal.archives-ouvertes.fr/hal-02189536 (accessed on 10 June 2020).
- Leroux, L. Analyse diachronique de la dynamique paysagère sur le bassin supérieur de l’Ouémé (Bénin) à partir de l’imagerie Landsat et MODIS-Cas d’étude du communal de Djougou. Hydrosci. Montpellier, ANR ESCAPE. 2012, p. 62. Available online: https://www.scirp.org/(S(351jmbntvnsjt1aadkposzje))/reference/referencespapers.aspx?referenceid=1819990 (accessed on 10 June 2020).
- Zakari, S.; Tente, B.A.H.; Imorou, I.T.; Yabi, I.; Afouda, F.; N’Bessa, B. Hydropluviometric variability and dynamics of land cover in the catchment of Sota at the outle in Benin (West Africa). Int. J. Innov. Appl. Stud. 2015, 13, 235–250. [Google Scholar]
- Issiaka, N.T.; Arouna, O.; Imorou, I.T. Cartographie De La Dynamique Spatio-Temporelle Des Parcours Naturels Des Troupeaux Transhumants Dans Les Communes De Banikoara Et De Karimama Au Benin (Afrique De L’ouest). Eur. Sci. J. 2016, 12, 251. [Google Scholar] [CrossRef] [Scilit]

Disclaimer/Publisher’s Note: The statements, opinions and data contained in all publications are solely those of the individual author(s) and contributor(s) and not of MDPI and/or the editor(s). MDPI and/or the editor(s) disclaim responsibility for any injury to people or property resulting from any ideas, methods, instructions or products referred to in the content. |
© 2023 by the authors. Licensee MDPI, Basel, Switzerland. This article is an open access article distributed under the terms and conditions of the Creative Commons Attribution (CC BY) license (https://creativecommons.org/licenses/by/4.0/).