Abstract
Monitoring water quality is an essential tool for the control of pollutants and pathogens that can cause damage to the environment and human health. However, water quality analysis is usually performed in laboratory environments, often with the use of high-cost equipment and qualified professionals. With the progress of nanotechnology and the advance in engineering materials, several studies have shown, in recent years, the development of technologies aimed at monitoring water quality, with the ability to reduce the costs of analysis and accelerate the achievement of results for management and decision-making. In this work, a review was carried out on several low-cost developed technologies and applied in situ for water quality monitoring. Thus, new alternative technologies for the main physical (color, temperature, and turbidity), chemical (chlorine, fluorine, phosphorus, metals, nitrogen, dissolved oxygen, pH, and oxidation–reduction potential), and biological (total coliforms, Escherichia coli, algae, and cyanobacteria) water quality parameters were described. It was observed that there has been an increase in the number of publications related to the topic in recent years, mainly since 2012, with 641 studies being published in 2021. The main new technologies developed are based on optical or electrochemical sensors, however, due to the recent development of these technologies, more robust analyses and evaluations in real conditions are essential to guarantee the precision and repeatability of the methods, especially when it is desirable to compare the values with government regulatory standards.
1. Introduction
Water is an important natural resource for life on earth and for human activities and, therefore, it is necessary to have abundant clean water to quench thirst, irrigate fields, and sustain all forms of life in the environment [1]. Several sources contribute negatively to changing water quality, mainly caused by human action, such as population growth, industrialization, urbanization, agriculture, domestic sewage, and poor management [2,3]. To improve water quality, the 2030 Agenda for Sustainable Development established, as a goal for 2030, the availability and sustainable management of water and basic sanitation for all human beings, with the improvement of water quality, the reduction in pollution, and the elimination of dangerous pollutants [4].
Water quality monitoring allows the identification and quantification of polluting substances that can be compared to acceptable standards for each location, being a strategic management tool for decision-making and the improvement of water quality [5,6]. Tamm, Nõges, and Jävet [7], for example, monitored the load supply of dissolved organic carbon (DOC) to Lake Võrtsjärv (Estonia) between 1990 and 2002 by ground and surface flow—parameters affected by hydrological factors—highlighting the importance of assessing the parameter both currently and under changing climatic conditions. Unfortunately, there is still a large gap in water quality data, especially in remote locations and in developing countries [8], raising concerns about the sustainability of water resources and risks to human health. Furthermore, the main conventional techniques for monitoring water are often expensive, requiring qualified professionals and complex equipment, and which, in many circumstances, do not allow direct analysis in the field with immediate results.
However, several studies have tried to fill the gap and overcome the lack of data provision, such as the incorporation of citizen science [9,10], for example, or the development of low-cost and in situ technologies, as will be described throughout this work. The development of low-cost, accessible, and easy-to-handle devices and sensors for water quality analysis can be a viable alternative for obtaining data, improving water quality, and, consequently, the security of the water [11,12]. Furthermore, in situ measurement contributes to cost minimization, as it eliminates the need for sampling, sample preservation, transport, and laboratory water analysis [13].
The combination of technologies and water quality sensors with components of microsystems, associated with a software architecture and cloud computing (online), allows the development of a system in the conception of Smart Water Quality Monitoring Systems (SWQMS), from the point of view of the Internet of Things (IoT) [14,15,16]. In addition, integration with the Big Data system can improve the modeling of the water system, reducing model uncertainties and ensuring more information in the management of risk analysis [17,18]. Pehme et al. [19], for example, highlighted the necessity of an advanced understanding of landfill hydrological regime, by modeling tools and evaluating the risks to environmental and human health related to landfill geomorphology and hydrological balance.
According to Webb et al. [11] and Hoolohan et al. [20], digital technologies are seen as resilient, innovative, and efficient devices that can enhance the relationship between water and society, being a progression toward solving challenges in water systems and helping to mitigate social and environmental problems. An approach to water quality improvement, for example, is also the association of Real-Time Control systems (RTC) and Nature-Based Solutions (NBS) in urban drainage infrastructures, as described by Brasil et al. [21].
Thus, this work aims at a literary review that brings together technologies and portable sensors aimed at monitoring the quality of water in situ (regarding physical, chemical, and biological water quality parameters), at low cost, which allows a prescreening of the condition of the water as a monitoring tool for decision-making and good water management.
2. Water Monitoring Parameters
Although there are several parameters for monitoring water quality, only a few are used as key parameters in the monitoring, which can vary according to the location or the purpose of water use [22]. Regarding water use, according to Boyd [22] and Alley [23], when intended for human consumption, such as drinking, for example, the water must not have high concentrations of minerals, taste, or odor, and must be free of toxins or pathogenic organisms; for recreation, despite being unsuitable for consumption, the water must not present risks of contagion or diseases through direct contact; for the environment, the water must not contain pollutants that cause adverse effects on flora and fauna. Alam et al. [24], Rahman and Bakri [25], Mohamed et al. [26], and Rahmanian et al. [27], for example, present water quality monitoring studies whose monitoring parameters were established according to the needs of each location.
For monitoring water quality, Boyd [22], Alley [23], the World Health Organization [28], Spellman [29], Cotruvo [30], and Omer [31] present a variety of physical, chemical, and biological parameters for drinking water, superficial water (fresh and saltwater) and groundwater, the sources of pollutants, types of speciation, and the main analysis techniques. In this work, the following were considered as physical parameters: (i) color, (ii) temperature, and (iii) turbidity; and as chemicals: (iv) chlorine, (v) fluorine, (vi) phosphorus, (vii) metals, (viii) nitrogen, (ix) dissolved oxygen, (x) pH, and (xi) redox potential or ORP (Oxidation–Reduction Potential).
In biological monitoring, although it is possible to identify numerous pathogenic species in water, the methods of isolation and the enumeration of such microorganisms make this a complex and time-consuming task, making it impractical to monitor all microorganisms that may be present in water [32]. To solve this problem, the monitoring of biological contamination is conventionally carried out by the analysis of key microorganisms present in human and warm-blooded animal feces, (xii) total coliforms and Escherichia coli being the most-used parameters to assess the microbiological safety of drinking and surface water supplies [33,34].
The monitoring of (xiii) algae and cyanobacteria is also important, since in many aquatic ecosystems, including drinking water supplies, there is a proliferation of these microorganisms called Harmful Algal Blooms (HAB) [35]. As emerging contaminants, the occurrence of HAB depends on several environmental conditions, such as the presence of nutrients and water temperature, and it is responsible for producing a variety of toxins released into water, which are dangerous for public health [36,37,38].
Many of the parameters mentioned above make up the Water Quality Index (WQI), such as dissolved oxygen, total coliforms, pH, temperature, nitrogen, phosphorus, and turbidity [39]. The WQI appeared in 1960 (Horton Index), being a simple and concise tool that allows the expression of the quality of water bodies and their derivations, such as for recreation, irrigation, and public supply, for example [40,41]. Nowadays, there are different numbers of models developed by different international organizations and used for WQI calculation, such as the National Sanitation Foundation Water Quality Index (NSFWQI) and the Weighted Arithmetic Water Quality Index (WAWQI), for example [42].
3. Development of Technologies for Water Quality Monitoring
The main technologies under development are based on colorimetric techniques or electrochemical sensors to analyze drinking water, rivers, lakes, and salt water [16,43,44]. However, as will be presented later, there are also technologies and methodologies capable of simplifying and improving existing water monitoring techniques, reducing costs, integrating them with the IoT, and accelerating data acquisition, such as the use of automatic samplers and autonomous analyzers.
According to Alberti et al. [43], with the progress of nanotechnology and materials science, various sensors and biosensors based on nanomaterials, such as nanoparticles (NPs), quantum dots (QDs), carbon nanotubes and nanofibers (CNTs/CNFs), nanowires, and graphene, for example, were developed for monitoring the environment. Figure 1 shows the evolution of the number of publications per year in research related to the topic, considering the terms water quality, low-cost, in situ, real-time, online, and portable. It is possible to identify a significant growth in this topic since 2012, with about 641 works published in 2021.
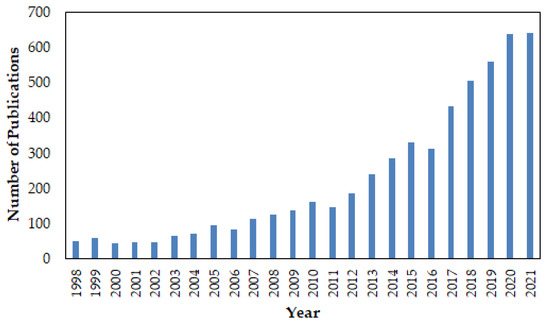
Figure 1.
Evolution of the number of studies published per year related to the topic.
3.1. Technologies for Physical Monitoring of Water Quality
3.1.1. Color
The color of water refers to the reflection of light in tiny particles of organic or mineral origin, being an old indicator of water quality, even before technological development and the emergence of environmental sensors. However, when technology became part of our society’s configuration, there was research directed toward water color measurements, such as Edwards [45], for example, who developed a sensor to measure the color and turbidity of natural waters using a four-beam intensity compensation technique for robust measurement. This prototype was operated in a water treatment plant, and at the time, it was considered very visionary research. The development of new technologies for color measurement will be described below, as well as presented in Table 1.
With the evolution of optical physics, studies such as Murphy et al. [46] reported a low-cost optical sensor for water monitoring, in which the sensor is based on a multi-wavelength light source with two photodiode detectors capable of measuring the transmission and lateral scattering of light at the detector head, estimating the parameters of color and turbidity. The tests were carried out in the laboratory, but the researchers’ intention is to test the sensor in the future as a real-time water pollution monitoring system.
Given the importance of understanding the variation of color with other water quality parameters, Yang [47] developed a multisensory system for measuring water quality parameters (temperature, dissolved oxygen content, pH value, ammonia nitrogen, and color) for fish farming through algorithmically optimized sensors, in which the measurement of color parameters in the water is sent in real-time via the ZigBee communication standard [48]. Further, Saravanan et al. [49] also described a real-time IoT-based water quality monitoring system, which includes color as one of the parameters to be monitored in situ. In India, the real-time monitoring of water quality was integrated through an innovative alternative, as reported by George et al. [50], who described the initiative as a network of citizen scientists to monitor the color of water through Mini Secchi Disks, with Forel–Ule color scale stickers. This technique utilized a mobile app called “TurbAqua” to facilitate near real-time data transmission.

Table 1.
Summary of studies that present new alternative technologies for monitoring the color parameter in water.
Table 1.
Summary of studies that present new alternative technologies for monitoring the color parameter in water.
| Author(s) | Type | Description | Research Findings |
|---|---|---|---|
| Murphy et al. [46] | Optical | Developed a low-cost Optical Colorimetric Sensor (OCS), equipped with telecommunication to assess the transmission of light in water. | The results show strong linear correlations between the signal response and the studied parameters. |
| Yang [47] | Introduced a multi-sensory system to monitor water quality parameters in fish ponds, with Zigbee wireless interface communication. | The system was able to collect water quality parameters and transmit them to the central station host computer, being a tool for fishing pond production management. | |
| Saravanan et al. [49] | Proposed a low-cost system, called Supervisory Control and Data Acquisition (SCADA), to monitor various water quality parameters with remote communication (using a GSM module). | The device was able to measure the selected parameters in drinking water (including color) in real-time and with good accuracy. | |
| George et al. [50] | Developed Mini Secchi Disks, with Forel–Ule color scale stickers used to measure water color and clarity, and a mobile app, called TurbAqua, was developed to facilitate near real-time data transmission. | The study presents a low-cost method for monitoring water quality on a voluntary basis, where the data can be used to validate satellite water quality products and be a tool for decision-makers to improve water issues. |
3.1.2. Temperature
As with pH sensors, temperature sensors are present in most multi-parametric sensors. This is due, on the one hand, to the importance of temperature in relation to water quality; since several processes of other parameters occur as a function of temperature (e.g., biological activity, pH, dissolved oxygen, and conductivity), and, on the other hand, its easy monitoring, since there is a close linear relationship between temperature and resistivity, or electromotive force [51,52,53].
The measurement of water temperature can be performed by different methods, such as the thermal expansion of a material, thermoelectric processes, electrical resistance, semiconductors, optical fiber, and capacitance [54]. However, the most common low-cost temperature measurement process is the use of thermoelectric devices and/or resistive sensors. These techniques are mainly used for their accuracy, low cost for the operating temperature range required for water monitoring, robustness, and simplicity [55]. As most sensors and technologies presented in this review show the temperature measurement combined with some technique, only a few articles reported in the literature will be described in order to present the different techniques applied in the delimitation of this article (real-time, in situ, and low cost), as described in Table 2 also.
The most-used method for measuring temperature is the resistive method. This is not only due to the ease of development of the sensors but also because thermoelectric sensors (specifically, thermocouples) often use resistive sensors to determine the standard temperature required for this technique [54]. Alam, Clyne, and Deen [56] used sensors based on the Wheatstone bridge configuration to obtain a high sensitivity temperature measurement with low variability between 0 and 50 °C. Two of the four bridge terminals were produced with P-type Silicon Wafers, with a high Temperature Coefficient Resistance (TCR)—the calculation of a relative change of resistance per degree of temperature change—and the other two were produced with polystyrene sulfonate (PEDOT:PSS), with negative TCR values. Alam et al. [57] developed a sensor using the same principles (Wheatstone bridges); however, it used two separate layers of a glass substrate using a bulk silicon wafer, poly(3,4-ethylenedioxythiophene), and PEDOT:PSS. The authors also integrated the sensor into an Arduino platform with an Android systems interface application.
Still related to resistive sensors, Wu et al. [55] developed a sensor for temperature measurement using a platinum (Pt) layer, since this material is a good conductor and has good characteristics for temperature measurement. Finally, another option for resistive temperature sensor measurement was presented by Simic et al. [58], using a low-cost and commercially available sensor (LM35). They performed a calibration of the device in the laboratory and obtained an accuracy of ±0.25 °C. Srivastava, Vaddadi, and Sadistap [59], aiming at a quick response of the temperature sensor and a low cost, used a K-type thermocouple. A K-type thermocouple is a thermocouple (a device that converts thermal energy into electrical energy) that uses a non-magnetic positive terminal (usually Chromel) and a magnetic negative terminal (usually Alumel) and performs the measurement based on the output voltage.
Finally, Huang [60] and Huang et al. [61] used optical fiber to measure the temperature. Despite being a method with a high cost, this technique is usually applied to temperature when the optical fiber is also used to measure other parameters. As the parameters monitored by the authors have high temperature sensitivity, two insulated fiber optic terminals were used. Thus, through the variation of the different central wavelengths, it was possible to find a linear relationship with the temperature, therefore calibrating the device.
Table 2.
Summary of studies that present new alternative technologies for monitoring the temperature parameter in water.
Table 2.
Summary of studies that present new alternative technologies for monitoring the temperature parameter in water.
| Author(s) | Type | Description | Research Findings |
|---|---|---|---|
| Alam, Clyne and Deen [56] | Electrical | Developed a temperature sensor fabricated with p-type Si and poly(3,4-ethylenedioxythiophene) polystyrene sulfonate (PEDOT:PSS) film in a Wheatstone bridge configuration. | The results show that the sensor was able to measure temperature between 0 and 50 °C with high sensitivity and low variability. |
| Alam et al. [57] | Presented a sensor-based using poly(3,4-ethylenedioxythiophene) and PEDOT:PSS to measure temperature in water. | The experiments present an accuracy above 85% for temperature sensor measurement. | |
| Wu et al. [55] | Developed a platinum (Pt)-based sensor for temperature measurement integrated into a micro-electro-mechanical system (MEMS). | The Pt thermistor with a three-wire orthogonal structure has a temperature response of 5.95 Ω/°C. | |
| Simic et al. [58] | Used a commercial sensor (LM35) to measure temperature in water. | The results show an accuracy of ±0.25 °C. | |
| Srivastava, Vaddadi and Sadistap [59] | Presented a K-type thermocouple sensor as a low-cost way to measure temperature integrated with a smartphone. | The system presents itself as a low-cost tool for monitoring water quality parameters in several urban locations. | |
| Huang [60] | Optical | A temperature sensor was developed using long-period fiber grating (LPFG). | The sensor can effectively monitor the temperature with a maximum difference of ±1 mm for water level, ±0.005 for refractive index, and 1 °C for temperature. |
| Huang et al. [61] |
3.1.3. Turbidity
The turbidity of water is a parameter that indicates the degree of interference that a light beam encounters when crossing it, mainly because of the presence of suspended solids such as inorganic particles and organic debris, which can give a murky appearance to that water [62]. Because of this, turbidity is a fundamental parameter to assess water quality, being able to identify whether the water is fit for consumption and, consequently, prevent waterborne diseases [63].
Given the importance of turbidity, there are several turbidity sensors, commercially available, that can be integrated into water quality monitoring systems, as used and described in much research, to develop IoT-based online monitoring combined with other water quality parameters. Some examples of these studies are presented by Geetha and Gouthami [16], Lambrou et al. [64], Samijayani et al. [65], and Chowdury et al. [66]. In addition, the following works present the development of new technologies applied to the monitoring of water turbidity, as shown in Table 3 also.
With the intention of optimizing, and reducing the costs associated with detecting turbidity, some recent research, such as Azman et al. [63], has developed low-cost technology based on a nephelometric turbidity sensor for the continuous monitoring of water quality. According to the authors, the electronic sensor’s operation is based on the intensity of scattered light in relation to light scattering in solids and liquids, using LED (Light Emitting Diode) as a transmitter, LDR (Light Dependent Resistor) as a receiver, and an RS232 module for communication between sensor and computer. Arifin et al. [67] researched the development of a sensor for water turbidity measurement using an infrared LED, a polymer optical fiber, and a photodetector as main materials, in which the experiments showed promising sensitivity results with 0.046 µW/NTU and 0.022 NTU resolution.
Wang et al. [68] also worked on a low-cost turbidity sensor and online water quality monitoring project, using an 850 nm infrared LED, dual orthogonal photodetectors, and, for communication, a custom IoT platform. The research showed that the device was able to measure the turbidity parameter with accuracy and robustness comparable to commercial sensors. Rahman et al. [69] also evaluated the performance of an LED-based sensor for water turbidity measurement, observing the response to different colors of light sources used for water turbidity measurement and determining the best photodetector according to the voltage variation during the ON/OFF condition. The authors showed that the white LED gives the best performance with less than 10% systematic error in most measurements and followed by the UV LED, but both lights were suitable for water turbidity measurements ranging from 0 to 1000 NTU. Finally, Schima et al. [70] developed an open-source optical sensor system for real-time and in situ turbidity monitoring, using detectors in the infrared range of the electromagnetic spectrum, which presented high accuracy when compared to standards methods in the laboratory. In addition, a Python script used on the Raspberry Pi was responsible for communication with the sensor, with which it was possible to show, even in the laboratory phase, that open-source technology can be a key to resilient and promising systems.
Table 3.
Summary of studies that present new alternative technologies for monitoring the turbidity parameter in water.
Table 3.
Summary of studies that present new alternative technologies for monitoring the turbidity parameter in water.
| Author(s) | Type | Description | Research Findings |
|---|---|---|---|
| Azman et al. [63] | Optical | Presented a low-cost nephelometric turbidity sensor for the continuous monitoring of water quality and communication using the RS232 module. | The results show that the developed low-cost sensor presented results as a commercial turbidity sensor. |
| Arifin et al. [67] | Developed a polymer optical fiber sensor for measuring turbidity in water. | The experiments provided promising results, with 0.046 µW/NTU and 0.022 NTU resolution for the sensor. | |
| Wang et al. [68] | Presented a low-cost and online monitoring sensor for turbidity using an infrared LED and photodetectors. | The device was able to measure turbidity with high accuracy as a commercial device. | |
| Rahman et al. [69] | Evaluated the performance of an LED-based sensor for measuring turbidity in water. | The use of visible and UV LED was able to measure turbidity between 0 and 1000 NTU. | |
| Schima et al. [70] | Developed an open-source optical system for real-time and turbidity monitoring using detectors in the infrared range of the electromagnetic spectrum. | The developed in situ sensor system showed a very high agreement with the results obtained using a laboratory photometer but with less methodological effort. |
3.2. Technologies for Chemical Monitoring of Water Quality
3.2.1. Chlorine
Chlorine is one of the main disinfectants in public water supplies since its oxidizing characteristic can eliminate pathogenic microorganisms present in the water [71]. Therefore, detecting the concentration of free chlorine in the water is essential for monitoring and detecting the presence of contaminants. The consolidation of free chlorine sensors in water has taken place gradually, so that, even after many years have passed since the first attempts, many sensors are still under development and improvement. The development of new technologies for chlorine measurement will be described below, as well as presented in Table 4.
Table 4.
Summary of studies that present new alternative technologies for monitoring the chlorine parameter in water.
Cassidy et al. [72], for example, studied a low-cost spectrophotometric sensor for chlorine detection with real-time data collection capability, aimed at increasing the acquisition time and improving the mechanical stability of chlorine sensors. The main components of this optical system were a xenon light source and a flow sample chamber. For communication, a DSP (Digital Signal Processor, EVM56303, produced by Motorola, Austin, TX, USA) board was used, which provides control signals and interacts with external devices. Overall, the device performed positively in the laboratory, but improvements are still pending for field applications and real-world scenarios.
Hall et al. [73] focused on the detection of parameters online to indicate contamination in the distribution system, using commercial sensors, including free chlorine sensors. Altogether, three sensors with different chlorine detection principles (colorimetric, polarographic, and voltammetric) were tested with costs ranging from US$3000 to US$10,000. The free chlorine was the best parameter, among the analyzed parameters, which responded to the presence of contaminants, but the authors point out that the technologies used were still in the consolidation phase and needed future improvements.
The quest to improve and reduce the costs of chlorine measurement was also presented by Gimenez-Gomez et al. [74], who proposed a compact portable device to simultaneously measure five water quality parameters, including amperometric parameters, using microelectronic technology with low power consumption. The electronic system was tested, and the analytical signals were compared with commercial equipment. In addition, the authors claim that the communication between the computer and the portable device can be carried out using a wireless protocol, such as a Wi-Fi or a low-power ZigBee interface.
To facilitate and modernize the detection of contaminants, Cui et al. [75] designed a Water Quality Monitoring System based on the STM32F103 microcontroller integrated system and the nRF24L01 wireless communication module. Various types of sensors were used to detect harmful components in the water, including the commercial residual chlorine sensor CLE3-DMT to detect free chlorine and monochloramine. The system’s proposal was to allow users to use their smartphones to carry out the real-time and online monitoring of various parameters in water quality. As the system has been successful in experiments, the authors believe that the device can be widely used with further research.
With the objective of facilitating portability, Yen et al. [76] also broke new ground in chlorine monitoring and presented a chemo-resistive sensor based on a nanohybrid paper that can be used with smartphones to detect free chlorine ions. The sensor was manufactured using a simple, standardized coating process on graphene paper and PEDOT:PSS, whose results presented a linear range of 0.1–500 ppm for free chlorine measurement, with a detection limit of 0.18 ppm. The sensor was integrated into an electrical reading system, using Arduino Uno Rev3 SM (Arduino, Genoa, Italy), designed for miniaturization and wireless transmission to a smartphone by a Bluetooth module. The authors emphasize that the system is advantageous for its portability, low cost, and allowing real-time readings on a smartphone.
Furthermore, the innovation of chlorine sensors is ongoing, as shown by Alam et al. [77], who developed a reusable, reagent-free sensor based on a thin gold film. The sensor presented high sensitivity, which is often a challenge for other commercial sensors, and due to simple fabrication and good detection performance, the proposed device enables mass production and future application in distant regions with low investment.
3.2.2. Dissolved Oxygen (OD)
Dissolved oxygen (DO) is an important parameter in water quality and essential for aquatic life. According to Hou et al. [78], when the DO concentration is less than 3 mg/L, there is an impact on the health of the fish, which can even lead to death by asphyxia. Furthermore, according to Hsu et al. [79], a low concentration of DO can negatively affect a water system by facilitating the excessive growth of anaerobic bacteria. The DO concentration can also indicate various contaminants in water bodies, making DO one of the most important parameters for monitoring.
There are two types of DO sensors: electrochemical and optical. Electrochemical DO sensors are based on the electrical current produced to measure the concentration of dissolved oxygen in water and can be polarographic or galvanic [80]. Optical DO sensors, also called luminescent DO sensors (LDO), measure the concentration of dissolved oxygen in water according to the extinction of luminescence in the presence of oxygen, being able to measure the intensity or lifetime of luminescence, since oxygen affects both [81].
Research to optimize DO measurement technologies is directed towards both electrochemical and optical sensors, however, DO electrochemical sensors are currently seen as more promising and are more widely used, mainly because they perform online in situ measurements [80]. The following works present the advances in technologies for DO measurement in water, as summarized in Table 5 also. Thus, in situ and online monitoring systems for aquaculture and other water uses have been using commercial dissolved oxygen sensors with electrochemical detection, as described by Liu [82], Luo et al. [83], Vijayakumar and Ramya [84], and He [85]. Liu [82] and He [85] were able to monitor OD and other water quality parameters (turbidity, pH, temperature, and electrical conductivity) for fishery management based on the IoT concept. From the same approach, Vijayakumar and Ramya [84] also were able to measure DO in water for aquaculture management using a Raspberry PI B+ core controller and an IoT module (USR WIFI 232). Finally, Luo et al. [83] used a commercial YCS-2000 dissolved oxygen sensor and Zigbee and GPRS modules to monitor water quality parameters in real-time at a low cost, including DO.
Table 5.
Summary of studies that present new alternative technologies for monitoring the dissolved oxygen parameter in water.
The development of new technologies for DO sensors is ongoing, as presented, for example, by Lee et al. [86], who studied a new DO sensor for in situ water analysis with a needle-like microelectrode arrangement, obtained by microfabrication technologies, which aims to integrate sensors with IC (Integrated Circuit) chips for online data acquisition. Thus, the authors obtain a rapid 15 s linear response in the 0–9 mg/L (0–21% O2) range. Penso et al. [87] described the development, fabrication, and characterization of a low-cost, high-sensitivity optical sensor for DO detection with the potential for in situ measurement in a marine environment (between 0 and 5.5 mg/L) based on a PDMS membrane coated with a platinum octaethylporphyrin (PtOEP) film. Mahoney et al. [88] also innovated the optimization of a multilayer optical-fluidic sensor device based on the measurement of fluorescence suppression in a ruthenium-based oxygen-sensitive dye to obtain increased sensitivity in the in situ detection of DO in water between 0 and 20 ppm.
3.2.3. Fluorine
Fluoride analysis is essential for human health, especially concerning dental health [89,90]. For this reason, there are several techniques for the analysis of fluorine in water, such as the potentiometric and colorimetric methods, with the zirconium dye complex (SPADNS) method being the most used [91]. According to WHO [28], fluoride is usually determined by means of an ion-selective electrode, which makes it possible to measure the total amount of free and complex-bound fluoride dissolved in water. The description of new technologies for measuring fluoride in water will be described below, as well as presented in Table 6.
Table 6.
Summary of studies that present new alternative technologies for monitoring the fluorine parameter in water.
In the field of in situ and low-cost technologies development, Jadhav et al. [92], using a fiber optic sensor based on Fiber Bragg Grating (FBG), were able to detect low concentrations of fluoride in water by observing the linear relationship between light transmitted by the fiber and the increase in fluoride concentration. In addition, the research observed a resolution of 0.03 nm for the spectrum light, which allows an accuracy of ±20 ppm for fluoride analysis in the range of 0.05–8 ppm. Additionally, Moradi et al. [90] presented a technique that consists of coating a fiber optic terminal with aluminum by Direct Current Sputtering to reduce the sensor costs, making it possible to evaluate samples down to 5 ppm. As described by the authors, when the sensor is in contact with the fluorine in solution, a reaction occurs between the fluorine and the aluminum, removing the aluminum coating and causing a change in the light intensity proportional to the fluoride concentration.
Using other techniques to detect fluoride, Levin et al. [93] and Mukherjee et al. [94] also tested the development of a smartphone camera technique to measure fluoride in real-time, in situ, and at low cost. In the study by Levin et al. [93], an optical device was connected to the smartphone camera by a suitable case to measure the fluoride concentration in water samples. In this way, using the smartphone camera, it was possible to assess the relationship between the red, green, and blue (RGB) colors of the water samples to estimate the fluoride concentration. The authors obtained consistent results in the laboratory, although it is important to highlight that the turbidity and chlorine may interfere with the results of the analysis. Mukherjee et al. [94] used an external bicomponent sensing material, powered and operated by a smartphone, for fluorine analysis. The sensor used a mixture of near-cubic ceria−zirconia NC and XO dye that rapidly changes color from yellow to red based on interaction with fluorine. The authors also evaluated the device’s accuracy against other laboratory equipment such as XPS and NMR spectroscopy, as well as testing the system for high concentrations of other anions also present in water. Thus, the results were similar to the laboratory methods and showed that the device has a good selectivity for fluorine, showing no influence of other anions in the analysis.
3.2.4. Metals
The pollution of the aquatic environment by heavy metals is a growing problem worldwide. There are several sources of heavy metals, many of them originating from human action, mostly domestic sewage, hospital waste, and industrial and mining activities, among others [95,96]. Since heavy metals cannot be biodegraded, they are continuously deposited, accumulated, and incorporated into water, sediment, and aquatic organisms [97]. Within organisms, some heavy metals can exert a toxic and harmful effect and alter the functioning of the kidneys, liver, and nervous system, for example [98,99]. However, it should be noted that many metals, such as iron, copper, zinc, and magnesium, are essential for living beings in low concentrations, but exert a toxic effect in high concentrations [100].
According to Sibal and Espino [96], the mainly lab-based techniques to measure metal in water are atomic absorption spectrometry (AAS), mass spectrometry (MS), inductively coupled plasma MS (ICP-MS), atomic emission spectrometry (AES), X-ray fluorescence (XRF), and optical techniques. For Garciá-Miranda Ferrari et al. [101], such techniques are characterized as being sophisticated and expensive and may require the use of pre-concentration and separation techniques for high-analysis performance. On the other hand, when it comes to in situ analysis, methods with electrochemical sensors can be considered more appropriate, mainly due to the small size of the equipment, easy installation, low cost, and simple handling [101]. Gumpu et al. [102], for example, present techniques for measuring metallic ions, based on electrochemical biosensors for measuring arsenic (As), cadmium (Cd), mercury (Hg), lead (Ld), chromium (Cr), silver (Ag), zinc (Zn), and copper (Cu). The development of new technologies for measuring metals in water are presented below, as well as shown in Table 7.
Table 7.
Summary of studies that present new alternative technologies for monitoring the metals parameter in water.
In the development of portable optical systems for the determination of metals in water, Oliveira et al. [103], Zhou et al. [104], and Srivastava and Sharma [105] presented simple, low-cost solutions for measuring lead, copper, hexavalent chromium, and iron. The portable spectrophotometry system developed by Oliveira et al. [103], in Medium Density Fiberboard (MDF) material, using a DVD as a diffraction medium, and a smartphone device camera, was able to measure Fe2+ in a range of 0.5–15 mg/L, with a LOD of 0.02 and LOQ of 0.07 mg/L. Srivastava and Sharma [105] also developed an ultra-compact and portable spectrophotometry system, which integrates with a smartphone device and a cloud database (IoT), for measuring iron and copper in drinking water. Zhou et al. [104], using portable X-ray fluorescence (pXRF) equipment, were able to estimate the concentration of Pb and Cu directly in a lake, yielding results of 28 and 21 mg/L for Pb and Cu, respectively.
In the development of electrochemical sensors for metal determination, Wu et al. [55], Alam et al. [57], Wang et al. [106], Yen and Lai [107], and Li et al. [108] were able to measure copper, lead, mercury, and zinc in an aqueous medium, with portable, low-cost electrochemical sensors that could be integrated with other electronic devices for in situ and real-time responses. Alam et al. [57], from sensors made of multi-walled carbon nanotubes and β-cyclodextrin (MWCNT-βCD), were able to determine a concentration of Pb+2 in water between 5 and 100 mg/L, even in the presence of other metals, such as Cd2+, Zn2+, Cu2+, Hg2+, and Ni2+. Wu et al. (2020) [55] and Wang et al. [106] used a sensor manufactured by MEMS (Micro-Electro-Mechanical System) technique to measure Cu+2 between 0.0 and 0.6 mg/L and 0.0–400 mg/L, respectively. Wu et al. [55] observed an accuracy of 0.04 mg/L for the equipment, while Wang et al. [106] observed that the sensor suffered no interference by the presence of other metals (such as Pb2+, Zn2+, and Mg2+ ions). Yen and Lai [107], by the technology based on a metal-oxide-semiconductor microelectromechanical system (CMOS-MEMS), which can be operated in real-time and in situ, were able to detect Pb2+ between 0.01 and 100 mg/L with a detection limit of 0.005 mg/L. Finally, Li et al. [108] developed a portable device, costing less than U$160.00, based on plastic pipetting equipment using a Disposable Electrode-Printed (DEP) chip, for the determination of Pb, Hg, Cu, and Zn at different concentrations. Furthermore, the experimental results demonstrated that the limits of detection for Pb, Hg, Cu, and Zn were 2.2 ng/mL, 2.5 ng/mL, 15.5 ng/mL, and 10 ng/mL, respectively, and the limits of quantification for them were 10 ng/mL, 25 ng/mL, 25 ng/mL, and 14 ng/mL, respectively.
3.2.5. Nitrogen
Nitrogen can be found in different sources, such as decomposed plants, human waste, animals, and chemical fertilizers [64]. For nitrogen monitoring, several techniques can be applied, such as chromatography, electrochemistry, and spectroscopy methods [109]. Chromatography is the most suitable method when there is organic matter in the samples, since this method does not suffer interference from other compounds; however, it is the most complex and expensive method of application, as it uses different techniques and specialized materials in the process [110]. Spectroscopy can also suffer interference, but it is easier to apply than the other two methods, in addition to the advantage of obtaining results faster [111]. Monitoring through electrochemistry has great potential for low-cost applications, but it can be influenced by ions and organic matter present in the samples [112]. The development of new technologies for nitrogen measurement will be described below, as well as presented in Table 8 also.
As it is an important parameter from a monitoring point of view, the development of low-cost sensors for the real-time and in situ detection of nitrogen has gained attention in the literature. Akhter et al. [113], for example, developed an electrochemical sensor using Polydimethylsiloxane as a flexible substrate with multi-walled carbon nanotubes as a conductive material. Although graphene has better electrical properties, the mass production of this material is complex, which can change the repeatability of the developed sensor. In addition, the authors developed an IoT platform based on LoRa (Long Range) [114] to send the collected data in real-time, finding a relationship between temperature and resistivity for different concentrations of nitrate. When evaluating repeatability, the authors observed that the Relative Standard Deviation (RSD) was below 2% when comparing three different readings from the same sensor, and an RSD below 5% when compared to the other five sensors of the same manufacture. Finally, the values obtained by the developed sensor were compared with those obtained by the UV-vis spectrometry method to validate the results, obtaining a higher maximum concentration with a difference of 4.91% in relation to the standard method.
Obrovski et al. [111] used a chemical fiber optic probe based on the HSV (Hue, Saturation, and Value) color model. The sensor is based on the principle that when water is exposed to light, certain wavelengths are transmitted while others are absorbed depending on the color of the evaluated sample. Then, the device uses three RGB LEDs and a TLS250 photodetector to detect the transmitted light. The device was compared to the UV-vis spectrometer, and it was found that nitrate was the only parameter with which it was possible to obtain a correlation with the concentration variation, the detection limit of this sensor being between 0 and 0.7 mg/L. In addition, the authors performed only laboratory evaluation; therefore, it is not possible to verify the performance of the device in real applications, nor evaluate the repeatability and durability of this sensor in field conditions.
Finally, Ingles, Louw, and Booysen [115] developed a sensor that can be used with smartphones based on a laboratory photometer spectrum, however, with fewer components, more portability, and less expense. The device has four parts: the light source, the wavelength filter, a cuvette, and a scintillator. For the light source, the only one commercially available and capable of emitting light at the indicated wavelength was the CompactFiberlight D2. The wavelength filter was developed with quartz, which is a material that has a negligible absorbance at a wavelength of 205 nm: the ideal wavelength for nitrogen evaluation [116,117]. The cuvette was 3D printed in plastic with a 1 cm opening to isolate external light while allowing instrument light to pass through. With this device, the authors obtained a maximum deviation of 27% compared to the analysis performed by the photometer spectrum, with the sensor operating range between 1 and 10 mg/L for nitrate.
Table 8.
Summary of studies that present new alternative technologies for monitoring the nitrogen parameter in water.
Table 8.
Summary of studies that present new alternative technologies for monitoring the nitrogen parameter in water.
| Author(s) | Type | Description | Research Findings |
|---|---|---|---|
| Akhter et al. [113] | Electrical | Developed an electrochemical sensor using Polydimethylsiloxane as a flexible substrate with multi-walled carbon nanotubes nitrate in water. | The sensor had a difference of 4.91% in relation to the standard method for measuring nitrate. |
| Obrovski et al. [111] | Optical | Used a chemical fiber optic probe based on the HSV model to detect nitrate in water. | The detection limit of this sensor was between 0 and 0.7 mg/L. |
| Ingles, Louw and Booysen [115] | Presented a low-cost, portable sensor that can be used with a smartphone to measure nitrate in water. | The sensor operating range was between 1 and 10 mg/L for nitrate, with a 27% deviation compared to commercial equipment. |
3.2.6. pH
As pH is an essential parameter to ensure good water quality, this parameter is widely monitored and found in practically all multiparameter equipment. Different techniques can be applied to measure the pH in a water sample, namely visual analysis, photometric and potentiometric methods [118,119]. While the visual method uses color change as a pH indicator using specific materials (litmus paper), this method does not have good accuracy and only provides approximate pH values. The potentiometric method is based on the Nernst equation, which measures the change in hydrogen ion concentration due to chemical reactions. The photometric method is based on spectrophotometry, which provides information about the change in wavelength absorption based on the pH change of the samples. The following research presents the development of alternative technologies for measuring pH in water, as described in Table 9 also.
Table 9.
Summary of studies that present new alternative technologies for monitoring the pH parameter in water.
Alam, Clyne, and Deen [56], Wu et al. [55], and Simic et al. [58] developed pH sensors using the potentiometric method in different ways. Alam, Clyne, and Deen [56] used a special ink made of palladium (Pd) with the silver/silver-chloride electrode (Ag/AgCl) as a reference in a polyimide substrate. Wu et al. [55] used the ruthenium (Ru) redox to measure pH; compared to Pd, Ru has low contamination potential, easy preparation, and good chemical resistance. The authors were able to measure pH between 4.01 and 10.87 with an accuracy of 1.02%. Finally, Simic et al. [58] used titanium dioxide (TiO2) as the main film in the pH sensor, which was connected to an integrated circuit (using an AD5933 module) for online communication.
In the study by Hossain et al. [120], the authors used a multi-parametric sensor to assess water quality. For pH, a Photo-Induced Electron Transfer (PET) method was used with 4-aminonapthlimide as a dye for analysis. Regarding further photometric methods, Dutta, Sarma, and Nath [119] sought to perform analyses in colorless liquids, that is, without the use of dyes for analysis. The sensor uses the capture of the image spectrum and, through an optical preparation and consequent conversion into intensity and wavelength distribution, performs the pH measurement. Finally, Silva et al. [118] used a device based on the measurement of colorimetry using a smartphone camera and a microfluidic paper-based device (IPAD) to measure the pH of the samples. For the method, 3D printer supports were developed to ensure the stability of the device, in which the device was able to determine pH in the 4.7–12 range.
3.2.7. Phosphorus
Phosphorus is an essential nutrient used by plants and microorganisms, mainly for growth and energy transport, and it is a limiting element for primary production in terrestrial and aquatic ecosystems [121,122]. In the aquatic environment, phosphorus usually occurs in dissolved forms, such as orthophosphates, and organic phosphorus [123]. However, high concentrations of phosphorus in rivers and lakes can favor the proliferation of plankton and algae, accelerating eutrophication [124].
The determination of phosphorus in water depends on the type to be analyzed, such as dissolved, precipitated, associated, organic, or inorganic [125], with the main methodologies used being based on electrochemical sensors, such as potentiometry, voltammetry, and amperometry techniques [126], and in optical sensors [127]. Although the spectrophotometry technique is one of the most widely used for the detection of phosphorus [128], according to Berchmans, Issa, and Singh [126], the use of potentiometric systems offers a simple and low-cost instrumentation for monitoring phosphorus in the environment, clinical analysis, and remote sensing. However, electrochemical sensors can be influenced by several factors, such as temperature fluctuation and the presence of other substances (such as metals), hindering the results [129]. The following research presents the development of new technologies for measuring phosphorus in water, as summarized in Table 10.
Table 10.
Summary of studies that present new alternative technologies for monitoring the phosphorus parameter in water.
Based on the colorimetry technique, Lin et al. [130] developed a sensor for the automatic monitoring of phosphate in situ, and at a low cost (US$200), through the use of an automatic collector of water samples, called “Fish-Bite”, which contains multiple capsules of reagents for analysis. The equipment was developed to be used to monitor water intended for agriculture and is capable of measuring phosphate concentrations up to 1.00 mg/L, with a lower detection limit of 0.01 mg/L. Akhter et al. [131] were also able to determine phosphate in water for agricultural use, with concentrations between 0.01 and 40 mg/L and with 95% accuracy. The measurement technique is based on an electrochemical sensor, produced from multi-walled carbon nanotubes (MWCNTs) and Polydimethylsiloxane (PDMS), with the possibility of integration with smart devices (Internet of Things) for continuous monitoring.
3.2.8. Oxidation Reduction Potential (ORP)
The Oxidation Reduction Potential (ORP) is a measure of the molecular charge corresponding to the oxidation or reduction capacity of a substance and is an important indicator of water quality, capable of contributing to the understanding of variations in other parameters. For this reason, the ORP sensors are commonly coupled in multiparameter systems [132,133]. The development of new technologies to measure ORP in water are presented below, as well as in Table 11.
Table 11.
Summary of studies that present new alternative technologies for monitoring the Oxidation Reduction Potential (ORP) parameter in water.
In developing new techniques for monitoring ORP, Qasem et al. [134] built a remotely operated underwater vehicle containing ORP sensors, and sensors for three more parameters (electrical conductivity, dissolved oxygen, and temperature), to identify oil spills in ocean waters using Raspberry Pi 3 connected to the internet via Wi-Fi. Dejus et al. [135] also used a system containing online ORP sensors and five more parameters to detect drinking water contamination events. For water quality control, Helmi, Hafiz, and Rizam [136] developed a surface water quality monitoring buoy with ORP, pH, and temperature sensors, also remotely controlled by an internet-connected computer that sends instructions to the Intel Atom N2600 board, which, in addition to the quality data, sends the physical location coordinates. Subsequently, Siyang and Kerdcharoen [137] innovated with a small, unmanned vehicle coupling an Arduino Uno with standard Wi-Fi, where ORP, Electrical Conductivity, Dissolved Oxygen, pH, and Temperature sensors were connected, whereupon the acquisition and transmission of data took place by XBee wireless communication directed to the control station and then to the database server on the internet. Similar system designs were studied by Khatri et al. [138] and Ilie et al. [139], who developed a low-cost drinking water quality monitoring station, with ORP as a parameter, for online and real-time monitoring using commercial sensors.
The systems described above refer to projects in the laboratory phase, not consolidated in the market, although the ORP sensors used are commercial probes for embedded systems. In contrast, due to the lack of low-cost, in situ devices for ORP measurement, Lee et al. [140] studied the fabrication of microelectrode sensor arrays (MEAs) for in situ ORP measurements using a chemical etching technique, where MEAs exhibited a substantially faster response time in the order of seconds rather than minutes, as compared to the commercial milli-electrodes. Jang et al. [141] also developed arrays of microelectrode sensors for ORP measurements, in an easier and more robust method, which presented readings equal to or more accurate than conventional ones. Finally, Lin et al. [142] were able to measure ORP, as well as pH, chloride, and conductivity, using microfabricated platinum electrodes deposited on a glass substrate as a sensor. The authors described that the sensor was able to measure ORP from 150 to 800 mV and, due to its simple fabrication, the sensor costs about US$0.10.
3.3. Technologies for Biological Monitoring of Water Quality
3.3.1. Algae and Cyanobacteria
The determination of algae and cyanobacteria in water can be conducted through numerous techniques, such as cell counting with the aid of an optical microscope or the analysis of indicator substances, such as chlorophylls [143]. Chlorophyll analysis is widespread because it is an active optical pigment capable of being determined by spectrophotometry, fluorimetry, and High-Performance Liquid Chromatography (HPLC) [35,144]. In addition, the analysis of such organisms can also be done remotely by observing different bands of satellite images [144] and by means of cytometry [145], which allows counting the number of cells. The following works present the development of new technologies for Algae and Cyanobacteria in water quality monitoring, as also summarized in Table 12.
Table 12.
Summary of studies that present new alternative technologies for monitoring the algae and cyanobacteria parameters in water.
In algae analysis, several studies have sought to use new sensors and low-cost techniques to obtain in situ data with good accuracy. Lee et al. [146] developed a portable, 3D-printed device that uses a smartphone and utilizes opto-electrowetting (in the acronym OEW, being a method of manipulating liquid droplets used in microfluidic applications) for the determination of algae in freshwater (C. reinhardtii and M. aeruginosa) and seawater (Amphiprora sp. and C. closterium). Saboe et al. [147] studied the determination of algae using a microbiological potentiometric sensor, through the analysis of electrical signal patterns, as a means of diagnosing changes in water quality and the presence of algae in the aquatic environment. For this, the authors made use of machine learning to differentiate the sensor response under different conditions and in the presence of other contaminants, resulting in a linear relationship between the microbiological concentration of algae and the potentiometric signal of the sensor.
Using optical sensors, Lee et al. [148] developed a device connected to a biological optical sensor and an ARM Cortex-M3 processor, with a wireless connection, for the diagnosis of algae growth in a water treatment plant, whose control and monitoring could be performed remotely. Izydorczyk et al. [149], in turn, were able to monitor cyanobacteria in a water supply reservoir, through chlorophyll analysis using a system called Algae Online Analyzer (AOA). The AOA device is composed of five light-emitting diodes (450, 525, 570, 590, and 610 nm), which, through the fluorescence technique, allow the determination and differentiation of algae from the Chlorophyceae, Bacillariophyceae, Cyanophyceae, and Cryptophyceae classes.
In the use of multiparametric probes, Zamydi et al. [150] detected cyanobacteria (Phycocyanin and Chlorophylla) in the Yamaska River Reservoir and Lake Champlain Bay, Canada, using the fluorescence technique and the YSI 6600 V2–4 probe. Beckler et al. [151] were also able to monitor and map the algae bloom on the coast in an automated way using a fluorometer sensor (Cyclops Integrator/C3) coupled to a remotely operated boat (Navocean Nav2 ASV). Naughton et al. [152] monitored microalgae on an aquaculture farm for 10 months using the AlgaeTorch® probe, in the Republic of Ireland, as a tool for monitoring seasonal changes in cultivation and for decision-making by producers.
Finally, Yamahara et al. [153] presented the integration of an automatic sampler that, through molecular analytical techniques, allows the in situ detection of fecal indicators (fecal coliforms) and harmful algae in surface waters. The equipment, called an Environmental Sampling Processor (ESP), is capable of measuring and issuing reports with a certain frequency and uses the qPCR (real-time Polymerase Chain Reaction) technique in chemical-biological analysis.
3.3.2. Total Coliforms and Escherichia coli
According to the American Public Health Association [91], the main methods for rapid coliform detection in water are based on radiometric, glutamate decarboxylase, electrochemical, gas chromatographic, colorimetric, and potentiometric techniques. The Membrane Filter Coliform Test, for example, is a method for coliform analysis that can detect 50–200 CFU in water samples in 24 h with the aid of a microscope [23]. The analysis of total coliforms and E. coli can also be done by the commercial tests ColitagTM and Colilert® [154] and by the Multiple Fermentation Technique [155] with high performance and results between 24 and 48 h. The following research presents the development of alternative technologies for monitoring total coliforms and E. coli in water quality, as also shown in Table 13.
Table 13.
Summary of studies that present new alternative technologies for monitoring the total coliforms and Escherichia coli parameter in water.
In the development of new methodologies for the detection of pathogens in water, Simões and Dong [156] were able to perform the continuous and real-time monitoring of E. coli and Legionella in drinking water distribution networks using a fluorescent optical sensor fluid (Hamamatsu H17023), at a low cost, and whose equipment had a detection limit equal to 1.4 × 10³ CFU/mL. Bedell et al. [157], in turn, used the Tryptophan-Like Fluorescent (TLF) technique, with deep-ultraviolet light-emitting diodes (UV-LEDs), sensitive semiconductor photodiodes, and photomultipliers to detect the presence of E. coli with a sensitivity of 4 CFU/mL.
Based on the use of smartphones, Gunda et al. [158] and Patil et al. [159] were able to detect the presence of total coliforms and E. coli in water. The device developed by Gunda et al. [158], called the Mobile Water Kit (MWK), was able to detect such microorganisms in 30 min, using chemical reagents such as colorimetric/fluorescent sensors and a smartphone, which captures and analyzes the images obtained. The system developed by Patil et al. [159] is operated by a smartphone that captures images of a water sample contained in a chamber and, through an algorithm, analyzes the images to identify the growth of bacteria through the increase in turbidity and/or changes in the color. The system can issue an alert when contamination is detected.
Tok et al. [160] and Huynh, Hausot, and Angelescu [161] discussed in situ devices for sampling and the automatic testing of total coliforms and E. coli, with a low cost and high efficiency. The device developed by Tok et al. [160] is operated by a Raspberry Pi microcontroller and a camera that measures water absorption and fluorescence, through a blue LED and UV light, in 100 mL samples each 24 h. Huynh, Hausot, and Angelescu [161] presented the Autonomous Microbiological Alert Sensor (AMAS), whose bacterial presence is monitored using multispectral measurements (colorimetry and fluorimetry), and the data are transmitted wirelessly to a remote server.
Finally, Grossi et al. [162] and Zhang et al. [163] were able to detect bacterial growth (which may indicate the presence of E. coli and total coliforms) using electrical sensors. The system developed by Grossi et al. [162] is composed of two electronic boards—one to measure the electrical parameters and the other to control the temperature of the sample. It can be used for in situ analysis on different types of samples, with results between 3 and 12 h. On the other hand, Zhang et al. [163] used a capacitively coupled multichannel contactless conductivity detector (C4D) to detect bacterial growth in an apparent normalized relationship between conductivity and incubation time.
4. Conclusions
Monitoring water quality is an important water management tool, acting to control pollution and minimize impacts on the environment and human health. However, due to the high cost of monitoring, through the sampling process, sample preservation, transport, qualified professionals, and the use of expensive laboratory equipment, unfortunately, there is a lack of water quality data for the correct management of this resource. With the development of new technologies and the progress of nanotechnology and material sciences, integrated with the Internet of Things, it is possible to accelerate and minimize the costs of obtaining water quality data. In this review, several studies were described that presented the development of low-cost technologies, with in situ applications, that can accelerate the collection of data for the monitoring of physical, chemical, and biological parameters of the waters. It was also possible to observe that there was an increase in the number of publications related to the topic, mainly from 2012, with a total of 641 studies being published in 2021 alone. However, although many technologies presented have the potential for monitoring water quality, it is important to highlight that more robust analyses are necessary to guarantee its efficiency, such as equipment useful for life and interference from the environment, being indispensable with the help of standard methodologies at first. Moreover, it should be noted that reporting values for governmental regulatory purposes require that methods undergo exhaustive scrutiny with regard to accuracy and repeatability before being authorized for use.
Author Contributions
Conceptualization, G.M.e.S., D.F.C., J.A.T.B. and F.G.; methodology, G.M.e.S., D.F.C., J.A.T.B. and F.G.; formal analysis, E.M.M. and M.T.; data curation, G.M.e.S.; writing—original draft preparation, G.M.e.S., D.F.C. and J.A.T.B.; writing—review and editing, E.M.M., M.T. and F.G.; supervision, F.G. All authors have read and agreed to the published version of the manuscript.
Funding
The researchers were supported by the Coordenação de Aperfeiçoamento de Pessoal de Nível Superior—CAPES, by the Conselho Nacional de Desenvolvimento Científico e Tecnológico—CNPq, by the Fundação de Amparo à Pesquisa do Estado de São Paulo—FAPESP, and by the Pró-Reitoria de Pesquisa—USP.
Institutional Review Board Statement
Not applicable.
Informed Consent Statement
Not applicable.
Data Availability Statement
Not applicable.
Conflicts of Interest
The authors declare no conflict of interest.
References
- Vigil, K.M. Clean Water: An Introduction to Water Quality and Water Pollution Control, 2nd ed.; Oregon State University Press: Corvallis, OR, USA, 2003; Volume 1, ISBN 9780870718335. [Google Scholar]
- Owa, F.D. Water pollution: Sources, effects, control and management. Mediterr. J. Soc. Sci. 2013, 4, 65. [Google Scholar] [CrossRef]
- Speight, J.G. Sources of Water Pollution. In Natural Water Remediation; Butterworth-Heinemann: Kidlington, UK, 2020. [Google Scholar]
- United Nations. Sustainable Development Goal 6-Synthesis Report on Water and Sanitation; United Nations: New York, NY, USA, 2018. [Google Scholar]
- Behmel, S.; Damour, M.; Ludwig, R.; Rodriguez, M.J. Water quality monitoring strategies—A review and future perspectives. Sci. Total Environ. 2016, 571, 1312–1329. [Google Scholar] [CrossRef] [PubMed]
- Gallaher, S.; Heikkila, T. Challenges and Opportunities for Collecting and Sharing Data on Water Governance Institutions. J. Contemp. Water Res. Educ. 2014, 153, 66–78. [Google Scholar] [CrossRef] [Green Version]
- Tamm, T.; Nõges, T.; Järvet, A.; Bouraoui, F. Contributions of DOC from Surface and Groundflow into Lake Võrtsjärv (Estonia). Hydrobiologia 2008, 599, 213–220. [Google Scholar] [CrossRef]
- Eisenberg, J.N.S.; Bartram, J.; Wade, T.J. The water quality in rio highlights the global public health concern over untreated sewage. Environ. Health Perspect. 2016, 124, A180–A181. [Google Scholar] [CrossRef] [Green Version]
- Hegarty, S.; Hayes, A.; Regan, F.; Bishop, I.; Clinton, R. Using citizen science to understand river water quality while filling data gaps to meet United Nations Sustainable Development Goal 6 objectives. Sci. Total Environ. 2021, 783, 146953. [Google Scholar] [CrossRef]
- San Llorente Capdevila, A.; Kokimova, A.; Sinha Ray, S.; Avellán, T.; Kim, J.; Kirschke, S. Success factors for citizen science projects in water quality monitoring. Sci. Total Environ. 2020, 728, 137843. [Google Scholar] [CrossRef]
- Sarni, W.; White, C.; Webb, R.; Cross, K.; Glotzbach, R. Digital Water: Industry Leaders Chart the Transformation Journey. International Water Association and Xylem Inc. 2019. Available online: https://iwa-network.org/publications/digital-water/ (accessed on 4 February 2022).
- Justino, C.I.L.; Duarte, A.C.; Rocha-Santos, T.A.P. Recent progress in biosensors for environmental monitoring: A review. Sensors 2017, 17, 2918. [Google Scholar] [CrossRef] [Green Version]
- Crocker, J.; Bartram, J. Comparison and cost analysis of drinking water quality monitoring requirements versus practice in seven developing countries. Int. J. Environ. Res. Public Health 2014, 11, 7333–7346. [Google Scholar] [CrossRef]
- Borgia, E. The internet of things vision: Key features, applications and open issues. Comput. Commun. 2014, 54, 1–31. [Google Scholar] [CrossRef]
- Dong, J.; Wang, G.; Yan, H.; Xu, J.; Zhang, X. A survey of smart water quality monitoring system. Environ. Sci. Pollut. Res. 2015, 22, 4893–4906. [Google Scholar] [CrossRef] [PubMed]
- Geetha, S.; Gouthami, S. Internet of things enabled real time water quality monitoring system. Smart Water 2016, 2, 1. [Google Scholar] [CrossRef]
- Curl, J.M.; Nading, T.; Hegger, K.; Barhoumi, A.; Smoczynski, M. Digital Twins: The Next Generation of Water Treatment Technology. J. Am. Water Works Assoc. 2019, 111, 44–50. [Google Scholar] [CrossRef]
- Shafiee, M.E.; Barker, Z.; Rasekh, A. Enhancing water system models by integrating big data. Sustain. Cities Soc. 2018, 37, 485–491. [Google Scholar] [CrossRef]
- Pehme, K.M.; Burlakovs, J.; Kriipsalu, M.; Pilecka, J.; Grinfelde, I.; Tamm, T.; Jani, Y.; Hogland, W. Urban Hydrology Research Fundamentals for Waste Management Practices. In Proceedings of the Research for Rural Development 2019: Annual 25th International Scientific Conference Proceedings, Jelgava, Latvia, 15–17 May 2019; Volume 1. [Google Scholar]
- Hoolohan, C.; Amankwaa, G.; Browne, A.L.; Clear, A.; Holstead, K.; Machen, R.; Michalec, O.; Ward, S. Resocializing digital water transformations: Outlining social science perspectives on the digital water journey. Wiley Interdiscip. Rev. Water 2021, 8, e1512. [Google Scholar] [CrossRef]
- Brasil, J.; Macedo, M.; Lago, C.; Oliveira, T.; Júnior, M.; Oliveira, T.; Mendiondo, E. Nature-based solutions and real-time control: Challenges and opportunities. Water 2021, 13, 651. [Google Scholar] [CrossRef]
- Boyd, C.E. Water Quality an Introduction, 3rd ed.; Springer: Berlin/Heidelberg, Germany, 2020; ISBN 9783319705484. [Google Scholar]
- Alley, E.R. Water Quality Control Handbook, 2nd ed.; McGraw-Hill: New York, NY, USA, 2007; ISBN 0071508708. [Google Scholar]
- Alam, M.J.B.; Islam, M.R.; Muyen, Z.; Mamun, M.; Islam, S. Water quality parameters along rivers. Int. J. Environ. Sci. Technol. 2007, 4, 159–167. [Google Scholar] [CrossRef] [Green Version]
- Rahman, A.; Bakri, D. Al A Study on Selected Water Quality Parameters along the River Buriganga, Bangladesh. Iran. J. Energy Environ. 2006, 1, 81–92. [Google Scholar]
- Mohamed, I.; Othman, F.; Ibrahim, A.I.N.; Alaa-Eldin, M.E.; Yunus, R.M. Assessment of water quality parameters using multivariate analysis for Klang River basin, Malaysia. Environ. Monit. Assess. 2015, 187, 4182. [Google Scholar] [CrossRef]
- Rahmanian, N.; Ali, S.H.B.; Homayoonfard, M.; Ali, N.J.; Rehan, M.; Sadef, Y.; Nizami, A.S. Analysis of physiochemical parameters to evaluate the drinking water quality in the state of perak, Malaysia. J. Chem. 2015, 2015, 716125. [Google Scholar] [CrossRef] [Green Version]
- World Health Organization. Guidelines for Drinking-Water Quality, 4th ed.; Library Cataloguing-in-Publication Data: Geneva, Switzerland, 2011; Volume 1. [Google Scholar]
- Spellman, F.R. The Drinking Water Handbook, 3rd ed.; CRC Press: Boca Raton, FL, USA, 2017. [Google Scholar]
- Cotruvo, J. Drinking Water Quality and Contaminants Guidebook; CRC Press: Boca Raton, FL, USA, 2018. [Google Scholar] [CrossRef]
- Omer, N.H. Water Quality Parameters-Science, Assessments and Policy; Summers, K., Ed.; IntechOpen: London, UK, 2019. [Google Scholar]
- FAO. Fishery Harbour Manual on the Prevention of Pollution; FAO: Rome, Italy, 2014. [Google Scholar]
- Medema, G.J.; Payment, P.; Dufour, A.; Robertson, W.; Waite, M.; Hunter, P.; Kirby, R.; Andersson, Y. Safe drinking water: An ongoing challenge. In Assessing Microbial Safety of Drinking Water: Improving Approaches and Methods; IWA Publishing: London, UK, 2003; Volume 11. [Google Scholar]
- Zulkifli, S.N.; Rahim, H.A.; Lau, W.J. Detection of contaminants in water supply: A review on state-of-the-art monitoring technologies and their applications. Sens. Actuators B Chem. 2018, 255, 2657–2689. [Google Scholar] [CrossRef] [PubMed]
- Hambrook Berkman, J.A.; Canova, M.G. Algal Biomass Indicators; USGS TWRI B. 9 Biol. Indic.; USGS: Washington, DC, USA, 2007.
- Pal, A.; He, Y.; Jekel, M.; Reinhard, M.; Gin, K.Y.H. Emerging contaminants of public health significance as water quality indicator compounds in the urban water cycle. Environ. Int. 2014, 71, 46–62. [Google Scholar] [CrossRef] [PubMed]
- Wang, J.; Wu, J. Occurrence and potential risks of harmful algal blooms in the East China Sea. Sci. Total Environ. 2009, 407, 4012–4021. [Google Scholar] [CrossRef] [PubMed]
- Schaap, A.; Rohrlack, T.; Bellouard, Y. Lab on a chip technologies for algae detection: A review. J. Biophotonics 2012, 5, 661–672. [Google Scholar] [CrossRef]
- Uddin, M.G.; Nash, S.; Olbert, A.I. A review of water quality index models and their use for assessing surface water quality. Ecol. Indic. 2021, 122, 107218. [Google Scholar] [CrossRef]
- Lumb, A.; Sharma, T.C.; Bibeault, J.-F. A Review of Genesis and Evolution of Water Quality Index (WQI) and Some Future Directions. Water Qual. Expo. Health 2011, 3, 11–24. [Google Scholar] [CrossRef]
- Kachroud, M.; Trolard, F.; Kefi, M.; Jebari, S.; Bourrié, G. Water quality indices: Challenges and application limits in the literature. Water 2019, 11, 361. [Google Scholar] [CrossRef] [Green Version]
- Tyagi, S.; Sharma, B.; Singh, P.; Dobhal, R. Water Quality Assessment in Terms of Water Quality Index. Am. J. Water Resour. 2020, 1, 3. [Google Scholar] [CrossRef]
- Alberti, G.; Zanoni, C.; Magnaghi, L.R.; Biesuz, R. Disposable and low-cost colorimetric sensors for environmental analysis. Int. J. Environ. Res. Public Health 2020, 17, 8331. [Google Scholar] [CrossRef]
- Rainbow, J.; Sedlackova, E.; Jiang, S.; Maxted, G.; Moschou, D.; Richtera, L.; Estrela, P. Integrated electrochemical biosensors for detection of waterborne pathogens in low-resource settings. Biosensors 2020, 10, 36. [Google Scholar] [CrossRef] [Green Version]
- Edwards, H.O. An instrument for the measurement of colour and turbidity in natural waters. Water Sci. Technol. 1998, 37, 263–267. [Google Scholar] [CrossRef]
- Murphy, K.; Heery, B.; Sullivan, T.; Zhang, D.; Paludetti, L.; Lau, K.T.; Diamond, D.; Costa, E.; O’Connor, N.; Regan, F. A low-cost autonomous optical sensor for water quality monitoring. Talanta 2015, 132, 520–527. [Google Scholar] [CrossRef] [PubMed]
- Yang, Y. Water Quality Monitoring and Control for Fish Pond Based on Wireless Sensor Network. In Proceedings of the Automation, Mechanical and Electrical Engineering, Beijing, China, 19–20 August 2014; Volume 1. [Google Scholar]
- Haque, H.; Labeeb, K.; Riha, R.B.; Khan, M.N.R. IoT Based Water Quality Monitoring System by Using Zigbee Protocol. In Proceedings of the 2021 International Conference on Emerging Smart Computing and Informatics (ESCI), Pune, India, 5–7 March 2021. [Google Scholar]
- Saravanan, K.; Anusuya, E.; Kumar, R.; Son, L.H. Real-time water quality monitoring using Internet of Things in SCADA. Environ. Monit. Assess. 2018, 190, 556. [Google Scholar] [CrossRef] [PubMed]
- George, G.; Menon, N.N.; Abdulaziz, A.; Brewin, R.J.W.; Pranav, P.; Gopalakrishnan, A.; Mini, K.G.; Kuriakose, S.; Sathyendranath, S.; Platt, T. Citizen Scientists Contribute to Real-Time Monitoring of Lake Water Quality Using 3D Printed Mini Secchi Disks. Front. Water 2021, 3, 662142. [Google Scholar] [CrossRef]
- Martínez-Máñez, R.; Soto, J.; García-Breijo, E.; Gil, L.; Ibáñez, J.; Gadea, E. A multisensor in thick-film technology for water quality control. Sens. Actuators A Phys. 2005, 120, 589–595. [Google Scholar] [CrossRef]
- Qin, Y.; Kwon, H.J.; Howlader, M.M.R.; Deen, M.J. Microfabricated electrochemical pH and free chlorine sensors for water quality monitoring: Recent advances and research challenges. RSC Adv. 2015, 5, 69086–69109. [Google Scholar] [CrossRef]
- Zhou, B.; Bian, C.; Tong, J.; Xia, S. Fabrication of a miniature multi-parameter sensor chip for water quality assessment. Sensors 2017, 17, 157. [Google Scholar] [CrossRef] [Green Version]
- Childs, P.R.N.; Greenwood, J.R.; Long, C.A. Review of temperature measurement. Rev. Sci. Instrum. 2000, 71, 2959–2978. [Google Scholar] [CrossRef] [Green Version]
- Wu, Z.; Wang, J.; Bian, C.; Tong, J.; Xia, S. A MEMS-based multi-parameter integrated chip and its portable system forwater quality detection. Micromachines 2020, 11, 63. [Google Scholar] [CrossRef] [Green Version]
- Alam, A.U.; Clyne, D.; Deen, M.J. A low-cost multi-parameter water quality monitoring system. Sensors 2021, 21, 3775. [Google Scholar] [CrossRef]
- Alam, A.U.; Clyne, D.; Jin, H.; Hu, N.X.; Deen, M.J. Fully Integrated, Simple, and Low-Cost Electrochemical Sensor Array for in Situ Water Quality Monitoring. ACS Sens. 2020, 5, 412–422. [Google Scholar] [CrossRef] [PubMed]
- Simic, M.; Stojanovic, G.M.; Manjakkal, L.; Zaraska, K. Multi-Sensor System for Remote Environmental (Air and Water) Quality Monitoring. In Proceedings of the 24th Telecommunications Forum, TELFOR 2016, Belgrade, Serbia, 22–23 November 2016. [Google Scholar]
- Srivastava, S.; Vaddadi, S.; Sadistap, S. Smartphone-based System for water quality analysis. Appl. Water Sci. 2018, 8, 130. [Google Scholar] [CrossRef] [Green Version]
- Huang, Y. Fiber Optic Sensing System for in-Situ Simultaneous Monitoring of Water Stage, Quality, and Temperature. In Proceedings of the Sensors and Smart Structures Technologies for Civil, Mechanical, and Aerospace Systems, San Diego, CA, USA, 9–13 March 2014; Lynch, J.P., Wang, K.-W., Sohn, H., Eds.; SPIE: San Diego, CA, USA, 2014; Volume 9061. [Google Scholar]
- Huang, Y.; Chen, B.; Chen, G.; Xiao, H.; Khan, S.U. Simultaneous detection of liquid level and refractive index with a long-period fiber grating based sensor device. Meas. Sci. Technol. 2013, 24, 095303. [Google Scholar] [CrossRef] [Green Version]
- Von Sperling, M. Introdução à Qualidade das Águas e ao Tratamento de Esgotos, 4th ed.; Departamento de Engenharia Sanitária e Ambiental (DESA), Universidade Federal de Minas Gerais (UFMG): Belo Horizonte, Brazil, 2014; ISBN 9788570411143. [Google Scholar]
- Azman, A.A.; Rahiman, M.H.F.; Taib, M.N.; Sidek, N.H.; Abu Bakar, I.A.; Ali, M.F. A Low Cost Nephelometric Turbidity Sensor for Continual Domestic Water Quality Monitoring System. In Proceedings of the 2016 IEEE International Conference on Automatic Control and Intelligent Systems, I2CACIS 2016, Selangor, Malaysia, 22 October 2016. [Google Scholar]
- Lambrou, T.P.; Anastasiou, C.C.; Panayiotou, C.G.; Polycarpou, M.M. A low-cost sensor network for real-time monitoring and contamination detection in drinking water distribution systems. IEEE Sens. J. 2014, 14, 2765–2772. [Google Scholar] [CrossRef]
- Samijayani, O.N.; Sulistya, F.G.; Wulansari, M.T.; Mujadin, A.; Rahmatia, S. Wireless sensor network for pH and turbidity of river water monitoring. AIP Conf. Proc. 2018, 2043, 020019. [Google Scholar]
- Chowdury, M.S.U.; Emran, T.B.i.n.; Ghosh, S.; Pathak, A.; Alam, M.M.; Absar, N.; Andersson, K.; Hossain, M.S. IoT based real-time river water quality monitoring system. Procedia Comput. Sci. 2019, 155, 161–168. [Google Scholar] [CrossRef]
- Arifin, A.; Irwan, I.; Abdullah, B.; Tahir, D. Design of Sensor Water Turbidity Based on Polymer Optical Fiber. In Proceedings of the 2017 International Seminar on Sensor, Instrumentation, Measurement and Metrology: Innovation for the Advancement and Competitiveness of the Nation, ISSIMM 2017, Surabaya, Indonesia, 25–26 August 2017; Volume 2017. [Google Scholar]
- Wang, Y.; Rajib, S.M.S.M.; Collins, C.; Grieve, B. Low-Cost Turbidity Sensor for Low-Power Wireless Monitoring of Fresh-Water Courses. IEEE Sens. J. 2018, 18, 4689–4696. [Google Scholar] [CrossRef] [Green Version]
- Abd Rahman, M.F.; Samah, A.H.A.; Ahmad, K.A.; Boudville, R.; Yahaya, S.Z. Performance Evaluation of LED Based Sensor for Water Turbidity Measurement. In Proceedings of the International Conference on Sensing Technology, ICST, Sydney, Australia, 2–4 December 2019; Volume 2018. [Google Scholar]
- Schima, R.; Krüger, S.; Bumberger, J.; Paschen, M.; Dietrich, P.; Goblirsch, T. Mobile monitoring—open-source based optical sensor system for service-oriented turbidity and dissolved organic matter monitoring. Front. Earth Sci. 2019, 7, 184. [Google Scholar] [CrossRef] [Green Version]
- Di Bernardo, L.; Dantas, Â.D.B. Métodos e técnicas de tratamento de água. Eng. Sanit. Ambient. 2006, 11, 107. [Google Scholar] [CrossRef] [Green Version]
- Cassidy, C.S.; Matthews, L.R.; Church, K.H.; Taylor, R.M.; Teague, K.A. In Situ Chlorine Detection by Ultraviolet Absorption Spectroscopy. In Proceedings of the Midwest Symposium on Circuits and Systems, Tulsa, OK, USA, 4–7 August 2002; Volume 2. [Google Scholar]
- Hall, J.; Zaffiro, A.D.; Marx, R.B.; Kefauver, P.C.; Radha Krishnan, E.; Haught, R.C.; Herrmann, J.G. On-line water quality parameters as indicators of distribution system contamination. J. Am. Water Work. Assoc. 2007, 99, 66–77. [Google Scholar] [CrossRef]
- Gimenez-Gomez, P.; Escude-Pujol, R.; Jimenez-Jorquera, C.; Gutierrez-Capitan, M. Multisensor Portable Meter for Environmental Applications. IEEE Sens. J. 2015, 15, 6517–6523. [Google Scholar] [CrossRef]
- Cui, L.; Qiu, M.; Fan, H.; Wang, L.; Zhao, S.; Du, J. Design and Research of Water Quality Monitoring System Based on nRF24L01 Wireless Communication. Proc. IOP Conf. Ser. Earth Environ. Sci. 2018, 208, 012074. [Google Scholar] [CrossRef]
- Yen, Y.K.; Lee, K.Y.; Lin, C.Y.; Zhang, S.T.; Wang, C.W.; Liu, T.Y. Portable Nanohybrid Paper-Based Chemiresistive Sensor for Free Chlorine Detection. ACS Omega 2020, 5, 25209–25215. [Google Scholar] [CrossRef] [PubMed]
- Alam, A.U.; Clyne, D.; Lush, W.; Deen, M.J. A reusable, reagent-less free chlorine sensor using gold thin film electrode. Analyst 2021, 146, 2626–2631. [Google Scholar] [CrossRef]
- Hou, Z.S.; Wen, H.S.; Li, J.F.; He, F.; Li, Y.; Qi, X. Environmental hypoxia causes growth retardation, osteoclast differentiation and calcium dyshomeostasis in juvenile rainbow trout (Oncorhynchus mykiss). Sci. Total Environ. 2020, 705, 135272. [Google Scholar] [CrossRef]
- Hsu, L.; Selvaganapathy, P.R.; Brash, J.; Fang, Q.; Xu, C.Q.; Deen, M.J.; Chen, H. Development of a low-cost hemin-based dissolved oxygen sensor with anti-biofouling coating for water monitoring. IEEE Sens. J. 2014, 14, 3400–3407. [Google Scholar] [CrossRef]
- Wei, Y.; Jiao, Y.; An, D.; Li, D.; Li, W.; Wei, Q. Review of dissolved oxygen detection technology: From laboratory analysis to online intelligent detection. Sensors 2019, 19, 3995. [Google Scholar] [CrossRef] [Green Version]
- Wang, Q.; Zhang, J.M.; Li, S. Minreview: Recent advances in the development of gaseous and dissolved oxygen sensors. Instrum. Sci. Technol. 2019, 47, 19–50. [Google Scholar] [CrossRef]
- Liu, S. Design for Fishery Water Environment Monitoring System Based on IOT. In Proceedings of the 2nd International Conference on Electronics, Network and Computer Engineering (ICENCE 2016), Yinchuan, China, 13–14 August 2016. [Google Scholar]
- Luo, H.P.; Li, G.L.; Peng, W.F.; Song, J.; Bai, Q.W. Real-time remote monitoring system for aquaculture water quality. Int. J. Agric. Biol. Eng. 2015, 8, 136–143. [Google Scholar] [CrossRef]
- Vijayakumar, N.; Ramya, R. The Real Time Monitoring of Water Quality in IoT Environment. In Proceedings of the ICIIECS 2015—2015 IEEE International Conference on Innovations in Information, Embedded and Communication Systems, Coimbatore, India, 19–20 March 2015. [Google Scholar]
- He, Y. Design of Water Quality Monitoring Platform Based on Embedded System. IOP Conf. Ser. Earth Environ. Sci. 2021, 631, 012020. [Google Scholar] [CrossRef]
- Lee, J.H.; Lim, T.S.; Seo, Y.; Bishop, P.L.; Papautsky, I. Needle-type dissolved oxygen microelectrode array sensors for in situ measurements. Sens. Actuators B Chem. 2007, 128, 179–185. [Google Scholar] [CrossRef]
- Penso, C.M.; Rocha, J.L.; Martins, M.S.; Sousa, P.J.; Pinto, V.C.; Minas, G.; Silva, M.M.; Goncalves, L.M. PtOEP–PDMS-based optical oxygen sensor. Sensors 2021, 21, 5645. [Google Scholar] [CrossRef] [PubMed]
- Mahoney, E.J.; Hsu, H.H.L.; Du, F.; Xiong, B.; Selvaganapathy, P.R.; Fang, Q. Optofluidic Dissolved Oxygen Sensing with Sensitivity Enhancement Through Multiple Reflections. IEEE Sens. J. 2019, 19, 10452–10460. [Google Scholar] [CrossRef]
- Fu, M.; Wu, X.; He, J.; Zhang, Y.; Hua, S. Natrium fluoride influences methylation modifications and induces apoptosis in mouse early embryos. Environ. Sci. Technol. 2014, 48, 10398–10405. [Google Scholar] [CrossRef] [PubMed]
- Moradi, V.; Caws, E.A.; Wild, P.M.; Buckley, H.L. A simple method for detection of low concentrations of fluoride in drinking water. Sens. Actuators A Phys. 2020, 303, 111684. [Google Scholar] [CrossRef]
- American Public Health Association. Standard Methods for the Examination of Water and Wastewater; APHA: Washington, DC, USA, 2005; Volume 541, ISBN 9780875532356. [Google Scholar]
- Jadhav, M.S.; Laxmeshwar, L.S.; Akki, J.F.; Raikar, P.U.; Kumar, J.; Prakash, O.; Raikar, U.S. Fluoride contamination sensor based on optical fiber grating technology. Opt. Fiber Technol. 2017, 38, 136–141. [Google Scholar] [CrossRef]
- Levin, S.; Krishnan, S.; Rajkumar, S.; Halery, N.; Balkunde, P. Monitoring of fluoride in water samples using a smartphone. Sci. Total Environ. 2016, 551–552, 101–107. [Google Scholar] [CrossRef] [Green Version]
- Mukherjee, S.; Shah, M.; Chaudhari, K.; Jana, A.; Sudhakar, C.; Srikrishnarka, P.; Islam, M.R.; Philip, L.; Pradeep, T. Smartphone-based Fluoride-specific Sensor for Rapid and Affordable Colorimetric Detection and Precise Quantification at Sub-ppm Levels for Field Applications. ACS Omega 2020, 5, 25253–25263. [Google Scholar] [CrossRef]
- Ogoyi, D.O.; Mwita, C.J.; Nguu, E.K.; Shiundu, P.M. Determination of Heavy Metal Content in Water, Sediment and Microalgae from Lake Victoria, East Africa. Open Environ. Eng. J. 2011, 4, 156–161. [Google Scholar] [CrossRef] [Green Version]
- Sibal, L.N.; Espino, M.P.B. Heavy metals in lake water: A review on occurrence and analytical determination. Int. J. Environ. Anal. Chem. 2018, 98, 536–554. [Google Scholar] [CrossRef]
- Linnik, P.M.; Zubenko, I.B. Role of bottom sediments in the secondary pollution of aquatic environments by heavy-metal compounds. Lakes Reserv. Res. Manag. 2000, 5, 11–21. [Google Scholar] [CrossRef]
- Hamilton, J.W.; Kaltreider, R.C.; Bajenova, O.V.; Ihnat, M.A.; McCaffrey, J.; Turpie, B.W.; Rowell, E.E.; Oh, J.; Nemeth, M.J.; Pesce, C.A.; et al. Molecular basis for effects of carcinogenic heavy metals on inducible gene expression. Environ. Health Perspect. 1998, 106, 1005–1015. [Google Scholar] [PubMed] [Green Version]
- Partanen, T.; Heikkila, P.; Hernberg, S.; Kauppinen, T.; Moneta, G.; Ojajarvi, A. Renal cell cancer and occupational exposure to chemical agents. Scand. J. Work. Environ. Health 1991, 17, 231–239. [Google Scholar] [CrossRef] [PubMed]
- Valko, M.; Morris, H.; Cronin, M. Metals, Toxicity and Oxidative Stress. Curr. Med. Chem. 2005, 12, 1161–1208. [Google Scholar] [CrossRef] [Green Version]
- Garciá-Miranda Ferrari, A.; Carrington, P.; Rowley-Neale, S.J.; Banks, C.E. Recent advances in portable heavy metal electrochemical sensing platforms. Environ. Sci. Water Res. Technol. 2020, 6, 2676–2690. [Google Scholar] [CrossRef]
- Gumpu, M.B.; Sethuraman, S.; Krishnan, U.M.; Rayappan, J.B.B. A review on detection of heavy metal ions in water—An electrochemical approach. Sens. Actuators B Chem. 2015, 213, 515–533. [Google Scholar] [CrossRef]
- de Oliveira, H.J.S.; de Almeida, P.L.; Sampaio, B.A.; Fernandes, J.P.A.; Pessoa-Neto, O.D.; de Lima, E.A.; de Almeida, L.F. A handheld smartphone-controlled spectrophotometer based on hue to wavelength conversion for molecular absorption and emission measurements. Sens. Actuators B Chem. 2017, 238, 1084–1091. [Google Scholar] [CrossRef]
- Zhou, S.; Yuan, Z.; Cheng, Q.; Zhang, Z.; Yang, J. Rapid in situ determination of heavy metal concentrations in polluted water via portable XRF: Using Cu and Pb as example. Environ. Pollut. 2018, 243, 1325–1333. [Google Scholar] [CrossRef]
- Srivastava, S.; Sharma, V. Ultra-portable, smartphone-based spectrometer for heavy metal concentration measurement in drinking water samples. Appl. Water Sci. 2021, 11, 177. [Google Scholar] [CrossRef]
- Wang, Y.; Xu, Y.; Jiang, J.; Li, Y.; Tong, J.; Bian, C. A portable sensor system with ultramicro electrode chip for the detection of heavy-metal ions in water. Micromachines 2021, 12, 1468. [Google Scholar] [CrossRef]
- Yen, Y.K.; Lai, C.Y. Portable real-time detection of Pb (II) using a CMOS MEMS-based nanomechanical sensing array modified with PEDOT:PSS. Nanomaterials 2020, 10, 2454. [Google Scholar] [CrossRef] [PubMed]
- Li, Z.; Xu, D.; Zhang, D.; Yamaguchi, Y. A portable instrument for on-site detection of heavy metal ions in water. Anal. Bioanal. Chem. 2021, 413, 3471–3477. [Google Scholar] [CrossRef] [PubMed]
- Sohail, M.; Adeloju, S.B. Nitrate biosensors and biological methods for nitrate determination. Talanta 2016, 153, 83–98. [Google Scholar] [CrossRef] [PubMed]
- Yi, K.; Wang, D.; Yang, Q.; Li, X.; Chen, H.; Sun, J.; An, H.; Wang, L.; Deng, Y.; Liu, J.; et al. Effect of ciprofloxacin on biological nitrogen and phosphorus removal from wastewater. Sci. Total Environ. 2017, 605–606, 368–375. [Google Scholar] [CrossRef]
- Obrovski, B.B.; Bajić, J.S.; Mihajlović, I.J.; Vojinović Miloradov, M.B.; Batinić, B.D.; Živanov, M.B. Colorimetric fiber optic probe for measurement of chemical parameters in surface water. Sens. Actuators B Chem. 2016, 228, 168–173. [Google Scholar] [CrossRef]
- Ouni, L.; Ramazani, A.; Taghavi Fardood, S. An overview of carbon nanotubes role in heavy metals removal from wastewater. Front. Chem. Sci. Eng. 2019, 13, 274–295. [Google Scholar] [CrossRef]
- Akhter, F.; Siddiquei, H.R.; Alahi, M.E.E.; Mukhopadhyay, S.C. An IoT-enabled portable sensing system with MWCNTs/PDMS sensor for nitrate detection in water. Meas. J. Int. Meas. Confed. 2021, 178, 109424. [Google Scholar] [CrossRef]
- Wu, N.; Khan, M. LoRa-based Internet-of-Things: A Water Quality Monitoring System. In Proceedings of the IEEE SOUTHEASTCON, Huntsville, AL, USA, 11–14 April 2019; Volume 2019. [Google Scholar]
- Ingles, J.M.D.F.P.; Louw, T.M.; Booysen, M.J. Water quality assessment using a portable uv optical absorbance nitrate sensor with a scintillator and smartphone camera. Water SA 2021, 47, 135–140. [Google Scholar] [CrossRef]
- Drolc, A.; Vrtovšek, J. Nitrate and nitrite nitrogen determination in waste water using on-line UV spectrometric method. Bioresour. Technol. 2010, 101, 4228–4233. [Google Scholar] [CrossRef]
- Karlsson, M.; Karlberg, B.; Olsson, R.J.O. Determination of nitrate in municipal waste water by UV spectroscopy. Anal. Chim. Acta 1995, 312, 107–113. [Google Scholar] [CrossRef]
- Da Silva, V.A.O.P.; de Freitas, R.C.; de Oliveira, P.R.; Moreira, R.C.; Marcolino-Júnior, L.H.; Bergamini, M.F.; Coltro, W.K.T.; Janegitz, B.C. Microfluidic paper-based device integrated with smartphone for point-of-use colorimetric monitoring of water quality index. Meas. J. Int. Meas. Confed. 2020, 164, 108085. [Google Scholar] [CrossRef]
- Dutta, S.; Sarma, D.; Nath, P. Ground and river water quality monitoring using a smartphone-based pH sensor. AIP Adv. 2015, 5, 057151. [Google Scholar] [CrossRef]
- Hossain, M.A.; Canning, J.; Ast, S.; Rutledge, P.J.; Jamalipour, A. Early warning smartphone diagnostics for water security and analysis using real-time pH mapping. Photonic Sens. 2015, 5, 289–297. [Google Scholar] [CrossRef] [Green Version]
- Xie, C.; Xu, J.; Tang, J.; Baig, S.A.; Xu, X. Comparison of Phosphorus Determination Methods by Ion Chromatography and Molybdenum Blue Methods. Commun. Soil Sci. Plant Anal. 2013, 44, 2535–2545. [Google Scholar] [CrossRef]
- Elser, J.J. Phosphorus: A limiting nutrient for humanity? Curr. Opin. Biotechnol. 2012, 23, 833–838. [Google Scholar] [CrossRef]
- Korostynska, O.; Mason, A.; Al-Shamma’a, A. Monitoring of nitrates and phosphates in wastewater: Current technologies and further challenges. Int. J. Smart Sens. Intell. Syst. 2012, 5, 149–176. [Google Scholar] [CrossRef] [Green Version]
- Mainstone, C.P.; Parr, W. Phosphorus in rivers-Ecology and management. Sci. Total Environ. 2002, 282–283, 25–47. [Google Scholar] [CrossRef]
- Jarvie, H.P.; Withers, J.A.; Neal, C. Review of robust measurement of phosphorus in river water: Sampling, storage, fractionation and sensitivity. Hydrol. Earth Syst. Sci. 2002, 6, 113–131. [Google Scholar] [CrossRef] [Green Version]
- Berchmans, S.; Issa, T.B.; Singh, P. Determination of inorganic phosphate by electroanalytical methods: A review. Anal. Chim. Acta 2012, 729, 7–20. [Google Scholar] [CrossRef] [Green Version]
- Kalkhajeh, Y.K.; Amiri, B.J.; Huang, B.; Khalyani, A.H.; Hu, W.; Gao, H.; Thompson, M.L. Methods for sample collection, storage, and analysis of freshwater phosphorus. Water 2019, 11, 1889. [Google Scholar] [CrossRef] [Green Version]
- Worsfold, P.; McKelvie, I.; Monbet, P. Determination of phosphorus in natural waters: A historical review. Anal. Chim. Acta 2016, 918, 8–20. [Google Scholar] [CrossRef] [PubMed] [Green Version]
- Chen, H.; Zhao, L.; Yu, F.; Du, Q. Detection of phosphorus species in water: Technology and strategies. Analyst 2019, 144, 7130–7148. [Google Scholar] [CrossRef] [PubMed]
- Lin, B.; Xu, J.; Lin, K.; Li, M.; Lu, M. Low-Cost Automatic Sensor for in Situ Colorimetric Detection of Phosphate and Nitrite in Agricultural Water. ACS Sens. 2018, 3, 2541–2549. [Google Scholar] [CrossRef] [PubMed]
- Akhter, F.; Siddiquei, H.R.; Alahi, M.E.E.; Mukhopadhyay, S.C. Design and development of an IoT-enabled portable phosphate detection system in water for smart agriculture. Sens. Actuators A Phys. 2021, 330, 112861. [Google Scholar] [CrossRef]
- Suslow, T.V. Oxidation-Reduction Potential (ORP) for Water Disinfection Monitoring, Control, and Documentation; University of California: Berkley, CA, USA, 2004. [Google Scholar]
- Copeland, A.; Lytle, D.A. Measuring the oxidation-reduction potential of important oxidants in drinking water. J. Am. Water Works Assoc. 2014, 106, E10–E20. [Google Scholar] [CrossRef]
- Qasem, F.; Susilo, T.B.; Said, S.; Alarbash, Z.; Hasan, M.; Jabakhanji, B.; Beyrouthy, T.; Alkork, S. Preliminary Engineering Implementation on Multisensory Underwater Remotely Operated Vehicle (rov) for Oil Spills Surveillance. In Proceedings of the BioSMART 2019-Proceedings: 3rd International Conference on Bio-Engineering for Smart Technologies, Paris, France, 24–26 April 2019. [Google Scholar]
- Dejus, S.; Nescerecka, A.; Kurcalts, G.; Juhna, T. Detection of drinking water contamination event with Mahalanobis distance method, using on-line monitoring sensors and manual measurement data. Water Sci. Technol. Water Supply 2018, 18, 2133–2141. [Google Scholar] [CrossRef]
- Helmi, A.H.M.A.; Hafiz, M.M.; Rizam, M.S.B.S. Mobile Buoy for Real Time Monitoring and Assessment of Water Quality. In Proceedings of the Proceedings—2014 IEEE Conference on System, Process and Control, ICSPC 2014, Kuala Lumpur, Malaysia, 12–14 December 2014. [Google Scholar]
- Siyang, S.; Kerdcharoen, T. Development of Unmanned Surface Vehicle for Smart WATER quality Inspector. In Proceedings of the 2016 13th International Conference on Electrical Engineering/Electronics, Computer, Telecommunications and Information Technology, ECTI-CON 2016, Chiang Mai, Thailand, 28 June–1 July 2016. [Google Scholar]
- Khatri, P.; Gupta, K.K.; Gupta, R.K.; Panchariya, P.C. Towards the Green Analytics: Design and Development of Sustainable Drinking Water Quality Monitoring System for Shekhawati Region in Rajasthan. Mapan J. Metrol. Soc. India 2021, 36, 843–857. [Google Scholar] [CrossRef]
- Ilie, A.M.C.; Vaccaro, C.; Rogeiro, J.; Leitao, T.E.; Martins, T. Configuration, Programming and Implementation of 3 Smart Water Network Wireless Sensor Nodes for Assessing the Water Quality. In Proceedings of the 2017 IEEE SmartWorld, Ubiquitous Intelligence & Computing, Advanced & Trusted Computed, Scalable Computing & Communications, Cloud & Big Data Computing, Internet of People and Smart City Innovation (SmartWorld/SCALCOM/UIC/ATC/CBDCom/IOP/SCI), San Francisco, CA, USA, 4–8 August 2017; pp. 1–8. [Google Scholar]
- Lee, J.H.; Jang, A.; Bhadri, P.R.; Myers, R.R.; Timmons, W.; Beyette, F.R.; Bishop, P.L.; Papautsky, I. Fabrication of microelectrode arrays for in situ sensing of oxidation reduction potentials. Sens. Actuators B Chem. 2006, 115, 220–226. [Google Scholar] [CrossRef]
- Jang, A.; Lee, J.H.; Bhadri, P.R.; Kumar, S.A.; Timmons, W.; Beyette, F.R.; Papautsky, I.; Bishop, P.L. Miniaturized redox potential probe for in situ environmental monitoring. Environ. Sci. Technol. 2005, 39, 6191–6197. [Google Scholar] [CrossRef]
- Lin, W.C.; Brondum, K.; Monroe, C.W.; Burns, M.A. Multifunctional water sensors for pH, ORP, and conductivity using only microfabricated platinum electrodes. Sensors 2017, 17, 1655. [Google Scholar] [CrossRef] [Green Version]
- Bowe, G. An Overview of Counting Methods of Algae. In Detection Methods for Algae, Protozoa and Helminths in Fresh and Drinking Water; John Wiley & Sons Ltd: West Sussex, UK, 2002. [Google Scholar]
- Zhang, C.; Zhang, J. Current Techniques for Detecting and Monitoring Algal Toxins and Causative Harmful Algal Blooms. J. Environ. Anal. Chem. 2014, 2, 2380–2391. [Google Scholar] [CrossRef] [Green Version]
- Linklater, N.; Örmeci, B. Real-Time and Near Real-Time Monitoring Options for Water Quality. In Monitoring Water Quality: Pollution Assessment, Analysis, and Remediation; Newnes: Oxford, UK, 2013. [Google Scholar]
- Lee, S.; Thio, S.K.; Park, S.Y.; Bae, S. An automated 3D-printed smartphone platform integrated with optoelectrowetting (OEW) microfluidic chip for on-site monitoring of viable algae in water. Harmful Algae 2019, 88, 101638. [Google Scholar] [CrossRef] [PubMed]
- Saboe, D.; Ghasemi, H.; Gao, M.M.; Samardzic, M.; Hristovski, K.D.; Boscovic, D.; Burge, S.R.; Burge, R.G.; Hoffman, D.A. Real-time monitoring and prediction of water quality parameters and algae concentrations using microbial potentiometric sensor signals and machine learning tools. Sci. Total Environ. 2021, 764, 142876. [Google Scholar] [CrossRef] [PubMed]
- Lee, S.H.; Mariappan, V.; Won, D.C.; Shin, J.; Yang, S. Design of In-situ Self-diagnosable Smart Controller for Integrated Algae Monitoring System. Int. J. Adv. Cult. Technol. 2017, 5, 64–69. [Google Scholar] [CrossRef] [Green Version]
- Izydorczyk, K.; Carpentier, C.; Mrówczyński, J.; Wagenvoort, A.; Jurczak, T.; Tarczyńska, M. Establishment of an Alert Level Framework for cyanobacteria in drinking water resources by using the Algae Online Analyser for monitoring cyanobacterial chlorophyll a. Water Res. 2009, 43, 989–996. [Google Scholar] [CrossRef] [PubMed]
- Zamyadi, A.; McQuaid, N.; Prévost, M.; Dorner, S. Monitoring of potentially toxic cyanobacteria using an online multi-probe in drinking water sources. J. Environ. Monit. 2012, 14, 579–588. [Google Scholar] [CrossRef]
- Beckler, J.S.; Arutunian, E.; Moore, T.; Currier, B.; Milbrandt, E.; Duncan, S. Coastal Harmful Algae Bloom Monitoring via a Sustainable, Sail-Powered Mobile Platform. Front. Mar. Sci. 2019, 6, 587. [Google Scholar] [CrossRef]
- Naughton, S.; Kavanagh, S.; Lynch, M.; Rowan, N.J. Synchronizing use of sophisticated wet-laboratory and in-field handheld technologies for real-time monitoring of key microalgae, bacteria and physicochemical parameters influencing efficacy of water quality in a freshwater aquaculture recirculation system: A case study from the Republic of Ireland. Aquaculture 2020, 526, 735377. [Google Scholar] [CrossRef]
- Yamahara, K.M.; Demir-Hilton, E.; Preston, C.M.; Marin, R.; Pargett, D.; Roman, B.; Jensen, S.; Birch, J.M.; Boehm, A.B.; Scholin, C.A. Simultaneous monitoring of faecal indicators and harmful algae using an in-situ autonomous sensor. Lett. Appl. Microbiol. 2015, 61, 130–138. [Google Scholar] [CrossRef] [Green Version]
- Szczerbińska, N.; Gałczyńska, M. Biological methods used to assess surface water quality. Arch. Pol. Fish. 2015, 23, 185. [Google Scholar] [CrossRef] [Green Version]
- Oshiro, R. USEPA Method 1604: Total Coliforms and Escherichia coli in Water by Membrane Filtration Using a Simultaneous Detection Technique (MI Medium); Environmental Protection Agency: Washington, DC, USA, 2002.
- Simões, J.; Dong, T. Continuous and real-time detection of drinking-water pathogens with a low-cost fluorescent optofluidic sensor. Sensors 2018, 18, 2210. [Google Scholar] [CrossRef] [PubMed] [Green Version]
- Bedell, E.; Sharpe, T.; Purvis, T.; Brown, J.; Thomas, E. Demonstration of tryptophan-like fluorescence sensor concepts for fecal exposure detection in drinkingwater in remote and resource constrained settings. Sustainability 2020, 12, 3768. [Google Scholar] [CrossRef]
- Kumar Gunda, N.S.; Naicker, S.; Shinde, S.; Kimbahune, S.; Shrivastava, S.; Mitra, S. Mobile Water Kit (MWK): A smartphone compatible low-cost water monitoring system for rapid detection of total coliform and E. coli. Anal. Methods 2014, 6, 6236–6246. [Google Scholar] [CrossRef]
- Patil, R.; Levin, S.; Halery, N.; Rajkumar, S.; Gupta, I. A smartphone-based early alert system for screening of coliform contamination in drinking water. J. Microbiol. Biotechnol. Food Sci. 2019, 9, 539–547. [Google Scholar] [CrossRef]
- Tok, S.; De Haan, K.; Tseng, D.; Usanmaz, C.F.; Ceylan Koydemir, H.; Ozcan, A. Early detection of: E. coli and total coliform using an automated, colorimetric and fluorometric fiber optics-based device. Lab. Chip 2019, 19, 2925–2935. [Google Scholar] [CrossRef] [Green Version]
- Huynh, V.; Hausot, A.; Angelescu, D.E. An Autonomous Field Sensor for Total Coliform and E.Coli Monitoring at Remote Sites. In Proceedings of the OCEANS 2016 MTS/IEEE Monterey, OCE 2016, Monterey, CA, USA, 19–23 September 2016. [Google Scholar]
- Grossi, M.; Lazzarini, R.; Lanzoni, M.; Pompei, A.; Matteuzzi, D.; Ricco, B. A portable sensor with disposable electrodes for water bacterial quality assessment. IEEE Sens. J. 2013, 13, 1775–1782. [Google Scholar] [CrossRef]
- Zhang, X.; Jiang, X.; Yang, Q.; Wang, X.; Zhang, Y.; Zhao, J.; Qu, K.; Zhao, C. Online Monitoring of Bacterial Growth with an Electrical Sensor. Anal. Chem. 2018, 90, 6006–6011. [Google Scholar] [CrossRef]
Publisher’s Note: MDPI stays neutral with regard to jurisdictional claims in published maps and institutional affiliations. |
© 2022 by the authors. Licensee MDPI, Basel, Switzerland. This article is an open access article distributed under the terms and conditions of the Creative Commons Attribution (CC BY) license (https://creativecommons.org/licenses/by/4.0/).