
Advances in Technological Research for Online and In Situ Water Quality Monitoring—A Review

 , , and
Abstract
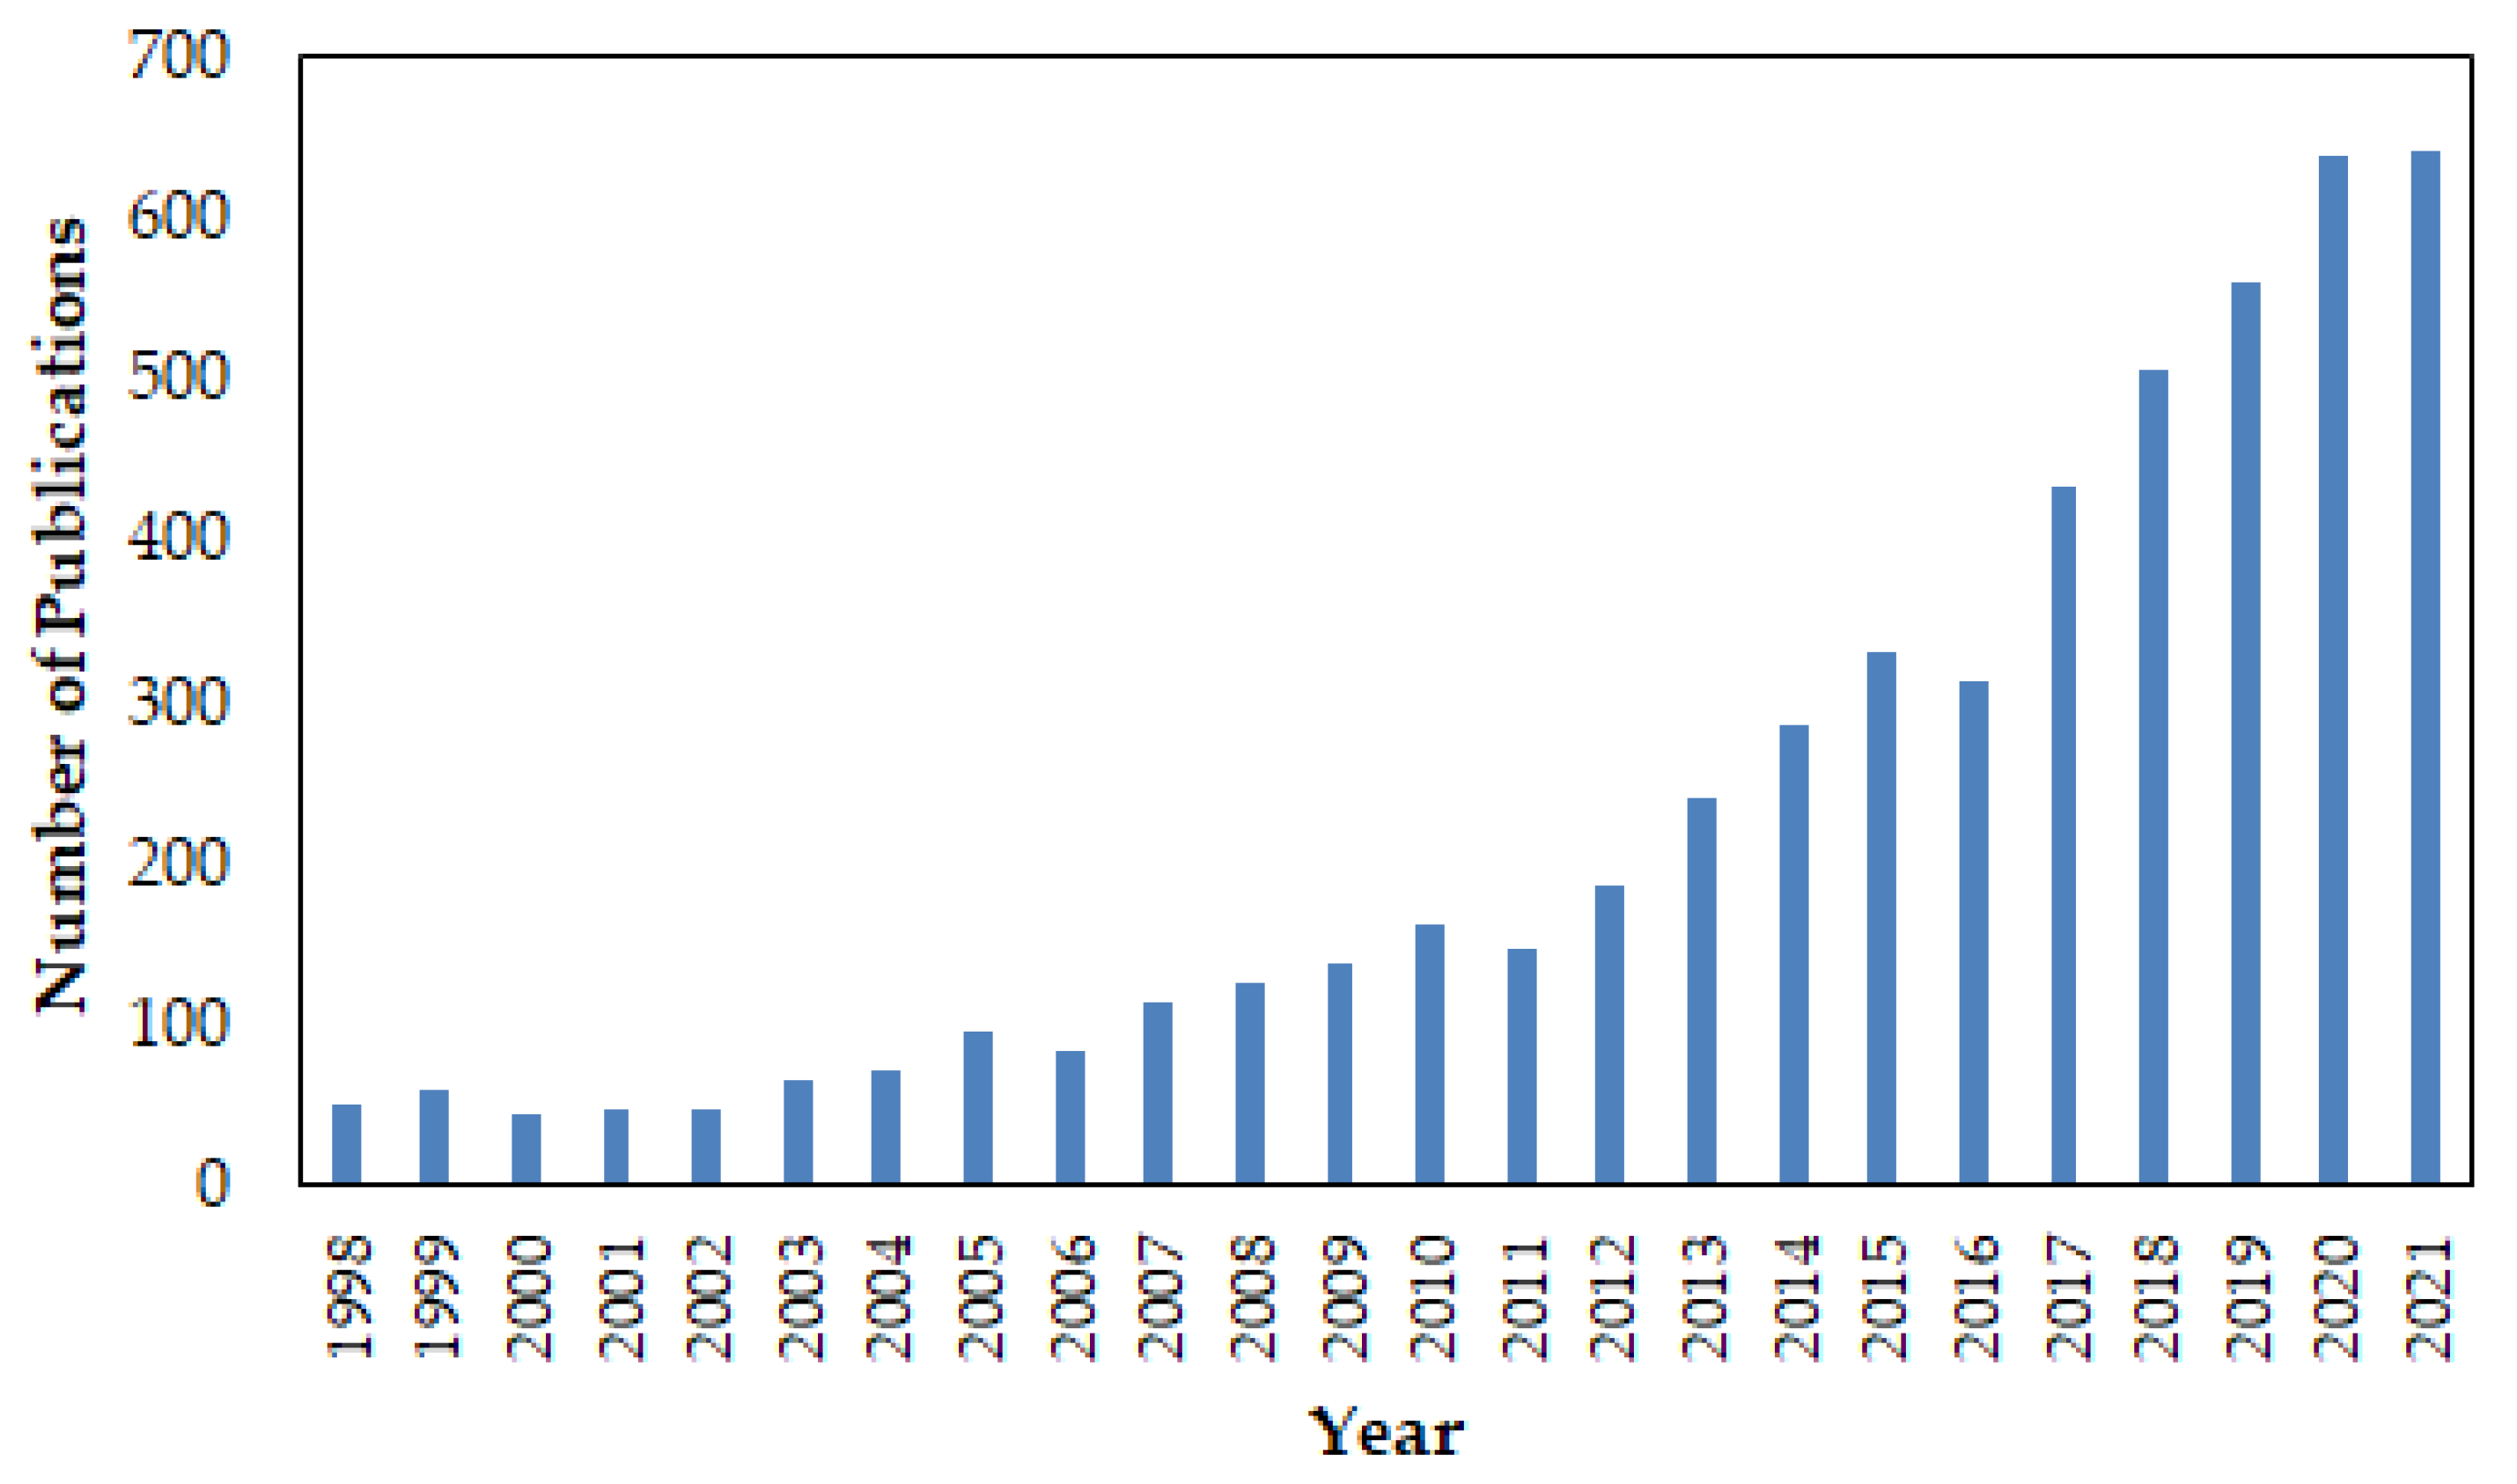
:1. Introduction
2. Water Monitoring Parameters
3. Development of Technologies for Water Quality Monitoring
3.1. Technologies for Physical Monitoring of Water Quality
3.1.1. Color

| Author(s) | Type | Description | Research Findings |
|---|---|---|---|
| Murphy et al. [46] | Optical | Developed a low-cost Optical Colorimetric Sensor (OCS), equipped with telecommunication to assess the transmission of light in water. | The results show strong linear correlations between the signal response and the studied parameters. |
| Yang [47] | Introduced a multi-sensory system to monitor water quality parameters in fish ponds, with Zigbee wireless interface communication. | The system was able to collect water quality parameters and transmit them to the central station host computer, being a tool for fishing pond production management. | |
| Saravanan et al. [49] | Proposed a low-cost system, called Supervisory Control and Data Acquisition (SCADA), to monitor various water quality parameters with remote communication (using a GSM module). | The device was able to measure the selected parameters in drinking water (including color) in real-time and with good accuracy. | |
| George et al. [50] | Developed Mini Secchi Disks, with Forel–Ule color scale stickers used to measure water color and clarity, and a mobile app, called TurbAqua, was developed to facilitate near real-time data transmission. | The study presents a low-cost method for monitoring water quality on a voluntary basis, where the data can be used to validate satellite water quality products and be a tool for decision-makers to improve water issues. |
3.1.2. Temperature
| Author(s) | Type | Description | Research Findings |
|---|---|---|---|
| Alam, Clyne and Deen [56] | Electrical | Developed a temperature sensor fabricated with p-type Si and poly(3,4-ethylenedioxythiophene) polystyrene sulfonate (PEDOT:PSS) film in a Wheatstone bridge configuration. | The results show that the sensor was able to measure temperature between 0 and 50 °C with high sensitivity and low variability. |
| Alam et al. [57] | Presented a sensor-based using poly(3,4-ethylenedioxythiophene) and PEDOT:PSS to measure temperature in water. | The experiments present an accuracy above 85% for temperature sensor measurement. | |
| Wu et al. [55] | Developed a platinum (Pt)-based sensor for temperature measurement integrated into a micro-electro-mechanical system (MEMS). | The Pt thermistor with a three-wire orthogonal structure has a temperature response of 5.95 Ω/°C. | |
| Simic et al. [58] | Used a commercial sensor (LM35) to measure temperature in water. | The results show an accuracy of ±0.25 °C. | |
| Srivastava, Vaddadi and Sadistap [59] | Presented a K-type thermocouple sensor as a low-cost way to measure temperature integrated with a smartphone. | The system presents itself as a low-cost tool for monitoring water quality parameters in several urban locations. | |
| Huang [60] | Optical | A temperature sensor was developed using long-period fiber grating (LPFG). | The sensor can effectively monitor the temperature with a maximum difference of ±1 mm for water level, ±0.005 for refractive index, and 1 °C for temperature. |
| Huang et al. [61] |
3.1.3. Turbidity
| Author(s) | Type | Description | Research Findings |
|---|---|---|---|
| Azman et al. [63] | Optical | Presented a low-cost nephelometric turbidity sensor for the continuous monitoring of water quality and communication using the RS232 module. | The results show that the developed low-cost sensor presented results as a commercial turbidity sensor. |
| Arifin et al. [67] | Developed a polymer optical fiber sensor for measuring turbidity in water. | The experiments provided promising results, with 0.046 µW/NTU and 0.022 NTU resolution for the sensor. | |
| Wang et al. [68] | Presented a low-cost and online monitoring sensor for turbidity using an infrared LED and photodetectors. | The device was able to measure turbidity with high accuracy as a commercial device. | |
| Rahman et al. [69] | Evaluated the performance of an LED-based sensor for measuring turbidity in water. | The use of visible and UV LED was able to measure turbidity between 0 and 1000 NTU. | |
| Schima et al. [70] | Developed an open-source optical system for real-time and turbidity monitoring using detectors in the infrared range of the electromagnetic spectrum. | The developed in situ sensor system showed a very high agreement with the results obtained using a laboratory photometer but with less methodological effort. |
3.2. Technologies for Chemical Monitoring of Water Quality
3.2.1. Chlorine
3.2.2. Dissolved Oxygen (OD)
3.2.3. Fluorine
3.2.4. Metals
3.2.5. Nitrogen
| Author(s) | Type | Description | Research Findings |
|---|---|---|---|
| Akhter et al. [113] | Electrical | Developed an electrochemical sensor using Polydimethylsiloxane as a flexible substrate with multi-walled carbon nanotubes nitrate in water. | The sensor had a difference of 4.91% in relation to the standard method for measuring nitrate. |
| Obrovski et al. [111] | Optical | Used a chemical fiber optic probe based on the HSV model to detect nitrate in water. | The detection limit of this sensor was between 0 and 0.7 mg/L. |
| Ingles, Louw and Booysen [115] | Presented a low-cost, portable sensor that can be used with a smartphone to measure nitrate in water. | The sensor operating range was between 1 and 10 mg/L for nitrate, with a 27% deviation compared to commercial equipment. |
3.2.6. pH
3.2.7. Phosphorus
3.2.8. Oxidation Reduction Potential (ORP)
3.3. Technologies for Biological Monitoring of Water Quality
3.3.1. Algae and Cyanobacteria
3.3.2. Total Coliforms and Escherichia coli
4. Conclusions
Author Contributions
Funding
Institutional Review Board Statement
Informed Consent Statement
Data Availability Statement
Conflicts of Interest
References
- Vigil, K.M. Clean Water: An Introduction to Water Quality and Water Pollution Control, 2nd ed.; Oregon State University Press: Corvallis, OR, USA, 2003; Volume 1, ISBN 9780870718335. [Google Scholar]
- Owa, F.D. Water pollution: Sources, effects, control and management. Mediterr. J. Soc. Sci. 2013, 4, 65. [Google Scholar] [CrossRef]
- Speight, J.G. Sources of Water Pollution. In Natural Water Remediation; Butterworth-Heinemann: Kidlington, UK, 2020. [Google Scholar]
- United Nations. Sustainable Development Goal 6-Synthesis Report on Water and Sanitation; United Nations: New York, NY, USA, 2018. [Google Scholar]
- Behmel, S.; Damour, M.; Ludwig, R.; Rodriguez, M.J. Water quality monitoring strategies—A review and future perspectives. Sci. Total Environ. 2016, 571, 1312–1329. [Google Scholar] [CrossRef] [PubMed]
- Gallaher, S.; Heikkila, T. Challenges and Opportunities for Collecting and Sharing Data on Water Governance Institutions. J. Contemp. Water Res. Educ. 2014, 153, 66–78. [Google Scholar] [CrossRef] [Green Version]
- Tamm, T.; Nõges, T.; Järvet, A.; Bouraoui, F. Contributions of DOC from Surface and Groundflow into Lake Võrtsjärv (Estonia). Hydrobiologia 2008, 599, 213–220. [Google Scholar] [CrossRef]
- Eisenberg, J.N.S.; Bartram, J.; Wade, T.J. The water quality in rio highlights the global public health concern over untreated sewage. Environ. Health Perspect. 2016, 124, A180–A181. [Google Scholar] [CrossRef] [Green Version]
- Hegarty, S.; Hayes, A.; Regan, F.; Bishop, I.; Clinton, R. Using citizen science to understand river water quality while filling data gaps to meet United Nations Sustainable Development Goal 6 objectives. Sci. Total Environ. 2021, 783, 146953. [Google Scholar] [CrossRef]
- San Llorente Capdevila, A.; Kokimova, A.; Sinha Ray, S.; Avellán, T.; Kim, J.; Kirschke, S. Success factors for citizen science projects in water quality monitoring. Sci. Total Environ. 2020, 728, 137843. [Google Scholar] [CrossRef]
- Sarni, W.; White, C.; Webb, R.; Cross, K.; Glotzbach, R. Digital Water: Industry Leaders Chart the Transformation Journey. International Water Association and Xylem Inc. 2019. Available online: https://iwa-network.org/publications/digital-water/ (accessed on 4 February 2022).
- Justino, C.I.L.; Duarte, A.C.; Rocha-Santos, T.A.P. Recent progress in biosensors for environmental monitoring: A review. Sensors 2017, 17, 2918. [Google Scholar] [CrossRef] [Green Version]
- Crocker, J.; Bartram, J. Comparison and cost analysis of drinking water quality monitoring requirements versus practice in seven developing countries. Int. J. Environ. Res. Public Health 2014, 11, 7333–7346. [Google Scholar] [CrossRef]
- Borgia, E. The internet of things vision: Key features, applications and open issues. Comput. Commun. 2014, 54, 1–31. [Google Scholar] [CrossRef]
- Dong, J.; Wang, G.; Yan, H.; Xu, J.; Zhang, X. A survey of smart water quality monitoring system. Environ. Sci. Pollut. Res. 2015, 22, 4893–4906. [Google Scholar] [CrossRef] [PubMed]
- Geetha, S.; Gouthami, S. Internet of things enabled real time water quality monitoring system. Smart Water 2016, 2, 1. [Google Scholar] [CrossRef]
- Curl, J.M.; Nading, T.; Hegger, K.; Barhoumi, A.; Smoczynski, M. Digital Twins: The Next Generation of Water Treatment Technology. J. Am. Water Works Assoc. 2019, 111, 44–50. [Google Scholar] [CrossRef]
- Shafiee, M.E.; Barker, Z.; Rasekh, A. Enhancing water system models by integrating big data. Sustain. Cities Soc. 2018, 37, 485–491. [Google Scholar] [CrossRef]
- Pehme, K.M.; Burlakovs, J.; Kriipsalu, M.; Pilecka, J.; Grinfelde, I.; Tamm, T.; Jani, Y.; Hogland, W. Urban Hydrology Research Fundamentals for Waste Management Practices. In Proceedings of the Research for Rural Development 2019: Annual 25th International Scientific Conference Proceedings, Jelgava, Latvia, 15–17 May 2019; Volume 1. [Google Scholar]
- Hoolohan, C.; Amankwaa, G.; Browne, A.L.; Clear, A.; Holstead, K.; Machen, R.; Michalec, O.; Ward, S. Resocializing digital water transformations: Outlining social science perspectives on the digital water journey. Wiley Interdiscip. Rev. Water 2021, 8, e1512. [Google Scholar] [CrossRef]
- Brasil, J.; Macedo, M.; Lago, C.; Oliveira, T.; Júnior, M.; Oliveira, T.; Mendiondo, E. Nature-based solutions and real-time control: Challenges and opportunities. Water 2021, 13, 651. [Google Scholar] [CrossRef]
- Boyd, C.E. Water Quality an Introduction, 3rd ed.; Springer: Berlin/Heidelberg, Germany, 2020; ISBN 9783319705484. [Google Scholar]
- Alley, E.R. Water Quality Control Handbook, 2nd ed.; McGraw-Hill: New York, NY, USA, 2007; ISBN 0071508708. [Google Scholar]
- Alam, M.J.B.; Islam, M.R.; Muyen, Z.; Mamun, M.; Islam, S. Water quality parameters along rivers. Int. J. Environ. Sci. Technol. 2007, 4, 159–167. [Google Scholar] [CrossRef] [Green Version]
- Rahman, A.; Bakri, D. Al A Study on Selected Water Quality Parameters along the River Buriganga, Bangladesh. Iran. J. Energy Environ. 2006, 1, 81–92. [Google Scholar]
- Mohamed, I.; Othman, F.; Ibrahim, A.I.N.; Alaa-Eldin, M.E.; Yunus, R.M. Assessment of water quality parameters using multivariate analysis for Klang River basin, Malaysia. Environ. Monit. Assess. 2015, 187, 4182. [Google Scholar] [CrossRef]
- Rahmanian, N.; Ali, S.H.B.; Homayoonfard, M.; Ali, N.J.; Rehan, M.; Sadef, Y.; Nizami, A.S. Analysis of physiochemical parameters to evaluate the drinking water quality in the state of perak, Malaysia. J. Chem. 2015, 2015, 716125. [Google Scholar] [CrossRef] [Green Version]
- World Health Organization. Guidelines for Drinking-Water Quality, 4th ed.; Library Cataloguing-in-Publication Data: Geneva, Switzerland, 2011; Volume 1. [Google Scholar]
- Spellman, F.R. The Drinking Water Handbook, 3rd ed.; CRC Press: Boca Raton, FL, USA, 2017. [Google Scholar]
- Cotruvo, J. Drinking Water Quality and Contaminants Guidebook; CRC Press: Boca Raton, FL, USA, 2018. [Google Scholar] [CrossRef]
- Omer, N.H. Water Quality Parameters-Science, Assessments and Policy; Summers, K., Ed.; IntechOpen: London, UK, 2019. [Google Scholar]
- FAO. Fishery Harbour Manual on the Prevention of Pollution; FAO: Rome, Italy, 2014. [Google Scholar]
- Medema, G.J.; Payment, P.; Dufour, A.; Robertson, W.; Waite, M.; Hunter, P.; Kirby, R.; Andersson, Y. Safe drinking water: An ongoing challenge. In Assessing Microbial Safety of Drinking Water: Improving Approaches and Methods; IWA Publishing: London, UK, 2003; Volume 11. [Google Scholar]
- Zulkifli, S.N.; Rahim, H.A.; Lau, W.J. Detection of contaminants in water supply: A review on state-of-the-art monitoring technologies and their applications. Sens. Actuators B Chem. 2018, 255, 2657–2689. [Google Scholar] [CrossRef] [PubMed]
- Hambrook Berkman, J.A.; Canova, M.G. Algal Biomass Indicators; USGS TWRI B. 9 Biol. Indic.; USGS: Washington, DC, USA, 2007.
- Pal, A.; He, Y.; Jekel, M.; Reinhard, M.; Gin, K.Y.H. Emerging contaminants of public health significance as water quality indicator compounds in the urban water cycle. Environ. Int. 2014, 71, 46–62. [Google Scholar] [CrossRef] [PubMed]
- Wang, J.; Wu, J. Occurrence and potential risks of harmful algal blooms in the East China Sea. Sci. Total Environ. 2009, 407, 4012–4021. [Google Scholar] [CrossRef] [PubMed]
- Schaap, A.; Rohrlack, T.; Bellouard, Y. Lab on a chip technologies for algae detection: A review. J. Biophotonics 2012, 5, 661–672. [Google Scholar] [CrossRef]
- Uddin, M.G.; Nash, S.; Olbert, A.I. A review of water quality index models and their use for assessing surface water quality. Ecol. Indic. 2021, 122, 107218. [Google Scholar] [CrossRef]
- Lumb, A.; Sharma, T.C.; Bibeault, J.-F. A Review of Genesis and Evolution of Water Quality Index (WQI) and Some Future Directions. Water Qual. Expo. Health 2011, 3, 11–24. [Google Scholar] [CrossRef]
- Kachroud, M.; Trolard, F.; Kefi, M.; Jebari, S.; Bourrié, G. Water quality indices: Challenges and application limits in the literature. Water 2019, 11, 361. [Google Scholar] [CrossRef] [Green Version]
- Tyagi, S.; Sharma, B.; Singh, P.; Dobhal, R. Water Quality Assessment in Terms of Water Quality Index. Am. J. Water Resour. 2020, 1, 3. [Google Scholar] [CrossRef]
- Alberti, G.; Zanoni, C.; Magnaghi, L.R.; Biesuz, R. Disposable and low-cost colorimetric sensors for environmental analysis. Int. J. Environ. Res. Public Health 2020, 17, 8331. [Google Scholar] [CrossRef]
- Rainbow, J.; Sedlackova, E.; Jiang, S.; Maxted, G.; Moschou, D.; Richtera, L.; Estrela, P. Integrated electrochemical biosensors for detection of waterborne pathogens in low-resource settings. Biosensors 2020, 10, 36. [Google Scholar] [CrossRef] [Green Version]
- Edwards, H.O. An instrument for the measurement of colour and turbidity in natural waters. Water Sci. Technol. 1998, 37, 263–267. [Google Scholar] [CrossRef]
- Murphy, K.; Heery, B.; Sullivan, T.; Zhang, D.; Paludetti, L.; Lau, K.T.; Diamond, D.; Costa, E.; O’Connor, N.; Regan, F. A low-cost autonomous optical sensor for water quality monitoring. Talanta 2015, 132, 520–527. [Google Scholar] [CrossRef] [PubMed]
- Yang, Y. Water Quality Monitoring and Control for Fish Pond Based on Wireless Sensor Network. In Proceedings of the Automation, Mechanical and Electrical Engineering, Beijing, China, 19–20 August 2014; Volume 1. [Google Scholar]
- Haque, H.; Labeeb, K.; Riha, R.B.; Khan, M.N.R. IoT Based Water Quality Monitoring System by Using Zigbee Protocol. In Proceedings of the 2021 International Conference on Emerging Smart Computing and Informatics (ESCI), Pune, India, 5–7 March 2021. [Google Scholar]
- Saravanan, K.; Anusuya, E.; Kumar, R.; Son, L.H. Real-time water quality monitoring using Internet of Things in SCADA. Environ. Monit. Assess. 2018, 190, 556. [Google Scholar] [CrossRef] [PubMed]
- George, G.; Menon, N.N.; Abdulaziz, A.; Brewin, R.J.W.; Pranav, P.; Gopalakrishnan, A.; Mini, K.G.; Kuriakose, S.; Sathyendranath, S.; Platt, T. Citizen Scientists Contribute to Real-Time Monitoring of Lake Water Quality Using 3D Printed Mini Secchi Disks. Front. Water 2021, 3, 662142. [Google Scholar] [CrossRef]
- Martínez-Máñez, R.; Soto, J.; García-Breijo, E.; Gil, L.; Ibáñez, J.; Gadea, E. A multisensor in thick-film technology for water quality control. Sens. Actuators A Phys. 2005, 120, 589–595. [Google Scholar] [CrossRef]
- Qin, Y.; Kwon, H.J.; Howlader, M.M.R.; Deen, M.J. Microfabricated electrochemical pH and free chlorine sensors for water quality monitoring: Recent advances and research challenges. RSC Adv. 2015, 5, 69086–69109. [Google Scholar] [CrossRef]
- Zhou, B.; Bian, C.; Tong, J.; Xia, S. Fabrication of a miniature multi-parameter sensor chip for water quality assessment. Sensors 2017, 17, 157. [Google Scholar] [CrossRef] [Green Version]
- Childs, P.R.N.; Greenwood, J.R.; Long, C.A. Review of temperature measurement. Rev. Sci. Instrum. 2000, 71, 2959–2978. [Google Scholar] [CrossRef] [Green Version]
- Wu, Z.; Wang, J.; Bian, C.; Tong, J.; Xia, S. A MEMS-based multi-parameter integrated chip and its portable system forwater quality detection. Micromachines 2020, 11, 63. [Google Scholar] [CrossRef] [Green Version]
- Alam, A.U.; Clyne, D.; Deen, M.J. A low-cost multi-parameter water quality monitoring system. Sensors 2021, 21, 3775. [Google Scholar] [CrossRef]
- Alam, A.U.; Clyne, D.; Jin, H.; Hu, N.X.; Deen, M.J. Fully Integrated, Simple, and Low-Cost Electrochemical Sensor Array for in Situ Water Quality Monitoring. ACS Sens. 2020, 5, 412–422. [Google Scholar] [CrossRef] [PubMed]
- Simic, M.; Stojanovic, G.M.; Manjakkal, L.; Zaraska, K. Multi-Sensor System for Remote Environmental (Air and Water) Quality Monitoring. In Proceedings of the 24th Telecommunications Forum, TELFOR 2016, Belgrade, Serbia, 22–23 November 2016. [Google Scholar]
- Srivastava, S.; Vaddadi, S.; Sadistap, S. Smartphone-based System for water quality analysis. Appl. Water Sci. 2018, 8, 130. [Google Scholar] [CrossRef] [Green Version]
- Huang, Y. Fiber Optic Sensing System for in-Situ Simultaneous Monitoring of Water Stage, Quality, and Temperature. In Proceedings of the Sensors and Smart Structures Technologies for Civil, Mechanical, and Aerospace Systems, San Diego, CA, USA, 9–13 March 2014; Lynch, J.P., Wang, K.-W., Sohn, H., Eds.; SPIE: San Diego, CA, USA, 2014; Volume 9061. [Google Scholar]
- Huang, Y.; Chen, B.; Chen, G.; Xiao, H.; Khan, S.U. Simultaneous detection of liquid level and refractive index with a long-period fiber grating based sensor device. Meas. Sci. Technol. 2013, 24, 095303. [Google Scholar] [CrossRef] [Green Version]
- Von Sperling, M. Introdução à Qualidade das Águas e ao Tratamento de Esgotos, 4th ed.; Departamento de Engenharia Sanitária e Ambiental (DESA), Universidade Federal de Minas Gerais (UFMG): Belo Horizonte, Brazil, 2014; ISBN 9788570411143. [Google Scholar]
- Azman, A.A.; Rahiman, M.H.F.; Taib, M.N.; Sidek, N.H.; Abu Bakar, I.A.; Ali, M.F. A Low Cost Nephelometric Turbidity Sensor for Continual Domestic Water Quality Monitoring System. In Proceedings of the 2016 IEEE International Conference on Automatic Control and Intelligent Systems, I2CACIS 2016, Selangor, Malaysia, 22 October 2016. [Google Scholar]
- Lambrou, T.P.; Anastasiou, C.C.; Panayiotou, C.G.; Polycarpou, M.M. A low-cost sensor network for real-time monitoring and contamination detection in drinking water distribution systems. IEEE Sens. J. 2014, 14, 2765–2772. [Google Scholar] [CrossRef]
- Samijayani, O.N.; Sulistya, F.G.; Wulansari, M.T.; Mujadin, A.; Rahmatia, S. Wireless sensor network for pH and turbidity of river water monitoring. AIP Conf. Proc. 2018, 2043, 020019. [Google Scholar]
- Chowdury, M.S.U.; Emran, T.B.i.n.; Ghosh, S.; Pathak, A.; Alam, M.M.; Absar, N.; Andersson, K.; Hossain, M.S. IoT based real-time river water quality monitoring system. Procedia Comput. Sci. 2019, 155, 161–168. [Google Scholar] [CrossRef]
- Arifin, A.; Irwan, I.; Abdullah, B.; Tahir, D. Design of Sensor Water Turbidity Based on Polymer Optical Fiber. In Proceedings of the 2017 International Seminar on Sensor, Instrumentation, Measurement and Metrology: Innovation for the Advancement and Competitiveness of the Nation, ISSIMM 2017, Surabaya, Indonesia, 25–26 August 2017; Volume 2017. [Google Scholar]
- Wang, Y.; Rajib, S.M.S.M.; Collins, C.; Grieve, B. Low-Cost Turbidity Sensor for Low-Power Wireless Monitoring of Fresh-Water Courses. IEEE Sens. J. 2018, 18, 4689–4696. [Google Scholar] [CrossRef] [Green Version]
- Abd Rahman, M.F.; Samah, A.H.A.; Ahmad, K.A.; Boudville, R.; Yahaya, S.Z. Performance Evaluation of LED Based Sensor for Water Turbidity Measurement. In Proceedings of the International Conference on Sensing Technology, ICST, Sydney, Australia, 2–4 December 2019; Volume 2018. [Google Scholar]
- Schima, R.; Krüger, S.; Bumberger, J.; Paschen, M.; Dietrich, P.; Goblirsch, T. Mobile monitoring—open-source based optical sensor system for service-oriented turbidity and dissolved organic matter monitoring. Front. Earth Sci. 2019, 7, 184. [Google Scholar] [CrossRef] [Green Version]
- Di Bernardo, L.; Dantas, Â.D.B. Métodos e técnicas de tratamento de água. Eng. Sanit. Ambient. 2006, 11, 107. [Google Scholar] [CrossRef] [Green Version]
- Cassidy, C.S.; Matthews, L.R.; Church, K.H.; Taylor, R.M.; Teague, K.A. In Situ Chlorine Detection by Ultraviolet Absorption Spectroscopy. In Proceedings of the Midwest Symposium on Circuits and Systems, Tulsa, OK, USA, 4–7 August 2002; Volume 2. [Google Scholar]
- Hall, J.; Zaffiro, A.D.; Marx, R.B.; Kefauver, P.C.; Radha Krishnan, E.; Haught, R.C.; Herrmann, J.G. On-line water quality parameters as indicators of distribution system contamination. J. Am. Water Work. Assoc. 2007, 99, 66–77. [Google Scholar] [CrossRef]
- Gimenez-Gomez, P.; Escude-Pujol, R.; Jimenez-Jorquera, C.; Gutierrez-Capitan, M. Multisensor Portable Meter for Environmental Applications. IEEE Sens. J. 2015, 15, 6517–6523. [Google Scholar] [CrossRef]
- Cui, L.; Qiu, M.; Fan, H.; Wang, L.; Zhao, S.; Du, J. Design and Research of Water Quality Monitoring System Based on nRF24L01 Wireless Communication. Proc. IOP Conf. Ser. Earth Environ. Sci. 2018, 208, 012074. [Google Scholar] [CrossRef]
- Yen, Y.K.; Lee, K.Y.; Lin, C.Y.; Zhang, S.T.; Wang, C.W.; Liu, T.Y. Portable Nanohybrid Paper-Based Chemiresistive Sensor for Free Chlorine Detection. ACS Omega 2020, 5, 25209–25215. [Google Scholar] [CrossRef] [PubMed]
- Alam, A.U.; Clyne, D.; Lush, W.; Deen, M.J. A reusable, reagent-less free chlorine sensor using gold thin film electrode. Analyst 2021, 146, 2626–2631. [Google Scholar] [CrossRef]
- Hou, Z.S.; Wen, H.S.; Li, J.F.; He, F.; Li, Y.; Qi, X. Environmental hypoxia causes growth retardation, osteoclast differentiation and calcium dyshomeostasis in juvenile rainbow trout (Oncorhynchus mykiss). Sci. Total Environ. 2020, 705, 135272. [Google Scholar] [CrossRef]
- Hsu, L.; Selvaganapathy, P.R.; Brash, J.; Fang, Q.; Xu, C.Q.; Deen, M.J.; Chen, H. Development of a low-cost hemin-based dissolved oxygen sensor with anti-biofouling coating for water monitoring. IEEE Sens. J. 2014, 14, 3400–3407. [Google Scholar] [CrossRef]
- Wei, Y.; Jiao, Y.; An, D.; Li, D.; Li, W.; Wei, Q. Review of dissolved oxygen detection technology: From laboratory analysis to online intelligent detection. Sensors 2019, 19, 3995. [Google Scholar] [CrossRef] [Green Version]
- Wang, Q.; Zhang, J.M.; Li, S. Minreview: Recent advances in the development of gaseous and dissolved oxygen sensors. Instrum. Sci. Technol. 2019, 47, 19–50. [Google Scholar] [CrossRef]
- Liu, S. Design for Fishery Water Environment Monitoring System Based on IOT. In Proceedings of the 2nd International Conference on Electronics, Network and Computer Engineering (ICENCE 2016), Yinchuan, China, 13–14 August 2016. [Google Scholar]
- Luo, H.P.; Li, G.L.; Peng, W.F.; Song, J.; Bai, Q.W. Real-time remote monitoring system for aquaculture water quality. Int. J. Agric. Biol. Eng. 2015, 8, 136–143. [Google Scholar] [CrossRef]
- Vijayakumar, N.; Ramya, R. The Real Time Monitoring of Water Quality in IoT Environment. In Proceedings of the ICIIECS 2015—2015 IEEE International Conference on Innovations in Information, Embedded and Communication Systems, Coimbatore, India, 19–20 March 2015. [Google Scholar]
- He, Y. Design of Water Quality Monitoring Platform Based on Embedded System. IOP Conf. Ser. Earth Environ. Sci. 2021, 631, 012020. [Google Scholar] [CrossRef]
- Lee, J.H.; Lim, T.S.; Seo, Y.; Bishop, P.L.; Papautsky, I. Needle-type dissolved oxygen microelectrode array sensors for in situ measurements. Sens. Actuators B Chem. 2007, 128, 179–185. [Google Scholar] [CrossRef]
- Penso, C.M.; Rocha, J.L.; Martins, M.S.; Sousa, P.J.; Pinto, V.C.; Minas, G.; Silva, M.M.; Goncalves, L.M. PtOEP–PDMS-based optical oxygen sensor. Sensors 2021, 21, 5645. [Google Scholar] [CrossRef] [PubMed]
- Mahoney, E.J.; Hsu, H.H.L.; Du, F.; Xiong, B.; Selvaganapathy, P.R.; Fang, Q. Optofluidic Dissolved Oxygen Sensing with Sensitivity Enhancement Through Multiple Reflections. IEEE Sens. J. 2019, 19, 10452–10460. [Google Scholar] [CrossRef]
- Fu, M.; Wu, X.; He, J.; Zhang, Y.; Hua, S. Natrium fluoride influences methylation modifications and induces apoptosis in mouse early embryos. Environ. Sci. Technol. 2014, 48, 10398–10405. [Google Scholar] [CrossRef] [PubMed]
- Moradi, V.; Caws, E.A.; Wild, P.M.; Buckley, H.L. A simple method for detection of low concentrations of fluoride in drinking water. Sens. Actuators A Phys. 2020, 303, 111684. [Google Scholar] [CrossRef]
- American Public Health Association. Standard Methods for the Examination of Water and Wastewater; APHA: Washington, DC, USA, 2005; Volume 541, ISBN 9780875532356. [Google Scholar]
- Jadhav, M.S.; Laxmeshwar, L.S.; Akki, J.F.; Raikar, P.U.; Kumar, J.; Prakash, O.; Raikar, U.S. Fluoride contamination sensor based on optical fiber grating technology. Opt. Fiber Technol. 2017, 38, 136–141. [Google Scholar] [CrossRef]
- Levin, S.; Krishnan, S.; Rajkumar, S.; Halery, N.; Balkunde, P. Monitoring of fluoride in water samples using a smartphone. Sci. Total Environ. 2016, 551–552, 101–107. [Google Scholar] [CrossRef] [Green Version]
- Mukherjee, S.; Shah, M.; Chaudhari, K.; Jana, A.; Sudhakar, C.; Srikrishnarka, P.; Islam, M.R.; Philip, L.; Pradeep, T. Smartphone-based Fluoride-specific Sensor for Rapid and Affordable Colorimetric Detection and Precise Quantification at Sub-ppm Levels for Field Applications. ACS Omega 2020, 5, 25253–25263. [Google Scholar] [CrossRef]
- Ogoyi, D.O.; Mwita, C.J.; Nguu, E.K.; Shiundu, P.M. Determination of Heavy Metal Content in Water, Sediment and Microalgae from Lake Victoria, East Africa. Open Environ. Eng. J. 2011, 4, 156–161. [Google Scholar] [CrossRef] [Green Version]
- Sibal, L.N.; Espino, M.P.B. Heavy metals in lake water: A review on occurrence and analytical determination. Int. J. Environ. Anal. Chem. 2018, 98, 536–554. [Google Scholar] [CrossRef]
- Linnik, P.M.; Zubenko, I.B. Role of bottom sediments in the secondary pollution of aquatic environments by heavy-metal compounds. Lakes Reserv. Res. Manag. 2000, 5, 11–21. [Google Scholar] [CrossRef]
- Hamilton, J.W.; Kaltreider, R.C.; Bajenova, O.V.; Ihnat, M.A.; McCaffrey, J.; Turpie, B.W.; Rowell, E.E.; Oh, J.; Nemeth, M.J.; Pesce, C.A.; et al. Molecular basis for effects of carcinogenic heavy metals on inducible gene expression. Environ. Health Perspect. 1998, 106, 1005–1015. [Google Scholar] [PubMed] [Green Version]
- Partanen, T.; Heikkila, P.; Hernberg, S.; Kauppinen, T.; Moneta, G.; Ojajarvi, A. Renal cell cancer and occupational exposure to chemical agents. Scand. J. Work. Environ. Health 1991, 17, 231–239. [Google Scholar] [CrossRef] [PubMed]
- Valko, M.; Morris, H.; Cronin, M. Metals, Toxicity and Oxidative Stress. Curr. Med. Chem. 2005, 12, 1161–1208. [Google Scholar] [CrossRef] [Green Version]
- Garciá-Miranda Ferrari, A.; Carrington, P.; Rowley-Neale, S.J.; Banks, C.E. Recent advances in portable heavy metal electrochemical sensing platforms. Environ. Sci. Water Res. Technol. 2020, 6, 2676–2690. [Google Scholar] [CrossRef]
- Gumpu, M.B.; Sethuraman, S.; Krishnan, U.M.; Rayappan, J.B.B. A review on detection of heavy metal ions in water—An electrochemical approach. Sens. Actuators B Chem. 2015, 213, 515–533. [Google Scholar] [CrossRef]
- de Oliveira, H.J.S.; de Almeida, P.L.; Sampaio, B.A.; Fernandes, J.P.A.; Pessoa-Neto, O.D.; de Lima, E.A.; de Almeida, L.F. A handheld smartphone-controlled spectrophotometer based on hue to wavelength conversion for molecular absorption and emission measurements. Sens. Actuators B Chem. 2017, 238, 1084–1091. [Google Scholar] [CrossRef]
- Zhou, S.; Yuan, Z.; Cheng, Q.; Zhang, Z.; Yang, J. Rapid in situ determination of heavy metal concentrations in polluted water via portable XRF: Using Cu and Pb as example. Environ. Pollut. 2018, 243, 1325–1333. [Google Scholar] [CrossRef]
- Srivastava, S.; Sharma, V. Ultra-portable, smartphone-based spectrometer for heavy metal concentration measurement in drinking water samples. Appl. Water Sci. 2021, 11, 177. [Google Scholar] [CrossRef]
- Wang, Y.; Xu, Y.; Jiang, J.; Li, Y.; Tong, J.; Bian, C. A portable sensor system with ultramicro electrode chip for the detection of heavy-metal ions in water. Micromachines 2021, 12, 1468. [Google Scholar] [CrossRef]
- Yen, Y.K.; Lai, C.Y. Portable real-time detection of Pb (II) using a CMOS MEMS-based nanomechanical sensing array modified with PEDOT:PSS. Nanomaterials 2020, 10, 2454. [Google Scholar] [CrossRef] [PubMed]
- Li, Z.; Xu, D.; Zhang, D.; Yamaguchi, Y. A portable instrument for on-site detection of heavy metal ions in water. Anal. Bioanal. Chem. 2021, 413, 3471–3477. [Google Scholar] [CrossRef] [PubMed]
- Sohail, M.; Adeloju, S.B. Nitrate biosensors and biological methods for nitrate determination. Talanta 2016, 153, 83–98. [Google Scholar] [CrossRef] [PubMed]
- Yi, K.; Wang, D.; Yang, Q.; Li, X.; Chen, H.; Sun, J.; An, H.; Wang, L.; Deng, Y.; Liu, J.; et al. Effect of ciprofloxacin on biological nitrogen and phosphorus removal from wastewater. Sci. Total Environ. 2017, 605–606, 368–375. [Google Scholar] [CrossRef]
- Obrovski, B.B.; Bajić, J.S.; Mihajlović, I.J.; Vojinović Miloradov, M.B.; Batinić, B.D.; Živanov, M.B. Colorimetric fiber optic probe for measurement of chemical parameters in surface water. Sens. Actuators B Chem. 2016, 228, 168–173. [Google Scholar] [CrossRef]
- Ouni, L.; Ramazani, A.; Taghavi Fardood, S. An overview of carbon nanotubes role in heavy metals removal from wastewater. Front. Chem. Sci. Eng. 2019, 13, 274–295. [Google Scholar] [CrossRef]
- Akhter, F.; Siddiquei, H.R.; Alahi, M.E.E.; Mukhopadhyay, S.C. An IoT-enabled portable sensing system with MWCNTs/PDMS sensor for nitrate detection in water. Meas. J. Int. Meas. Confed. 2021, 178, 109424. [Google Scholar] [CrossRef]
- Wu, N.; Khan, M. LoRa-based Internet-of-Things: A Water Quality Monitoring System. In Proceedings of the IEEE SOUTHEASTCON, Huntsville, AL, USA, 11–14 April 2019; Volume 2019. [Google Scholar]
- Ingles, J.M.D.F.P.; Louw, T.M.; Booysen, M.J. Water quality assessment using a portable uv optical absorbance nitrate sensor with a scintillator and smartphone camera. Water SA 2021, 47, 135–140. [Google Scholar] [CrossRef]
- Drolc, A.; Vrtovšek, J. Nitrate and nitrite nitrogen determination in waste water using on-line UV spectrometric method. Bioresour. Technol. 2010, 101, 4228–4233. [Google Scholar] [CrossRef]
- Karlsson, M.; Karlberg, B.; Olsson, R.J.O. Determination of nitrate in municipal waste water by UV spectroscopy. Anal. Chim. Acta 1995, 312, 107–113. [Google Scholar] [CrossRef]
- Da Silva, V.A.O.P.; de Freitas, R.C.; de Oliveira, P.R.; Moreira, R.C.; Marcolino-Júnior, L.H.; Bergamini, M.F.; Coltro, W.K.T.; Janegitz, B.C. Microfluidic paper-based device integrated with smartphone for point-of-use colorimetric monitoring of water quality index. Meas. J. Int. Meas. Confed. 2020, 164, 108085. [Google Scholar] [CrossRef]
- Dutta, S.; Sarma, D.; Nath, P. Ground and river water quality monitoring using a smartphone-based pH sensor. AIP Adv. 2015, 5, 057151. [Google Scholar] [CrossRef]
- Hossain, M.A.; Canning, J.; Ast, S.; Rutledge, P.J.; Jamalipour, A. Early warning smartphone diagnostics for water security and analysis using real-time pH mapping. Photonic Sens. 2015, 5, 289–297. [Google Scholar] [CrossRef] [Green Version]
- Xie, C.; Xu, J.; Tang, J.; Baig, S.A.; Xu, X. Comparison of Phosphorus Determination Methods by Ion Chromatography and Molybdenum Blue Methods. Commun. Soil Sci. Plant Anal. 2013, 44, 2535–2545. [Google Scholar] [CrossRef]
- Elser, J.J. Phosphorus: A limiting nutrient for humanity? Curr. Opin. Biotechnol. 2012, 23, 833–838. [Google Scholar] [CrossRef]
- Korostynska, O.; Mason, A.; Al-Shamma’a, A. Monitoring of nitrates and phosphates in wastewater: Current technologies and further challenges. Int. J. Smart Sens. Intell. Syst. 2012, 5, 149–176. [Google Scholar] [CrossRef] [Green Version]
- Mainstone, C.P.; Parr, W. Phosphorus in rivers-Ecology and management. Sci. Total Environ. 2002, 282–283, 25–47. [Google Scholar] [CrossRef]
- Jarvie, H.P.; Withers, J.A.; Neal, C. Review of robust measurement of phosphorus in river water: Sampling, storage, fractionation and sensitivity. Hydrol. Earth Syst. Sci. 2002, 6, 113–131. [Google Scholar] [CrossRef] [Green Version]
- Berchmans, S.; Issa, T.B.; Singh, P. Determination of inorganic phosphate by electroanalytical methods: A review. Anal. Chim. Acta 2012, 729, 7–20. [Google Scholar] [CrossRef] [Green Version]
- Kalkhajeh, Y.K.; Amiri, B.J.; Huang, B.; Khalyani, A.H.; Hu, W.; Gao, H.; Thompson, M.L. Methods for sample collection, storage, and analysis of freshwater phosphorus. Water 2019, 11, 1889. [Google Scholar] [CrossRef] [Green Version]
- Worsfold, P.; McKelvie, I.; Monbet, P. Determination of phosphorus in natural waters: A historical review. Anal. Chim. Acta 2016, 918, 8–20. [Google Scholar] [CrossRef] [PubMed] [Green Version]
- Chen, H.; Zhao, L.; Yu, F.; Du, Q. Detection of phosphorus species in water: Technology and strategies. Analyst 2019, 144, 7130–7148. [Google Scholar] [CrossRef] [PubMed]
- Lin, B.; Xu, J.; Lin, K.; Li, M.; Lu, M. Low-Cost Automatic Sensor for in Situ Colorimetric Detection of Phosphate and Nitrite in Agricultural Water. ACS Sens. 2018, 3, 2541–2549. [Google Scholar] [CrossRef] [PubMed]
- Akhter, F.; Siddiquei, H.R.; Alahi, M.E.E.; Mukhopadhyay, S.C. Design and development of an IoT-enabled portable phosphate detection system in water for smart agriculture. Sens. Actuators A Phys. 2021, 330, 112861. [Google Scholar] [CrossRef]
- Suslow, T.V. Oxidation-Reduction Potential (ORP) for Water Disinfection Monitoring, Control, and Documentation; University of California: Berkley, CA, USA, 2004. [Google Scholar]
- Copeland, A.; Lytle, D.A. Measuring the oxidation-reduction potential of important oxidants in drinking water. J. Am. Water Works Assoc. 2014, 106, E10–E20. [Google Scholar] [CrossRef]
- Qasem, F.; Susilo, T.B.; Said, S.; Alarbash, Z.; Hasan, M.; Jabakhanji, B.; Beyrouthy, T.; Alkork, S. Preliminary Engineering Implementation on Multisensory Underwater Remotely Operated Vehicle (rov) for Oil Spills Surveillance. In Proceedings of the BioSMART 2019-Proceedings: 3rd International Conference on Bio-Engineering for Smart Technologies, Paris, France, 24–26 April 2019. [Google Scholar]
- Dejus, S.; Nescerecka, A.; Kurcalts, G.; Juhna, T. Detection of drinking water contamination event with Mahalanobis distance method, using on-line monitoring sensors and manual measurement data. Water Sci. Technol. Water Supply 2018, 18, 2133–2141. [Google Scholar] [CrossRef]
- Helmi, A.H.M.A.; Hafiz, M.M.; Rizam, M.S.B.S. Mobile Buoy for Real Time Monitoring and Assessment of Water Quality. In Proceedings of the Proceedings—2014 IEEE Conference on System, Process and Control, ICSPC 2014, Kuala Lumpur, Malaysia, 12–14 December 2014. [Google Scholar]
- Siyang, S.; Kerdcharoen, T. Development of Unmanned Surface Vehicle for Smart WATER quality Inspector. In Proceedings of the 2016 13th International Conference on Electrical Engineering/Electronics, Computer, Telecommunications and Information Technology, ECTI-CON 2016, Chiang Mai, Thailand, 28 June–1 July 2016. [Google Scholar]
- Khatri, P.; Gupta, K.K.; Gupta, R.K.; Panchariya, P.C. Towards the Green Analytics: Design and Development of Sustainable Drinking Water Quality Monitoring System for Shekhawati Region in Rajasthan. Mapan J. Metrol. Soc. India 2021, 36, 843–857. [Google Scholar] [CrossRef]
- Ilie, A.M.C.; Vaccaro, C.; Rogeiro, J.; Leitao, T.E.; Martins, T. Configuration, Programming and Implementation of 3 Smart Water Network Wireless Sensor Nodes for Assessing the Water Quality. In Proceedings of the 2017 IEEE SmartWorld, Ubiquitous Intelligence & Computing, Advanced & Trusted Computed, Scalable Computing & Communications, Cloud & Big Data Computing, Internet of People and Smart City Innovation (SmartWorld/SCALCOM/UIC/ATC/CBDCom/IOP/SCI), San Francisco, CA, USA, 4–8 August 2017; pp. 1–8. [Google Scholar]
- Lee, J.H.; Jang, A.; Bhadri, P.R.; Myers, R.R.; Timmons, W.; Beyette, F.R.; Bishop, P.L.; Papautsky, I. Fabrication of microelectrode arrays for in situ sensing of oxidation reduction potentials. Sens. Actuators B Chem. 2006, 115, 220–226. [Google Scholar] [CrossRef]
- Jang, A.; Lee, J.H.; Bhadri, P.R.; Kumar, S.A.; Timmons, W.; Beyette, F.R.; Papautsky, I.; Bishop, P.L. Miniaturized redox potential probe for in situ environmental monitoring. Environ. Sci. Technol. 2005, 39, 6191–6197. [Google Scholar] [CrossRef]
- Lin, W.C.; Brondum, K.; Monroe, C.W.; Burns, M.A. Multifunctional water sensors for pH, ORP, and conductivity using only microfabricated platinum electrodes. Sensors 2017, 17, 1655. [Google Scholar] [CrossRef] [Green Version]
- Bowe, G. An Overview of Counting Methods of Algae. In Detection Methods for Algae, Protozoa and Helminths in Fresh and Drinking Water; John Wiley & Sons Ltd: West Sussex, UK, 2002. [Google Scholar]
- Zhang, C.; Zhang, J. Current Techniques for Detecting and Monitoring Algal Toxins and Causative Harmful Algal Blooms. J. Environ. Anal. Chem. 2014, 2, 2380–2391. [Google Scholar] [CrossRef] [Green Version]
- Linklater, N.; Örmeci, B. Real-Time and Near Real-Time Monitoring Options for Water Quality. In Monitoring Water Quality: Pollution Assessment, Analysis, and Remediation; Newnes: Oxford, UK, 2013. [Google Scholar]
- Lee, S.; Thio, S.K.; Park, S.Y.; Bae, S. An automated 3D-printed smartphone platform integrated with optoelectrowetting (OEW) microfluidic chip for on-site monitoring of viable algae in water. Harmful Algae 2019, 88, 101638. [Google Scholar] [CrossRef] [PubMed]
- Saboe, D.; Ghasemi, H.; Gao, M.M.; Samardzic, M.; Hristovski, K.D.; Boscovic, D.; Burge, S.R.; Burge, R.G.; Hoffman, D.A. Real-time monitoring and prediction of water quality parameters and algae concentrations using microbial potentiometric sensor signals and machine learning tools. Sci. Total Environ. 2021, 764, 142876. [Google Scholar] [CrossRef] [PubMed]
- Lee, S.H.; Mariappan, V.; Won, D.C.; Shin, J.; Yang, S. Design of In-situ Self-diagnosable Smart Controller for Integrated Algae Monitoring System. Int. J. Adv. Cult. Technol. 2017, 5, 64–69. [Google Scholar] [CrossRef] [Green Version]
- Izydorczyk, K.; Carpentier, C.; Mrówczyński, J.; Wagenvoort, A.; Jurczak, T.; Tarczyńska, M. Establishment of an Alert Level Framework for cyanobacteria in drinking water resources by using the Algae Online Analyser for monitoring cyanobacterial chlorophyll a. Water Res. 2009, 43, 989–996. [Google Scholar] [CrossRef] [PubMed]
- Zamyadi, A.; McQuaid, N.; Prévost, M.; Dorner, S. Monitoring of potentially toxic cyanobacteria using an online multi-probe in drinking water sources. J. Environ. Monit. 2012, 14, 579–588. [Google Scholar] [CrossRef]
- Beckler, J.S.; Arutunian, E.; Moore, T.; Currier, B.; Milbrandt, E.; Duncan, S. Coastal Harmful Algae Bloom Monitoring via a Sustainable, Sail-Powered Mobile Platform. Front. Mar. Sci. 2019, 6, 587. [Google Scholar] [CrossRef]
- Naughton, S.; Kavanagh, S.; Lynch, M.; Rowan, N.J. Synchronizing use of sophisticated wet-laboratory and in-field handheld technologies for real-time monitoring of key microalgae, bacteria and physicochemical parameters influencing efficacy of water quality in a freshwater aquaculture recirculation system: A case study from the Republic of Ireland. Aquaculture 2020, 526, 735377. [Google Scholar] [CrossRef]
- Yamahara, K.M.; Demir-Hilton, E.; Preston, C.M.; Marin, R.; Pargett, D.; Roman, B.; Jensen, S.; Birch, J.M.; Boehm, A.B.; Scholin, C.A. Simultaneous monitoring of faecal indicators and harmful algae using an in-situ autonomous sensor. Lett. Appl. Microbiol. 2015, 61, 130–138. [Google Scholar] [CrossRef] [Green Version]
- Szczerbińska, N.; Gałczyńska, M. Biological methods used to assess surface water quality. Arch. Pol. Fish. 2015, 23, 185. [Google Scholar] [CrossRef] [Green Version]
- Oshiro, R. USEPA Method 1604: Total Coliforms and Escherichia coli in Water by Membrane Filtration Using a Simultaneous Detection Technique (MI Medium); Environmental Protection Agency: Washington, DC, USA, 2002.
- Simões, J.; Dong, T. Continuous and real-time detection of drinking-water pathogens with a low-cost fluorescent optofluidic sensor. Sensors 2018, 18, 2210. [Google Scholar] [CrossRef] [PubMed] [Green Version]
- Bedell, E.; Sharpe, T.; Purvis, T.; Brown, J.; Thomas, E. Demonstration of tryptophan-like fluorescence sensor concepts for fecal exposure detection in drinkingwater in remote and resource constrained settings. Sustainability 2020, 12, 3768. [Google Scholar] [CrossRef]
- Kumar Gunda, N.S.; Naicker, S.; Shinde, S.; Kimbahune, S.; Shrivastava, S.; Mitra, S. Mobile Water Kit (MWK): A smartphone compatible low-cost water monitoring system for rapid detection of total coliform and E. coli. Anal. Methods 2014, 6, 6236–6246. [Google Scholar] [CrossRef]
- Patil, R.; Levin, S.; Halery, N.; Rajkumar, S.; Gupta, I. A smartphone-based early alert system for screening of coliform contamination in drinking water. J. Microbiol. Biotechnol. Food Sci. 2019, 9, 539–547. [Google Scholar] [CrossRef]
- Tok, S.; De Haan, K.; Tseng, D.; Usanmaz, C.F.; Ceylan Koydemir, H.; Ozcan, A. Early detection of: E. coli and total coliform using an automated, colorimetric and fluorometric fiber optics-based device. Lab. Chip 2019, 19, 2925–2935. [Google Scholar] [CrossRef] [Green Version]
- Huynh, V.; Hausot, A.; Angelescu, D.E. An Autonomous Field Sensor for Total Coliform and E.Coli Monitoring at Remote Sites. In Proceedings of the OCEANS 2016 MTS/IEEE Monterey, OCE 2016, Monterey, CA, USA, 19–23 September 2016. [Google Scholar]
- Grossi, M.; Lazzarini, R.; Lanzoni, M.; Pompei, A.; Matteuzzi, D.; Ricco, B. A portable sensor with disposable electrodes for water bacterial quality assessment. IEEE Sens. J. 2013, 13, 1775–1782. [Google Scholar] [CrossRef]
- Zhang, X.; Jiang, X.; Yang, Q.; Wang, X.; Zhang, Y.; Zhao, J.; Qu, K.; Zhao, C. Online Monitoring of Bacterial Growth with an Electrical Sensor. Anal. Chem. 2018, 90, 6006–6011. [Google Scholar] [CrossRef]
| Author(s) | Type | Description | Research Findings |
|---|---|---|---|
| Cassidy et al. [72] | Optical | Developed a spectrophotometric device for chlorine detection in real-time using a xenon light source and a flow sample chamber. | Device performed well, but improvements are needed for field application. |
| Hall et al. [73] | Optical and Electrical | Assessed electrical and optical sensors for chlorine detection in water. | The sensors were able to determine chlorine with good accuracy, but more analysis is needed to improve the devices. |
| Gimenez-Gomez et al. [74] | Electrical | Presented a low-cost, compact portable multisensory electronic system to measure parameters of water quality. | The device presented good performance compared to commercial equipment, including free chlorine analysis. |
| Cui et al. [75] | Described the development of a microcontroller system, with wireless communication, to measure water quality parameters. | The device allowed online communication and the commercial residual chlorine sensor used (free chlorine and monochloramine) showed good results. | |
| Yen et al. [76] | Developed a low-cost chemo-resistive sensor based on nanohybrid paper to measure free chlorine ions. | The developed sensor showed a linear range of 0.1−500 ppm, and the limit of detection was 0.18 ppm. | |
| Alam et al. [77] | Proposed a reusable, reagent-free sensor based on a thin gold film for chlorine measurement. | The sensor showed high-sensitivity accuracy, like commercial sensors. |
| Author(s) | Type | Description | Research Findings |
|---|---|---|---|
| Liu [82] | Electrical | Designed an IoT system for monitoring the water quality environment for fishing in real-time. | The system was able to acquire DO, turbidity, pH, temperature, and electrical conductivity parameters in real-time, storing them in a database. |
| Luo et al. [83] | Developed a real-time monitoring system to measure DO in water using a YCS-2000 sensor. | The system could fulfill the real-time remote monitoring of aquaculture water quality and had great practical significance in the reduction in labor intensity. | |
| Vijayakumar and Ramya [84] | Present a low-cost system for real-time water quality monitoring (including DO) using a Raspberry PI B+ model. | The device was presented as a low-cost and real-time monitoring system, being capable of processing, analyzing, sending, and viewing the data in the cloud. | |
| He [85] | Designed and developed an embedded aquaculture intelligent water quality monitoring system based on STM32F103VET6. | The system could provide technical support for the design and development of an aquaculture monitoring system. | |
| Lee et al. [86] | Designed a DO sensor for in situ water quality analysis using a needle-like microelectrode arrangement (MEA). | The DO MEA exhibited a rapid 15 s linear response in the 0–9 mg/L (0–21% O2) range. | |
| Penso et al. [87] | Optical | Used a PDMS membrane coated with a platinum octaethylporphyrin (PtOEP) film to measure DO in water. | In a liquid medium, the sensor was able to measure DO in a range of 0–5.5 mg/L. |
| Mahoney et al. [88] | Optimized a multilayer optical-fluidic sensor for DO in situ measurement. | The results showed a comparable sensitivity and sensing range (0–20 ppm) compared to previously developed miniaturized DO sensors. |
| Author(s) | Type | Description | Research Findings |
|---|---|---|---|
| Jadhav et al. [92] | Optical | Used a fiber optic sensor based on Fiber Bragg Grating (FBG) to detect fluorine in water. | The sensor allowed fluorine detection with a good accuracy between 0.05 and 8 ppm. |
| Moradi et al. [90] | A simple method for fluoride detection is presented. The sensor comprises a 35 nm aluminum coating on the distal end of a length of single-mode optical fiber. | The fabricated sensor measures fluoride concentration within the range of 0–5 mg/L. | |
| Levin et al. [93] | Determined fluorine in water using an optical device connected to a smartphone camera. | It was possible to measure fluorine in water by assessing RGB color, although the presence of other substances may interfere with the results. | |
| Mukherjee et al. [94] | Used external bicomponent sensing material, powered and operated by a smartphone, for fluorine analysis. | The results were similar to the laboratory methods and showed good selectivity for fluorine. |
| Author(s) | Type | Description | Research Findings |
|---|---|---|---|
| Oliveira et al. [103] | Optical | Developed spectrophotometry using a DVD as a diffraction medium to measure iron in water. | The system was able to measure iron between 0.5 and 15.0 mg/L. |
| Zhou et al. [104] | Used portable X-ray fluorescence (pXRF) equipment to estimate lead and copper in a lake. | The equipment was capable of determining the concentrations of heavy metals in polluted water, especially for heavily polluted water with relatively high concentrations. | |
| Srivastava and Sharma [105] | Developed ultra-compact portable spectrophotometry, integrated with a cloud database, to measure iron and copper in drinking water. | The spectrophotometer system provides an innovative chemo-electronic cost-effective system to measure heavy metal contamination present in water samples in real-time. | |
| Wu et al. [55] | Electrical | Used a sensor manufactured by MEMS (Micro-Electro-Mechanical System) technology to measure copper in water. | The sensor was able to detect copper between 0.0 and 0.6 mg/L, with an accuracy of 0.04 mg/L. |
| Wang et al. [106] | The sensor suffers no interference from other metals and was able to measure copper between 0.0 and 400 mg/L. | ||
| Alam et al. [57] | Developed a multi-walled carbon nanotubes and β-cyclodextrin (MWCNT-βCD) sensor to measure lead in water. | The sensor was able to detect lead in water between 5 and 100 mg/L. | |
| Yen and Lai [107] | Designed a metal-oxide-semiconductor microelectromechanical system (CMOS-MEMS) sensor to detect lead in water. | The sensor was able to detect lead in water between 0.01 and 100 mg/L. | |
| Li et al. [108] | Used a Disposable Electrode-Printed (DEP) chip, integrated with a plastic pipette, to measure Pb, Hg, Cu, and Zn. | The device was able to measure the metals at different concentrations, which demonstrated that there existed a linear relationship between the peak current and the concentration. |
| Author(s) | Type | Description | Research Findings |
|---|---|---|---|
| Alam, Clyne and Deen [56] | Electrical | Used a special ink made of palladium (Pd) with a silver/silver-chloride electrode (Ag/AgCl) to measure pH in water. | The sensor was able to measure pH in real-time with high accuracy. |
| Wu et al. [55] | Used the Ruthenium (Ru) redox to measure pH in water. | The sensor has a sensitivity of −57.34 mV/pH in pH detection and was able to measure pH in a 4.01–10.87 range. | |
| Simic et al. [58] | Used Titanium Dioxide (TiO2) as the main film in the pH sensor. | The design ensured reliable in situ measurement. | |
| Hossain et al. [120] | Optical | A Photo-Induced Electron Transfer (PET) method was used with 4-aminonapthlimide (integrated into a smartphone) to measure the pH parameter in water. | The application of a novel smartphone-based pH meter showed a rapid assessment and mapping of the quality of drinking water. |
| Dutta, Sarma amd Nath [119] | Used a simple laboratory optical components and the camera of a smartphone as a low-cost, portable device to measure pH in water. | The sensor presented reliable data for pH measurement. | |
| Silva et al. [118] | Developed a smartphone camera and a microfluidic paper-based device (IPAD) to measure pH. | The device was able to measure pH between 4.7 and 12. |
| Author(s) | Type | Description | Research Findings |
|---|---|---|---|
| Lin et al. [130] | Optical | Developed an automatic collector of water samples, called “Fish-Bite” to measure phosphorus in water. | The device was able to detect phosphorus up to 1.00 mg/L, with a lower detection limit of 0.01 mg/L. |
| Akhter et al. [131] | Electrical | Used multi-walled carbon nanotubes (MWCNTs) and Polydimethylsiloxane (PDMS) to detect phosphorus in water for agricultural use. | The sensor was able to measure phosphorus between 0.01 and 40 mg/L, with 95% accuracy. |
| Author(s) | Type | Description | Research Findings |
|---|---|---|---|
| Qasem et al. [134] | Electrical | Built a remotely operated underwater vehicle with an ORP sensor. | The proposed hardware and software designs can monitor ORP in water. |
| Dejus et al. [135] | Used a commercial ORP sensor to monitor water quality. | Mahalanobis distance method with DW quality sensors has a good potential to be applied in warning systems (EWS). | |
| Helmi, Hafiz and Rizam [136] | Developed a mobile buoy for water quality assessment, with the ORP parameter, operated remotely. | The device was able to measure the ORP parameter and transmit the water quality reading data in real-time. | |
| Siyang and Kerdcharoen [137] | Described the development of a low-cost unmanned surface vehicle to monitor water quality. | The system has the capability to perform water quality assessment (including the ORP parameter) missions on inland water resources. | |
| Khatri et al. [138] | Presented the development of a sustainable water quality monitoring system, with ORP as a parameter. | The developed system can be a suitable replacement for traditional water quality monitoring techniques, with which the ORP measure uncertainty was equal to 0.029. | |
| Ilie et al. [139] | Developed a Smart Water kit connected to the internet for real-time water quality monitoring. | The developed system can be used in many environmental conditions, to give an idea about the state of the water in real-time. | |
| Lee et al. [140] | Developed a microelectrode array for the in situ sensing of ORP. | The sensor developed exhibited a very fast response time and proved to be extraordinarily stable. | |
| Jang et al. [141] | The sensor performance was equal to or more accurate than the commercial sensors. | ||
| Lin et al. [142] | Used micro-fabricated platinum electrodes to measure ORP in water. | The sensor was able to measure ORP from 150 to 800 mV. |
| Author(s) | Type | Description | Research Findings |
|---|---|---|---|
| Lee et al. [146] | Electrical | Developed a portable, 3D-printed device with a smartphone and opto-electrowetting to measure algae in water. | The device offers a highly portable, user-friendly, low-cost tool that enables simple on-chip sample preparation and the detection of viable algae. |
| Saboe et al. [147] | Optical | Used a microbiological potentiometric sensor to measure algae in water by electrical signal patterns. | The very low NRMSE <3% for algal and chlorophyll concentrations demonstrated that these and similar biological parameters could be monitored in natural waters with extremely high precision. |
| Lee et al. [148] | Developed a device connected to a biological optical sensor for the diagnosis of algae growth in a water treatment plant. | The proposed system emulated a real-time water treatment plant for algae monitoring. | |
| Izydorczyk et al. [149] | Presented an Algae Online Analyzer (AOA) system to monitor algae in water. | A positive correlation between cyanobacteria, as determined by conventional methods, was found (p < 0.05). | |
| Zamydi et al. [150] | Used multi-parametric commercial probes to detect cyanobacteria using the fluorescence technique. | The analysis revealed significant correlations between the extracted Chl-a, extracted PC, and cyanobacterial biovolume and in vivo fluorescence parameters measured. | |
| Beckler et al. [151] | The results demonstrated the potential for mapping unispecies of harmful algae using a Navocean autonomous sail vehicle (Nav2). | ||
| Naughton et al. [152] | The sensor allowed algae monitoring over 10 months, data from which can be used as a way to improve reservoir management. | ||
| Yamahara et al. [153] | Polymerase Chain Reaction | Designed an automatic sampler to detect harmful algae and fecal indicators in water using the qPCR technique. | The device showed good performance, with qPCR efficiencies ranging from 86% to 105%. |
| Author(s) | Type | Description | Research Findings |
|---|---|---|---|
| Simões and Dong [156] | Optical | Used a fluorescent optical sensor to monitor E. coli and Legionella in drinking water. | The equipment had a good performance, with a detection limit equal to 1.4 × 10³ CFU/mL. |
| Bedell et al. [157] | Used a Tryptophan-Like Fluorescent (TLF) technique to monitor E. coli in drinking water. | The results showed a close correlation between TLF and E. coli in model waters and proof of principle with a sensitivity of 4 CFU/mL for E. coli. | |
| Gunda et al. [158] | Developed the Mobile Water Kit (MWK) to detect microorganisms in water based on the colorimetric method. | The device was able to detect the total coliform and E. coli bacteria in water samples within 30 min or less. | |
| Patil et al. [159] | Presented a quick screening and alerting of coliform and E. coli contamination in water samples using a device attached to a smartphone. | The system was able to measure coliforms and E. coli contamination and issued an alert when contamination was detected. | |
| Tok et al. [160] | Presented a cost-effective and automated device to monitor coliforms and E. coli in water based on fluorescent techniques. | The system can automatically detect the presence of both E. coli and total coliforms in drinking water within ∼16 h, down to a level of one colony-forming unit (CFU) per 100 mL. | |
| Hausot and Angelescu [161] | Described the development of an Autonomous Microbiological Alert Sensor (AMAS) for bacterial monitoring in water based on colorimetric and fluorimetric techniques. | The sensor is able to quantify initial concentrations of pathogens present in each sample and alert operators in the case of high bacterial contamination. | |
| Grossi et al. [162] | Electrical | Presented a portable sensor implemented as an electronic embedded system for microbial concentration assessment. | The system provides a much faster response than standard techniques and can be used for in situ microbial tests rather than taking samples to a laboratory for analysis. |
| Zhang et al. [163] | Developed an automatic electrical bacterial growth sensor (EBGS) based on a multichannel, capacitively coupled, contactless conductivity detector (C4D). | The sensor was able to detect the bacteria as much as the conventional online monitoring methods. |
Publisher’s Note: MDPI stays neutral with regard to jurisdictional claims in published maps and institutional affiliations. |
© 2022 by the authors. Licensee MDPI, Basel, Switzerland. This article is an open access article distributed under the terms and conditions of the Creative Commons Attribution (CC BY) license (https://creativecommons.org/licenses/by/4.0/).
Share and Cite
Silva, G.M.e.; Campos, D.F.; Brasil, J.A.T.; Tremblay, M.; Mendiondo, E.M.; Ghiglieno, F. Advances in Technological Research for Online and In Situ Water Quality Monitoring—A Review. Sustainability 2022, 14, 5059. https://doi.org/10.3390/su14095059
Silva GMe, Campos DF, Brasil JAT, Tremblay M, Mendiondo EM, Ghiglieno F. Advances in Technological Research for Online and In Situ Water Quality Monitoring—A Review. Sustainability. 2022; 14(9):5059. https://doi.org/10.3390/su14095059
Chicago/Turabian StyleSilva, Gabriel Marinho e, Daiane Ferreira Campos, José Artur Teixeira Brasil, Marcel Tremblay, Eduardo Mario Mendiondo, and Filippo Ghiglieno. 2022. "Advances in Technological Research for Online and In Situ Water Quality Monitoring—A Review" Sustainability 14, no. 9: 5059. https://doi.org/10.3390/su14095059
APA StyleSilva, G. M. e., Campos, D. F., Brasil, J. A. T., Tremblay, M., Mendiondo, E. M., & Ghiglieno, F. (2022). Advances in Technological Research for Online and In Situ Water Quality Monitoring—A Review. Sustainability, 14(9), 5059. https://doi.org/10.3390/su14095059