


Abstract
Supplier selection is an important task in supply chain management, as suppliers have a vital role in the success of organisations in a supply chain. Sustainability has emerged as a solution to decreasing resources and increasing environmental and social problems in the past few decades. It has been applied to various industrial operations, one of them is supplier selection, to mitigate unwanted effects in the future. Sustainable supplier selection is a complicated multi-criteria decision making problem, including several criteria from economic, environmental, and social perspectives. To deal with subjective judgements of decision makers, fuzzy and grey methods are widely used in multi-criteria decision making, In the case of small, limited, and incomplete data, the grey theory provides satisfactory results, compared to fuzzy methods. Therefore, this study is an integrated method including grey Best-Worst Method (BWM) and grey Weighted Sum-Product (WISP) for choosing the most sustainable supplier for a textile manufacturer, which includes three main criteria and twelve sub-criteria. According to the result of the proposed model, the supplier with the best performance was determined to be the supplier with the SP2 coded. The results of the developed model were shown to the experts, and the accuracy of the results was confirmed. According to the experts, a higher amount of product can be purchased from the supplier with the SP2 code, and a tighter relationship can be worked with this supplier. The contributions of this study are: (1) Develop a new grey MCDM model called Grey WISP. (2) Create a new integrated MCDM model with grey theory, BWM, and WISP methods that can be applied to assess supplier sustainability using this hybrid model. The proposed model can be used not just for selecting sustainable suppliers, but also for any other decision problems that have multiple criteria and alternatives. The findings suggest that the Grey WISP method achieved accurate results.
1. Introduction
Sustainability has appeared as a concept that aims to make decisions today with less effects on tomorrow. It basically considers the economic, environmental, and social effects of any strategic decisions to lessen the negative consequences of the decisions in the future. Because of the increased awareness of environmental preservation and social responsibility, the notion of sustainability is becoming a crucial principle for many industrial sectors, including supply chain management. Many firms are increasingly including environmental aspects in their supplier selection process, as a result of rising environmental knowledge and concerns. Furthermore, selecting a sustainable supplier is a vital milestone for the whole sustainable supply chain [1].
Supplier selection is among the most significant tasks in supply chain management, since suppliers are critical to the performance of supply chain organizations [2,3]. Selecting the most optimal supplier is a complex process, as it involves various criteria and alternatives. However, it has become more challenging with the sustainability, as it requires handling the economic, environmental, and social effects of decisions. In order to choose the suppliers who perform the best in the supply chains, in terms of the three dimensions of sustainability, businesses must first identify and analyse the right suppliers and their supply networks [4]. This means that, in order to be sustainable, businesses must address environmental challenges, while also satisfying social criteria at all levels of the supply chain and attaining specified economic outcomes. As a result, the sustainable supplier selection decision problem is frequently referred to as a multi-criteria decision making (MCDM) problem [5,6,7,8,9,10].
The recent literature review studies about sustainable supplier selection have presented that MCDM methods were among the most often used ways to assess and choose sustainable suppliers [11]. In the earlier studies, the analytic hierarchy process (AHP) and analytic network process (ANP) methods have been found as the most used methods in sustainable supplier selection. Govindan et al. [12] found, in their study that reviewed sustainable supplier selection studies in the literature between 1996 and 2011, that AHP and ANP methods were the most used techniques in the selection. Zimmer et al. [13] conducted a systematic assessment of studies on the use of decision-making approaches for supplier selection that were published between 1997 and 2014. They discovered that the most common techniques for tackling sustainable supplier selection are the AHP, ANP, and fuzzy methods. However, with the development of new techniques in MCDM, the variety of the methods used in decision problems has increased.
The main goal of this study is to assess and select suppliers from a sustainability viewpoint for a textile manufacturer in Turkey with a new hybrid model, including the grey numbers method, best-worst method (BWM), and weighted sum-product (WISP) method. The following goals will be addressed in further detail in this paper:
- Developing the criteria for evaluating the sustainability of alternative suppliers;
- Presenting a new integrated model including grey numbers, BWM, and WISP methods for assessing sustainability of suppliers;
- Applying the suggested new hybrid model to a case study to identify the most sustainable supplier.
The following actions were taken in this study to achieve these goals. A preliminary literature review was carried out in order to define the sustainability criteria. Following that, a novel integrated MCDM, based on the grey numbers, BWM, and WISP methods, was developed. Then, sustainable suppliers were analyzed and prioritized with the criteria and new hybrid method.
The following are the study’s contributions: (1) The creation of the Grey WISP MCDM model, which is a new grey MCDM model. (2) Building a new, integrated MCDM model that incorporates the WISP, BWM, and grey theory techniques for evaluating supplier sustainability.
This paper has been organized as follows. In Section 2, a literature review on sustainable supplier selection is conducted. In Section 3, the methodology, which includes grey BWM and grey WISP methods, has been presented. In Section 4, the case study and application of the methodology are described. In Section 5, the proposed method is validated by a sensitivity analysis. Finally, in Section 6, the conclusion of the paper, with recommendations for further research, is provided.
2. Literature Review
Supplier selection problem has a wide coverage in the literature for a long time. It has been studied from various perspectives, with several methodologies and criteria. Traditionally suppliers were assessed from economic viewpoint in the studies. Then, environmental criteria began to be used in supplier selection, with increasing environmental concerns. Additionally, sustainability was introduced to supplier selection in the literature by the end of 2000s. In this review, we review sustainable supplier selection in two parts. The first part will present the MCDM methods that have been used in sustainable supplier selection in a timely order. The second part will provide criteria used in the sustainable assessment of supplier alternatives.
2.1. The Review of MCDM Methods in Sustainable Supplier Selection
As a subfield of operations research, MCDM supports decision-makers who deal with several alternatives and various conflicting criteria while making decisions. As in all decision problems, supplier selection problem, too, has various criteria and alternatives to consider. To deal with this complexity in supplier selection, MCDM techniques are employed by supply chain decision makers to analyse and categorize data, in order to make optimal decisions. There are several studies in the literature-reviewed methods used in supplier selection [12,14,15]. There are several MCDM methods used in the literature for supplier selection, such as technique of order preference similarity to the ideal solution (TOPSIS), complex proportional assessment (COPRAS), and viekriterijumsko kompromisno rangiranje (VIKOR); however, the most used ones are namely AHP, data envelopment analysis (DEA), and ANP [16]. In this part, we will look at how various MCDM methods were used to solve supplier selection in the literature.
Awasthi et al. [17] assessed suppliers sustainably with fuzzy TOPSIS. Kuo and Lin [18] suggested a strategy for evaluating green suppliers that combines ANP and DEA. Amindoust et al. [19] applied a fuzzy inference system (FIS) for supplier selection of a manufacturing company from sustainability perspective. Govindan et al. [20] used fuzzy set theory and TOPSIS to rank sustainable supplier for supply chains. Orji and Wei [21] employed fuzzy decision making trial and evaluation laboratory (DEMATEL) and TOPSIS methods to select a sustainable supplier for a manufacturer in China. Jia et al. [22] assessed suppliers to select the most sustainable one with TOPSIS method for an apparel company located in India. Jiang et al. [23] assessed sustainable suppliers with fuzzy DEMATEL for a chemistry enterprise in China. Luthra et al. [24] provided an integrated model using AHP and VIKOR methods for supplier selection of automobile company in India from a sustainable viewpoint. Khan et al. [25] examined sustainable supplier alternatives for a manufacturing company in Pakistan with a hybrid method including fuzzy Shannon Entropy (FSE) and fuzzy inference system (FIS) for a manufacturing company. Wang et al. [26] presented an integrated model with fuzzy AHP and green DEA for the sustainable supplier selection of a food oil company in Vietnam. Durmic [27] aimed to provide the most significant criteria for evaluating and selecting a long-term supplier for a lime company with the full consistency method (FUCOM). Memari et al. [28] used an intuitionistic fuzzy TOPSIS technique for choosing the most sustainable supplier for an automobile spare parts manufacturer. Rani et al. [29] introduced an extended model including the hesitant fuzzy set, COPRAS, and stepwise weight assessment ratio analysis (SWARA) to rank the supplier alternatives for a trading company. Stević et al. [30] used the measurement of alternatives and ranking according to compromise solution (MARCOS) method to choose the most optimal supplier for a healthcare company. Shang et al. [31] assessed suppliers with a hybrid MCDM method including BWM, FSE, and fuzzy multi-objective optimization by ratio analysis plus full multiplicative form (MULTIMOORA) for a company that is a prominent provider of forklift trucks and warehousing equipment across the world. Tong et al. [32] utilized the extended preference ranking organization method for enrichment of evaluations II (PROMETHEE II) method for a furniture company in China. The previous studies have been summarised in Table 1.
Table 1.
The review of previous studies about sustainable supplier selection methods.
2.2. The Review of Assessment Criteria for Sustainable Supplier Selection
Determining relevant and appropriate criteria is one of the most difficult aspects of supplier selection [33]. The review of criteria used in the supplier selection prior to 2000 shows that there are three main categories of emphasis in supplier selection. First, cost was the main focus until the early 1980s. Second, cycle time and customer responsiveness were taken into account in the early 1990s. Third, flexibility was considered in the late 1990s. The beginning of supplier selection studies extends to the 1960s. Dickson [34] has presented 23 criteria for supplier selection in 1966 and asked the managers of 273 companies, mostly manufacturing companies, to rank these criteria according to their importance. It was found that the most significant criterion was quality, the second significant one is delivery, and the third one was historical performance. Weber et al. [35] examined and categorised 74 relevant papers published between 1966 and 1991. They stated that, with the influence of just-in-time (JIT) on supplier selection, the cycle time and customer responsiveness were added as assessment criteria in supplier selection. In the late 1990s, studies identified the need of a flexibility criterion as a critical factor [36]. By the 2000s, innovation criterion has been appeared in the assessment of suppliers [37]. With the increasing concerns about environmental problems, the quest for ways to manage and alleviate environmental deterioration has been an objective for most businesses and organizations by 2000s. With those environmental considerations, a new trend focused on green supply chains has emerged. Handfield et al. [38] added environmental criteria such as waste management and green programs to supplier selection problem of three manufacture companies in US. The need for supplier assessment from a sustainable viewpoint has become more evident, as firms began to place a more emphasis on environmental and social concerns as the notion of corporate social responsibility matured in the second half of 2000s [39]. Bai and Sarkis [40] used internal and external social criteria for the assessment of suppliers with grey relational analysis (GRA) and rough set theory. Since then, sustainable criteria are commonly used in supplier selection.
The most used supplier selection criteria from the sustainability perspective are categorised into three groups: economic, environmental, and social concerns. The most used economic criteria in the sustainable supplier selection studies are cost, quality, and delivery [27,28,29,41,42]. Some of the most used environmental criteria include environmental management systems, environmental competencies, and pollution [19,25,31]. Work safety, information disclosure, and reputation are among the most used social criteria [21,30].
In practice, MCDM typically takes decision makers’ own preferences into consideration. Because decision makers are not able to evaluate their preferences using an accurate scale, due to the complexity and ambiguity of evaluations and options, linguistic evaluations can only be supplied in place of precise evaluations. Fuzzy or grey numbers are included in the proposed MCDM framework [43,44,45,46,47,48,49,50] to address this ambiguity. The literature review has demonstrated that approaches based on fuzzy set theory have been primarily used to tackle the challenge of sustainable supplier selection (FST). However, the fundamental benefit of the grey theory over the FST is that it takes into consideration the fuzziness issue. In addition, the grey theory produces excellent findings using little, limited, and partial data [40,51,52,53].
A new grey MCDM model is created in this paper. Grey BWM and grey WISP techniques are part of the suggested grey MCDM model. The grey WISP approach will be used to rank the alternatives, while the grey BWM method is used to determine the criterion weights. In two respects, this study makes a contribution to the literature. The first contribution is the development of the WISP approach with the addition of grey numbers. As far as we are aware, the WISP approach has no grey extensions in the literature. Uncertainties that the crisp WISP technique cannot manage will be handled by the grey WISP approach. The second contribution is that the combination of the grey BWM and grey WISP approaches is a first in the literature. This grey MCDM model can, therefore, account for uncertainties in the presence of small, sparse, and missing data.
3. Materials and Methods
The criteria weights will be determined with the grey BWM and the ranking of the alternatives will be determined with the grey WISP method in this study. Basic grey operations are presented as follows.
3.1. Basic Grey Operations
The arithmetic operations between these two grey numbers and positive crisp number, where and are two different grey numbers and a positive crisp number, are as follows [54,55].
The value and value indicated in the equations present the lowest values of and grey numbers, respectively, while the value and value indicate the highest values of and grey numbers, respectively. In Equation (1), the addition operation between grey numbers is shown. As can be seen, the lowest values of the grey numbers are summed up among themselves, and the highest values are among themselves. Equation (2) shows the subtraction between grey numbers. As can be seen, while the lowest value of the first grey number is subtracted from the highest value of the second grey number, the lowest value of the second grey number is subtracted from the highest value of the first grey number. Equation (3) shows the multiplication between grey numbers. In this operation, the lowest value of the first grey number is multiplied by the lowest and highest value of the second grey number. Additionally, the highest value of the first grey number is multiplied by the lowest and highest value of the second grey number. The lowest of the results of the mentioned four transactions is determined as the lowest value of this operation, while the highest of the results is determined as the highest value of this operation. Equation (4) shows the division between grey numbers. In this operation, the lowest value of the first grey number is divided by the lowest and highest value of the second grey number. Additionally, the highest value of the first grey number is divided by the lowest and highest value of the second grey number. The lowest of the results of the mentioned four transactions is determined as the lowest value of this operation, while the highest of the results is determined as the highest value of this operation. Equation (5) shows the multiplication of a grey number and a crisp number. The crisp number is multiplied by both the lowest value and the highest value of the grey number. Whitened of any grey number is made by Equation (6).
Equation (6) shows how to convert a grey number to a crisp number. The value in Equation (6) takes a value between 0 and 1.
3.2. Grey BWM
BWM, which is a method to use for computing criteria weights, was developed by Rezaei [56]. The grey BWM method used in this study was adapted from the fuzzy BWM, developed by [57]. The steps of grey BWM are clarified in detail below.
Step 1-1: Criteria list is determined.
Step 1-2: The best () and the worst criteria () are identified.
Step 1-3: Grey comparisons for the best criterion are determined. In other words, decision-makers compare the best criterion with the other criteria using the linguistic values. These linguistic values are as follows: absolutely important (AI)([3.5, 4.5]), very important (VI)([2.5, 3.5]), medium important (MI) ([1.5, 2.5]), weakly important (WI)([0.667, 1.5]) and equally important (EI) ([1, 1]). These values are adapted from [57]. The grey best-to-others vector showing these comparisons is indicated in Equation (7).
In the vector shown in Equation (7), the value of is equal to [1, 1].
Step 1-4: Grey comparisons for the worst criterion are determined. In other words, decision makers compare the worst criterion with the other criteria using the linguistic values which are mentioned above. The grey others-to-worst vector indicating these comparisons is shown in Equation (8).
In the vector shown in Equation (8), the value of is equal to [1, 1].
Step 1-5: An optimization model is created to find the grey weights. Equation (9) indicates this model.
where and .
Let and and , then Equation (9) can be transferred as:
Step 1-6: Consistency ratios () of grey comparisons are computed, with following equation.
There are two views on the consistency ratio. According to Guo and Zhao [57], a close to 0 is sufficient, while according to Ghoushchi et al. [58], the should be less than 0.1. Although the second view is preferred in this study, a number less than 0.1 will be close to 0. Experts will use the linguistic values which are mentioned above for grey comparisons for the best criterion and worst criterion. Additionally, each linguistic value has (consistency index) value, and these values were computed with the methodology of Guo and Zhao [57]. These values are as follows: 8.04 for AI, 6.69 for VI, 5.29 for MI, 3.8 for WI and 3 for EI. Please see Guo and Zhao’s study [57] for detailed information.
3.3. Grey WISP
Simple WISP method has been developed by Stanujkic et al. [59]. Four utility indicators are used by the simple WISP technique to assess the total value of the option. In contrast to simple WISP, results can be obtained faster in simplified WISP (WISP-S), as it employs two utility indicators [6].
In this study, the grey WISP method is developed. The steps of grey WISP are explained in detail below.
Step 2-1: Grey decision matrix () is built. The decision-makers will use the linguistic values, while evaluating the performances of the alternatives for building the grey decision matrix. Equation (12) indicates this matrix. Linguistic values used in evaluating the performances of the alternatives are as follows: extremely high (EH)([0.8, 1.0]), very high (VH)([0.7, 0.9]), high (H) ([0.6, 0.8]), moderately high (MH) ([0.5, 0.7]), medium (M) ([0.4, 0.6]), moderately low (ML) ([0.3, 0.5]), low (L) ([0.2, 0.4]), very low (VL) ([0.1, 0.3]) and extremely low (EL) ([0.0-0.2]). These values are taken from [60].
In Equation (12), , and it is one of the elements of . This grey decision matrix consists of th alternatives and th criteria.
Step 2-2: This matrix is normalized by using Equation (13).
Step 2-3: For all alternatives, the grey weighted sum and grey weighted product of normalized values of non-beneficial () and beneficial criteria () were determined as below.
Step 2-4: The grey utility measures are computed as follows.
where is computed as the grey difference between two grey sums of beneficial criteria and non-beneficial criteria, multiplied by a grey weight. is computed as the grey difference between two grey multiplications of beneficial criteria and non-beneficial criteria, multiplied by a grey weight. The difference is between beneficial criteria and non-beneficial criteria. is computed as the ratio between two grey sums of beneficial criteria and non-beneficial criteria, multiplied by a grey weight. is computed as the ratio between two grey multiplications of beneficial criteria and non-beneficial criteria, multiplied by a grey weight. The ratio is between beneficial criteria and non-beneficial criteria.
Step 2-5: Grey utility measures are recalculated as below.
where , , and indicate recalculated grey values of , , , and .
Step 2-6: The overall grey utility value () for each alternative is computed as follows.
Step 2-7: The overall grey utility values () are whitened to obtain crisp overall utility values ().
In this study, will be taken as 0.5. The highest presents the most optimal alternative.
4. Application
When the place of the textile industry in world trade for 2021 is examined, the countries that come to the fore in exports are China (35%), India (6.9%), the USA (5.3%), Turkey (4.2%), and Germany (4.2%) [61]. As can be seen, Turkey has an important share in world textile exports. Therefore, the application of this study is carried out in a textile factory in Turkey that has many production facilities in Central Asia and Europe. In the application, data were obtained from an expert team consisting of seven top managers of the company. The details of experts are summarised in Table 2.
Table 2.
The Details of Experts.
The master list was created from the criteria found in the literature related to the problem. This list has been shown to the expert team. In consultation with this expert team, the criteria to be used in the sustainable supplier selection were determined. The main criteria and sub-criteria used in the study are listed below.
- Economics (EC)
- ➢
- Discount opportunity (DO);
- ➢
- Price (P);
- ➢
- Late delivery ratio (LDR);
- ➢
- Defect ratio (DR);
- ➢
- Technological capability (TC).
- Environmental Aspects (EV)
- ➢
- Reduction of air emissions (RAE);
- ➢
- Green warehouse management (GWM);
- ➢
- Environmentally-friendly materials (EFM);
- ➢
- Environmental performance evaluation (EPE).
- Social Aspects (SO)
- ➢
- Work contract (WCT);
- ➢
- Job safety and labour health (JSLH);
- ➢
- Organization culture (OC).
Only three of the mentioned sub-criteria were taken as non-beneficial criteria. The non-beneficial criteria were P, LDR, and DR.
First, the linguistic expressions in Appendix A were converted to grey numbers using linguistic scales, which are mentioned in Step 1-3. This process step will be illustrated by taking Expert 1’s opinions for the main criteria as an example. According to Expert 1, the best criterion () was determined as EC, while the worst criterion () was determined as SO. According to Expert 1, the EC criterion is very important (VI) ([2.5, 3.5]), compared to the EV criterion. Additionally, according to Expert 1, the EC criterion is absolutely important (AI) ([3.5, 4.5]), compared to the SO criterion. Therefore, the grey best-to-others vector for Expert 1 is shown below.
According to Expert 1, the EC criterion is absolutely important (AI) ([3.5, 4.5]), compared to the SO criterion. Additionally, according to Expert 1, the EV criterion is weakly important (WI) ([0.667, 1.5]), compared to the SO criterion. Therefore, the grey others-to-worst vector for Expert 1 is shown below.
Then, with Equation (10), the main criteria and sub-criteria weights were obtained. The weights of the main criteria and the weights of the sub-criteria were multiplied to determine the global weights of the sub-criteria. Table 3 presents the findings of grey WISP.
Table 3.
The Results of Grey WISP.
After finding the sub-criteria weights, the suppliers were ranked by the grey WISP method. Each expert evaluated five suppliers, according to their performance in the criteria. While making this evaluation, the experts used the linguistic values shown in Step 2-1. Experts’ assessments were combined with the arithmetic mean. Table 4 presents the combined assessments of experts.
Table 4.
The Combined Assessments.
An example will be presented to illustrate the combined assessments shown in Table 4. Expert 1, Expert 2, Expert 3, Expert 4, Expert 5, Expert 6, and Expert 7 have assigned the following values to the DO criterion of the SP1 alternative, respectively: [0.2, 0.4], [0.3, 0.5], [0.4, 0.6], [0.5, 0.7], [0.5, 0.7], [0.4, 0.6], and [0.4, 0.6]. The computation is as follows.
[((0.2 + 0.3 + 0.4 + 0.5 + 0.5 + 0.4 + 0.4)/7), ((0.4 + 0.5 + 0.6 + 0.7 + 0.7 + 0.6 + 0.6)/7)] = [0.386, 0.586]
Using Equation (13), a grey normalized matrix is obtained. Table 5 shows the grey normalized matrix.
Table 5.
The Grey Normalized Matrix.
An example will be presented to illustrate the grey normalized values shown in Table 5. The grey normalized value of the SP1 alternative in the DO criterion was calculated as follows.
max (0.586, 0.686, 0.643, 0.671, 0.686) = (0.686)
[(0.386/0.686), (0.586/0.686)] = [0.563, 0.854]
Using Equations (18)–(21), grey utility measures are calculated. Table 6 shows grey utility measures.
Table 6.
The Grey Utility Measures.
The grey utility measures are recalculated using Equations (22)–(25). Table 7 presents recalculated grey utility measures.
Table 7.
Recalculated Grey Utility Measures.
In the final step of the grey WISP, the overall grey utility value and the overall crisp utility value are calculated for each supplier by using Equations (26) and (27). The rankings of the suppliers are presented in Table 8.
Table 8.
The Results of Grey WISP.
The grey combinative distance-based assessment (CODAS), grey COPRAS, and grey additive ratio assessment (ARAS), grey multi-attributive border approximation area comparison (MABAC), and grey multi-attributive ideal-real comparative analysis (MAIRCA) methods were applied to the Grey decision matrix to confirm whether the developed Grey WISP method presented accurate results. Table 9 shows the ranking of suppliers according to these grey methods and the developed grey WISP method.
Table 9.
The Results of Grey MCDM Methods.
As can be seen from Table 9, the grey WISP, grey MAIRCA, and grey COPRAS methods obtained the same rankings of suppliers. Small differences were observed in the rankings between the grey WISP method and grey CODAS, grey MABAC, and grey ARAS methods. The Pearson correlation coefficient between the grey MCDM methods and grey WISP was determined as 0.9. Based on this, it is concluded that results from the proposed grey WISP approach are precise.
5. Sensitivity and Comparative Analysis
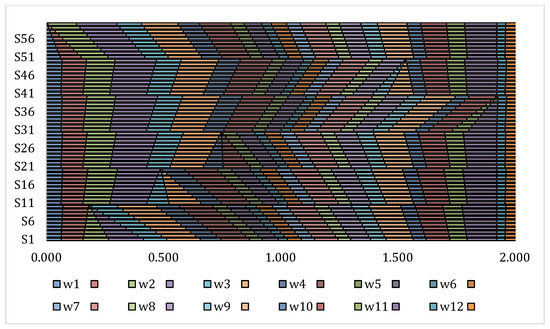
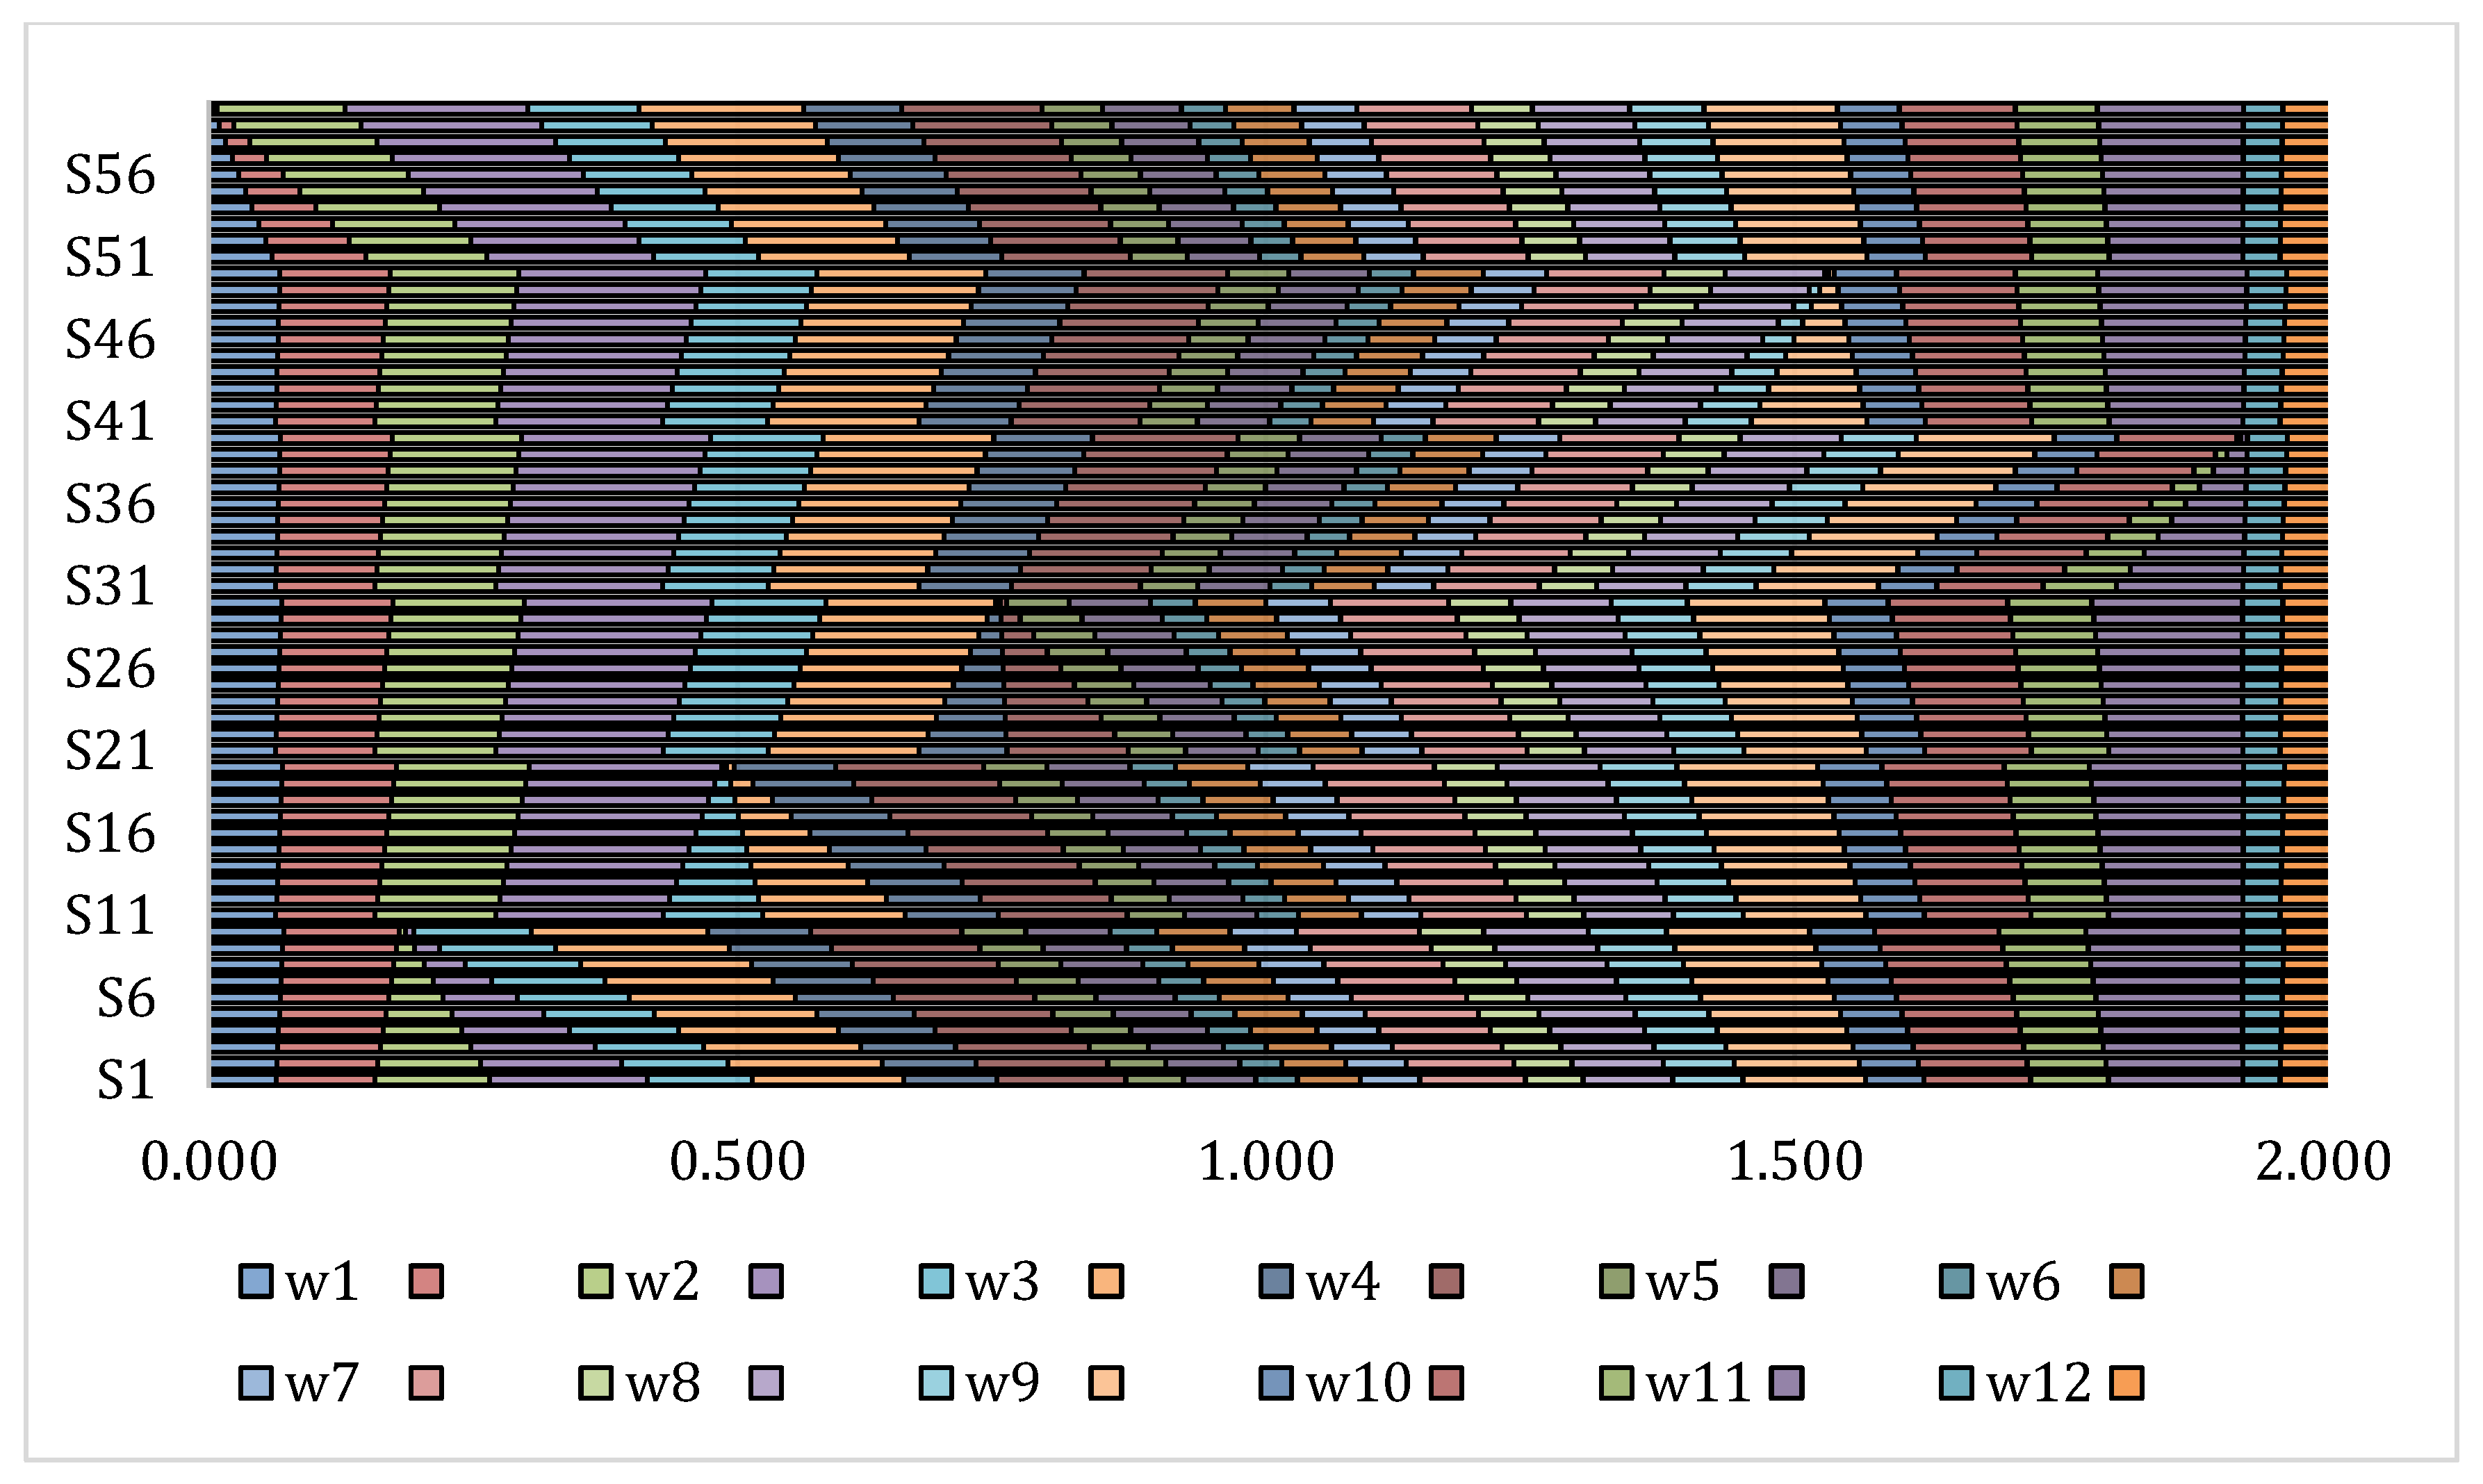
In the sensitivity analysis, the effect of the change of the six most important criteria, P, LDR, DR, JSLH, EPE, and DO were analysed. By applying Equation (28), Mešić et al. [62], a total of 60 scenarios (Figure 1) were formed.
Figure 1.
Simulated criteria weights through 60 scenarios.
In Equation (28), indicates a new value of criteria, and presents original value of criteria. Additionally, shows the reduced criterion value, and indicates the original value of the criterion with a reduced value [62].
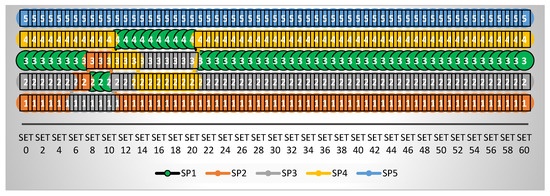
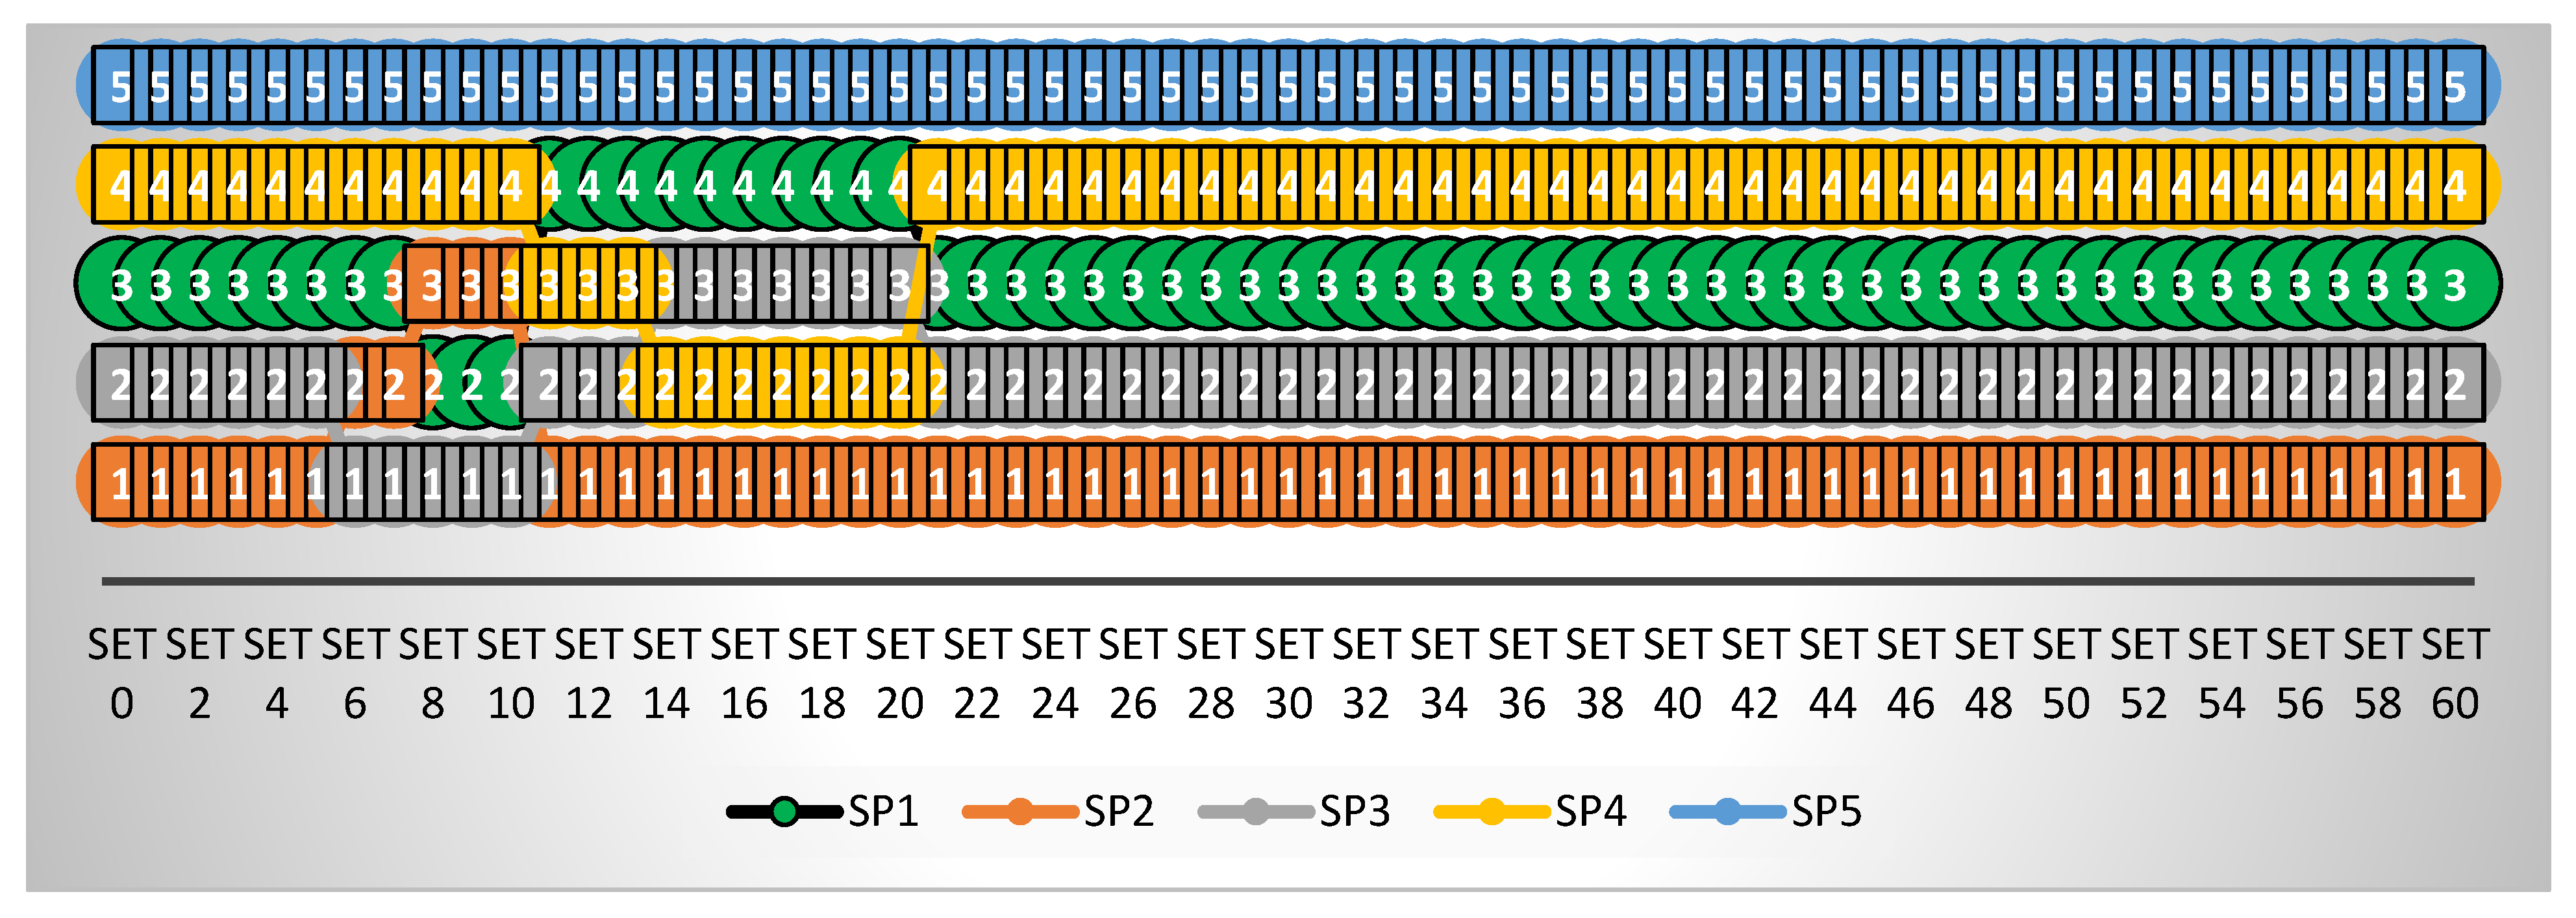
In scenarios S1–S10, the most significant criterion was P, criterion LDR in scenarios S11–S20, criterion DR in scenarios S21–S30, criterion JSLH in scenarios S31–S40, criterion EPE in scenarios S41–S50, and criterion DO in scenarios S51–S60. The results of performed sensitivity analysis are represented in Figure 2.
Figure 2.
Results of sensitivity analysis at new criterion values.
Based on 60 sets, in which new criteria values are represented, we can see that there were significant changes in some scenarios. In scenarios S1–S5 and S21–S60, there were no changes in alternative ranking, but scenarios S6–S20 had significant changes in alternative ranking. In S6 and S7, in which criterion P had values (0.051, 0.071) and (0.040, 0.055), respectively, the second and third alternatives replaced their position, so SP3 was the best solution. In scenarios S8-S10, three alternatives (SP1, SP2, and SP3) changed their initial rank, so SP2 was in third place. These changes in alternative ranking meant that the most important criterion P had a large influence on the final alternative ranking. Additionally, the second most important criterion LDR had a large influence on the alternative ranking because, in scenarios S11–S20, only the best and worst alternatives kept their position. Despite the change in criteria weights, we found that SP5 was the last ranked alternative.
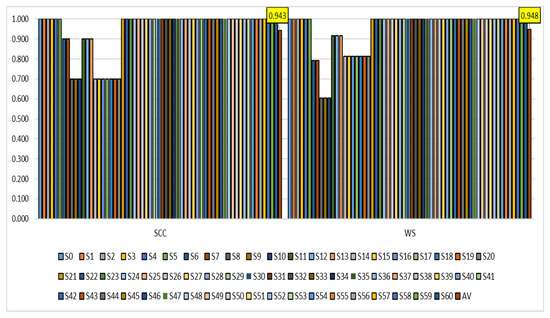
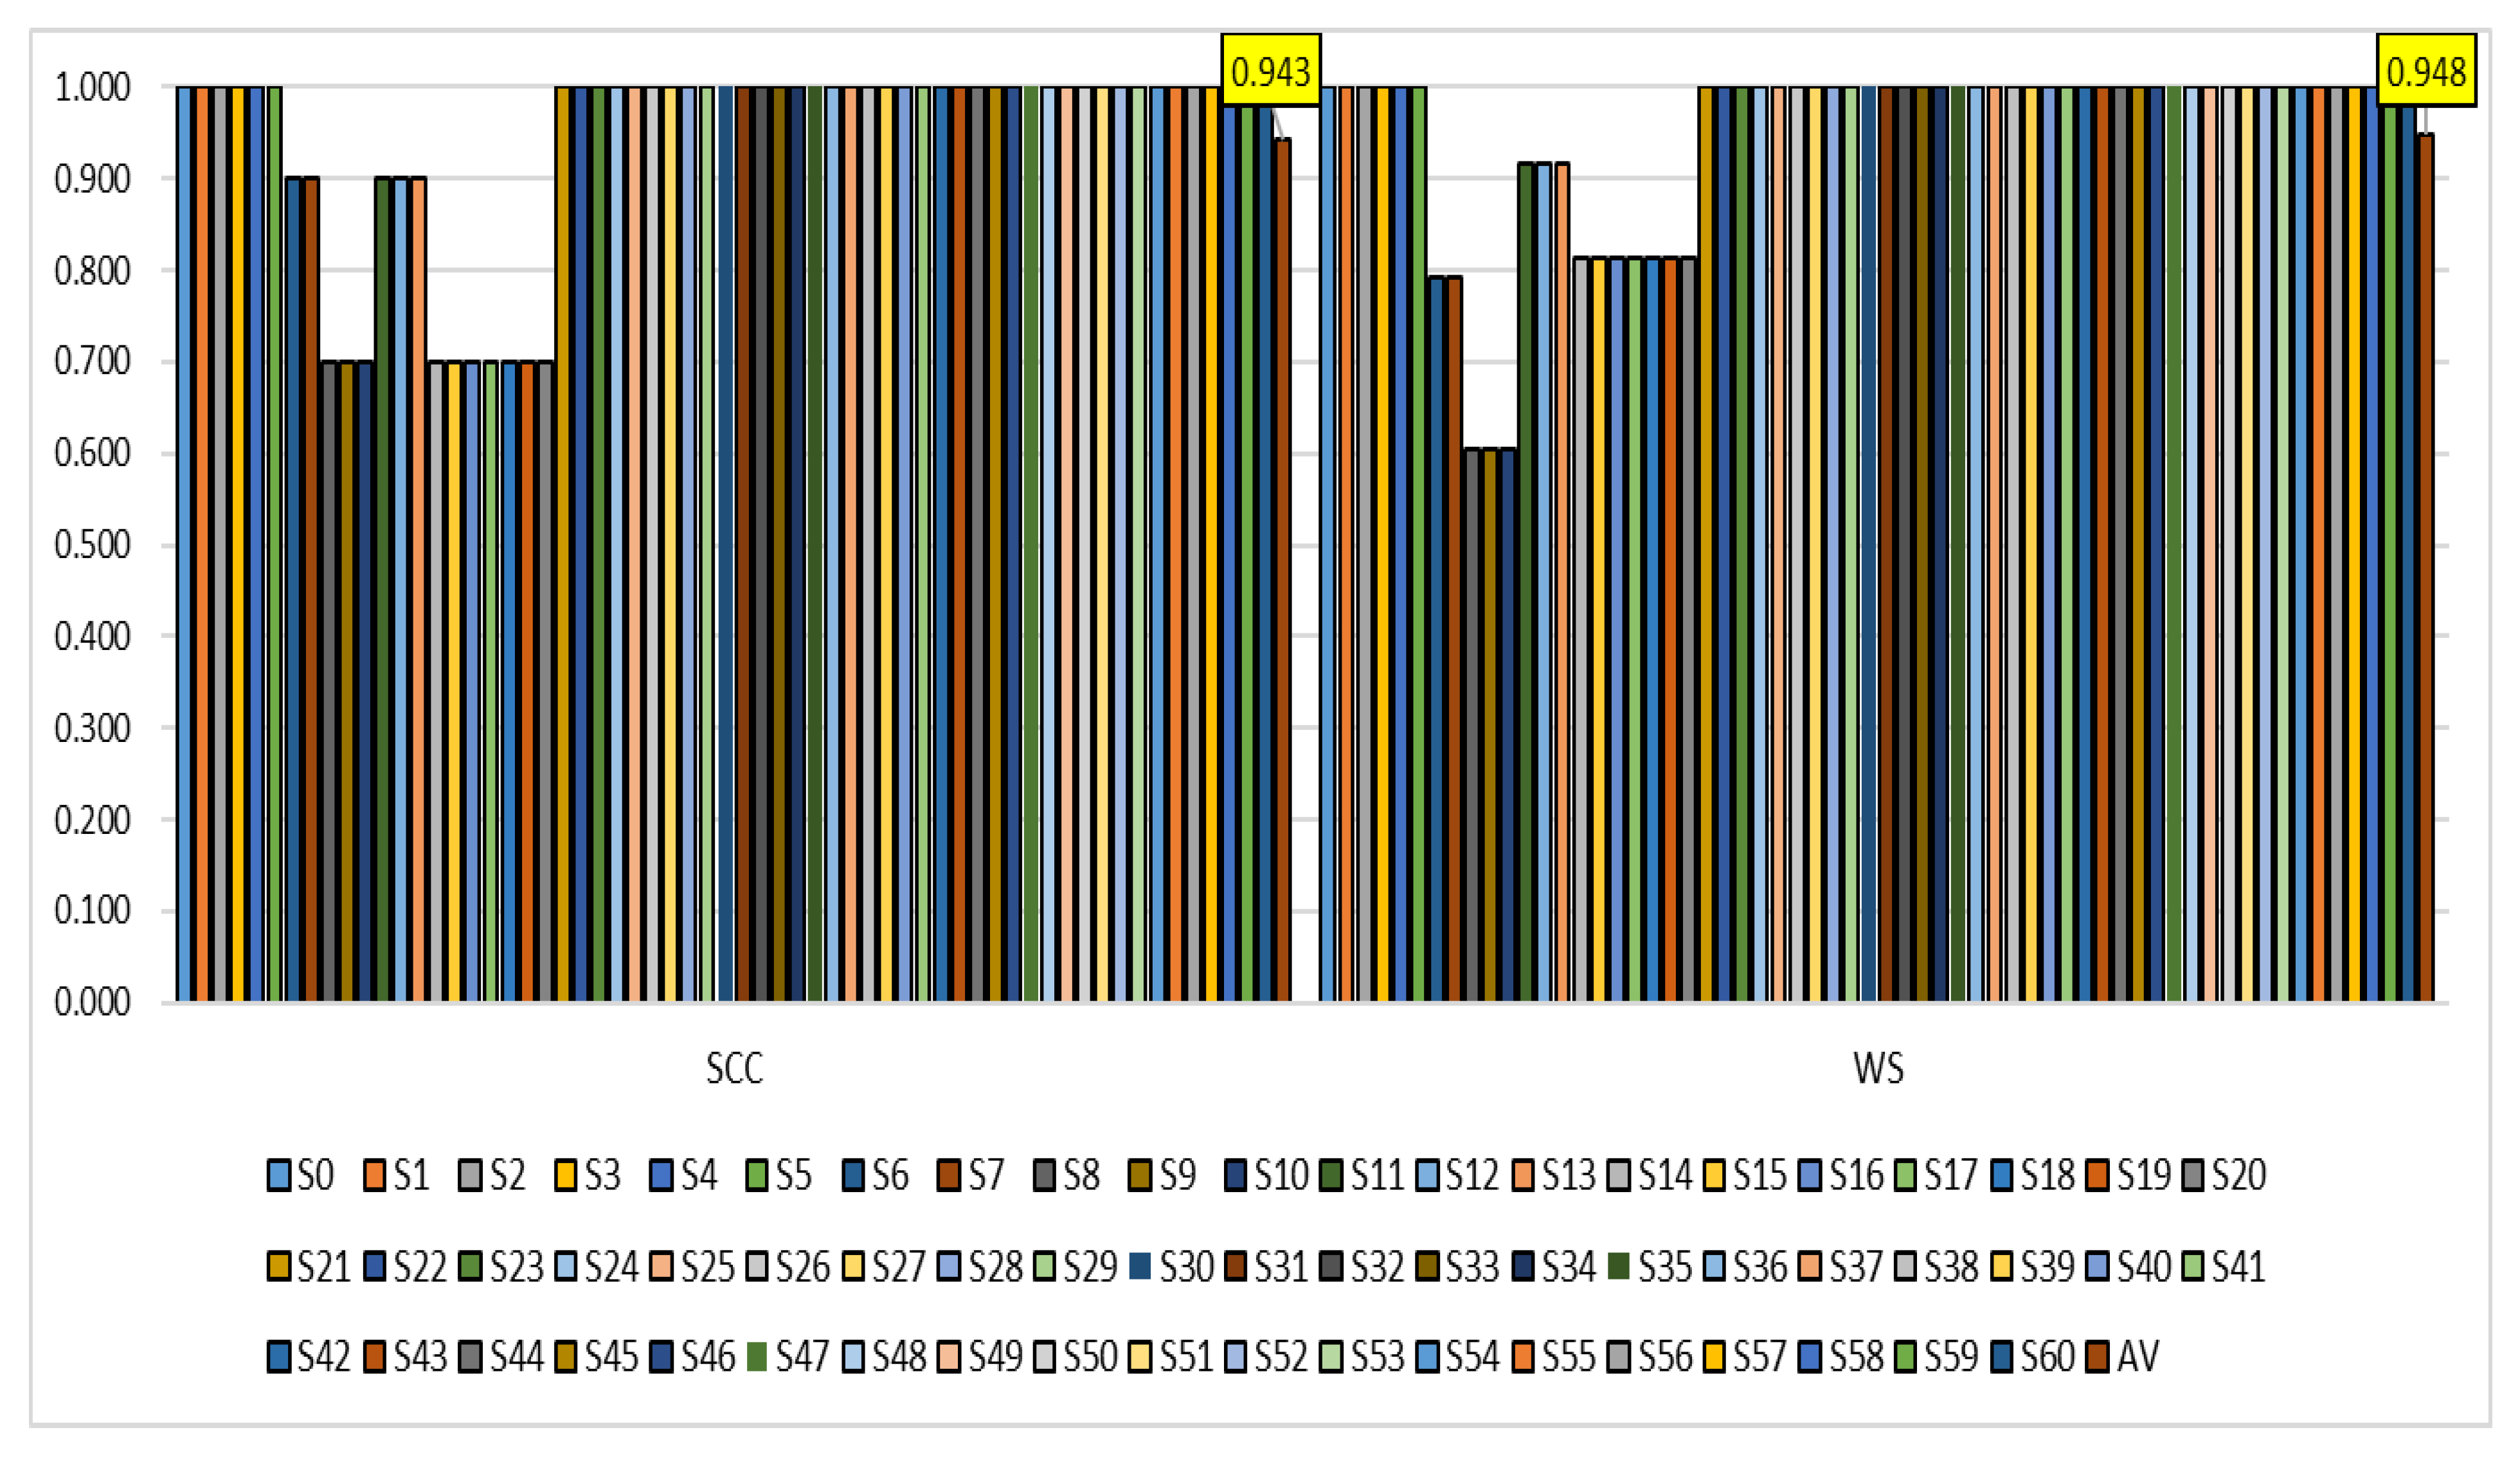
After sensitivity analysis, we performed a statistical correlation test, including the Spearman’s correlation coefficient (SCC) [63] and Wojciech Salabun (WS) coefficients [64] represented in Figure 3.
Figure 3.
Correlation test—calculated SCC and WS coefficients.
Besides the changes in the alternative ranking, we can conclude that the ranks had a high correlation (SCC = 0.943), while WS = 0.948.
6. Conclusions
Since suppliers are crucial to the success of the organizations in a supply chain, supplier selection is important in the supply chains. In recent decades, sustainability has become a viable response to the world’s depleting natural resources and growing social and environmental issues. In order to reduce environmental impacts, sustainability has been used in a variety of industrial procedures, with supplier selection being one of them. This study’s primary objective was to analyse and choose suppliers for a Turkish textile manufacturing based on their sustainability scores using a new hybrid model that incorporates grey numbers, BWM, and WISP methodologies. The supplier with the best performance was determined to be the supplier with the SP2 coded. The SP2 coded supplier is followed by the SP3 coded supplier. The SP3 coded supplier is followed by the SP1, SP4, and SP5 coded suppliers, respectively. The results of Grey WISP have been compared with the grey CODAS, grey COPRAS, grey MABAC, grey MAIRCA, and grey ARAS methods. The grey WISP, grey MAIRCA, and grey COPRAS methods obtained the same rankings of suppliers. In other words, the suppliers were ranked according to their performance, as follows: SP2, SP3, SP1, SP4, and SP5. However, small differences were observed in the rankings between the grey WISP method and grey CODAS, grey MABAC, and grey ARAS methods. According to the results of the grey CODAS and grey ARAS methods, the SP2 coded supplier is in the second place and the SP3 coded supplier is in the first place, unlike the grey WISP method. The rankings of other suppliers (SP1, SP4, SP5) remained the same. According to the results of the grey MABAC method, the SP4 coded supplier is in the fifth place and the SP5 coded supplier is in the fourth place, unlike the grey WISP method. The rankings of the other suppliers (SP1, SP2, SP3) remained the same. Despite the slight differences in the results, the Pearson correlation coefficient between all three methods (grey CODAS, grey ARAS, and grey MABAC) and the grey WISP method was determined to be 0.9. These results have confirmed that the developed grey WISP method is reliable with accurate results. After comparing the grey WISP method with the other grey MCDM methods, the weights of the criteria were changed, and the sensitivity analysis was conducted. In the sensitivity analysis, the criteria weights of P, LDR, DR, JSLH, EPE, and DO were changed to analyse the effect weight change. Based on 60 sets, which represented the new criteria values, there were significant changes in some scenarios. In scenarios S1–S5 and S21–S60, there were no changes in alternative ranking, but scenarios S6-S20 had significant changes in alternative ranking. In S6 and S7, the second and third alternatives replaced their position, so SP3 was determined as the best solution. In scenarios S8-S10, three alternatives (SP1, SP2, and SP3) changed their initial rank, so SP2 was in third place. These changes in alternative ranking mean that the most important criterion, P, had a large influence on the final alternative ranking. Additionally, the second most important criterion LDR had a large influence on alternative ranking because in scenarios S11-S20, only the best and worst alternative kept their position. Despite the change in criteria weights, it was found that SP5 was the last ranked alternative. After sensitivity analysis, a statistical correlation test including the SCC and WS coefficients was performed. According to the results of the statistical correlation, it can be concluded that the ranks have a high correlation. Thus, it has been determined that the developed grey WISP method is sensitive to changes in the criteria weights. The study makes two contributions to the literature. First, the WISP method’s grey extension was created first. As far as we are aware, the WISP approach had no grey extensions in the literature. Uncertainties that the crisp WISP technique cannot manage will be handled by the grey WISP approach. Second, this study is the first to combine the grey BWM and grey WISP approaches. This grey MCDM model can, therefore, account for uncertainties in the presence of small, sparse, and missing data.
The results of the developed model were shown to the experts, and the accuracy of the results was confirmed. According to experts, a higher amount of product can be purchased from the supplier with the SP2 code, and a tighter relationship can be worked out with this supplier. According to the same experts, the performance of SP4 and SP5 coded suppliers will be closely monitored, and more detailed performance analysis will be made.
This study has various limitations, even though it offered a comprehensive grey model. First, only subjective (expert judgments) data were employed in this study; no objective data were. By utilizing objective data from the factories, future research will be able to produce more comprehensive and effective results. Additionally, this study did not employ objective weighing techniques such as CRITIC, Entropy, or MEREC. One of these methods can be used in future studies to create a more robust model. Historical data were not included in this study; only subjective data were. By employing historical data, future research will be able to produce comprehensive results. Only 3 main criteria and 12 sub-criteria were assessed at in this study. Future research may take into account other factors and produce inclusive solutions. Additionally, no method has been used in this study for order allocation. However, one of the crucial steps in the supplier selection process is order allocation. A model that additionally takes order allocation into account might be presented in further investigations. Due to the WISP method’s recent development, its stochastic, neutrosophic, and plithogenic extensions have not yet been created. Therefore, these WISP approach extensions may be developed in further studies. Additionally, they can apply the grey WISP approach created in this study to address other MCDM issues (3PLs selection, logistics centre selection, ERP software selection, etc.). Additionally, future research can use the created grey WISP technique to address the sustainable supplier selection issue in other industries (chemical, machinery, automotive, etc.).
Author Contributions
Conceptualization, D.K. and G.P.; methodology, A.U., D.K., D.P. and A.T.; software, Ž.S. and D.P.; validation, A.U., Ž.S. and A.T.; formal analysis, A.U. and Ž.S.; investigation, D.P. and D.K.; resources, D.K. and D.P.; data curation, D.P., A.T. and G.P.; writing—original draft preparation, A.T.; writing—review and editing, A.T.; visualization, A.T.; supervision, A.U. All authors have read and agreed to the published version of the manuscript.
Funding
This research received no external funding.
Informed Consent Statement
Not applicable.
Data Availability Statement
Not applicable.
Conflicts of Interest
The authors declare no conflict of interest.
Appendix A
Table A1.
The Experts’ Evaluation of the Criteria.
References
- Durmić, E.; Stević, Ž.; Chatterjee, P.; Vasiljević, M.; Tomašević, M. Sustainable supplier selection using combined FUCOM–Rough SAW model. Rep. Mech. Eng. 2020, 1, 34–43. [Google Scholar] [CrossRef] [Scilit]
- Bohner, C.; Minner, S. Supplier selection under failure risk, quantity and business volume discounts. Comput. Ind. Eng. 2017, 104, 145–155. [Google Scholar] [CrossRef] [Scilit]
- Chattopadhyay, R.; Das, P.P.; Chakraborty, S. Development of a rough-MABAC-DoE-based metamodel for supplier selection in an iron and steel industry. Oper. Res. Eng. Sci. Theory Appl. 2022, 5, 20–40. [Google Scholar] [CrossRef] [Scilit]
- Akman, G.; Piskin, H. Evaluating green performance of suppliers via analytic network process and TOPSIS. J. Ind. Eng. 2013, 2013, 915241. [Google Scholar] [CrossRef] [Scilit]
- Đukić, T. Ranking factors that affect satisfaction and motivation of employees using the PIPRECIA method. J. Process Manag. New Technol. 2022, 10, 102–114. [Google Scholar] [CrossRef] [Scilit]
- Ulutaş, A.; Stanujkic, D.; Karabasevic, D.; Popovic, G.; Novaković, S. Pallet truck selection with MEREC and WISP-S methods. Strateg. Manag.-Int. J. Strateg. Manag. Decis. Support Syst. Strateg. Manag. 2022. online first. [Google Scholar] [CrossRef] [Scilit]
- Karamaşa, Ç. Ranking service quality using multi-criteria decision-making methods: Example of erzurum province. J. Process Manag. New Technol. 2021, 9, 1–12. [Google Scholar] [CrossRef] [Scilit]
- Popović, M. An MCDM approach for personnel selection using the CoCoSo method. J. Process Manag. New Technol. 2021, 9, 78–88. [Google Scholar] [CrossRef] [Scilit]
- Jauković-Jocić, K.; Karabašević, D.; Popović, G. An approach for e-learning courses evaluation based on the EDAS method. Ekonomika 2020, 66, 47–59. [Google Scholar] [CrossRef] [Scilit]
- Ulutaş, A. Supplier selection by using a fuzzy integrated model for a textile company. Eng. Econ. 2019, 30, 579–590. [Google Scholar] [CrossRef] [Scilit]
- Schramm, V.B.; Cabral, L.P.B.; Schramm, F. Approaches for supporting sustainable supplier selection—A literature review. J. Clean. Prod. 2020, 273, 123089. [Google Scholar] [CrossRef] [Scilit]
- Govindan, K.; Rajendran, S.; Sarkis, J.; Murugesan, P. Multi criteria decision making approaches for green supplier evaluation and selection: A literature review. J. Clean. Prod. 2015, 98, 66–83. [Google Scholar] [CrossRef] [Scilit]
- Zimmer, K.; Fröhling, M.; Schultmann, F. Sustainable supplier management–a review of models supporting sustainable supplier selection, monitoring and development. Int. J. Prod. Res. 2016, 54, 1412–1442. [Google Scholar] [CrossRef] [Scilit]
- De Boer, L.; Labro, E.; Morlacchi, P. A review of methods supporting supplier selection. Eur. J. Purch. Supply Manag. 2001, 7, 75–89. [Google Scholar] [CrossRef] [Scilit]
- Ho, W.; Xu, X.; Dey, P.K. Multi-criteria decision making approaches for supplier evaluation and selection: A literature review. Eur. J. Oper. Res. 2010, 202, 16–24. [Google Scholar] [CrossRef] [Scilit]
- Khan, S.A.R.; Yu, Z.; Golpira, H.; Sharif, A.; Mardani, A. A state-of-the-art review and meta-analysis on sustainable supply chain management: Future research directions. J. Clean. Prod. 2021, 278, 123357. [Google Scholar] [CrossRef] [Scilit]
- Awasthi, A.; Chauhan, S.S.; Goyal, S.K. A fuzzy multicriteria approach for evaluating environmental performance of suppliers. Int. J. Prod. Econ. 2010, 126, 370–378. [Google Scholar] [CrossRef] [Scilit]
- Kuo, R.J.; Lin, Y.J. Supplier selection using analytic network process and data envelopment analysis. Int. J. Prod. Res. 2012, 50, 2852–2863. [Google Scholar] [CrossRef] [Scilit]
- Amindoust, A.; Ahmed, S.; Saghafinia, A.; Bahreininejad, A. Sustainable supplier selection: A ranking model based on fuzzy inference system. Appl. Soft Comput. 2012, 12, 1668–1677. [Google Scholar] [CrossRef] [Scilit]
- Govindan, K.; Khodaverdi, R.; Jafarian, A. A fuzzy multi criteria approach for measuring sustainability performance of a supplier based on triple bottom line approach. J. Clean. Prod. 2013, 47, 345–354. [Google Scholar] [CrossRef] [Scilit]
- Orji, I.; Wei, S. A decision support tool for sustainable supplier selection in manufacturing firms. J. Ind. Eng. Manag. 2014, 7, 1293–1315. [Google Scholar] [CrossRef] [Scilit]
- Jia, P.; Govindan, K.; Choi, T.M.; Rajendran, S. Supplier selection problems in fashion business operations with sustainability considerations. Sustainability 2015, 7, 1603–1619. [Google Scholar] [CrossRef] [Scilit]
- Jiang, X.L.; Wu, Z.B.; Yang, Y. A fuzzy DEMATEL method to analyze the criteria for sustainable supplier selection. In Proceedings of the 2016 International Conference on Green Building, Materials and Civil Engineering (GBMCE 2016), Hong Kong, China, 26–27 April 2016. [Google Scholar]
- Luthra, S.; Govindan, K.; Kannan, D.; Mangla, S.K.; Garg, C.P. An integrated framework for sustainable supplier selection and evaluation in supply chains. J. Clean. Prod. 2017, 140, 1686–1698. [Google Scholar] [CrossRef] [Scilit]
- Khan, S.A.; Kusi-Sarpong, S.; Arhin, F.K.; Kusi-Sarpong, H. Supplier sustainability performance evaluation and selection: A framework and methodology. J. Clean. Prod. 2018, 205, 964–979. [Google Scholar] [CrossRef] [Scilit]
- Wang, C.N.; Nguyen, V.T.; Thai, H.T.N.; Tran, N.N.; Tran, T.L.A. Sustainable supplier selection process in edible oil production by a hybrid fuzzy analytical hierarchy process and green data envelopment analysis for the SMEs food processing industry. Mathematics 2018, 6, 302. [Google Scholar] [CrossRef] [Scilit]
- Durmić, E. Evaluation of criteria for sustainable supplier selection using FUCOM method. Oper. Res. Eng. Sci. Theory Appl. 2019, 2, 91–107. [Google Scholar] [CrossRef] [Scilit]
- Memari, A.; Dargi, A.; Jokar, M.R.A.; Ahmad, R.; Rahim, A.R.A. Sustainable supplier selection: A multi-criteria intuitionistic fuzzy TOPSIS method. J. Manuf. Syst. 2019, 50, 9–24. [Google Scholar] [CrossRef] [Scilit]
- Rani, P.; Mishra, A.R.; Krishankumar, R.; Mardani, A.; Cavallaro, F.; Soundarapandian Ravichandran, K.; Balasubramanian, K. Hesitant fuzzy SWARA-complex proportional assessment approach for sustainable supplier selection (HF-SWARA-COPRAS). Symmetry 2020, 12, 1152. [Google Scholar] [CrossRef] [Scilit]
- Stević, Ž.; Pamučar, D.; Puška, A.; Chatterjee, P. Sustainable supplier selection in healthcare industries using a new MCDM method: Measurement of alternatives and ranking according to COmpromise solution (MARCOS). Comput. Ind. Eng. 2020, 140, 106231. [Google Scholar] [CrossRef] [Scilit]
- Shang, Z.; Yang, X.; Barnes, D.; Wu, C. Supplier selection in sustainable supply chains: Using the integrated BWM, fuzzy Shannon entropy, and fuzzy MULTIMOORA methods. Expert Syst. Appl. 2022, 195, 116567. [Google Scholar] [CrossRef] [Scilit]
- Tong, L.Z.; Wang, J.; Pu, Z. Sustainable supplier selection for SMEs based on an extended PROMETHEE Ⅱ approach. J. Clean. Prod. 2022, 330, 129830. [Google Scholar] [CrossRef] [Scilit]
- Xue, M.; Fu, C.; Feng, N.P.; Lu, G.Y.; Chang, W.J.; Yang, S.L. Evaluation of supplier performance of high-speed train based on multi-stage multi-criteria decision-making method. Knowl.-Based Syst. 2018, 162, 238–251. [Google Scholar] [CrossRef] [Scilit]
- Dickson, G.W. An analysis of vendor selection systems and decisions. J. Purch. 1966, 2, 5–17. [Google Scholar] [CrossRef] [Scilit]
- Weber, C.A.; Current, J.R.; Benton, W.C. Vendor selection criteria and methods. Eur. J. Oper. Res. 1991, 50, 2–18. [Google Scholar] [CrossRef] [Scilit]
- Beamon, B.M. Designing the green supply chain. Logist. Inf. Manag. 1999, 12, 332–342. [Google Scholar] [CrossRef] [Scilit]
- Chan, F.T. Performance measurement in a supply chain. Int. J. Adv. Manuf. Technol. 2003, 21, 534–548. [Google Scholar] [CrossRef] [Scilit]
- Handfield, R.; Walton, S.V.; Sroufe, R.; Melnyk, S.A. Applying environmental criteria to supplier assessment: A study in the application of the Analytical Hierarchy Process. Eur. J. Oper. Res. 2002, 141, 70–87. [Google Scholar] [CrossRef] [Scilit]
- Ciliberti, F.; Pontrandolfo, P.; Scozzi, B. Logistics social responsibility: Standard adoption and practices in Italian companies. Int. J. Prod. Econ. 2008, 113, 88–106. [Google Scholar] [CrossRef] [Scilit]
- Bai, C.; Sarkis, J. Integrating sustainability into supplier selection with grey system and rough set methodologies. Int. J. Prod. Econ. 2010, 124, 252–264. [Google Scholar] [CrossRef] [Scilit]
- Kizielewicz, B.; Więckowski, J.; Shekhovtsov, A.; Wątróbski, J.; Depczyński, R.; Sałabun, W. Study towards the time-based mcda ranking analysis–a supplier selection case study. Facta Univ. Ser. Mech. Eng. 2021, 19, 381–399. [Google Scholar] [CrossRef] [Scilit]
- Fazlollahtabar, H.; Kazemitash, N. Green supplier selection based on the information system performance evaluation using the integrated Best-Worst Method. Facta Univ. Ser. Mech. Eng. 2021, 19, 345–360. [Google Scholar] [CrossRef] [Scilit]
- Jana, C.; Pal, M.; Wang, J. A robust aggregation operator for multi-criteria decision-making method with bipolar fuzzy soft environment. Iran. J. Fuzzy Syst. 2019, 16, 1–16. [Google Scholar]
- Jana, C.; Pal, M. A dynamical hybrid method to design decision making process based on GRA approach for multiple attributes problem. Eng. Appl. Artif. Intell. 2021, 100, 104203. [Google Scholar] [CrossRef] [Scilit]
- Jana, C.; Pal, M. Extended bipolar fuzzy EDAS approach for multi-criteria group decision-making process. Comput. Appl. Math. 2021, 40, 9. [Google Scholar] [CrossRef] [Scilit]
- Jana, C. Multiple attribute group decision-making method based on extended bipolar fuzzy MABAC approach. Comput. Appl. Math. 2021, 40, 227. [Google Scholar] [CrossRef] [Scilit]
- Arora, H.D.; Naithani, A. Significance of TOPSIS approach to MADM in computing exponential divergence measures for pythagorean fuzzy sets. Decis. Mak. Appl. Manag. Eng. 2022, 5, 246–263. [Google Scholar] [CrossRef] [Scilit]
- Das, A.K. FP-intuitionistic multi fuzzy N-soft set and its induced FP-Hesitant N soft set in decision-making. Decis. Mak. Appl. Manag. Eng. 2022, 5, 67–89. [Google Scholar] [CrossRef] [Scilit]
- Riaz, M.; Athar Farid, H.M. Picture fuzzy aggregation approach with application to third-party logistic provider selection process. Rep. Mech. Eng. 2022, 3, 318–327. [Google Scholar] [CrossRef] [Scilit]
- Ashraf, A.; Ullah, K.; Hussain, A.; Bari, M. Interval-Valued Picture Fuzzy Maclaurin Symmetric Mean Operator with application in Multiple Attribute Decision-Making. Rep. Mech. Eng. 2022, 3, 301–317. [Google Scholar] [CrossRef] [Scilit]
- Liu, S.; Lin, Y. Grey Information: Theory and Practical Applications; Springer Science & Business Media: London, UK, 2006. [Google Scholar]
- Xia, X.; Govindan, K.; Zhu, Q. Analyzing internal barriers for automotive parts remanufacturers in China using grey-DEMATEL approach. J. Clean. Prod. 2015, 87, 811–825. [Google Scholar] [CrossRef] [Scilit]
- Ulutas, A. A grey hybrid model to select the optimal third-party logistics provider. S. Afr. J. Ind. Eng. 2021, 32, 171–181. [Google Scholar] [CrossRef] [Scilit]
- Liu, S.; Forrest, J.Y.L. Grey Systems: Theory and Applications; Springer Science & Business Media: Berlin, Germany, 2010. [Google Scholar]
- Liu, S.; Rui, H.; Fang, Z.; Yang, Y.; Forrest, J. Explanation of terms of grey numbers and its operations. Grey Syst. Theory Appl. 2016, 6, 436–441. [Google Scholar] [CrossRef] [Scilit]
- Rezaei, J. Best-worst multi-criteria decision-making method. Omega 2015, 53, 49–57. [Google Scholar] [CrossRef] [Scilit]
- Guo, S.; Zhao, H. Fuzzy best-worst multi-criteria decision-making method and its applications. Knowl.-Based Syst. 2017, 121, 23–31. [Google Scholar] [CrossRef] [Scilit]
- Ghoushchi, S.J.; Yousefi, S.; Khazaeili, M. An extended FMEA approach based on the Z-MOORA and fuzzy BWM for prioritization of failures. Appl. Soft Comput. 2019, 81, 105505. [Google Scholar] [CrossRef] [Scilit]
- Stanujkic, D.; Popovic, G.; Karabasevic, D.; Meidute-Kavaliauskiene, I.; Ulutaş, A. An integrated simple weighted sum product method—WISP. IEEE Trans. Eng. Manag. 2021. early access. [Google Scholar] [CrossRef] [Scilit]
- Kumar, A. Transition management theory-based policy framework for analyzing environmentally responsible freight transport practices. J. Clean. Prod. 2021, 294, 126209. [Google Scholar] [CrossRef] [Scilit]
- Tekstil ve Hammaddeleri Sektör Raporu (Textile and Raw Materials Industry Report). Available online: https://ticaret.gov.tr/data/5b87000813b8761450e18d7b/Tekstil%20ve%20Hammaddeleri%20Raporu.pdf (accessed on 16 September 2022). (In Turkish)
- Mešić, A.; Miškić, S.; Stević, Z.; Mastilo, Z. Hybrid MCDM solutions for evaluation of the logistics performance index of the Western Balkan countries. Econ.-Innov. Res. J. 2022, 10, 13–34. [Google Scholar] [CrossRef] [Scilit]
- Bouraima, M.B.; Stević, Ž.; Tanackov, I.; Qiu, Y. Assessing the performance of Sub-Saharan African (SSA) railways based on an integrated Entropy-MARCOS approach. Oper. Res. Eng. Sci. Theory Appl. 2021, 4, 13–35. [Google Scholar] [CrossRef] [Scilit]
- Sałabun, W.; Urbaniak, K. A new coefficient of rankings similarity in decision-making problems. In Proceedings of the International Conference on Computational Science, Amsterdam, The Netherlands, 3–5 June 2020. [Google Scholar]

Publisher’s Note: MDPI stays neutral with regard to jurisdictional claims in published maps and institutional affiliations. |
© 2022 by the authors. Licensee MDPI, Basel, Switzerland. This article is an open access article distributed under the terms and conditions of the Creative Commons Attribution (CC BY) license (https://creativecommons.org/licenses/by/4.0/).