


Abstract
The eco-economic system is a complex system based on human activities, and the sustainability of the eco-economic system needs to maintain the balance between the three subsystems of society, economy, and environment. In this work, a comprehensive evaluation index system of the ecological-economic system of Liaoning Province in China was constructed by combining the emergy analysis and the system dynamic (SD) model, and four development scenarios were designed by adjusting the influencing factors of the ecological-economic system, based on the simulation and evaluation of the sustainable ecological and economic development of Liaoning Province from 2017 through to the next 19 years. The conclusion shows that, under the scenario of coordinated development type, the GDP, emergy density, and emergy output rate of Liaoning Province show an increasing trend; the ecological load, such as waste emergy ratio and environmental load rate, is small; and the sustainable development index and emergy sustainable development index are at a high level compared to other programs.
1. Introduction
With the acceleration of industrialization and urbanization, the connection among the three subsystems of society, economy, and environment has become very close. The intensification of human activities has led to an inadequate supply of resources. For instance, population growth has led to poor environmental quality and land intensification [1,2]. The intensification of industrial activities consumes a large number of non-renewable resources, reducing environmental resources [3]. The discharge of waste increases the carrying capacity of the environment [4,5], thus restricting the development of the economy. These problems have affected the sustainable development of the ecological-economic system. Sustainable development includes the coordinated development of the three subsystems of society, economy, and environment. The development model aims to seek to coordinate resources and environment, economy, and society, and to adjust the balance between society, economy, and environment to achieve overall optimization, so that sustainability can exist for a long time and meet the needs of contemporary reality and future development [6]. Sustainable development scenario analysis and evaluation are the foundation of regional ecological economic construction and development.
The units of each factor are different between subsystems, the evaluation criteria are also different, and its comprehensive impact cannot be evaluated. Therefore, it is necessary to construct a set of common evaluation criteria to break these constraints, so as to evaluate and analyze the entire ecological-economic system. The emergy analysis method takes solar energy as the standard, and converts different types of incomparable energy in the ecosystem into the same standard emergy, and then judges its contribution to the system [7,8]. Solar emergy is the amount of solar energy contained in any flowing or stored energy and its unit is solar emjoules (sej). Ulgiati and Brown embedded a series of sustainable development indicators into emergy analysis, quantitatively analyzed the relationship between nature and economy, and explained the application of emergy in sustainable development [9,10]. Emergy analysis is widely used in research on the sustainable development of the ecological-economic system: in view of a natural ecosystem, Zhan et al. combined the emergy analysis method with the mountain eco-hydrological model to carry out vegetation analysis on the forest system of Huanjiang County [11]; Ma et al. evaluated the forest and aquatic ecosystems in Beijing Ecological Reserve using a combination of emergy and impact matrix [12]; Song et al. evaluated the sustainable development status of wetland ecosystems in Northeast China using emergy analysis [13]. In view of agricultural ecosystems, Ma et al. analyzed the agricultural ecosystem of Luancheng County in North China [14]. In view of regional eco-economic systems, Su and Koppiahraj conducted emergy analysis on the agricultural system and industrial system, respectively, on the national level [15,16]; Chen et al. and Yu et al. conducted the sustainable development of the regional ecological-economic system in Yunnan Province and individual provinces from a regional perspective analysis [17,18]; Santagata et al. and Pan et al. conducted a city-level analysis of the circular economy in Naples, Italy, and the sustainable development of Simao, China, respectively [19,20]. With the aid of an emergy ternary diagram, Zhao et al. analyzed the sustainability of an eco-industrial park [21] and green concrete production mode [22]. However, as a static evaluation analysis method, the results of the emergy analysis method cannot fully show the actual development of the complex and changeable ecological-economic system. Therefore, the dynamic aspects need to be analyzed, mainly through finding a tool that can dynamically reflect the changing state of the system, complement the emergy analysis method, and analyze the sustainable development status of the eco-economic system in all aspects.
As a decision analysis tool, system dynamics can describe the relationships and interactions among various elements of the system through computer modeling technology, and perform dynamic simulation analysis to show the changing trend of the system. Since both emergy and system dynamics involve ecological thermodynamic theory, Odum (1988) first combined the concept of system dynamics modeling with systems ecology to analyze the feedback relationship between energy flow and material conversion in ecosystems. Since then, system dynamics has been widely used in the field of sustainable development of eco-economic systems. Zhou et al. constructed a dynamic model of energy conservation and emission reduction from government, economy, population, science and technology, and energy environment [23], and Jiang et al. combined the emergy analysis method with the system dynamics method to discuss the development of agroecosystems in Heilongjiang Province, China [24]. Thomas et al. made recommendations for urban planning by integrating system dynamics and carbon emissions [25]. Fang et al. explored the relationship between economic growth and environmental protection by establishing the SD model of Beijing’s urban ecological-economic system [26]. Using an emergy accounting and SD model, Zhao et al. proposed a dynamic evaluation method for the sustainable development of eco-industrial parks and conducted an empirical analysis [27].
In general, the combination of emergy analysis and SD can better simulate the development of the system for quantitative and qualitative analysis and from dynamic and static aspects. However, the number of studies combining them is still very small, and most of them focus on agriculture, economy, environmental protection, and other individual fields, or on the city level, and there is a lack of research on the whole society, economy, ecosystem, and a larger spatial scale (such as the provincial level).
The purpose of this research was to explore the sustainable development path of the ecological-economic system in Liaoning Province. First, we conducted an evaluation on the basis of the development by establishing an emergy evaluation index system. Then, we embedded the emergy evaluation index system into the system dynamics model, and set different development scenarios to evaluate and predict the sustainable development status and trend of the ecological economy under the background of urbanization. Finally, by comparing with the corresponding indicators, the problems existing in development were corrected in a timely manner.
2. Methodology
2.1. Emergy Analysis
2.1.1. Emergy Flow Chart
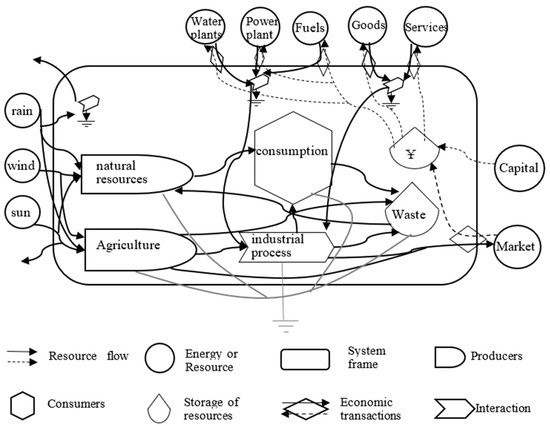
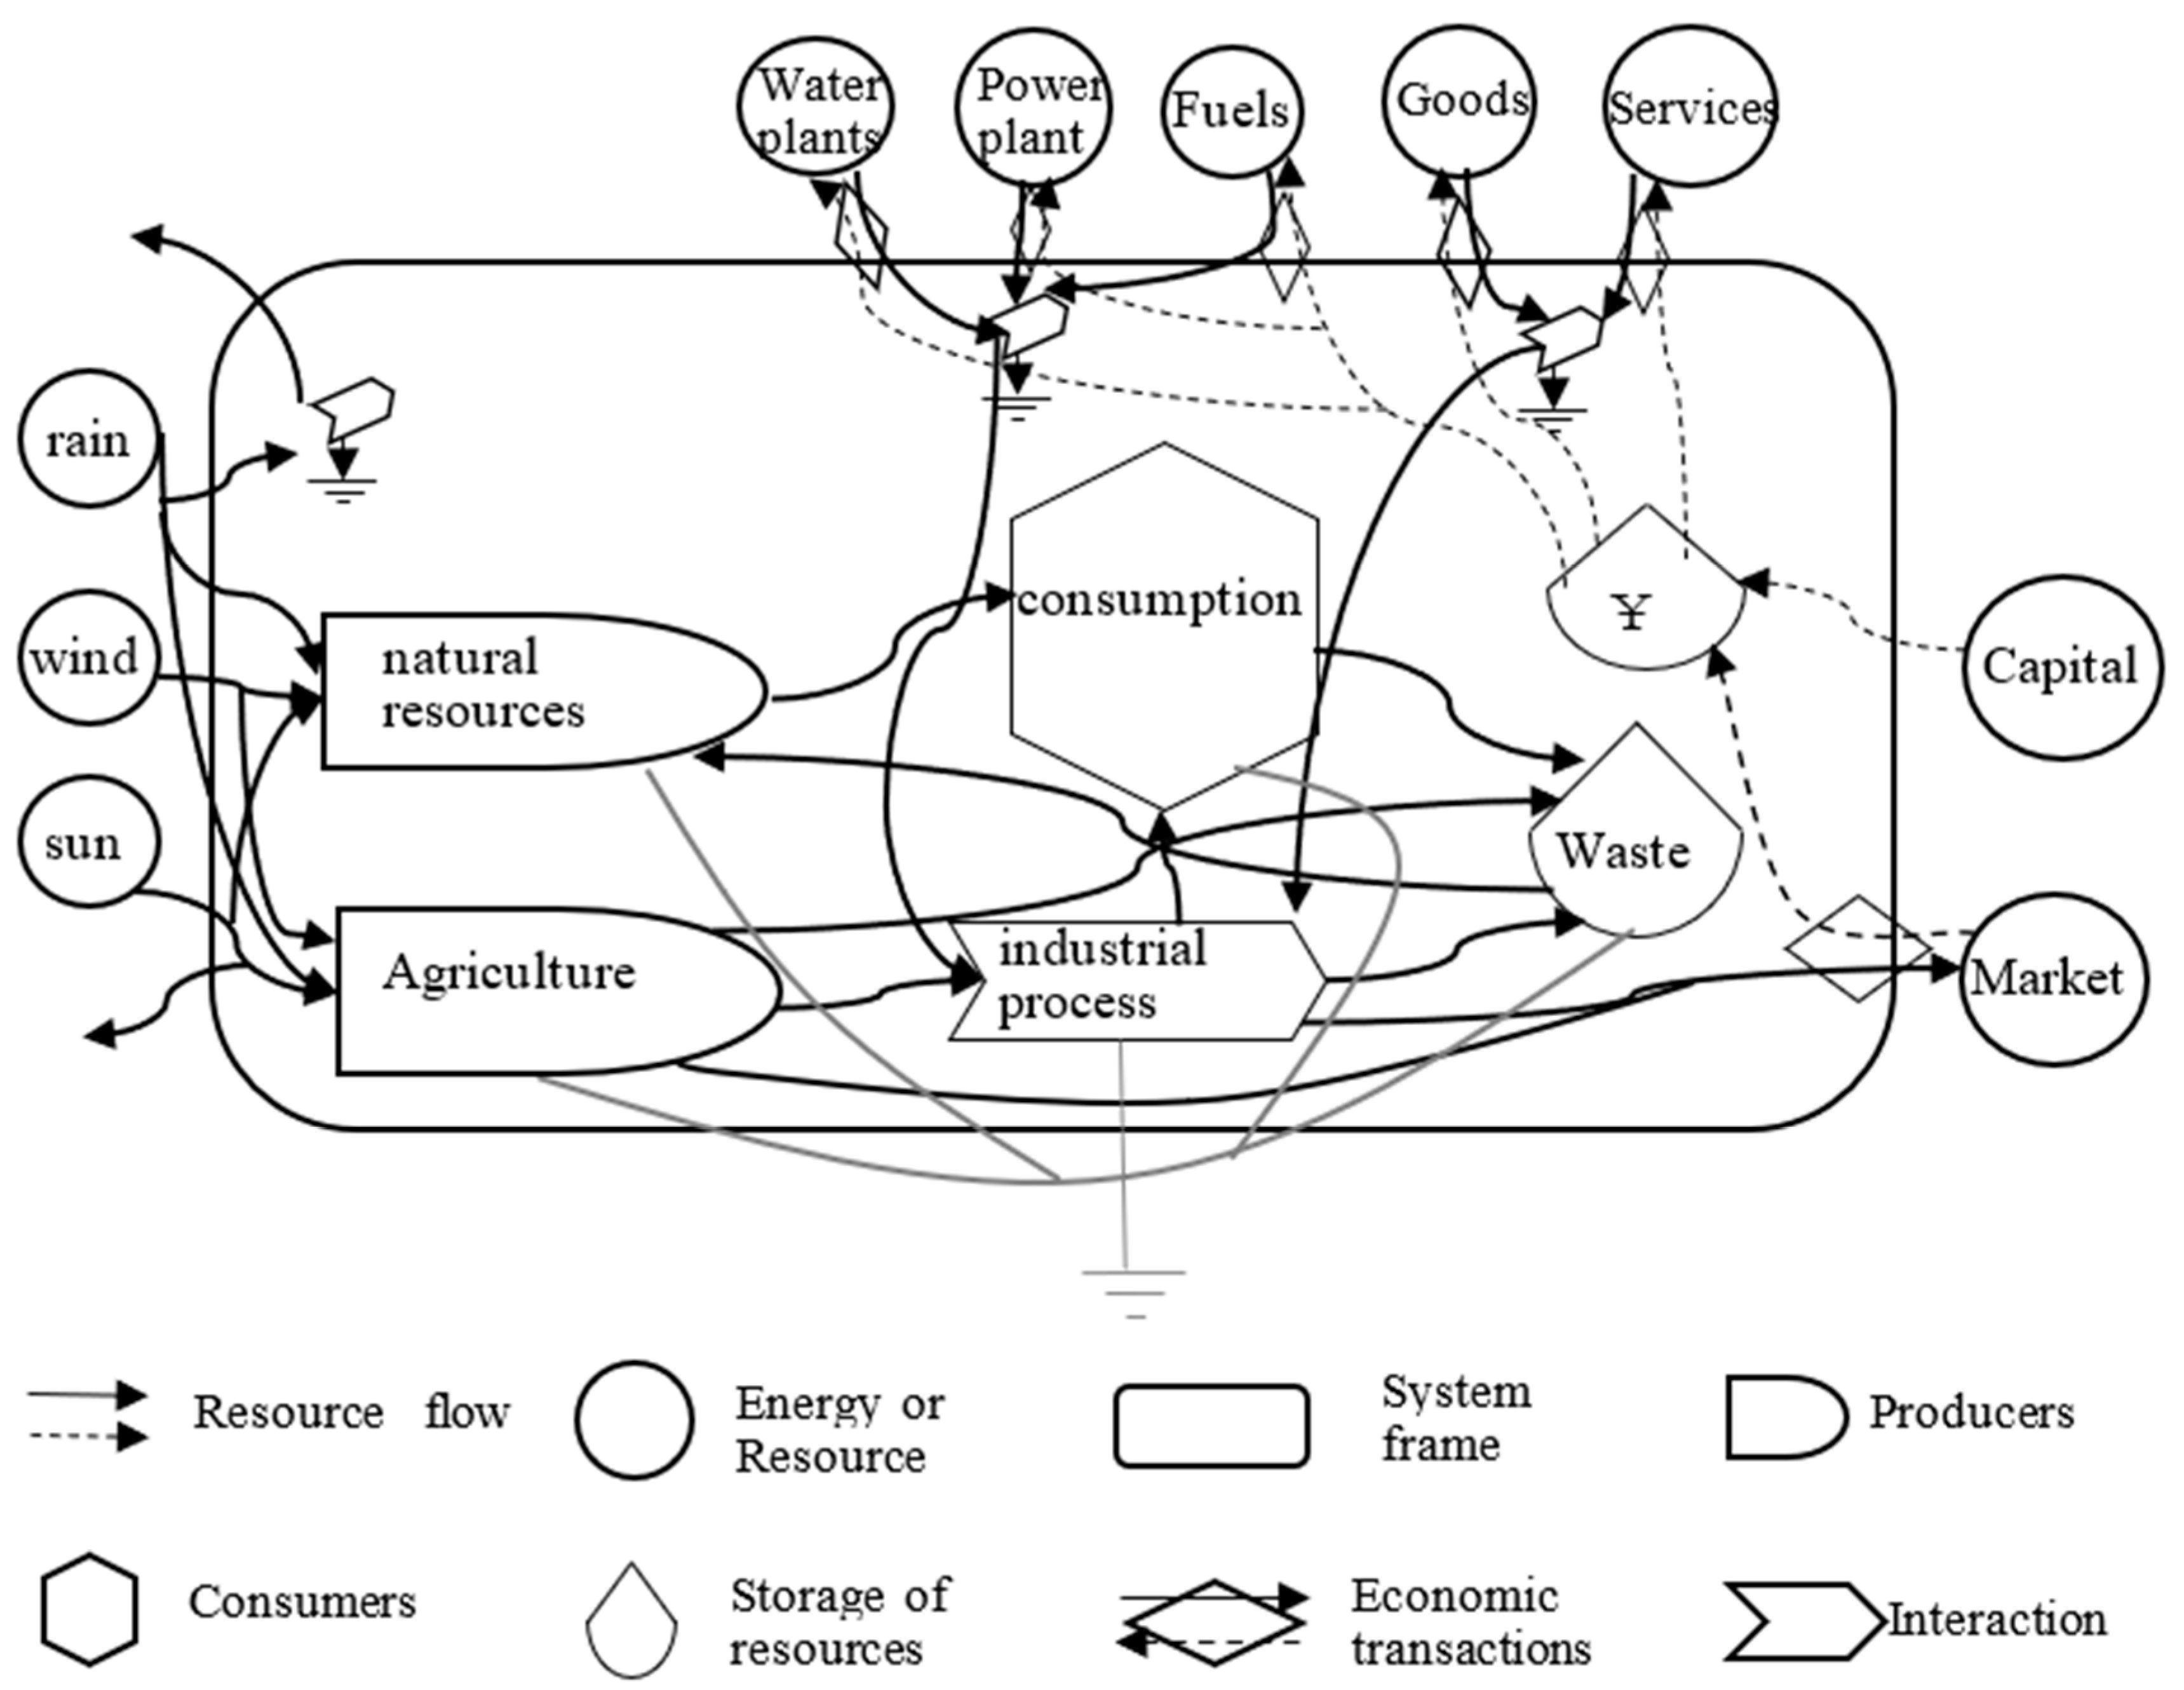
Emergy analysis is applied to socio-economic systems and ecosystems with energy as the main driving force [8]. Emergy analysis on Liaoning Province was taken as the research object, and emergy flow analysis is given here. To clarify the basic structure of the system, internal and external relations, and the direction of the main ecological flow, the emergy input and output map with flow on the eco-economic system of Liaoning Province (2017) is given, as shown in Figure 1.
Figure 1.
Emergy flow map of the ecological and economic system in Liaoning Province.
The eco-economic system is composed of three subsystems: society, economy, and environment, and the interaction among input, output stream, and system components. Renewable resources, such as sun, wind, and rainwater, and non-renewable resources, such as coal in the environmental subsystem and the purchased emergy of the economic subsystems, such as goods, services, and a combination of those, are input into the social subsystem through the flow of emergy. The social subsystem realizes the transformation of emergy in different products and returns the transformed waste emergy to the environmental subsystem. The economic subsystem provides capital security for the other two systems through feedback input and the three complement each other.
2.1.2. Emergy Evaluation Index System
The emergy evaluation index system comprehensively reflects the structure, function, and efficiency of the ecological-economic system, realizes the effective connection of the evaluation of the system from the social, economic, and ecological environment, and is an important indicator system for systematic comprehensive analysis and social and economic development decision making [28]. The research results of Liu et al. divide the index categories into emergy flow, social subsystem index, economic subsystem index, environmental subsystem index, and synthesis [29,30]. There are 5 types of efficiency indicators, and the emergy evaluation index system of the ecological and economic system was established as shown in Table 1.
Table 1.
Eco-economic system emergy evaluation index system.
2.2. Dynamics Model
2.2.1. Social Subsystem Analysis
The social subsystem mainly examines the distribution of emergy and the changes of emergy flow in regions. Human production and service produce a large amount of resource consumption and emission of domestic pollutants, affecting economic development and the improvement of the ecological environment, and changes in population size and structure also influence the currency flow subsystem. Social subsystem indicators include ED and EER.
ED is a measure of the total emergy within the unit area with the formula:
where U is the total emergy usage, U = R + N + IMP, and is the unit area of the area.
EER measures the ratio of emergy inflow to emergy outflow, and the formula is:
CC is used to measure the degree of impact of per capita resource consumption and waste emissions on the ecological environment. The formula is:
where Y is the total population. The change in the total population is affected by the birth rate, mortality rate, and net migration rate, and it is calculated as:
where Yt represents the population at the end of the t year (10,000 people), Yt−1 represents the population at the end of the t − 1 (10,000 people), X1 is the number of births in the t year (10,000 people), X2 is the number of deaths in the t year (10,000 people), and X3 is the net migration population (10,000 people) in the t year. The structural and quantitative changes of the population have a fundamental impact on economic growth, and the population number in this paper is calculated through natural and mechanical changes.
2.2.2. Economic Subsystem Analysis
The economic subsystem is used to simulate the total economic volume, the inflow and outflow of money. Currency inflows include GDP, actual utilization of foreign capital, exports, and international tourism revenues, and currency outflows mainly consider new fixed asset investment and import goods expenditure. Economic subsystem indicators include EYR and EDR.
EYR measures the total amount of emergy produced by the input emergy in units, with the formula:
EDR is used to measure the emergy required for the unit GDP, and the formula is:
where GDP can be expressed as a function of technological progress, capital, and labor input. In this research, the Cobb–Douglas production function prediction of the economic mathematical model was used to study the change of regional GDP. Assume that it is a constant remuneration type, that is, α + β = 1. The GDP calculation formula is:
The logarithm is:
where GDPt represents the total economic volume of the t year (100 million), A(t) is the level of technological progress, Lt denotes the labor force population invested in the t year (10,000 people), and Kt represents the investment in fixed assets (100 million) for the t year. α, β is the elasticity coefficient of labor and capital output. In Equation (8), logarithmic processing was taken to reduce data volatility.
According to the Equations (7) and (8), we calculated the scientific and technological progress coefficient of Liaoning Province from 2010 to 2017 by fitting the known total industrial output value, labor force population, fixed asset investment, and labor and capital elasticity coefficients of Liaoning Province.
2.2.3. Environmental Subsystem Analysis
The environmental subsystem simulates the flow of emergy and environmental pressure, the emergy flow of renewable resources, non-renewable resources, output products and services in the environmental subsystem, and the recycling of waste emergy. The development of clean emergy and environmental protection technology affect environmental subsystems. Environmental subsystem metrics include EWR and ELR.
EWR is used to measure the ratio of waste to total emergy consumption, and the formula is:
ELR measures the impact of emergy inputs on ecosystems from non-renewable resources.
2.2.4. Comprehensive Efficiency Analysis
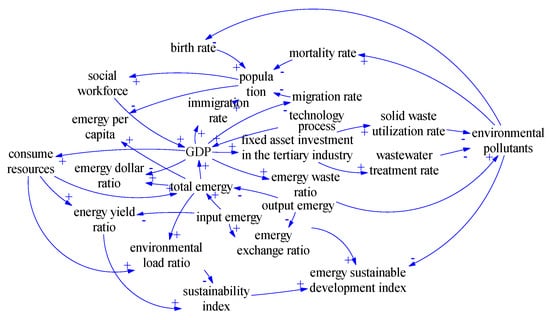
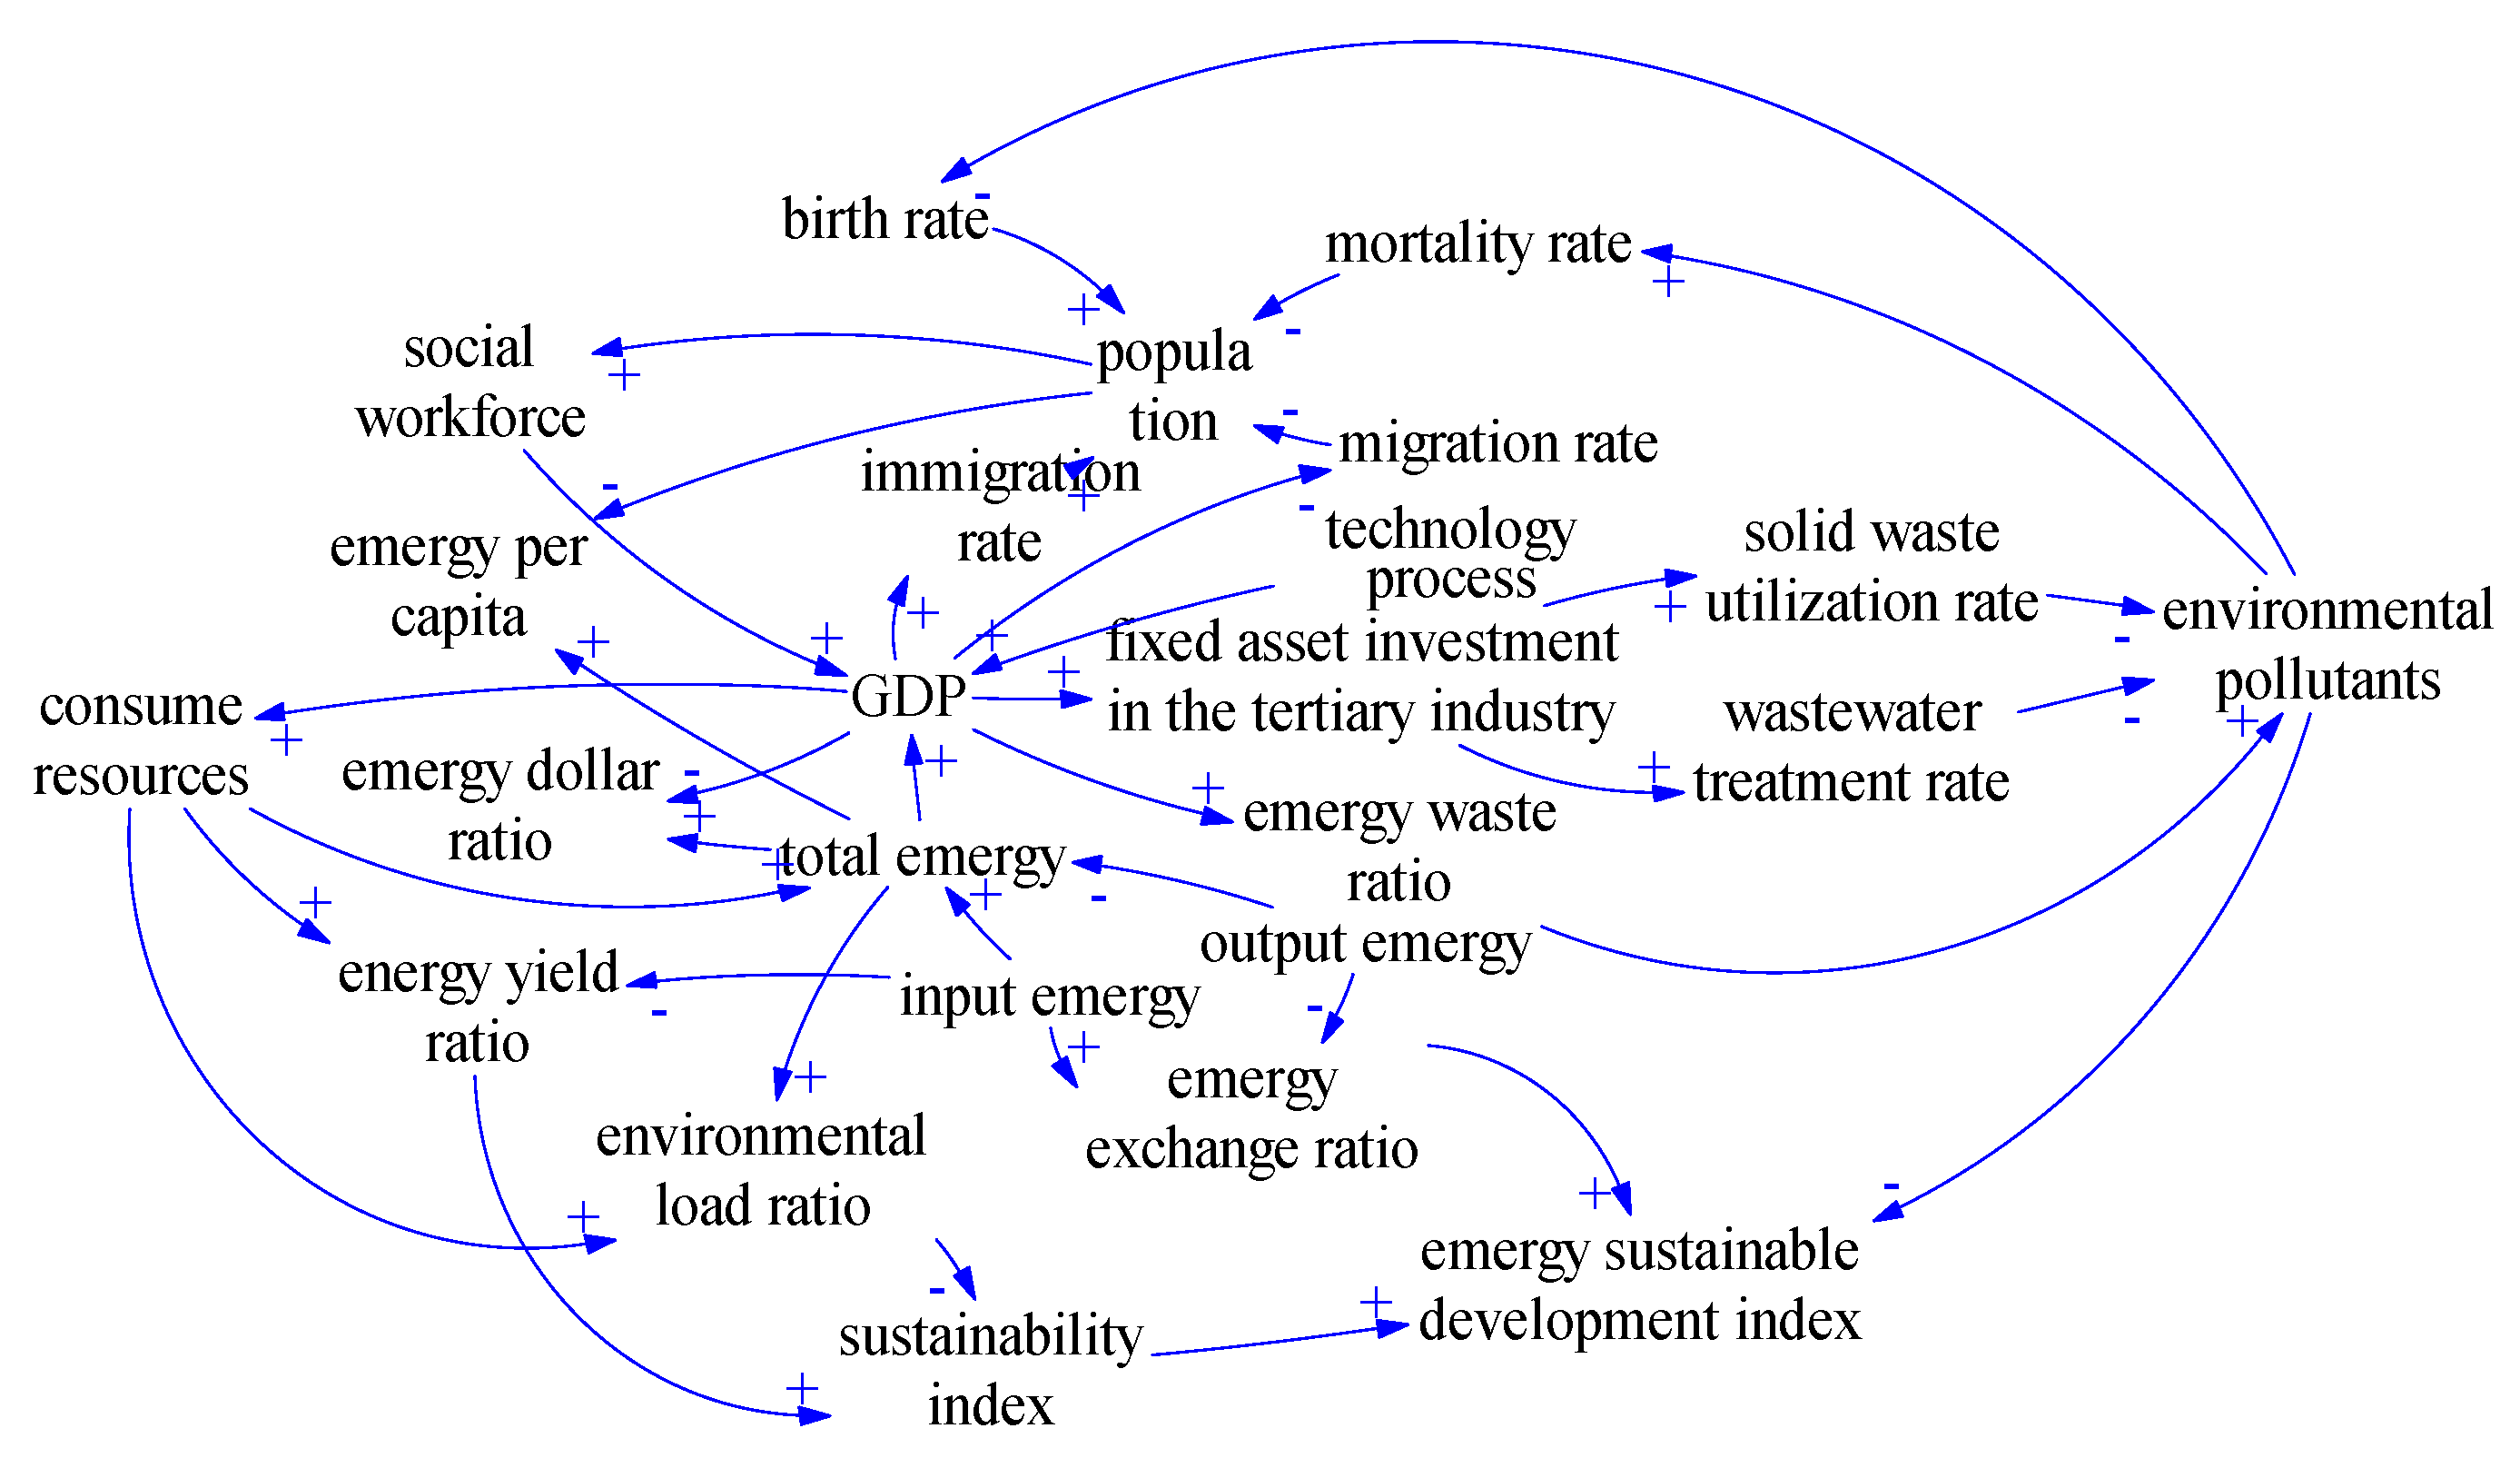
In this paper, the eco-economic system is divided into three interrelated and influencing subsystems of society, economy, and environment. The key factors in the three subsystems were selected and the causal relationship diagram of the regional eco-economic system model was drawn according to the feedback relationship and the relationship among the factors of the system (“+” for positive feedback, “−” for negative feedback), as shown in Figure 2. Regarding the interaction between economic subsystems and environmental subsystems, Brown and Ulgiati propose ESI to measure the degree of economic development that regional ecosystems can withstand [10]. The formula is:
Figure 2.
Causality diagram of ecological and economic system in Liaoning Province.
In order to further analyze the comprehensive efficiency of regional eco-economic systems, ESI and ESID is proposed to measure the comprehensive efficiency of the development of regional eco-economic systems.
Vensim is a system dynamics software that models high-quality dynamic feedback by building dynamic models and understanding the causal relationship diagrams of various variables in the system. In this work, the emergy theory and system dynamics are combined to simulate and analyze the development of the ecological-economic system in Liaoning Province.
3. Case Studies
3.1. Regional Overview and Data Collation
Liaoning Province (118°53′~125°46′ E, 118°53′~125°46′ N) is located in the south of China’s three eastern provinces, covering an area of 148,400 m2 with a population of 43.593 million. It is one of the earliest coastal provinces in China to implement opening up to the outside world, with a long industrial history and rich mineral resources, and there are Liaohe, Hunhe, and other river systems in the province, with an average annual temperature of 9.7 °C, an average precipitation of 757 mm, and an average sunshine hour of 2507 h. The territory has sufficient sunshine and four distinct seasons, and is the province with the most precipitation in the northeast region, known as the “Eastern Ruhr”.
The data in this study are mainly derived from the China Statistical Yearbook, the Statistical Yearbook of Liaoning Province, the Statistical Bulletin of Various Regions of Liaoning Province, the China Meteorological Data Network, and other relevant literature. The transformity and the emergy conversion formula were derived from research results [8,31,32]. The solar emergy transformation process is as follows:
- Collect the original data among various elements and related components, then calculate the energy of different substances: E.
- Determine the corresponding emergy transformity of each substance: T.
- Calculate the solar emjoules:
According to the main components and related links of the ecological and economic system of Liaoning Province, the socio-economic system data of 2010–2019 were collected.
However, for the needs of post-system dynamics modeling data, only the data on the ecological-economic system of Liaoning Province in 2017 are listed in Table 2.
Table 2.
2017 Liaoning Province eco-economic system emergy analysis.
3.2. Construction and Testing of Dynamic Model
3.2.1. Model Building
In this research, Vensim software was used to simulate the system and the construction process of the system dynamics model is as follows:
- (1)
- System boundary determination: According to the characteristics of the adequacy, pertinence, and closure of the system boundaries, the ecological and economic system of Liaoning Province is taken as the research object, and the research content is the population status, economic development, and natural environment of Liaoning Province. The research base year is 2017, the time step distance is 1 year, and the operation cycle is 2017–2035.
- (2)
- System structure analysis: This step is mainly taken to analyze the feedback mechanism of the overall and local systems, to divide the system level, and to determine the coupling relationship between the loops.
- (3)
- System model parameter setting: The parameters are mainly composed of three types: initial value, constant, and table function, which are used to analyze the relationship between variables in the system and the data in each subsystem. The initial value, constant, and other values refer to the relevant data, such as the “Liaoning Statistical Yearbook”, and the corresponding emergy is calculated through the emergy conversion rate. The various rates of change are expressed as table functions. The relationship between GDP and the capital elasticity coefficient, labor elastic coefficient, and technological level in the production function, as well as the relationship between import and export ratio, are determined on the basis of statistical analysis.
- (4)
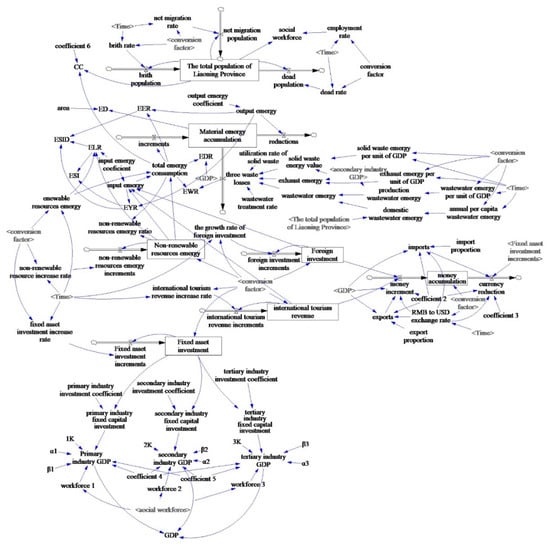
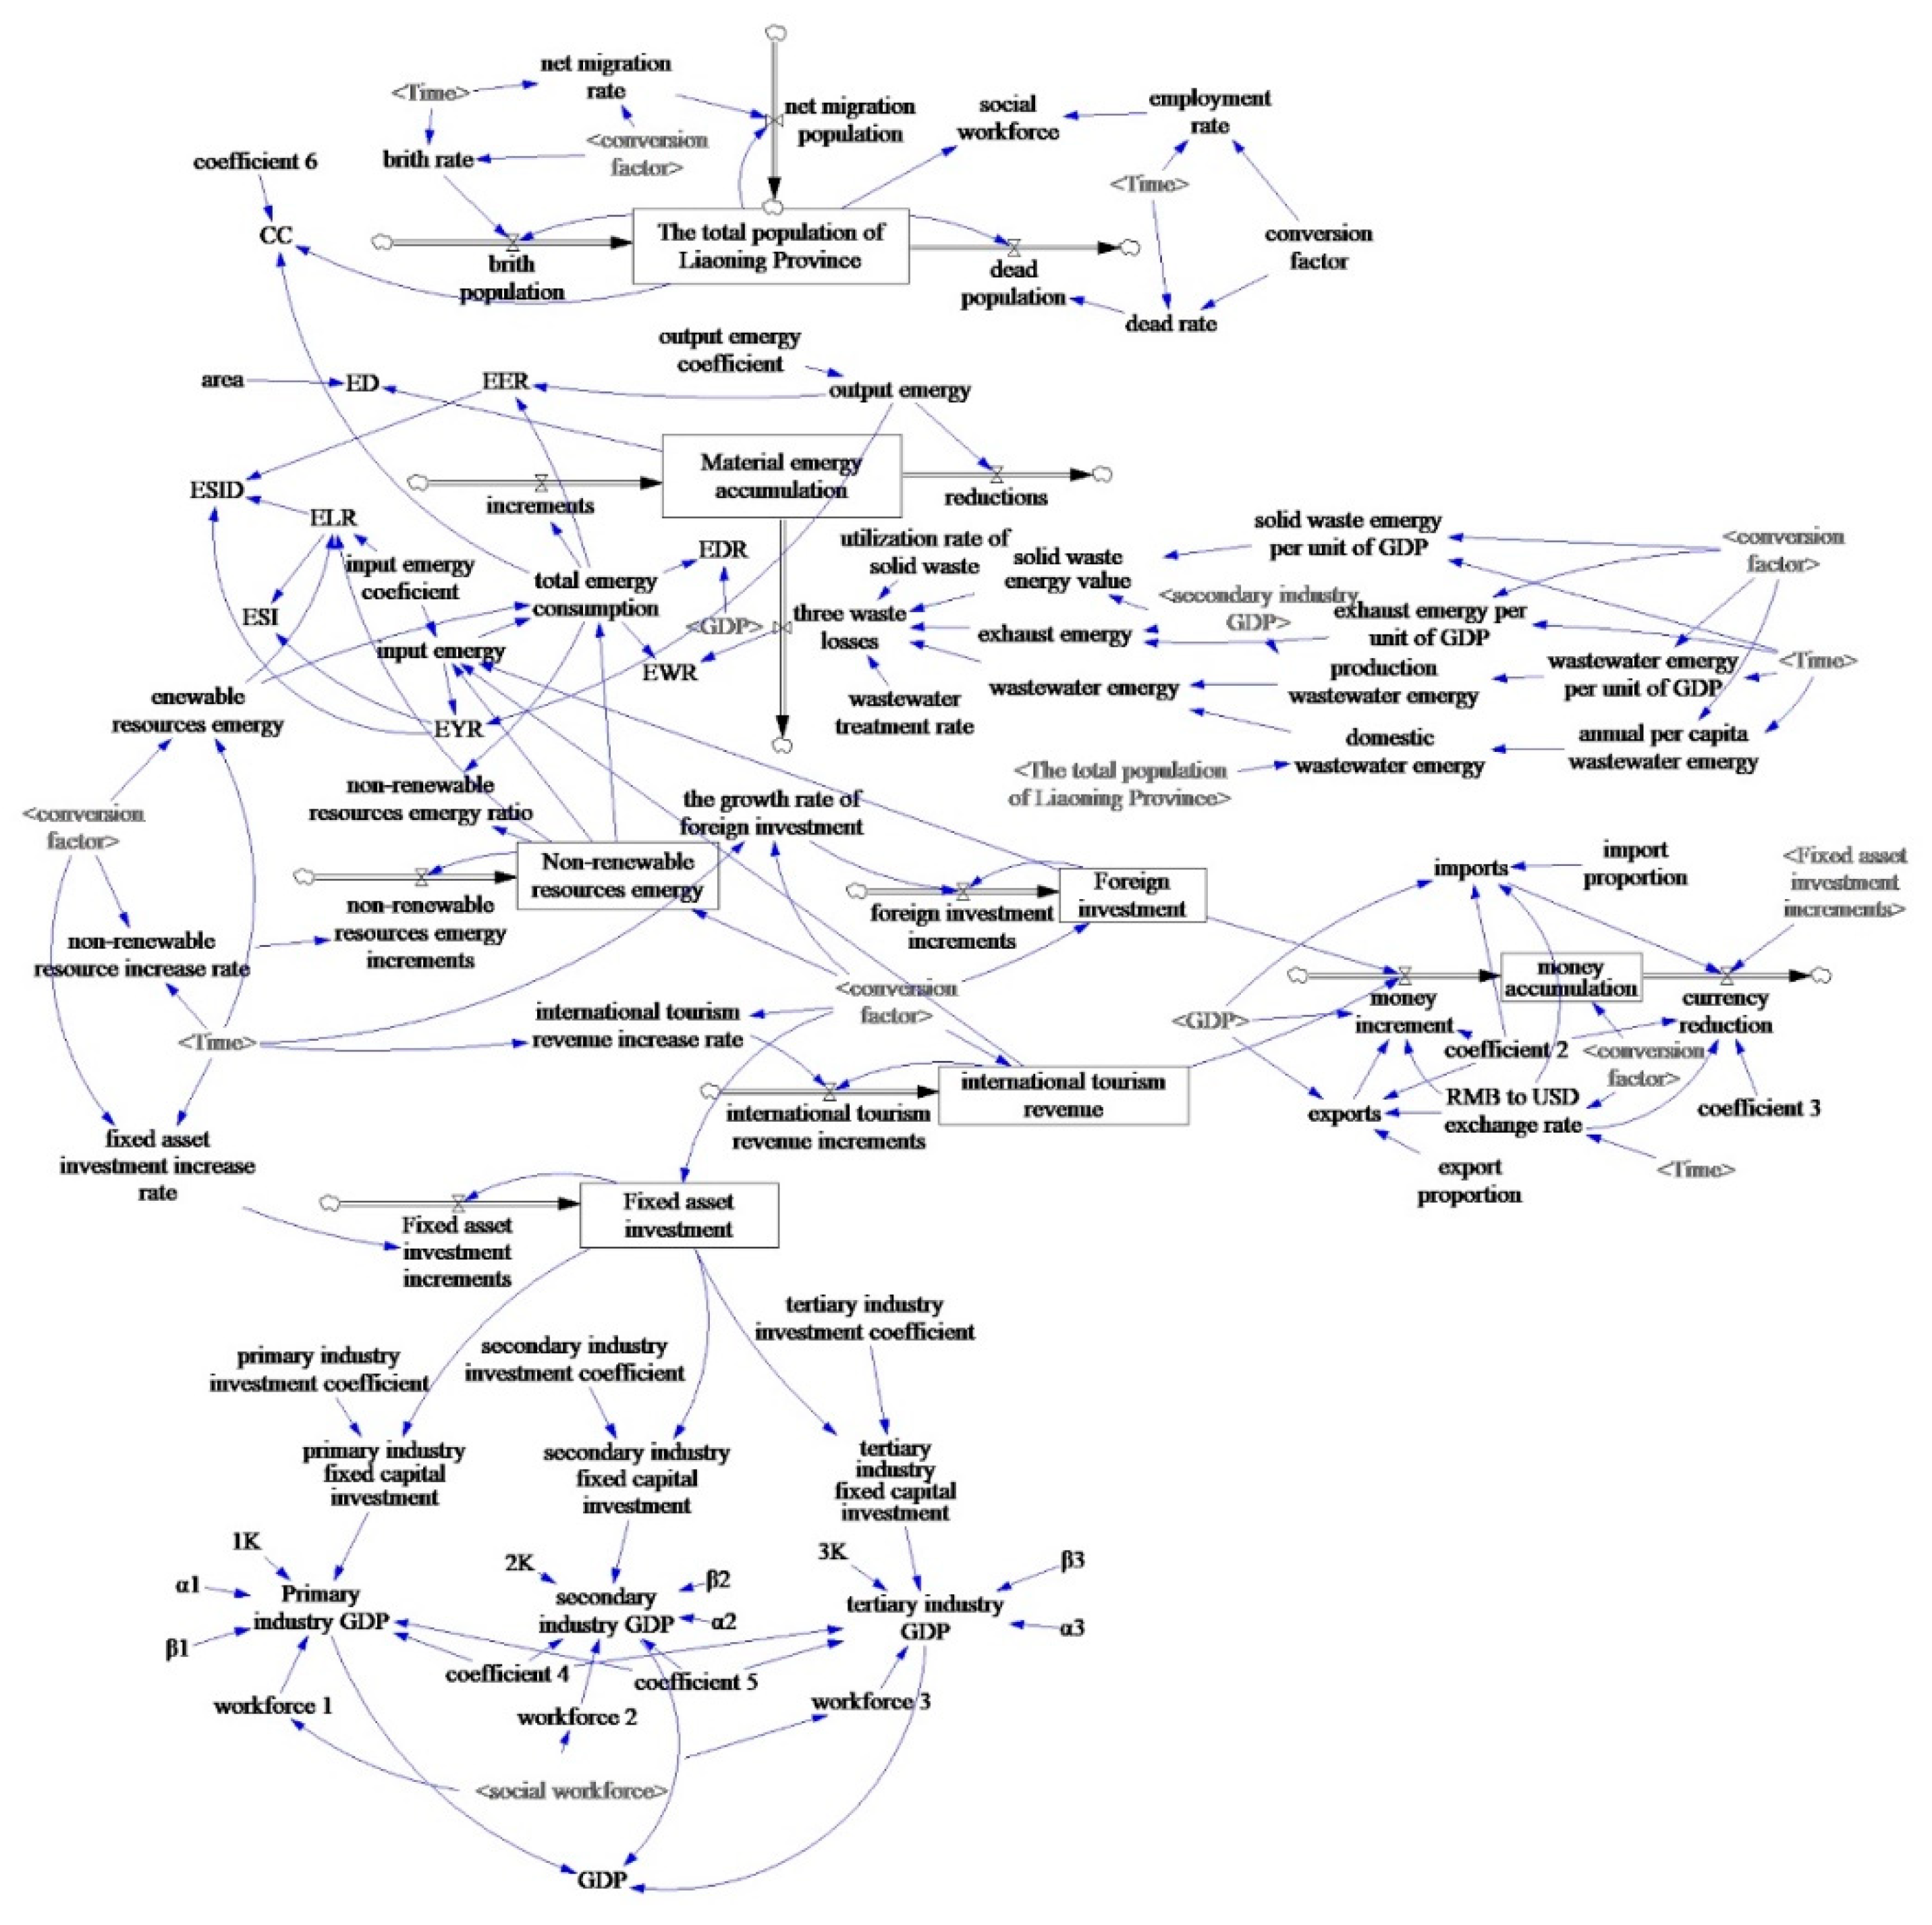
- System model simulation: More in-depth analysis of the problems in the system, the system structure, and parameters are modified until the model runs correctly, and finally, the dynamics model of the ecological and economic system of Liaoning Province was obtained as shown in Figure 3.Figure 3. Dynamics model of ecological and economic system in Liaoning Province.
3.2.2. Sensitivity Analysis
Model effectiveness analysis is a necessary step of system simulation, and the reliability of the simulation model is judged by comparing the simulation results with the existing data. In order to make the simulation results of the ecological and economic system in Liaoning Province more accurate and objective, considering the availability of data, we used the authenticity verification method and selected the data from 2017 to 2019 for verification, as shown in Table 3. The simulation model results designed in this work are basically consistent with the current development of the system, and the error of the simulation results is within 15% (the error is acceptable within 30%), which shows that the simulation ability of the model is adequate, and it can be used as the analysis and in the prediction of the ecological and economic system of Liaoning Province.
Table 3.
Model validity test (%).
3.3. Scenario Settings
3.3.1. Development Mode Settings
According to the characteristics of the sustainable development status and SD model of the ecological-economic system in Liaoning Province, take the development status in 2017 as a reference. Firstly, on the basis of changing the internal and external cycles of the economy, design four different types of development scenarios.
Current: Based on the current industrial structure, scientific and technological level, and environmental governance of Liaoning Province, the urban ecosystem is simulated without intervention and the development model under this scenario is obtained. All parameters are the current values of the system.
Economic priority type: From the perspective of maximizing economic development, increase the proportion of investment in the secondary industry and the level of science and technology, and adjust the proportion of import and export, so as to achieve rapid economic development. Taking economic maximization as the standard, focus on increasing the investment coefficient and technological progress coefficient in the secondary industry, reducing the investment coefficient in the tertiary industry and the import and export ratio. Due to the serious waste pollution caused by the economic priority type, its comprehensive waste utilization rate and wastewater treatment rate will decrease.
Environmental priority type: From the perspective of environmental protection, reduce the proportion of investment in the primary and secondary industries, increase the investment and scientific and technological level of the tertiary industry, appropriately adjust the proportion of imports and exports, and make every effort to make the government control the environment, improve the treatment and utilization rate of industrial waste, and reduce the impact on the environment. Based on the maximum environmental protection, reduce the investment coefficient of the primary and secondary industries, increase the investment coefficient and progress level of the tertiary industry, adjust the import and export ratio, and improve the comprehensive utilization rate of solid waste and wastewater treatment rate.
Coordinated development type: Comprehensively consider the social, economic, and environmental influencing factors—under the premise of coordinated development—increase investment in environmental protection science and technology, introduce advanced technology, improve resource utilization efficiency, and maximize the comprehensive economic and environmental benefits. Consider the approximate balance of economic priority type and environmental development type, and strive to maximize economic and environmental benefits.
3.3.2. Selection of Scenario Parameters
The selection of scenario parameters is used to comprehensively analyze the impact of development paths, industrial layout, technology levels, economic development, and environmental protection policies on the sustainable development of the eco-economic system in Liaoning Province, while taking into account the relevant planning requirements of Liaoning Province. The selected parameters are primary, secondary, and tertiary industries investment coefficients and the level of technological progress, proportion of imports and exports, comprehensive utilization rate of solid waste, and wastewater treatment rate. The industrial layout is represented by the investment coefficients of the three industries, and the level of science and technology measured by the Cobb–Douglas function; see Equation (5). The proportion of imports and exports is related to GDP and the ratio of the two is used to express the impact of external circulation on the economy system. The comprehensive solid waste utilization rate and wastewater treatment rate are set according to environmental policies. The overall indicators are selected and adjusted according to the established SD model. The scenario parameters are mainly used to select the important factors that affect the social, economic, and environmental development of the system, and the economic development involves internal circulation and external circulation. The proportion of investment in the primary, secondary, and tertiary industries in the internal circulation and technological progress have different impacts on it. For example, the increase in investment in the primary and secondary industries leads to rapid economic and social development and rapid GDP growth. However, due to the serious environmental pollution caused, the economy cannot be blindly developed. Therefore, it is necessary to seek a balance of investment in the tertiary industry. According to the factors affecting the development of GDP, we also selected the parameter of the coefficient of scientific and technological progress. The progress of science and technology also makes the economy develop more healthily, and reduces the pollution of the environment. External circulation is mainly measured by the index of domestic and foreign imports and exports. Finally, the most intuitive indicators that can show the reduction of environmental pollution are the comprehensive utilization rate of solid waste and the rate of wastewater treatment, which also cause of urban pollution.
Comparing these indicators, the results can provide better references for the sustainable development of society, economy, and environment. According to documents related to the “14th Five-Year Plan” of Liaoning Province and city-related construction, parameter settings based on existing data are shown in Table 4. Next, the dynamic simulation of the development mode from 2017 to 2035 was carried out.
Table 4.
Parameters of four types of development scenarios for ecological and economic systems.
3.4. Results
3.4.1. Economic Development
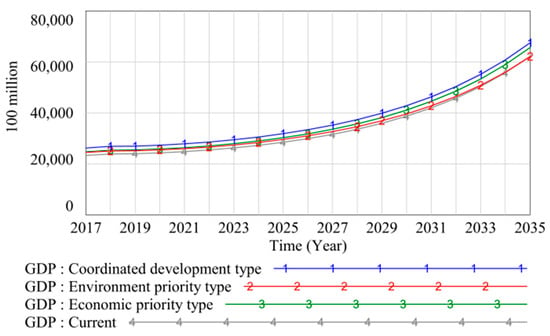
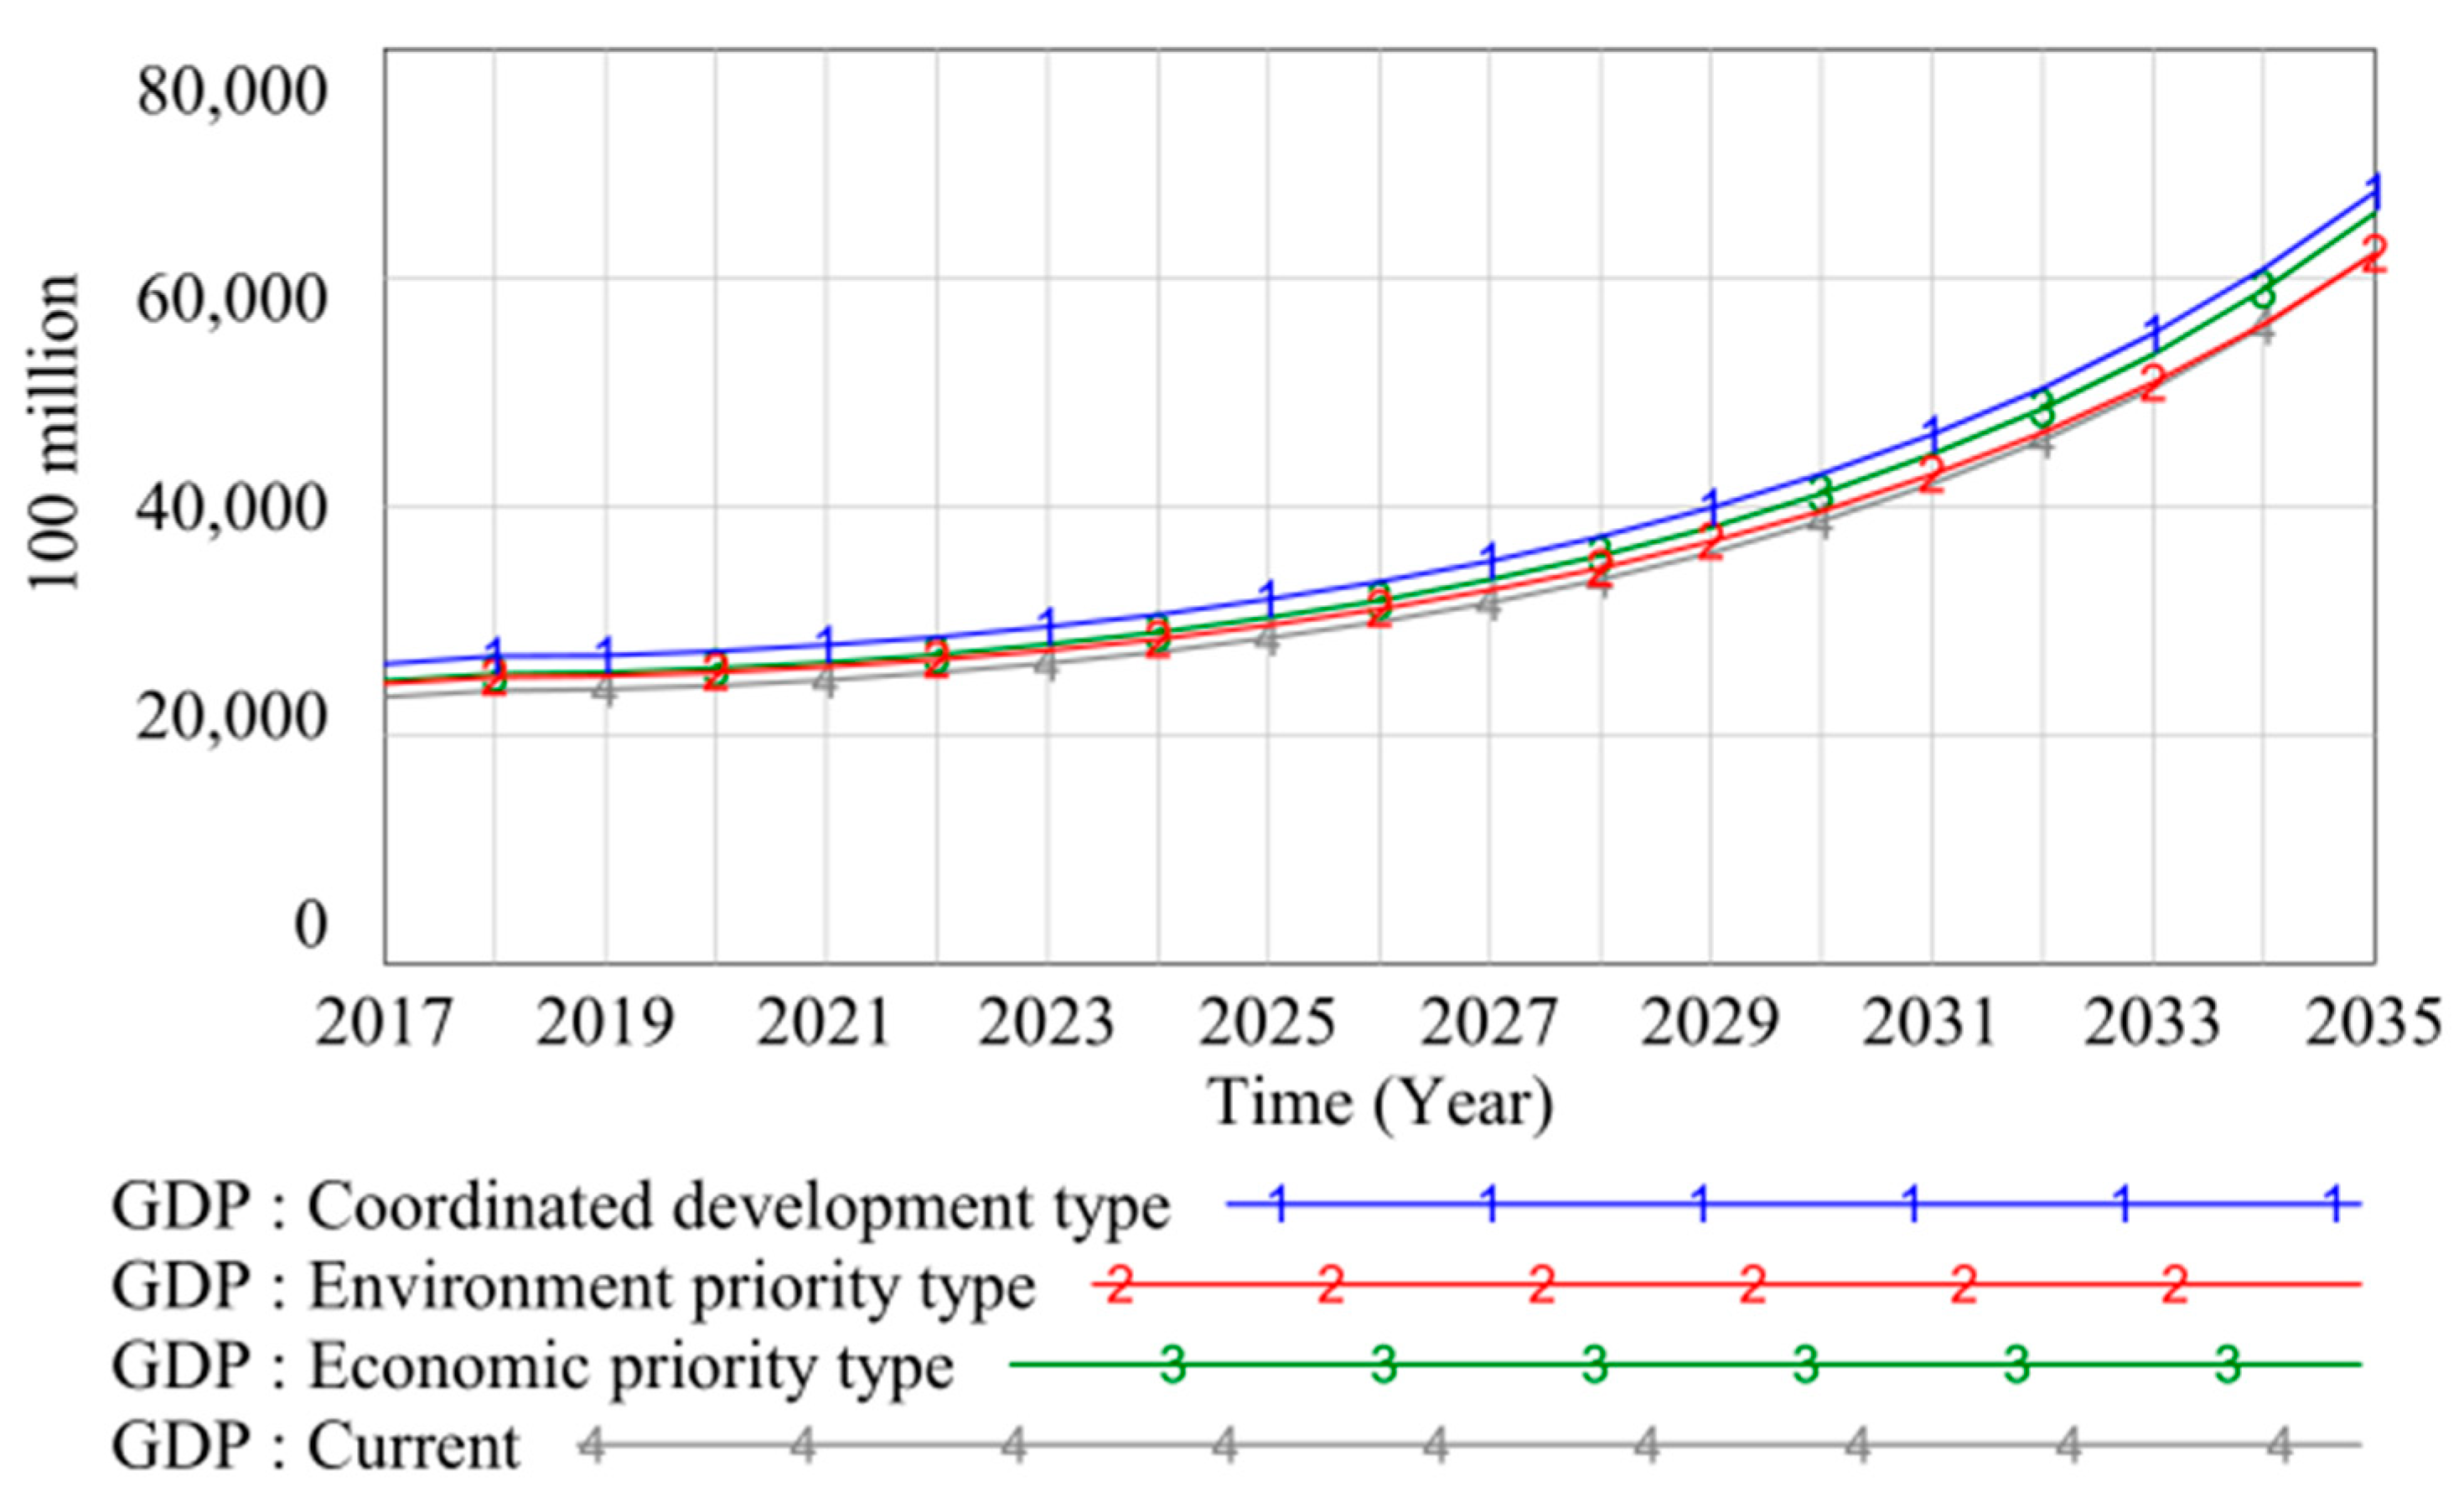
GDP represents the economic development status of a region. The larger the value, the stronger the production capacity and the stronger the economic strength of the region. It can be seen from Figure 4 that the GDP in the four scenarios is on the rise but the growth rate will be slow before 2023, and the growth will start to accelerate in 2023. This is due to the epidemic and Sino–US trade frictions and other reasons that hinder the speed of economic development; the easing of trade frictions has prompted a rapid economic recovery. Sino–US trade frictions gradually intensified after 2018 until they largely eased in early 2022. The epidemic, which broke out in late 2019, is still present, but the situation is much less severe than before. During this period, the two have largely influenced the pace of economic development. On the basis of current trends, we predict that in the future, the easing of the situation between the two will mitigate the impact on the economy. The coordinated development type economy will be the fastest, the production capacity will be the strongest, and the system development will be the most dynamic.
Figure 4.
GDP simulation results.
In an eco-economic system, economic development is closely related to society and the environment; a single-minded approach to economic development leads to a deterioration in the relationship between society and the environment, which in turn inhibits economic development. On the contrary, in the coordinated development type, the improvement of the environmental situation and the coordination of social development in turn has a catalytic effect on economic development, increasing the sustainable socio-economic development. Therefore, it is possible for the coordinated development type of economic development to outperform the economic development type.
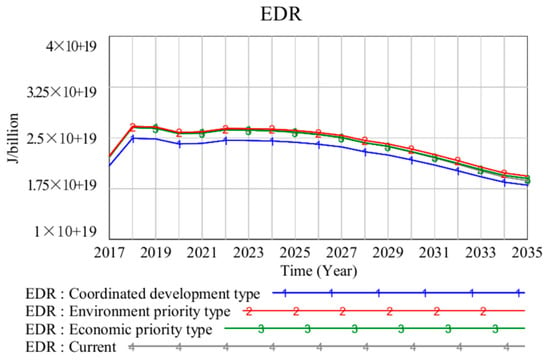
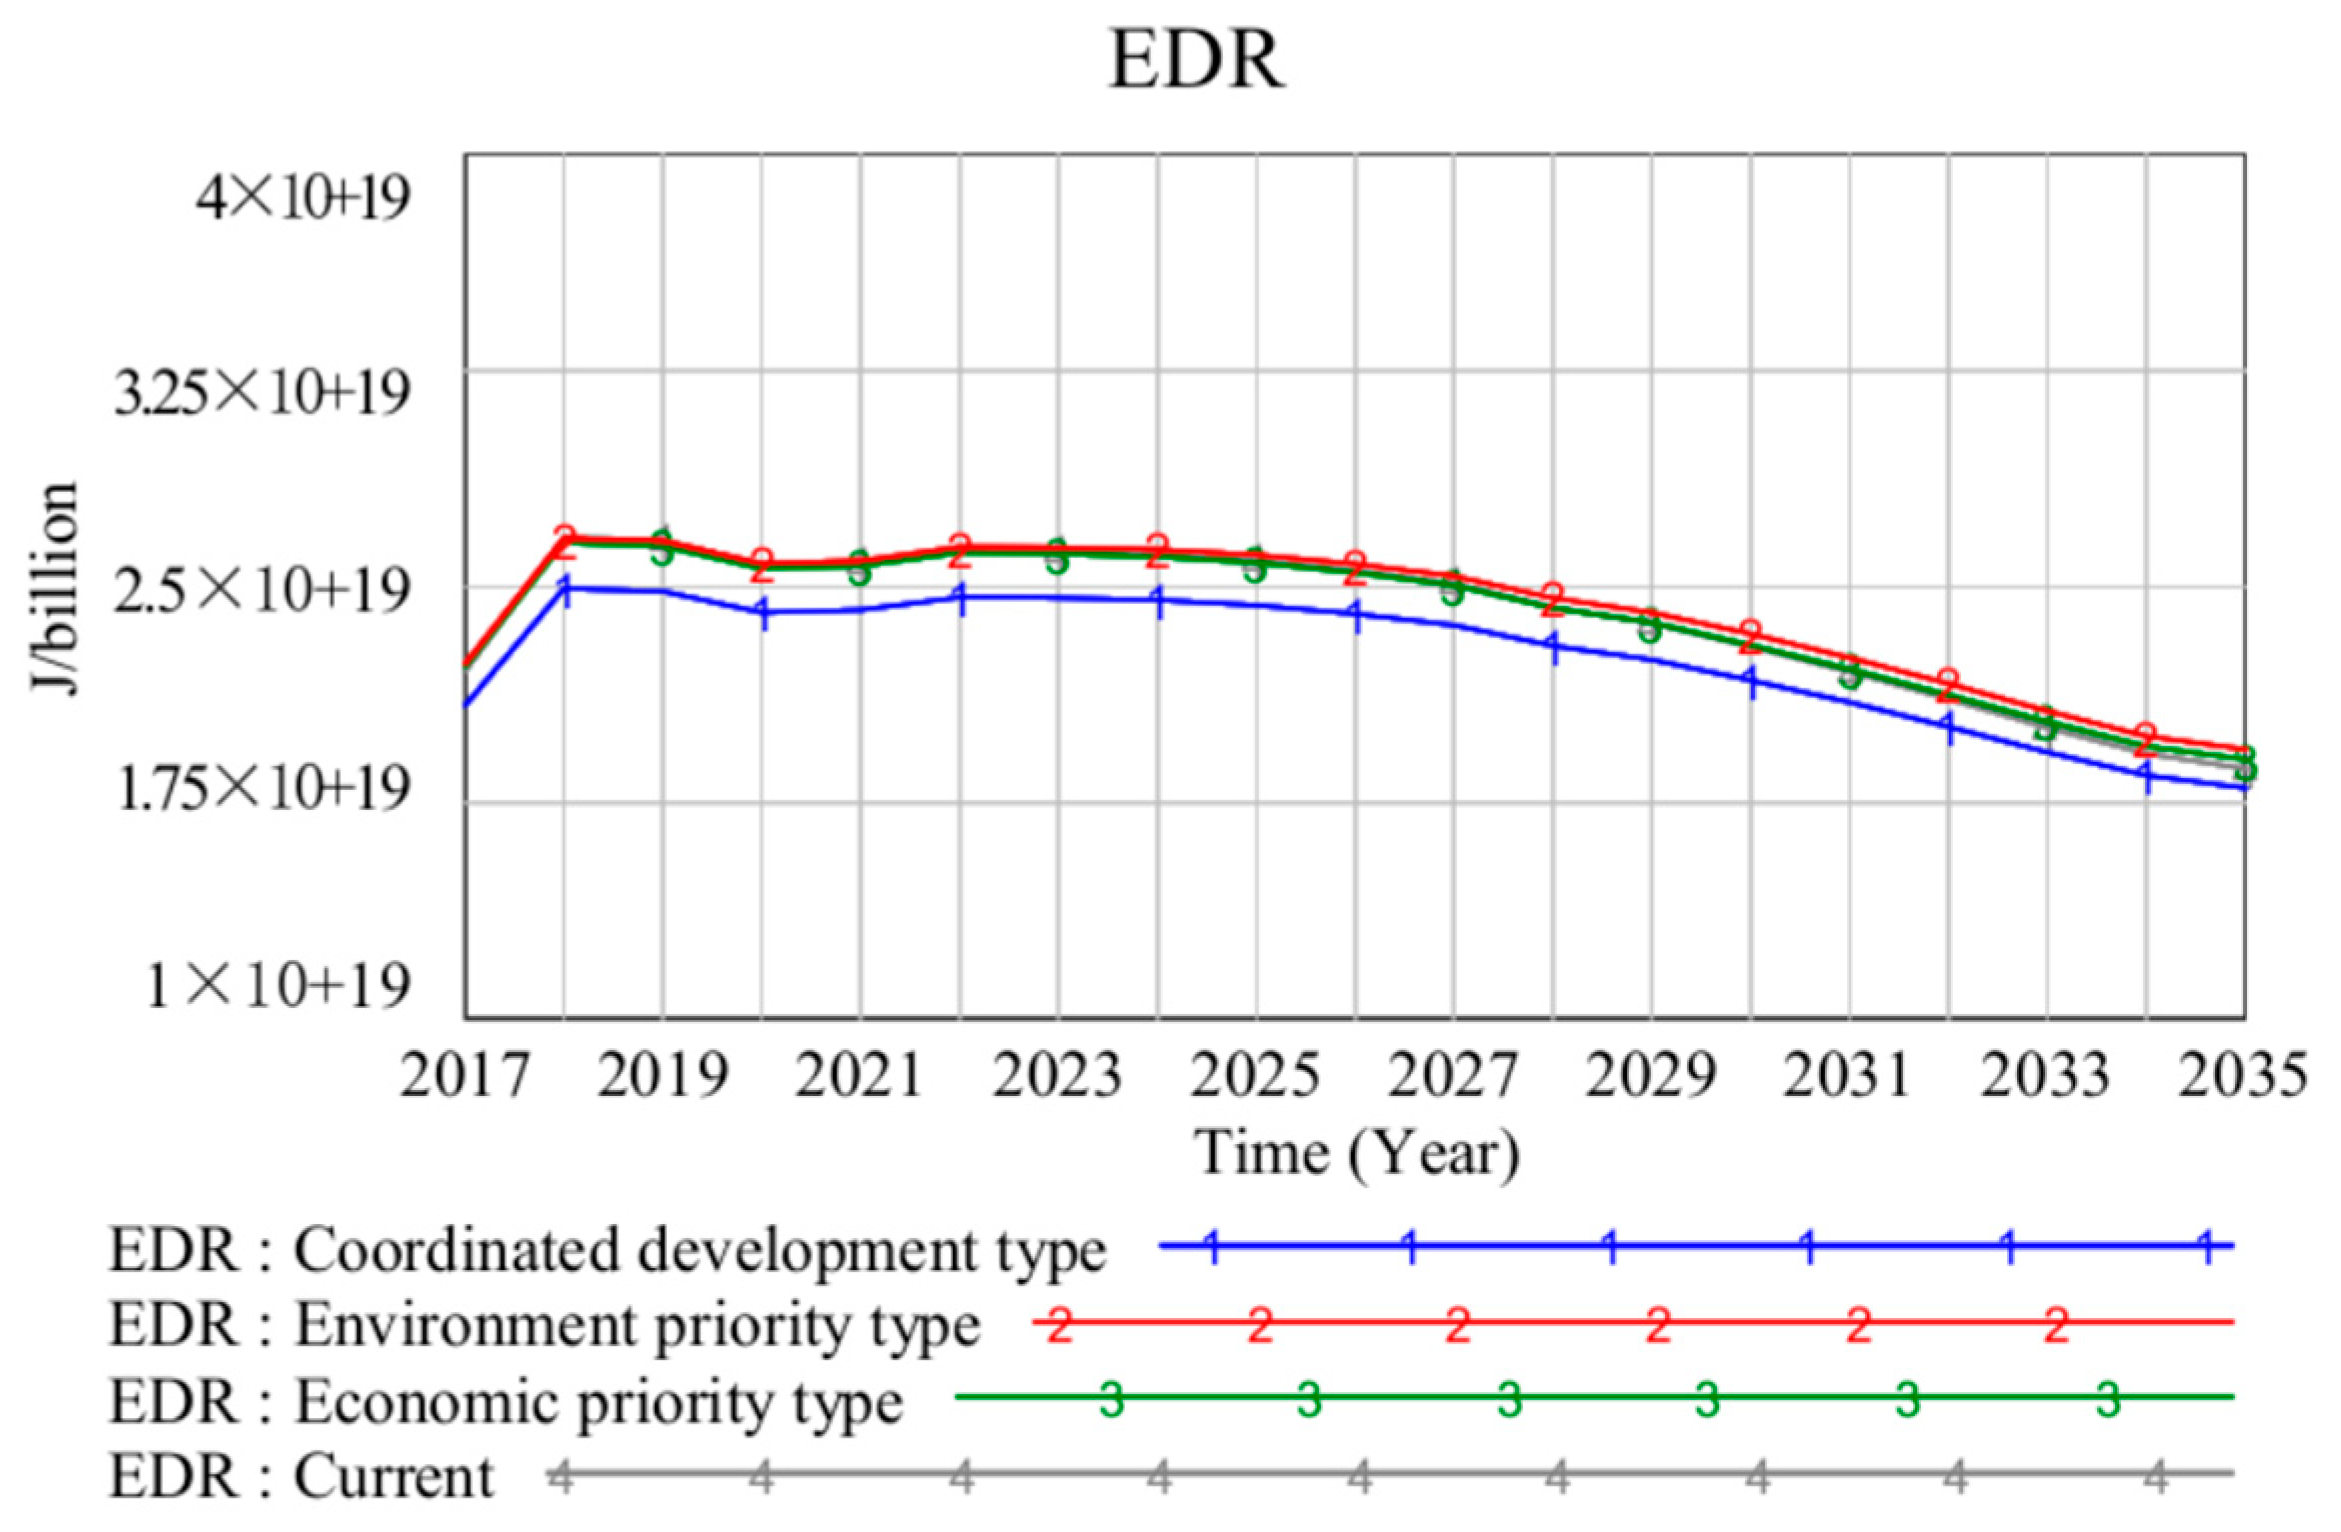
EDR is the ratio of a region’s annual total emergy consumption to that year’s GDP, reflecting the actual purchasing power of a region’s unit currency and the contribution of natural resources. The higher the value, the less developed the economy, the more it is dependent on external resources, and the lower the emergy utilization rate. As shown in Figure 5, all four scenarios show a downward trend. By 2035, the environment priority type will be 1.93 × 10¹⁹, the economy priority type will be 1.90 × 10¹⁹, the current will be 1.87 × 10¹⁹, and the coordinated development type will be 1.80 × 10¹⁹, indicating that the coordinated development type has a high utilization rate of emergy, low emergy obtained per unit of currency, developed economy, and low dependence on external resources, while the environmental priority type has the highest value, indicating that in this scenario, the emergy obtained per unit of currency describes a low, weak economy.
Figure 5.
Simulation results of the EDR.
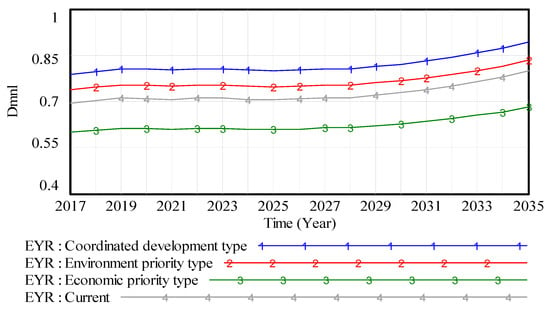
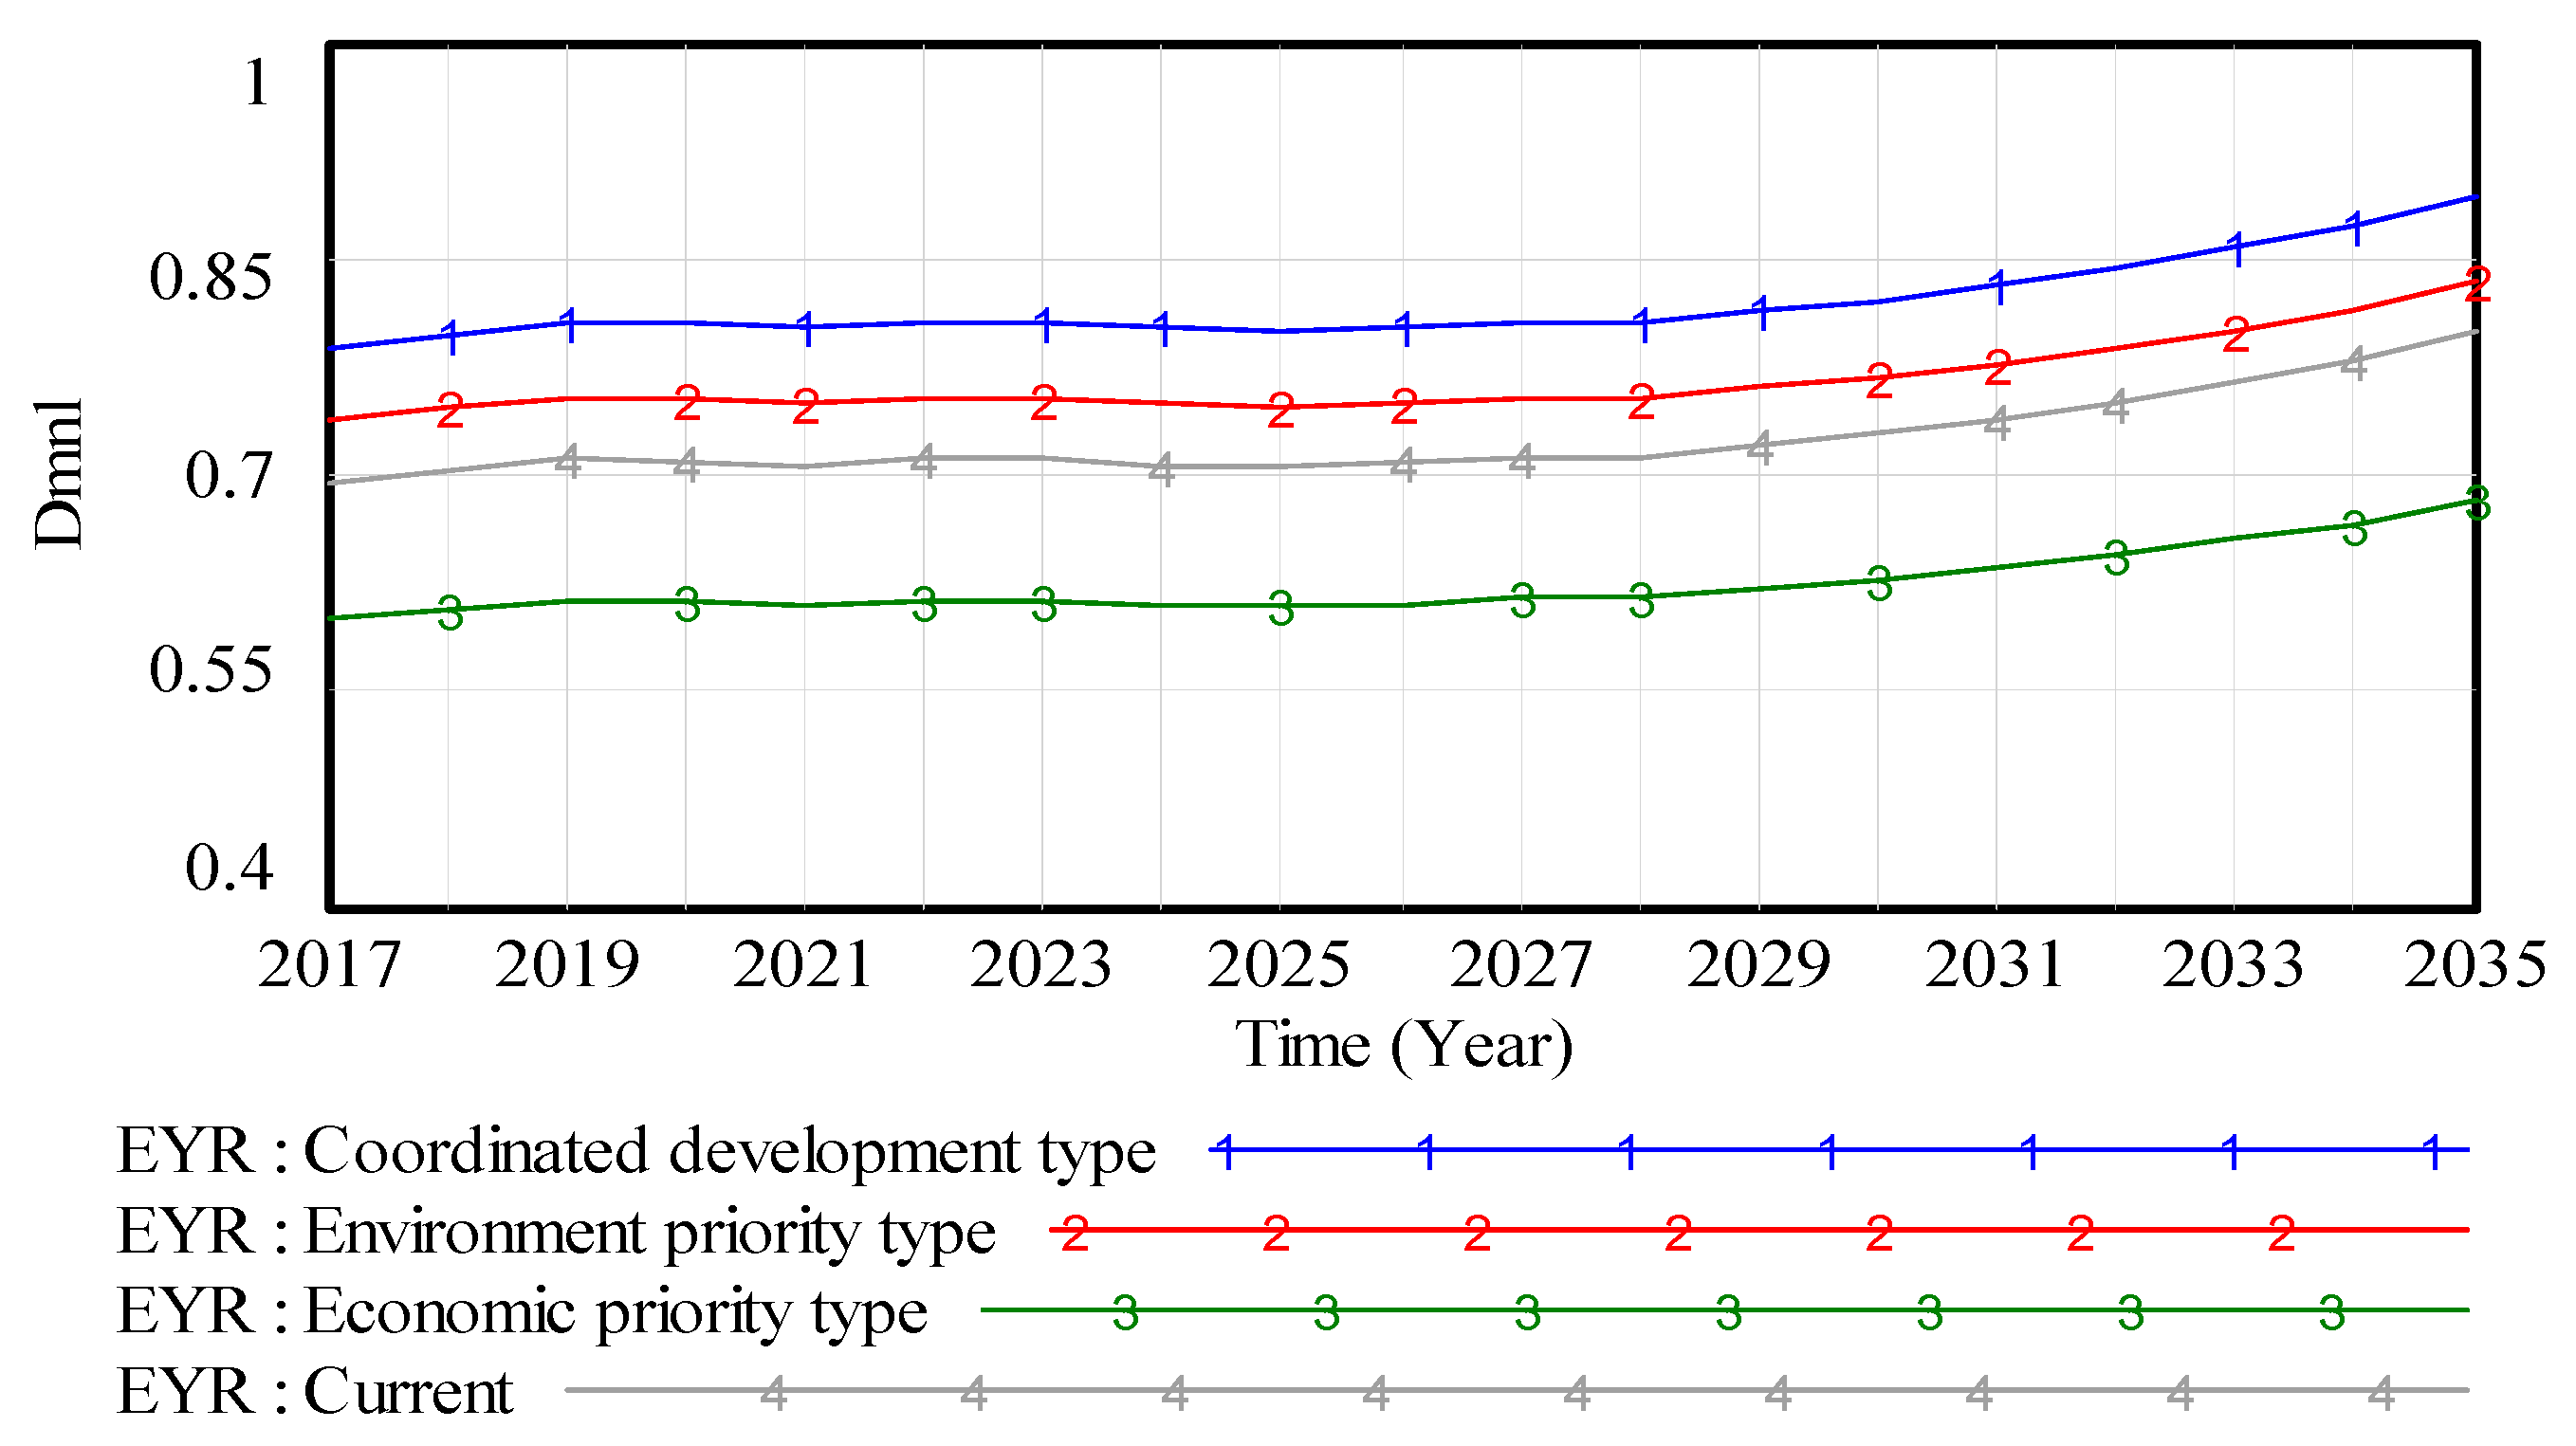
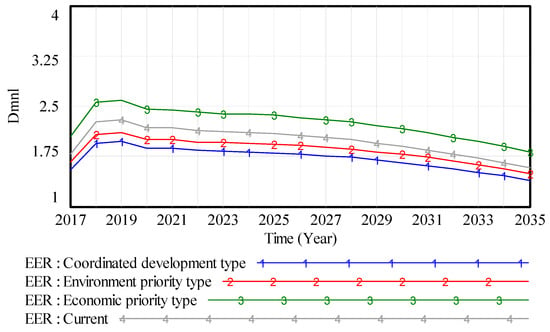
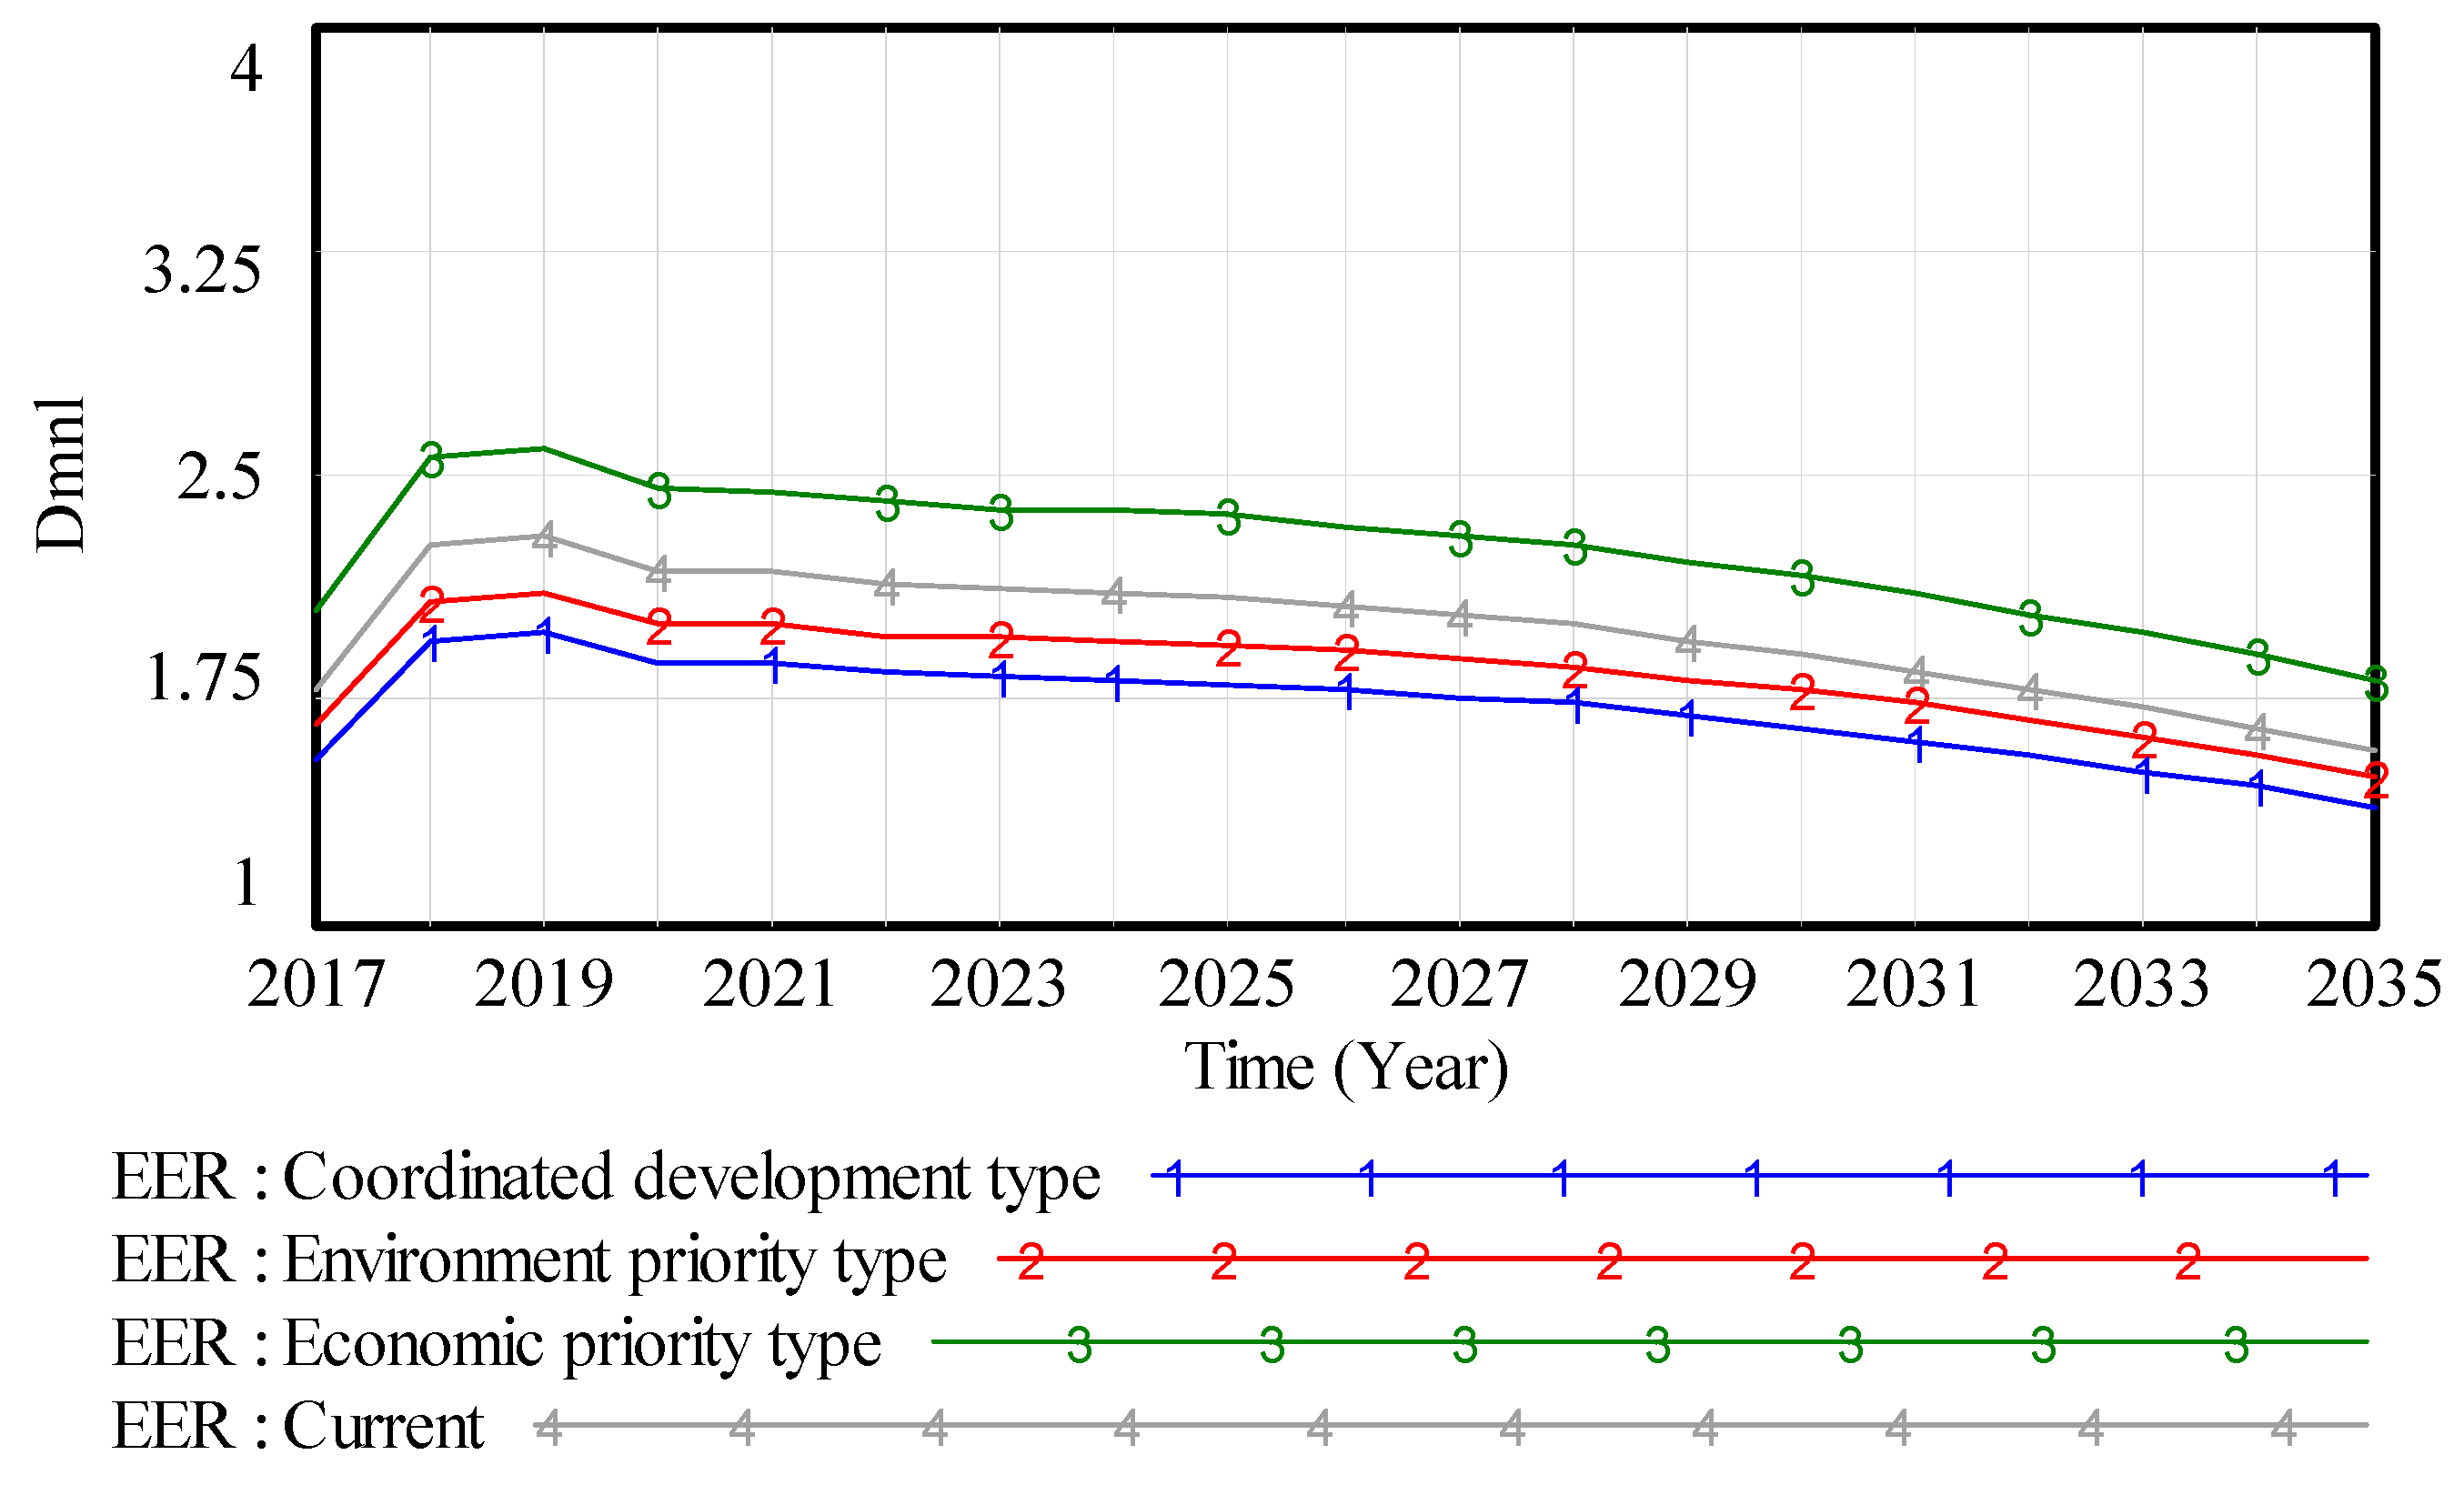
EYR is the ratio of system output emergy to input emergy, which can evaluate the contribution rate of system output to the economy and the eco-economic benefits. EER reflects the gain and loss of value wealth in regional economy and trade. It can be seen from Figure 6 and Figure 7 that the emergy exchange rate in the four scenarios gradually increases, and the emergy exchange rate gradually decreases. By 2035, the maximum output rate of the coordinated development type will be 0.8309 and the minimum of the economic priority type will be 0.6324, indicating that when the same amount of economic energy is input, the coordinated development type system has higher production efficiency and greater economic development potential. However, the output of continuous high energy value is unfavorable from the point of view of emergy and the exchange rate of emergy is just the opposite: the economic priority type is the largest and the coordinated development type is the smallest, indicating that in the case of the economic priority type, the system has obtained the most. Economic wealth will benefit more, and the system will gradually shift from labor-based to knowledge-based. The emergy exchange rate in the four scenarios is greater than 1, indicating that the system is in a profit mode.
Figure 6.
Simulation results of the EYR.
Figure 7.
Simulation result of the EER.
3.4.2. Social Acceptability
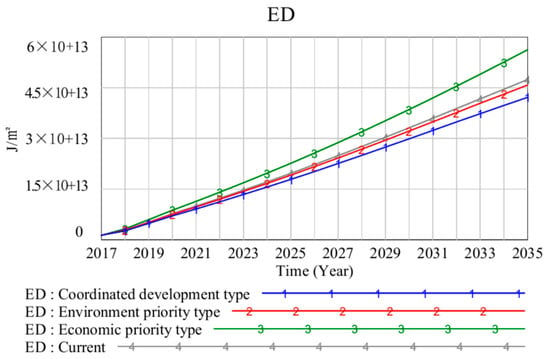
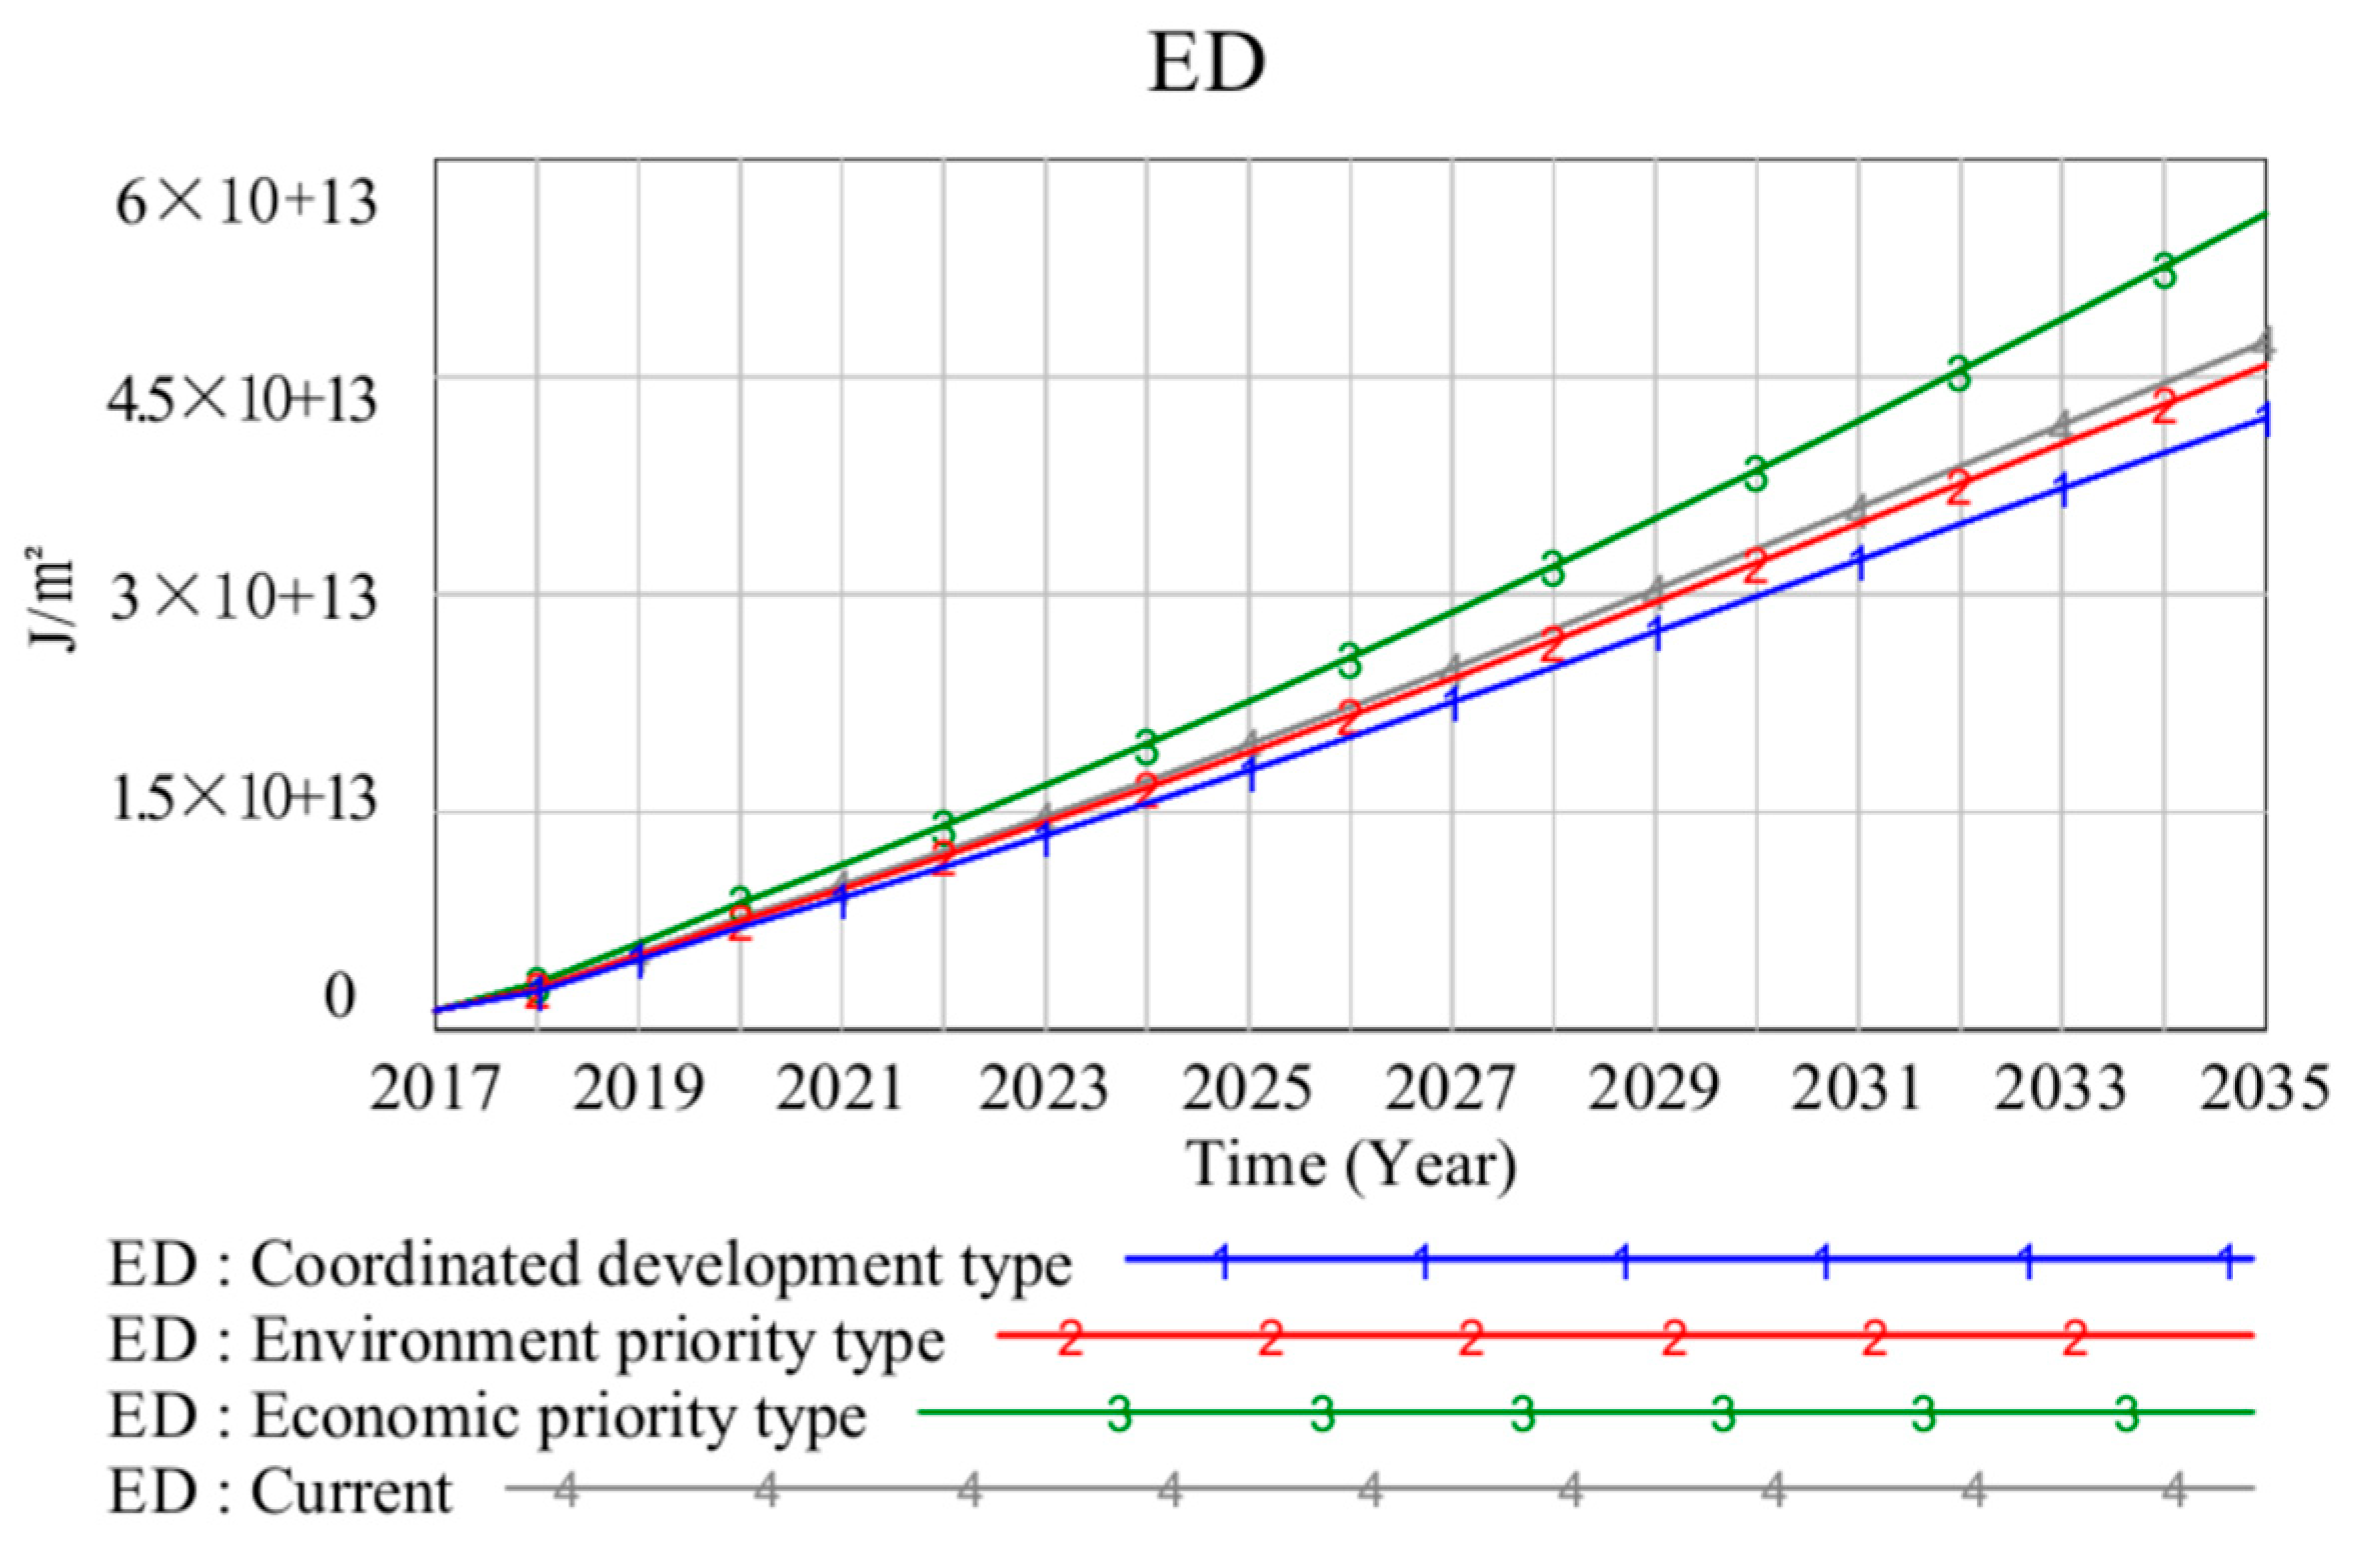
ED is the amount of emergy utilization per unit area of a region, which reflects the intensity of economic activities per unit area. The material emergy accumulation represents the material accumulation in the region during the development process. As shown in Figure 8, in the simulation period, the emergy density in the four scenarios all show an increasing trend, and the system accumulation emergy increases. Liaoning Province belongs to developed areas.
Figure 8.
Simulation results of the ED.
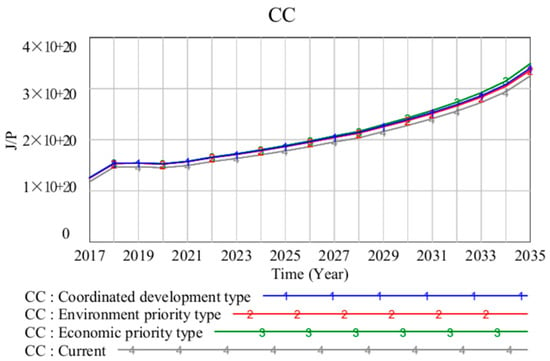
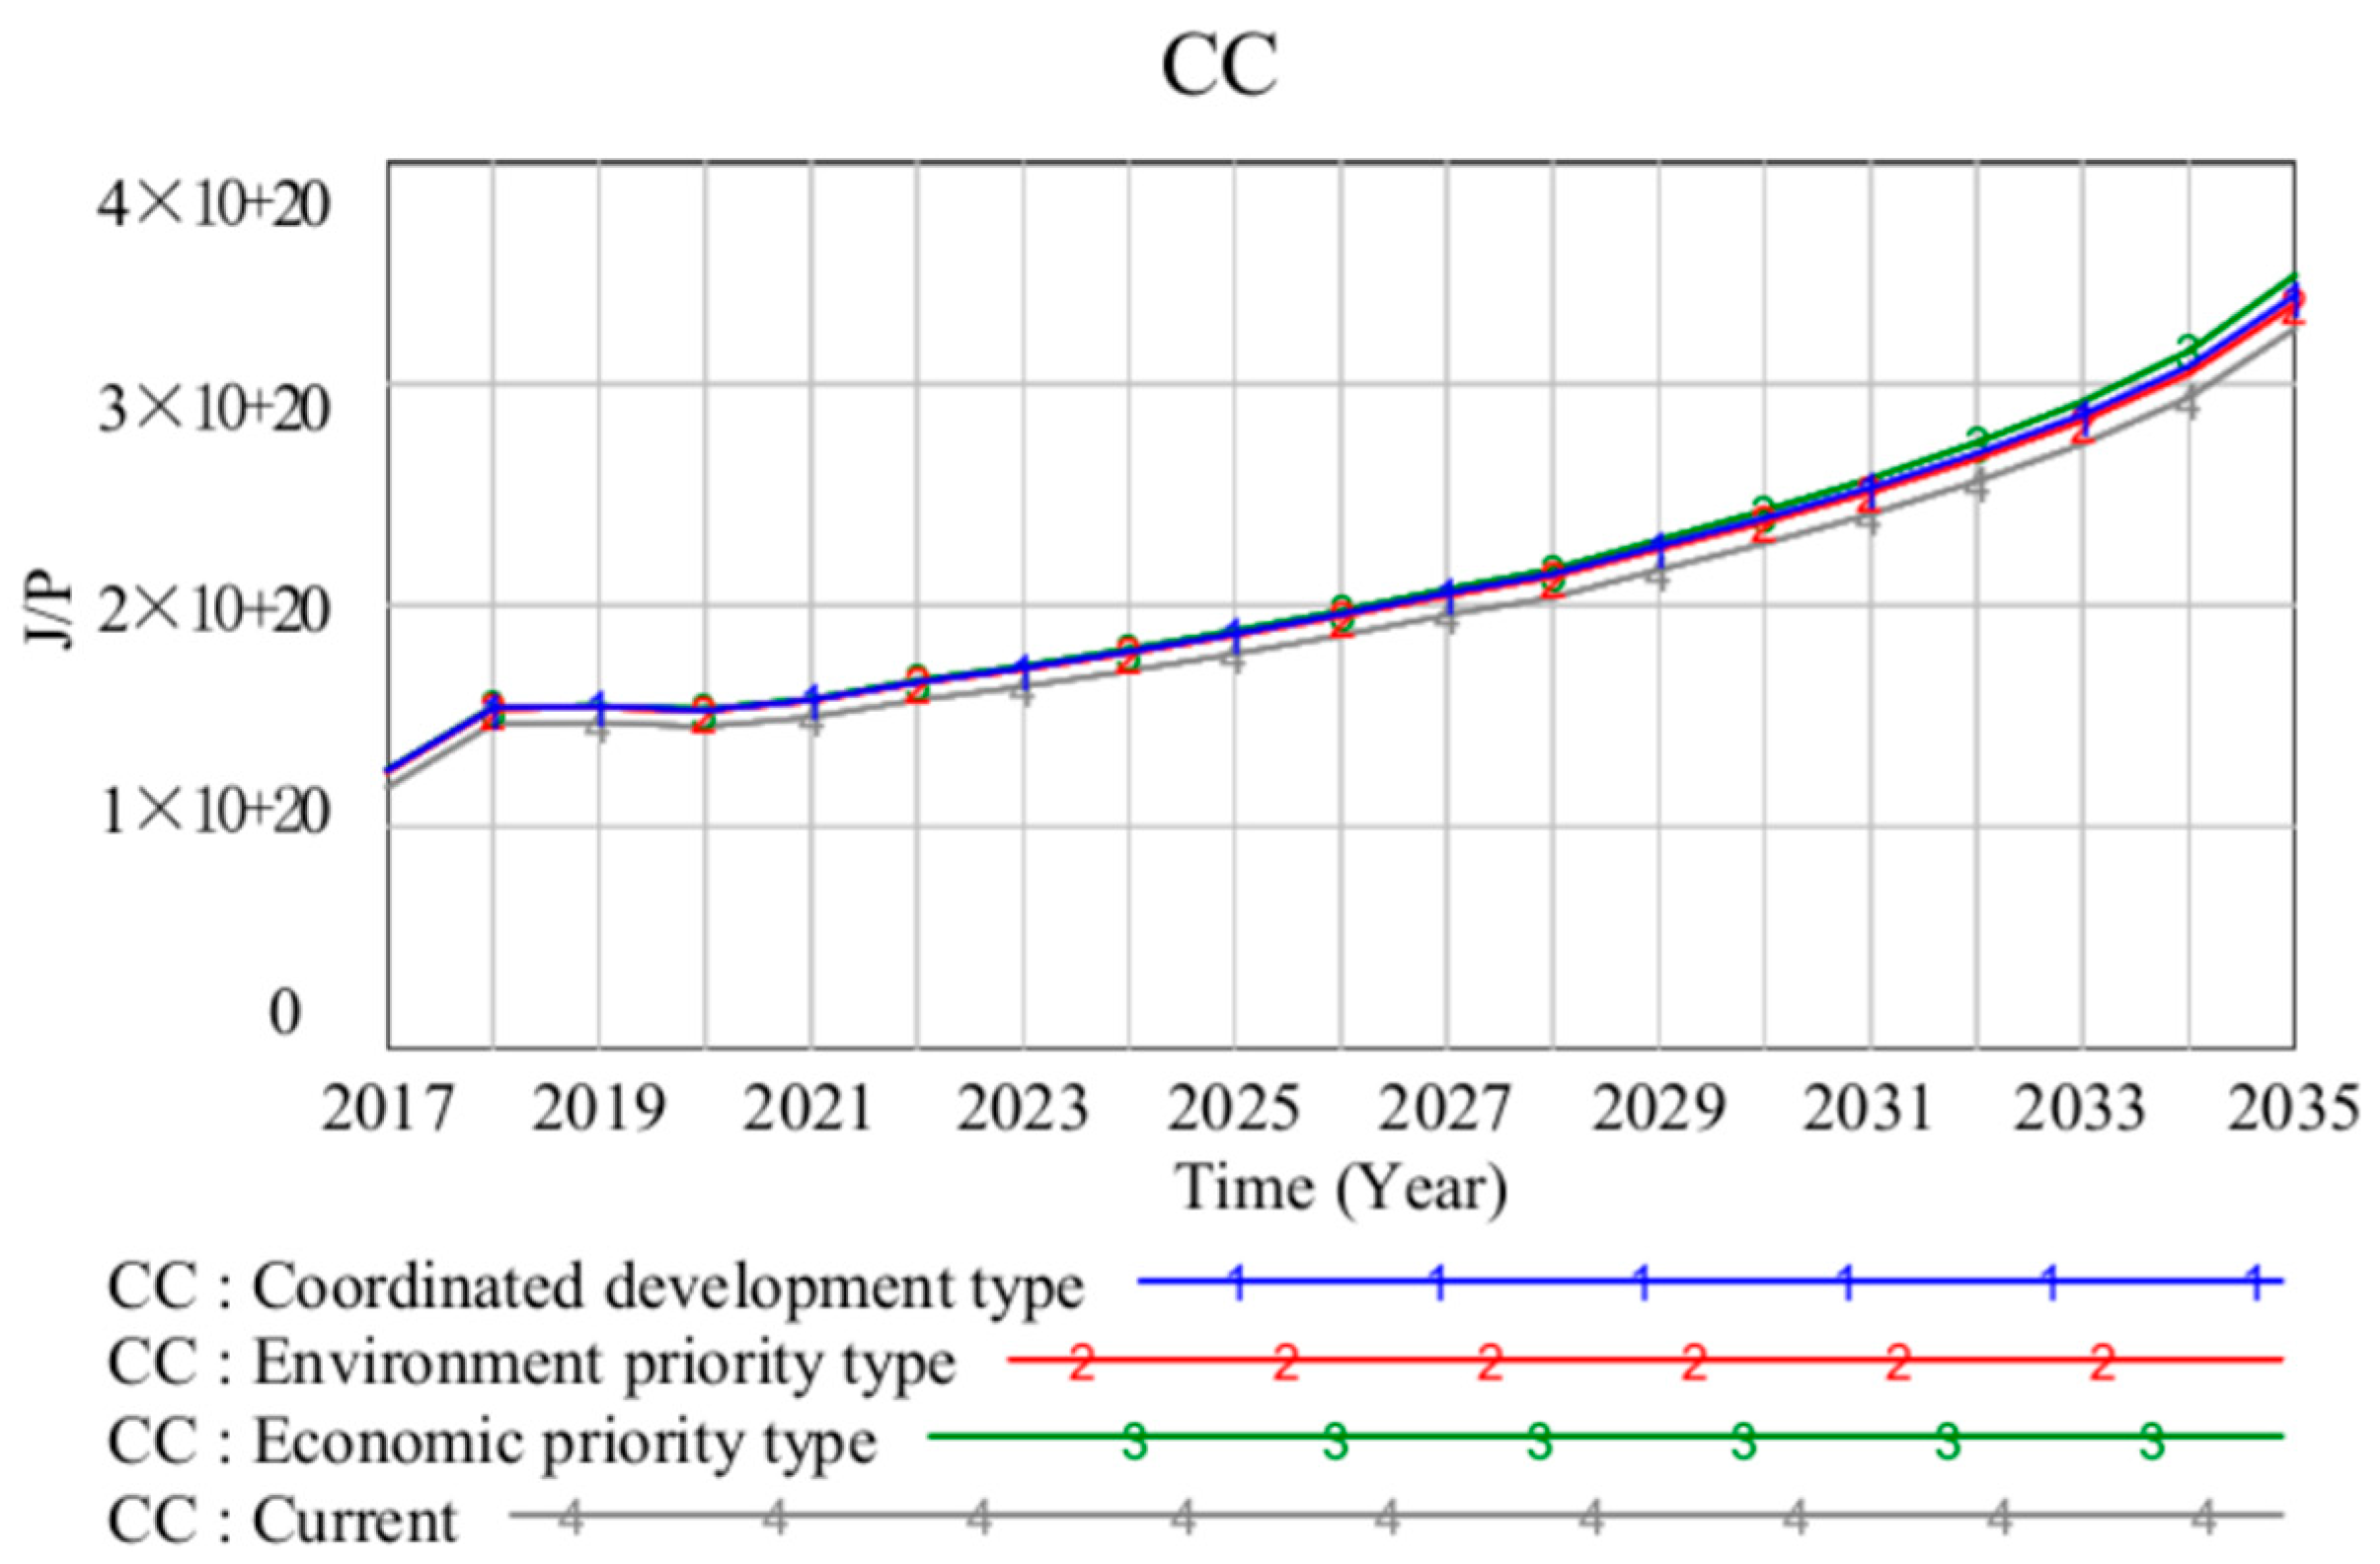
CC is the amount of emergy utilization per capita in an area, which is used to evaluate people’s living standards and quality. The higher the value, the greater the energy value available per person, and the more material welfare. As shown in Figure 9, due to the abundant energy of renewable resources, the per capita energy value generally increases, indicating that people’s quality of life constantly improves. By 2035, the value of per capita emergy will be the economic priority type, coordinated development type, environment priority type, and current type. Except for the economic priority type, people with the coordinated development type have the highest living standards and more material welfare.
Figure 9.
Simulation results of the CC.
3.4.3. Environmental Stability
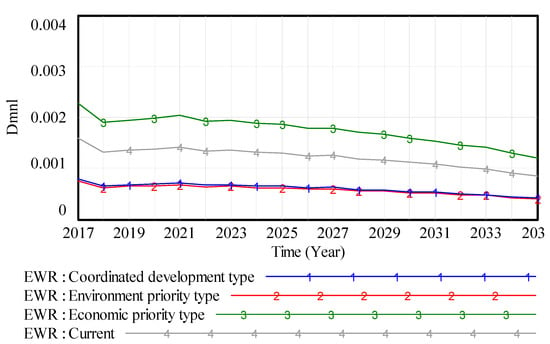
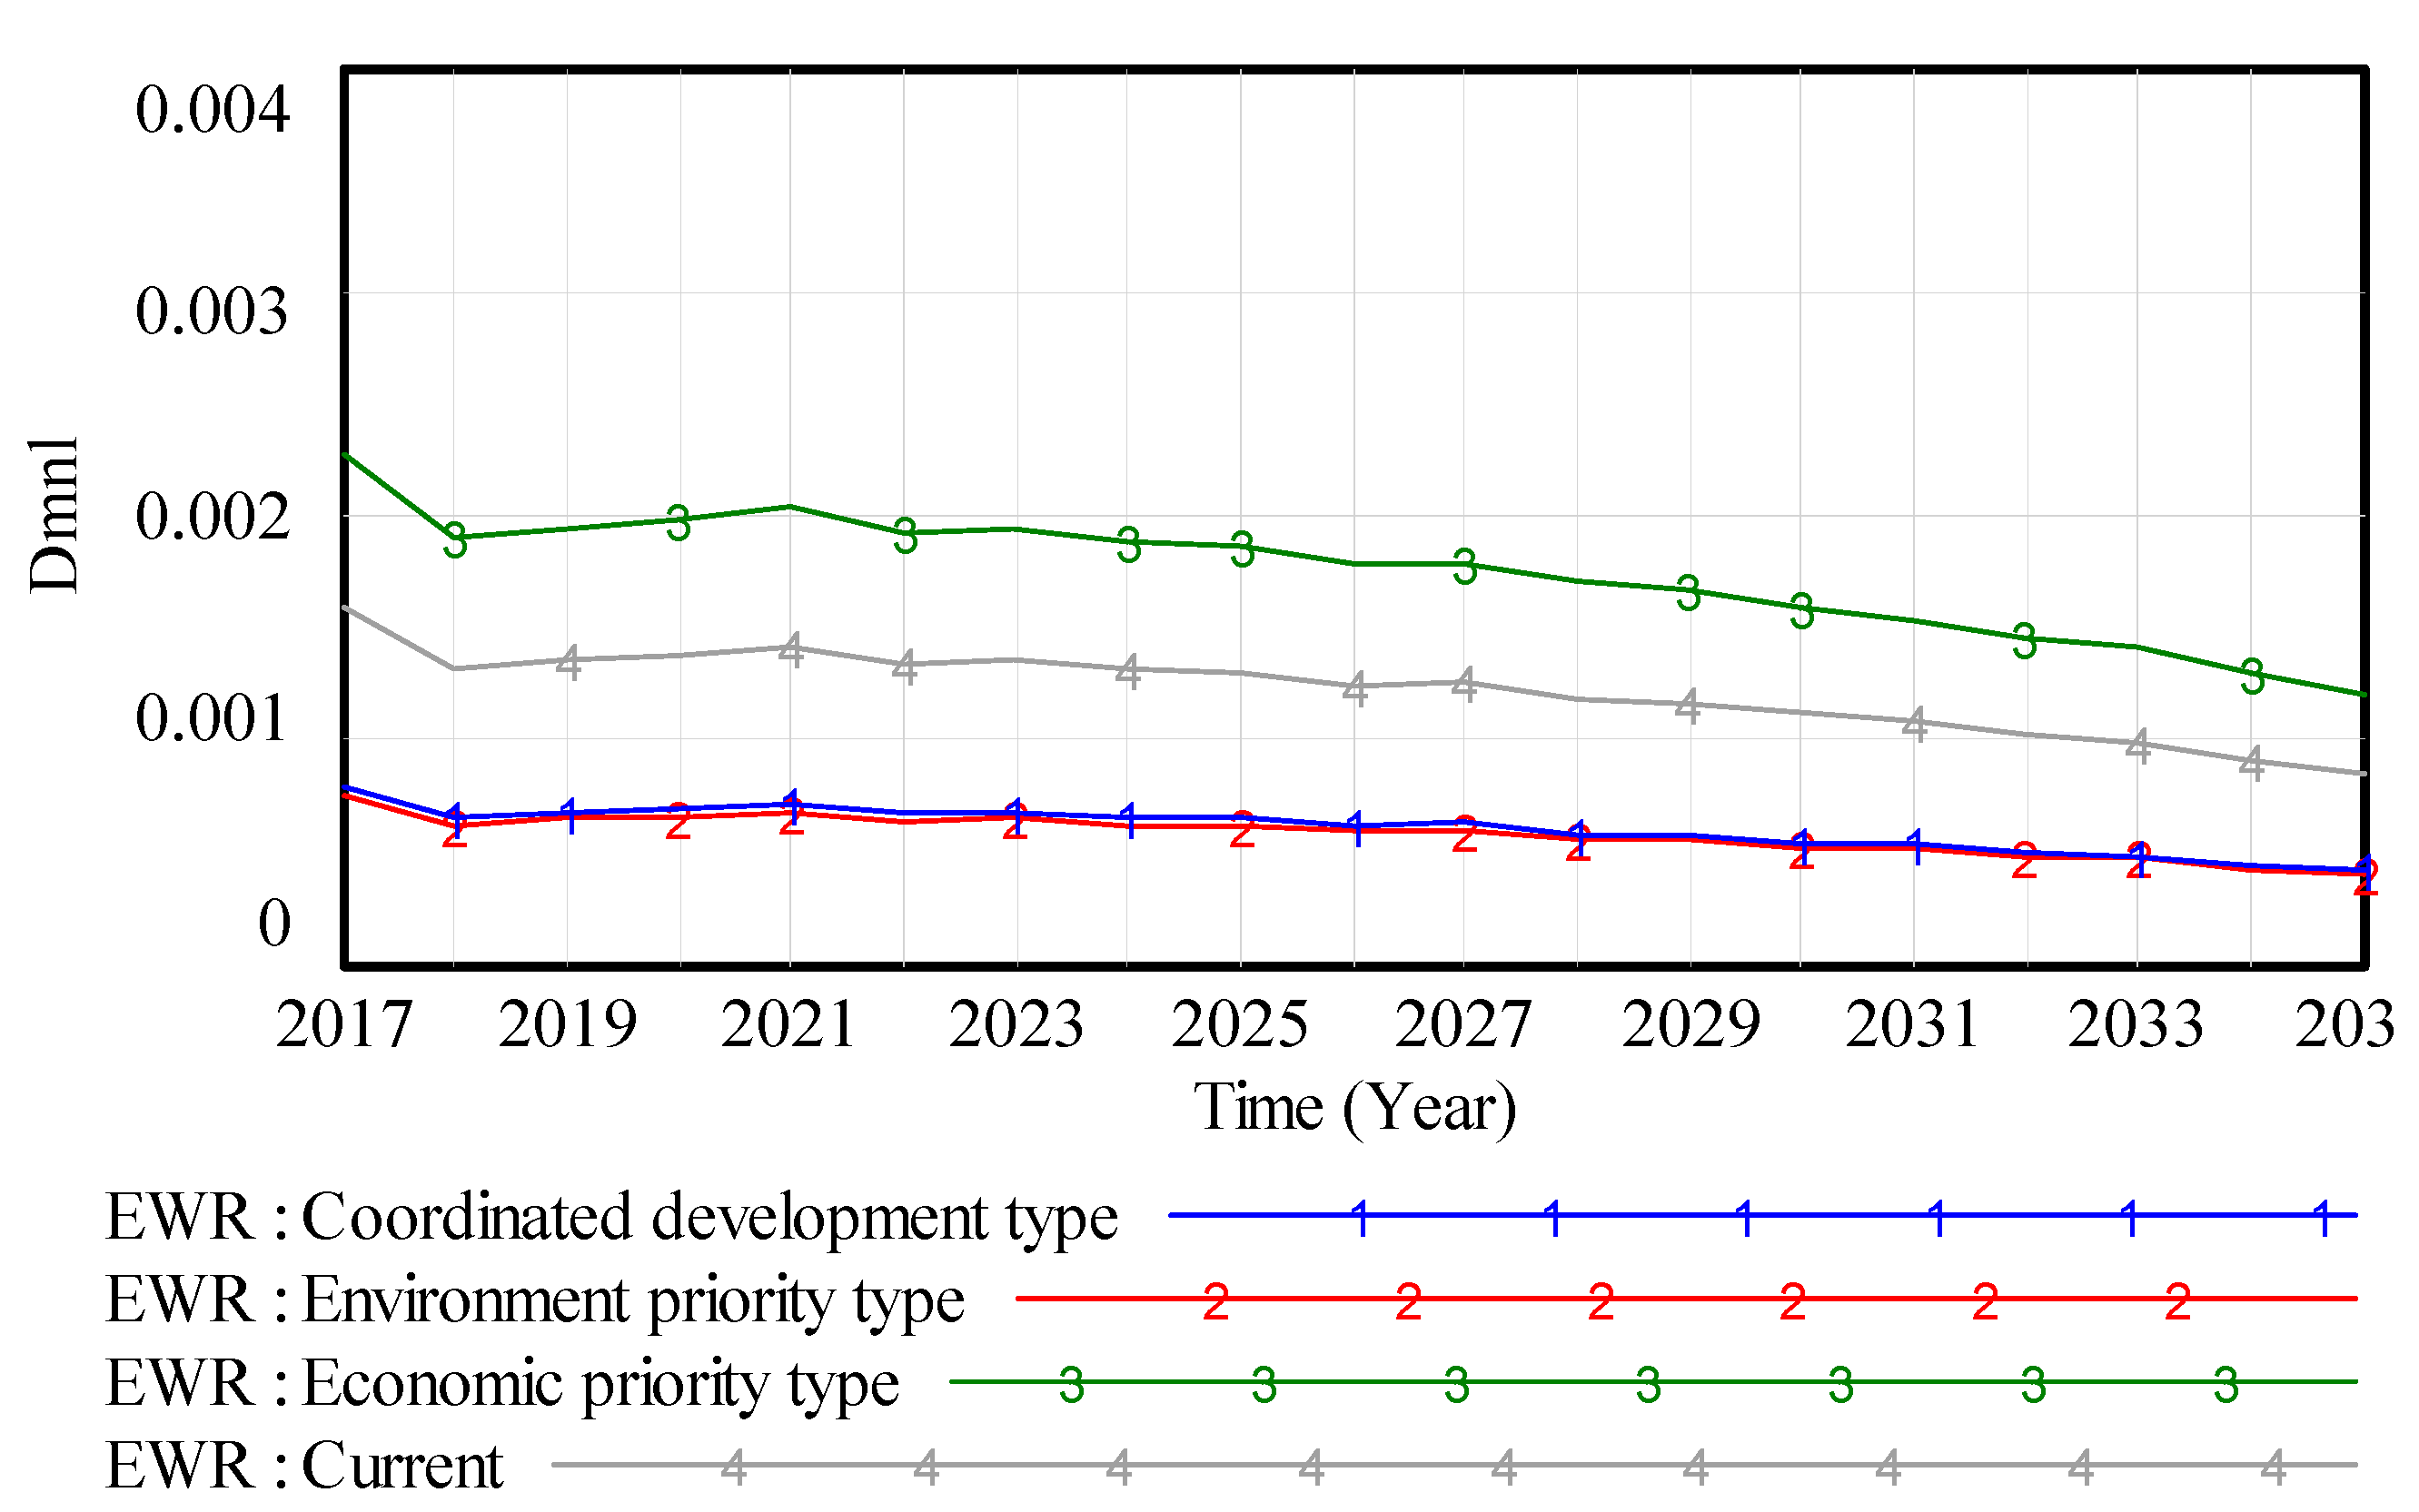
EWR is the ratio of the loss of three types of waste to the total energy value, which is used to measure the pressure of waste on the ecosystem. As shown in Figure 10, the values of the economic priority type and the current model are much higher than those of the environment priority type and the coordinated development type, indicating that the traditional extensive economic model leads to low utilization efficiency of the system, causing great pressure on the ecological environment, and improving energy use. The waste content of the system significantly reduces after the rate is reduced, and the pressure on the environment also improves accordingly.
Figure 10.
Simulation results of the EWR.
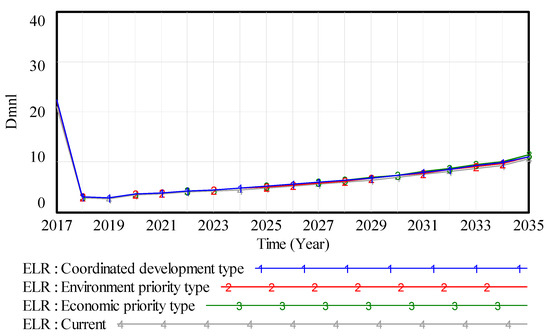
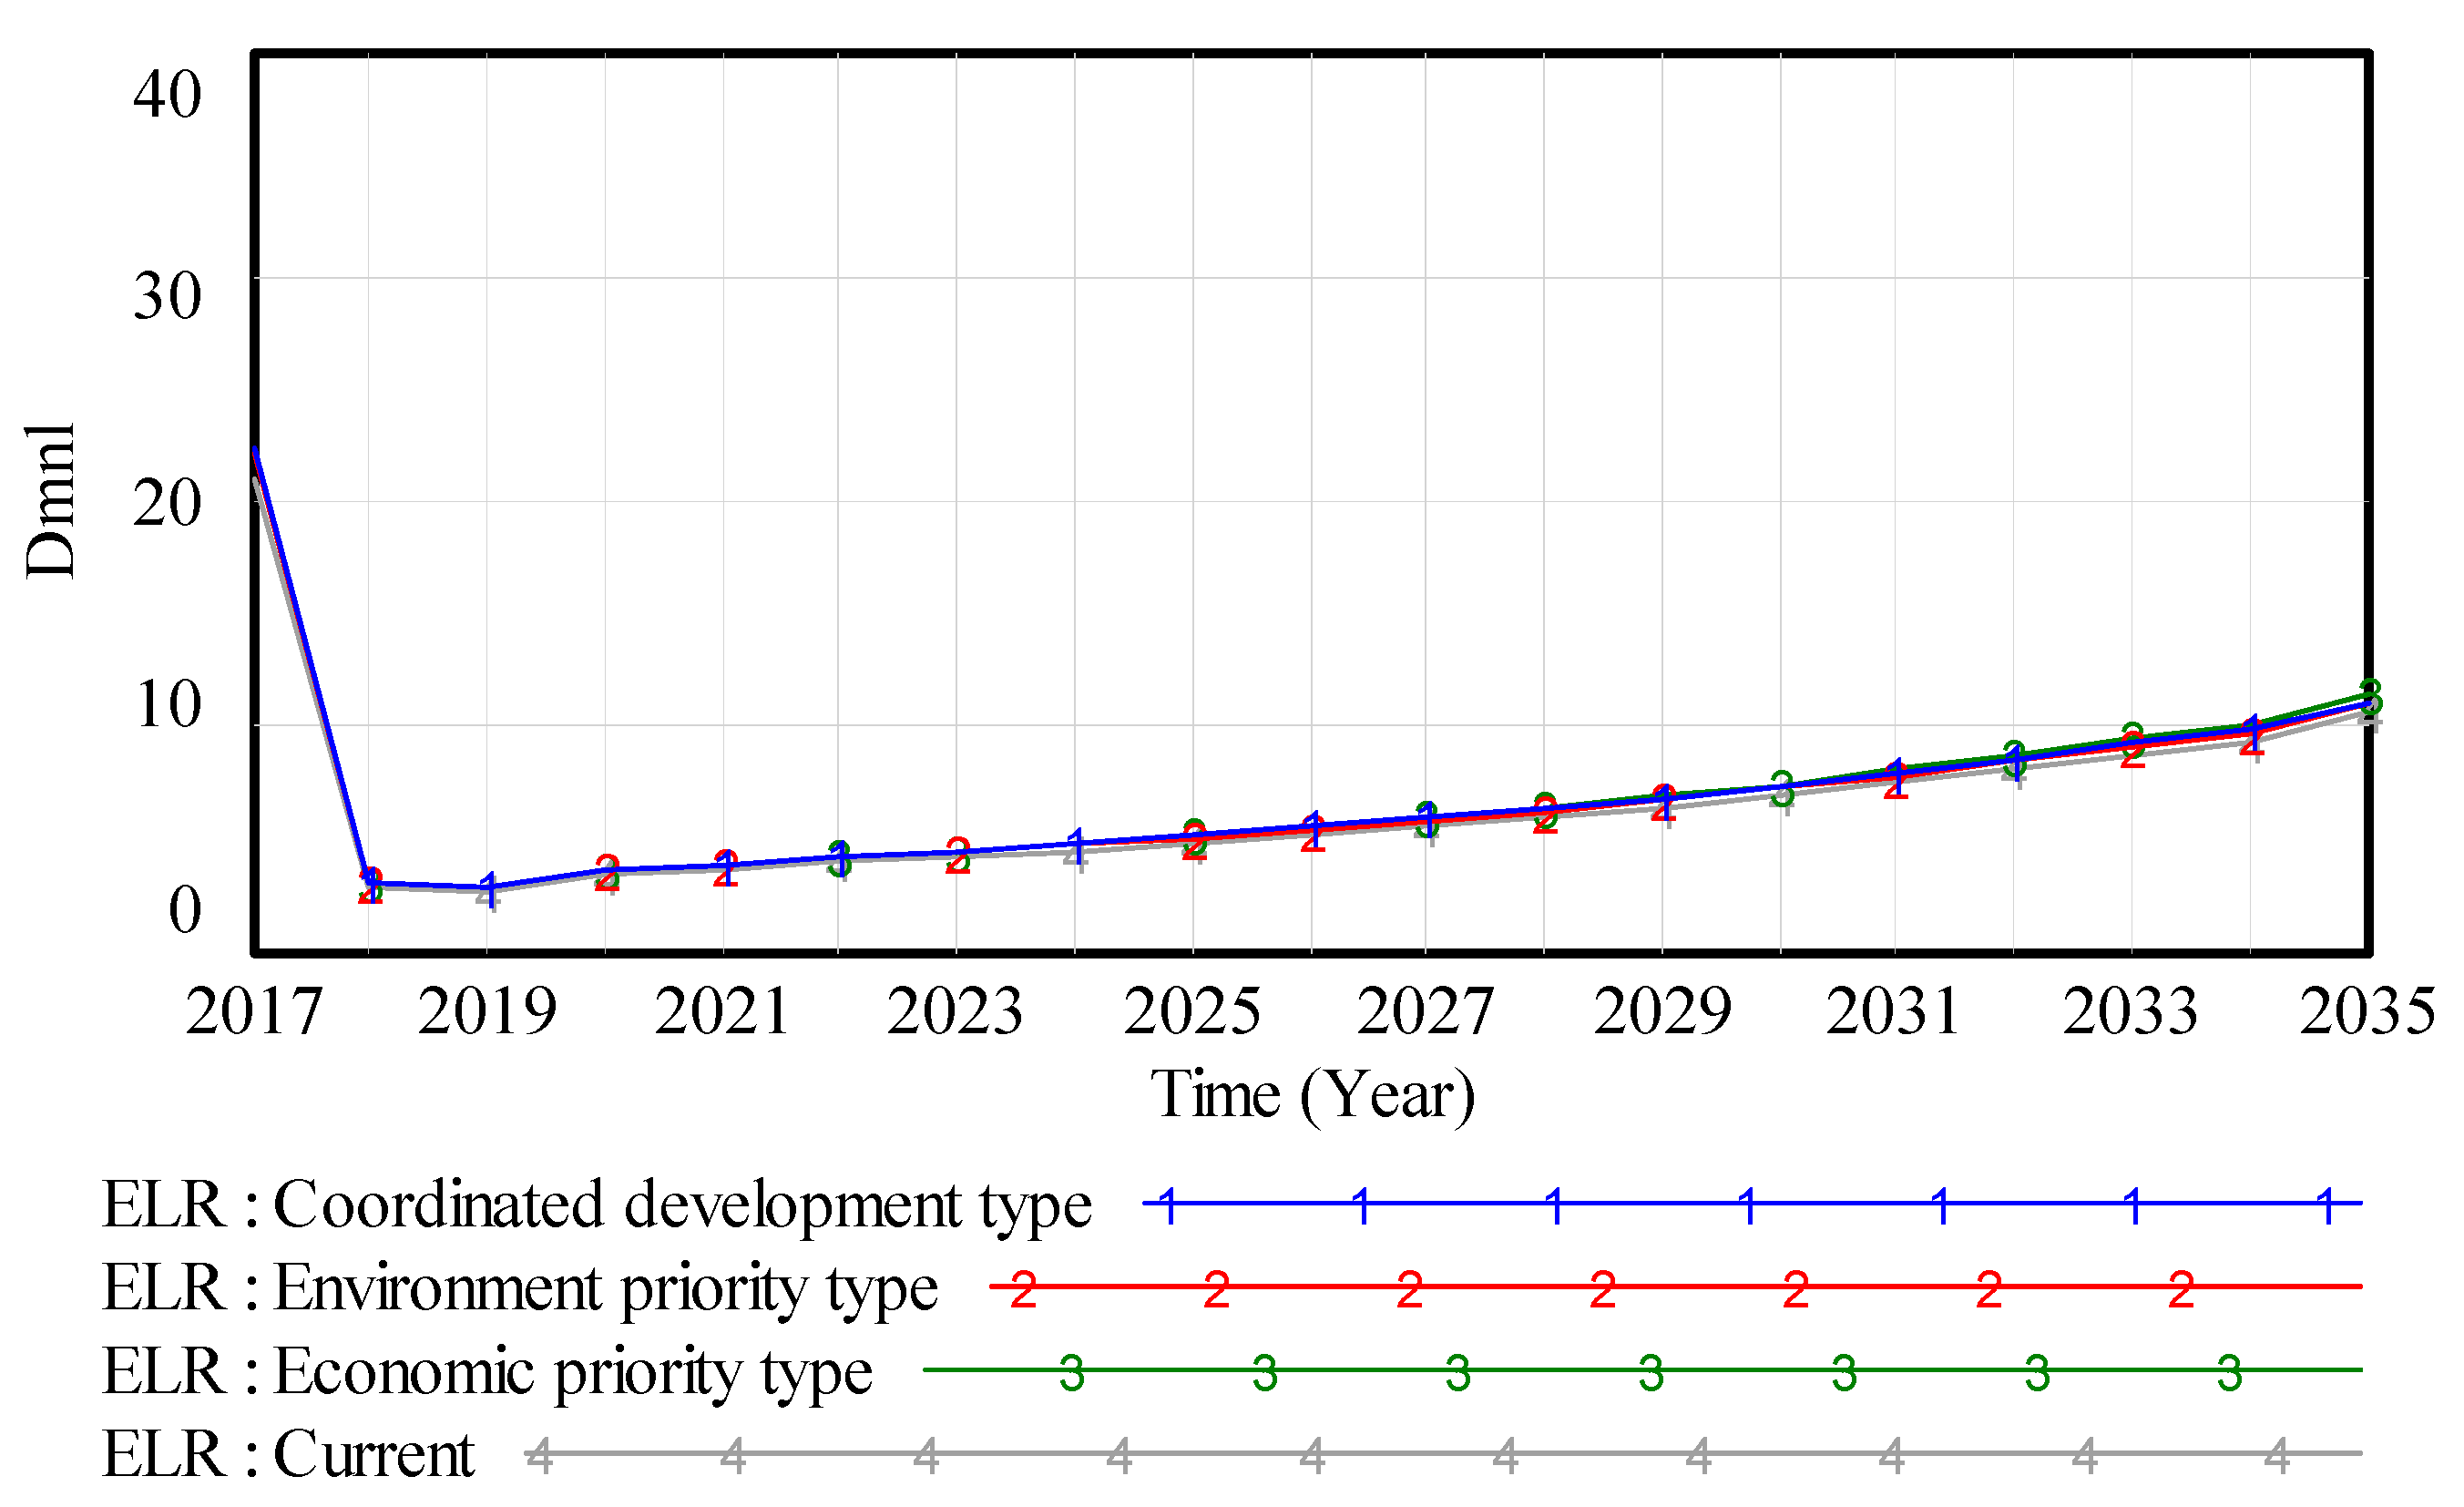
ELR is the ratio of the system’s non-renewable resources to the renewable resources input, which reflects the environmental pressure on the regional ecological-economic system. As shown in Figure 11, the environmental load rates under the four scenarios are all high, show an increasing trend, indicating that the carrying capacity of the ecological environment weakens, and the future will still consume a large number of non-renewable resources. By 2035, the growth rates under the four scenarios are 0.127, 0.125, 0.131, and 0.129. The environment priority type and coordinated development type have a smaller growth rate, and the long-term development capability of the system is better.
Figure 11.
Simulation results of the ELR.
3.4.4. Overall Efficiency
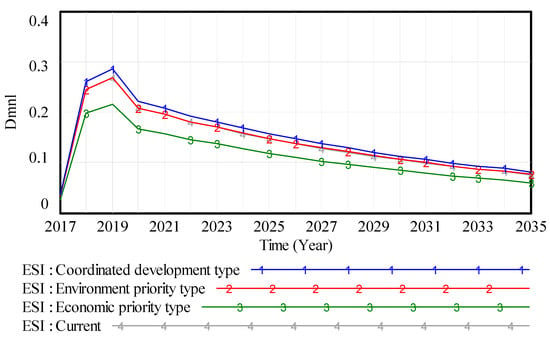
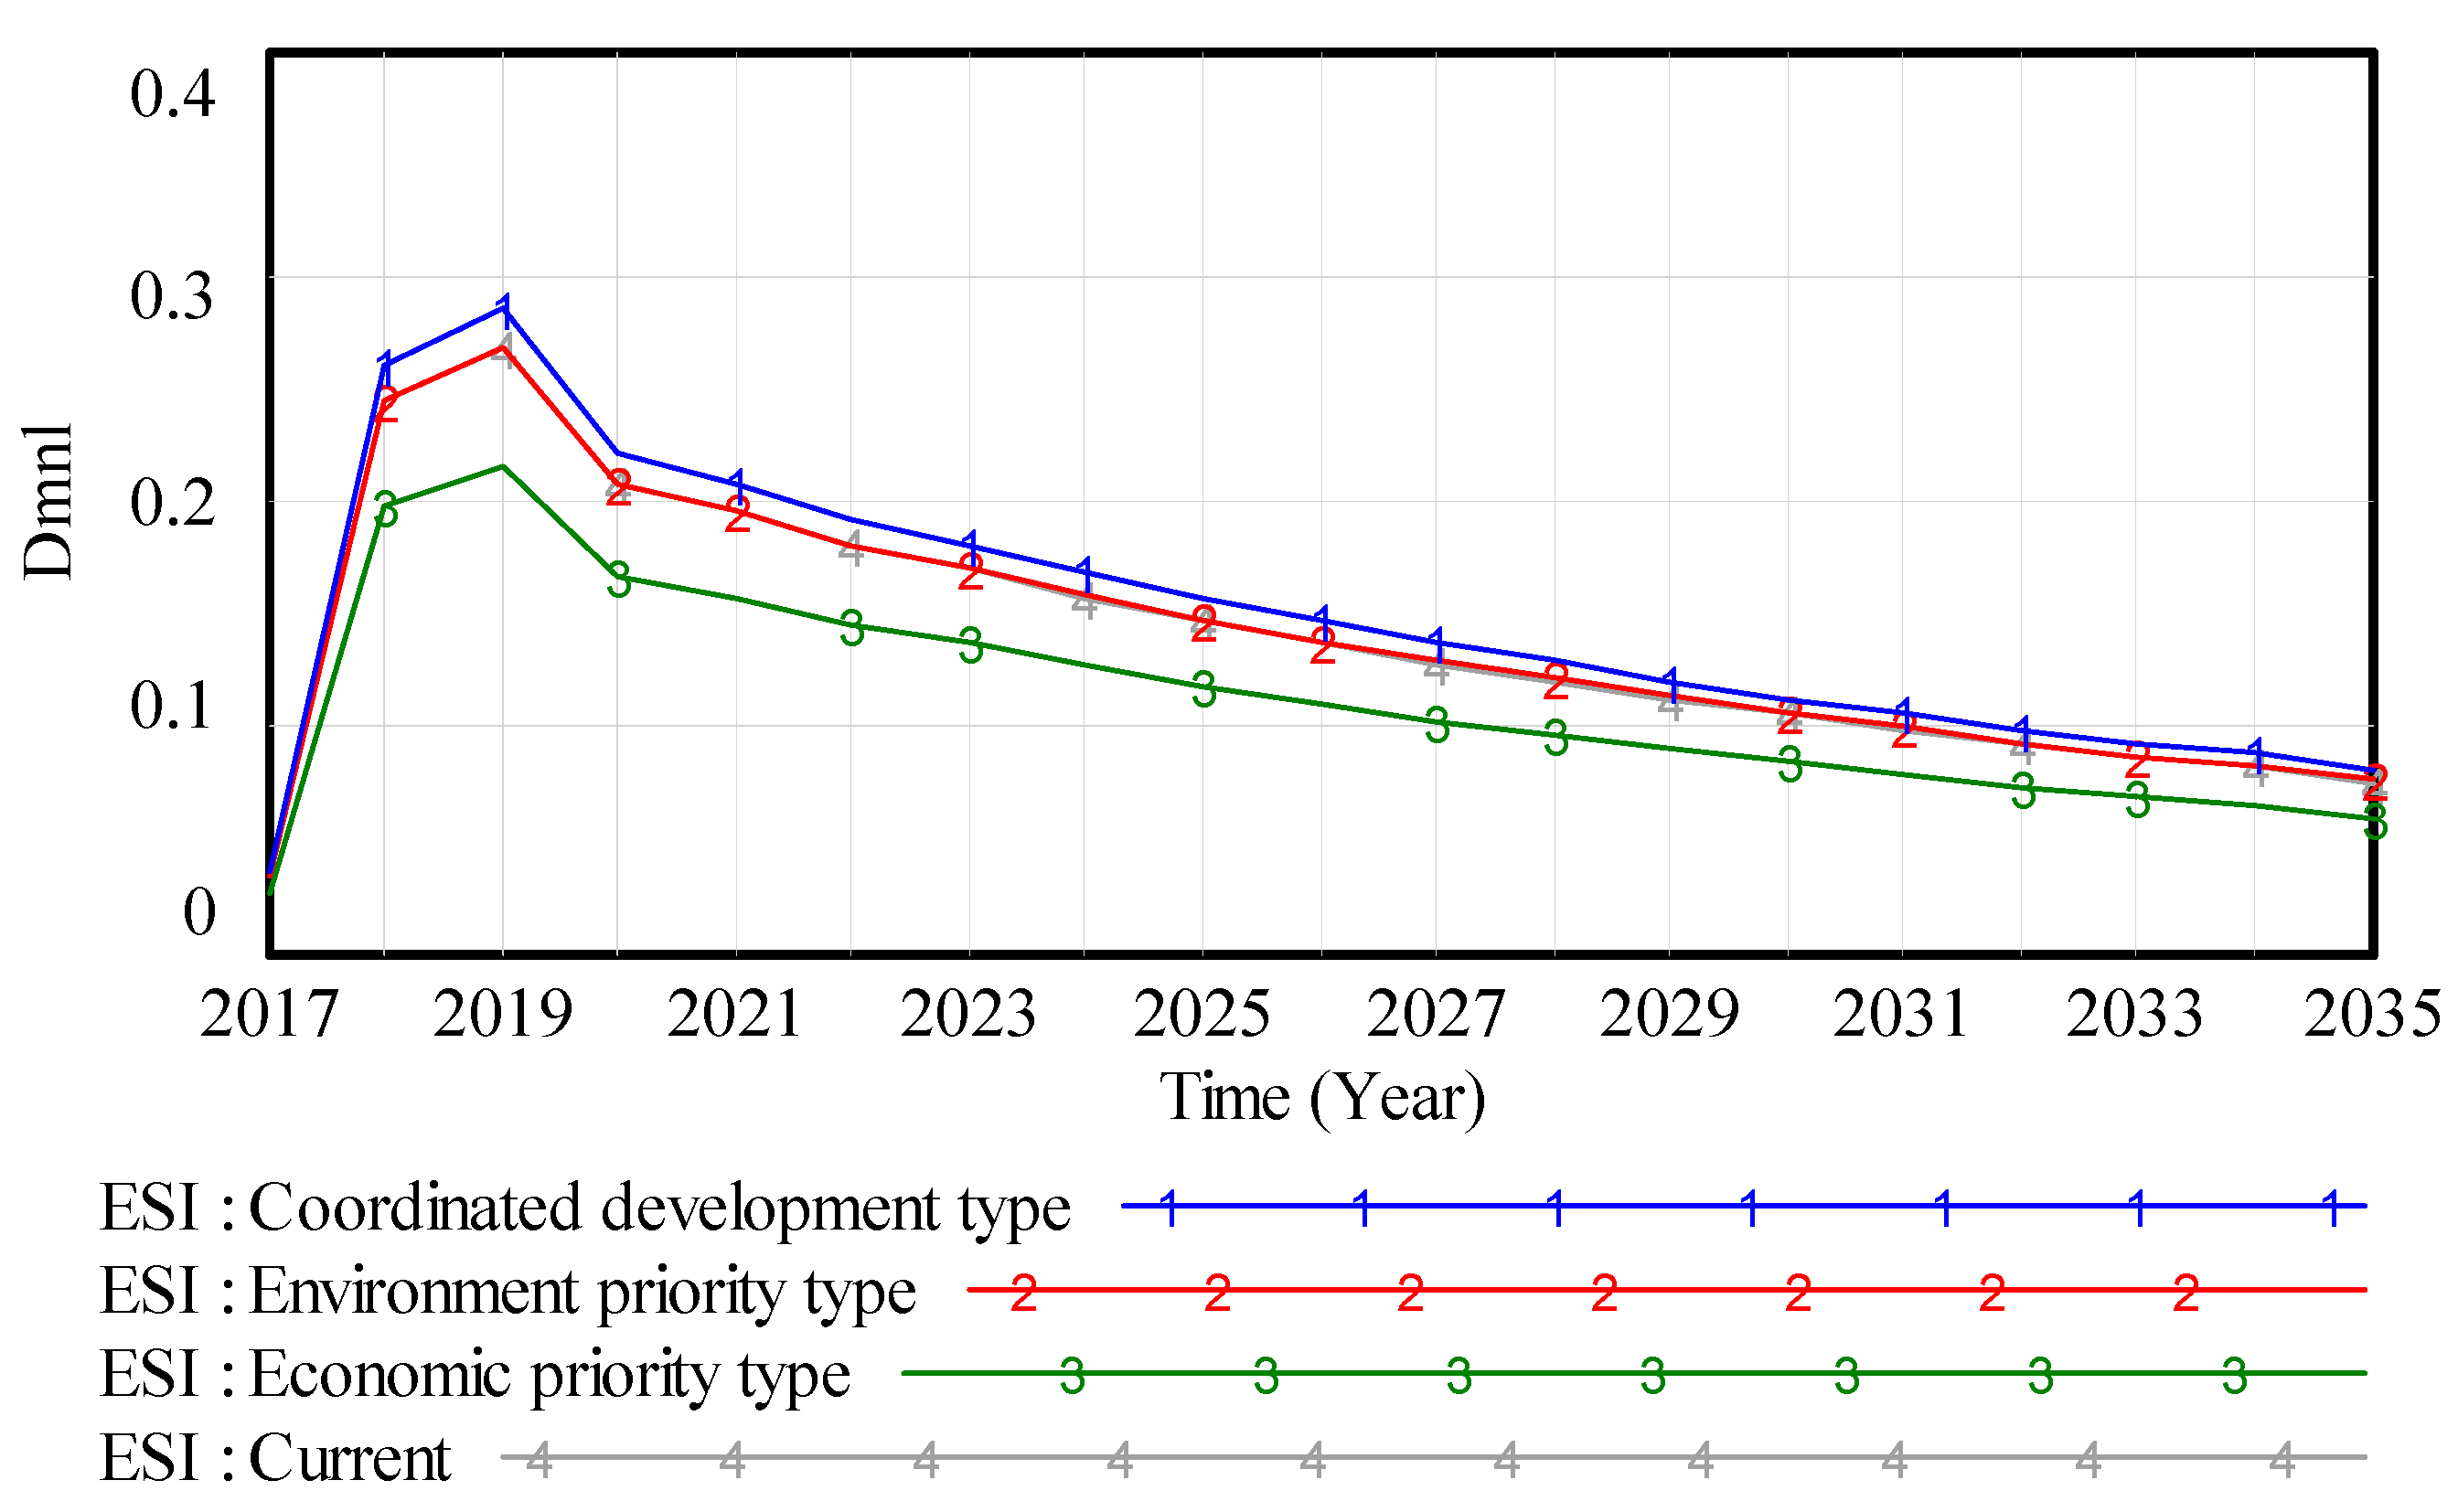
ESI is the value of the system’s emergy output rate divided by the environmental load rate, which is used to comprehensively evaluate the sustainable development capability of the system. Among them, when ESI < 1, it is a consumption-oriented economic system; when 1 < ESI < 10, it is a vigorous and potential system; when ESI > 10, it is an economically underdeveloped system. As shown in Figure 12, the four scenarios are all less than 1, it indicates that the ecological-economic system in Liaoning Province is a consumption-based system; the value of the coordinated development type is significantly higher than the other three, the sustainable development capability is also better than the other three, and the economic priority type is the lowest, indicating that the sustainability of the system is severely weakened under the background of the consumption of a large number of non-renewable resources, and excessive reliance on external resources will be strengthened.
Figure 12.
Simulation results of the ESI.
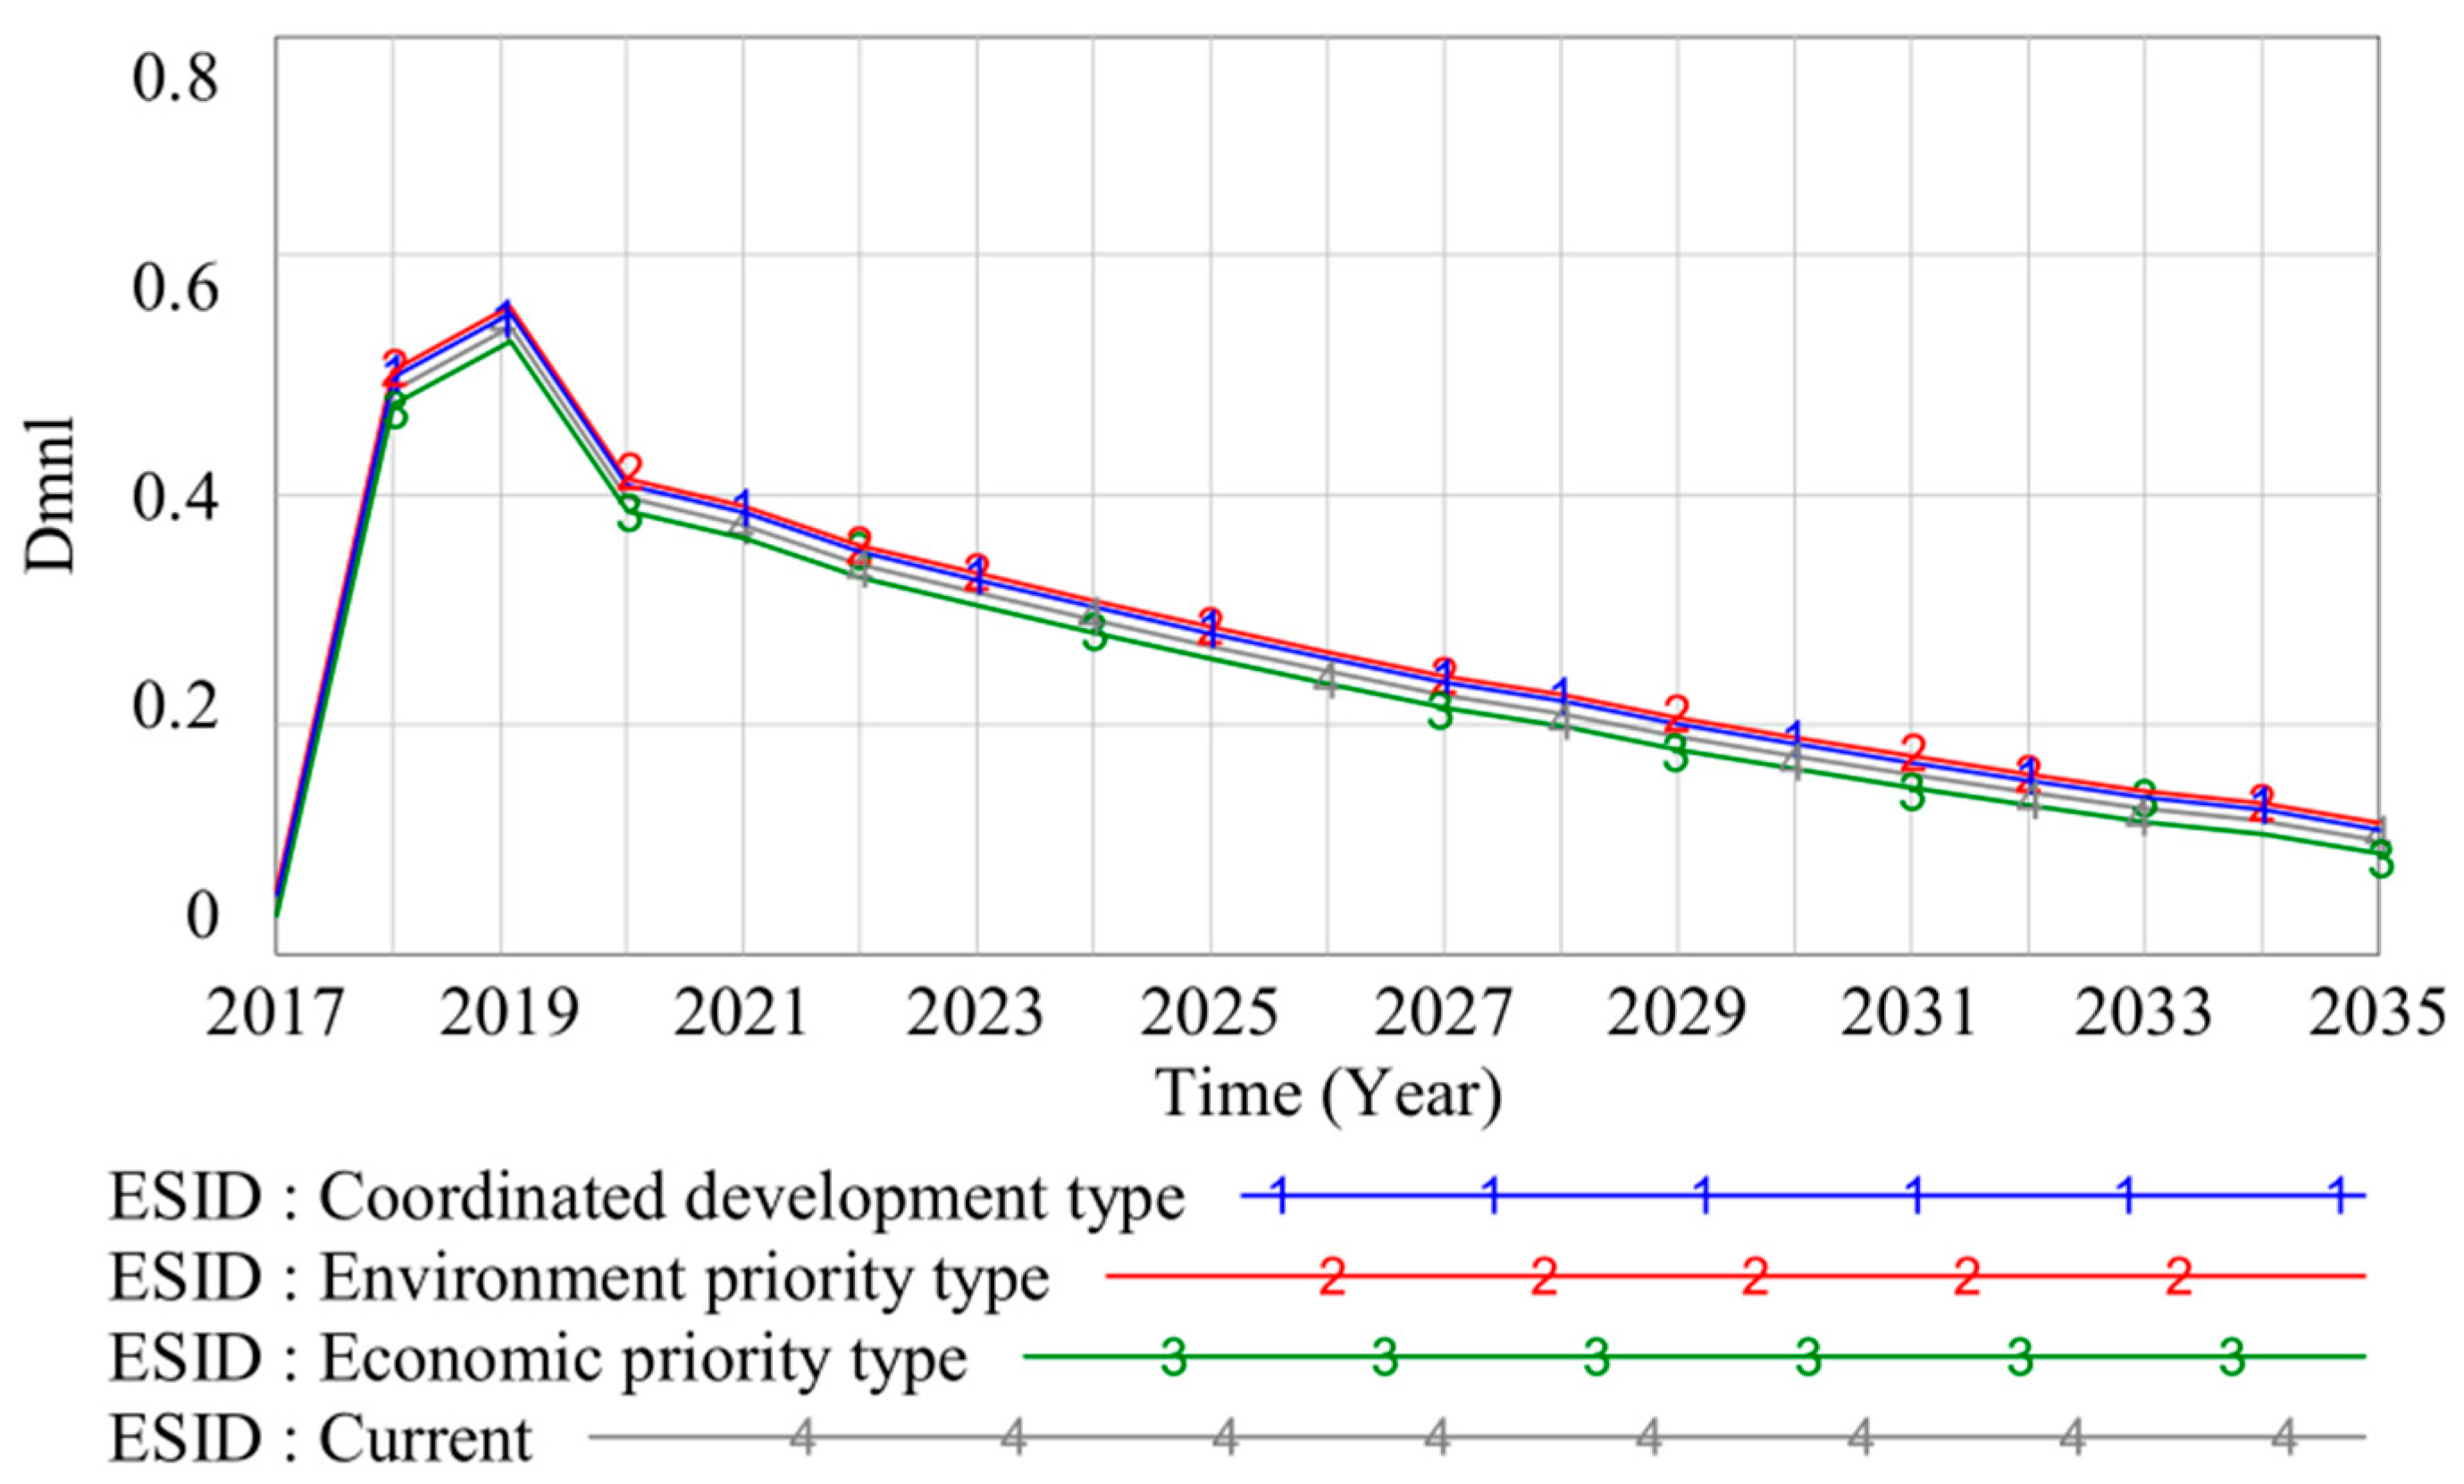
ESID is a sustainable development index that combines the emergy output rate, the emergy exchange rate and the environmental load rate, taking into account the social and economic benefits and the pressure of the ecological environment. It is the ratio of the product of the former and the latter. The higher the value, the better the social and economic benefits, and the better the sustainability under the pressure of the unit ecological environment. As shown in Figure 13, the index values in the four scenarios all show a downward trend, indicating that with the development of the social economy, the sustainability of the system gradually deteriorates. The environment priority type is 0.1191, the coordinated development type is 0.1138, the current model is 0.1089, and the economic development type is 0.0982. The environment priority type and coordinated development type are relatively high, and the system sustainability is relatively adequate.
Figure 13.
Simulation results of the ESID.
4. Discussion
4.1. Policy Suggestions
The energy value analysis of Liaoning’s eco-economic system reveals a non-sustainable economic development. As Liaoning is a heavy industrial base, it relies mostly on imported resources, resulting in a greater energy value of inputs than outputs, while emerging national debt yields continue to fall, so the ESI shows a downward trend, with relatively large environmental load rates, low levels of technology and serious waste pollution. Therefore, it is necessary to continuously expand the utilization rate of renewable resources, adjust the ratio of imports and exports, and improve the technological content for its optimal direction. Suggestions to policy makers are as follows:
- Optimize the industrial layout and adjust the structure of resource utilization. In terms of economic circulation, Liaoning Province should increase fixed asset investment in the tertiary industry, reduce fixed asset investment in the heavily polluted primary and secondary industries, and focus on the coordinated development of the leading manufacturing and productive service industries. At the same time, reduce the brain drain, increase funding for technological innovation in the three major industries, and set up superior salaries, benefits, and household registration to attract relevant talents to settle in the province. In addition, through technological innovation, Liaoning Province should focus on the development of renewable resources such as solar energy value and wind energy, reduce the reliance on and use of non-renewable resources, improve resource utilization, and ease the pressure of resource depletion. In terms of the external circulation of the economy, Liaoning Province should adjust the proportion of imports and exports, increase exports, and reduce the proportion of imports and dependence on foreign investment, as well as invest in the development of a “circular economy”, improve resource utilization, integrate cleaner production, and focus on building an infrastructure for resource optimization.
- Increase investment in environmental protection technology to improve waste utilization. As a heavy industrial base, Liaoning Province has, over the years, accumulated a large number of environmental pollution problems from the discharge of industrial waste, leading to the hindrance of its ecological civilization. According to the national emergency energy saving and emission reduction requirements, the revitalization of the old industrial base is combined with scenarios with sustainable-development-related parameters and emphasis on public infrastructure construction. For example, the construction of eco-industrial parks uses sewage treatment systems for water reuse and public sewage treatment facilities to improve the level of resource utilization and waste recycling. This approach can improve the efficiency of waste conversion, facilitate its maximization of power output, reduce emergent consumption, improve environmental quality and seek a low-carbon development path.
- Increase the proportion of high-tech investments and strengthen scientific and technological innovation. Scientific and technological progress can bring about progress in productivity and promote economic development. Liaoning Province should improve the utility of high-tech talent, promote the development of high-tech industries, build industrial innovation platforms, and develop relevant policies to promote industrial innovation. It should also strengthen scientific and technological exchanges and infrastructure, unite regional universities to cultivate dovetailing talents in the sustainable development of the ecological economy, and set up corresponding innovation-driven funds to enhance innovation strength.
4.2. Contribution and Limitations
The combination of the emergy analysis method and the system dynamics method provides a new research idea for the sustainable development of ecological and economic systems, makes up for the shortcomings of a single research method, and provides a reference for the study of ecological and economic systems in the provincial space. On the basis of implementing the national concept of green development, this study is a guide to the implementation of the old industrial base of Liaoning in practicing the concept of ecological priority and green development and environmental protection. It will help Liaoning Province further define the direction and focus of green and sustainable development, and also facilitate the exchange of valuable opinions with other cities in similar development situations, so that making better suggestions can achieve sustainable development.
Due to the differences in methodology between the two studies, there are a number of limitations to the adaptation study. Firstly, there are differences in the selection of emergy transformation rates. The energy conversion rates here are taken from existing studies, but their applicability cannot be fully guaranteed due to the heterogeneity of the study object. Secondly, for the scientific accuracy of the energy value data, the data here are obtained from different sources and the system dynamics requires a large amount of data to support the results, which may lead to uncertainty and validity, thus affecting the simulation results and the conclusions accordingly.
5. Conclusions
GDP and emergy density all showed an upward trend, indicating that the economic level of Liaoning Province is improving and the high-intensity development mode has caused a heavier burden on the already weak ecological environment. The increase in import input results in the input emergy value being greater than the output emergy value and the output value of emergy not being high, and the low waste disposal capacity leads to a low energy utilization rate, which is harmful to the environment, causing great environmental pressure and weakening the sustainability. After comparing the change trends under the four scenarios, it is concluded that under the coordinated development type, GDP, monetary accumulation, emergy density, and material emergy accumulation are higher, and the sustainable development index is also the highest among the four scenarios. Under this model, the system is more dynamic, healthier, and has the best development trend, which is most conducive to the development of the ecological-economic system in Liaoning Province.
Author Contributions
Data curation, N.Z. and J.M.; Methodology, Y.Z.; Supervision, M.Y. All authors have read and agreed to the published version of the manuscript.
Funding
This paper is supported by Humanities and Social Sciences of the Ministry of Education (22YJA630121), Natural Science Foundation of Liaoning (2022-MS-279), Social and Science Foundation of Liaoning (L20BJY010), and Basic Scientific Research Project of Colleges and Universities in Liaoning Province (lnms202140).
Data Availability Statement
Source of data: http://www.ln.gov.cn/zfsj/tjnj/index.html (accessed on 26 June 2022). And data of instances can be published along with manuscript.
Conflicts of Interest
The authors declare that they have no known competing financial interest or personal relationships that could have appeared to influence the work reported in this paper.
References
- Khan, I.; Hou, F.; Le, H.P. The impact of natural resources, energy consumption, and population growth on environmental quality: Fresh evidence from the United States of America. Sci. Total Environ. 2020, 754, 142222. [Google Scholar] [CrossRef] [Scilit] [PubMed]
- Mardiansjah, F.H.; Sugiri, A.; Sari, G.P. Urban population growth and their implication to agricultural land in the process of metropolitanization: The case of kabupaten sukoharjo, in metropolitan surakarta. IOP Conf. Ser. Earth Environ. Sci. 2019, 328, 012064. [Google Scholar] [CrossRef] [Scilit]
- Ulucak, R.; Danish; Ozcan, B. Relationship between energy consumption and environmental sustainability in oecd countries: The role of natural resources rents. Resour. Policy 2020, 69, 101803. [Google Scholar] [CrossRef] [Scilit]
- Dong, H.; Xue, M.; Xiao, Y.; Liu, Y. Do carbon emissions impact the health of residents? considering China’s industrialization and urbanization. Sci. Total Environ. 2021, 758, 143688. [Google Scholar] [CrossRef] [Scilit] [PubMed]
- Valdes, C.F.; Marrugo, G.P.; Chejne, F.; Marin-Jaramillo, A.; Franco-Ocampo, J.; Norena-Marin, L. Co-gasification and co-combustion of industrial solid waste mixtures and their implications on environmental emissions, as an alternative management. Waste Manag. 2020, 101, 54–65. [Google Scholar] [CrossRef] [Scilit]
- Wilfart, A.; Prudhomme, J.; Blancheton, J.P.; Aubin, J. LCA and emergy accounting of aquaculture systems: Towards ecological intensification. J. Environ. Manag. 2013, 121, 96–109. [Google Scholar] [CrossRef] [Scilit] [PubMed]
- Odum, H.T. Environmental Accounting—Emergy and Environmental Decision Making; Child Development; John Wiley & Sons: New York, NY, USA, 1996. [Google Scholar]
- Odum, H.T. Handbook of Emergy Evaluation: A Compendium of Data for Emergy Computation; University of Florida: Gainesville, FL, USA, 2000. [Google Scholar]
- Ulgiati, S.; Odum, H.T.; Bastianoni, S. Emergy use, environmental loading and sustainability an emergy analysis of Italy. Ecol. Model. 1994, 73, 215–268. [Google Scholar] [CrossRef] [Scilit]
- Brown, M.T.; Ulgiati, S. Emergy evaluations and environmental loading of electricity production systems. J. Clean. Prod. 2002, 10, 321–334. [Google Scholar] [CrossRef] [Scilit]
- Zhan, C.; Zhao, R.; Hu, S. Emergy-based sustainability assessment of forest ecosystem with the aid of mountain eco-hydrological model in Huanjiang County, China. J. Clean. Prod. 2019, 251, 119638. [Google Scholar] [CrossRef] [Scilit]
- Ma, C.; Wang, X.; Zhang, Y.; Li, S. Emergy analysis of ecosystem services supply and flow in Beijing ecological conservation area. Acta Geogr. Sin. 2017, 72, 974–985. [Google Scholar]
- Song, F.; Su, F.; Zhu, D.; Li, L.; Li, H.; Sun, D. Evaluation and driving factors of sustainable development of the wetland ecosystem in northeast china: An emergy approach. J. Clean. Prod. 2020, 248, 119236.1–119236.11. [Google Scholar] [CrossRef] [Scilit]
- Ma, F.; Eneji, A.E.; Liu, J. Assessment of ecosystem services and dis-services of an agro-ecosystem based on extended emergy framework: A case study of Luancheng county, North China. Ecol. Eng. 2015, 82, 241–251. [Google Scholar] [CrossRef] [Scilit]
- Su, Y.; He, S.; Wang, K.; Shahtahmassebi, A.R.; Gan, M. Quantifying the sustainability of three types of agricultural production in china: An emergy analysis with the integration of environmental pollution. J. Clean. Prod. 2019, 252, 119650. [Google Scholar] [CrossRef] [Scilit]
- Karuppiah, K.; Sankaranarayanan, B.; Ali, S.M. Evaluation of suppliers in the tannery industry based on emergy accounting analysis: Implications for resource conservation in emerging economies. Int. J. Sustain. Eng. 2022, 15, 1–14. [Google Scholar] [CrossRef] [Scilit]
- Chen, W.; Zhong, S.; Geng, Y.; Chen, Y.; Cui, X.; Wu, Q.; Pan, H.; Wu, R.; Sun, L.; Tian, X. Emergy based sustainability evaluation for Yunnan Province, China. J. Clean. Prod. 2017, 162, 1388–1397. [Google Scholar] [CrossRef] [Scilit]
- Yu, X.; Geng, Y.; Dong, H.; Fujita, T.; Liu, Z. Emergy-based sustainability assessment on natural resource utilization in 30 Chinese provinces. J. Clean. Prod. 2016, 133, 18–27. [Google Scholar] [CrossRef] [Scilit]
- Santagata, R.; Zucaro, A.; Viglia, S.; Ripa, M.; Ulgiati, S. Assessing the sustainability of urban eco-systems through emergy-based circular economy indicators. Ecol. Indic. 2019, 109, 105859. [Google Scholar] [CrossRef] [Scilit]
- Pan, Y.; Zhang, B.; Wu, Y.; Tian, Y. Sustainability assessment of urban ecological-economic systems based on emergy analysis: A case study in Simao, China. Ecol. Indic. 2020, 121, 107157. [Google Scholar] [CrossRef] [Scilit]
- Zhao, Y.; Yu, M.; Kong, F.; Li, L. An emergy ternary diagram approach to evaluate circular economy implementation of eco-industrial parks. Clean Technol. Environ. Policy 2019, 21, 1433–1445. [Google Scholar] [CrossRef] [Scilit]
- Zhao, Y.; Yu, M.; Xiang, Y.; Kong, F.; Li, L. A Sustainability Comparison between Green Concretes and Traditional Concrete Using an Emergy Ternary Diagram. J. Clean. Prod. 2020, 256, 120421. [Google Scholar] [CrossRef] [Scilit]
- Zhou, X.; Zhiduan, X.U.; Yongqin, X.I.; Management, S.O.; University, X. The system dynamic model and policy optimized simulation of energy conservation and emission reduction in china. Syst. Eng.-Theory Pract. 2018, 38, 1422–1444. [Google Scholar]
- Jiang, Q.; Zhao, X.; Wang, Z.; Fu, Q.; Zhou, Z.; Wang, T.; Dong, Y. Emergy analysis of agricultural ecosystems in Heilongjiang Province based on system dynamics. J. Appl. Basic Eng. Sci. 2019, 4, 780–793. [Google Scholar]
- Elliot, T.; Rugani, B.; Almenar, J.B.; Niza, S. A proposal to integrate system dynamics and carbon metabolism for urban planning. Procedia Cirp 2018, 69, 78–82. [Google Scholar] [CrossRef] [Scilit]
- Fang, W.; An, H.; Li, H.; Gao, X.; Sun, X.; Zhong, W. Accessing on the sustainability of urban ecological-economic systems by means of a coupled emergy and system dynamics model: A case study of Beijing. Energy Policy 2017, 100, 326–337. [Google Scholar] [CrossRef] [Scilit]
- Zhao, Y.; Yu, M.; Xiang, Y.; Chang, C. An Approach to stimulate the sustainability of Eco-industrial Park using a coupled emergy and system dynamics. Environ. Dev. Sustain. 2022, 93. [Google Scholar] [CrossRef] [Scilit]
- Lu, H.F.L.; Lan, S.F.; Peng, S.L. Extending study on energy indices for sustainable development. PubMed 2003, 24, 150–154. [Google Scholar]
- Liu, G.Y.; Yang, Z.F.; Chen, B.; Zhang, Y.; Zhang, L.X. Urban Ecosystem Health Assessment Based on Emergy Analysis: Taking Baotou City as an Example. J. Ecol. 2008, 4, 1720–1728. [Google Scholar]
- Liu, G.Y.; Yang, Z.F.; Chen, B.; Yang, Y.; Su, M.R.; Zhang, L.X. Emergy evaluation of the urban solid waste metabolism in Liaoning Province. Energies 2013, 6, 5486–5506. [Google Scholar] [CrossRef] [Scilit]
- Sun, Y.F.; Guo, Q.Y. Analysis of Ecological Efficiency of Mining Area Circular Economy System Based on Emergy Analysis. Chin. J. Ecol. 2014, 3, 710–717. [Google Scholar]
- Lan, S.F.; Lu, H.F. Emergy Analysis of Ecological Economic System; Chemical Industry Press: Beijing, China, 2002. (In Chinese) [Google Scholar]

Publisher’s Note: MDPI stays neutral with regard to jurisdictional claims in published maps and institutional affiliations. |
© 2022 by the authors. Licensee MDPI, Basel, Switzerland. This article is an open access article distributed under the terms and conditions of the Creative Commons Attribution (CC BY) license (https://creativecommons.org/licenses/by/4.0/).