


Abstract
The competition between cities involves the search for different ways and means to create, attract, sustain, and use diverse resources, knowledge, ideas, and innovations to support the economic growth of each individual city and, as a result, to strengthen the city’s position in the urban hierarchy both short-term and long-term. However, for each city, urbanisation does not only mean an increase in competitive economic power but also a number of problems such as pollution, poverty, crime and unemployment. In order to address the challenges posed by the urbanisation processes, the United Nations World Commission on Environment and Development (WCED) issued the 1987 Report that emphasised the need for sustainable socio-economic development that would also consider ecological factors. Given this, the article examines the issue of urban competitiveness on the basis of sustainable development principles. After a systematic and comparative analysis of the concepts published in the scientific literature, this article accomplishes the following: It defines the concept of competitiveness in urban areas; it identifies the inclusion aspects of the sustainable development principles into the assessment of urban competitiveness; it presents the research into urban competitiveness assessment models; and it carries out an integrated competitiveness assessment of the Baltic capitals in the period of 2014–2019 based on the principles of sustainable development by applying the integrated competitiveness assessment model that is based on the principles of sustainable development (MDK).
1. Introduction
The impact of the urbanisation process on the economic development of cities and regions has been a point of debate in the scientific literature. Some researchers [1,2,3] point to the positive effect that this process has on the economic development of cities. They highlight the following factors: A strong correlation between urbanisation and GDP, greater opportunities for business development and investments, an increase in productivity and the implementation of innovations, as well as better conditions for living, working, studying and relaxing. On the other hand, some research [4,5,6,7,8,9,10] also discerns the dangers of deteriorating ecological and social circumstances, including social inequality, income inequality, poverty, growing pollution, morbidity, as well as water, food and housing shortages, and over-consumption of energy resources. The third camp [11,12,13,14,15] emphasises the need to implement the principles of sustainable urban development in developing urban expansion and increasing competitiveness.
Scientific literature regards sustainable development as an integrated concept and a complex process [16]. It is aimed at ensuring prosperity not only for the present but also for future generations. Cioca et al. [17] describe sustainable development as development that maintains the stability of the system and balances the economic, social and environmental development while not putting future generations in jeopardy. Many researchers have studied the relationship between economic development and urban or regional competitiveness [18,19,20]. Kresl [20] has stressed that the economic prosperity of a country depends on the economic vitality of cities. Sinkienė [19] has concluded that cities are the main drivers of the state’s or region’s economy due to them containing the highest concentration of consumers and the largest domestic markets.
Given the above, we can observe that there is a direct link between the following economic phenomena: The urbanisation process, urban economic growth and competitiveness. However, they can also work in a contrary manner where the city fails to adapt to the changing conditions and is passive with regards to the implementation of sustainable development in the areas that are pertinent to the city, such as the economy, the social environment and the quality of the environment. The larger the city, the richer it is, albeit only to a certain extent of overcrowding, whereby the city may suffer a more significant social and ecological burden.
The aim of the article is to assess the competitive position of small urban areas in terms of their economic, social and environmental quality both over time and with respect to other competing cities.
Research methods: Systematic and comparative analysis of concepts and methods published in the scientific literature; statistical processing; expert evaluation; and multi-criteria assessment methods.
2. Analysis of Related Literature
2.1. The Concept of Competitiveness in Urban Areas
The concept of urban competitiveness is the subject of much debate among scholars. Researchers do not agree on what determines the competitiveness of a city: Whether it is the competitiveness of a region or a country that determines urban competitiveness; or vice versa—the competitiveness of a city determines the competitiveness of a region and a country [21]. The documents of the European Spatial Development Perspective (ESDP) state that regions can only become competitive if their cities have strong economies. Researchers [20,22] emphasise that urban development and the vitality of cities form the basis of a country’s economic prosperity. Sinkienė [19] has highlighted that cities drive socio-economic growth both nationally and internationally. Singhal et al. [1] have emphasised the growing importance of cities in the global economy. Paliulis and Činčikaitė [23,24,25,26] have highlighted the capacity of cities to create satisfactory conditions for businesses, to strengthen their existing competitive position, and to form alliances with other cities. Researchers [27,28,29] have argued that the economies of countries, and especially regions, are closely linked with the development of cities and urban areas. Piliulytė [30,31] has emphasised the importance of urban governance in the context of increasing urban competitiveness. The term “smart city” is especially common in the scientific literature [32,33,34,35,36,37] and in various strategic documents [38,39,40]. It is most often defined as a highly competitive city, where the living quality is excellent.
In summary, urban competitiveness is regarded as the ability of cities to use certain available competitive factors that are created or drawn by the city to ensure the success of its economic, social and environmental systems and to maintain and strengthen the city’s competitive position in relation to both the other competing cities and time. This definition allows urban competitiveness to be perceived as a continuous and self-reinforcing process, rather than a finite result, whereby the result also becomes an input that later determines the outcome.
2.2. Urban Competitiveness Assessment
The scientific literature does not offer a single unified method or model for assessing the competitiveness of a city. Rutkauskas [13] has attempted to assess the competitiveness of a region in terms of the competitiveness of the activity areas that dominate the country or the region, its international economic relations, its legal, financial, ecological and natural resources as well as its geographical environment. Researchers [15,25,26,27] have assessed the competitiveness of cities using integrated indicators that formed an integrated index.
By identifying various factors of urban competitiveness (e.g., fundamental and driving or input and output), other researchers have formed their own urban competitiveness models [19,24] and/or applied them to analyse and assess cities [20,29]. In examining the concept of a smart city, researchers have additionally assessed the socio-economic issues of the city both by analysing individual indicators and by assessing the correlation between them [37] or by applying various functions [34]. In addition, successful case analysis is often used to assess smart cities. Having analysed the scientific literature and the strategic plans of various cities, Bruneckienė et al. [27] proposed that the most common non-econometric-qualitative methods used to assess urban competitiveness are the following: The analysis of strengths, weaknesses, opportunities and threats (SWOT), problem analysis, identification of competitive advantage and scenario identification.
To summarise, we observed that the research into urban competitiveness assessment methods as found in the scientific literature demonstrates a variety of approaches. Some authors assessed urban competitiveness by employing one or more indicators; others developed theoretical models of urban competitiveness that combine a particular set of quantitative and qualitative indicators; and others still assessed it as an index or formulated various mathematical equations.
Despite the variety of different methods for assessing competitiveness, research has shown that index and ranking methodologies are most commonly used both by researchers and by various businesses, consulting companies and organisations (e.g., the World Economic Forum, IDC Energy Insights, IBM, GSMA).
Researchers [13,18,41] place area competitiveness indices that are most frequently found in the literature into the following two groups:
- Indices measuring the overall competitiveness of a country or a region. The most well-known indices in this group include the Global Competitiveness Index of the World Economic Forum and the Global Competitiveness Index of the Institute for Management Development.
- Indices measuring the partial competitiveness of a country or a region. The most well-known indices of this group include the Economic Freedom and Transparency International Corruption Perceptions Index.
It is also possible to name another group of indices as follows:
- Indices assessing urban competitiveness.
One of the main rankings of urban competitiveness is the Smart Cities Index developed by the Centre of Regional Science of Vienna University of Technology. The GSMA Smart City Index assesses the cities of the world. The following cities were recognised as smart cities by the GSMA: Berlin, Helsinki, Barcelona, Amsterdam, New York, San Francisco, Dubai, Seoul, Shanghai, Hong Kong and Singapore.
The aspects of sustainable development assessment examined by the authors [7,12,15,42,43,44,45] are those aspects that are directly or indirectly included as factors in the structure of a ranking or developed for city rankings focused on sustainable development. Siemens has developed the Green City Index, which assessed more than 120 cities in Europe, Latin America, the United States and Canada, Asia and Africa. Despite there being a diverse variety of competitiveness indicators for cities that more or less highlight the principles of sustainable development, it must be acknowledged that these indices are designed to measure large or medium-sized cities. Research into their application to small cities outside the NUTS II classification is lacking.
In summary, assessing the competitiveness of cities is a complex process. There are many methods for assessing urban competitiveness. This subject has received much debate with regards to objective urban competitiveness assessment. Given that urban competitiveness is a multi-criteria concept and studies [7,15,24,27,28] have shown that urban competitiveness cannot be reflected in a single economic and/or social micro-level or macro-level indicator or its comparison with similar ones in other cities, its evaluation demands an integrated assessment.
In the academic literature, models assessing urban competitiveness may be distinguished into urban models and models that focus on sustainable urban competitiveness.
The urban competitiveness model developed by Sinkienė [19] is based on the urban functioning process that defines the inputs, processes and outputs. The model identifies the main factors determining the city’s competitiveness and classifies it into the following two groups: (1) External environmental factors affecting how the city gains, maintains and grows its competitiveness, which is then further divided into five groups: Political-legal, economic, socio-cultural, technological and natural-ecological environmental factors; (2) internal environmental factors that condition the growth of the competitiveness of a city, which are then classed into four groups of factors: Human, institutional, physical and economic factors. The competitiveness model devised by Sinkienė [19] emphasises the principles of sustainable development that are focused on the economy and environmental friendliness. The author’s model suggests that a city can be competitive only if it has a high quality of life. This model highlights factors at both the national-regional and city levels. However, it pays less regard to the factor of cooperation with other cities and the participation in certain unions. While the author has described the significance of the highlighted key factors of urban competitiveness, she has not provided specific indicators defining them.
In [24], the integrated urban competitiveness assessment model based on the principle of sustainable development (MDK), the factors are divided into three levels as follows: Level I—basic factors; level II—developmental factors; and level III—interactions.
Basic factors are the necessary factors conditioning the existence of a city. They are particularly important for the economic and social development and the environmental quality of the city.
Developmental factors are the factors that directly generate the city’s welfare and simultaneously shape the city’s competitiveness by means that allow the effective use of basic factors.
Interactional factors reflect the outcome mutually generated by basic factors and developmental factors.
The identified factors are structured according to the components of sustainable development, i.e., the vitality and competitiveness of the economy, a healthy environment, social welfare and environmental friendliness.
Urban competitiveness (M40) is calculated according to the following function (1):
where:
- M40 is a rating of the city’s sustainable competitiveness
- M31 is a rating of the city’s gross domestic product
- M32 is a rating of the urban life quality
- M10 is a rating of the basic factors
- M20 is a rating of the developmental factors
- M50 is a rating of the external urban environment
- w1 … n are the weighting factors
To summarise the analysis of urban competitiveness models, we can observe that cities compete with one another by way of a combination of various competitiveness determinants. Therefore, competitiveness cannot be assessed in isolation from the external urban environment. Given the results of the analysis of urban competitiveness models, the MDK model has been selected to assess the competitiveness of the Baltic capitals in the period between 2014 and 2019.
3. Methodology
The authors of the article were conducting an empirical study with the aim to determine the competitive position and dynamics of the Baltic capitals in the period of 2014–2019 and to assess the position of individual indicators (or levels). The MDK model was used for the study. The study consisted of the following 3 stages:
After forming the expert group in the 1st stage, the factors were selected from the formed sets for calculations. This empirical research used expert evaluation to determine the adequacy of indicators.
The concordance of the opinions of the surveyed experts was assessed using the Kendall concordance coefficient [46] W (2):
S is calculated using the following Formula (3):
where
- xij is the value of the ith variable evaluation by the jth expert.
- the sum of the ranks of the jth city, i.e., =Rx1 + Rx2 +…. + Rxk
- n is the sample size;
In the 2nd stage, we determined the weighting factors of urban competitiveness factors. The weighting factors (w) of the competitiveness factors and their individual groups were determined using the statistical average method by applying the following Formula (4):
where —the statistical average
The weighting factor takes values between 0 and 1. The sum of the weighting factors of the factors for each factor group was 1.
In the 3rd stage, the competitiveness of cities was calculated based on the principle of sustainable development by using 2 multi-criteria assessment methods: SAW and COPRAS.
SAW (Simple Additive Weighting) method [46] (5):
where
- Sj is the multi-criteria assessment value of the jth alternative;
- ωi is the weight of the ith indicator;
- rij is the normalised value of the ith indicator to the jth alternative (6)
The normalisation of the initial data was performed according to the following Formula (7) [46,47]:
where
- rij is the value of the ith indicator to the jth object.
Using the COPRAS (Complex Proportional Assignment Method) [46,47] complex proportional method, the data were normalised by transforming them into a dimensionless form according to the following Formula (8):
where
- ωi is the weight of the ith indicator;
- rij is the normalised value of the ith indicator to the jth object.
Following this, we determined the priority of objects. The higher the Qj, the higher the efficiency (priority) of the variant (9).
The degree of usefulness Nj of the variant aj is determined using the following Formula (10):
4. Research Results
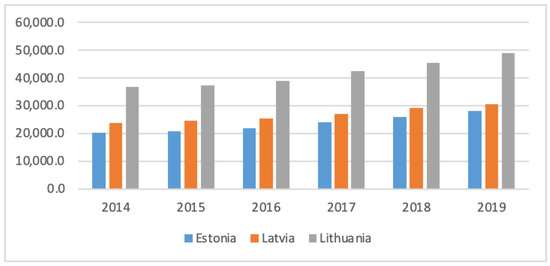
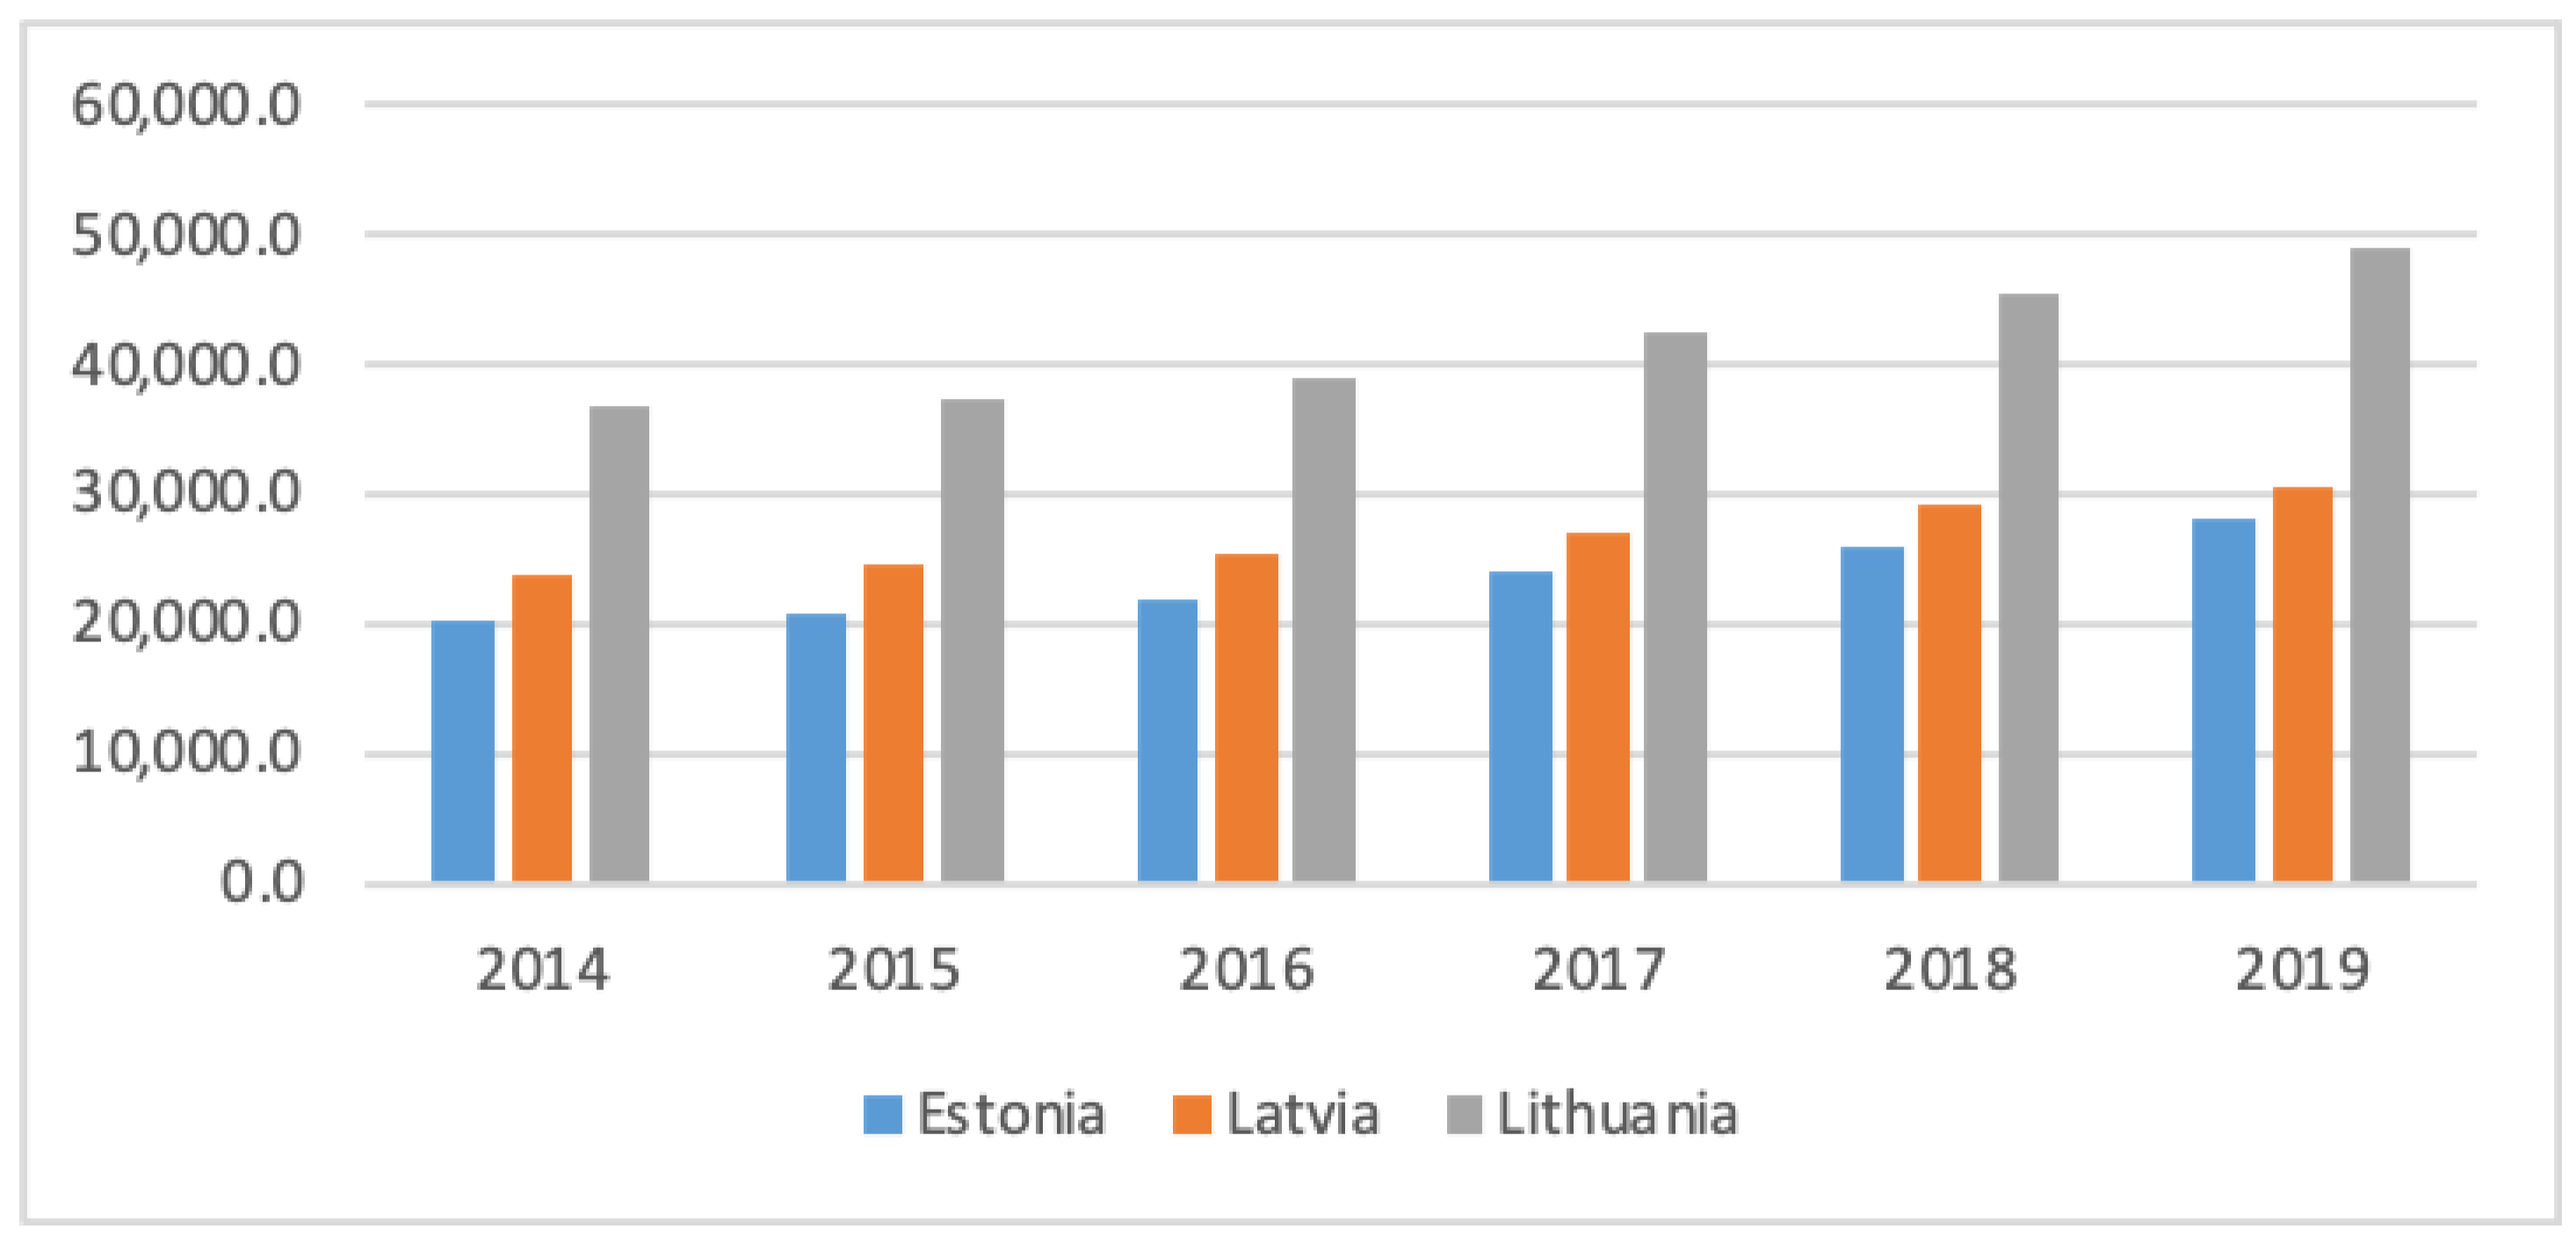
The empirical GDP volume of the Baltic States was as follows: In 2019, the GDP volume of Lithuania was EUR 48797.4M; Latvia—EUR 30463.3M; Estonia—EUR 28112.4M. In 2019, the GDP volume of Lithuania accounted for 45.45% of the GDP volume of all the Baltic states. Moreover, this volume was the largest in the period under consideration (excluding 2014). In 2019, compared to the previous year, the GDP volume of Lithuania increased by 7.27%; in Estonia, it increased by 8.38%; and in Latvia, it increased by 4.53%.
Changes in the GDP of the Baltic states in the period of 2014–2019 (Gross domestic product at market prices) (Current prices, million euros) (see Figure 1).
Figure 1.
Changes in the GDP of the Baltic States in the period of 2014–2019 (Gross domestic product at market prices) (Current prices, million euros).
According to the data in the IMD World Competitiveness Yearbook 2019 as reflected in Table 1, in the course of the year, Lithuania rose to 29th place from 32nd, i.e., by 3 places. The opposite was seen in Estonia, where in the course of the year, the country dropped down by 4 places, i.e., from 31st to 35th place. In the meantime, Latvia remained in 40th place. Research published in the Global Competitiveness Report 2019 by the World Economic Forum that used the Global Competitiveness Index method demonstrated different trends, i.e., in the course of the year, Lithuania, Latvia and Estonia rose by one position each (Table 1).
Table 1.
Global Competitiveness Index and the World Competitiveness Index (IWCI) rankings and comparisons with the data of 2018.
2014–2019 data (Eurostat, Statistics Departments of Lithuania, Latvia and Estonia) were used to assess the competitiveness of the capitals of the Baltic states. Both statistical and expert evaluation methods were used to assess the competitiveness of the Baltic capitals. The result was affected by the availability of information. The peer review study interviewed 50 individuals whose activities were related to strategic planning, regional development, and promotion of territorial socio-economic development. The concordance of the opinions of the surveyed experts as evaluated using the Kendall concordance coefficient W was high (W = 0.95). However, the authors of the article conducted two studies to explain the impact of subjective assessment on the final result. In the first study, the authors considered the separation of the influence/importance of the factors determining the competitiveness according to the experts. In the second study, the authors assigned equal influence on the assessment of competitiveness to all factors. According to the urban competitiveness assessment model based on the principles of sustainable development (MDK), the factors were divided into three levels and structured according to the components of sustainable development. Level I reflected the basic factors that condition the existence of a city, i.e., the infrastructure, human capital, business environment/government, financial capital, urban distinctiveness, culture, community activities, environmental friendliness, natural resources, urban management, urban security. The basic level ranking was calculated according to the following Formula (11):
where
- M12 is the factor value of the urban transportation infrastructure
- M18 is the factor value of the information and communications technology infrastructure
- M110 is the factor value of the city’s demographical situation
- M17 is the factor value of the social, cultural and sports infrastructure
- M19 is the factor value of the healthcare infrastructure
- M16 is the factor value of the sewage treatment system
- M111 is the factor value of the educational system
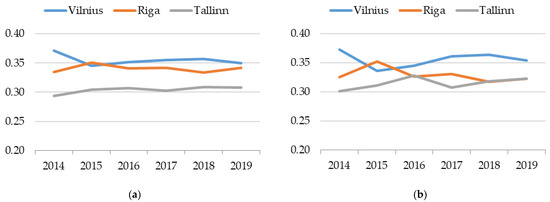
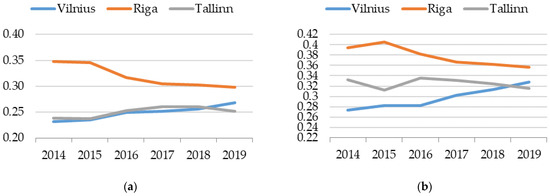
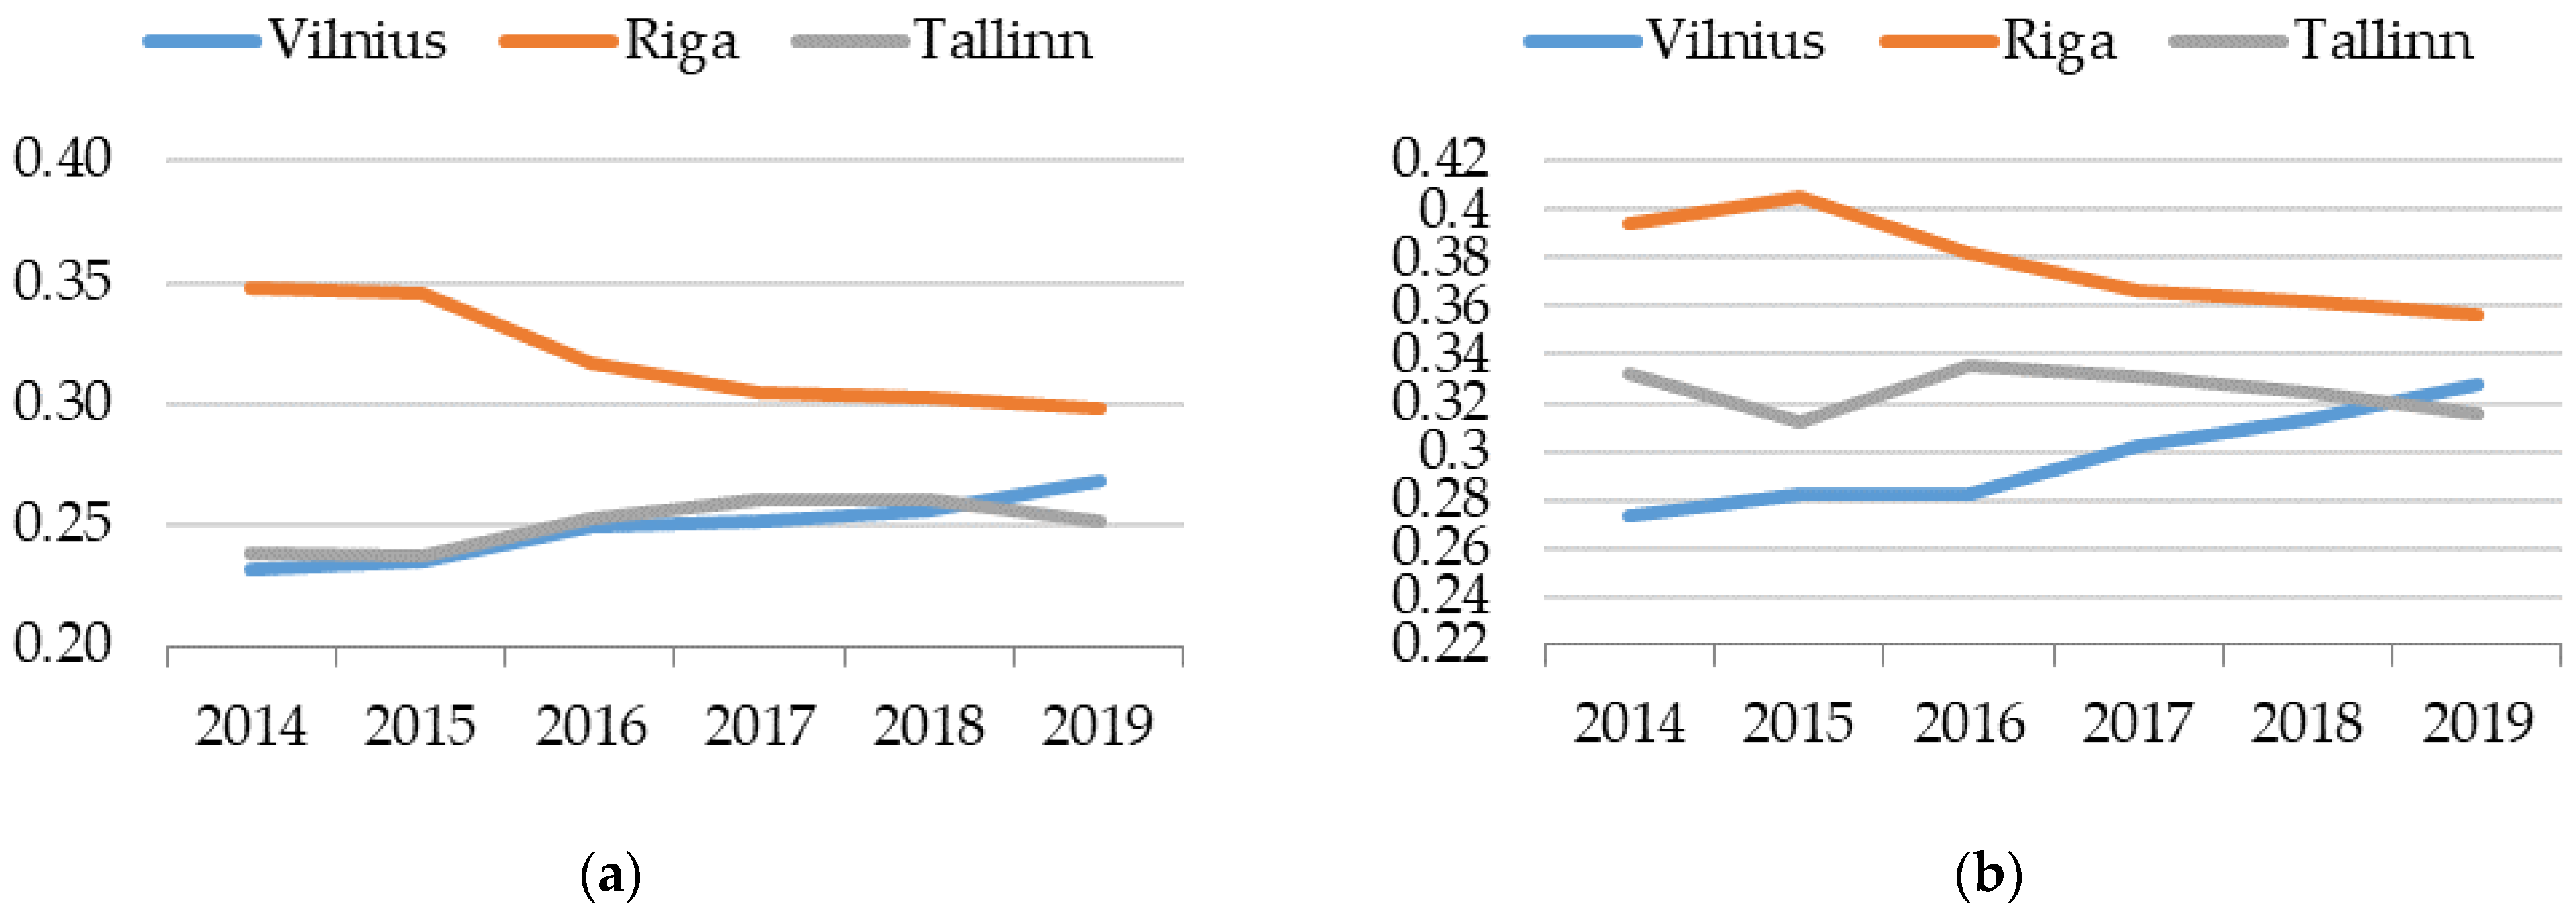
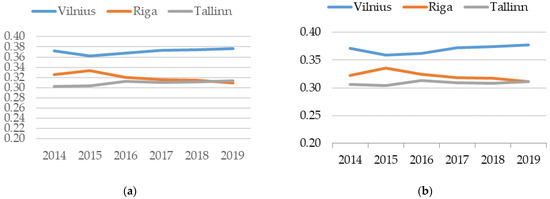
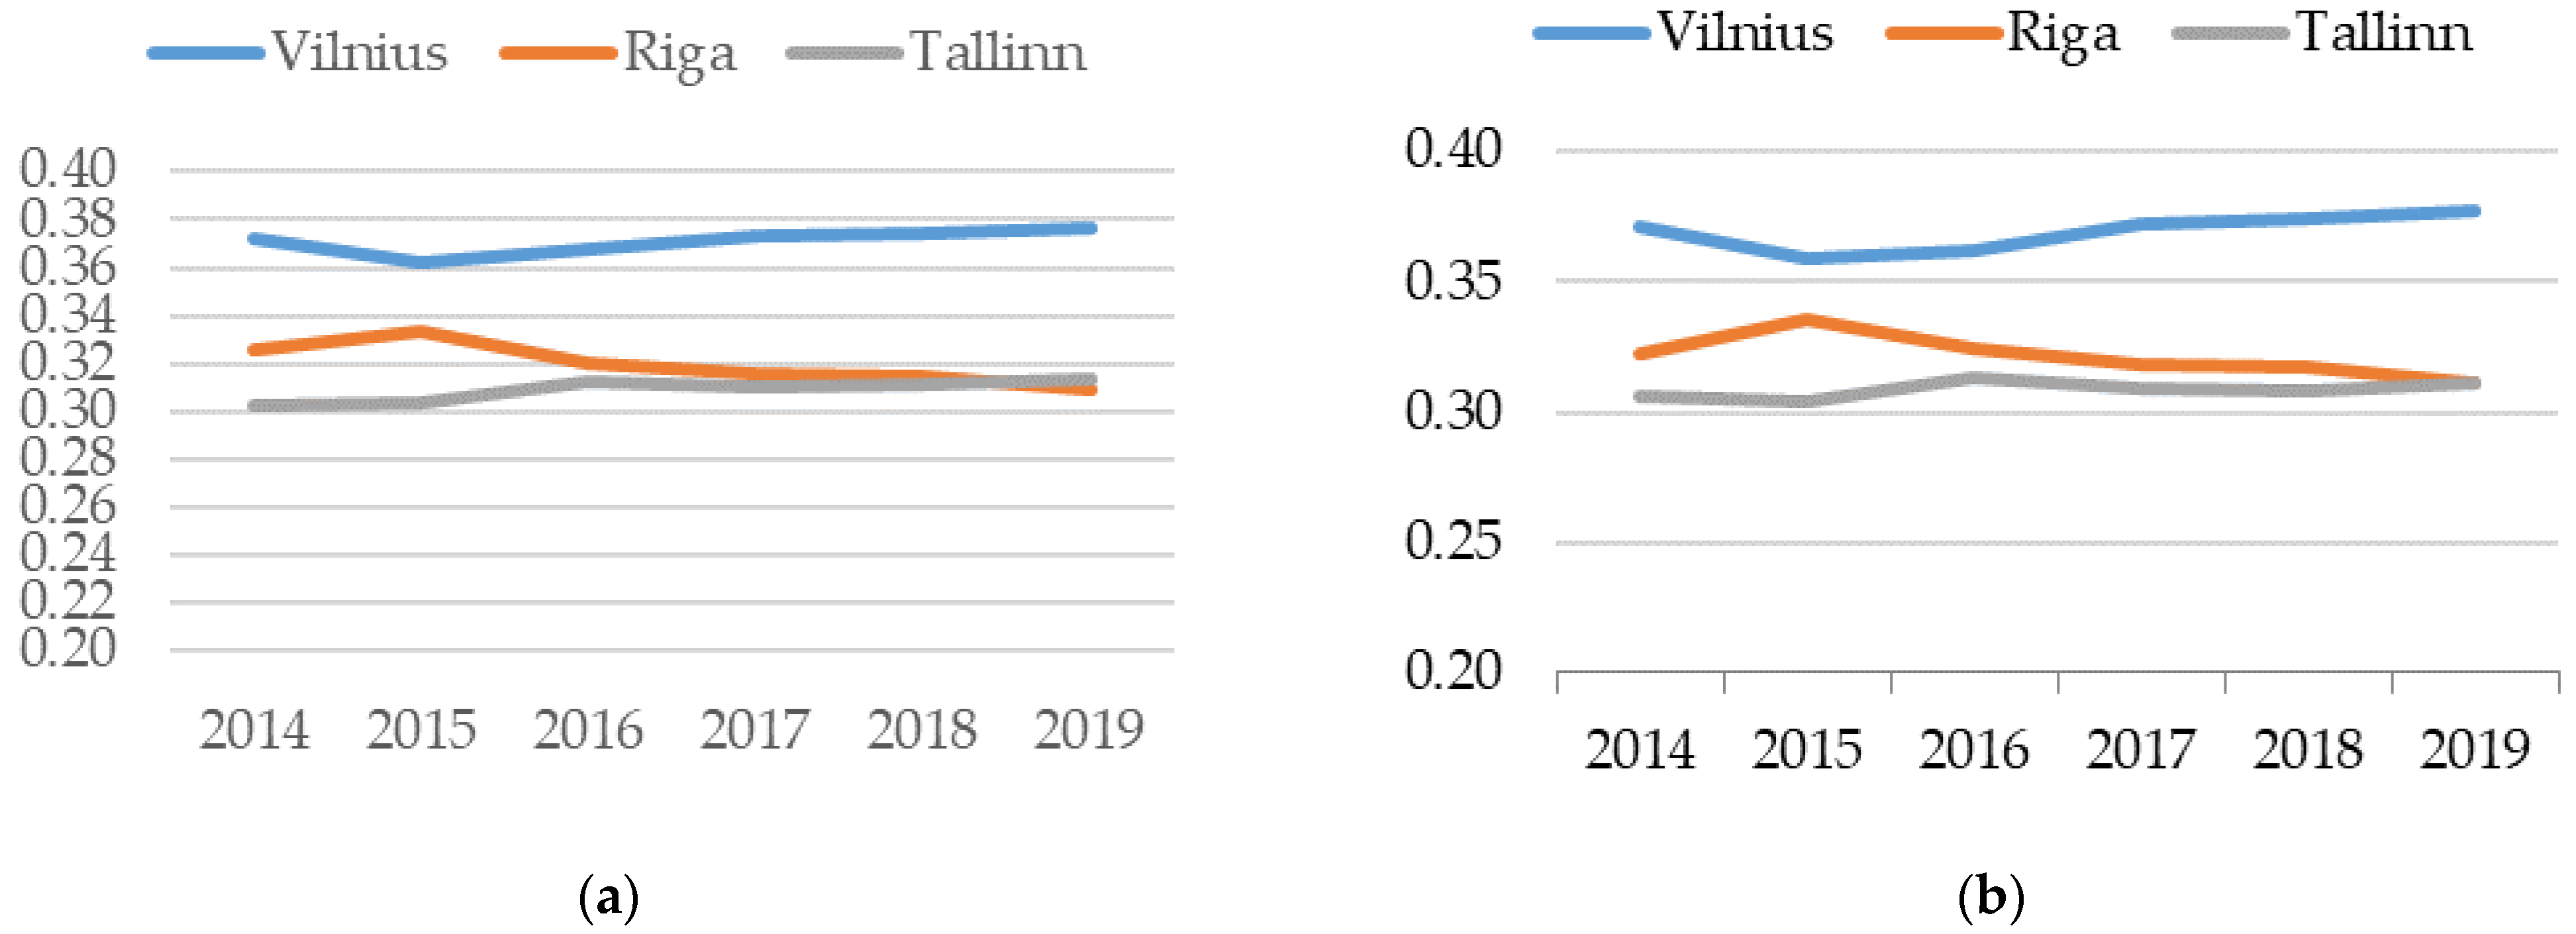
Following the basic level assessment data of the MDK model (Scenario I) as reflected in Figure 2, Vilnius leads among the capitals of the Baltic States in the period of 2014–2019, excluding 2015, where Riga took the lead. Tallinn ranked third throughout the studied period. The situation was very similar when calculations were carried out under Scenario II, albeit the ranking positions of Tallinn and Riga came into a line in 2016, 2018 and 2019.
Figure 2.
Basic level assessment of the Baltic capitals according to Scenarios I (a) and II (b).
Level II marks the factors that promote development, i.e., tourism, imports, exports, entrepreneurship, knowledge and innovation, economic structure, networks of excellence, city companies and partnership. The ranking of the developmental level was calculated according to the following Formula (12):
where
- M23 is the factor value of the city’s economic power
- M24 is the factor value of the competitiveness of the city companies
- M27 is the factor value of the city’s touristic appeal
- M28 is the factor value of the city’s investment appeal
- M29 is the factor value of workforce adaptability to changing conditions
- M210 is the factor value of city living convenience
- M211 is the factor value of environmental pollution
- M212 is the factor value of the human capital
- M213 is the factor value of migration
- M215 is the factor value of safety in the city
- M216 is the factor value of community learning, partnership and active involvement
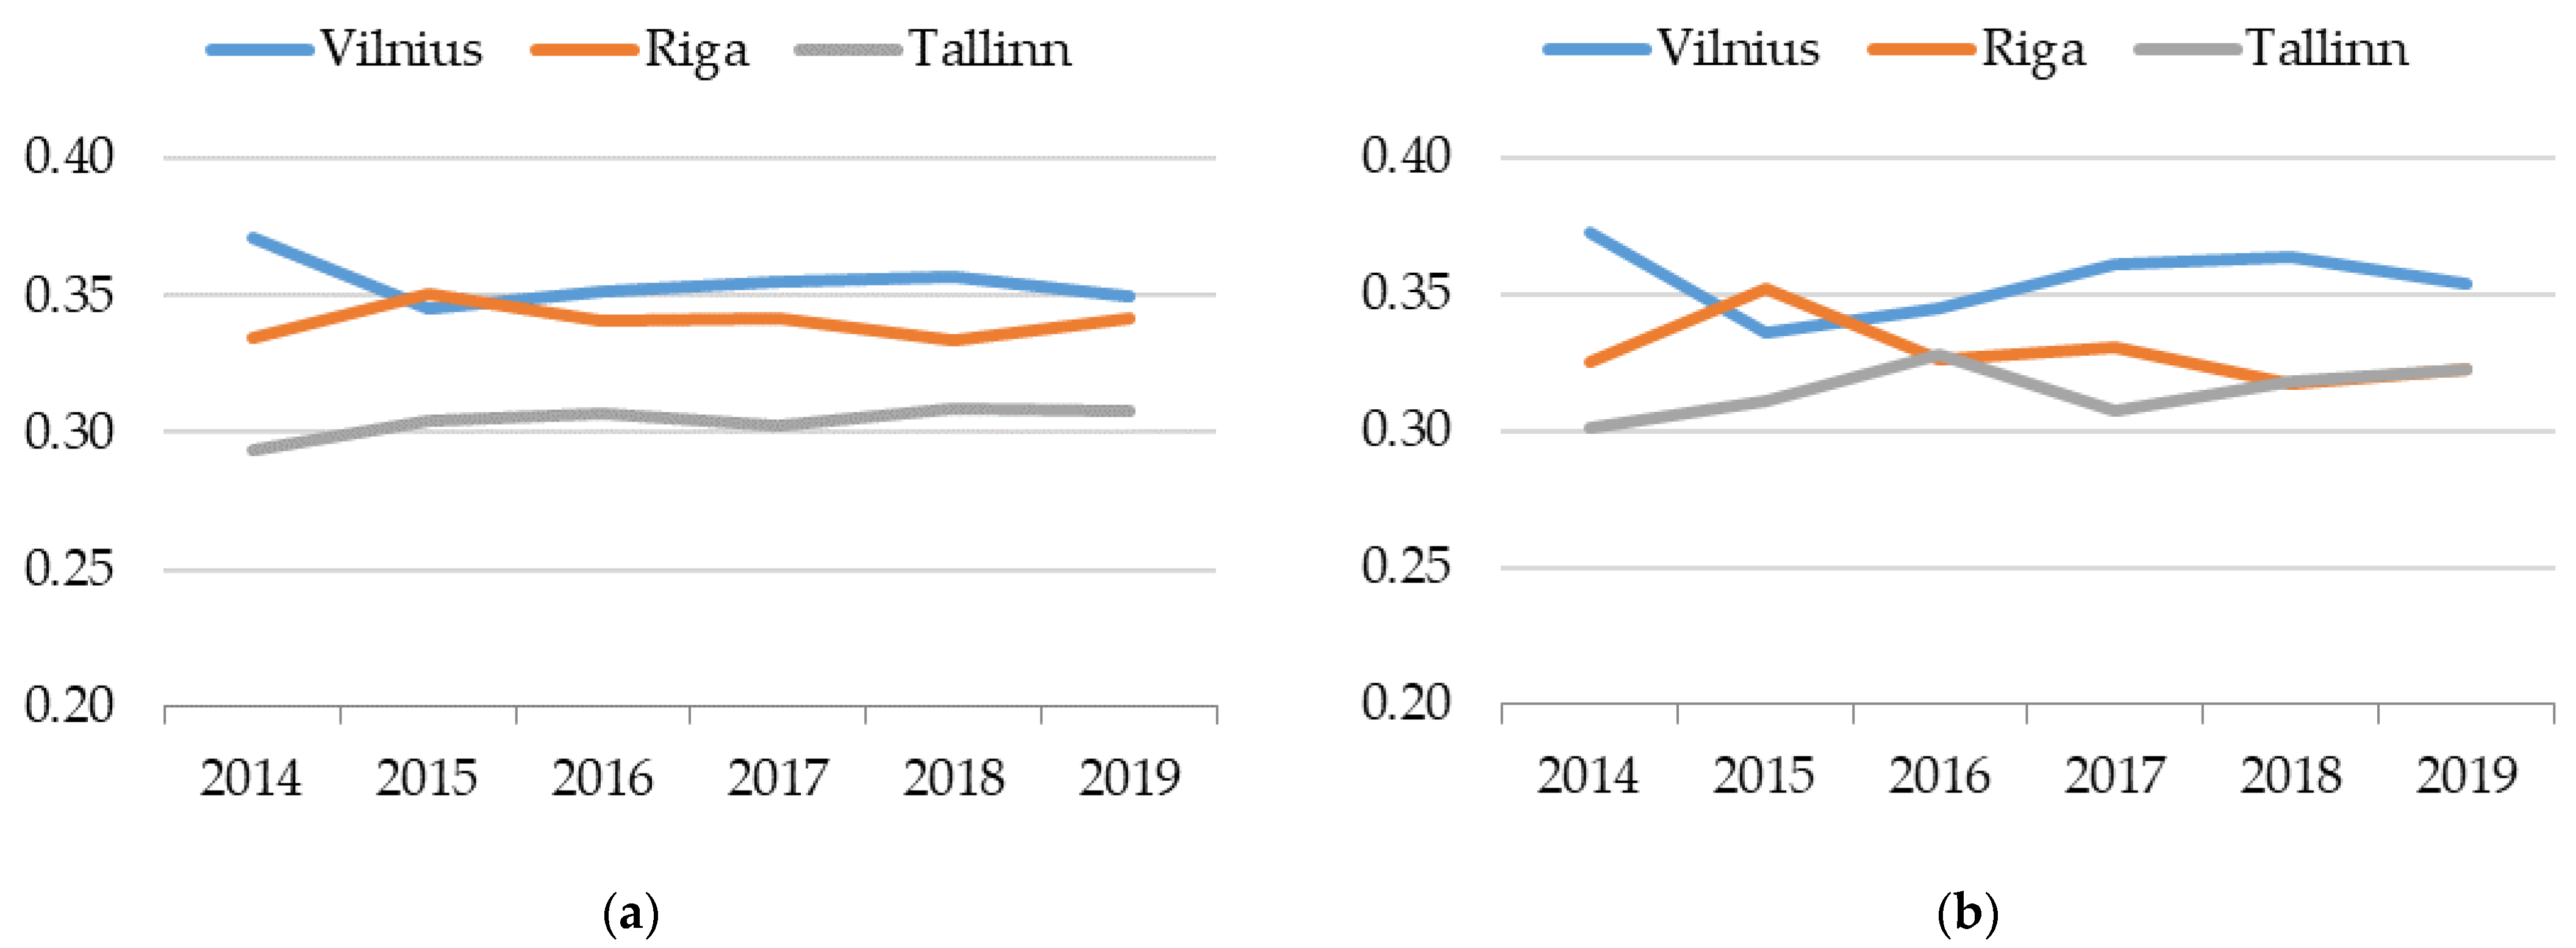
Based on the data obtained by using COPRAS and SAW methods in Figure 3, in the period of 2014–2019, Riga was in the lead. Whereas Vilnius and Tallinn tended to swap positions. Based on the results of the SAW method (Scenario I), Tallinn was in the lead (except in 2019). The results of the COPRAS method (Scenario I) suggested that the ranking remained the same as in the method above. However, the statistical gap between the cities was larger than it was in the example. Where Scenario II was examined with all factors being assigned the same weighting factors, the ranking among the capitals of the Baltic states in the period of 2014–2019 remained the same as in Scenario I above.
Figure 3.
Developmental level assessment of the Baltic capitals according to Scenario I using SAW (a) and COPRAS (b) methods.
At level III, we assessed the outcome of the interaction between the two previous levels. The result was assessed in two sections, i.e., in terms of GDP and of the quality of life. The ranking at the interaction level was calculated according to the following Formula (13):
where
- IM30 is the ranking at level III
- M31 is the factor value of GDP
- M32 is the factor value of the quality of life
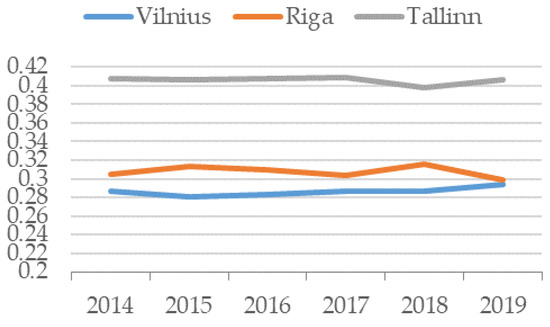
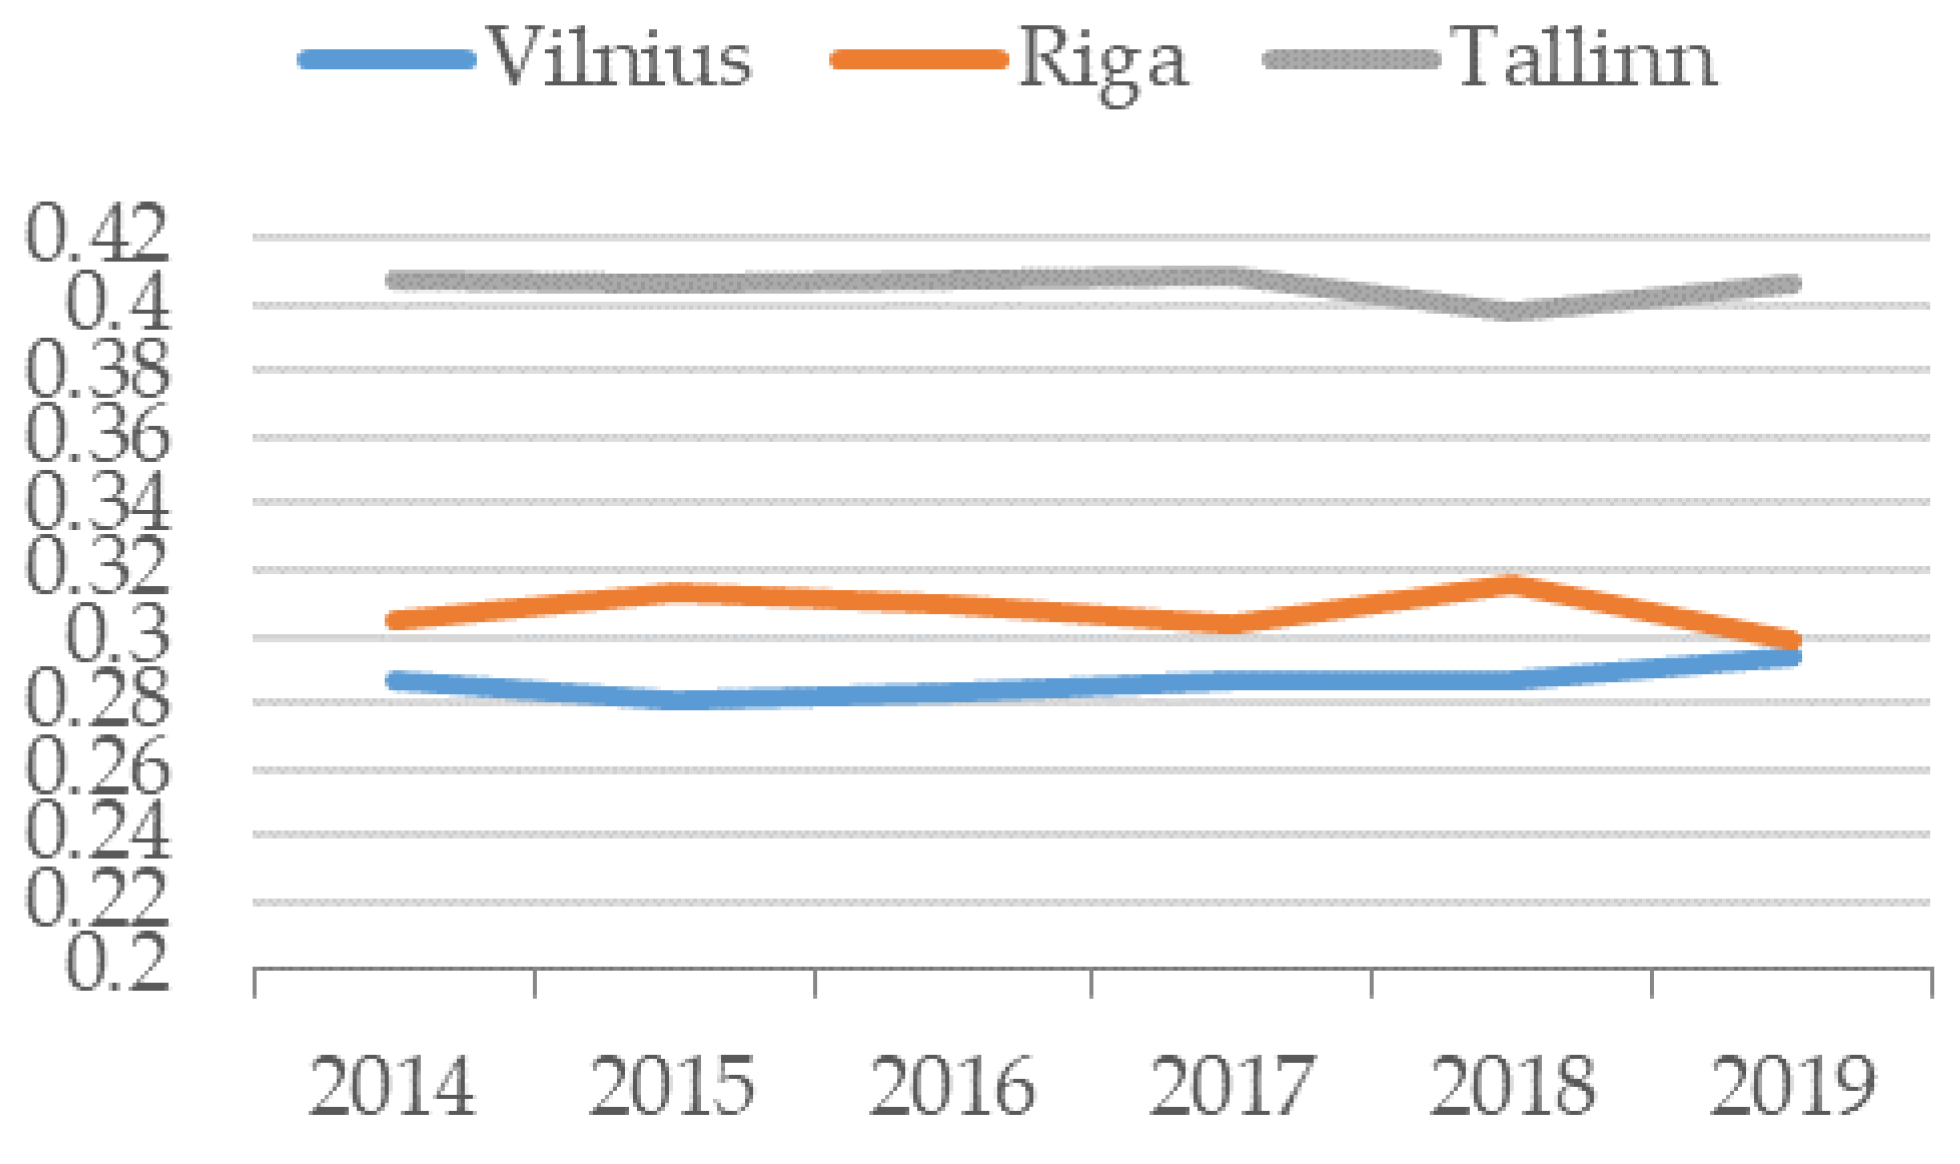
Based on the results obtained by applying the third level of the MDK model and by using both COPRAS and SAW methods (Scenario I), as reflected in Figure 4, Tallinn was in the lead among the capitals of the Baltic states. Riga and Vilnius were close to each other.
Figure 4.
Competitiveness assessment of the Baltic capitals (Level III) based on the principles of sustainable development, using SAW method according to Scenario I.
The results obtained from assessing the overall competitiveness of the Baltic capitals according to the urban competitiveness assessment model based on the principles of sustainable development with the application of the SAW multi-criteria assessment method, suggested that Vilnius was in the lead in the period of 2014–2019 (see Figure 5). Riga ranked second in the period of 2014–2019, albeit the results from the SAW method suggested that Tallinn ranked second in 2019. Tallinn ranked third in the 2014–2019 period (exclusive of 2019). Given that the sensitivity and robustness analysis of the assessment results (Table 2) showed that the assessment results using different multi-criteria assessment methods, i.e., SAW and COPRAS, were very strong, the SAW method was selected for calculations in order to offer a simple method for small cities. Each level was analysed to identify what determined the dynamics of city rankings.
Figure 5.
Competitiveness assessment of the Baltic capitals based on the principles of sustainable development, using SAW (a) and COPRAS (b) methods according to Scenario II.
Table 2.
Robustness and sensitivity analysis of SAW and COPRAS results.
The results of the analysis suggested that there was a very strong relationship between assessment using different weighting factors and assessment using identical weighting factors. The authors of the article agreed with the opinion that expert evaluation was based on subjective opinion and that different factors have different effects on the overall competitiveness. Keeping in mind that during the expert evaluation, the surveyed experts had substantial experience with urban competitiveness, it was decided to conduct two studies: Scenario I—each factor was assigned a weighting factor; Scenario II—all factors were assigned identical weighting factors. Sensitivity and robustness analysis was performed using SAW and COPRAS methods to calculate the assessment of urban competitiveness using two scenarios. It was concluded that the correlation between the results was very strong.
5. Discussion
As shown in our research results [11,12,13,14,15], an assessment of urban competitiveness that is based on the principles of sustainable development is necessary. This assessment follows the modern standards and approaches to economic development. Cities should not only assess their current situation but also plan for actions that improve the economic situation, the environment, and the quality of life, i.e., actions that ensure sustainable development. It should also be taken into account that lower-level factors may influence certain higher-level factors, and that influence may also be of different levels.
A number of researches on the assessment of urban competitiveness have been carried out, several of them: a survey of smart cities, following the example of Amsterdam and London in Lithuania [25], and an assessment of the competitiveness of Lithuanian cities [24,27,28], evaluation for urban sustainable development: A case study for China’s Jining City [48], ranking of priorities among the Baltic capital cities for the development of sustainable construction [49], the Lisbon ranking for smart sustainable cities in Europe [50]. A multi-criteria evaluation of the European cities’ smart performance: Economic, social and environmental aspects [51]. In the search for the ‘Smart’ Source of the Perception of Quality of Life in European Smart Cities [52], determining factors in becoming a sustainable smart city: An empirical study in Europe [53], strengthening urban sustainability: Identification and analysis of proactive measures to combat blight [54], military and demographic inter-linkages in the context of the Lithuanian sustainability [55], rethinking urban sustainability using fuzzy cognitive mapping and system dynamics [56], socio-technical approach to the assessment of sustainable tourism: Adding value with a comprehensive process-oriented framework [57]
Therefore, the integrated competitiveness assessment model that is based on the principles of sustainable development (MDK) is built on the principle of targeted programmatic management, which creates the premise for determining the relationships of different level factors and their effect on the objective. MDK is a methodological tool for city authorities to determine the current situation of the city and to make predictions about the future by changing the values of one or more factors. The MDK model distinguishes between external and internal environments that are divided into three levels: Level I—basic factors; level II—developmental factors; and level III—interactions. The identified factors are structured according to the components of sustainable development. The objective of the model is to reflect the aggregated influence and results of the interactional factors.
The empirical assessment of the sustainable competitiveness of the Baltic capitals in the period of 2014–2019 confirmed the appropriateness of the MDK model as a tool for determining the competitive position of a city in relation to both other competing cities and time, as well as for determining the factors associated with sustainable urban competitiveness. The obtained information can be used to justify a variety of strategic urban decisions, to assess the effectiveness of the already implemented solutions, and to promote the city itself.
The authors of the article presented an integrated competitiveness assessment of the Baltic capitals by detailing the three levels, i.e., basic, developmental, and interactional. However, the assessment in this study did not include the individual components of sustainable development. Therefore, potential future research could include the assessment of small cities in terms of time and the individual components of sustainable development.
6. Conclusions
For cities, the urbanisation process does not only mean a strengthening of their economic competitiveness, but it also poses many challenges that need to be addressed in order to implement the principles of sustainable development. The quality of life requirements in a modern city are integrally linked to a vibrant and competitive economy, a healthy environment, social well-being and environmental friendliness. Consequently, the principles of sustainable urban development are considered necessary for cities to become and remain competitive in both the short-term and long-term. An assessment of urban competitiveness that is based on the principles of sustainable development is necessary. This assessment follows the modern standards and approaches to economic development.
- The concept of urban competitiveness is regarded as the ability of cities to use certain available competitive factors that are created or drawn by the city to ensure the success of its economic, social and environmental systems and to maintain and strengthen the city’s competitive position in relation to both the other competing cities and time. This definition allows urban competitiveness to be perceived as a continuous and self-reinforcing process, rather than a finite result, whereby the result also becomes an input that later determines the outcome.
- We observed that the research into urban competitiveness assessment methods as found in the scientific literature demonstrates a variety of approaches. Some authors assessed urban competitiveness by employing one or more indicators; others developed theoretical models of urban competitiveness that combine a particular set of quantitative and qualitative indicators; and others still assessed it as an index or formulated various mathematical equations. There are many methods for assessing urban competitiveness, which stimulates much debate that aims to assess urban competitiveness objectively. It is especially difficult to assess its less studied aspects.
- The results obtained from assessing the overall competitiveness of the Baltic capitals according to the urban competitiveness assessment model based on the principles of sustainable development with the application of the SAW and COPRAS multi-criteria assessment methods suggest that Vilnius is in the lead in the entire period, followed by Riga that ranks second, and Tallinn that ranks third.
- Sensitivity and robustness analysis of the small city competitiveness assessment results showed that the assessment results using different multi-criteria assessment methods, i.e., SAW or COPRAS, differ only slightly.
Author Contributions
Conceptualisation, R.Č. and I.M.-K.; methodology, R.Č.; software, R.Č.; validation, R.Č. and I.M.-K.; formal analysis, I.M.-K.; investigation, R.Č.; resources, R.Č. and I.M.-K.; writing—original draft preparation, R.Č.; writing—review and editing, I.M.-K.; visualisation, R.Č.; supervision, I.M.-K. All authors have read and agreed to the published version of the manuscript.
Funding
This research received no external funding.
Institutional Review Board Statement
Not applicable.
Informed Consent Statement
Not applicable.
Data Availability Statement
The data of this study is available from the authors upon request.
Conflicts of Interest
The authors declare no conflict of interest.
References
- Singhal, S.; Berry, J.; McGreal, S. A Framework for Assessing Regeneration, Business Strategies and Urban Competitiveness. Local Econ. J. Local Econ. Policy Unit 2009, 24, 111–124. [Google Scholar] [CrossRef] [Scilit]
- Xu, B.; Watada, J. Identification of regional urbanization gap: Evidence of China. J. Model. Manag. 2008, 3, 7–25. [Google Scholar] [CrossRef] [Scilit]
- Henderson, J.-V.; Storeygard, A.; Weil, D.V. Measuring Economic Growth from Outer Space. Am. Econ. Rev. 2012, 102, 994–1028. [Google Scholar] [CrossRef] [Scilit] [PubMed]
- Witcher, P. The World Urban Forum: Ideas on the Future of the World’s Cities. UN Chron. 2006, 43, 30. [Google Scholar]
- Sun, C.; Luo, Y.; Li, J. Urban traffic infrastructure investment and air pollution: Evidence from the 83 cities in China. J. Clean. Prod. 2018, 172, 488–496. [Google Scholar] [CrossRef] [Scilit]
- Wang, J.; Shen, L.; Ren, Y.; Ocha, J.-J. A lessons mining system for searching references to support decision making towards sustainable urbanization. J. Clean. Prod. 2019, 209, 451–460. [Google Scholar] [CrossRef] [Scilit]
- Wang, J.; Wei, X.; Guo, Q. A three-dimensional evaluation model for regional carrying capacity of ecological environment to social economic development: Model development and a case study in China. Ecol. Indic. 2018, 89, 348–355. [Google Scholar] [CrossRef] [Scilit]
- Li, S.; Feng, K.; Li, M. Identifying the main contributors of air pollution in Beijing. J. Clean. Prod. 2017, 163, S359–S365. [Google Scholar] [CrossRef] [Scilit]
- Golzarpoor, H.; González, V.; Shahbazpour, M.; O’Sullivan, M. An input-output simulation model for assessing production and environmental waste in construction. J. Clean. Prod. 2017, 143, 1094–1104. [Google Scholar] [CrossRef] [Scilit]
- Akizu-Gardoki, O.; Bueno, G.; Wiedm, T. Decoupling between human development and energy consumption within footprint accounts. J. Clean. Prod. 2018, 202, 1145–1157. [Google Scholar] [CrossRef] [Scilit]
- Žalevičienė, A.; Čiegis, R. Darnus miestų vystymasis ir europos sąjungos investicijų įsisavinimas. Manag. Theory Stud. Rural Bus. Infrastruct. Dev. 2012, 1, 42–51. [Google Scholar]
- Ramanauskienė, J.; Čiegis, R. Integruotas darnaus vystymosi vertinimas: Lietuvos atvejis. Vadyb. Moksl. Ir Stud. -Kaimo Verslų Ir Jų Infrastruktūros Plėtrai 2011, 2, 39–49. [Google Scholar]
- Rutkauskas, A.-V. On the sustainability of regional competitiveness development considering risk. Technol. Econ. Dev. Econ. 2008, 14, 89–99. [Google Scholar] [CrossRef] [Scilit]
- Wei, Y.; Huang, C.; Lam, P.T.I.; Yuan, Z. Sustainable urban development: A review on urban carrying capacity assessment. Habitat Int. 2015, 46, 64–71. [Google Scholar] [CrossRef] [Scilit]
- Campagnolo, L.; Carraro, C.; Eboli, F.; Farnia, L.; Parrado, R.; Pierfederici, R. The Ex-Ante Evaluation of Achieving Sustainable Development Goals. Soc. Indic. Res. 2018, 136, 73–116. [Google Scholar] [CrossRef] [Scilit]
- Pivorienė, J. Global Education and Social Dimension of Sustainable Development. Soc. Ugdym. 2014, 39, 39–47. [Google Scholar] [CrossRef] [Scilit]
- Cioca, L.-I.; Ivascu, L.; Rada, E.; Torretta, V.; Ionescu, G. Sustainable Development and Technological Impact on CO2 Reducing Conditions in Romania. Sustainability 2015, 7, 1637–1650. [Google Scholar] [CrossRef] [Scilit]
- Bruneckienė, J. Šalies Regionų Konkurencingumo Vertinimas Įvairiais Metodais: Rezultatų Analizė Ir Vertinimas. Econ. Manag. 2010, 15, 25–31. [Google Scholar]
- Sinkienė, J. Miesto konkurencingumo veiksniai. Viešoji Polit. ir Adm. 2008, 25, 68–83. [Google Scholar]
- Ni, P.; Kresl, P.; Li, X. China urban competitiveness in industrialization: Based on the panel data of 25 cities in China from 1990 to 2009. Urban Stud. 2014, 51, 2787–2805. [Google Scholar] [CrossRef] [Scilit]
- Cuadrado-Roura, J.-R.; Maroto, A. Unbalanced regional resilience to the economic crisis in Spain: A tale of specialisation and productivity, Cambridge. J. Reg. Econ. Soc. 2016, 9, 153–178. [Google Scholar] [CrossRef] [Scilit]
- Jeney, L. Key factors of urban competitiveness in East Central European space structure. In Proceedings of the Regional Studies Association Annual International Conference, Budapest, Hungary, 24–26 May 2010. [Google Scholar]
- Činčikaitė, R.; Paliulis, N. Miesto konkurencingumo sąvokos ir jį lemiančių veiksnių analizė. Ekonomika ir Vadyba 2011, 16, 258–265. [Google Scholar]
- Činčikaitė, R.; Paliulis, N. Assessing Competitiveness of Lithuanian Cities. Econ. Manag. 2013, 18, 490–500. [Google Scholar] [CrossRef] [Scilit]
- Pabedinskaitė, A.; Karlas, A.; Činčikaitė, R. Evaluation of smart cities. Manag. Eng. 2016, 1, 273–283. [Google Scholar]
- Pabedinskaitė, A.; Činčikaitė, R. Peculiarities of evaluating urban competitiveness. Manag. Eng. 2015, 1, 475–483. [Google Scholar]
- Bruneckiene, J.; Činčikaitė, R.; Kilijonienė, A. The Specifics of Measurement the Urban Competitiveness at the National and International Level. Eng. Econ. 2012, 23, 256–270. [Google Scholar] [CrossRef] [Scilit]
- Bruneckiene, J.; Guzavicius, A.; Cincikaite, R. Measurement of Urban Competitiveness in Lithuania. Eng. Econ. 2010, 21, 493–508. [Google Scholar]
- Webster, D.; Muller, L. Urban Competitiveness Assessment in Developing Country Urban Regions: The Road Forward, Urban Group; The World Bank: Washington, DC, USA, 2000; pp. 1–47. [Google Scholar]
- Piliutytė, J. Miestų konkurencingumo koncepcija ir analizės lygmenys. Viešoji Polit. ir Adm. 2007, 19, 81–89. [Google Scholar]
- Shen, J.; Yang, X. Analyzing Urban Competitiveness Changes in Major Chinese Cities 1995–2008. Appl. Spat. Anal. Policy 2014, 7, 361–379. [Google Scholar] [CrossRef] [Scilit]
- Bakıcı, T.; Almirall, E.; Wareham, J. A Smart City Initiative: The Case of Barcelona. J. Knowl. Econ. 2013, 4, 135–148. [Google Scholar] [CrossRef] [Scilit]
- Anttiroiko, A.V.; Valkama, P.; Bailey, S.-J. Smart cities in the new service economy: Building platforms for smart services. AI Soc. 2014, 29, 323–334. [Google Scholar] [CrossRef] [Scilit]
- Auci, S.; Mundula, L. Smart Cities and a Stochastic Frontier Analysis: A Comparison among European Cities. SSRN Electron. J. 2012. Available online: http://ssrn.com/abstract=2150839 (accessed on 5 February 2021).
- Bojic, I.; Lipic, T.; Podobnik, V. Bio-inspired Clustering and Data Diffusion in Machine Social Networks. In Computational Social Networks; Springer: London, UK, 2012; pp. 51–79. [Google Scholar]
- Fernandez-Anez, V.; Fernández-Güell, J.-M.; Giffinger, R. Smart City implementation and discourses: An integrated conceptual model. The case of Vienna. Cities 2018, 78, 4–16. [Google Scholar] [CrossRef] [Scilit]
- Caragliu, A.; Del Bo, C.; Nijkamp, P. Smart Cities in Europe. J. Urban Technol. 2011, 18, 65–82. [Google Scholar] [CrossRef] [Scilit]
- Valstybės Pažangos Strategija Lietuvos Pažangos Strategija “Lietuva 2030”. Available online: https://e-seimas.lrs.lt/portal/legalAct/lt/TAD/TAIS.425517 (accessed on 5 February 2021).
- Lietuvos Respublikos Regioninės Plėtros Įstatymas. 2020. Available online: https://e-seimas.lrs.lt/portal/legalAct/lt/TAD/ab78cdf0b15c11ea9a12d0dada3ca61b (accessed on 5 February 2021).
- European Innovation Partnership on Smart Cities and Communities Operational Implementation Plan: First Public Draft. Available online: https://www.interregeurope.eu/fileadmin/user_upload/tx_tevprojects/library/operational-implementation-plan-oip-v2_en.pdf (accessed on 5 February 2021).
- Ramanauskas, G. Evaluation of International Competitiveness. Èkonomika 2004, 68, 91–112. [Google Scholar] [CrossRef] [Scilit]
- Hák, T.; Janoušková, S.; Moldan, B. Sustainable Development Goals: A need for relevant indicators. Ecol. Indic. 2016, 60, 565–573. [Google Scholar] [CrossRef] [Scilit]
- Shaaban, M.; Scheffran, J. Selection of sustainable development indicators for the assessment of electricity production in Egypt. Sustain. Energy Technol. Assess. 2017, 22, 65–73. [Google Scholar] [CrossRef] [Scilit]
- Biermann, F.; Kanie, N.; Kim, R.-E. Global governance by goal-setting: The novel approach of the UN Sustainable Development Goals. Curr. Opin. Environ. Sustain. 2017, 26–27, 26–31. [Google Scholar] [CrossRef] [Scilit]
- Xavier, A.; Freitas, M.; Fragoso, R.; Rosário, M. A regional composite indicator for analysing agricultural sustainability in Portugal: A goal programming approach. Ecol. Indic. 2018, 89, 84–100. [Google Scholar] [CrossRef] [Scilit]
- Ginevičius, R.; Podvezko, V.; Mikelis, D. Quantitative Evaluation of Economic and Social Development of Lithuanian Regions. Ekonomika 2004, 65. [Google Scholar] [CrossRef] [Scilit]
- Zavadskas, E.-K.; Turskis, Z. Multiple criteria decision making (mcdm) methods in economics: An overview / daugiatiksliai sprendimų priėmimo metodai ekonomikoje: Apžvalga. Technol. Econ. Dev. Econ. 2011, 17, 397–427. [Google Scholar] [CrossRef] [Scilit]
- Li, F.; Liu, X.; Hu, D.; Wang, R.; Yang, W. Measurement indicators and an evaluation approach for assessing urban sustainable development: A case study for China’s Jining City. Landsc. Urban Plan. 2009, 90, 134–142. [Google Scholar] [CrossRef] [Scilit]
- Lazauskas, M.; Zavadskas, E.-K.; Šaparauskas, J. Ranking of priorities among the baltic capital cities for the development of sustainable construction. Econ. Manag. 2015, 18, 15–24. [Google Scholar] [CrossRef] [Scilit]
- Akande, A.; Cabral, P.; Gomes, P.; Casteleyn, S. Lisbon ranking for smart sustainable cities in Europe. Sustain. Cities Soc. 2019, 44, 475–487. [Google Scholar] [CrossRef] [Scilit]
- Stanković, J.; Džunić, M.; Džunić, Ž.; Marinković, S. A multi-criteria evaluation of the european cities’ smart performance: Economic, social and environmental aspects. J. Econ. Bus. 2017, 35, 519–550. [Google Scholar] [CrossRef] [Scilit]
- Rodríguez Bolívar, M.-P. In the search for the ‘Smart’ Source of the Perception of Quality of Life in European Smart Cities. In Proceedings of the 52nd Hawaii International Conference on System Sciences, Maui, HI, USA, 8–11 January 2019. [Google Scholar] [CrossRef] [Scilit]
- Gil, M.T.N.; Carvalho, L.; Paiva, I. Determining factors in becoming a sustainable smart city: An empirical study in Europe. Econ. Sociol. 2020, 13, 24–39. [Google Scholar] [CrossRef] [Scilit]
- Barão, M.V.H.C.; Ferreira, F.A.F.; Spahr, R.W.; Sunderman, M.A.; Govindan, K.; Meidutė-Kavaliauskienė, I. Strengthening urban sustainability: Identification and analysis of proactive measures to combat blight. J. Clean. Prod. 2021, 292, 126026. [Google Scholar] [CrossRef] [Scilit]
- Meidutė-Kavaliauskienė, I.; Dudzevičiūtė, G.; Maknickienė, N. Military and Demographic inter-linkages in the context of the Lithuanian sustainability. J. Bus. Econ. Manag. 2020, 6, 1508–1524. [Google Scholar] [CrossRef] [Scilit]
- Assunção, E.R.G.T.R.; Ferreira, F.A.F.; Meidutė-Kavaliauskienė, I.; Zopounidis, C.; Pereira, L.F.; Correia, R.J.C. Rethinking urban sustainability using fuzzy cognitive mapping and system dynamics. Int. J. Sustain. Dev. World Ecol. 2020, 27, 261–275. [Google Scholar] [CrossRef] [Scilit]
- Estêvão, R.S.G.; Ferreira, F.A.F.; Rosa, Á.A.; Govindan, K.; Meidutė-Kavaliauskienė, I. A socio-technical approach to the assessment of sustainable tourism: Adding value with a comprehensive process-oriented framework. J. Clean. Prod. 2019, 236, 117487. [Google Scholar] [CrossRef] [Scilit]

Publisher’s Note: MDPI stays neutral with regard to jurisdictional claims in published maps and institutional affiliations. |
© 2021 by the authors. Licensee MDPI, Basel, Switzerland. This article is an open access article distributed under the terms and conditions of the Creative Commons Attribution (CC BY) license (http://creativecommons.org/licenses/by/4.0/).