


Abstract
Research conducted so far on the presence of microplastics in the environment shows that these items are ubiquitous pollutants and therefore constitute an inherent part of our lives. This constitutes a significant problem in many aspects, and one of them is the correct identification of microplastics in environmental samples. Environmental samples can be easily contaminated by plastic microparticles from other sources if proper precautions are not taken during sampling and analysis. The consequence of not taking this cross-contamination into account when analysing the results may be their significant overestimation. This review aims to draw attention to the problem of cross-contamination that accompanies the collection and analysis of samples for the presence of microplastics, and to discuss this issue in a comprehensive manner. The article indicates potential sources of cross-contamination, lists the mitigation methods, and describes the possibilities of assessing this type of contamination. Moreover, the review examines how cross-contamination control appears in practice, based on the available literature data.
1. Introduction
Microplastics (MP) are small fragments of plastics (1 µm–5 mm) that may be purposely produced in such a form (primary MP), or originate from degradation of larger plastic objects (secondary MP) under the influence of different environmental factors such as UV radiation, temperature, or waves [1]. It is questionable whether one of these categories can be unambiguously ascribed to particles that originated from the abrasion of large plastic items during their production, use, or maintenance (e.g., as a result of the use of tires). In this paper, however, such particles are treated as primary MP in accordance with the division presented by Boucher and Friot [2].
One of the main sources of primary MP are synthetic textiles that are subject to abrasion or crumbling during washing, consequently leading to the generation of vast amounts of microfibres that are discharged with wastewater [2,3]. Research by De Falco et al. [3] evidenced that the amount of released MP depends, among others, on the type of applied detergent, temperature, and water hardness. Therefore, industrial laundries may generate considerably more pollution with microplastics. The use of much more aggressive conditions of the washing process on an industrial scale contributes to more significant mechanical and chemical stresses favouring fabric disintegration. Moreover, the authors [3] estimated that the average amount of MP released during washing polyester textiles (for a load of 5 kg) exceeds 6 million particles in the form of microfibres.
Car tires are another equally important source of primary MP. As a result of contact with the road surface during the vehicle’s movement, they are subject to wear. As a result, microscopic particles are released to the environment, built of a mixture of polymers, both synthetic (primarily styrene–butadiene rubber) and natural, as well as various admixtures [2,4].
The remaining sources of primary MP include plastic pellets, used for the production of plastic goods, different types of coatings (e.g., applied in the shipbuilding and construction industry), personal care products and cosmetics, artificial grass, and many others [2].
As shown in these examples, in most cases, the release of MP to the environment is of incidental character, i.e., it is a natural consequence of the use and aging of items made entirely or partially of plastics. The exception is personal care products containing plastic microbeads that consumers consciously purchase. In this case, they are produced purposely to improve the value of cosmetic products, which are eventually discharged to the environment, causing the pollution [2].
The other category, namely secondary MP, refers to plastic particles originating from the degradation of larger items, such as plastic bags, bottles, or fishing nets [1,2].
Pollution with microplastics is an especially valid issue attracting much interest. It results from their common occurrence confirmed by numerous studies. The presence of MP was confirmed in various environmental matrices (among others, in the water, soil, and air), including drinking water and food products [1,5]. Considering the latter two cases, this is particularly important from the point of view of its potential impact on human health.
A starting point for implementing any legal regulations regarding the acceptable content of MP (e.g., in treated water or treated sewage) is evidencing their negative effect on the environment, and particularly on living organisms, including humans. This in turn requires knowledge regarding the actual MP concentrations in the environment, and therefore conducting monitoring of such pollution. Measurements permitting identification of the presence and determination of concentrations of MP currently require highly advanced analytical techniques. It constitutes a severe obstacle in the popularisation of research on the ecotoxicology of microplastics.
Many studies have been conducted so far in the scope of MP toxicology. Adverse effects caused by these micropollutants, however, still require confirmation [5]. MP measurements in the water environment are also conducted, although they mainly concern marine waters, whereas information concerning freshwater environments is limited [6]. The greatest issue is the lack of standardisation of sampling, separation, and identification of MP. It makes comparisons between the available data difficult or even impossible [5,7]. The issue of cross-contamination plays a very important role in the problem. It can considerably affect the quality of the results obtained, leading to their overestimation (Section 5). Therefore, conscious control of this phenomenon is of utmost importance.
This publication is the first review paper entirely devoted to the issue of cross-contamination related to the analysis of MP from environmental samples, and particularly water samples. However, there are several review papers on methodology of sample collection and analysis that address this issue, mainly concerning biota samples [8,9]. This article discusses the most important issues related to cross-contamination, such as sources of the contamination, possible methods of reducing the risk of sample contamination during research, and measurement methods of cross-contamination. In this paper, cross-contamination is defined as microplastics released to environmental samples in an uncontrolled way during their collection and analysis. For the purposes of this article, based on publications from reviewed scientific journals from the last 20 years (i.e., from the beginning of 2000 to the end of 2019), an extensive and accurate database was developed, clearly showing the approaches towards cross-contamination in MP research during recent years. The database providing the basis for writing this review paper contains 552 research papers regarding research in the scope of analysis of the presence of MP in different elements of the environment, i.e., in water, sediments, soil, living organisms, and air. Among these, 180 papers refer to the water environment.
2. Sources of Cross-Contamination
As mentioned above, a source of MP can be all items made of plastics, which undergo ageing or wear when exposed to mechanical stresses. Plastics, particularly those with dimensions at a micrometre level, are characterised by small inertia, i.e., they can be easily carried and suspended in the air. The smallest of them develop stable aerosol systems, and larger particles show a higher sedimentation rate, resulting in their short presence in the atmosphere [4]. Due to this, the most serious problem of cross-contamination is MP present in the air that can be subject to air deposition. Emission of micropollutants is caused by, among others, synthetic textiles, easily releasing MP in the form of fibres as a result of abrasion, together with shoes, laboratory equipment made of plastics (e.g., bottles, trays), and furniture [10,11].
Example equipment that can be responsible for sample contamination during MP research are nets (such as Neuston nets, Bongo nets, or Manta trawls) used to collect volume-reduced samples [7,11,12]. The nets, or more precisely their central part—the mesh—are made of plastics. Therefore, it is possible that synthetic fibres can be released to the collected material. Moreover, an inaccurately rinsed sample collection container located at the end of the net may also be a source of cross-contamination. Mu et al. [12] found several dozen fibres in field blank samples that were identified to originate from nets used for sampling.
Research in the scope of air contamination with plastic microfibres, both indoors and outdoors, was conducted by Dris et al. [10]. The analysis covered four sites: one outdoors and three representing a closed space (two private apartments and one office). The results showed that the mean concentration of contaminants indoors, reaching a level of 5.4 fibres/m3, was much higher than outdoors, where a value of 0.9 fibres/m3 was recorded. Moreover, it was calculated that the rate of deposition of fibres in the indoor environment varied from 1586 to 11,130 fibres/day/m2. This suggests considerable contamination with microplastics of indoor spaces, irrespective of their purpose, and high probability of their transfer from the air to nearby surfaces. The conclusion drawn from these findings is that the thorough control of contamination during the analysis of MP samples is a highly important element of laboratory research, and should not be disregarded (Section 4).
3. Methods of Reducing Cross-Contamination
Considering the knowledge that emission of microplastic pollutants is caused by items made of plastics, the obvious solution is their elimination to limit the possibility of cross-contamination [7,11]. When elimination of such items is not possible, special caution measures should be taken, and procedures for activities should be developed to minimise the risk of undesirable migration of pollutants.
Many different methods of mitigation of cross-contamination exist. A large majority are universal and can be applied irrespective of the type of analysed samples. The most popular methods include, among others: wearing clothing containing no plastic fibres, cleaning laboratory surfaces and entire equipment before use, covering samples and laboratory equipment, work in conditions of controlled air flow, and the use of exclusively glass or metal laboratory dishes (Appendix A).
The release of synthetic microfibres from clothing can be avoided by avoiding synthetic textiles. Moreover, during work conducted at a laboratory, it is recommended to wear cotton coats or overalls [13,14,15,16,17,18,19,20,21,22,23], which is a commonly implemented practice. Such a plastic-free outfit is supplemented with gloves, usually made of nitrile [21,22,23,24,25,26] or latex [20,27,28]. Several publications also mention headgear, e.g., in the form of a shower cap [22]. Guidelines developed by Gago et al. [7] also suggest taking notes regarding the type and colour of clothing worn by each person involved in the research. This can considerably aid the identification of microfibres in samples. Moreover, a larger number of people obviously generate more contamination. Therefore, it is recommended to assign a possibly low number of persons to each task [29].
Analogically, as in the case of the aforementioned notes regarding the type and colour of clothing, a register of selected information on the surroundings (e.g., colour of ship deck) should also be run [30]. They may become a potential source of additional contamination.
Covering samples or laboratory equipment usually involves aluminium foil [17,21,25,26,27,31,32,33,34] which is inexpensive and easily available. However, it is a delicate material, and can be easily torn, ceasing to fulfil its protective function. An alternative solution is a protection made of a more durable material, e.g., a glass lid [32,35] or a wooden cover, as used to cover a metal sieve described in one of the publications [36]. An ingenious solution for protection against cross-contamination was also presented by Torre et al. [37] by placing the stereoscopic microscope in a properly fitted plastic cover, thereby isolating the sample from external contamination during its visual examination. The authors showed that the microscope cover reduced airborne contamination by 95.3% compared to the analysis without any protection. Due to the high potential of this method to eliminate cross-contamination, it has already been implemented in several other studies [14,38].
Work in conditions of controlled air flow can limit the deposition of contaminants. These conditions can be provided by means of a fume hood or laminar flow cabinet equipped with an air filter [14,18,19,22,23,38,39,40,41]. Study results by Wesch et al. [42] showed that processing samples inside a laboratory fume hood contributed to a reduction of sample cross-contamination by almost 50%. Limiting access of air from the outside is equally important. This involves keeping windows and doors closed during the analysis [13,27,43].
As mentioned above, particles contained in the air, particularly microfibres, have a tendency for deposition. Therefore, it is highly important to clean different types of work surfaces and laboratory equipment before their use, because contaminants from the air might have accumulated on them in the meantime. Substances used for this purpose most commonly include: different types of alcohols, e.g., ethanol [13,17,24,28,44,45]; acetone [40,46]; distilled water [21,27,36,41]; deionised water [13,25,38]; and ultrapure water [17,18,25,47,48,49]. Review of literature also reveals the use of other substances such as double-distilled deionised water [34]; nitric acid [26]; or “Decon 90”, i.e., an agent typically made for cleaning surfaces [35]. Washing surfaces is frequently performed in several repetitions, usually three times [13,16,21,50], although several different substances are sometimes used in a sequence [35,44]. In some studies, cleaning laboratory glassware with liquids is additionally followed by heating in an oven or autoclave at high temperatures for several hours to minimise the adhesion of microfibres to their surface and combust any organic matter [16,49]. Due to the tendency of micropollutants to deposition, apart from cleaning laboratory equipment and surfaces, it also seems reasonable to thoroughly scrub hands and forearms by sample operators before starting laboratory analyses [23,25,50].
An interesting solution that appeared in several publications is increasing air humidity in the laboratory [15,19,46]. It results in a decrease in the amount of contaminants in the air, although on the other hand it contributes to their permanent deposition on surfaces. In this case, the aforementioned careful cleaning of surfaces before their use is essential.
Less popular methods of reducing cross-contamination include, among others, filtering all reagents used in the analyses (through a membrane filter with medium pore size up to several µm) [27,32,41,45,49].
Irrespective of whether and what measures of caution are applied for reduction of cross-contamination, many authors particularly recommend simultaneous analysis of control samples (Section 4) [17,19,21].
4. Assessment of Cross-Contamination
Obtaining the most reliable study results requires taking relevant steps aimed at quality assurance and quality control (QA/QC) of the conducted research [51]. One of such steps is the measurement of cross-contamination through analysis of control samples, including, among others, blanks.
Blanks are a necessary element of the process of validation of new or existing laboratory procedures, but they are also very frequently included in routine analytical activities related to sample analysis aimed at the assessment of contamination accompanying such activities [52].
In the analysis of MP samples from the water environment, analysis of blanks concerns water free from contamination, such as distilled water or prefiltered water that is then subject to procedures identical to those for the analysed environmental samples [17,19,21,49].
Another type of control samples are samples providing information on the amount of contaminants present in the air that is subject to air deposition in the vicinity of the conducted activities (background contamination), and therefore probably also permeate into the analysed samples [13,24,31,35,50].
In the scope of control of background contamination, empty Petri dishes [39,48,53] or single filter papers [18,33] are usually used. Several publications describe combining these two solutions, where filter papers are placed in Petri dishes [43,50]. Another method for conducting this type of control analyses is filling Petri dishes with water [24,25,54], or moistening filter papers [35] to provide a substrate with strong adhesion, contributing to capturing contaminants from the air. Next, the resulting samples are distributed at selected sites for a specified period of time, usually the duration of particular stages of the analysis, or duration of the entire analysis, and then they are analysed. Control of cross-contamination is sometimes also conducted in conditions of forced air flow, i.e., through sucking air through a filter paper in a vacuum filtration system for a specified period of time. Such a technique was employed in research by Wang et al. [21], using a glass fibre filter paper with a pore diameter of 0.45 μm, and adopting the filtration time of one hour.
The literature review showed a largely arbitrary approach to nomenclature of control samples. Example descriptions of control samples encountered in publications include: “procedural laboratory blank” [19], “method blank” [36], “air contamination control” [35], “blind control” [45], or “blank control” [16]. There is also a division into positive and negative controls [55], although these terms are rarely used. The use of many different names, often in reference to the same activity, can be misleading. Therefore, standardising the terminology is advisable.
Control samples require more labour due to the necessity of their preparation and analysis. Depending on the equipment used, it can be a tedious process, and therefore a reason why it is an element neglected in part of studies. The review and analysis of the literature show that 80 out of 180 research papers focusing on MP analysis in water samples do not mention control samples. This suggests that they were not considered in the research. Although, as mentioned above, analysing control samples is an additional more labour and time-consuming task, it provides much valuable information that considerably improved the quality of the study results obtained. Most importantly, the analysis of the discussed samples provides information on the quantity of micropollutants to which primary samples were exposed during particular stages of research. Due to this, the values obtained can be preliminarily considered in processing results while avoiding their overestimation. Moreover, quantitative analysis of control samples can facilitate the identification of potential sources of MP emission, which can then be eliminated from future analyses, thus reducing the current level of cross-contamination.
5. Control of Cross-Contamination in Practice
A large portion of articles includes no information on the control of cross-contamination during research [38,56]. These papers sometimes mention using “clean” tools, but this type of information is very imprecise, and does not evidence taking any steps towards mitigation of cross-contamination.
Part of the publications includes only a short note concerning taking relevant steps in order to eliminate the possibility of contamination of samples during research. However, they do not specify such steps, and therefore provide no details of the applied procedure preventing contamination.
In many papers, methods of reduction of cross-contamination are combined with several sentences of the methodology description. There are also publications including a separate chapter regarding the provision of quality assurance and quality control (QA/QC) during research. Such chapters have many different titles, such as “Background contamination” [15,44,46], “Quality assurance (QA) and quality control (QC)” [47], “Contamination prevention” [31,32,49], “Reducing and measuring contamination” [50], “Laboratory QA/QC” [13], “Contamination avoidance” [20,40], and “Anti-contamination measures for microplastic analysis” [19].
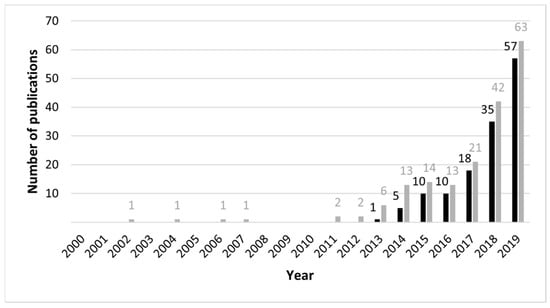
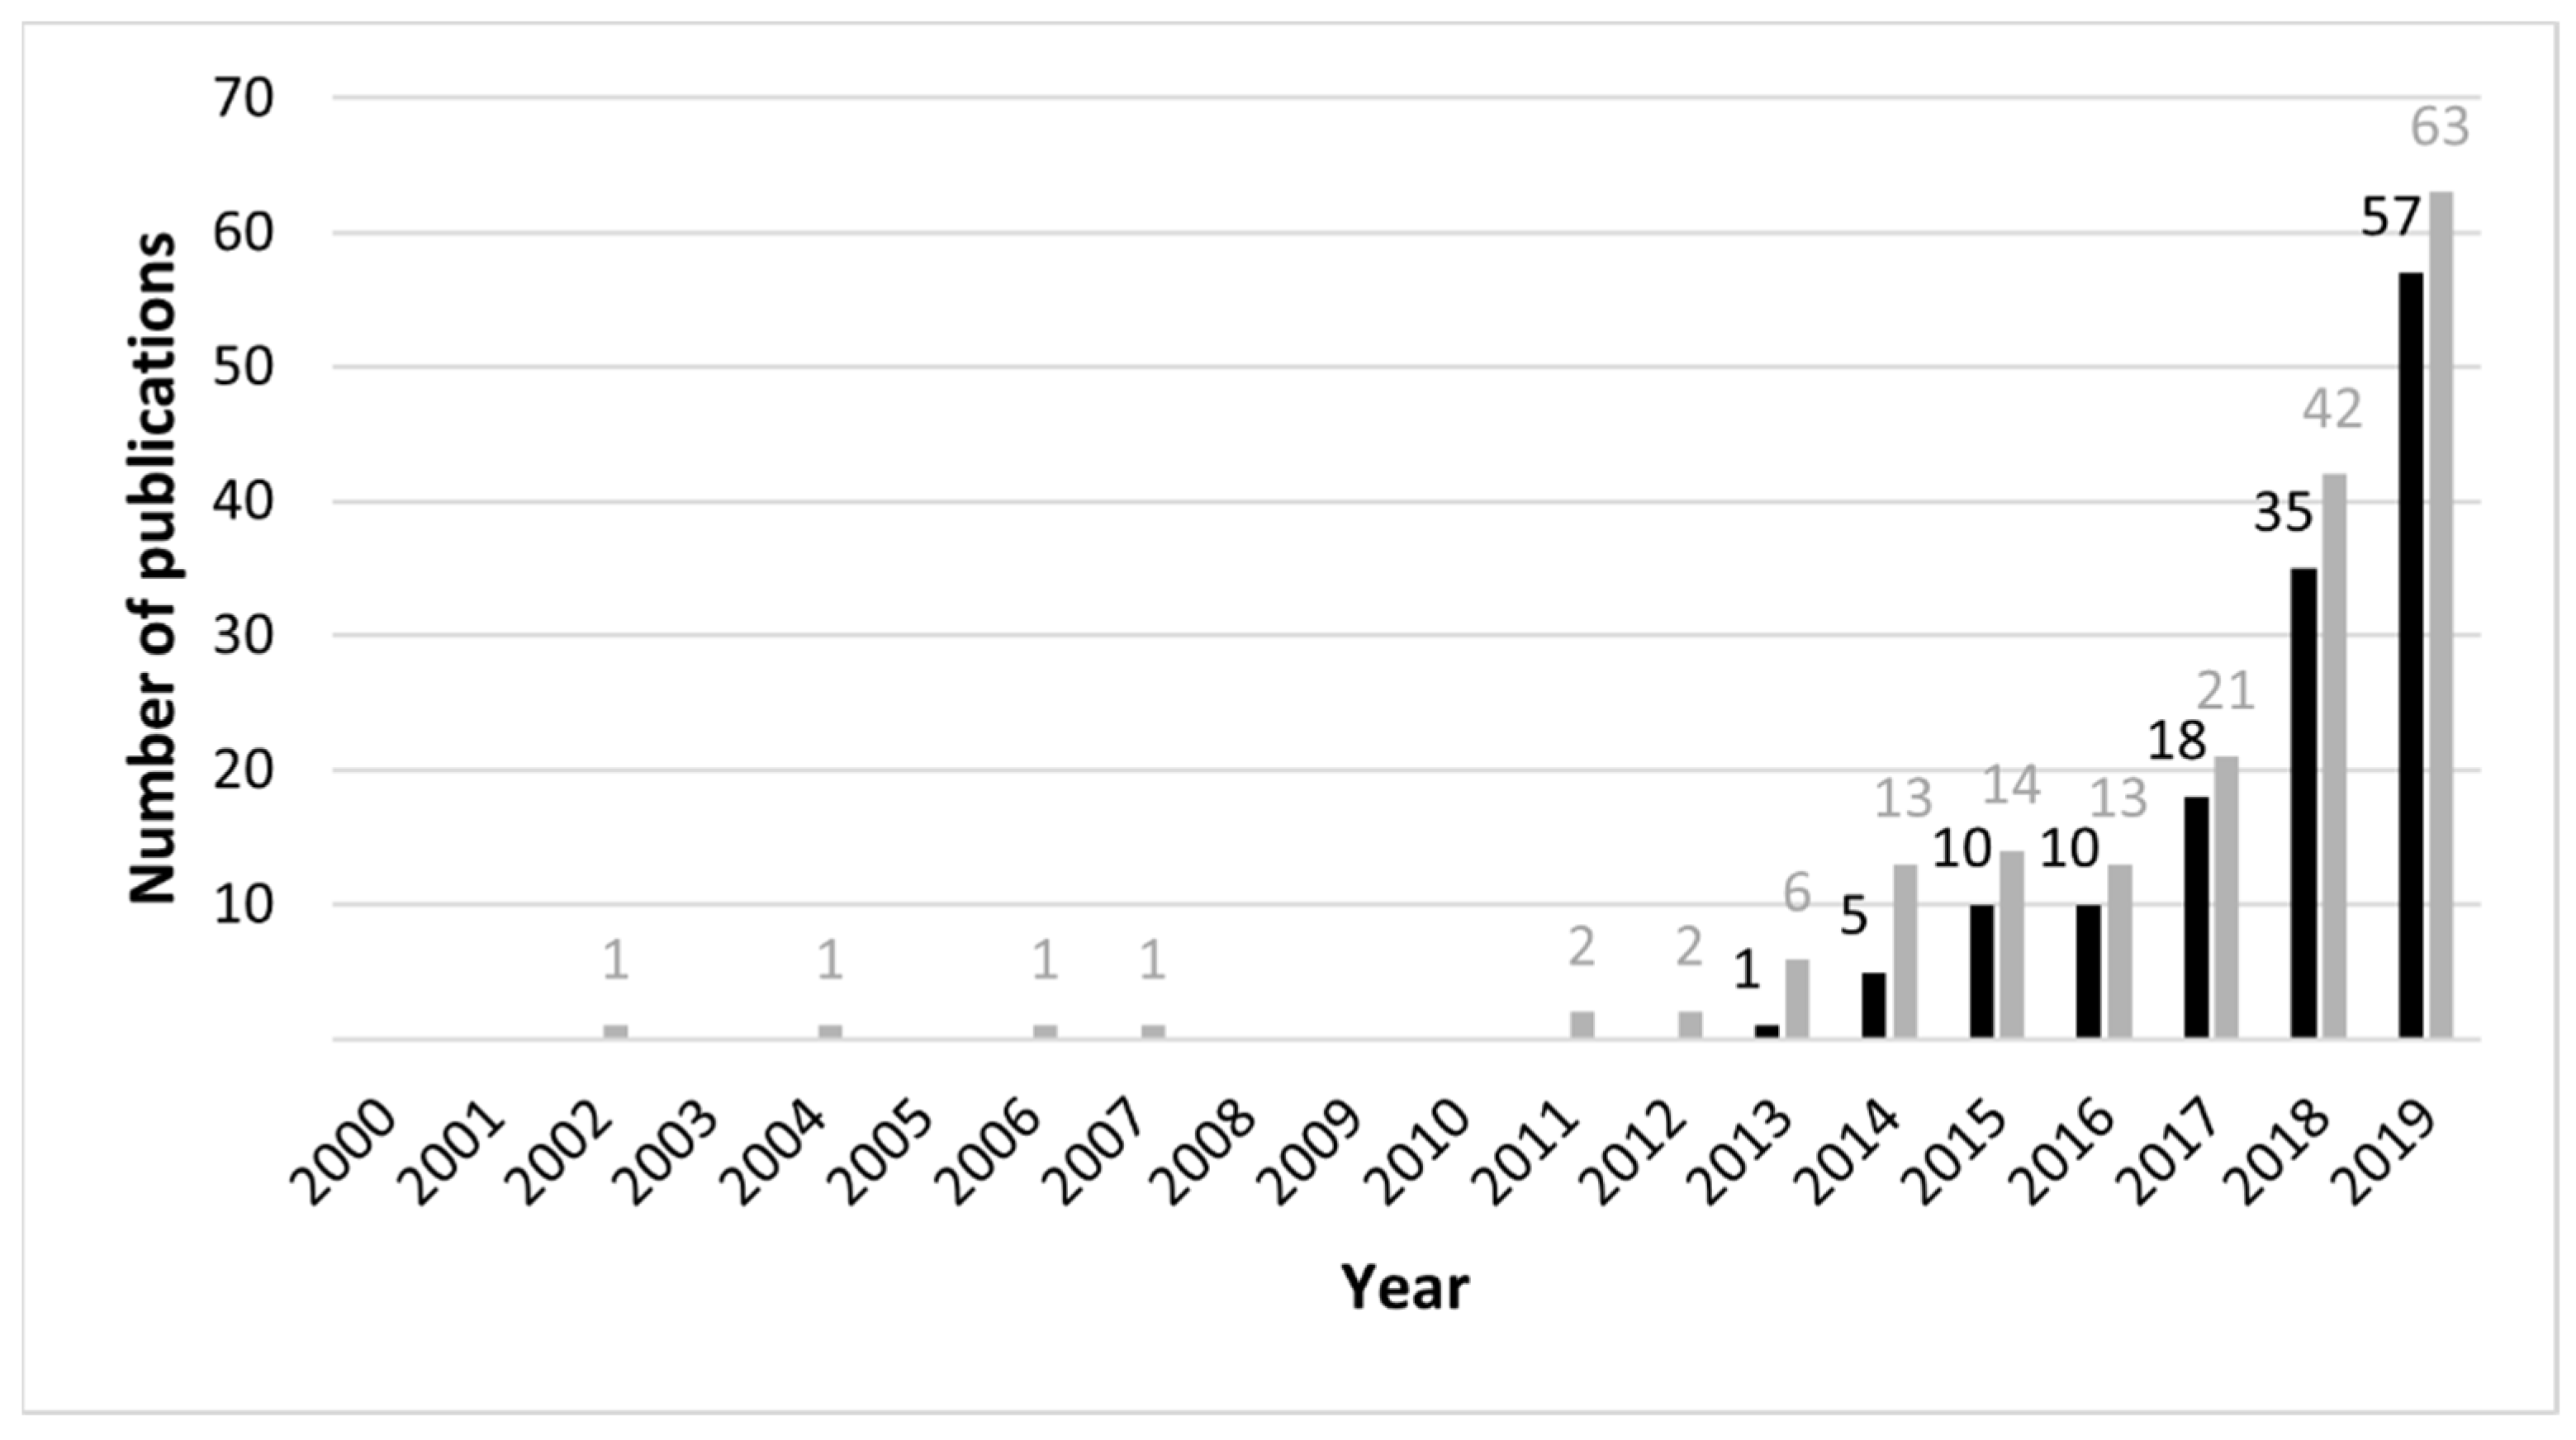
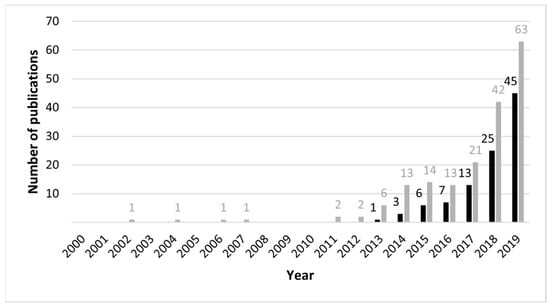
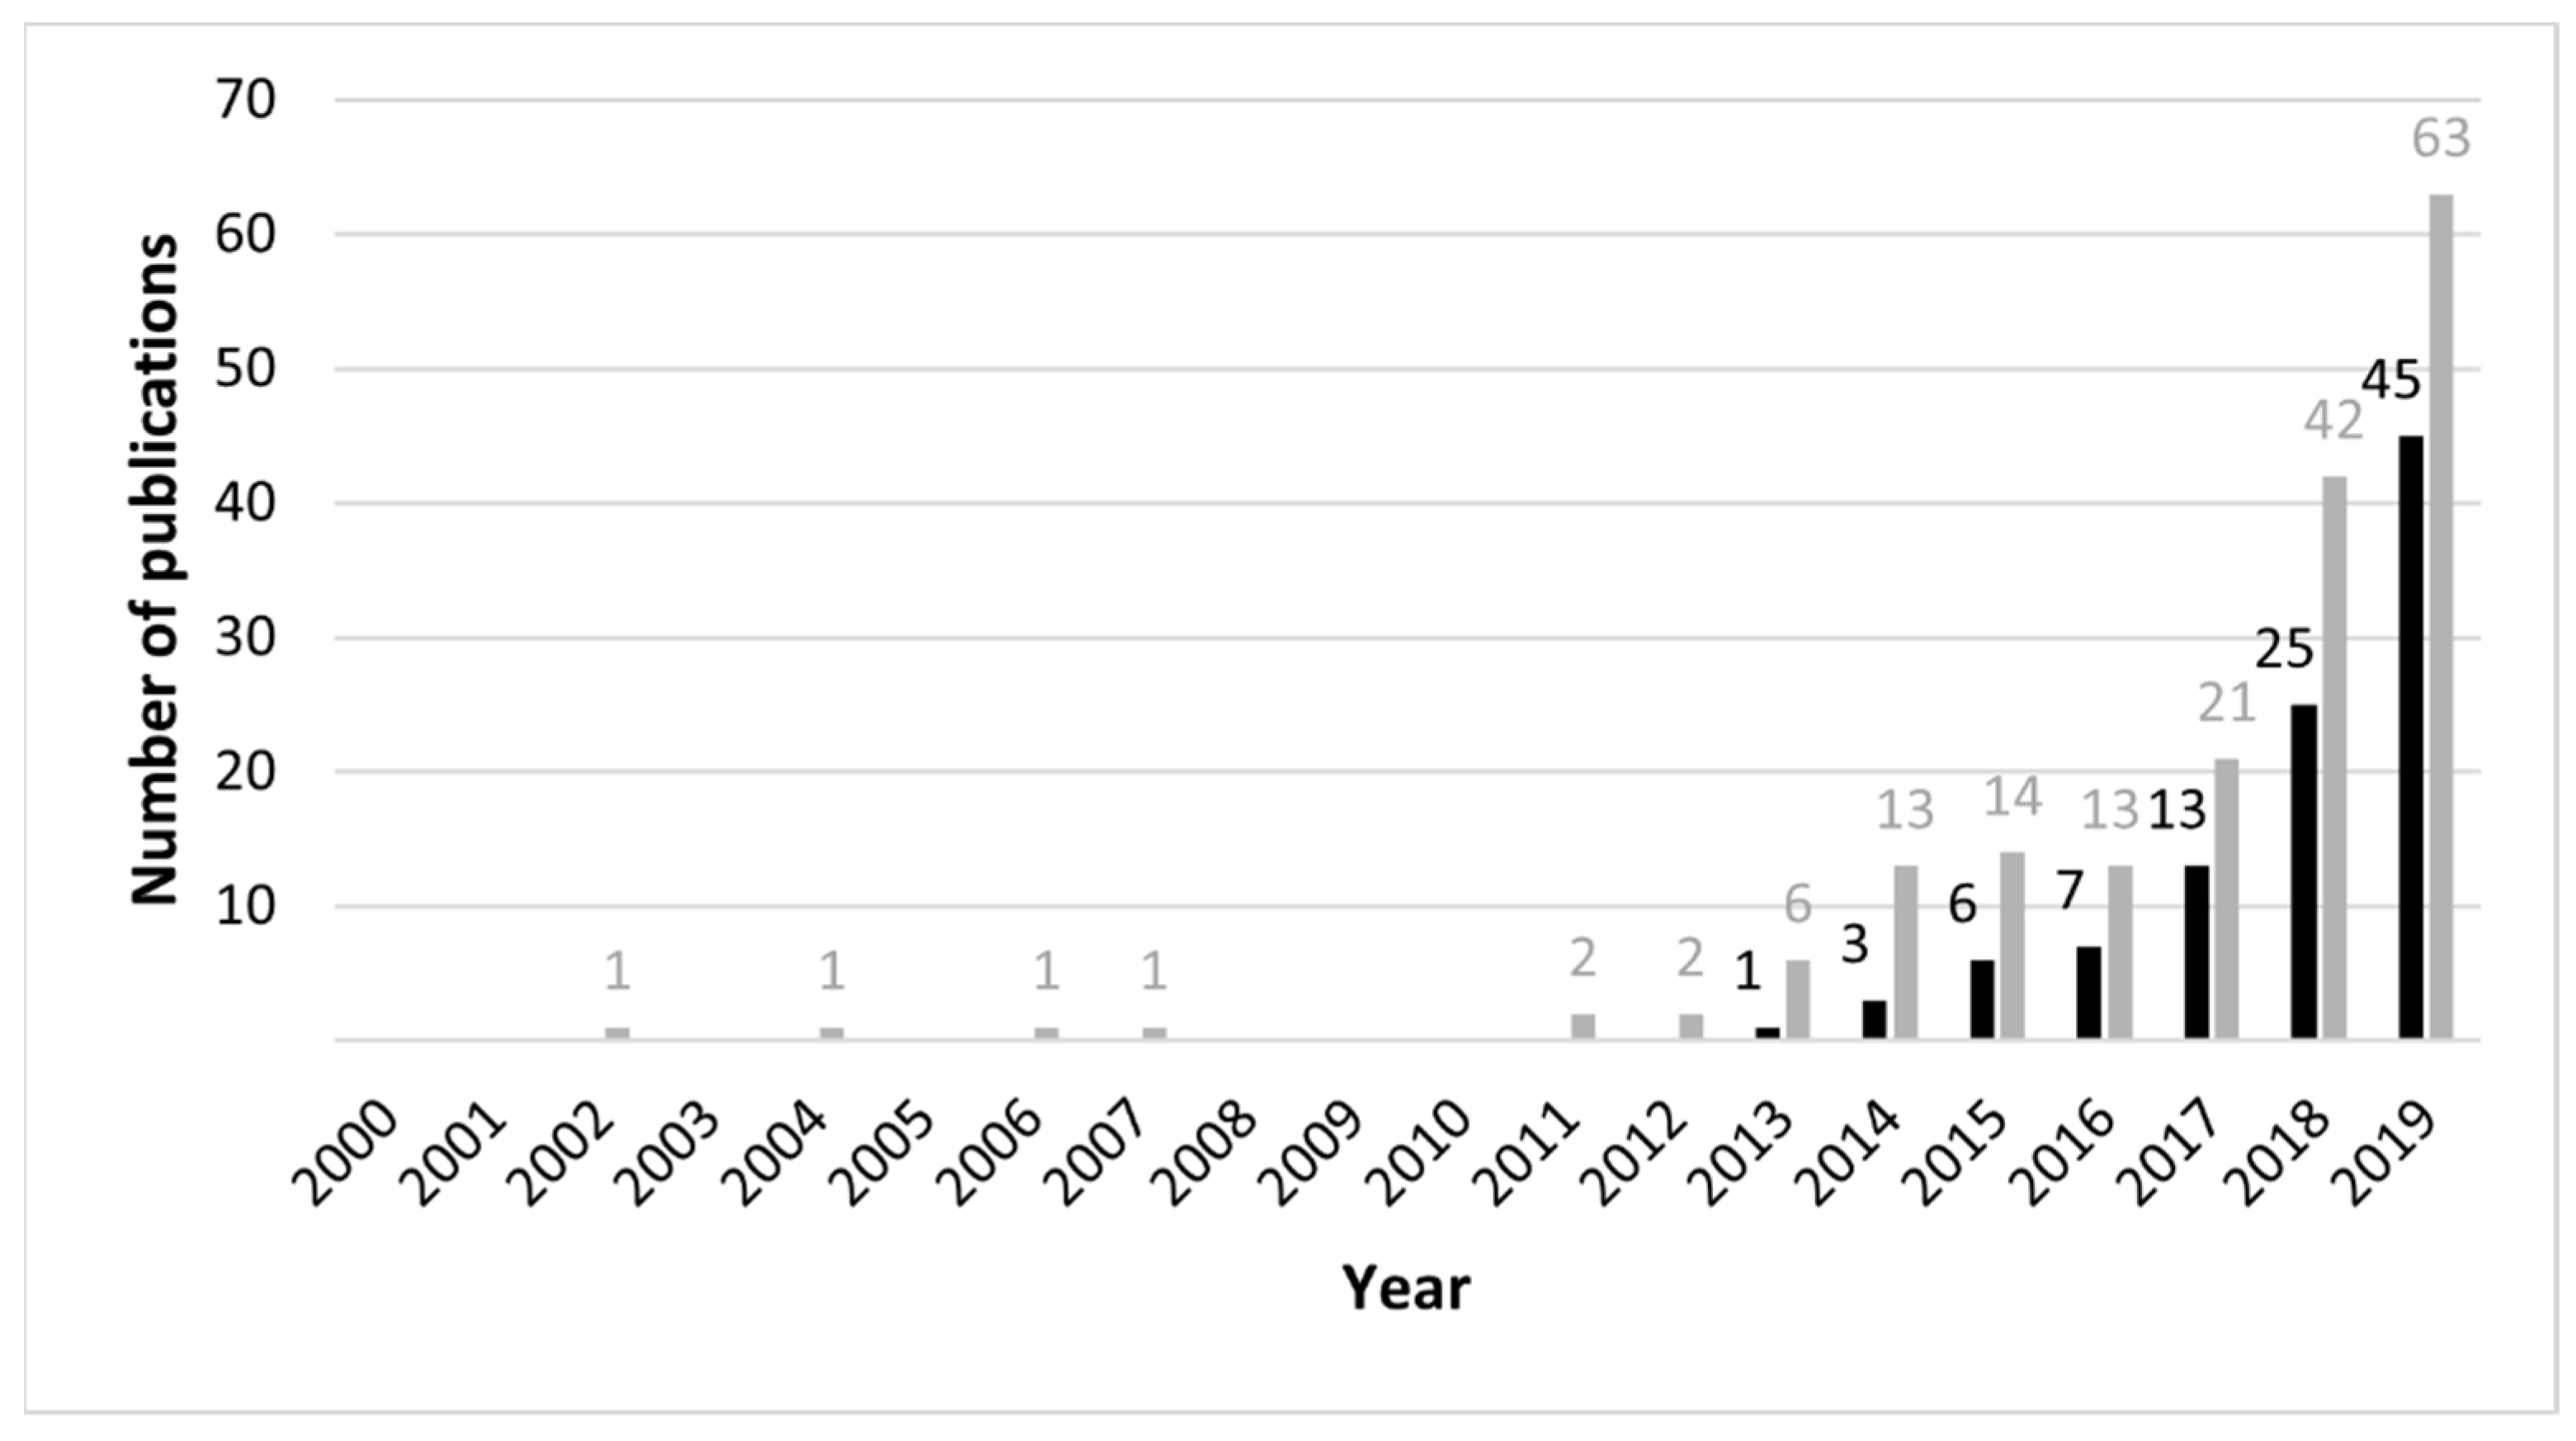
The number of research papers in the scope of MP analysis in the water environment that include information regarding taking any conscious steps aimed at reducing cross-contamination in conducted research is increasing yearly (Figure 1). An analogical increasing trend in terms of the publications number is also observed in reference to articles covering control samples (Figure 2). Furthermore, it can be seen that most of the methods of mitigating cross-contamination, such as wearing protective clothing (gloves or cotton laboratory coats) or filtering chemical reagents before use, show a similar upward tendency as demonstrated in the Supplementary Materials (Figures S1–S10). However, this increase is not always proportional to the number of new research papers on microplastics, but it is nevertheless indicative of a growing awareness of the issue of cross-contamination occurring during the MP research. Interestingly, as shown in the diagrams (Figure 1 and Figure 2), before 2013, no research papers regarding the presence of MP in the water environment mentioned either the implementation of methods for control of cross-contamination, or control samples. These are, therefore, practices implemented in recent years only. Moreover, in 2013, control samples were analysed in only one study, and in 2019 the number increased to 45.
Figure 1.
Number of publications (annually) concerning MP analysis in the water environment in total (grey) compared to publications employing any solutions aimed at reduction of cross-contamination (black).
Figure 2.
Number of publications (annually) concerning MP analysis in the water environment in total (grey) compared to publications employing control samples (black).
Based on the developed database, the literature review showed that over the last 20 years, control samples appeared in 242 out of 552 articles (44%) referring to MP analysis in environmental samples. In the case of publications referring to water samples, the number was 100 out of 180 papers (56%). Although the presented proportions appear relatively low, the observed trend (Figure 1 and Figure 2) suggests that the proportions will increase with time.
Information regarding control samples provided by authors is sometimes very limited, i.e., focused only on the analysis of control samples, and not including results of analysis of such samples. This may mean that no cross-contamination occurred in a given study, or it was sufficiently low to be considered insignificant. Nonetheless, such information should be included in publications, because they may prove useful from the point of view of discussion regarding cross-contamination.
Hermsen et al. [9] performed a quality assessment of selected research papers on MP analysis in biota samples. The evaluation criteria included, inter alia, methodology of sampling and MP identification, sample size, and control samples. Based on the results obtained, the authors [9] concluded that none of the assessed studies can be considered fully reliable due to the lack of certain information, e.g., in the field of analytical procedures used. As indicated by the authors of the abovementioned reviews [8,9], cross-contamination may occur at any stage of sample handling, i.e., during sampling, transport to the laboratory, and laboratory analysis. Therefore, it is extremely important to identify potential sources of secondary contamination during research in order to take appropriate actions towards reduction and to estimate the impact of cross-contamination on the results. Control and assessment of cross-contamination are particularly important in the case of samples where the occurrence of particles with small sizes (at a level of several micrometres) and in small quantities is expected, as confirmed in the study by Mintenig et al. [17]. The study involved the analysis of MP presence in raw (underground) water and treated water. In the scope of assessment of cross-contamination, a series of blanks was performed, analysing prefiltered consumable water in the same way as that used for collected samples of water. In all water samples, between three and 46 particles in the form of microfibres were detected in 1 m3, and the analysis of control samples showed their average content at a level of 45 microfibres. The results provided the basis for the conclusion that water sample contamination with microplastics, both for raw and treated water, was in its entirety incidentally introduced to the samples during activities involved in their collection and analysis. This demonstrates the importance of proper methodology of sample collection and preparation in research, aimed at minimising cross-contamination of the analysed water.
6. Conclusions
This article discusses the existence of many potential sources of emission of contaminants in the form of MP. Cross-contamination of samples during research appears unavoidable. Due to this, the implementation of research focusing on the analysis of the presence of MP in the environment should be accompanied by undertaking conscious activities aimed at reduction of cross-contamination. However, applying many strict guidelines in the scope does not guarantee complete elimination of secondary contamination of the analysed samples, which points to the need for determining the share of cross-contamination with microplastics in sampled water. Although in reality, in reference to research conducted and described in the literature so far, the application of control samples is not a common practice. An increasing tendency has been observed in recent years regarding the number of studies, in which the control samples were implemented. It should also be noted that the effectiveness of particular methods of reducing cross-contamination is unknown and difficult to determine quantitatively. Therefore, appropriate research should be carried out to validate each of these approaches. As a result, it would be possible to develop a protocol detailing the mitigation and assessment measures for cross-contamination. To summarise, MP constitute an omnipresent pollutant, and failure to consider this fact in research can lead to considerable overestimation in the results obtained. In the situation of expectation of a trace amount of MP, it can constitute a serious problem. In order to guarantee the highest possible quality of study results in the scope of MP analysis in environmental samples, it is necessary to standardise the methodology of sampling, separation, and identification of MP, with consideration of procedures aimed at reduction and measurement of cross-contamination.
Supplementary Materials
The following are available online at https://www.mdpi.com/article/10.3390/su132112123/s1, Figure S1: Number of publications (annually) concerning MP analysis in the water environment in total (grey) compared to publications employing latex or nitrile gloves (black), Figure S2: Number of publications (annually) concerning MP analysis in the water environment in total (grey) compared to publications employing laboratory coats (black), Figure S3. Number of publications (annually) concerning MP analysis in the water environment in total (grey) compared to publications employing fume hoods or laminar flow cabinets (black), Figure S4. Number of publications (annually) concerning MP analysis in the water environment in total (grey) compared to publications employing covering samples or laboratory equipment with aluminium foil or other nonplastic covers (black), Figure S5. Number of publications (annually) concerning MP analysis in the water environment in total (grey) compared to publications employing polymer-free clothing (black), Figure S6. Number of publications (annually) concerning MP analysis in the water environment in total (grey) compared to publications employing washing glassware or laboratory equipment several times in a row prior to use (black), Figure S7. Number of publications (annually) concerning MP analysis in the water environment in total (grey) compared to publications employing filtration of chemical reagents (e.g., H2O2) before use (black), Figure S8. Number of publications (annually) concerning MP analysis in the water environment in total (grey) compared to publications employing sterilisation of glassware or laboratory tools before use (black), Figure S9. Number of publications (annually) concerning MP analysis in the water environment in total (grey) compared to publications employing washing glassware or laboratory equipment with agents other than water, such as alcohol, acids, or special detergents (black), Figure S10. Number of publications (annually) concerning MP analysis in the water environment in total (grey) compared to publications employing the use of equipment made of materials other than plastic, e.g., glass, whenever possible (black).
Author Contributions
Conceptualisation, A.B., M.Z.-S. and A.K.; investigation, A.B.; writing—original draft preparation, A.B.; writing—review and editing, M.Z.-S., A.K. and M.S.; visualisation, A.B. All authors have read and agreed to the published version of the manuscript.
Funding
This research received no external funding.
Institutional Review Board Statement
Not applicable.
Informed Consent Statement
Not applicable.
Data Availability Statement
Not applicable.
Conflicts of Interest
The authors declare no conflict of interest.
Appendix A
Table A1.
Summary of cross-contamination mitigation methods in selected research works on the presence of microplastics in various environmental matrices (“item” refers to a single microplastic particle, SD means standard deviation).
References
- Crawford, C.B.; Quinn, B. 5-Microplastics, standardisation and spatial distribution. In Microplastic Pollutants, 1st ed.; Crawford, C.B., Quinn, B., Eds.; Elsevier: Amsterdam, Netherlands, 2017; pp. 101–130. ISBN 9780128104699. [Google Scholar]
- Boucher, J.; Friot, D. Primary Microplastics in the Oceans: A Global Evaluation of Sources; IUCN: Gland, Switzerland, 2017; p. 43. ISBN 978-2-8317-1827-9. [Google Scholar]
- De Falco, F.; Gullo, M.P.; Gentile, G.; Di Pace, E.; Cocca, M.; Gelabert, L.; Brouta-Agnésa, M.; Rovira, A.; Escudero, R.; Villalba, R.; et al. Evaluation of microplastic release caused by textile washing processes of synthetic fabrics. Environ. Pollut. 2018, 236, 916–925. [Google Scholar] [CrossRef] [Scilit] [PubMed]
- Sommer, F.; Dietze, V.; Baum, A.; Sauer, J.; Gilge, S.; Maschowski, C.; Gieré, R. Tire Abrasion as a Major Source of Microplastics in the Environment. Aerosol Air Qual. Res. 2018, 18, 2014–2028. [Google Scholar] [CrossRef] [Scilit]
- SAPEA. Science Advice for Policy by European Academies. In A Scientific Perspective on Microplastics in Nature and Society; SAPEA: Berlin, Germany, 2019; ISBN 978-3-9820301-0-4. [Google Scholar]
- Lambert, S.; Wagner, M. Microplastics Are Contaminants of Emerging Concern in Freshwater Environments: An Overview. In Freshwater Microplastics; Wagner, M., Lambert, S., Eds.; Springer: Cham, Switzerland, 2018; pp. 1–23. ISBN 978-3-319-61615-5. [Google Scholar]
- Gago, J.; Filgueiras, A.; Pedrotti, M.L.; Caetano, M.; Frias, J. Standardised Protocol for Monitoring Microplastics in Seawater; JPI-Oceans: Brussels, Belgium, 2018. [Google Scholar] [CrossRef]
- Wesch, C.; Bredimus, K.; Paulus, M.; Klein, R. Towards the suitable monitoring of ingestion of microplastics by marine biota: A review. Environ. Pollut. 2016, 218, 1200–1208. [Google Scholar] [CrossRef] [Scilit]
- Hermsen, E.; Mintenig, S.M.; Besseling, E.; Koelmans, A.A. Quality Criteria for the Analysis of Microplastic in Biota Samples: A Critical Review. Environ. Sci. Technol. 2018, 52, 10230–10240. [Google Scholar] [CrossRef] [Scilit]
- Dris, R.; Gasperi, J.; Mirande, C.; Mandin, C.; Guerrouache, M.; Langlois, V.; Tassin, B. A first overview of textile fibers, including microplastics, in indoor and outdoor environments. Environ. Pollut. 2017, 221, 453–458. [Google Scholar] [CrossRef] [Scilit] [PubMed]
- Hidalgo-Ruz, V.; Gutow, L.; Thompson, R.C.; Thiel, M. Microplastics in the Marine Environment: A Review of the Methods Used for Identification and Quantification. Environ. Sci. Technol. 2012, 46, 3060–3075. [Google Scholar] [CrossRef] [Scilit]
- Mu, J.; Zhang, S.; Qu, L.; Jin, F.; Fang, C.; Ma, X.; Zhang, W.; Wang, J. Microplastics abundance and characteristics in surface waters from the Northwest Pacific, the Bering Sea, and the Chukchi Sea. Mar. Pollut. Bull. 2019, 143, 58–65. [Google Scholar] [CrossRef] [Scilit]
- Courtene-Jones, W.; Quinn, B.; Gary, S.F.; Mogg, A.O.M.; Narayanaswamy, B.E. Microplastic pollution identified in deep-sea water and ingested by benthic invertebrates in the Rockall Trough, North Atlantic Ocean. Environ. Pollut. 2017, 231, 271–280. [Google Scholar] [CrossRef] [Scilit]
- Covernton, G.A.; Pearce, C.M.; Gurney-Smith, H.J.; Chastain, S.G.; Ross, P.S.; Dower, J.F.; Dudas, S.E. Size and shape matter: A preliminary analysis of microplastic sampling technique in seawater studies with implications for ecological risk assessment. Sci. Total Environ. 2019, 667, 124–132. [Google Scholar] [CrossRef] [Scilit]
- Hengstmann, E.; Tamminga, M.; vom Bruch, C.; Fischer, E.K. Microplastic in beach sediments of the Isle of Rügen (Baltic Sea)—Implementing a novel glass elutriation column. Mar. Pollut. Bull. 2018, 126, 263–274. [Google Scholar] [CrossRef] [Scilit]
- Huang, Y.; Yan, M.; Xu, K.; Nie, H.; Gong, H.; Wang, J. Distribution characteristics of microplastics in Zhubi Reef from South China Sea. Environ. Pollut. 2019, 255. [Google Scholar] [CrossRef] [Scilit]
- Mintenig, S.M.; Löder, M.G.J.; Primpke, S.; Gerdts, G. Low numbers of microplastics detected in drinking water from ground water sources. Sci. Total Environ. 2019, 648, 631–635. [Google Scholar] [CrossRef] [Scilit]
- Simon-Sánchez, L.; Grelaud, M.; Garcia-Orellana, J.; Ziveri, P. River Deltas as hotspots of microplastic accumulation: The case study of the Ebro River (NW Mediterranean). Sci. Total Environ. 2019, 687, 1186–1196. [Google Scholar] [CrossRef] [Scilit] [PubMed]
- Tamminga, M.; Hengstmann, E.; Fischer, E.K. Microplastic analysis in the South Funen Archipelago, Baltic Sea, implementing manta trawling and bulk sampling. Mar. Pollut. Bull. 2018, 128, 601–608. [Google Scholar] [CrossRef] [Scilit]
- Vaughan, R.; Turner, S.D.; Rose, N.L. Microplastics in the sediments of a UK urban lake. Environ. Pollut. 2017, 229, 10–18. [Google Scholar] [CrossRef] [Scilit]
- Wang, W.; Ndungu, A.W.; Li, Z.; Wang, J. Microplastics pollution in inland freshwaters of China: A case study in urban surface waters of Wuhan, China. Sci. Total Environ. 2017, 575, 1369–1374. [Google Scholar] [CrossRef] [Scilit]
- Xiong, X.; Zhang, K.; Chen, X.; Shi, H.; Luo, Z.; Wu, C. Sources and distribution of microplastics in China’s largest inland lake—Qinghai Lake. Environ. Pollut. 2018, 235, 899–906. [Google Scholar] [CrossRef] [Scilit] [PubMed]
- Zhao, S.; Zhu, L.; Li, D. Microplastic in three urban estuaries, China. Environ. Pollut. 2015, 206, 597–604. [Google Scholar] [CrossRef] [Scilit] [PubMed]
- Baalkhuyur, F.M.; Bin Dohaish, E.-J.A.; Elhalwagy, M.E.A.; Alikunhi, N.M.; AlSuwailem, A.M.; Røstad, A.; Coker, D.J.; Berumen, M.L.; Duarte, C.M. Microplastic in the gastrointestinal tract of fishes along the Saudi Arabian Red Sea coast. Mar. Pollut. Bull. 2018, 131, 407–415. [Google Scholar] [CrossRef] [Scilit] [PubMed]
- Enders, K.; Lenz, R.; Stedmon, C.A.; Nielsen, T.G. Abundance, size and polymer composition of marine microplastics ≥10μm in the Atlantic Ocean and their modelled vertical distribution. Mar. Pollut. Bull. 2015, 100, 70–81. [Google Scholar] [CrossRef] [Scilit]
- Rose, D.; Webber, M. Characterization of microplastics in the surface waters of Kingston Harbour. Sci. Total Environ. 2019, 664, 753–760. [Google Scholar] [CrossRef] [Scilit]
- Abbasi, S.; Keshavarzi, B.; Moore, F.; Turner, A.; Kelly, F.J.; Dominguez, A.O.; Jaafarzadeh, N. Distribution and potential health impacts of microplastics and microrubbers in air and street dusts from Asaluyeh County, Iran. Environ. Pollut. 2019, 244, 153–164. [Google Scholar] [CrossRef] [Scilit]
- Cincinelli, A.; Scopetani, C.; Chelazzi, D.; Lombardini, E.; Martellini, T.; Katsoyiannis, A.; Fossi, M.C.; Corsolini, S. Microplastic in the surface waters of the Ross Sea (Antarctica): Occurrence, distribution and characterization by FTIR. Chemosphere 2017, 175, 391–400. [Google Scholar] [CrossRef] [Scilit] [PubMed]
- Frias, J.; Pagter, E.; Nash, R.; O’Connor, I.; Carretero, O.; Filgueiras, A.; Viñas, L.; Gago, J.; Antunes, J.; Bessa, F.; et al. Standardised Protocol for Monitoring Microplastics in Sediments; JPI-Oceans: Brussels, Belgium, 2018. [Google Scholar] [CrossRef] [Scilit]
- Bagaev, A.; Mizyuk, A.; Khatmullina, L.; Isachenko, I.; Chubarenko, I. Anthropogenic fibres in the Baltic Sea water column: Field data, laboratory and numerical testing of their motion. Sci. Total Environ. 2017, 599–600, 560–571. [Google Scholar] [CrossRef] [Scilit] [PubMed]
- Lusher, A.L.; Burke, A.; O’Connor, I.; Officer, R. Microplastic pollution in the Northeast Atlantic Ocean: Validated and opportunistic sampling. Mar. Pollut. Bull. 2014, 88, 325–333. [Google Scholar] [CrossRef] [Scilit] [PubMed]
- Piehl, S.; Mitterwallner, V.; Atwood, E.C.; Bochow, M.; Laforsch, C. Abundance and distribution of large microplastics (1–5 mm) within beach sediments at the Po River Delta, northeast Italy. Mar. Pollut. Bull. 2019, 149. [Google Scholar] [CrossRef] [Scilit]
- Rodrigues, M.O.; Abrantes, N.; Gonçalves, F.J.M.; Nogueira, H.; Marques, J.C.; Gonçalves, A.M.M. Spatial and temporal distribution of microplastics in water and sediments of a freshwater system (Antuã River, Portugal). Sci. Total Environ. 2018, 633, 1549–1559. [Google Scholar] [CrossRef] [Scilit] [PubMed]
- Cordova, M.R.; Purwiyanto, A.I.S.; Suteja, Y. Abundance and characteristics of microplastics in the northern coastal waters of Surabaya, Indonesia. Mar. Pollut. Bull. 2019, 142, 183–188. [Google Scholar] [CrossRef] [Scilit] [PubMed]
- Kapp, K.J.; Yeatman, E. Microplastic hotspots in the Snake and Lower Columbia rivers: A journey from the Greater Yellowstone Ecosystem to the Pacific Ocean. Environ. Pollut. 2018, 241, 1082–1090. [Google Scholar] [CrossRef] [Scilit]
- Kanhai, L.D.K.; Officer, R.; Lyashevska, O.; Thompson, R.C.; O’Connor, I. Microplastic abundance, distribution and composition along a latitudinal gradient in the Atlantic Ocean. Mar. Pollut. Bull. 2017, 115, 307–314. [Google Scholar] [CrossRef] [Scilit]
- Torre, M.; Digka, N.; Anastasopoulou, A.; Tsangaris, V.; Mytilineou, C. Anthropogenic microfibres pollution in marine biota. A new and simple methodology to minimize airborne contamination. Mar. Pollut. Bull. 2016, 113, 55–61. [Google Scholar] [CrossRef] [Scilit] [PubMed]
- Gündoğdu, S.; Çevik, C.; Ayat, B.; Aydoğan, B.; Karaca, S. How microplastics quantities increase with flood events? An example from Mersin Bay NE Levantine coast of Turkey. Environ. Pollut. 2018, 239, 342–350. [Google Scholar] [CrossRef] [Scilit]
- Baini, M.; Fossi, M.C.; Galli, M.; Caliani, I.; Campani, T.; Finoia, M.G.; Panti, C. Abundance and characterization of microplastics in the coastal waters of Tuscany (Italy): The application of the MSFD monitoring protocol in the Mediterranean Sea. Mar. Pollut. Bull. 2018, 133, 543–552. [Google Scholar] [CrossRef] [Scilit]
- Beer, S.; Garm, A.; Huwer, B.; Dierking, J.; Nielsen, T.G. No increase in marine microplastic concentration over the last three decades—A case study from the Baltic Sea. Sci. Total Environ. 2018, 621, 1272–1279. [Google Scholar] [CrossRef] [Scilit] [PubMed]
- Fan, Y.; Zheng, K.; Zhu, Z.; Chen, G.; Peng, X. Distribution, sedimentary record, and persistence of microplastics in the Pearl River catchment, China. Environ. Pollut. 2019, 251, 862–870. [Google Scholar] [CrossRef] [Scilit]
- Wesch, C.; Elert, A.M.; Wörner, M.; Braun, U.; Klein, R.; Paulus, M. Assuring quality in microplastic monitoring: About the value of clean-air devices as essentials for verified data. Sci. Rep. 2017, 7. [Google Scholar] [CrossRef] [Scilit]
- Savoca, S.; Capillo, G.; Mancuso, M.; Faggio, C.; Panarello, G.; Crupi, R.; Bonsignore, M.; D’Urso, L.; Compagnini, G.; Neri, F.; et al. Detection of artificial cellulose microfibers in Boops boops from the northern coasts of Sicily (Central Mediterranean). Sci. Total Environ. 2019, 691, 455–465. [Google Scholar] [CrossRef] [Scilit]
- Frère, L.; Paul-Pont, I.; Rinnert, E.; Petton, S.; Jaffré, J.; Bihannic, I.; Soudant, P.; Lambert, C.; Huvet, A. Influence of environmental and anthropogenic factors on the composition, concentration and spatial distribution of microplastics: A case study of the Bay of Brest (Brittany, France). Environ. Pollut. 2017, 225, 211–222. [Google Scholar] [CrossRef] [Scilit]
- Schmidt, L.K.; Bochow, M.; Imhof, H.K.; Oswald, S.E. Multi-temporal surveys for microplastic particles enabled by a novel and fast application of SWIR imaging spectroscopy—Study of an urban watercourse traversing the city of Berlin, Germany. Environ. Pollut. 2018, 239, 579–589. [Google Scholar] [CrossRef] [Scilit]
- Klein, M.; Fischer, E.K. Microplastic abundance in atmospheric deposition within the Metropolitan area of Hamburg, Germany. Sci. Total Environ. 2019, 685, 96–103. [Google Scholar] [CrossRef] [Scilit] [PubMed]
- Dai, Z.; Zhang, H.; Zhou, Q.; Tian, Y.; Chen, T.; Tu, C.; Fu, C.; Luo, Y. Occurrence of microplastics in the water column and sediment in an inland sea affected by intensive anthropogenic activities. Environ. Pollut. 2018, 242, 1557–1565. [Google Scholar] [CrossRef] [Scilit]
- Hendrickson, E.; Minor, E.C.; Schreiner, K. Microplastic Abundance and Composition in Western Lake Superior As Determined via Microscopy, Pyr-GC/MS, and FTIR. Environ. Sci. Technol. 2018, 52, 1787–1796. [Google Scholar] [CrossRef] [Scilit] [PubMed]
- Zhao, S.; Wang, T.; Zhu, L.; Xu, P.; Wang, X.; Gao, L.; Li, D. Analysis of suspended microplastics in the Changjiang Estuary: Implications for riverine plastic load to the ocean. Water Res. 2019, 161, 560–569. [Google Scholar] [CrossRef] [Scilit] [PubMed]
- Miller, R.Z.; Watts, A.J.R.; Winslow, B.O.; Galloway, T.S.; Barrows, A.P.W. Mountains to the sea: River study of plastic and non-plastic microfiber pollution in the northeast USA. Mar. Pollut. Bull. 2017, 124, 245–251. [Google Scholar] [CrossRef] [Scilit] [PubMed]
- Wang, W.; Wang, J. Investigation of microplastics in aquatic environments: An overview of the methods used, from field sampling to laboratory analysis. Trends Anal. Chem 2018, 108, 195–202. [Google Scholar] [CrossRef] [Scilit]
- Cantwell, H. (Ed.) Blanks in Method Validation—Supplement to Eurachem Guide the Fitness for Purpose of Analytical Methods, 1st ed.; Eurachem, 2019; Available online: https://www.eurachem.org/index.php/publications/guides/blanks-in-method-validation (accessed on 10 May 2010).
- Kataoka, T.; Nihei, Y.; Kudou, K.; Hinata, H. Assessment of the sources and inflow processes of microplastics in the river environments of Japan. Environ. Pollut. 2019, 244, 958–965. [Google Scholar] [CrossRef] [Scilit] [PubMed]
- Lefebvre, C.; Saraux, C.; Heitz, O.; Nowaczyk, A.; Bonnet, D. Microplastics FTIR characterisation and distribution in the water column and digestive tracts of small pelagic fish in the Gulf of Lions. Mar. Pollut. Bull. 2019, 142, 510–519. [Google Scholar] [CrossRef] [Scilit] [PubMed]
- Koelmans, A.A.; Mohamed Nor, N.H.; Hermsen, E.; Kooi, M.; Mintenig, S.M.; De France, J. Microplastics in freshwaters and drinking water: Critical review and assessment of data quality. Water Res. 2019, 155, 410–422. [Google Scholar] [CrossRef] [Scilit]
- De Haan, W.P.; Sanchez-Vidal, A.; Canals, M. Floating microplastics and aggregate formation in the Western Mediterranean Sea. Mar. Pollut. Bull. 2019, 140, 523–535. [Google Scholar] [CrossRef] [Scilit] [PubMed]
Publisher’s Note: MDPI stays neutral with regard to jurisdictional claims in published maps and institutional affiliations. |
© 2021 by the authors. Licensee MDPI, Basel, Switzerland. This article is an open access article distributed under the terms and conditions of the Creative Commons Attribution (CC BY) license (https://creativecommons.org/licenses/by/4.0/).