Abstract
In the modern era, characterized by intense urbanization and frequent travel between interconnected communities, the constant expansion of cities, associated with high densities and growing need for traveling, has led to a significant increase in road traffic volumes. More than ever, road traffic today requires effort to be managed effectively in order to improve performance and safety conditions, given the greater probability of unpleasant events such as accidents or road congestion with related delays and the increased stress levels of the user and infrastructure. Fortunately, there are already various engineering tools, such as ramp metering, that can be used for this purpose. Ramp metering allows for achieving the aforementioned desired benefits, including improving mobility, reliability, efficiency, and safety, and even reducing environmental impact. It also has been shown to be cost-effective from the existing literature. Further research will be necessary to strengthen the quality, efficacy, and efficiency of ramp metering, especially considering the fast-paced progress in technology (e.g., connected autonomous vehicles and drones used for surveys) and new challenging scenarios (e.g., congested industrial areas and emergency vehicles). This review’s scope is to present a general overview of principal ramp metering solutions, focusing on current research studies in the last couple of years and highlighting some of the main algorithms used for this purpose, depending on diverse scenarios. With this article, the authors desire to present the subject of ramp metering, providing a general overview of its story, evolution, and recent analytical models.
1. Introduction
Vehicles attempting to access a busy freeway via an entry ramp might experience difficulty merging into traffic, struggling to find a gap between other drivers in the mainstream due to intense traffic volumes. When this happens, vehicles tend to line up behind the stop line on the ramp, forming a queue and waiting until the first user in the queue can move forward and enter the freeway. Subsequent users may still have to wait on the stop line until they too find a gap to access. This circumstance is a cause of congestion with all the related consequences, such as delays, decreased driving comfort levels, and a higher risk of accidents. Ramp meters are traffic signals installed on freeway ramps to control the frequency at which vehicles enter the flow of traffic [1]. The primary approach today consists of a combined system of traffic lights (on-ramps) connected with traffic sensors placed on the roadway (both on the freeway and the ramp) as showed in scheme in Figure 1. These traffic lights operate according to the intensity of the mainstream of traffic, signaling the ramp user when it is the right moment to enter the freeway. These specific traffic lights can be similar to standard ones (as in the Netherlands, where the background color of lights is yellow instead of black), although more often they will adopt exceptional cases and use just red and green lights. When amber is used, its duration after green is very brief, consisting of rapid flashes before transitioning to red.

Figure 1.
Ramp metering scheme for a generic site, Highway Agency, UK [2].
Ramp meter systems are regulated by control algorithms using traffic-related input parameters, such as traffic flow density, vehicle speed, travel times, and crash and accident records to name a few. Many available algorithms have already been described in the literature, and some will be described in this paper. The benefits of ramp metering consist of a general improvement of mobility, reliability, efficiency, and safety, reducing congestion (i.e., increasing traffic speed and volume) by breaking up the platoons of cars on on-ramps and reducing demand. Even the environmental impact is reduced; the Federal Highway Administration of the U.S. Department of Transportation reports, for instance, that “Minneapolis identified a net annual savings of 1160 tons of emissions” and “Other simulation analysis shows ramp metering to be effective in reducing CO emissions by 1195 t per year” [1]. From the same study, in terms of cost–benefit analysis, “the measured benefits of implementing ramp metering systems can outweigh the associated costs by a ratio of 15 to 1, […] excellent for transportation improvements” [1].
The principal threats to the adoption of ramp metering are usually of a technical or financial nature, one being, for instance, the complexity of computer simulations and algorithms and another being the required funding for application. Besides that, further constraints may also arise due to political and bureaucratic aspects. Gathering support from the public might constitute a challenge as well. This article aims to offer a general overview of ramp metering, introducing its history briefly, describing the main engineering principles and algorithms, and proposing further considerations. The authors have selected and cited several articles considered by them to be representative for covering the subject on a general basis, focusing on research studies carried out over the last couple of years to describe some of the most recent algorithms and ramp metering models. Articles were chosen to cover the main aspects of ramp metering, presenting different types of approaches (e.g., fixed time and local control), introducing some of the commonly used computer algorithms (e.g., Asservissement Linéaire d’Entrée Autoroutière (ALINEA)) and software (e.g., VISSIM), reporting traffic-related key performance indicators (KPIs) for comparison, and showing how ramp metering can be applied to different scenarios (e.g., geography, public transport, and automated vehicles). With this article, the authors wish to contribute to ramp metering by providing knowledge about its general aspects and showing the main benefits of ramp metering, in the hope that it will spark new ideas for future research.
2. Background
The first form of ramp metering consisted of a police officer manually directing the traffic flow from a ramp on the Eisenhower Expressway in Chicago, and it was deployed in the early 1960s. Ramp metering then spread on an experimental basis to other major cities in the United States (e.g., Detroit, Los Angeles, and Minneapolis–St. Paul) and became more and more tested and advanced. It eventually began to also be adopted in Europe and Oceania. Ramp metering began spreading in Europe during the 1980s, when the UK installed it first on the M6 near Walsall (later updated) in 1986. The Netherlands introduced ramp metering in Amsterdam in 1989, and it then spread to other cities like Rotterdam and Utrecht, and Paris (Figure 2) with more recent projects like the Praktijkproef Amsterdam started in 2013. In Germany, ramp metering can be found on the Autobahn around Hamburg, Munich, and several other areas in the Rhine-Ruhr region. In Europe, international research on the subject has been encouraged in the last two decades, with dedicated funding for projects like the Network of Excellence for Advanced Road Cooperative Traffic Management in the Information Society (NEARCTIS) and the European Ramp Metering Project (EURAMP).

Figure 2.
Ramp metering deployment on Paris peri-urban motorways (AA2 Action, France) [3].
In Australia, this technology is widely used in Melbourne. The first form of similar traffic management was deployed in 1971, evolving into more recent solutions like integration with the Sydney Coordination Adaptive Traffic System (SCATS) [4]. Ramp metering eventually landed in New Zealand in the early 1980s, being gradually implemented over the years and representing the most extensive ramp metering system in the Southern Hemisphere [5]. The application of ramp metering to diverse cities and countries has significantly contributed to the evolution of this technology, as adaptation to the diverse city layouts and road setups across the globe is generally necessary (the differences between American metropolises and European cities, with their different road systems and extensions, immediately come to mind). Many research projects revolve around elaborating and improving algorithms, some of which will be reviewed in the following chapters.
Despite the benefits of ramp metering, its diffusion is often hindered by various kinds of challenges. Agencies commonly complain about the lack of political and financial support; the financial aspects include the costs for installation and maintenance, which includes staff training. Moreover, funding requests might compete with other projects having higher priority. Feasibility studies followed by cost–benefit analysis and performance metrics can demonstrate these systems’ economic validity, proving the advantages they can bring while reducing the expenses caused by their absence (e.g., costs related to accidents and freeway queues). Other local agencies (including the public) might contend the application of ramp metering due to a negative perception arising from a lack of both technical knowledge and awareness of the benefits. Implementing communication plans and information campaigns can be effective solutions, helping to gather consent and let the public get familiar with ramp meters. The geometry of existing ramps, in many cases, is not immediately compatible with ramp metering. It will not allow for easy installation, with common problems being inadequate acceleration lengths, ramps being too short or too close to each other, and visibility problems related to limited sight distances (vertical and horizontal spotting sights). If funding for infrastructure improvement schemes is available, this could represent an excellent opportunity to update the most strategically appropriate ramps with refurbishment and modernization work. Where this is not possible—or can be performed in conjunction—research for new solutions and technical approaches to be implemented should be done.
3. General Technical Aspects
The first ramp metering strategy consisted of a policeman directing traffic on a ramp to a freeway. Nowadays, ramp metering commonly means a set of technological systems that rely on electronics and are aimed to facilitate lane entries on freeways, optimizing the timing between ramp users and freeway mainstream traffic. Some typical, essential components constitute ramp metering systems, such as signal heads, detectors, and signage. Signal heads are the heads of traffic lights with colored lights, and they can be two-section or three-section signal heads, depending on the presence of the amber light. Detectors are tools, usually sensors, aimed at monitoring vehicles’ positions and movements, detecting the presence of a vehicle positioned at the stop line, and monitoring the queue length on a ramp or the traffic flow of the mainstream. Road signage consists of road signs to assist drivers in their operations. Signs may vary according to national regulations, but the general good practice and logic behind them are to safely communicate information and instructions to drivers soon enough to allow prompt reactions. In this case, road signs should be placed at least at the beginning of the ramp and near the signal head, including perhaps adaptive screens or warning lights.
Furthermore, the three primary types of control strategies are fixed time, local control, and system-wide control, and they are defined as follows:
- Fixed Time: This is the easiest to be implemented, as it does not depend on traffic detection. On the other hand, due to its static nature, it is a relatively rigid approach and cannot adapt to real-time variations in traffic flow and roadway conditions;
- Traffic Responsive: The control parameters are established in relation to the collected real-time data. However, such a method can occur only in specific time intervals during the day due to management or policy reasons;
- Local Control: This approach considers the traffic flow intensity, thanks to the monitoring sensors (which can be of various types) installed on the freeway and ramp. It focuses on a defined (local) area, and as it considers traffic variations, it can adjust and regulate itself, depending on the traffic flow, in real time. Its application is relatively simple, but it usually focuses on a ramp and its nearby area and ignores other nearby ramps’ influence;
- System-Wide Control: This is similar to local control, but on a larger scale and for a broader system. If local control generally focuses on a ramp and its primary junction point on the freeway, system-wide control also takes into consideration adjacent ramps and a broader range of traffic flow across the freeway. The combined use of these two control methods allows, for instance, that if the system-wide control is offline or malfunctioning, it is possible to rely on local control as a backup measure. The advantage of this approach is that it is traffic responsive and can work toward freeway facility optimization. The disadvantage is that it can become very complex and expensive to implement and maintain as reported in Table 1 [6].
 Table 1. Comparison of control strategy types [6].
Modern systems rely on electronics and are fundamentally based on the interconnection between traffic lights installed on on-ramps and road sensors placed on on-ramps and the freeway. This interaction is regulated through sophisticated algorithms that consider the characteristic parameters of road transport, such as traffic intensity and vehicle speed. These algorithms exploit the control theory, which will not be discussed in detail in this paper. The best-fitting algorithm can be selected according to the outputs of computer-based simulations and available data sets, wisely adapted to model and recreate a given scenario. This approach can be time-consuming and possibly expensive. However, it is relatively customizable and adaptable, and as technology becomes more refined by time (e.g., machine learning), it gives them hope of getting more and more accurate results. As one can imagine, these algorithms’ typical input parameters are road traffic-related and typically include traffic volumes, vehicle speeds, travel times, crash and accident records, and even roadway inventory, to name a few.
Besides that, it is also understandable that the larger the database available, the better the modeling and simulation results will be and, therefore, the more accurate the control algorithms that will be selected. Volume data is collected in the form of video or loop detection along the ramp and on the freeway mainline upstream and downstream of the ramp. Furthermore, data analysis should be performed both before and after the installation of ramp meters. In general, the classification of ramp metering strategies and algorithms can be done according to several aspects: the extension of the interesting area (i.e., number of operating lanes), the number of vehicles to pull onto the freeway for each cycle, and the type of road connection (freeway-to-freeway). Ramp metering methods can be classified into two primary categories: fixed time control and traffic flow responsive control. Fixed time ramp metering methods consider historical traffic information to determine the metering rates and establish the rates on a time-of-day basis [7]. These methods seem to be more reliable in steady traffic flow conditions. Papageorgiou and Kotsialos [8] provided a comprehensive classification for ramp metering methods, reported below in Figure 3. ALINEA (Asservissement Linéaire d’Entrée Autoroutière), METALINE, and AMOC (Advanced Motorway Optimal Control), as well as the others shown on the chart below, are algorithms for determining metering rates.

Figure 3.
Ramp metering algorithm classification proposed by Papageorgiou and Kotsialos [8].
A comparative paper focusing on Australasia ramp meters was presented by Amini et al. [9], considering state-of-the-art coordinated systems within a network-wide environment. The paper offers many insights and an overview of some technical aspects, including a summary of the foci of Ramp Metering evaluation studies and the relative algorithms in various world areas. ALINEA (Asservissement Linéaire d’Entrée Autoroutière) is a local control type of algorithm, probably one if not the most popular, being widely applied within ramp metering studies. We suggest reading “ALINEA: A local feedback control law for on-ramp metering” [10], written by M. Papageorgiou et al., to get an understanding of this system. In their work “A Ramp Metering Method Based on Congestion Status in the Urban Freeway” [11], Zhi Liu et al. focused on the concept of critical occupancy due to its difficulty to obtain and the low accuracy of the results. Consider the scheme reported in Figure 4.

Figure 4.
Scheme of an on-ramp control layout [11].
As reported in [11], the control rate can be calculated normally with ALINEA through Equation (1):
where R(k) is the ramp metering rate related to the kth cycle; is the regulator parameter, usually determined according to empirical value; is the occupancy downstream from the flow–occupancy chart, measured when the flow is equal to the capacity; and O(k − 1) is the actual measured occupancy value of the k − 1th cycle detector.
The authors have proposed an updated version of the algorithm and called it CS-ALINEA, which uses the traffic flow instead of the occupancy as the control parameter, while the control rate can be selected according to the congestion status and reclassified adaptively. This way, the control rate for Equation (2) will be
where R’(k) is the control rate obtained with CS-ALINEA; L’ is the cumulative queue length; L1 is the critical queue length; KF is the regulator parameter; is the mainstream’s expected saturated flow; is the flow from upstream the ramp to downstream in the k − 1 cycle; µ is the vehicle headway on the ramp queuing; and λ is the number of lanes on the ramp.
This study also adopted the segmented control method to consider the impact of ramp overflow on ground road traffic, adjusting the signal timing scheme by selecting the control rate to avoid ramp overflow. Ramp control was simulated with the SUMO (Simulation of Urban Mobility) platform, which allowed for obtaining an intermodal traffic model of all vehicles and pedestrians, in addition to other tools for emission estimation, which was also used here to test the algorithm. The adopted car-following model was the intelligent driver model, and the selected parameters were among those types of road transportation, such as speed, acceleration, minimum distance, response time, and vehicle length. The results confirmed that this method can optimize the ramp queuing length and reduce vehicle waiting times, still guaranteeing the urban freeway’s efficiency. The results are reported below in Table 2, where it is possible to see that the mainstream’s travel time was reduced with the algorithm’s implementation, corresponding to an increase in ramp waiting time and average queue length, as well as improved mainstream average traffic throughout.
Table 2.
Four indicators at different control schemes [11].
The ramp waiting time and average queue length values for the no-signal scenario were 0 because vehicles, in this case, had no restrictions for entering the ramp; therefore, they merged in the mainstream without any waiting time and without forming queues on the ramp. At first glance, the fact that there were no queues and the waiting time was null on the ramp might induce one to think of a better mainstream. However, it must be noted how the related mainstream travel time was visibly higher, and the mainstream average traffic throughout was higher than in other scenarios, showing that the mainstream traffic performance was improved with the application of the chosen algorithms.
Dadashzadeh and Ergun [12] have studied the combination of ALINEA with another merging congestion strategy: variable speed limits (VSLs). They analyzed the case of high volumes of bus transportation on the Istanbul Metrobus lane through a microscopic simulation with VISSIM and its vehicle actuated programming (VAP) feature called VisVAP. VISSIM is a widely used piece of simulation software oriented toward modelling and making forecasts on road traffic and studying ramp metering. Compared with the existing VSL+ALINEA model, this method offers improved average delays of mixed traffic and buses, fuel consumption, emissions, and average speeds, in addition to boosting bottlenecks. For instance, analysis of the results highlighted that the application of this algorithm produced a reduction of the total travel time, an increase in bottleneck throughput, and a decrease of average vehicle delays and some stops. Detailed tables with performance results are available for the study, with an excerpt of these results reported below in Table 3 and Table 4, where it is also interesting to note how ramp metering brought benefits under the environmental aspect, helping by reducing polluting emissions.
Table 3.
Average vehicle delays and stops across the examined scenarios [12].
Table 4.
Fuel consumption and emissions across the examined scenarios [12].
Indeed, although algorithms are a useful tool to facilitate the computational process, the implementation of road infrastructures often requires a study in the design phase that gives higher certainties on future impacts. In this regard, simulation software like VISSIM is helpful to carry out forecasting processes. Another exciting example of VISSIM application is the research study carried out by Mitkas and Politis [13].
The environment of analysis was a complex interchange at the Thessaloniki Ring Road in Greece. The authors surveyed traffic volumes via a drone (DJI Phantom 4) and then developed a model with VISSIM, analyzing several different scenarios including an increase of traffic volumes with and without ramp metering (i.e., traffic signals (fixed time and vehicle actuated). These were modeled thanks to VISSIM, as mentioned above, with an add-on called VisVAP. This procedure eventually led to the production of a flowchart, which was then used to program and activate the ramp’s signal light. Finally, the results produced from the scenarios were examined, and the KPIs (chosen to assess performance) were collected for a general evaluation, proving that ramp metering effectively brought to road traffic the many benefits reviewed so far in this article. The examined KPIs were the total travel time, average vehicle speed in entrance, average vehicle speed in exit, and level of service. A comparison between the selected KPIs led to these conclusions:
- The total travel time, measured in seconds, was longer after the traffic volume was increased (as expected) and then reduced once ramp metering was implemented;
- The average vehicle speed in entrance did not show relevant differences, due to this speed being measured before the ramp–freeway merging point from vehicles affected only by the mainstream;
- The average vehicle speed in exit showed a significant reduction in correspondence with traffic incrementation across the various scenarios. The difference between the exit and entrance speeds was reduced by a significant estimate of 35%, due to vehicles merging from the ramp into the mainstream and to a steeper road slope. When the presence of ramp metering was considered, the average vehicle speed in exit was higher, but still significantly lower (by about 30%) when compared with the average speed in entrance;
- The levels of service obtained from the simulation were A, B, C, and E, depending on the scenario. In particular, for one of the scenarios where the obtained level was E, the authors decided to drop it to F because the network was completely saturated, and eventually a large amount of entering vehicles could not complete their travel. (In fact, it seems that this collapsing network behavior could actually be seen for all the KPIs) The implementation of ramp metering again brought improvements to the network.
It is interesting to see that the model was evaluated for accuracy by comparing the simulated traffic with the actual measured data, using a particular statistical index called GEH (from the initials of its inventor, Geoffrey E. Havers), used in the traffic industry to compare two sets of traffic load:
where M is the modeled hourly traffic volumes and C is the measured hourly traffic volumes.
If more than 85% of the GEH is less than 5, then the simulation was correct. The values of the GEH obtained in this study ranged between 0.050 and 0.872, depending on the analyzed road axis. Therefore, the simulation could be considered accurate. The authors also compared the measured and modeled travel times (from 10 simulation runs) for a predetermined distance, finding that the deviation was less than 5% and, therefore, demonstrated their model’s reliability. This situation has also been graphically represented in the chart reported in Figure 5 below.
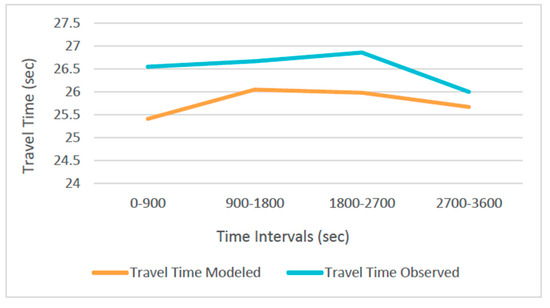
Figure 5.
Deviation between the modeled and measured travel times [13].
In conclusion, it was proven once again how the deployment of ramp metering had positive effects on road traffic conditions. Oskarbski and Zarski [14] also used VISSIM; their work was aimed to assess the impact of intelligent transport systems (ITSs) like ramp meters on the road networks adjacent to freeways and motorways, concerning traffic safety and efficiency, through the use of macroscopic, mesoscopic, and microscopic models and with the comparison of several related KPIs. The adopted simulation models and software were VISUM for the macroscopic level (to gather data related to traffic distribution), Saturn for the mesoscopic level, and VISSIM for the microscopic level (these last two were used to perform detailed analysis). It is interesting to note that ALINEA was the algorithm used to model the ramp metering system with a Python script.
This study also considered different scenarios, according to the presence or absence of ramp metering in the simulation, and the case of a variable speed limit and the presence of road accidents. The selected KPIs were travel time reliability (average delays/vehicle), the smoothness of traffic flow in the road network, travel time reliability on the significant road, and efficient traffic control. The analytical results demonstrated that the deployment of ramp meters had a more significant impact in the case of high traffic volumes (above 1700 veh/h/lane) and performed well if associated with other ITSs for average traffic (around 1010 veh/h/lane). In the case of low traffic volumes, other ITSs may be more suitable. Another example of VISSIM utilization can be found in a research study produced by Abu-Bakr et al. [15], who evaluated the effects of ramp metering on three critical on-ramp sites in an urban expressway in the Greater Cairo region (GCR).
The model was calibrated with data collected during peak periods, and three strategies were considered: fixed time, actuated control, and no control at all. The parameters used for calibration included maximum decelerations, minimum headways, and the safety distance reduction factor. Occupancy rates, obtained from installed sensors on both the mainstream and the on-ramps in correspondence with the upstream and merging points, were used as parameters when performing the actual control scenario design. Specifically, the adopted parameters for this scenario were the cycle update, mainline critical occupancy, and on-ramp critical occupancy. The chosen KPIs for comparison were the average speed, average vehicle delay, and on-ramp queue length. The GEH index was calculated, and since all its values in this study were lower than 5, the simulation could be considered correct, and the model, therefore, resulted in being well-calibrated and reliable. As could be expected, the implementation of ramp metering brought benefits to the simulated traffic flow, improving safety and efficiency conditions, with a visible increase of system speeds and a reduction of vehicle delays. As an example of the obtained findings, Table 5 below reports the performance results for the actuated signal strategy applied to one of the three analyzed sites (site n.2, the Abdel-Monem Riyadh on-ramp).
Table 5.
Performance results for the fixed signal timing scenario at site-2 [15].
Several other authors have researched other different strategies. The model developed by Yu Han et al. [16] operated on two levels of control. An upper level was designed with a model predictive control (MPC) approach and considered the total traffic flow entering the freeway network via ramps in order to optimize the total network travel time. The lower level was instead designed to distribute the optimal total inflow to each ramp of the freeway, according to the feedback of local traffic conditions. The MPC approach has become more refined across the last few decades and includes a prediction model that can forecast the evolution of traffic dynamics and estimate the optimal control scheme for a specific given period. A well-conducted predictive analysis allows for making cost-effective decisions. Hence, at the upper level, the total traffic flow from ramps to the freeway is optimized through the MPC model, and traffic accessing a stretch of freeway is forecasted via a proposed macroscopic fundamental diagram (MFD) model. In contrast, the optimal total inflow is re-distributed to ramps at the lower level, according to the received feedback on local traffic. This control method was also tested with different models, such as CTM (cell transmission model) and METANET, and compared with other similar approaches. Its results have been shown to achieve desirable performance in reducing vehicles’ overall times. The authors also presented two case studies, the first where an extended CTM was used as the process model and the second using METANET instead. An extract of the obtained results is reported below in Table 6.
Table 6.
An example of the performance values obtained with several control scenarios [16].
A METANET-based macroscopic traffic model was also adopted by Wang and Niu [17] as a forecasting model, along with microsimulation tests performed with VISSIM and Visual C++ for the evaluation and comparison of different scenarios, considering both isolated and integrated cases for ramp metering and a variable speed limit (VSL). The study’s site was the section of an urban corridor named Whitemud Drive (WMD) in Edmonton, Canada (Figure 6). The microsimulation setup flowchart is also reported below in Figure 7.
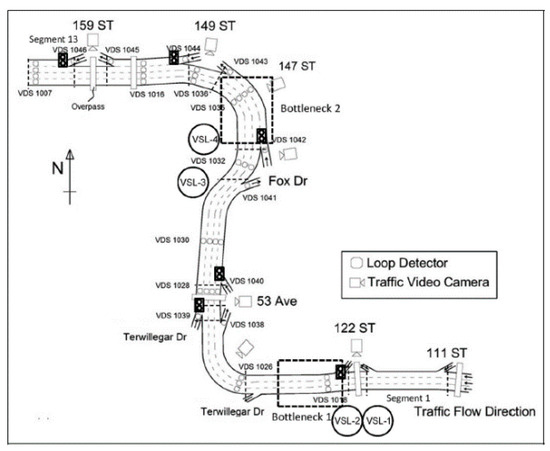
Figure 6.
Layout of the study corridor (Whitemud Drive, Edmonton, Canada) [17].
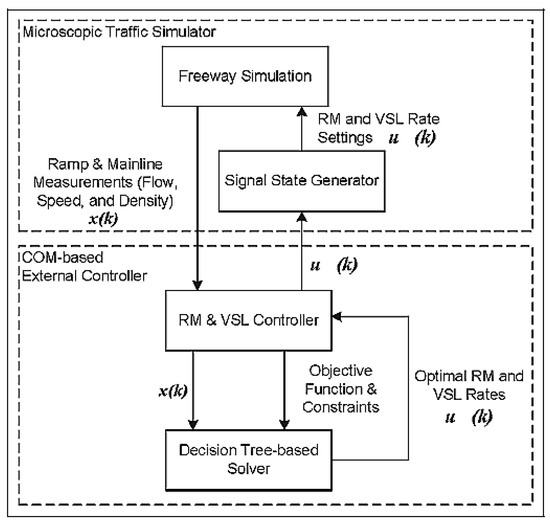
Figure 7.
Simulation setup [17].
The authors examined the problem of bottlenecks arising during peak periods, caused by excessive demand from both ramps and mainstream traffic, and reported three main conclusions:
- A proactive use of ramp metering and VSLs significantly improves freeway mobility;
- The control performances between ramp metering and VSLs within the same demand scenario are different, suggesting that ramp metering may help alleviate the congestion caused by on-ramp flows, whereas VSLs fit better when controlling the mainstream traffic flow, bringing a greater level of benefit in this case;
- In the case of the integrated use of ramp metering and VSLs, the former reacts first, and the latter takes control as the demand grows. The two control systems work together during the highest congestion level, and ramp metering is deactivated in the case of a long ramp queue. Finally, when congestion is over, ramp metering is activated occasionally to manage the last strains of traffic.
Another research study on ramp metering was published in October 2020 by Xiaobo Ma et al. [18]. The study highlighted the lack of knowledge about data requirements (i.e., referring to the data collection duration for users’ accommodation times (to become acquainted with the new circumstance)) and evaluation times. The proposed approach was statistical and non-parametric, and the model accuracy was not affected by data distribution and random variables. For the extent of the data required for assessment, the authors’ case study considered three active ramps on State Route 51 of the Phoenix metropolitan area (Arizona, USA), as the Arizona Department of Transportation (ADOT) was switching from a fixed time strategy to a responsive ramp control strategy. From the results, and for this particular case study, the authors found that two months of data should be collected to possess enough information for ramp metering assessment (Table 7).
Table 7.
Minimum amount of data for ramp metering evaluation [18].
As ramp meters work with the help of algorithms, this also happens with automated vehicles, a technology that is expected to become more and more widespread in everyday life. The interactivity between ramp metering and automated vehicles has been covered recently by Tajdari et al. [19], specifically regarding the integration between lane changing and ramp metering. Based on a simplified traffic flow model and formulated as a linear quadratic integral regulator, a feedback controller is intended to optimize traffic flows in motorway bottlenecks. The feedback controller’s optimal setpoints are processed by an extremum seeking algorithm introduced by the authors. This method is evaluated through simulation with a macroscopic, multi-lane model that considers the capacity drop effect. The final result is a methodology that permits efficient integrated control between the lane-changing and ramp metering technologies.
This solution does not require excessive computational effort, as its parameters are insensitive to the selected parameters and therefore easily applicable without resource-consuming calibration processes. The study also offers many interesting insights for future research by mentioning, for example, micro-simulation, incorporation into a larger picture within mainstream control strategies altogether with VSL or multiple bottlenecks, or extending the research to more complex networks. Table 8 represents the total time spent across the various examined scenarios, along with the total number of lane changes, according to the penetration rate η (expressed as a percentage; a value of η = 100% corresponds to 100% connected and automated vehicles).
Table 8.
Total time spent (TTS) and TNLC (total number lane change) across different scenarios [19].
Yongheng Chen et al. analyzed the behavior of “Coordinated Ramp Metering Based on Real-Time OD Information” [20]. With the advancement of Internet of Vehicles (IoV) technology, information about the origin–destination of vehicles will become available in real time shortly. By using a system of real-time OD (origin destination) traffic flow information together with sets of coordinated ramp metering (CRM), it will be possible eventually to develop a new strategy in order to reduce the total travel time and bottleneck breakdowns on freeways during rush hour. Starting from a quantitative hierarchical model (QHM) algorithm, the authors determined the flow priorities according to real-time OD information and developed a new algorithm called OD-QHM. This algorithm prioritizes on-ramps with short total travel distances. The results obtained from simulation analysis confirmed this algorithm’s validity and stability. Additionally, a comparison between the non-control case and the ALINEA algorithm application was carried out. Table 9 reports some network performance indicators returned by the OD-QHM algorithm.
Table 9.
Overview of network performance indicators. Conditions (a), (b,) and (c) refer to 0.5×, 1.0×, and 1.5× flow, respectively [20].
4. Economical Aspects and Critical Issues
As shown above, ramp metering represents an efficient technique that, with minimum economic impact, can affect a traffic volume management strategy positively on the freeway so that general traffic flow can occur without creating disease in minor roadways [21]. However, like any other engineering artifact, it is necessary to analyze the economic aspects deeply. Two main phases are fundamental: deployment and maintenance. From an economic point of view, they represent the immediate impact. The main obstacle of ramp metering system implementation regards the institution’s interests. With recent innovations, such as autonomous vehicles and smart cars [22], they are more likely to allocate funds to other transportation infrastructure upgrades concerning smart roads environments (SREs) [23] and intelligent transportation systems (ITSs), considering that future perspectives of communities are leading to the gradual implementation of smart cities [24]. Therefore, necessary investments for ramp metering deployment are first subjected to an in-depth analysis of the art’s context state and where it will be implemented. Of course, the analysis of traffic flow will be fundamental. However, it will not represent the main aspects, considering that ramp metering proposal congestion phenomena and capacities would have been detected. Ultimately, the investment quantity will be linked to the required adaptions of existing ramps being subjected to queues and platoons more frequently. It is possible to provide a piece of general information about investment and cost levels concerning ramp metering approaches and the control strategies discussed in Section 3, shown in Figure 8, and based on [25] if the expected investments levels are low, medium, or high and if the cost types are affected.
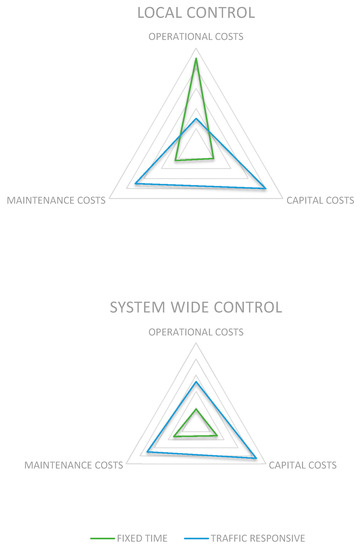
Figure 8.
General comparison of control strategy cost levels [25].
5. Discussion
In the last sixty years, ramp metering has evolved from a mere punctual traffic management intervention, with a single person directing traffic for on-ramps, to sophisticated analytical strategies capable of intercrossing with complex systems and embracing large freeway networks with multiple ramps. Moreover, consider its benefits in terms of traffic flow quality with consequent lower emissions, where the latter represents a feature that comprises all fields of the transport sector [26]. Computer engineering has allowed the modeling and simulation of realistic scenarios [27,28], permitting us to collect data, make predictions, and adjust the models to diverse circumstances. Mathematical algorithms have been coded into computer models, whose simulation accuracy and performance are improving day by day thanks to progress in the IT field and the continuous and eager research work of transportation specialists.
Technology is evolving so quickly that new inventions are introduced to the public at a relatively fast pace, challenging researchers to rapidly develop up-to-date systems to adapt and improve users’ quality of life. An example is the introduction of the Internet of Things (IoT) and Internet of Vehicles (IoV), which eventually will lead to the widespread everyday use of automated vehicles. As a consequence, many of the studied models might have to be updated, taking this new technology into consideration because its diffusion will cause an inevitable impact on traffic as we know it today [29,30]. If this circumstance might appear frightening and uncanny at first, especially to the less tech-savvy members of the public, it is instead an exciting opportunity to develop challenging future research studies on the subject and improve people’s quality of life. Research could focus, for instance, on autonomous vehicles, but also on the improvement of the algorithm when more powerful computers are available or using new technology such as drones to survey existing traffic. Faster Internet connections will allow a more rapid data exchange in real time between vehicles and infrastructure, allowing users to get real-time information on their vehicles. Public transport may become more popular and used more often, leading to the need for related ramp metering models [31,32].
An exciting subject might be how emergency vehicles, such as ambulances or fire engines, affect ramp metering operations and affect mainstream traffic in the case of an emergency run. Another interesting scenario to investigate could be the behavior of ramp metering applied on freeways in industrial areas, perhaps in road networks close to industrial seaports, where heavy vehicle traffic (typically container trucks) can be significant. A reduction of travel times leads to quicker deliveries and cost optimization. On the other hand, having queues of heavy trucks might be threatening in terms of pollution. Concerning environmental aspects, it could be interesting to see what the impact and possible improvement are in terms of energy, such as whether it is worth it to implement solar panels as local electricity sources, or comparing the fuel usage for trucks on a ramp queue with ramp metering, in comparison with a free flow scenario. Finally, ramp geometry could be studied to achieve optimized results in synergy with ramp metering. Research can also contribute by providing and improving useful recommendations to the involved stakeholders.
Good practice can include the multidisciplinary and combined engagement of all the stakeholders, with the cooperation of technicians, members of the public, and local authorities’ staff, to name a few, holding regular meetings and doing research alongside universities, for example. Authorities such as councils or highway agencies can face opposition from members of the public or even from other authorities (and vice versa), usually due to political circumstances, cost-related matters, or just opposition arising from a lack of knowledge. In this case, a suggestion could be to prepare and enforce an effective communication plan, aimed at illustrating the benefits brought by ramp metering to the community and transport network, displaying the achieved benefits in terms of costs, environment, and life quality, reporting the cost–benefit analysis or other technical studies.
Authorities should adapt the contents and communication style depending on the targeted audience. Getting too technical with members of the public might result in obtaining an opposite reaction than the one desired, whereas it is suggested to adopt a more technical approach when dealing, for instance, with the technical office of a highway agency. A sufficient amount of dedicated literature should be made available to members of the public so that, in case of a new ramp metering proposal, they can be able to investigate and see the benefits introduced by this technology. The primary focus should be on life quality, safety, cost and time reduction, and the environment. Moreover, authorities might also be interested in technical costs, asset capitalization, and achieving company objectives, so the focus should also revolve around these aspects. In any case, all the information should be presented scientifically and professionally, using reliable data analysis and precise and scientific performance metrics (for instance, the KPIs mentioned in this review). It is strongly recommended to research and develop new systems whenever the funds, time, and political support are available and sufficient. In case of scarcity of funds or tight deadlines, one might be tempted to adopt and apply existing ramp metering schemes to similar scenarios. Even if an existing scheme can be tailored to a custom setup, it is still recommended to justify any technical choice scientifically and demonstrate the following benefits.
Another recommendation is to hire and train professional staff with the required skills to implement and manage ramp metering, covering all its aspects from the design to the traffic management operations. This may range from the engineering departments involved in the design phase, to the maintenance staff for operations, to constabulary forces that have to operate on-site on freeways.
Ultimately, it is necessary to pay attention to simulation processes through the appropriate software mentioned in Section 3, as it is necessary to carry out a first phase of calibration of the model. Model calibration is a fundamental preliminary phase to start various simulation scenarios, since the parameters of traffic flows and behavioral models are established.
For example, regarding the VISSIM software, vehicle behavior is established on the basis of queue lengths, mainline speeds, and ramp metering signal status [33]. However, on the basis of some studies, the most appropriate software results would be from SUMO, due to the fact that it provides better traffic scenario visualization in addition to better merging behavior and the capability of carrying out multiple simulation instances in a parallel way [34,35]. Then, it has to be highlighted that SUMO also has several drawbacks, as it is not possible to carry out a model of lateral displacement within a lane or bottleneck formation because of vehicles with reduced speeds [36,37].
In conclusion, considering that calibrating a model can be a slow process, some studies developed quicker procedures based on evolutionary algorithms (EAs) and parallel computing techniques (PCTs) [38,39].
6. Conclusions
In this paper, the authors aimed to review a technique concerning traffic management on ramps, a critical point of every roadway network. Such a technique represents a valid intervention that can be implemented with significant cost savings, guaranteeing congestion phenomena reduction on freeways. Therefore, since it was applied for the first time in the early 1960s, technological innovation facilitated its operation and study.
The former can be easily carried out through intelligent transport systems (ITSs) and smart road environment (SRE) implementation. In describing various control strategies, several algorithms were analyzed, observing their applications and obtained results, mainly related to the ALINEA method. The benefits cited were mainly in terms of the average flow speed and safety. Therefore, the fundamental parameters to achieve a particular level of service (LOS) could predict such advantages through the simulation software’s forecasting process, as in VISSIM. Finally, ramp metering represents a valid technique from an economic point of view, considering that its implementation occurs mainly on existing roadways (especially freeways) that, for several reasons related to urbanization and the increasing number of vehicles, need to be upgraded or adapted for specific capacity performances.
This article aims to offer a general review of ramp metering, illustrating the main aspects of ramp metering and where it can be applied. Our wish is that if the main aspects are presented, this can be a starting point for new ideas and future research. Through the analysis of KPIs within a study, it can be seen how ramp metering introduces benefits to road networks. However, a comparison between the reported research studies is not always immediate, because they often consider diverse scenarios that are not easily comparable with each other (e.g., road geometry, public transport, and the methods of surveys). The design phase is often regulated by national regulations that may differ significantly, so we preferred to focus on the article’s review nature.
This circumstance could be an interesting idea for another article, focusing on the design aspect and the comparisons between different cases. The results from the examined studies show traffic benefits from ramp metering. This achievement can be seen through the analysis of performance parameters obtained with mathematical and computational models. With technology advancing rapidly, there will be new challenges for new methods to be developed and new scenarios to be studied.
Author Contributions
The authors contributed equally to this work. All authors have read and agreed to the published version of the manuscript.
Funding
This research received no external funding.
Institutional Review Board Statement
Not applicable.
Informed Consent Statement
Not applicable.
Acknowledgments
This work was related to the D.D. 407 of 27 February 2018 AIM—Attrazione e Mobilità Internazionale, issued by the Italian Ministry of Education, University, and Research in implementation of Action I.2 Mobilità dei Ricercatori Asse I—PON R&I 2014–2020, taking into account the written amendment procedure of the PON R&I 2014–2020, pursuant to articles 30 and 90 of Regulation (EU) 1303/2013 started on 21 February 2018, as well as the relevant implementation regulations.
Conflicts of Interest
The authors declare no conflict of interests.
References
- Mizuta, A.; Roberts, K.; Jacobsen, L.; Thompson, N.; Colyar, J. Ramp Metering: A Proven, Cost-Effective Operational Strategy—A Primer. U.S. Department of Transportation, Federal Highway Administration: 2014. Available online: https://rosap.ntl.bts.gov/view/dot/41501 (accessed on 13 January 2021).
- MCH 2470 issue B, Ramp Metering Technical Design Guidelines; Highways Agency: Surrey, UK, 2008.
- Arc Atlantique ITS Platform. Ramp Metering Deployment on Paris Peri-Urban Motorways. 2017. Available online: file:///C:/Users/MDPI/AppData/Local/Temp/Highlights_FR28%20ramp%20metering%20peri%20urban%20motorway.pdf (accessed on 13 January 2021).
- Johnson, F.; Bajenov, M. SCATS Ramp Metering-From North American origins to autonomous vehicle readiness. In Proceedings of the 25th ITS World Congress, Copenhagen, Denmark, 17–21 September 2018. [Google Scholar]
- Moyu, Z. Analysis of Current Dutch Traffic Management Effectiveness with Automated Vehicles: A Ramp-Metering Case Study—Simulation Study. Master’s Thesis, Delft University of Technology, Delft, The Netherlands, 2019. [Google Scholar]
- Bogenberger, K.; May, A. Advanced Coordinated Traffic Responsive Ramp Metering Strategies; Research Reports, Working Papers; Institute of Transportation Studies, UC Berkeley: Berkeley, CA, USA, 1999. [Google Scholar]
- Chu, L.; Liu, H.X.; Recker, W.; Zhang, H.M. Performance Evaluation of Adaptive Ramp-Metering Algorithms Using Microscopic Traffic Simulation Model. J. Transp. Eng. 2004, 130, 3. [Google Scholar] [CrossRef]
- Papageorgiou, M.; Kotsialos, A. Freeway ramp metering: An overview. IEEE Trans. Intell. Transp. Syst. 2002, 3, 271–281. [Google Scholar] [CrossRef]
- Amini, N.; Aydos, C.; Grzybowska, H.; Wijayaratna, K.P.; Dixit, V.; Waller, S.T. Network-Wide Evaluation of the State of the Art Coordinated Ramp Metering Systems. In Proceedings of the Transportation Research Board 95th Annual Meeting, Washington, DC, USA, 10–14 January 2016. [Google Scholar]
- Papageorgiou, M.; Haj-Salem, H.; Blosseville, J.M. ALINEA: A local feedback control law for on-ramp metering. Transp. Res. Rec. 1991, 1320, 58–67. [Google Scholar]
- Liu, Z.; Wu, Y.; Cao, S.; Zhu, L.; Shen, G. A Ramp Metering Method Based on Congestion Status in the Urban Freeway. IEEE Access 2020, 8, 76823–76831. [Google Scholar] [CrossRef]
- Dadashzadeh, N.; Ergun, M. An Integrated Variable Speed Limit and ALINEA Ramp Metering Model in the Presence of High Bus Volume. Sustainability. 2019, 11, 6326. [Google Scholar] [CrossRef]
- Mitkas, D.-Z.; Politis, I. Evaluation of alternative Ramp Metering scenarios on freeway on-ramp with the use of microscopic simulation software Vissim. Transp. Res. Procedia 2020, 45, 483–490. [Google Scholar] [CrossRef]
- Oskarbski, J.; Żarski, K. Methodology of research on the impact of ramp metering on the safety and efficiency of road traffic using transport models. In Proceedings of the 2019 6th International Conference on Models and Technologies for Intelligent Transportation Systems (MT-ITS), Cracow, Poland, 5–7 June 2019. [Google Scholar]
- Abu-Bakr, S.H.; Abdel-Latif, H.; El-Araby, K.; Shawky, M. Evaluation of Ramp Metering Control on Urban Expressway in Cairo. 2019. Available online: https://www.researchgate.net/publication/330729625_Evaluation_of_Ramp_Metering_Control_on_Urban_Expressway_in_Cairo (accessed on 13 January 2021).
- Han, Y.; Ramezani, M.; Hegyi, A.; Yuan, Y.; Hoogendoorn, S. Hierarchical ramp metering in freeways: An aggregated modeling and control approach. Transp. Res. Part C Emerg. Technol. 2020, 110, 1–19. [Google Scholar] [CrossRef]
- Wang, X.; Niu, L. Integrated variable speed limit and ramp metering control study on flow interaction between mainline and ramps. Adv. Mech. Eng. 2019, 11. [Google Scholar] [CrossRef]
- Ma, X.; Karimpour, A.; Wu, Y.-J. Statistical evaluation of data requirement for ramp metering performance assessment. Transp. Res. Part A Policy Pr. 2020, 141, 248–261. [Google Scholar] [CrossRef]
- Tajdari, F.; Roncoli, C.; Papageorgiou, M. Feedback-Based Ramp Metering and Lane-Changing Control with Connected and Automated Vehicles. IEEE Trans. Intell. Transp. Syst. 2020, 1–13. [Google Scholar] [CrossRef]
- Chen, Y.; Liu, F.; Bai, Q.; Tao, C.; Qi, X. Coordinated Ramp Metering Based on Real-Time OD Information. IEEE Access 2019, 7, 79233–79243. [Google Scholar] [CrossRef]
- Tawfeek, M.H.; El-Basyouny, K. Estimating traffic volume on minor roads at rural stop-controlled intersections using deep learning. Transp. Res. Rec. 2019, 2673, 108–116. [Google Scholar] [CrossRef]
- Arena, F.; Pau, G.; Severino, A. An Overview on the Current Status and Future Perspectives of Smart Cars. Infrastructures 2020, 5, 53. [Google Scholar] [CrossRef]
- Trubia, S.; Severino, A.; Curto, S.; Arena, F.; Pau, G. Smart Roads: An Overview of What Future Mobility Will Look Like. Infrastructures 2020, 5, 107. [Google Scholar] [CrossRef]
- Pau, G.; Severino, A.; Canale, A. Special issue “new perspectives in intelligent transportation systems and mobile communications towards a smart cities context”. Future Internet 2019, 11, 228. [Google Scholar] [CrossRef]
- Leslie, J.; Jason, S.; Lisa, N.; Doug, S. Ramp Management and Control Handbook; 2006. Available online: https://rosap.ntl.bts.gov/view/dot/4123 (accessed on 13 January 2021).
- Myamlin, S.; Neduzha, L.; Urbutis, Z. Research of Innovations of Diesel Locomotives and Bogies. Procedia Eng. 2016, 134, 469–474. [Google Scholar] [CrossRef][Green Version]
- Martin, G.; Edouard, I.; Sadko, M. Cooperative ramp metering simulation. In Proceedings of the 37th International Convention on Information and Communication Technology, Electronics and Microelectronics (MIPRO), Opatija, Croatia, 26–30 May 2014. [Google Scholar]
- Masroor, H.; Mithilesh, J.; Ben-Akiva, M. Evaluation of ramp control algorithms using microscopic traffic simulation. Transp. Res. Part C Emerg. Technol. 2002, 10, 229–256. [Google Scholar]
- Shehada, M.K.; Kondyli, A. Evaluation of Ramp Metering Impacts on Travel Time Reliability and Traffic Operations through Simulation. J. Adv. Transp. 2019, 2019, 8740158. [Google Scholar] [CrossRef]
- Saeed, G.; Anahita, S.; Zahra, M.; Kimia, T. A Novel Ramp Metering Approach Based on Machine Learning and Historical Data. Mach. Learn. Knowl. Extr. 2020, 2, 379–396. [Google Scholar]
- Sanandaji, A.; Ghanbartehrani, S.; Mokhtari, Z.; Tajik, K. A Novel Ramp Metering Approach Based on Machine Learning and Historical Data. arXiv 2020, arXiv:2005.13992. [Google Scholar]
- Lee, S.M.; Shokri, A.A.; Al-Mansour, A.I. Evaluation of the Applicability of the Ramp Metering to a Freeway Using Microsimulation: A Case Study in Riyadh, Saudi Arabia. Appl. Sci. 2019, 9, 4406. [Google Scholar] [CrossRef]
- Gregurić, M.; Ivanjko, E.; Mandžuka, S. The Use of Cooperative Approach in Ramp MeteringIntelligent Transport Systems (ITS). Promet-Traffic Transp. 2016, 28, 11–22. [Google Scholar] [CrossRef]
- Zhou, Y.; Ozbay, K.; Kachroo, P.; Zuo, F. Ramp Metering for a Distant Downstream Bottleneck Using Reinforcement Learning with Value Function Approximation. J. Adv. Transp. 2020, 2020, 8813467. [Google Scholar] [CrossRef]
- Meshkat, A.; Zhi, M.; Vrancken, J.L.; Verbraeck, A.; Yuan, Y.; Wang, Y. Coordinated ramp metering with priorities. IET Intell. Transp. Syst. 2015, 9, 639–645. [Google Scholar] [CrossRef]
- Deng, F.; Jin, J.; Shen, Y.; Du, Y. Advanced Self-Improving Ramp Metering Algorithm based on Multi-Agent Deep Reinforcement Learning. In Proceedings of the IEEE Intelligent Transportation Systems Conference (ITSC), Auckland, New Zealand, 27–30 October 2019. [Google Scholar]
- Matcha, B.N.; Namasivayam, S.N.; Hosseini Fouladi, M.; Ng, K.C.; Sivanesan, S.; Eh Noum, S.Y. Simulation Strategies for Mixed Traffic Conditions: A Review of Car-Following Models and Simulation Frameworks. J. Eng. 2020, 2020, 8231930. [Google Scholar] [CrossRef]
- Yang, M.; Li, Z.; Ke, Z.; Li, M. A Deep Reinforcement Learning-based Ramp Metering Control Framework for Improving Traffic Operation at Freeway Weaving Sections. In Proceedings of the Transportation Research Board 98th Annual Meeting, Washington, DC, USA, 13–17 January 2019. [Google Scholar]
- Dadashzadeh, N.; Ergun, M.; Kesten, A.S.; Žura, M. Improving the calibration time of traffic simulation models using parallel computing technique. In Proceedings of the 6th International Conference on Models and Technologies for Intelligent Transportation Systems (MT-ITS), Cracow, Poland, 5–7 June 2019. [Google Scholar]


Publisher’s Note: MDPI stays neutral with regard to jurisdictional claims in published maps and institutional affiliations. |
© 2021 by the authors. Licensee MDPI, Basel, Switzerland. This article is an open access article distributed under the terms and conditions of the Creative Commons Attribution (CC BY) license (http://creativecommons.org/licenses/by/4.0/).