


Abstract
A potentially attractive way for cities to maintain economic growth while reducing environmental harm is to let their production structures undergo industrial transformation, a process otherwise known as ecological modernization. This attraction lies mainly in the fact that residents, visitors and corporations prefer clean air, water and soil as a milieu to invest their resources in. Municipal governments can use city branding as an important instrument to force off such a transformation, if it is taken as a point of departure for the adoption of a strategy to which they are deeply committed and for the benefit of which they are willing to deploy their various policy instruments. In the literature on ecological modernization, five different pathways for industrial transformation in cities have been identified and these have been matched with city branding practices. In this contribution, the abovementioned conceptual framework is further detailed and specified to account for a variety in types of secondary and tertiary sector industries. In the empirical sections, all cities in the Chinese provinces Hubei and Hunan, where the transition from manufacturing to services is typically most pressing, are examined in terms of their industrial structures, pathways to industrial transformation and city branding choices. The results indicate, inter alia, that further subdivision of the secondary and tertiary economic sectors is useful in understanding key features of the transformation, and that different sub-pathways affect tradeoffs between economic expansion and ecological preservation differently. Branding practices among Hubei and Hunan cities also indicate that some industries are more easily embraced and utilized than others in establishing brand identities and adopting popular city labels.
1. Introduction
Facing low air quality in their immediate physical environment and global warming as an important background factor, many cities around the world aim to modernize their industrial structures [1]. This is especially true in areas where heavy manufacturing is still dominant, but where hope lives that a transition towards the tertiary sector will be a boost to both Gross Domestic Product (GDP) growth and scores on environmental indicators [2]. Such urban and industrial transformation leading towards ‘ecological modernization’ is not an easy challenge to deal with, however. The objective underlying ecological modernization is to reduce the use of raw materials and natural resources as well the emission of harmful substances in the production process. This require technological as well organizational innovation leading to win-win situations where increase in economic value added is paired with decrease in harm done to the natural environment [3,4]. Moreover, in comparison with remedial measures for fixing damage done to the natural environment, ecological modernization has the advantage of emphasizing the principle of pollution prevention: cost saving goes hand in glove with preserving or even improving the ecological environment [5,6,7]. If economic growth is paired with an absolute decrease in environmentally harmful emission or use of resources, this has been defined as ‘absolute decoupling’. If an increase of GDP comes with a less than proportional rise in environmental damage done, this is known as ‘relative decoupling’ [8]. Although the former is obviously the more desirable option, it is far more common for cities and their industries to realize the latter.
Although it is attractive for cities to realize industrial transformation as ecological modernization, this is neither easy nor painless. Many of them, especially in developing and newly emerging economies, still rely on polluting industries since these generate essential employment and income for a large share of their inhabitants and can only be moved out at high costs. New ‘high-quality’ visitors, residents and investors with higher levels of professional education, expertise in clean technologies or significant financial resources to set up their corporations prefer clean air, water and soil as a milieu to place their stakes in. For municipal governments, city branding can be an important instrument to attract these desirable new residents and force off such a transformation. This is only true, however, if this brand is taken as a point of departure for the adoption of a broader transformation strategy to which they are deeply committed and for the benefit of which they are willing to deploy various policy instruments as well. City branding has been defined as “the means both for achieving competitive advantage in order to increase inward investments and tourism, and also for achieving community development, reinforcing local identity and the identification of the citizens with their city and activating all social forces to support development efforts” [9]. Dinnie has proposed that an understanding of the interest in city brands may be that all places can benefit from implementing a coherent strategy for managing their resources, reputation and image [10]. In recent years, the interdisciplinary research on city branding has grown [11]. Especially the environmental dimension has obtained a fair amount of attention in the literature [12]. In this study, we bring the processes of ecological modernization and city branding together in cities where urban transformation is felt the strongest. Adopting a powerful city brand can be a crucial trigger for realizing and deepening industrial transformation towards ecological modernization—but not essential. It will only have this effect if operated in line with a broader strategy to implement it, or else it will ring more in the manner of greenwashing. Coherence between adopted city brands and industrial patterns is therefore a key condition for making this happen.
In this contribution, a generic conceptual framework, which includes five developmental pathways for industrial transformation will be introduced, after which it will be further detailed to account for a variety in types of secondary and tertiary sector industries. These more specific sub-pathways throw a more precise light on the transformational trajectories that cities adopt and the ways in which they brand themselves internally and externally. We will examine whether a more detailed understanding of these industrial profiles and existing branding practices among municipalities can help us understand why certain manufacturing and/or service-oriented profiles are emphasized and hailed or rejected a dissimulated in cities’ branding strategies. In the empirical sections of this article, all cities in the Chinese provinces Hubei and Hunan, where the transition from manufacturing to services is typically most pressing, are examined in terms of their industrial structures, pathways to industrial transformation and city branding choices.
The remainder of this article will proceed as follows. Section 2 will introduce the conceptual framework for developmental pathways and subsequently specify various sub-pathways. Section 3 will clarify the various methodological steps taken in this study for data collection and analysis. Section 4 will present relevant economic and geographic overview data on the cities in Hunan and Hubei Province later used in the analysis. The result will be a characterization of all cities in terms of pathways and sub-pathways that apply to them. Section 5 will then compare these sub-pathways with the branding choices made by those cities and analyze the coherence between pathways and chosen brands. Section 6 wraps up this article with conclusions and reflects on the broader research and policy relevance of the approach proposed here.
2. Ecological Modernization and a Revised Conceptual Framework on Developmental Pathways
Ecological modernization theory (EMT) has emerged as a prominent neoliberal theory and it is currently one of the leading theories in environmental sociology [13]. Most generally, “the aim of EMT has been to analyze how contemporary industrialized societies deal with environmental crises” [14]. Hajer claim that the central idea of ecological modernization is the growing compatibility between environmental protection and economic growth [15]. Previous studies in ecological modernization all indicate that environment is highly related to industrial production; it was therefore normally adopted as a dependent variable affected by industrial production features [16]. Bicknell’s input-output model to calculate the ecological footprint was adopted by Liu Jianxing and Cao Shuyan et al. [17,18,19] to discuss the relationship between the activities of the three different economic sectors (primary, secondary and tertiary) and their corresponding amounts of pollution. Their results suggest that among the three industries, the secondary industry had a huge impact on the environment and was responsible for a serious imbalance between the supply and demand of ecological resources. The total ecological footprint of the tertiary industry was the smallest, and its land use had the highest economic efficiency, which was conducive to reducing the ecological impact of China’s socio-economic metabolism. In more recent academic literature, in which industrial transformation and ecological modernization are connected with city branding practices, a typology of five different developmental pathways for industrial transformation in cities was developed. The types are based on the positions of cities in the urban hierarchy (international, national or regional orientation) and their stage of industrial development (agriculture and extraction oriented, manufacturing oriented, and trade and service oriented) and express expected trajectories for economic development based on the need for ecological modernization. Table 1 below depicts these five pathways as they have been coined in de Jong et al. (2018) and empirically validated for the three Chinese Mega City Regions around Beijing, Shanghai and Hong Kong/Shenzhen/Guangzhou and China’s Northeastern provinces Heilongjiang, Jilin and Liaoning in Han et al. (2018) [20,21].
Table 1.
Ecological modernization and urban developmental pathways.
In both of these studies, expected developmental pathways of cities as outlined above were established based on various economic and geographic figures and indicators and then compared with the city branding choices that these cities have adopted. Cities on pathways 2 and 4 appeared to be by far most numerous. Cities on pathways 4 and 5 tended to be pleased with their service-oriented profile and their branding strategies tended to be in line with what could be expected from their industrial profile and pathway. Cities on pathway 2 (and 3) often had more mixed emotions about their manufacturing dominated image and either presented themselves as 4 (or 5) or blended their own pathway 2 with features of pathway 4 (or less often, pathway 1). Cities on pathway 1 were comparatively rare. Those that existed branded themselves as blends of 1/2 or 1/2/4. Although these studies were useful in characterizing the challenges municipal governments face in their ecological modernization-inspired self-reinvention, these five pathways proved to be insufficiently specific to understand more subtle aspects in the tradeoffs made between economic and ecological considerations in city branding and urban transformation. Some types of secondary sector industries in fact were less environmentally harmful than others, while some tertiary sector activities were more economically desirable than others without the framework being able to clarify how this worked. In spite of the doubtful reputation of the secondary sector as being environmentally harmful, demand for its products and employment remains high. Meanwhile, in spite of the intuitive of appeal service industries as a whole have, some of them may actually generate very low value added. Indeed, the secondary and tertiary sectors are both broad concepts including many specific subordinate industries—not all of which have the same economic and ecological impact.
In this study, we aim to become more precise on the existence of various developmental pathways and seek ways to subdivide the three economic sectors on which developmental pathways are based (primary, secondary and tertiary) into more detailed subcategories allowing for a better grasp of their respective economic and ecological attractiveness. Since the primary sector accounts for a low percentage of industrial activity, is only dominant in a very tiny number of cities, is simple and straightforward (including only agriculture, forestry, animal husbandry and fishery) and has limited impact on the ecological environment [22], we decided to leave it intact for the purpose of our analysis. Pathways 2 and 3, in both of which the secondary sector prevails, tell a different story. According to the Chinese National Bureau of Statistics [23], the secondary sector can be subdivided into four main categories (manufacturing, construction, mining and production and distribution of electricity, gas and water), which correspond with pathways 2L/2H or 3L/3H for manufacturing, and 2bcd or 3bcd for the other three categories, as shown in Table 2. In the rest of our analysis, we will not be using all of these subtypes, however. Our empirical data (see Appendix A) show that regarding the secondary sector, only manufacturing industries play a significant role in the city branding practices undertaken by municipalities, with light and heavy manufacturing often explicitly mentioned and the former valued more highly than the latter (see Appendix B). Construction, mining and production of utilities were largely ignored in communication and strategy development, partly because they are common to all cities and therefore have no distinctive value (construction and production of utilities) and partly because they are considered highly extractive and polluting (construction and mining). We will therefore just include light (L) and heavy (H) manufacturing industry from hereon.
Table 2.
Categorization of the secondary sector and corresponding developmental pathways.
Singelmann and Browning (1978) have analyzed the service-oriented tertiary sector using a so-called six-sector model, in which it was categorized into four broad subtypes based on the nature and objects of the services provided: distributive services (trade, transport, and communication); personal services (hotels, catering, entertainment and miscellaneous personal services); producer services (banking, insurance, business services); and social services (government, health, education, non-profit organizations) [24]. Following Yan [25] who modified this typology, which is also used in the Standard Industrial Classification released by the Chinese National Bureau of Statistics, we eventually made a classification into producer services, distributive services, consumer services and social services. Producer services are defined as services provided for producers and individuals at intermediate stages [25]. Distributive services relate to the provision of transportation services to the final consumer. Consumer services target the delivery of personal services to the individual consumer. Finally, social services consist of activities aimed at the reproduction of labor (such as health services, education and social welfare) and activities to stabilize social relations between various societal groups and classes (public management). These classifications for the tertiary sector and their corresponding pathways are shown in Table 3.
Table 3.
Categorization of the tertiary sector and corresponding developmental pathways.
It should be noted that tourism is not in any of the four categories mentioned above. According to Charles (2011), tourism is a combination of economic activities, services or industries that provide tourists with an out-of-home experience, and this includes transportation, accommodation, catering, retail, entertainment facilities and other hospitality services [26,27]. These can be found dispersed across the various other types. Since we have no a priori reason to believe that any of the four main types of service industries appear either dominant over or more economically or ecologically attractive than the others, we have included all of them in our analysis. That said, at first sight some of the producer services match aspects of the advanced producer services that tend to set global cities apart, while scientific research and technical services are widely assumed to promote innovation. Both of these can be expected to play a bigger role than other types of services in the city branding around ecological modernization [28].
In Section 3 on methodology, we will clarify how we established economic pathways and sub-pathways for all cities in the Chinese provinces of Hunan and Hubei, where the transformation from secondary to tertiary sector dominated industries occurs at its most conspicuous in the country provinces. Since 2013, the GDP proportion of the tertiary sector exceeded that of secondary for the first time in China and the cities in these two provinces are typically in the middle of this transition. This is the reason why we have taken them for our empirical analysis.
3. Methodological Steps Taken for Data Collection and Analysis
To establish a city’s developmental pathway and sub-pathway, relate it to its branding choices and then examining how tradeoffs are made between attractiveness of economic value added and ecological harm reduction, a certain number of methodological steps were used. They were inspired by Jong et al. (2018) and Han et al. (2018), but have been amended given the specific focus of this contribution on sub-pathways [20,21].
- Sample of cities. To assess validity and usefulness of the modified developmental pathway framework, we selected all cities in the Chinese provinces Hubei and Hunan. They are both located in the central part of China and constitute a zone bridging the developed eastern coastal provinces with the less developed western inland provinces [29,30] and display many of the urban and industrial transformation features under study here: for long they have had a dominant manufacturing industry, but an obvious transition towards more and more service industries is underway. Yet, cities in these two provinces are still plagued by severe environmental contamination from which local governments can no longer look away [31,32].
- Administrative position. In establishing the position of a city in the administrative hierarchy, we found no international cities in either province. Wuhan and Changsha are capital cities categorized as national cities (NAT). All other cities all were classified as regional (REG). See Table 4. This implies that we will only find cities on pathways 1, 2 and 4.Table 4. Key geographic data and economic development pathways for the Hunan Province.
- Developmental stage and dominant sub-sectors. To establish the developmental (sub) stage of a city, a selection of relevant statistical data was collected. We mapped the percentage of (1) heavy manufacturing H and (2) light manufacturing L in total GDP; data to establish them as percentages of the working population could not be retrieved. Producer services (P), distributive services (D), consumer services (C) and social services (S) were mapped as percentages of GDP and alternatively as a share of the working population if GDP data proved to be missing. Based on these percentages, the dominant subtype(s) of industry could be established and consequently the developmental stage of each city. Again, see Table 4.
- Developmental pathway and sub-pathway. To establish the expected developmental pathway and sub-pathway of each city based on a city’s industrial features, the scores from steps 2 and 3 were combined (see Table 4). Take Wuhan for instance: in light of its ratio of (1) working population and (2) GDP to primary, secondary and tertiary economic sectors, which are respectively 9/38/53 and 3.3/43.9/52.8, the service economy is clearly the dominant one. In addition, it is of national rather than regional importance. Therefore, Wuhan’s expected pathway is 4. Regarding the sub-pathways, P/D/C/S as GDP of tertiary sector (in percentages) is 32.75/10.94/14.87/41.44, implying that social services prevail. Wuhan is therefore unambiguously on pathway 4S. Meanwhile for Shiyan, the proportion 1/2/3 as percentage of working population is 41.4/18.1/40.6, with only a tiny gap between the primary and tertiary sectors. To add to the complexity, the GDP percentages generated in the three sectors are at 12.1/47.7/40.2, respectively: the secondary industry is dominant on that criterion. We therefore establish the main pathway of Shiyan as 1/4/2. Regarding the sub-pathways, P/D/C/S as GDP of the tertiary sector (in percentages) is at 13.29/39.89/7.45/39.37, indicating that distributive and social services dominate; as for secondary sector, the L/H (light and heavy manufacturing) percentages are 66.9/33.1, showing a clear dominance of light manufacturing. Consequently, Shiyan displays characteristics of pathways 1, 4D, 4S and 2L. This result can be observed in Table 4 in the columns to the right.
- City branding choices I. To measure city branding choice, we used two different indicators: city brand identity and city label. A city brand identity reflects how a city defines itself when comparing itself with other cities [33]. Different from city brand identity, a city label is a generic label that a city uses when promoting itself. Such labels are normally policy-related academic phrases, and easy to remember [34]. Both city brand identities and city labels reflect, in different ways, the developmental pathway a city itself believes it is on or should be on and what it adopts in its internal and external communication and strategy development. City brand identities were identified in self-descriptions of the city in official government documents. These could be Urban Master Plan, 12th Five Year Social and Economic Plan or 13th Five Year Social and Economic Plan. These could only be taken from central parts of these documents such as summaries, introductions or conclusions, since city brand identities should be found at conspicuous places of documents. Often the interpretation of one or a few such key phrases and relating these to adopted pathway and sub-pathway required a fair amount of interpretation but was based on terms bold-faced in the text. See Table 5.Table 5. Developmental pathways and brand identities for cities in Hubei and Hunan.
- City branding choices II. To establish which city labels were most popular, these were counted in the same planning documents mentioned under 5. However, in this case, not one central key phrase was used as for the city brand identity, but a total count of each city label was made in each plan document. In this manner, the frequency of their occurrence across the plans allowed us to calculate a second indicator for the adopted pathway of a city. The city labels for the categorization of the main pathways are shown in Appendix E. For instance, ‘service center’, ‘trade center’, ‘financial center’ feature under service city, and service city belongs to pathways 4 and 5. Of these labels we calculated the frequencies, the results of which are shown in Appendix A. For instance, in Appendix A we can see that for Wuhan and Shiyan, the frequency of the city label ‘service city’ very evidently occupies the first place in the three documents. Therefore, Wuhan’s adopted pathway is 4 (see Appendix A); For Huangshi, ‘service city’ and ‘advanced manufacturing city’ are the two most frequently mentioned city labels, so the pathway adopted is 4/2. In order to determine the adopted sub-pathways, another frequency count in those same official documents was made for each city, this time to map how many times each of the various subtypes of industries under step 3 was mentioned. Dominance of such a subtype allowed us to establish the adopted sub-pathway in each city. See Appendix B for the secondary economic sector and Appendix C for the tertiary sector. If we take Wuhan as an example, we see that its sub-pathway is 2H (Appendix B) and 4D (Appendix C). As a procedure, we first determine its main pathway: pathway 4. Secondly, we find the corresponding sub-pathway, which is 4D. Likewise, in the case of Huangshi, its main pathways are 4/2, and its sub-pathways 4D/2H.
- Matching adopted with expected pathways. Finally, to examine to what extent the city brand identities and city labels expressed in adopted sub-pathways match the expected sub-pathways given their economic and geographic data, we combined the expected pathways derived under step 4 with the adopted pathways from step 6 (main pathways) and from step 7 (sub-pathways) into Appendix A. Where expected, sub-pathways and adopted sub-pathways significantly differed from each other, which was flagged up for subsequent discussion and could be used to understand how cities make tradeoffs between economic and ecological elements in choosing an industrial profile and developmental pathway.
4. The Provinces of Hunan and Hubei Province and their Cities
4.1. Hunan Province
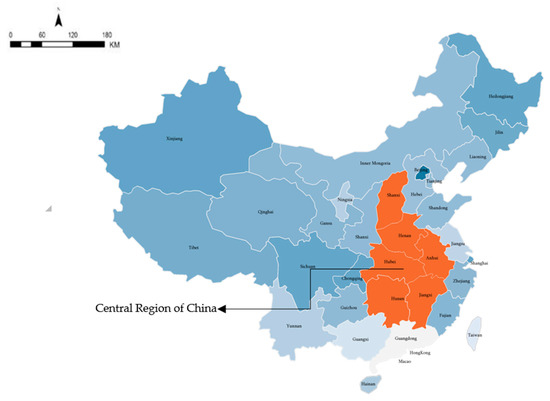
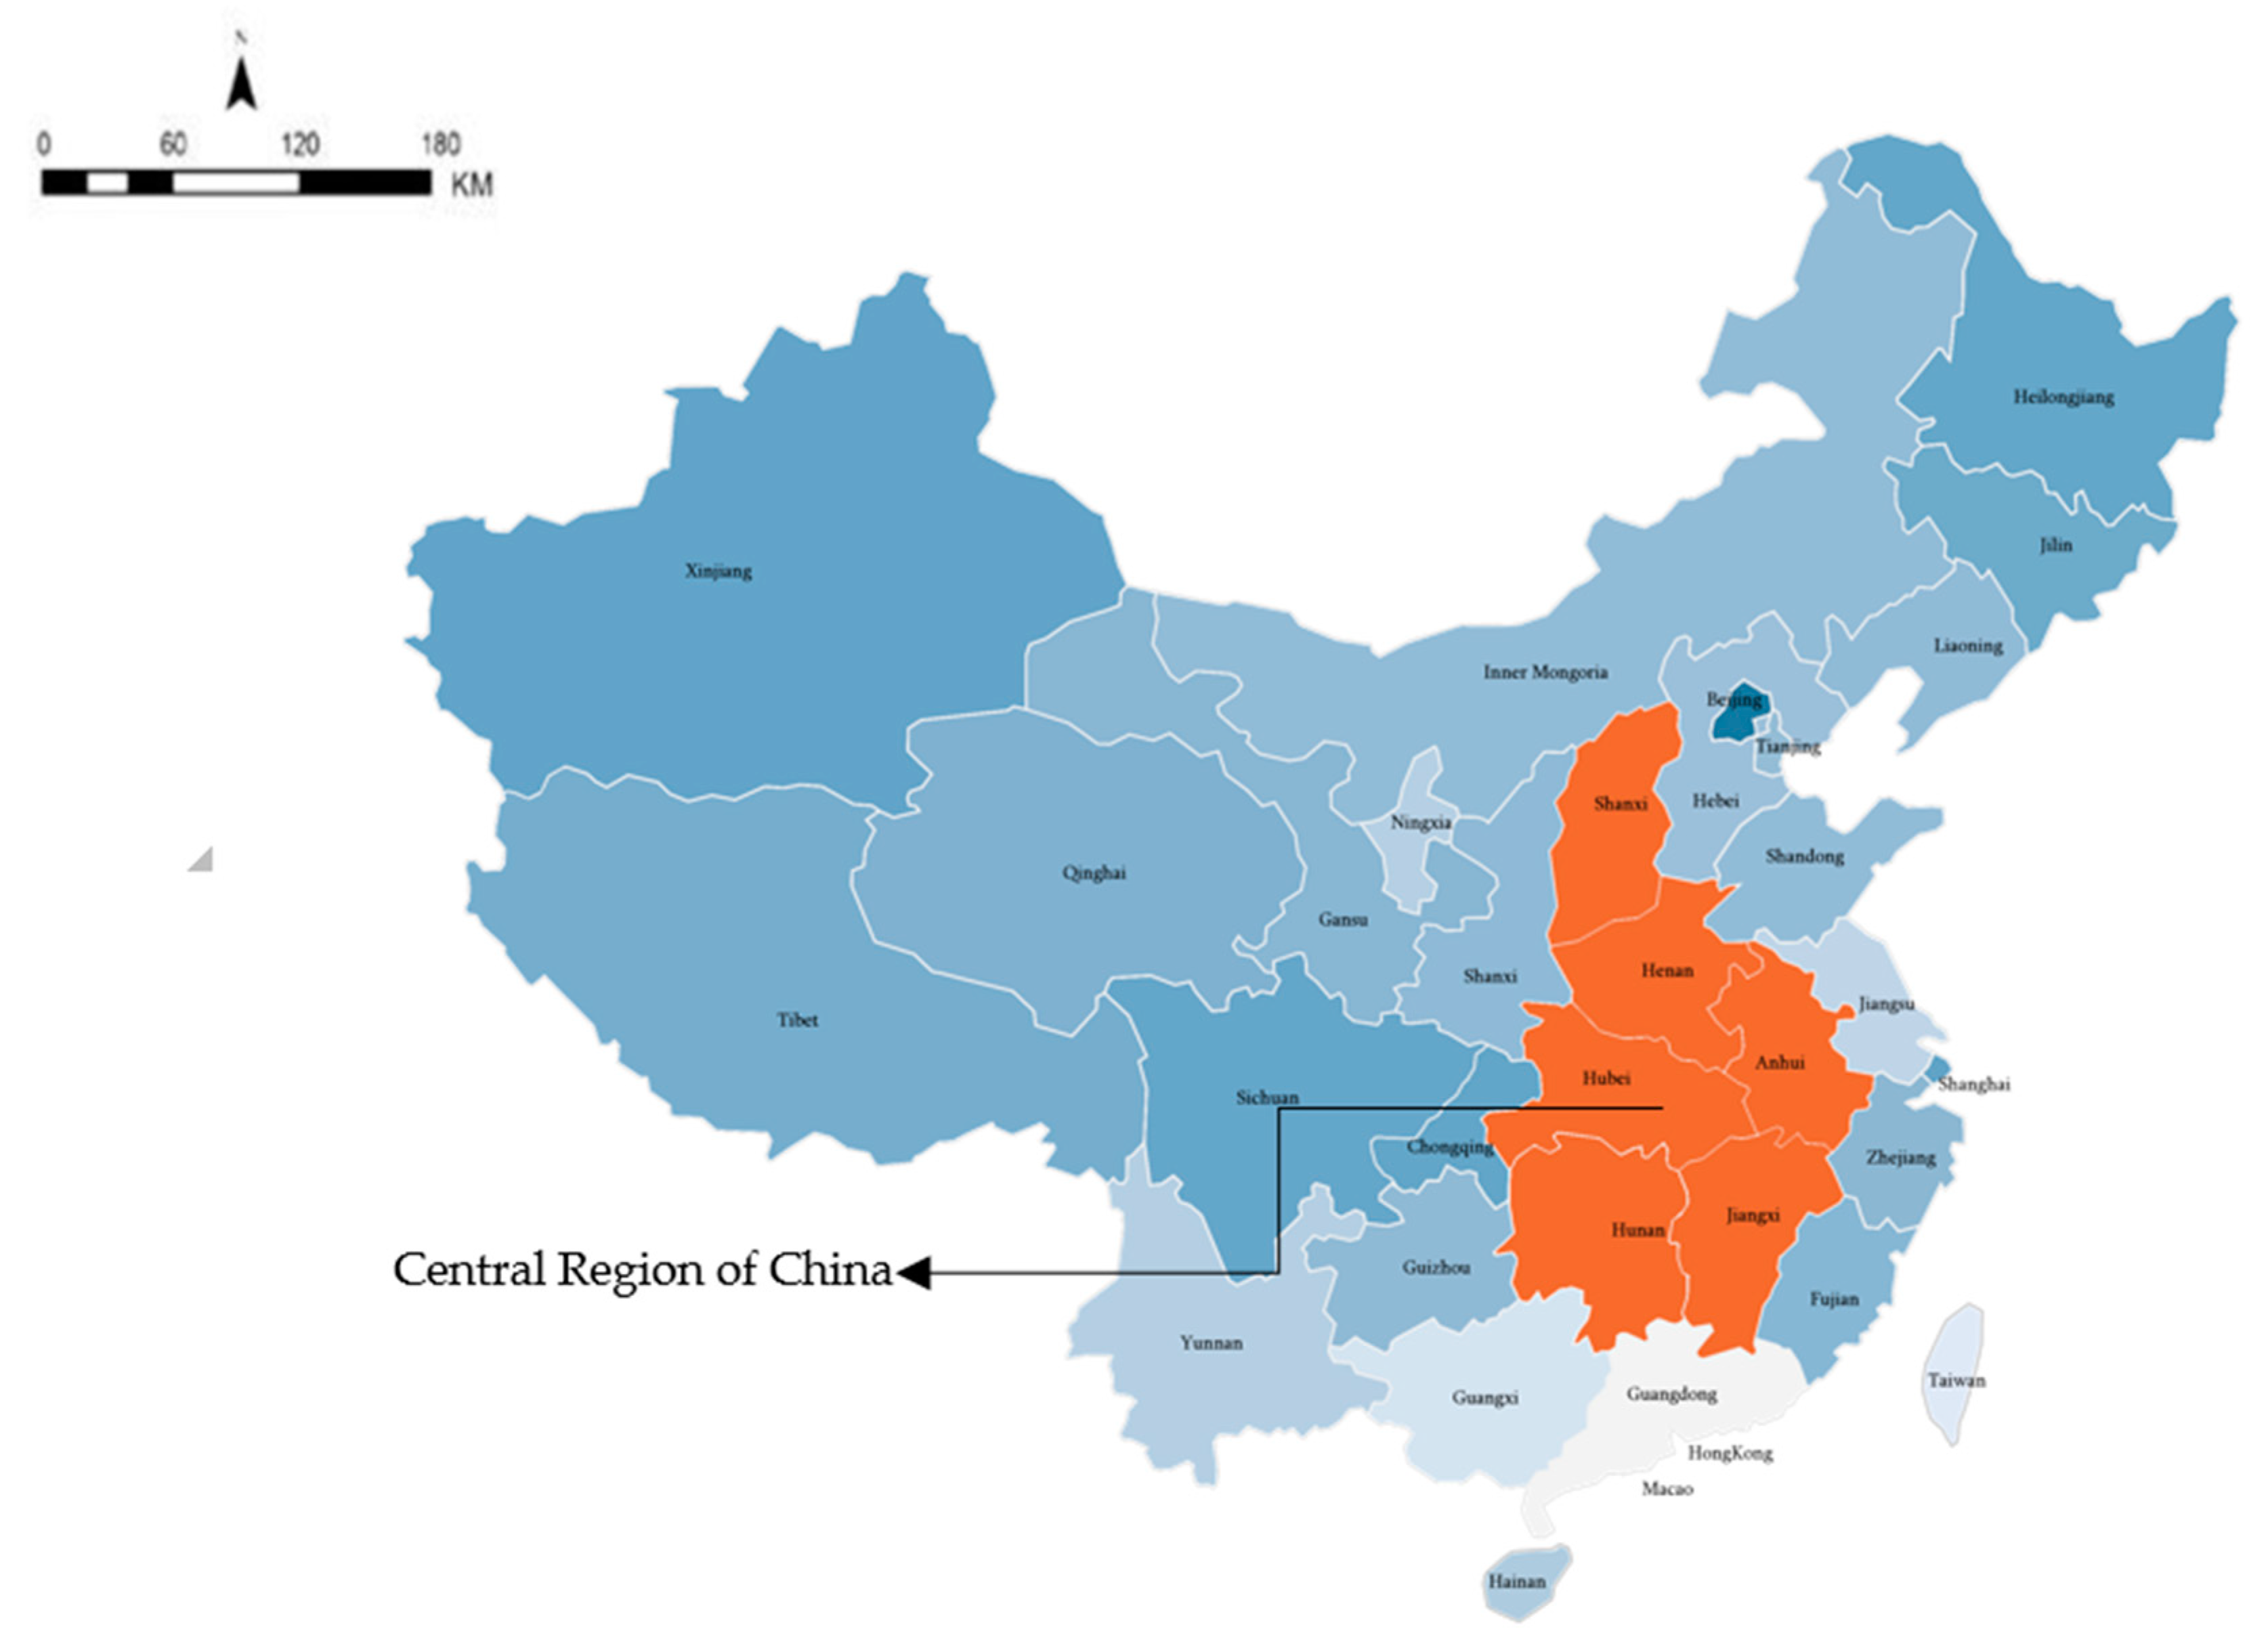
Located in China’s central region (see Figure 1), Hunan is not only the heart of its agricultural production, but also its main distribution center for industrial products, including steel, machinery and electronics. In 2016, the GDP proportions for the primary, secondary and tertiary sectors were 9.4%, 43.2% and 47.4%, compared to 8.8%, 41.7% and 49.5% just a year later. The typical of industrial readjustment towards services is therefore in full process in Hunan. The development of the tertiary sector including Finance, Real estate, Scientific research, Comprehensive technical supporting services, Public management and Social services [35], is promising from both an economic and ecological viewpoint [36,37].
Figure 1.
Central Region of China (the central regional of China comprise six provinces: Hunan, Hubei, Anhui, Shanxi, Henan, Jiangxi).
Hunan province counts 13 cities, including: Changsha, Zhuzhou, Xiangtan, Hengyang, Shaoyang, Yueyang, Changde, Zhangjiajie, Yiyang, Loudi, Chenzhou, Yongzhou, Huaihua. Changsha is the provincial capital and an important high-speed railway and aviation hub and important industrial and commercial center in the central region. In 2016, Changsha’s GDP reached 932.37 billion yuan, an increase of 9.4% over that of 2015. Changsha ranks 13th in China and second in China’s central region. Zhuzhou and Hengyang benefit from their geographical location and have become its logistics center and old industrial base. Yueyang is an ancient international trading port city in China. Changde is a sub provincial center city in Hunan and also a city where light manufacturing is especially strong. Shaoyang, Yiyang and Loudi are all secondary sector oriented, with manufacturing occupying more than half of the total output. Chenzhou, Yongzhou, Huaihua and Zhangjiajie are rich in forest resources; Zhangjiajie is also a major tourist city. Xiangtan is known nationwide as being Mao Zedong’s hometown.
4.2. Hubei Province
Hubei province is also located in China’s central region. It consists of 12 prefecture-level cities and one autonomous prefecture. Known as the ‘Land of Fish and Rice’, Hubei is rich in agricultural products and mineral resources. Its Gross Democratic Production in 2016 was 3229.8 billion yuan, ranking seventh among the other provinces in China and its growth rate was at 8.1% over that of the previous year, which exceeded the national average. Industrial transformation is also taking place in Hubei Province. According to data published by Hubei Province Bureau of Statistics of China, the GDP proportion of primary sector, secondary sector and tertiary sector in Hubei in 2016 were 11.3%, 44.5% and 44.2%. In 2017, the three sectors accounted for 10.0%, 43.5%, 46.5% of GDP, respectively [38]. However, the proportion of private investment in the total decreased by 1.3%. Hubei also faced some other problems including economic goals not being reached and the transformation of the traditional industries remaining below expectation. Due to the well-established transportation network in Hubei Province and its geographical features, Hubei is well developed in heavy industry, with its harmful environmental effect unfortunately becoming increasingly conspicuous [39,40].
Wuhan is Hubei’s capital city as well as a sub-provincial level city (higher than Changsha) and central China’s core city [41]. It is a very important transportation hub in China both for passengers and goods, a national famous historical and cultural city and the development base for research and education. Located in the middle reach of the Yangtze River, one of the cradles of Chinese civilization, the cities of Xiangyang, Jingzhou, Jingmen and Ezhou boast being representatives of the original Three Kingdoms culture known from one of China’s ancient literary classics. Next to tourism, their manufacturing also accounts for a large share of GDP. While Xiaogan, Jingzhou, Shiyan, Xianning, Suizhou and Huanggang are rich in natural resources, some of their agricultural products are of national importance. Apart from its primary industry, Suizhou is famous of its motor vehicle production, and was nominated as the ‘Chinese Capital of Special Purpose Motor Vehicles’ by the Hubei government.
4.3. Overview of Key Data on Cities in Hunan and Hubei Province
- Only two cities in Hubei (and none in Hunan) are on pathway 1: Shiyan and Jingmen. The labor input of Shiyan’s primary industry is 41.4%, while its GDP only accounts for 12.1% of the three major sectors, indicating that the production efficiency of primary sector is relatively low. The same applies to Jingmen.
- Two cities in Hunan and 11 in Hubei evidence a dominant secondary sector; more than half of these show in fact a dominance of the heavy manufacturing (Table 4: L/H as GDP of Secondary sector in %). The economic output of the heavy manufacturing is higher than that of light manufacturing industry in Hunan province. In Hubei, the number of pathway 2L (five cities) is almost on a par with that of those on pathway 2H (six cities); moreover, the difference in the proportion each type (H and L) makes to GDP is quite small, suggesting that the added value of the heavy and light manufacturing industries are more in balance with each other in Hubei than in Hunan.
- The tertiary sector is more developed than the secondary sector in both provinces, with social services being the leading type of industry. Most public management, security and social organization are non-profit and account for the largest proportion of GDP in social services [42]. In addition, apart from Wuhan, the GDP contribution of scientific research and technical services in Hubei province is low (Appendix D). Qiao has shown that more in general, China’s scientific research and technical services lag behind those in developed countries [43].
- Construction and manufacturing are no doubt the pillar industries (Pillar industry refers to the industry or industrial group that occupies an important strategic position in the national economic system, and its industrial scale occupies a large share in the national economy and plays a supporting role) in both provinces (Table 4). The third leading industry in Hubei province is wholesale and retail trade. Only Xianning and Jingzhou have well developed traffic, transportation, storage and post services. While in Hunan Province, the tertiary sector is more diverse, including traffic, transportation, storage and post (Xiangtan and Huaihua), financial mediation (Hengyang, Yueyang, Yiyang, Shaoyang, Yongzhou), and real estate (Zhuzhou), which all contribute significantly to Hunan’s economic growth.
5. Analysis
5.1. City Brand Identities in Hubei and Hunan
City brand identities are closely related to how cities define themselves in contradistinction to others [44,45]. A city brand identity can be established from self-descriptions of the city in official government documents. The city brand identities of cities in Hunan and Hubei are shown in Table 5. We compared the pathways following geographic position (expected pathways) with brand identities extracted from planning documents, including 12th and 13th Five Year Plans and Urban Master Plans (adopted pathways) and the following observations stand out:
- When it comes to branding, tourism features quite prominently in both provinces. Tourism has a reputation of being ecologically friendly rather than resource-extracting or contaminating, unlike manufacturing, which suggests it is more in line with what ecological modernization requires. This is a first reason for cities to highlight this aspect; another is that much city promotion, marketing and branding was traditionally done for tourism purposes and part of this routine practice has been preserved [46].
- A cultural image is another important aspect in the formation of city brand identities. Nine out of 12 cities in Hubei province and eight out of 14 cities in Hunan province make reference to being a “cultural city” in their planning documents. As an intangible asset, culture also is believed to be characterized by low input of resources and high-value output. Moreover, culture enhances the attraction of high-profile visitors, thus generating economic value [47,48]. Jingzhou, for instance, cherishes Guanyu, a protagonist in the Three Kingdoms.
- Regarding the sub-industries within the tertiary sector, “social service industries” appear to flourish in both provinces in their geographic profiles. However, when it comes to branding in both brand identities and city labels, the mention made of “distribution services” and, to a lesser extent, “consumer services”, prevails. A likely reason for this phenomenon is that most of the economic activity involved in social services (except research) counts more as social welfare oriented rather than as GDP-enhancing and is consequently less attractive for branding purposes [42]. Distributive services including wholesale and retail trade, traffic, transport, storage and post, on the other hand, provide obvious comparative advantage in terms of added economic value and constitute therefore an appealing aspect for urban governments to focus on in their branding strategy, especially in central China where having hubs for transport and logistics in place is of key importance [49,50,51].
- When it comes to the secondary sector, most cities in Hunan and Hubei provinces prefer to define themselves more vaguely as “important industrial base” or “new/new-type industrial base”. Only a few cities actually use “manufacturing base” to brand themselves. This is likely the result of the negative ecological impact the secondary sector has or is believed to have. Moreover, cities on pathway 2, such as Huangshi, Xiangyang, Zhuzhou, and Loudi, are more inclined to combine pathway 2 with the seemingly eco-friendlier pathway 4 to convey a cleaner impression of themselves. The same phenomenon was also observed in earlier work regarding the developmental pathways in China’s three megacity regions (Jing-Jin-Ji, Yangtze River Delta and Pearl River Delta) and the three Northeastern provinces (Heilongjiang, Jilin and Liaoning) [20,21].
5.2. City Labels in Hubei and Hunan
Next to city brand identities, city labels also throw light at city branding practices. City labels are generic phrases cities use to characterize themselves. These labels are often policy-related catchy denominations and are easy to remember [52]. Here as well, we compared expected pathways related to cities’ geographic position (Table 4) with adopted pathways as reflected by dominant city labels in the plans (Appendix A). We present the expected and adopted pathways in an overview in Table 6.
Table 6.
The comparison of expected and adopted pathways for Hunan and Hubei Province.
- Pathway 4+2 is the most common combination in both provinces. In particular, cities on pathway 2, where the secondary sector is dominant in the industrial profile, seek green washing by making creative combinations with pathway 4. Cities on pathway 4, on the other hand, show high level of congruence between expected and adopted pathways. These findings, too, are consistent with [20,21]. These findings also serve as evidence supporting conclusions drawn in earlier studies, which state that ecological modernization is effective in realizing a relative reduction in the emission of pollutants per capita when tertiary sector industries phase out secondary sector ones; this insight has become common knowledge among policy makers [2]. It is intriguing that Hengyang, Shaoyang, Chengde, and Yiyang, all of which are on pathway 4, also emphasize their secondary sector industries and turn themselves into pathway 4+2 rather than just pathway 4. As a percentage of both working population and GDP, the gap between tertiary and secondary industries in these cities is quite small (see Table 4), which suggests that their secondary sector still plays an important role and they wish not to lose it. Nonetheless, for all municipal governments involved, balancing economic growth and ecological protection in actual industrial regulation and in their branding practices remains a vital challenge.
- Regarding the secondary sector, cities heavy manufacturing is dominant, such as Ezhou, Jingmen and Xiaogan, prefer “light manufacturing” for their branding strategies. Here, industrial reality and branding practice do not correspond with each other. This is especially conspicuous in Ezhou city, where heavy manufacturing accounts for even 74.2% of its GDP. Scholars have pointed out that light sub-industries performed better than heavy sub-industries in terms of ecological efficiency, and generate less natural resource consumption [53,54,55,56]. This may explain why cities prefer light manufacturing over heavy manufacturing in their city branding practices. In contradistinction, cities on pathway 2L (light manufacturing) adopt pathways consistent with their actual profile. Such is the case in Shiyan, Huangshi, Jingzhou, Huanggang, Xianning, and Suizhou, where light manufacturing prevails, and escapist attitudes are not needed. Cities wishing to engage in ecological modernization can be expected to face difficulties if their branding shows long-term inconsistency with actual development, as is the case when heavy manufacturing is the backbone of their economy and transformation to light manufacturing is promised, but not delivered. This will negatively affect their credibility in the eyes of their stakeholders such as investors and residents, since urban governments fail to deliver on their brand promises [57].
- Regarding the tertiary sector in both provinces, many cities prefer distributive services over social services in their choice of city labels. Distributive services play a positive role in economic growth, which explains its branding popularity [58,59]. Public management, on the other hand, is non-profit and takes a large share of the workforce, but its contribution to GDP is comparatively low. It should therefore come as no surprise that cities prefer to brand themselves as being on pathway 4D (distributive services) rather than on 4S (social services). Seen from an environmental perspective, however, China’s distribution services—especially logistics—generate high and rising levels of carbon emission year after year. However, due to the high economic value of the logistics industry, cities warmly welcome the development of this type of industry, nonetheless. Here, the balance appears to be in favor of economic growth rather than ecological preservation. The only way out from an environmental point of view is to realize that even relative decoupling is improving the energy efficiency of logistics services. Producer services are in fact well-developed in the cities of Hengyang, Huaihua and Chenzhou, although they promote themselves as being strong in distributive and consumer services. We may surmise that this is due to the fact that in recent years consumer services and distributive services have shown faster economic growth in China than producer services and are therefore more appealing industries to have inside a city’s borders [51].
- The trend towards ecological modernization is again confirmed in that among the most frequently mentioned city labels, apart from service city, “advanced manufacturing city” and “innovation city” rank high, reflecting a wish for cities to realize industrial upgrades. In the meantime, cities in Hunan and Hubei also experience industrial transformation from the secondary to tertiary sectors. This is only in line with the precepts of ecological modernization if this involves at least a relative decoupling between rising economic value added and environmental harm done. This is frequently, but not always, the case. Distributive services are embraced more easily than social services in spite of their high levels of energy consumption and carbon emissions and may not represent ecological improvement when compared with certain manufacturing or other secondary sector activities. Finally, as important producers of wheat and rice, cities in Hubei appear barely to value the crucial role of their primary sector. This is fully understandable in terms of economic value added but increases the nation’s vulnerability to dependence on food imports.
6. Conclusions and Discussion
The starting point of this study has been that many modern cities, including those in China, currently face the dual pressure of having to accommodate both industrial restructuring and climate change. This implies that they remain committed to making an attempt at ecological modernization in order to improve their public image and attract investors, high-tech companies, top talents and prosperous visitors. Seen in this light, a shift from the secondary to the tertiary economic sectors appears at first sight to be a two-edged sword: continued, or even rising, economic growth and reduction of environmental harm may go hand in hand. To examine whether industrial transformation is indeed evolving as favorable as that, we have been leaning on an analytical framework in which different developmental pathways for cities can be distinguished based on the international, national or regional status of a city and the dominance of either the primary, secondary or tertiary economic sectors. Following that, we applied it to all cities in the central Chinese provinces of Hubei and Hunan where industrial restructuring of this sort is occurring in full swing. We found that in most cities undergoing ecological modernization, those in which service-oriented industries already prevailed, the urban governments tended to be satisfied with their status and brand themselves in line with their actual industrial structure. Cities where manufacturing industries still prevailed, on the other hand, often fear the consequences of having a dirty image and cloak themselves as either service-oriented cities or as cities that have a combined manufacturing and service-oriented profile. This finding was significant and confirmed the result of earlier studies conducted in other parts of China.
However, this contribution went a step further than previous studies in that both the secondary and tertiary economic sectors were divided up into sub-sectors to develop a clearer picture of the features of this process of ecological modernization; e.g., which types of industries are replacing which ones exactly and how cities brand these transformations. According to the academic literature, the secondary sector consists of manufacturing, construction, mining and the production and distribution of utilities. Whereas construction and utilities are non-distinctive subsectors in the sense that they fulfil key functions in all cities, mining is generally seen as unattractive. None of these subsectors is therefore significant in any city branding strategies. This does not hold for heavy and light manufacturing, which can be both distinctive for city profiles and have a significant impact on their relative attractiveness. The pattern here appears to be that in cities where light manufacturing dominates economic activity, urban governments tend to brand themselves in line with the industrial profile and developmental pathways they find themselves in. However, in the branding practices of cities where heavy manufacturing functions prevail, their importance is downplayed vis-à-vis that of light manufacturing or any service industries they covet. Since the question whether heavy or light manufacturing makes a higher contribution to economic added value in cities cannot be unambiguously answered, we may assume that this phenomenon occurs for the same reason as why service industries outshine manufacturing industries in city branding practices: a green image (with or without a concomitant green reality) is worth gold in the era of ecological modernization. The picture is more complex, however, when it comes to subdividing the tertiary sector. There, a subdivision was made into social services, distributive services, producer services and consumer services. All of these proved to be of significant economic importance in most Hubei and Hunan cities. While social services had the most extensive workforce and sometimes the highest share in local GDP, in nearly all cases it is the distributive services that tend to be overrepresented in branding. Producer and consumer services occupy middle positions in this spectrum. This outcome cannot be explained by referring to efforts among urban governments to create a green image to the outside world: rather, it is the appeal of higher added economic value generated by trade, transport and logistics that plays a role here. Such growth potential is not expected from non-profit social services (perhaps with the exception of research activities) or relatively low-tech consumer services. The limited attention paid to producer services in Hubei and Hunan begs more questions, but is presumably the result of the fact that central China is seen as having a strong position as a transport and logistics hub within the country, while most sophisticated producer services are provided in the most developed East and not in the center. Since distributive services tend to be high carbon industries, any transition from light industry or other types of services to distribution may well enhance economic growth but is unlikely to reduce environmental harm—neither absolute nor even as relative decoupling. It therefore does not fit the comfortable picture of ecological modernization and provides evidence that urban governments promoting such a shift prefer to follow economic interests rather than environmental ones when forced to choose.
In summary, the emerging picture is one where cities are keen to select key elements in their branding, which are those aspects of their industrial profile that give them a green and more environmentally friendly image, notwithstanding the fact that they may not always be taking effective action truly to realize this industrial greening. This yearning for a green service-oriented image is muted, nevertheless, by the urge to promote industrial activity with high added value. The latter can be seen in the preference for branding one’s distributive service functions over the social ones in spite of the fact that they are obviously the more resource-demanding and exhaust-emitting ones. It also occurs in a certain number of other cities, such as Hengyang, Shaoyang, Changde, and Yiyang, where even particular subcategories within the secondary sector proved more popular than the more ‘environmentally friendly’ tertiary social services.
The main contribution of this study has been its offering of a more nuanced analytical framework for developmental pathways that more accurately reflects the variety in industrial functions. This makes an understanding of both current economic profile and future prospects more precise and the considerations underlying economic branding behavior easier to grasp. It also demonstrates in a more fine-tuned manner how cities trade off types of industries within the secondary and tertiary sectors against each other in their outward appearance. Additionally, it makes clear how green images are pursued, but not at any price: we have seen multiple cases where expectations of higher economic value added prevail over environmental considerations in city branding if the two appear to be in conflict, even to the point of highlighting certain types of manufacturing over more vulnerable categories of services.
That said, there are enough questions left. Delving more deeply into the various categories of social services, producer services or consumer services would help a great deal in finding those among them that do offer more value added than others and/or that cause less environmental harm. Moreover, in this study, only cities located in the provinces of Hubei and Hunan, 25 altogether, have been examined. Even though the data collection process was highly time-consuming, its representativeness for China as a whole, or even the deindustrializing world, is obviously limited. Different regions in China and elsewhere are undergoing different industrial restructuring processes where different types of economic activities result in different developmental sub-pathways. Only further studies can tell what transformations are in process there, how urban governments brand themselves amidst these transformations and how robust the analytical framework established here turns out in pinpointing and explaining their challenges. Finally, as observed by Lu et al. (2017), the role of the national and provincial governments on municipal branding options and choices is quite substantial—especially in China [60]. This study has not taken the influence of higher tiers of government on local industrial policies into account. Doing that would certainly provide additional insight into the considerations municipal officials have when developing city brand identities and adopting popular city labels. Since this happens increasingly frequently, higher levels of awareness on how city branding is ‘done’ and what economic and ecological implications this has in the long term will remain highly relevant for both academics and policymakers.
Author Contributions
Conceptualization, M.d.J.; methodology, M.d.J. and M.H.; software, M.H.; validation, M.d.J., M.J.; formal analysis, M.H.; investigation, M.d.J.; resources, M.d.J.; data curation, M.H.; writing—original draft preparation, M.H.; writing—review and editing, M.d.J.; visualization, M.J.; supervision, M.J.; project administration, M.J.; funding acquisition, M.J.”
Funding
This research has been kindly supported by the National Natural Science Foundation of China (NSFC) (Grant No. 71774042; 71532004); the TU-Delft’s Initiative for Mobility and Infrastructures (DIMI) and the Erasmus Initiative for the Dynamics of Inclusive prosperity. The Key Program, National Science Foundation of China (Grant No. 71532004) will cover the costs for publishing in open access. The State Key Program of International Science and Technology Cooperation Foundation of China “Key technologies and demonstrations of comprehensive research on urban energy systems and carbon emissions” (No 2017YFE0101700).
Conflicts of Interest
The authors declare no conflict of interest.
Appendix A
Table A1.
City labels of categorization of secondary sector in Hubei Province.
Table A2.
Urban developmental pathways and city labels for Hunan Province.
Appendix B
Table A3.
Labels of categorization of secondary sector in Hubei Province.
Table A4.
Labels of categorization of secondary sector in Hunan Province.
Appendix C
Table A5.
Labels of categorization of the tertiary sector in Hubei Province.
Table A6.
City labels of categorization of tertiary sector in Hunan Province.
Appendix D
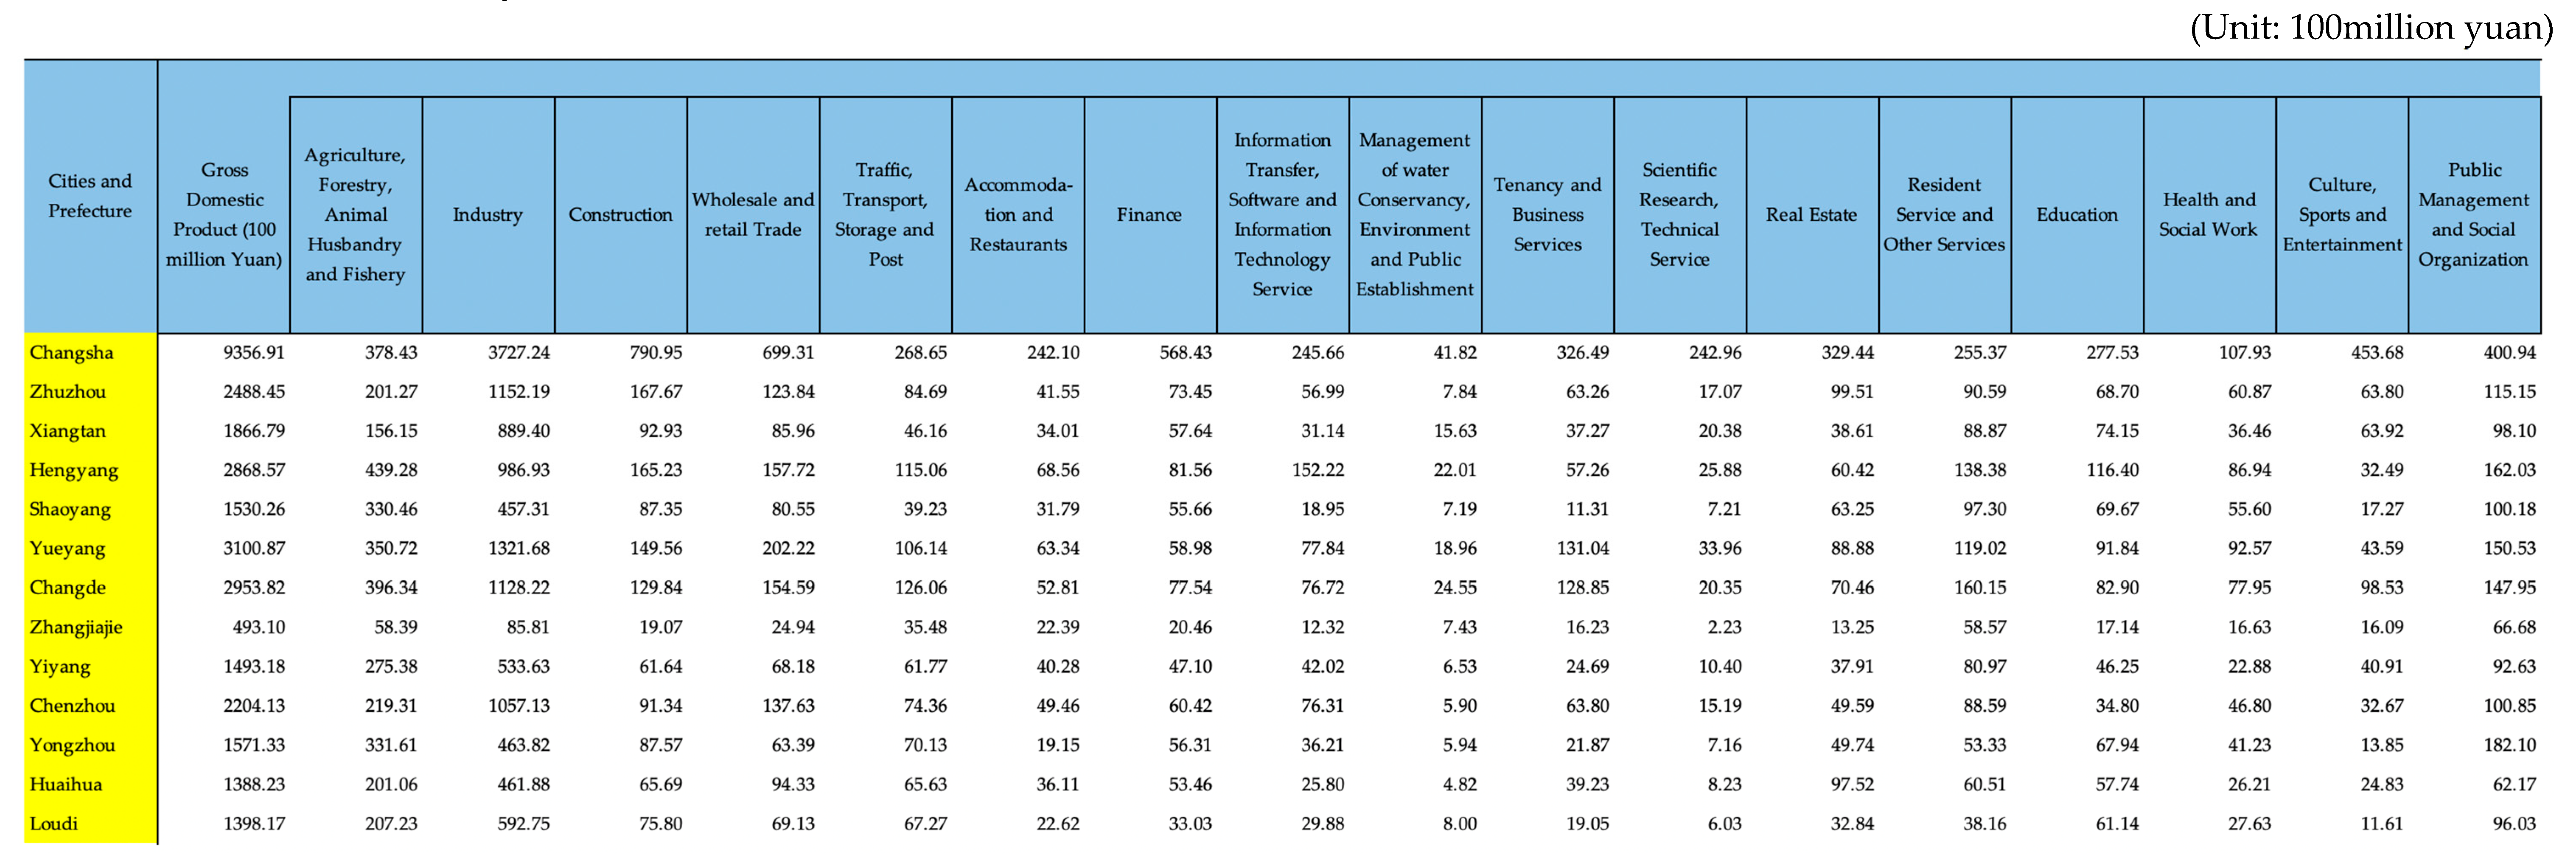
Gross Domestic Product by Sector (2016).
Figure A1.
Resources: Hunan Statistical Yearbook 2017.
Appendix E
Table A7.
Labels and corresponding key words of main pathways.
References
- Hou, J.; Teo, T.S.H.; Zhou, F.; Lim, M.K.; Chen, H. Does industrial green transformation successfully facilitate a decrease in carbon intensity in China? An environmental regulation perspective. J. Clean. Prod. 2018, 184, 1060–1071. [Google Scholar] [CrossRef] [Scilit]
- Xu, F. Empirical study on industrial structure adjustment and ecological environment quality—Based on data analysis of Shandong province from 2001 to 2012. J. Shangdong Inst. Bus. Technol. 2015, 29, 37–43. [Google Scholar]
- Huber, J. Towards industrial ecology: Sustainable development as a concept of ecological modernization. J. Environ. Policy Plan. 2000, 2, 269–285. [Google Scholar] [CrossRef] [Scilit]
- Jänicke, M. Ecological modernization: New perspectives. J. Clean. Prod. 2008, 16, 557–565. [Google Scholar] [CrossRef] [Scilit]
- Hajer, M.A. The Politics of Environmental Discourse: Ecological Modernization and the Policy Process; Clarendon Press: Oxford, UK, 1995. [Google Scholar]
- Sion, M.J. Theory of Ecological Modernization: Review and Prospect. Marx. Real. 2010, 1, 175–179. [Google Scholar]
- Bayulken, B.; Huisingh, D. A literature review of historical trends and emerging theoretical approaches for developing sustainable cities (Part 1). J. Clean. Prod. 2015, 109, 11–24. [Google Scholar] [CrossRef] [Scilit]
- Yu, C.; Dijkema, G.P.; De Jong, M.; Shi, H. From an eco-industrial park towards an eco-city: A case study in Suzhou, China. J. Clean. Prod. 2015, 102, 264–274. [Google Scholar] [CrossRef] [Scilit]
- Anttiroiko, A.V. City Branding as a Response to Global Intercity Competition. Growth Chang. 2015, 46, 233–252. [Google Scholar] [CrossRef] [Scilit]
- Dinnie, K. Introduction to the theory of city branding. In City Branding; Palgrave Macmillan: London, UK, 2011; pp. 3–7. [Google Scholar]
- Gammack, J.; Donald, S.H. Collaborative Methods in Researching City Branding: Studies from Hong Kong, Shanghai, and Sydney. Tour. Cult. Commun. 2006, 6, 171–180. [Google Scholar] [CrossRef] [Scilit]
- Kavaratzis, M. From city marketing to city branding: Towards a theoretical framework for developing city brands. Place Branding 2004, 1, 58–73. [Google Scholar] [CrossRef] [Scilit]
- Fisher, D.R.; Freudenburg, W.R. Ecological Modernization and Its Critics: Assessing the Past and Looking Toward the Future. Soc. Nat. Resour. 2001, 14, 701–709. [Google Scholar] [CrossRef] [Scilit]
- Mol, A.P.J. The Refinement of Production: Ecological Modernization Theory and the Chemical Industry; Van Arkel: Utrecht, The Netherlands, 1995. [Google Scholar]
- Hajer, M. The Politics of Environmental Discourse. Ecological Modernization and the Policy Process; Oxford University Press: New York, NY, USA; London, UK, 1995. [Google Scholar]
- Grossman, G.M.; Krueger, A.B. Economic growth and the environment. Quart. J. Econ. 1995, 110, 353–377. [Google Scholar] [CrossRef] [Scilit]
- Bicknell, K.B.; Ball, R.J.; Cullen, R.; Bigsby, H.R. New Methodology for the Ecological Footprint with an Application to the New Zealand Economy. Ecol. Econ. 1998, 27, 149–160. [Google Scholar] [CrossRef] [Scilit]
- Jianxing, L.; Wang, Q.; Chu, D.; Gu, X.; Li, G.; Liang, G. Input-output analysis of ecological footprint of China’s three major industries. Ecol. Environ. 2007, 16, 613–616. [Google Scholar]
- Cao, S.; Xie, G. Applying input-output analysis for calculation of ecological footprint of China. Acta Ecol. Sin. 2007, 27, 1499–1507. [Google Scholar]
- De Jong, M.; Chen, Y.; Joss, S.; Lu, H.; Zhao, M.; Yang, Q.; Zhang, C. Explaining city branding practices in China’s three mega-city regions: The role of ecological modernization. J. Clean. Prod. 2018, 179, 527–543. [Google Scholar] [CrossRef] [Scilit]
- Han, M.; De Jong, M.; Cui, Z.; Xu, L.; Lu, H.; Sun, B. City Branding in China’s Northeastern Region: How Do Cities Reposition Themselves When Facing Industrial Decline and Ecological Modernization? Sustainability 2018, 10, 102. [Google Scholar] [CrossRef] [Scilit]
- Duanlu, C.; Xiao, X. Influence of Industrial Structure on Ecological Quality. Hubei Agric. Sci. 2010, 49, 745–748. [Google Scholar]
- National Bureau of Statistics. 2013. Available online: http://www.stats.gov.cn/tjsj/tjbz/201301/t20130114_8675.html (accessed on 20 August 2019).
- Browning, H.L.; Singelmann, J. The Transformation of the U.S. Labor Force: The Interaction of Industry and Occupation. Politics Soc. 1978, 8, 481–509. [Google Scholar] [CrossRef] [Scilit]
- Yan, X. Information Industry and Urban Development; Science Press: Beijing, China, 1999. [Google Scholar]
- Goeldner, C.R.; Ritchie, J.B. Tourism: Principles, Practices, Philosophies, 12th ed.; John Wiley&Sons. Inc.: Marlton, NJ, USA, 2011; Volume 14, pp. 441–442. [Google Scholar]
- Yu, C.P.; Charles Chancellor, H.; Tian Cole, S. Examining the effects of tourism impacts on resident quality of life: Evidence from rural midwestern communities in USA. Int. J. Tour. Sci. 2011, 11, 161–186. [Google Scholar] [CrossRef] [Scilit]
- Sassen, S. The Global City: New York, London, Tokyo. Prince; Princeton University Press: New York, NY, USA, 2001. [Google Scholar]
- Ruoxiang, J. Making full use of advantages to promote the rise of high quality in the central region. China Econ. Trade Her. 2018, 916, 35–38. [Google Scholar]
- Chen, X.; Hu, T.; Ren, F.; Chen, D.; Li, L.; Gao, N. Landscape Analysis of Geographical Names in Hubei Province, China. Entropy 2014, 16, 6313–6337. [Google Scholar] [CrossRef] [Scilit]
- Ying, X.; Zeng, G.M.; Chen, G.Q.; Tang, L.; Wang, K.L.; Huang, D.Y. Combining AHP with GIS in synthetic evaluation of eco-environment quality—A case study of Hunan Province, China. Ecol. Model. 2007, 209, 97–109. [Google Scholar] [CrossRef] [Scilit]
- Li, X. Analysis of Ecological Footprint and Ecological Capacity of Hubei Province in 2008. Pioneer. Sci. Technol. Mon. 2010, 5, 3–5. [Google Scholar]
- Kavaratzis, M.; Ashworth, G.J. City branding: An effective assertion of identity or a transitory marketing trick? Place Branding 2006, 2, 83–194. [Google Scholar] [CrossRef] [Scilit]
- De Jong, M.; Chen, Y.; Lu, H.; Zhao, M. City Branding Practices and Urban Transitions in the Greater Pearl River Delta. In Sustainable Cities in Asia; Caprotti, F., Yu, L., Eds.; Routledge: London, UK, 2017. [Google Scholar]
- Hunan Statistical Yearbook. Available online: http://222.240.193.190/sjfb/tjnj/18tjnj/indexch.htm (accessed on 5 July 2018).
- Xiang, Y.Y. Demonstration of Hunan Third Industry’s Contribution to Economy Growth. Special Zone Econ. 2011, 12, 193–195. [Google Scholar]
- Zhang, L.; Wen, Q.; Huo, J.; Peng, X. Research on Sustainable Development of Hunan Province Based on Ecological Footprint and Grey Correlation Degree. Agric. Mod. Res. 2010, 31, 459–461. [Google Scholar]
- Hubei Statistical Yearbook. Available online: http://tjj.hubei.gov.cn/info/iIndex.jsp?cat_id=10055 (accessed on 5 July 2018).
- Chen, Z.; Fu, X.; Ping, H. Hubei: Building a Modern Communications Network. China Today 2000, 10, 22–25. [Google Scholar]
- Li, L.; Ren, M.; Liang, J. Study on Ecological Characteristics of Regional Urbanization in Hubei Province of China. Ekol. Dergisi 2018, 27, 677–686. [Google Scholar]
- Central Government of PRC. Available online: http://www.gov.cn/gongbao/content/2010/content_1555960.htm (accessed on 20 August 2019).
- Fang, Y.; Bi, D. Discussion on the Classification of Domestic and Foreign Service industry. Explor. Int. Econ. Trade 2008, 24, 72–76. [Google Scholar]
- Qiao, X.; Wang, G.; Zheng, C. A study on the status of China’s service industry and its subdivisions in the global value chain based on the perspective of “status-participation-dominant comparative advantage. Int. Trade 2017, 2, 99–108. [Google Scholar]
- Lynch, K. The Image of the City; MIT Press: Cambridge, UK, 1960; Volume 11. [Google Scholar]
- Riza, M.; Doratli, N.; Fasli, M. City branding and identity. Procedia Soc. Behav. Sci. 2012, 35, 293–300. [Google Scholar] [CrossRef] [Scilit]
- Ma, W.; Schraven, D.; de Bruijne, M.; de Jong, M.; Lu, H. Tracing the Origins of Place Branding Research: A Bibliometric Study of Concepts in Use (1980–2018). Sustainability 2019, 11, 2999. [Google Scholar] [CrossRef] [Scilit]
- Shepherd, R. Commodification, culture and tourism. Tour. Stud. 2002, 2, 183–201. [Google Scholar] [CrossRef] [Scilit]
- White, C.J. Culture, Emotions and Behavioural Intentions: Implications for Tourism Research and Practice. Curr. Issues Tour. 2005, 8, 510–531. [Google Scholar] [CrossRef] [Scilit]
- Wang, X.; Wang, S. The Hub-and-Spoke Logistics Network System in Central China Based on Road and Railway Transportation Cost. Progress Geogr. 2012, 31, 1583–1590. [Google Scholar]
- Gao, Z. Quantitative Analysis of China’s Service Industry Segmentation and Economic Growth. Travel Together 2016, 9, 124–125. [Google Scholar]
- Wang, S.; Hu, Z. Study on productivity changes and heterogeneity of China’s service industry. Econ. Res. 2012, 4, 15–27. [Google Scholar]
- De Jong, M.; Joss, S.; Schraven, D.; Zhan, C.; Weijnen, M. Sustainable–smart–resilient–low carbon–eco–knowledge cities; making sense of a multitude of concepts promoting sustainable urbanization. J. Clean. Prod. 2015, 109, 25–38. [Google Scholar] [CrossRef] [Scilit]
- Kang, Y.Q.; Xie, B.C.; Wang, J.; Wang, Y.N. Environmental assessment and investment strategy for China’s manufacturing industry: A non-radial DEA based analysis. J. Clean. Prod. 2018, 175, 501–511. [Google Scholar] [CrossRef] [Scilit]
- Price, L.; Worrell, E.; Martin, N.; Lehman, B.; Sition, J. China’s industrial sector in an international context. Off. Sci. Technol. Inf. Technol. Rep. 2000, 58, 209–211. [Google Scholar]
- Li, J.; Lin, B. Ecological total-factor energy efficiency of China’s heavy and light industries: Which performs better? Renew. Sustain. Energy Rev. 2017, 72, 83–94. [Google Scholar] [CrossRef] [Scilit]
- Li, H.; Shi, J.F. Energy efficiency analysis on Chinese industrial sectors: An improved Super-SBM model with undesirable outputs. J. Clean. Prod. 2014, 65, 97–107. [Google Scholar] [CrossRef] [Scilit]
- Insch, A. Positioning cities: Innovative and sustainable strategies for city development and transformation. Place Branding Public Dipl. 2014, 10, 249–252. [Google Scholar] [CrossRef] [Scilit]
- Chu, Z. Logistics and economic growth: A panel data approach. Ann. Reg. Sci. 2012, 49, 87–102. [Google Scholar] [CrossRef] [Scilit]
- Wang, J. Empirical Analysis on the Effects of Chinese Logistics Industry on Economic Growth. Sci. Tech. Inf. Dev. Econ. 2014, 14, 69–70. [Google Scholar]
- Lu, H.; De Jong, M.; Chen, Y. Economic city branding in China: The multi-level governance of municipal self-promotion in the Greater Pearl River Delta. Sustainability 2017, 9, 496. [Google Scholar] [CrossRef] [Scilit]

© 2019 by the authors. Licensee MDPI, Basel, Switzerland. This article is an open access article distributed under the terms and conditions of the Creative Commons Attribution (CC BY) license (http://creativecommons.org/licenses/by/4.0/).