


Abstract
Systematic comparisons of how plants with contrasting ecological strategies respond to extremely wide nutrient availability gradients remain limited. We investigated the physiological, photosynthetic, and growth adaptations of four plant species representing distinct ecological strategies: Triticum aestivum L. (C3 annual crop), Zea mays L. (C4 annual crop), Ipomoea aquatica Forssk. (C3 annual/perennial aquatic vegetable), and Canna glauca L. (C3 perennial wetland ornamental). Plants were grown hydroponically under nitrogen (N), phosphorus (P), and potassium (K) gradients ranging from 0% to 500% of standard Hoagland nutrient solution. The study results showed that all measured plant traits exhibited characteristic unimodal dose–response patterns. Optimal performance mostly occurred at 100–150% nutrient availability gradients. Severe inhibition or mortality occurred at extreme gradients. Simultaneously, different plant species displayed markedly varying response amplitudes and nutrient-specific sensitivities. Z. mays showed the highest nutrient use efficiency and broadest optimal ranges, particularly for N and K. C. glauca exhibited extraordinary N responsiveness (32-fold increase in photosynthetic rate) but narrow optimal ranges (e.g., 1.01 ± 0.15 μmol CO2/(m2·s) at the 1% N treatment vs. 32.52 ± 3.33 μmol CO2/(m2·s) at the 150% N treatment). I. aquatica showed pronounced P limitation with broad tolerance to supra-optimal N and K. T. aestivum displayed moderate responses with clear sensitivity to N limitation. Root–shoot ratios declined systematically with increasing nutrient availability across all plant species, following negative exponential functions. The results of data analyses revealed significant effects of N, P, and K availability on all the determined plant traits. Correlation analyses demonstrated tight coupling effects among physiological, photosynthetic, and growth traits, indicating integrated whole-plant responses to nutrient variations. These findings reveal that plant ecological strategy systematically modulates nutrient response patterns and provide a quantitative framework for species-specific nutrient management. This study provides a theoretical basis for precision fertilization of aquatic vegetables and wetland plants, and more broadly support species-specific nutrient management in controlled-environment agriculture.
1. Introduction
Mineral nutrients are fundamental determinants of plant growth, development, and physiological performance. Thereinto, nitrogen (N), phosphorus (P), and potassium (K) play essential yet distinct roles in plant metabolism. N is a core component of proteins, nucleic acids, and chlorophyll [1]. P is critical for energy transfer (ATP), nucleic acid structure, and signal transduction [1]. K functions in osmotic regulation, stomatal movement, and enzyme activation [1]. Understanding how plants respond to varying nutrient availability has been a central theme in plant nutrition and physiological research for over a century, mainly driven by both fundamental questions about plant physiology and practical applications in plant cultivation and ecosystem management [1,2].
It is documented that the relationship between nutrient availability and plant performance typically follows a nonlinear dose–response pattern [3,4,5]. Plant performance increases from severe deficiency to an optimum, then declines under excess due to toxicity or osmotic stress [3,4,5]. This fundamental pattern, grounded in the law of diminishing returns, has been documented across diverse plant species and environmental conditions. However, systematic comparisons of interspecific differences in dose–response curve parameters across a wide nutrient gradient remain limited. Most studies use only two or three nutrient levels, precluding rigorous characterization of full response curves including both deficiency and toxicity ranges [3,4,5].
Recent advances in plant nutrition and physiological research have emphasized the necessity of understanding plant responses to nutrient availability within an ecological and evolutionary framework [6]. The concept of plant ecological strategies, as embodied in the leaf economics spectrum and related frameworks, posits that plant species evolve coordinated suites of traits reflecting fundamental trade-offs between resource acquisition and self-conservation [7]. Fast-growing plant species adapted to high-resource environments typically exhibit high water use efficiency, high photosynthetic rate, pronounced tissue nutrient concentration, and rapid biomass accumulation, with the traits that should theoretically confer high responsiveness to nutrient addition [8]. Conversely, slow-growing plant species from low-resource environments often display more self-conservative strategies, with relative lower metabolic rates and greater investment in structural and defensive compounds [9].
The relevance of plant ecological strategy to nutrient availability has been supported by several recent studies [10,11,12,13,14,15]. Global analyses of leaf photosynthetic traits revealed that maximum carboxylation rate (Vcmax) and maximum electron transport rate (Jmax) correlated strongly with leaf N and P concentrations, but the slopes of these relationships varied systematically among plant functional types [10,11]. Studies in temperate forests demonstrated that herbaceous and woody plants occupied distinct positions along the leaf economics spectrum, with herbaceous species distributing in varying micro-ecological niches but exhibiting higher nutrient concentrations and photosynthetic rates than woody species occupying dominant places [12,13]. Similarly, studies in alpine grasslands showed that root functional traits responded differentially to N and P additions depending on root order and species identity [14,15].
Despite this growing recognition of plant ecological strategy as a modulator of nutrient responses, several critical knowledge gaps still remain. Currently, the most comparative studies have preferentially examined the responses of plant physiological and photosynthetic traits to a limited number of nutrient levels (typically deficiency vs. sufficiency), precluding rigorous characterization of full dose–response patterns including both deficiency and toxicity ranges [4,16,17]. Although many studies have focused on single nutrients, systematic investigations of multiple nutrients on plant physiological, photosynthetic, and growth traits within a unified experimental framework are still rare [1,2,18]. Furthermore, comprehensive trait assessments that simultaneously evaluate growth, gas exchange, photosynthetic characteristics, and biomass allocation across multiple plant species are really uncommon [19,20,21]. This limits our ability to understand how different plant physiological processes coordinate in response to nutrient variations.
We systematically examined the dose-responses of growth, gas exchange, photosynthesis, and biomass allocation to a 500-fold concentration gradient of N, P, and K in four species with contrasting ecological strategies [22,23,24,25]. We quantified species-specific optima, sensitivity thresholds, and the coordination among traits. Our goal was to determine whether ecological strategy would predict nutrient response patterns and to provide quantitative guidelines for species-specific nutrient management.
2. Materials and Methods
2.1. Experimental Materials
We designed this study to address these knowledge gaps through a systematic investigation of N, P, and K dose–response relationships across a 500-fold concentration gradient. By employing ten availability gradients spanning from complete deficiency (0% of standard Hoagland nutrient solution) to extreme toxicity (500%), we aimed to: (1) characterize the full dose–response patterns for key physiological, photosynthetic, and growth traits under N, P, and K variation; (2) compare response patterns among plant species with different ecological strategies; (3) assess the coordination among physiological traits, photosynthetic parameters, growth characteristics, and biomass allocation; and (4) identify species-specific nutrient optima and sensitivity thresholds.
To increase the ecological and physiological breadth of our findings, we selected four plant species representing contrasting ecological strategies as the experimental materials: Triticum aestivum L., a C3 annual crop domesticated in fertile agricultural environments; Zea mays L., a C4 annual crop with high photosynthetic capacity and productivity potential; Ipomoea aquatica Forssk., a fast-growing C3 annual or perennial aquatic vegetable adapted to nutrient-rich wetlands; and Canna glauca L., a C3 wetland perennial with ornamental value and more conservative growth characteristics (Table 1) [22,23,24,25]. Seeds were obtained from the certified sources. They were surface-sterilized with 3% hydrogen peroxide (H2O2) for 5 min, followed by thorough rinsing with deionized water [26]. Seeds were germinated on moist filter paper in the dark at 25 °C for 5 days. Uniform seedlings at the two-leaf stage were selected and transferred to hydroponic systems.
Table 1.
Basic biological information for the four experimental plant species.
We selected these four plant species as the experimental materials to represent distinct positions along the leaf economics spectrum (LES). The LES describes a fundamental trade-off between fast resource acquisition and resource conservation [27]. Fast-growing species typically exhibit high specific leaf area (SLA), high leaf nitrogen concentration, high photosynthetic rates, and low leaf mass per area (LMA) [27], while slow-growing species usually show opposite patterns.
T. aestivum is a C3 annual cereal domesticated in fertile agricultural environments. Recent study has positioned it on the “fast” end of the LES relative to non-crop grasses [28]. T. aestivum exhibits high photosynthetic rates, high leaf N concentration, and rapid return on carbon investment [28]. This acquisitive strategy makes T. aestivum highly responsive to nutrient addition but also sensitive to nutrient limitation.
Z. mays is a C4 annual cereal with high photosynthetic capacity and productivity potential. The C4 photosynthetic pathway confers superior nitrogen use efficiency. This allows Z. mays to maintain high photosynthetic rates even under moderate N limitation. Z. mays represents an extreme acquisitive strategist [29]. Its high nutrient demand and rapid growth make it ideal for studying nutrient response at high supply levels.
I. aquatica is a fast-growing C3 aquatic vegetable adapted to nutrient-rich wetlands. It can grow as an annual or perennial. Aquatic plants typically have high SLA, high tissue nutrient concentrations, and high photosynthetic plasticity [30]. I. aquatica represents an acquisitive strategy but with tolerance to fluctuating nutrient conditions. This makes it useful for studying nutrient excess tolerance.
C. glauca is a C3 perennial wetland ornamental with more conservative growth characteristics. Perennials generally exhibit lower SLA, higher LMA, and longer leaf lifespan compared to annuals. However, as a wetland species, C. glauca also shows high responsiveness to N supply. This combination of conservative and acquisitive traits positions C. glauca uniquely along the LES [31]. It allows us to test how perennial species from high-resource habitats respond to nutrient variation.
2.2. Experimental Design
We used hydroponic culture to precisely control the supply levels of N, P, and K. The basal nutrient solution was modified from Hoagland nutrient solution, ensuring adequate and consistent concentrations of all the other macro- and micro-nutrients [32]. Three independent experimental series were established; each varied the concentration of a single nutrient (N, P, or K) while keeping all the other nutrients at the levels of standard Hoagland nutrient solution. In the standard Hoagland nutrient solution (100% gradient), the molar concentrations are 26.25 mmol/L for N, 2.50 mmol/L for P, and 10.00 mmol/L for K [32].
For each experimental nutrient, ten availability gradients were applied, expressed as percentages of the standard Hoagland nutrient concentration: 0% (complete deficiency), 1%, 10%, 25%, 50%, 100% (control), 150%, 200%, 300%, and 500% (extreme excess) (Table 2). This gradient was designed to capture the full dose–response curve of plant traits from deficiency to toxicity. The 0% and 500% treatments resulted in plant mortality and were excluded from final data analyses.
Table 2.
Nitrogen, phosphorus, and potassium availability gradients used in the three experimental treatments.
The experiment followed a completely randomized block design. For each plant species and nutrient treatment, five independent biological replicates were established. Each replicate was a separate beaker with one plant. This resulted in a total of 4 plant species × 3 nutrient treatments × 10 availability gradients × 5 replicates = 600 experimental units. All treatments were randomly arranged to minimize systematic errors.
Plants were grown in 2 L glass beakers; and each beaker was wrapped in black opaque plastic bag to exclude light from the root zone. Seedlings were supported by plastic planting cups with rock wool to hold the stem base. Nutrient solutions were prepared fresh before each application and completely replaced every five days to maintain stable concentrations and prevent accumulation of root exudates. Between changes, deionized water was added daily to compensate for evapotranspiration losses and maintain constant volume. The pH of all solutions was adjusted to 5.5–6.0 using 1 mol/L NaOH or HCl to ensure optimal solubility and bioavailability of all nutrients.
Plants were grown in a controlled-climate chamber (MGC-450HP, Shanghai Yiheng Technical Co., Ltd., Shanghai, China) under the following conditions: photoperiod 12 h light/12 h dark, photosynthetically active radiation 300 μmol/(m2·s), temperature 28 °C day/20 °C night, and relative humidity 65–75%. The experiment lasted 42 days after transplanting, at which time all plants were harvested for trait measurements.
2.3. Sample Collection and Data Determination
After 42 days of hydroponic cultivation, we collected all experimental data. Plant height was measured from the stem base to the stem apex using a ruler. Gas exchange measurements were conducted on the youngest fully expanded leaves between 10:00 and 11:30 a.m. using a LI-6800 portable photosynthesis system (LI-COR Biosciences, LI-COR, Lincoln, NE, USA) [33]. Conditions in the measurement cuvette were: photosynthetically active radiation = 1200 μmol/(m2·s), CO2 concentration = 400 μmol/mol, leaf temperature = 25 °C, and relative humidity = 60–70%. Measurements were taken after stabilization (typically 3–5 min). Parameters recorded included: net photosynthetic rate (μmol CO2/(m2·s)), transpiration rate (mmol H2O/(m2·s), and stomatal conductance (mol H2O/(m2·s)).
We harvested all plant individuals and separated them into shoots (stems and leaves) and roots. Roots were rinsed with deionized water to remove nutrient solution. All plant tissues were oven-dried at 40–45 °C to constant weight and weighed. Biomass parameters included: shoot biomass (g), root biomass (g), plant biomass (i.e., total biomass; g), and root–shoot ratio (%). Root–shoot ratio was calculated as root dry weight divided by shoot dry weight, expressed as a percentage.
2.4. Statistical Analyses
All statistical analyses were performed using R version 4.2.1 (R Foundation for Statistical Computing, Vienna, Austria) [34]. Data were tested for normality using Shapiro–Wilk tests and for homogeneity of variance using Levene’s tests [35,36]. Transformations were applied when necessary to meet ANOVA assumptions.
One-way analysis of variance (ANOVA) was performed separately for each plant species and nutrient treatment to analyze the effects of N, P, and K on the determined traits of the four experimental plant species. Post hoc comparisons among gradients means used Tukey’s HSD test at α = 0.05. Pearson correlation coefficients were calculated among all measured traits separately for each plant species and nutrient treatment. Significance levels were denoted as * p < 0.05, ** p < 0.01, and *** p < 0.001.
To quantify the coupling relationships among gas exchange parameters including stomatal conductance, photosynthetic rate, and transpiration rate, linear regression analyses were performed for each plant species and nutrient treatment separately in R. Models:
where y and x are pairs of gas exchange parameters (i.e., stomatal conductance vs. photosynthetic rate, stomatal conductance vs. transpiration rate, or transpiration rate vs. photosynthetic rate); a is the intercept; and b is the slope of the linear relationship.
y = a + bx,
For root–shoot ratio dynamics, nonlinear regression was performed using the Nonlinear Least Squares function in R. Models:
where y is root–shoot ratio (%); x is nutrient availability gradient (%); a is the root–shoot ratio when nutrient availability gradient is 1 (i.e., 100%); and b is the decrease rate of root–shoot ratio with the increase in nutrient availability gradients.
y = ax−b,
3. Results
3.1. Dose–Response Patterns of Plant Growth Indicators
Fast-growing plant species at the “acquisitive” end with high nutrient concentrations and photosynthetic rates, and conservative species at the opposite end prioritizing structural investment over rapid resource capture [12,37,38]. We hypothesized that plant species with faster growth strategies (Z. mays and I. aquatica) would exhibit steeper initial responses to nutrient addition and broader optimal ranges, while the more conservative species (T. aestivum and C. glauca) would show flatter response patterns and lower maximum performance. To test our hypothesis, we measured plant height and biomass.
3.1.1. Plant Height
Plant height, as an integrative measure of cumulative resource acquisition and growth performance, exhibited characteristic unimodal dose–response patterns across all four plant species and three nutrients, with the optimum consistently occurring at 100–150% of standard Hoagland concentrations (Figure 1). Furthermore, the magnitude of response and the breadth of optimal ranges varied substantially among plant species in ways that reflected their distinct ecological strategies.
Figure 1.
Dose–response dynamics of plant height in four plant species grown under nitrogen (N), phosphorus (P), and potassium (K) availability gradients: (a) T. aestivum, (b) Z. mays, (c) I. aquatica, and (d) C. glauca. Data are means ± SE (n = 5 biological replicates per treatment). Different lowercase letters (a, b, c, d, and e) within each colored treatment (green for N, dark gray for P, and brown for K) indicate statistically significant differences in plant height among nutrient availability gradients based on One-way ANOVA followed by Tukey’s HSD post hoc test (α = 0.05).
T. aestivum showed moderate height responses with clear optimal ranges. Under the N treatment, plant height increased progressively from 5.5 ± 0.7 cm at 1% gradient to 22.3 ± 3.4 cm at 100%, reaching a maximum of 25.6 ± 3.8 cm at 150% before declining to 8.8 ± 0.9 cm at 300% (Figure 1a). The response patterns for the P and K treatment were similar with the N treatment, though the decline at supra-optimal gradients was relatively milder, suggesting greater tolerance to P and K excess compared to N excess.
Z. mays displayed the most pronounced height responses, with the steepest increase from deficiency to optimum and the highest absolute values across all three experimental nutrients. Under the N treatment, plant height increased from 11.7 ± 1.9 cm at 1% gradient to 55.4 ± 6.8 cm at 100%, peaking at 67.8 ± 7.4 cm at 150% before declining to 28.7 ± 4.2 cm at 300% (Figure 1b). This nearly six-fold increase from extreme deficiency to optimum reflected the high N demand and growth plasticity as a C4 species. The P and K treatments produced similar patterns, though optimal heights in the P treatment were slightly lower than in the N and K treatments, suggesting that N and K were the primary growth-limiting nutrients.
I. aquatica exhibited more moderate height responses with relatively flat curves at supra-optimal gradients. Maximum heights reached 19.4 ± 2.5 cm under the N treatment (150%), 17.4 ± 1.9 cm under the P treatment (150%), and 18.7 ± 1.9 cm under the K treatment (150%) (Figure 1c). Notably, I. aquatica maintained relatively high heights even at 300% gradients (approximately 80% of optimum), suggesting its pronounced tolerance to nutrient excess as an adaptation consistent with its native aquatic habitats where nutrient concentrations could fluctuate widely.
C. glauca displayed intermediate height responses with distinctive nutrient-specific patterns. Maximum heights reached 39.8 ± 4.7 cm under optimal N supply (150%), 37.9 ± 4.1 cm under optimal P supply (150%), and 39.1 ± 4.2 cm under optimal K supply (150%) (Figure 1d). Unlike the other three plant species, C. glauca showed relatively high heights at 200% and 300% K gradients, indicating its superior K tolerance. However, under the P treatment, C. glauca was particularly sensitive to low gradients, with heights at 1% and 10% P supplies substantially lower than in corresponding the N and K treatments.
3.1.2. Plant Biomass
Plant biomass integrated the growth responses observed from height parameter, with all plant species exhibiting strong unimodal patterns and species-specific differences in magnitude and optimal ranges (Figure 2).
Figure 2.
Dose–response dynamics of plant biomass in four plant species grown under nitrogen (N), phosphorus (P), and potassium (K) availability gradients: (a) T. aestivum, (b) Z. mays, (c) I. aquatica, and (d) C. glauca. Data are means ± SE (n = 5 biological replicates per treatment). Different lowercase letters (a, b, c, d, e, and f) within each colored treatment (green for N, dark gray for P, and brown for K) indicate statistically significant differences in plant biomass among nutrient availability gradients based on One-way ANOVA followed by Tukey’s HSD post hoc test (α = 0.05).
T. aestivum biomass increased progressively to 150% across all three experimental nutrients. At optimal supply, plant biomass reached 3.75 ± 0.39 g under the N treatment (15.6-fold increase), 3.76 ± 0.37 g under the P treatment (18.8-fold increase), and 3.69 ± 0.38 g under the K treatment (12.7-fold increase) (Figure 2a). The narrower optimal ranges and lower absolute biomass compared to Z. mays reflect its more moderate growth strategy and lower resource demand.
Z. mays achieved the highest absolute biomass among the four plant species. Maximum values occurred at 150% gradient for all three experimental nutrients: 6.45 ± 0.68 g under the N treatment (34-fold increase from 0.19 ± 0.02 g at 1% N), 6.63 ± 0.68 g under the P treatment (55-fold increase from 0.12 ± 0.02 g at 1% P), and 6.36 ± 0.67 g under the K treatment (23-fold increase from 0.28 ± 0.03 g at 1% K) (Figure 2b). The dramatic P response (55-fold increase) was particularly striking, suggesting that while Z. mays requires substantial P for optimal growth, it possesses remarkable capacity to utilize available P when supplied.
I. aquatica reached peak biomass at 150% N (4.33 ± 0.44 g, 22-fold increase), with slightly lower maxima under the P (4.08 ± 0.39 g, 16-fold increase) and K (4.05 ± 0.41 g, 13-fold increase) treatment (Figure 2c). The relatively flat response curves at supra-optimal gradients, particularly for N and K, reinforced the pattern of nutrient excess tolerance observed for height.
C. glauca achieved the highest total biomass overall, reaching 8.99 ± 0.88 g at 150% N, a remarkable 27-fold increase from 0.33 ± 0.04 g at 1% N (Figure 2d). This extraordinary N responsiveness contrasted with more moderate but still substantial increases under the P (6.41 ± 0.61 g, 26-fold increase) and K (6.57 ± 0.68 g, 25-fold increase) treatment. The combination of high maximum biomass and steep response curves suggested that C. glauca, despite its perennial life history and conservative strategy in some respects, possesses high growth potential when N limitation is alleviated.
3.2. The Coupling Effect of Gas Exchange and Photosynthetic Parameters
C4 plant species could achieve superior nitrogen economy through type II cell wall architecture that reduces structural nitrogen investment, with high photosynthetic nitrogen use efficiency [39,40,41]. We hypothesize that C4 species (Z. mays) demonstrate higher nutrient use efficiency, particularly for N, given the metabolic advantages of the C4 photosynthetic pathway. To test our hypothesis, we measured transpiration rate, stomatal conductance, and photosynthetic rate in T. aestivum, Z. mays, I. aquatica, and C. glauca under varying nutrient conditions.
3.2.1. Transpiration Rate
Transpiration rate followed characteristic unimodal patterns across all plant species and nutrients, increasing from minimal values at 1% gradient to maxima at 100–150% before declining at higher gradients (Figure 3). However, the amplitude and timing of responses differed markedly among plant species and nutrients.
Figure 3.
Dose–response dynamics of transpiration rate in four plant species grown under nitrogen (N), phosphorus (P), and potassium (K) availability gradients: (a) T. aestivum, (b) Z. mays, (c) I. aquatica, and (d) C. glauca. Data are means ± SE (n = 5 biological replicates per treatment). Different lowercase letters (a, b, c, d, e, and f) within each colored treatment (green for N, dark gray for P, and brown for K) indicate statistically significant differences in transpiration rate among nutrient availability gradients based on One-way ANOVA followed by Tukey’s HSD post hoc test (α = 0.05).
T. aestivum showed the steepest relative response, with transpiration under the N treatment increasing nearly 60-fold from 0.08 ± 0.01 mmol H2O/(m2·s) at 1% to 4.68 ± 0.53 mmol H2O/(m2·s) at 150% (Figure 3a). The steep decline at supra-optimal N gradients (300%: 2.81 ± 0.31 mmol H2O/(m2·s)) suggested greater toxicity sensitivity for N compared to P and K.
Z. mays exhibited the highest absolute transpiration rates, reaching 6.72 ± 0.71 mmol H2O/(m2·s) under optimal N (150%) and 6.79 ± 0.71 mmol H2O/(m2·s) under optimal K (150%) (Figure 3b). The response to P was notable for relatively high transpiration at low concentrations (1.63 ± 0.18 mmol H2O/(m2·s) at 1% P vs. 0.66 ± 0.07 mmol H2O/(m2·s) at 1% N), suggesting that early-season transpiration was less constrained by P than by N, with a pattern also observed in T. aestivum.
I. aquatica displayed intermediate transpiration rates with peak values of 6.36 ± 0.65 mmol H2O/(m2·s) under the K treatment at 150% (Figure 3c). In addition, I. aquatica maintained relatively high transpiration at supra-optimal concentrations (300% treatments still exceeding 60% of maximum), consistent with its adaptation to aquatic environments where water loss is less constraining.
C. glauca exhibited the most striking nutrient-specific differences (Figure 3d). Under the N treatment, transpiration continued increasing through 200% (9.74 ± 0.87 mmol H2O/(m2·s)) before declining at 300%, a shift in the optimum to higher gradients than observed in the other plant species. This suggested that C. glauca, as a wetland perennial, might have greater capacity to utilize supra-optimal N without triggering toxicity responses. Under the P and K treatments, however, transpiration peaked at 100–150% and declined sharply, indicating differential nutrient-specific sensitivities.
3.2.2. Stomatal Conductance
Stomatal conductance patterns largely paralleled those of transpiration, with all plant species showing progressive increases from deficiency to optimum followed by declines at supra-optimal concentrations (Figure 4).
Figure 4.
Dose–response dynamics of stomatal conductance in four plant species grown under nitrogen (N), phosphorus (P), and potassium (K) availability gradients: (a) T. aestivum, (b) Z. mays, (c) I. aquatica, and (d) C. glauca. Data are means ± SE (n = 5 biological replicates per treatment). Different lowercase letters (a, b, c, d, e, and f) within each colored treatment (green for N, dark gray for P, and brown for K) indicate statistically significant differences in stomatal conductance among nutrient availability gradients based on One-way ANOVA followed by Tukey’s HSD post hoc test (α = 0.05).
I. aquatica exhibited the highest absolute stomatal conductance values among all four plant species (0.37 ± 0.04 mol H2O/(m2·s) under optimal N), consistent with its aquatic adaptation and high water availability in native habitats (Figure 4c). Z. mays showed the lowest absolute values (maximum 0.17–0.18 mol H2O/(m2·s)), reflecting its more conservative water use strategy as a C4 plant (Figure 4b), while T. aestivum and C. glauca displayed intermediate values with species-specific variations in nutrient sensitivity (Figure 4a).
For C. glauca, stomatal conductance under the K treatment showed remarkably broad optimal ranges, with high values maintained from 150% through 300% (Figure 4d). This pattern, combined with the transpiration data, indicated that C. glauca possesses exceptional K tolerance, an adaptation that may reflect its evolutionary history in wetland soils where K availability can be highly variable.
3.2.3. Photosynthetic Rate
Photosynthetic rate responses largely paralleled transpiration and stomatal conductance patterns but with important distinctions that revealed species-specific differences in photosynthetic capacity and nutrient sensitivity (Figure 5).
Figure 5.
Dose–response dynamics of photosynthetic rate in four plant species grown under nitrogen (N), phosphorus (P), and potassium (K) availability gradients: (a) T. aestivum, (b) Z. mays, (c) I. aquatica, and (d) C. glauca. Data are means ± SE (n = 5 biological replicates per treatment). Different lowercase letters (a, b, c, d, e, and f) within each colored treatment (green for N, dark gray for P, and brown for K) indicate statistically significant differences in photosynthetic rate among nutrient availability gradients based on One-way ANOVA followed by Tukey’s HSD post hoc test (α = 0.05).
T. aestivum increased from 1.87 ± 0.22 μmol CO2/(m2·s) at 1% N to 22.46 ± 2.25 μmol CO2/(m2·s) at 150% N, a 12-fold increase substantially less than the 60-fold increase in transpiration rate (Figure 5a). This divergence explained the water use efficiency patterns described below: at very low N supply, photosynthesis was less severely inhibited than transpiration; as N increased, photosynthesis recovered more slowly than transpiration, causing water use efficiency to increase progressively.
Z. mays reached 24.05 ± 2.56 μmol CO2/(m2·s) under optimal N (150%), with relatively high values maintained at 300% (15.28 ± 1.61 μmol CO2/(m2·s)) (Figure 5b). The response to K was notable for relatively high photosynthetic rate at low concentrations (3.92 ± 0.43 μmol CO2/(m2·s) at 1% K vs. 2.94 ± 0.33 μmol CO2/(m2·s) at 1% N), consistent with the pattern that early photosynthesis was less K-limited than N-limited.
I. aquatica peaked at 19.75 ± 2.15 μmol CO2/(m2·s) under the P treatment at 150%, with the P response curve notably broader than for N or K (Figure 5c). This suggested that I. aquatica, despite its aquatic adaptation, might have particularly high P requirements for optimal photosynthetic performance, a pattern consistent with the P limitation observed in biomass responses.
C. glauca exhibited the most dramatic photosynthetic response to N, increasing 32-fold from 1.01 ± 0.15 μmol CO2/(m2·s) at 1% N to 32.52 ± 3.33 μmol CO2/(m2·s) at 150% N, the highest photosynthetic plasticity among all four plant species (Figure 5d). The continued increase through 150% followed by sharp decline at 200–300% indicated a narrow optimal range but extraordinary responsiveness within that range. Under the P and K treatments, maximum photosynthetic rates were substantially lower (P: 24.56 ± 2.51 μmol CO2/(m2·s); K: 23.87 ± 2.44 μmol CO2/(m2·s)), confirming that N was the primary limiting nutrient for photosynthetic capacity.
3.2.4. Coordination Among Gas Exchange and Photosynthetic Parameters
The strong coupling effects among transpiration rate, stomatal conductance, and photosynthetic rate across all four plant species and three experimental nutrients revealed the integrated nature of gas exchange physiology (Figure 6). For all plant species, these three parameters increased in concert along nutrient gradients, indicating that stomatal behavior and photosynthetic capacity responded to nutrient availability as a coordinated system rather than as independent processes.
Figure 6.
Coupling relationships among transpiration rate, stomatal conductance, and photosynthetic rate of plant leaves for T. aestivum; Z. mays; I. aquatica; and C. glauca grown under nitrogen (N), phosphorus (P), and potassium (K) treatments: (a) positive linear relationship between stomatal conductance and photosynthetic rate of four plants in the N treatment; (b) positive linear relationship between stomatal conductance and transpiration rate of four plants in the N treatment; (c) positive linear relationship between transpiration rate and photosynthetic rate of four plants in the N treatment; (d) positive linear relationship between stomatal conductance and photosynthetic rate of four plants in the P treatment; (e) positive linear relationship between stomatal conductance and transpiration rate of four plants in the P treatment; (f) positive linear relationship between transpiration rate and photosynthetic rate of four plants in the P treatment; (g) positive linear relationship between stomatal conductance and photosynthetic rate of four plants in the K treatment; (h) positive linear relationship between stomatal conductance and transpiration rate of four plants in the K treatment; and (i) positive linear relationship between transpiration rate and photosynthetic rate of four plants in the K treatment. Each data point represents one biological replicate (n = 5 per treatment level) across all ten nutrient availability gradients (1%, 10%, 25%, 50%, 100%, 150%, 200%, 300%, 500%).
In T. aestivum, the relationships among these parameters were remarkably linear across the full nutrient gradient, suggesting tight coupling between stomatal regulation and photosynthetic demand regardless of nutrient status. In Z. mays, the relationships also showed followed a positive linear pattern, reflecting the C4 photosynthetic pathway’s efficient coordination of CO2 concentrating mechanisms with stomatal behavior. I. aquatica displayed the shallowest initial slopes among the four plant species, indicating that small increases in stomatal conductance translated into only modest gains in photosynthetic rate, a pattern consistent with its adaptation to high-water environments where stomatal limitation is minimal (Table A1). C. glauca showed consistent positive linear relationships across all treatments, though with nutrient-specific differences in slope and intercept, particularly under the K treatment where high stomatal conductance was maintained across a wide range of photosynthetic rates.
3.3. Allocation Strategy of Plant Biomass
Plants under resource limitation would increase root investment to enhance acquisition capacity, while allocation to shoots would increase when nutrients became more available [14,30]. Therefore, we hypothesized that plant species with faster growth strategies (Z. mays and I. aquatica) would exhibit steeper initial responses to nutrient addition and broader optimal ranges, while the more conservative species (T. aestivum and C. glauca) would show flatter response patterns and lower maximum performance. To test our hypothesis, we quantified biomass allocation patterns, specifically root-to-shoot ratios, to determine whether they shift systematically with nutrient supply, reflecting plant adaptive responses to resource availability.
3.3.1. Shoot Biomass
Shoot biomass responses followed patterns consistent with the physiological traits described above, with all plant species showing strong unimodal responses and species-specific differences in magnitude and optimal ranges (Figure 7).
Figure 7.
Dose–response dynamics of shoot biomass in four plant species grown under nitrogen (N), phosphorus (P), and potassium (K) availability gradients: (a) T. aestivum, (b) Z. mays, (c) I. aquatica, and (d) C. glauca. Data are means ± SE (n = 5 biological replicates per treatment). Different lowercase letters (a, b, c, d, e, and f) within each colored treatment (green for N, dark gray for P, and brown for K) indicate statistically significant differences in shoot biomass among nutrient availability gradients based on One-way ANOVA followed by Tukey’s HSD post hoc test (α = 0.05).
T. aestivum showed moderate shoot biomass responses, with maximum values at 150% for all nutrients: 2.94 ± 0.27 g under N (17-fold increase), 2.95 ± 0.28 g under P (21-fold increase), and 2.84 ± 0.27 g under K (13.5-fold increase) (Figure 7a). Z. mays exhibited the second-highest shoot biomass, with peak values at 150% for all nutrients: 4.88 ± 0.47 g under N, 4.96 ± 0.51 g under P, and 4.83 ± 0.49 g under K (Figure 7b). The response to K was relatively modest compared to N and P, with a 25-fold increase from 1% vs. 38-fold for N and 62-fold for P. I. aquatica had the lowest absolute shoot biomass, reaching 3.82 ± 0.39 g at 150% N (25-fold increase), with slightly lower maxima under P (3.59 ± 0.37 g, 20-fold) and K (3.56 ± 0.37 g, 16-fold) (Figure 7c). C. glauca achieved the highest absolute shoot biomass, reaching 6.78 ± 0.72 g at 150% N, a 29-fold increase from 0.23 ± 0.04 g at 1% N (Figure 7d). Strong responses were also evident under P (28-fold increase, maximum 4.83 ± 0.45 g at 150%) and K (27-fold increase, maximum 4.98 ± 0.53 g at 150%), though absolute maxima were lower than under N.
3.3.2. Root Biomass
Root biomass responses followed patterns similar to plant shoots, though with important differences in allocation magnitude that reflected shifting resource investment strategies along nutrient gradients (Figure 8).
Figure 8.
Dose–response dynamics of root biomass in four plant species grown under nitrogen (N), phosphorus (P), and potassium (K) availability gradients: (a) T. aestivum, (b) Z. mays, (c) I. aquatica, and (d) C. glauca. Data are means ± SE (n = 5 biological replicates per treatment). Different lowercase letters (a, b, c, d, e, and f) within each colored treatment (green for N, dark gray for P, and brown for K) indicate statistically significant differences in root biomass among nutrient availability gradients based on One-way ANOVA followed by Tukey’s HSD post hoc test (α = 0.05).
T. aestivum root biomass increased 11.5-fold under N, 13.5-fold under P, and 10.6-fold under K at optimal supply (Figure 8a). These increases were substantially less than the corresponding shoot responses, consistent with declining root–shoot ratios. Z. mays exhibited the highest absolute root biomass, with maximum values at 150% for all nutrients: 1.57 ± 0.16 g under N, 1.67 ± 0.15 g under P, and 1.53 ± 0.14 g under K (Figure 8b). The P treatment produced the largest relative increase (42-fold from 1%), compared to 26-fold for N and 17-fold for K, suggesting that P availability strongly influenced root investment. I. aquatica showed modest root biomass with peak values at 100% rather than 150% for all nutrients (0.53 ± 0.07 g) (Figure 8c). Root biomass declined at 150% and higher concentrations, suggesting that root growth was less responsive to nutrient enrichment and more sensitive to supra-optimal supply, a pattern consistent with its relatively flat shoot biomass curves. C. glauca displayed the most dramatic root responses under N, increasing 22-fold from 0.10 ± 0.00 g at 1% to 2.21 ± 0.19 g at 150% (Figure 8d). Strong responses were also evident under P (20-fold) and K (20-fold), though absolute maxima were lower than under N.
3.3.3. Root–Shoot Ratio
The dynamics of root–shoot ratio revealed fundamental shifts in biomass allocation with changing nutrient availability (Figure A1). Across all four plant species and all three nutrients, root–shoot ratio declined progressively as nutrient availability increased, a pattern reflecting strategic reallocation from root-dominated investment under severe limitation to shoot-dominated allocation under optimal nutrition. The relationship between root–shoot ratio and nutrient availability was well described by negative exponential functions in all four plant species, offering quantitative tools for predicting allocation patterns across the full range of nutrient supplies.
T. aestivum showed intermediate declines, with root–shoot ratio decreasing from 41.18 ± 4.18% at 1% N to 26.78 ± 2.47% at 300% (35% reduction) (Figure A1a). Similar patterns were observed under P (42.86% to 25.82%, 40% reduction) and K (38.10% to 26.80%, 30% reduction). Z. mays exhibited the highest root–shoot ratios overall but moderate relative declines (Figure A1b). Under the N treatment, values declined from 46.15 ± 4.78% at 1% to 29.93 ± 3.07% at 300% (35% reduction). Comparable reductions occurred under P (48.49% to 31.37%, 35% reduction) and K (47.37% to 29.93%, 37% reduction). I. aquatica showed the most dramatic relative declines, with root–shoot ratio falling from 33.34 ± 3.42% at 1% N to 12.51 ± 1.11% at 300%, with a 62% reduction (Figure A1c). Similarly dramatic shifts were evident under P (38.89% to 10.98%, 72% reduction) and K (40.91% to 12.02%, 71% reduction). This high plasticity in allocation may reflect adaptation to fluctuating nutrient availability in aquatic environments. C. glauca displayed the most gradual declines, with root–shoot ratio decreasing from 43.48 ± 4.19% at 1% N to 29.23 ± 3.05% at 300% (33% reduction) (Figure A1d). This more conservative allocation plasticity may reflect adaptation to more stable nutrient environments in perennial wetland habitats.
The predicted root–shoot ratio a ranged from 37.64% (I. aquatica under N) to 51.81% (Z. mays under K) (Table A2). The decay rate b indicated how rapidly root–shoot ratio declined with increasing nutrient supply. I. aquatica showed the highest b values (0.196–0.246), reflecting its high allocation plasticity. In contrast, C. glauca exhibited the lowest b values (0.066–0.087), indicating more conservative allocation.
3.4. The Results of Statistical Analyses
The results of One-way ANOVA revealed that nutrient concentration had a significant effect on every trait for all four species under the N, P, and K treatments (p < 0.05; Table A3). This validates the detailed dose–response patterns presented in the preceding sections and confirms that variations in N, P, and K availability systematically alter plant performance. The species- and nutrient-specific differences in p-values reflect the differential sensitivity of each plant species to the three experimental nutrients.
Pearson correlation analysis revealed strong and consistent relationships among physiological, photosynthetic, and growth traits across all four plant species and three nutrient treatments, though the strength and significance of correlations varied among plant species and nutrients (Table 3).
Table 3.
Pearson’s correlation coefficients among plant physiological, photosynthetic, and growth traits for Triticum aestivum L., Zea mays L., Ipomoea aquatica Forssk., and Canna glauca L. under nitrogen, phosphorus, and potassium treatments.
Photosynthetic traits, including photosynthetic rate, stomatal conductance, and transpiration rate, were strongly intercorrelated across all four plant species and nutrient treatments, forming a tightly coordinated functional module. Similarly high correlations among these gas exchange parameters were observed for all four plant species under all nutrient treatments, with coefficients typically exceeding 0.90 (p < 0.001). This tight coupling effects reflect the integrated nature of stomatal regulation and photosynthetic carbon assimilation in response to nutrient availability.
Growth traits, including plant height, shoot biomass, root biomass, and total plant biomass, formed another strongly correlated module. These strong positive relationships among growth parameters were consistent across all four plant species and nutrients, indicating remarkably coordinated biomass allocation patterns despite the substantial shifts in root–shoot ratios.
The relationships between root–shoot ratio and other traits showed special species-specific patterns. Contrary to our original expectations, root–shoot ratio exhibited generally positive but relatively weak correlations with most physiological and growth traits across plant species and nutrients. Similarly modest positive correlations were observed for most species–nutrient combinations, with coefficients typically ranging from 0.30 to 0.52. These positive correlations suggest that plants maintaining higher relative root investment under given nutrient conditions also tend to achieve slightly greater overall performance, a pattern that may reflect the continued importance of root function even as allocation shifts toward shoots with increasing nutrient availability.
Species-specific differences in correlation patterns were apparent. Z. mays generally showed the highest correlation coefficients among photosynthetic traits, with photosynthetic rate–stomatal conductance correlations of 0.97 (p < 0.001) across all nutrients, suggesting particularly tight integration of gas exchange physiology in C4 species. I. aquatica showed somewhat weaker correlations involving root–shoot ratio, with many coefficients failing to reach statistical significance, possibly reflecting greater physiological flexibility or noise associated with its aquatic adaptation. T. aestivum and C. glauca exhibited intermediate correlation strengths with relatively consistent patterns across nutrients, indicating stable trait coordination regardless of which nutrient was varied.
4. Discussion
4.1. Universal Unimodal Patterns in Nutrient Dose–Response Relationships
The dose–response relationship between nutrient supply and plant performance represents one of the most fundamental concepts in plant nutrition [3,4,42]. Lamont (2024) showed support for the unimodal (hump-shaped) curve among previous studies involved in soil nutrients and pH, substrate water, air temperature, evapotranspiration, sunlight, fire frequency (as a surrogate for resource turnover), herbivory, and plant density and productivity (as surrogates for resource availability) [43]. Lee et al. (2021) proposed a hypothesis “nutritional complexity”, i.e., plant species coexisted due to greater variation in the nutritional chemistry in the context of a unimodal relationship between plant biomass and elevation along Helvellyn mountain of UK [44]. Our results across four diverse plant species and three essential macronutrients consistently demonstrated the characteristic unimodal pattern: plant performance increased progressively from severe deficiency to an optimal supply range (100–150% of standard Hoagland nutrient solution), then declined at supra-optimal (potentially toxic) concentrations. This pattern, observed for growth, physiological, photosynthetic, and biomass traits alike, reflects the underlying principle that plant nutrient requirements are bounded by both minimum subsistence levels and maximum tolerance thresholds [45].
Beyond the immediate physiological responses documented in this study, plants might also employ epigenetic mechanisms to adapt to nutrient stress conditions [46,47,48]. Abdulraheem et al. (2024) comprehensively reviewed how DNA methylation, histone modifications, and non-coding RNAs mediate plant responses to environmental stress, enabling both short-term acclimation and transgenerational stress memory [46]. In the context of nutrient availability, epigenetic modifications can modulate the expression of nutrient transporters, assimilation enzymes, and signaling components, potentially explaining the species-specific differences in response curves observed here [46,47,48]. For instance, the extraordinary N responsiveness of C. glauca (32-fold increase in photosynthetic rate) might involve epigenetic reprogramming of N metabolism genes, a hypothesis that warrants investigation through integrated epigenomic and transcriptomic approaches.
The universality of this pattern across plant species with contrasting ecological strategies from the fast-growing annual Z. mays to the more conservative perennial C. glauca underscores its status as a general law of plant nutritional physiology. Recent theoretical frameworks have emphasized that this unimodal pattern emerges from the fundamental trade-off between nutrient limitation at low supply and ion toxicity or osmotic stress at high supply [49,50,51]. Our results provide empirical support for this framework while revealing that the parameters of these curves (slope, optimum location, plateau breadth, decline steepness) vary substantially among different plant species in ways that reflect their ecological strategies and evolutionary histories.
The asymmetry between deficiency and toxicity sides of the response curves deserves particular attention. For most species-trait combinations, the decline under deficiency was steeper than the decline under toxicity, suggesting that plants are more sensitive to insufficient supply than to moderate excess [3,4,52]. This asymmetry has practical implications for nutrient management, as it implies that the cost of under-fertilization (severe yield loss) may exceed the cost of modest over-fertilization (small yield reduction plus potential environmental externalities). However, the narrow optimal ranges observed for some species-trait combinations, particularly for P in T. aestivum and N in C. glauca, indicate that this generalization must be applied with species-specific caution.
4.2. Species-Specific Response Patterns Reflect Ecological Strategies
A central hypothesis of this study was that plant species with different ecological strategies would exhibit systematically different dose–response patterns, because fast-growing species at the “acquisitive” end with high nutrient concentrations and photosynthetic rates, and conservative species at the opposite end prioritizing structural investment over rapid resource capture [12,37,38]. Our results strongly support this hypothesis, revealing species-specific signatures in virtually every measured trait that align with predictions from plant strategy theory.
Z. mays, as a C4 annual crop domesticated in high-resource agricultural environments, exhibited the characteristics of a classic “acquisitive” strategist [53]. C4 plants generally exhibit higher photosynthetic nitrogen use efficiency than C3 plants, which provides them with a competitive advantage in low-fertility environments [54]. Cummings et al. (2023) demonstrated in Panama that the growth of the invasive C4 grass Saccharum spontaneum was co-limited by both nitrogen and phosphorus, with fertilization significantly increasing its biomass [54]. This finding highlights the need for cautious fertilizer management in land use practices to avoid inadvertently promoting weed growth. In this study, Z. mays, as a C4 crop, exhibited strong responses to N and P addition (a 55-fold increase in biomass), consistent with the observations above and further confirming the high sensitivity of C4 plants to nutrient enrichment. Its response curves were steep, with dramatic increases from deficiency to optimum (e.g., 60-fold increase in transpiration rate, 55-fold increase in biomass under P) and high maximum performance. The broad optimal ranges for N and K (100–200% for many traits) suggest that modern Z. mays varieties have been selected for tolerance to high fertilizer inputs, a logical consequence of breeding within intensive agricultural systems [55]. These findings align with recent meta-analyses showing that C4 species generally exhibit higher photosynthetic nitrogen use efficiency than C3 species, particularly under high N conditions [56].
T. aestivum, also an annual crop but with C3 photosynthesis, showed response patterns intermediate between the extreme acquisitiveness of Z. mays and the conservatism of C. glauca [57]. Its responses were strong but not as dramatic as Z. mays’, and its optimal ranges were generally narrower. The relatively higher sensitivity to P limitation compared to Z. mays may reflect evolutionary history in the P-rich soils of the Fertile Crescent, where strong selection for P efficiency may not have occurred [58]. This interpretation is consistent with recent work showing that crop domestication history strongly influences nutrient acquisition strategies and mycorrhizal responsiveness [59,60,61].
I. aquatica occupied an intermediate position with distinctive characteristics. As a fast-growing aquatic vegetable, it might be expected to show acquisitive traits similar to Z. mays [62]. Actually, its transpiration rates were high and its responses to optimal nutrition were substantial. However, the relatively flat response curves at supra-optimal concentrations suggested greater tolerance to nutrient excess, a logical adaptation to aquatic environments where nutrient concentrations could fluctuate widely [63]. The pronounced P limitation observed in I. aquatica (narrowest optimal range, steepest decline under deficiency) may reflect the particular importance of P in aquatic plant metabolism or the low P availability typical of many wetland soils [64]. This pattern aligns with recent findings that wetland plants often exhibit specific adaptations to P limitation, including enhanced phosphatase activity and modified root architecture [65,66,67].
C. glauca displayed the most distinctive response patterns, challenging simple classifications based on growth rate alone. While C. glauca showed extraordinary responsiveness to optimal N (32-fold increase in photosynthetic rate, 29-fold increase in shoot biomass), its response curves were narrower and its decline under excess was steeper than in other three plant species. The continued increase in transpiration and photosynthesis through 200% N suggested a regulatory strategy that prioritizes continued resource acquisition even at the cost of metabolic imbalance, a pattern that may reflect adaptation to nutrient-rich wetland soils where competition for light rather than nutrients limits growth [68]. The pronounced K tolerance (high performance maintained through 300% K) likely reflects adaptation to variable K availability in wetland soils, where flooding and drying cycles can dramatically alter K solubility [69]. These findings contribute to emerging understanding that perennial species from high-resource habitats may combine conservative traits (slow growth, high structural investment) with acquisitive traits (high photosynthetic plasticity) in ways not fully captured by simple leaf economics spectrum classifications [12,70,71].
Several mechanisms can possibly explain the pronounced P limitation observed in I. aquatica [62,65,72]. First, wetland plants often rely on root-associated phosphatase enzymes to mineralize organic phosphorus. Low phosphatase activity would limit P acquisition under deficiency [65]. Second, although many wetland plants form arbuscular mycorrhizal (AM) symbiosis, some aquatic species have reduced mycorrhizal dependence [72]. If I. aquatica has low AM colonization, its P uptake capacity would be constrained. Li et al. (2024) demonstrated that root-mediated acidification and phosphatase activity enhanced P mobilization in wetland plant rhizospheres [65]. Similarly, Hu et al. (2013) showed that mycorrhizal fungi induce differential P acquisition in I. aquatica when intercropped [62]. These studies suggest that both rhizosphere biochemical processes and symbiotic associations modulate P availability for this species. Future work should directly measure phosphatase activity and AM colonization in I. aquatica under varying P supply.
The species-specific response patterns observed in this study, particularly the contrasting strategies between the acquisitive Z. mays and the more conservative C. glauca, likely reflect differences in molecular mechanisms that are only beginning to be understood. Integrative approaches combining metabolomics and proteomics have revealed how plants rewire their metabolic networks in response to nutrient stress, identifying key metabolites and proteins that mediate stress tolerance [73]. For instance, the extraordinary N responsiveness of C. glauca might involve differential regulation of N assimilation enzymes such as nitrate reductase and glutamine synthetase, while the P limitation sensitivity of I. aquatica might reflect differences in phosphate transporter expression or organic acid exudation capacity [74,75]. Future studies should apply multi-omics approaches to the species studied here to elucidate the molecular basis of their contrasting dose–response patterns.
4.3. Nutrient-Specific Response Patterns Reveal Differential Physiological Roles
While species identity is a primary determinant of response patterns, nutrient identity also plays a crucial role in shaping dose–response curves [76,77,78]. Across plant species, N generally produced the steepest response curves and highest maximum performance, reflecting its central role in protein synthesis and chlorophyll structure. The dramatic N responses observed in all plant species, particularly the 32-fold increase in photosynthetic rate in C. glauca, underscore the direct link between N supply and photosynthetic capacity.
P responses were often characterized by relatively high performance at low concentrations but narrower optimal ranges and steeper declines under deficiency. This pattern reflects phosphorus’ distinct physiological roles in energy transfer (ATP), nucleic acid structure, and metabolic regulation [1]. The observation that low P concentrations often supported relatively high early performance may reflect plants’ ability to remobilize internal P stores or maintain essential P-dependent processes with minimal external supply [79]. Simultaneously, the capacity of plants to modify their rhizosphere environment through root exudates and thereby acquire sparingly soluble nutrients varies considerably among different plant species [80]. Using a rhizotron system, Gonzalez et al. (2023) demonstrated that when lupine (Lupinus montanus) was intercropped with Z. mays, the lupine plants mobilized calcium-bound phosphorus, resulting in significantly higher P concentrations in Z. mays compared to monoculture [80]. This rhizosphere interaction mechanism suggests that under nutrient-limited conditions, species combinations may enhance overall resource utilization through complementary effects. Although this study did not investigate interspecific interactions, the differential response amplitudes to P supply among the four plant species, particularly the narrow optimal range observed in I. aquatica, hint at underlying differences in rhizosphere traits that warrant further investigation. However, the narrow optimal ranges for P suggest that once internal stores are depleted, P limitation becomes severe and the transition to toxicity occurs over a narrow concentration range [81,82]. This pattern has important implications for P management, as it implies that P fertilization requires greater precision than N or K to avoid both deficiency and excess.
K responses showed the greatest species variation, with some species (C. glauca) exhibiting remarkable tolerance while others (T. aestivum) showed sharper declines under excess. This variation reflects K’s primary functions in osmotic regulation, stomatal movement, and enzyme activation, roles that are less directly tied to carbon fixation than N or P and more dependent on species-specific water use strategies and stomatal behaviors [1]. C. glauca’s remarkable K tolerance may reflect adaptation to variable K availability in wetland soils, where flooding and drying cycles can dramatically alter K solubility [63,73]. This interpretation is consistent with recent work showing that species from fluctuating environments often evolve greater tolerance to nutrient variation [83,84,85].
4.4. Coordination of Physiological and Growth Responses Across Nutrient Gradients
A striking feature of our results is the tight coordination among physiological, photosynthetic, and growth traits across nutrient gradients. Correlation analysis revealed that photosynthetic traits (photosynthetic rate, stomatal conductance, transpiration rate) formed a strongly integrated module, as did growth traits (plant height, shoot biomass, root biomass, plant biomass), and these modules were themselves strongly correlated. This coordination suggests that nutrient variation affects plants through integrated physiological mechanisms rather than through independent effects on individual traits [86,87,88]. For example, in resource-limited environments, integrated fertilization strategies combining soil application, foliar spraying, and biofertilizers can effectively improve crop nutrient use efficiency and yield stability [89]. A two-year field trial conducted by Malimbayeva et al. (2026) in the semi-arid region of Kazakhstan demonstrated that oil flax receiving soil-applied N60P60K60 combined with foliar applications of macro-/micronutrients and biofertilizers increased seed yield from 0.58 t ha−1 to 0.89 t ha−1, with significant improvements in both protein and oil contents [89]. These findings align with the results of this study, i.e., that optimizing the timing and mode of nutrient supply can substantially influence crop yield components. The dose–response curves established in this study provide a theoretical foundation for determining appropriate nutrient concentrations in such integrated fertilization schemes, particularly with respect to the sensitivity thresholds of different ecotypes.
The strong coupling relationships among gas exchange parameters across all plant species and experimental nutrients reflect the fundamental biophysical relationships linking stomatal behavior, transpiration, and carbon fixation. Recent modeling work has emphasized that this coupling relationship is not merely correlational but reflects causal relationships: stomatal conductance determines both CO2 supply for photosynthesis and water loss through transpiration, while photosynthetic demand feeds back on stomatal behavior through intercellular CO2 concentration [90,91,92]. Our results show that this coupling relationship is maintained across the full range of nutrient availability gradients, from severe deficiency to toxicity, indicating that the fundamental coordination of gas exchange is robust to extreme nutrient variation.
The shifts in root–shoot ratio with nutrient availability gradients represent a fundamental aspect of plant adaptive plasticity [93,94,95]. The universal decline in root–shoot ratio with increasing nutrient availability reflects the economic principle that plants should invest in organs that acquire the most limiting resources [96]. Under severe nutrient limitation, roots are the primary constraint on growth, and plants invest heavily in root systems to maximize nutrient acquisition; as nutrient availability increases, shoot growth becomes more rapid, and investment shifts to photosynthetic tissues.
The magnitude of root–shoot ratio plasticity varied substantially among plant species, with I. aquatica showing the most dramatic shifts (62–72% reduction from 1% to optimum) and C. glauca the least (33–35% reduction). This variation likely reflects different evolutionary strategies: species adapted to fluctuating environments (like I. aquatica’s aquatic habitat) may have evolved greater allocation plasticity, while species from more stable environments (like C. glauca’s perennial wetland) may rely on more fixed allocation patterns. The negative exponential functions fitted to these relationships provide quantitative tools for predicting allocation patterns across the full range of nutrient availability, with potential applications in plant growth modeling and precision nutrient management.
4.5. Translation to Soil-Based Systems and Sustainable Management
While hydroponic systems provide precise control of nutrient availability, translating these findings to agricultural soils requires consideration of soil-specific factors that modulate nutrient availability and plant responses. Soil organic matter, microbial communities, and physiochemical structure all influence the effective nutrient concentrations experienced by plants [97,98,99]. Abdulraheem et al. (2024) demonstrated that integrating legume crops into rotations could enhance soil quality and nutrient cycling, suggesting that the species-specific nutrient optima identified here should be considered within broader cropping system contexts [97]. For species like Z. mays with broad optimal ranges and high nutrient use efficiency, integration with cover crops or organic amendments might allow maintenance of productivity while reducing synthetic fertilizer inputs. Conversely, species with narrow optimal ranges like C. glauca might require more precise fertilizer management or specific placement strategies to avoid both deficiency and toxicity.
5. Conclusions
This comprehensive dose–response analysis of four plant species with contrasting ecological strategies reveals both universal patterns and species-specific variations in response to graded N, P, and K supplies. The unimodal response curve, increasing from deficiency to optimum then declining under excess, proved universal across species, nutrients, and traits, confirming its status as a fundamental principle of plant nutritional physiology. However, the parameters of these curves varied systematically with species identity in ways that reflected ecological strategy: acquisitive species like Z. mays showed steeper responses and broader optima, while more conservative species like C. glauca displayed narrower optima but extraordinary responsiveness within their optimal ranges.
Nutrient-specific patterns were also evident, with N generally producing the strongest responses, P showing the narrowest optimal ranges, and K exhibiting the greatest species variation in tolerance. The tight coordination among photosynthetic traits and their strong coupling relationships to growth parameters demonstrated that nutrient effects propagate through integrated physiological networks rather than affecting traits independently.
The negative exponential relationship between root–shoot ratio and nutrient availability, quantified for each species-nutrient combination, provides a predictive tool for understanding biomass allocation across resource gradients. The results of One-way ANOVA confirmed that nutrient concentration had significant effects on all measured traits across all plant species and experimental nutrients, with the majority of effects being highly significant, underscoring the critical role of nutrient availability gradients in modulating plant performance. Correlation analyses revealed the integrated nature of plant responses, with photosynthetic traits forming tightly coordinated functional modules and growth traits exhibiting strong positive inter-correlations across all plant species and experimental nutrients. Root–shoot ratio showed generally positive but relatively weak correlations with most physiological and growth traits, reflecting the complex allocation adjustments of plants was realized along nutrient gradients.
These findings advance our understanding of plant nutritional physiology, provide quantitative tools for species-specific fertilizer management, and establish a framework for predicting nutrient responses based on plant ecological strategy. Based on our findings, we propose the following species-specific fertilizer management recommendations. For Z. mays, its broad optimal ranges (100–200% for N and K) and high nutrient use efficiency suggest that this plant species can tolerate moderate over-fertilization without substantial yield loss. Therefore, a single application at 150% of the standard Hoagland concentration is sufficient. For T. aestivum, its moderate responses and sensitivity to N limitation (steep decline below 100% N) indicate that consistent N supply near 100–150% is critical. Phosphorus and potassium can be managed with wider margins. For I. aquatica, its pronounced P limitation (narrow optimal range, steep decline under deficiency) requires more precise P management at 100–150% of standard concentration than usual. In contrast, its tolerance to supra-optimal N and K (maintaining 80% of maximum performance at 300%) means that N and K fertilization can be less precise. For C. glauca, its extraordinary N responsiveness but narrow optimal range (peak at 150%, sharp decline at 200–300%) demands precise N application. Excessive N should be strictly avoided. Its high K tolerance (good performance up to 300% K) allows flexible K management. These recommendations should be validated under field conditions, as soil factors modulate effective nutrient availability.
Future research work should extend these analyses to soil-based systems, investigate multi-nutrient interactions using factorial designs, and explore the molecular mechanisms underlying species-specific response patterns. Furthermore, long-term studies spanning full life cycles would reveal how vegetative responses translate to reproductive output and whether optimal vegetative nutrient ranges align with optimal reproductive performance.
Author Contributions
Conceptualization, validation, resources, writing—original draft preparation, supervision, project administration, and funding acquisition, X.L. and J.D.; methodology, formal analysis, investigation, and data curation, X.L., C.Z., M.F., B.L., X.W. and Z.W.; software and visualization, X.L., C.Z. and M.F.; writing—review and editing, X.L., C.Z., M.F. and J.D. All authors have read and agreed to the published version of the manuscript.
Funding
This research was funded by four grants of College Students Innovation and Entrepreneurship Training Program Project from Yunnan Provincial Department of Education (grant numbers: S202411390002, 202411390004, 202511390004, and S202511390001), and it was co-funded by the Special Basic Cooperative Research Programs of the Yunnan Provincial Undergraduate Universities’ Association (grant number: 202301BA070001-087) and the Xingyun Lake Ecosystem Observation and Research Station of Yunnan Province (202505AM340008).
Data Availability Statement
The data used to support the findings of this study are available from the first author and the corresponding authors upon request.
Conflicts of Interest
The authors declare no conflicts of interest.
Abbreviations
The following abbreviations are used in this manuscript:
| N | Nitrogen |
| P | Phosphorus |
| K | Potassium |
| Triticum aestivum L. | T. aestivum |
| Zea mays L. | Z. mays |
| Ipomoea aquatica Forssk. | I. aquatica |
| Canna glauca L. | C. glauca |
| LES | leaf economics spectrum |
| SLA | specific leaf area |
| LMA | leaf mass per area |
| AM | arbuscular mycorrhizal |
Appendix A
Figure A1.
Dynamics of root–shoot ratio in four plant species grown under nitrogen, phosphorus, and potassium availability gradients: (a) T. aestivum; (b) Z. mays; (c) I. aquatica; and (d) C. glauca. Data are means ± SE (n = 5 biological replicates per treatment).
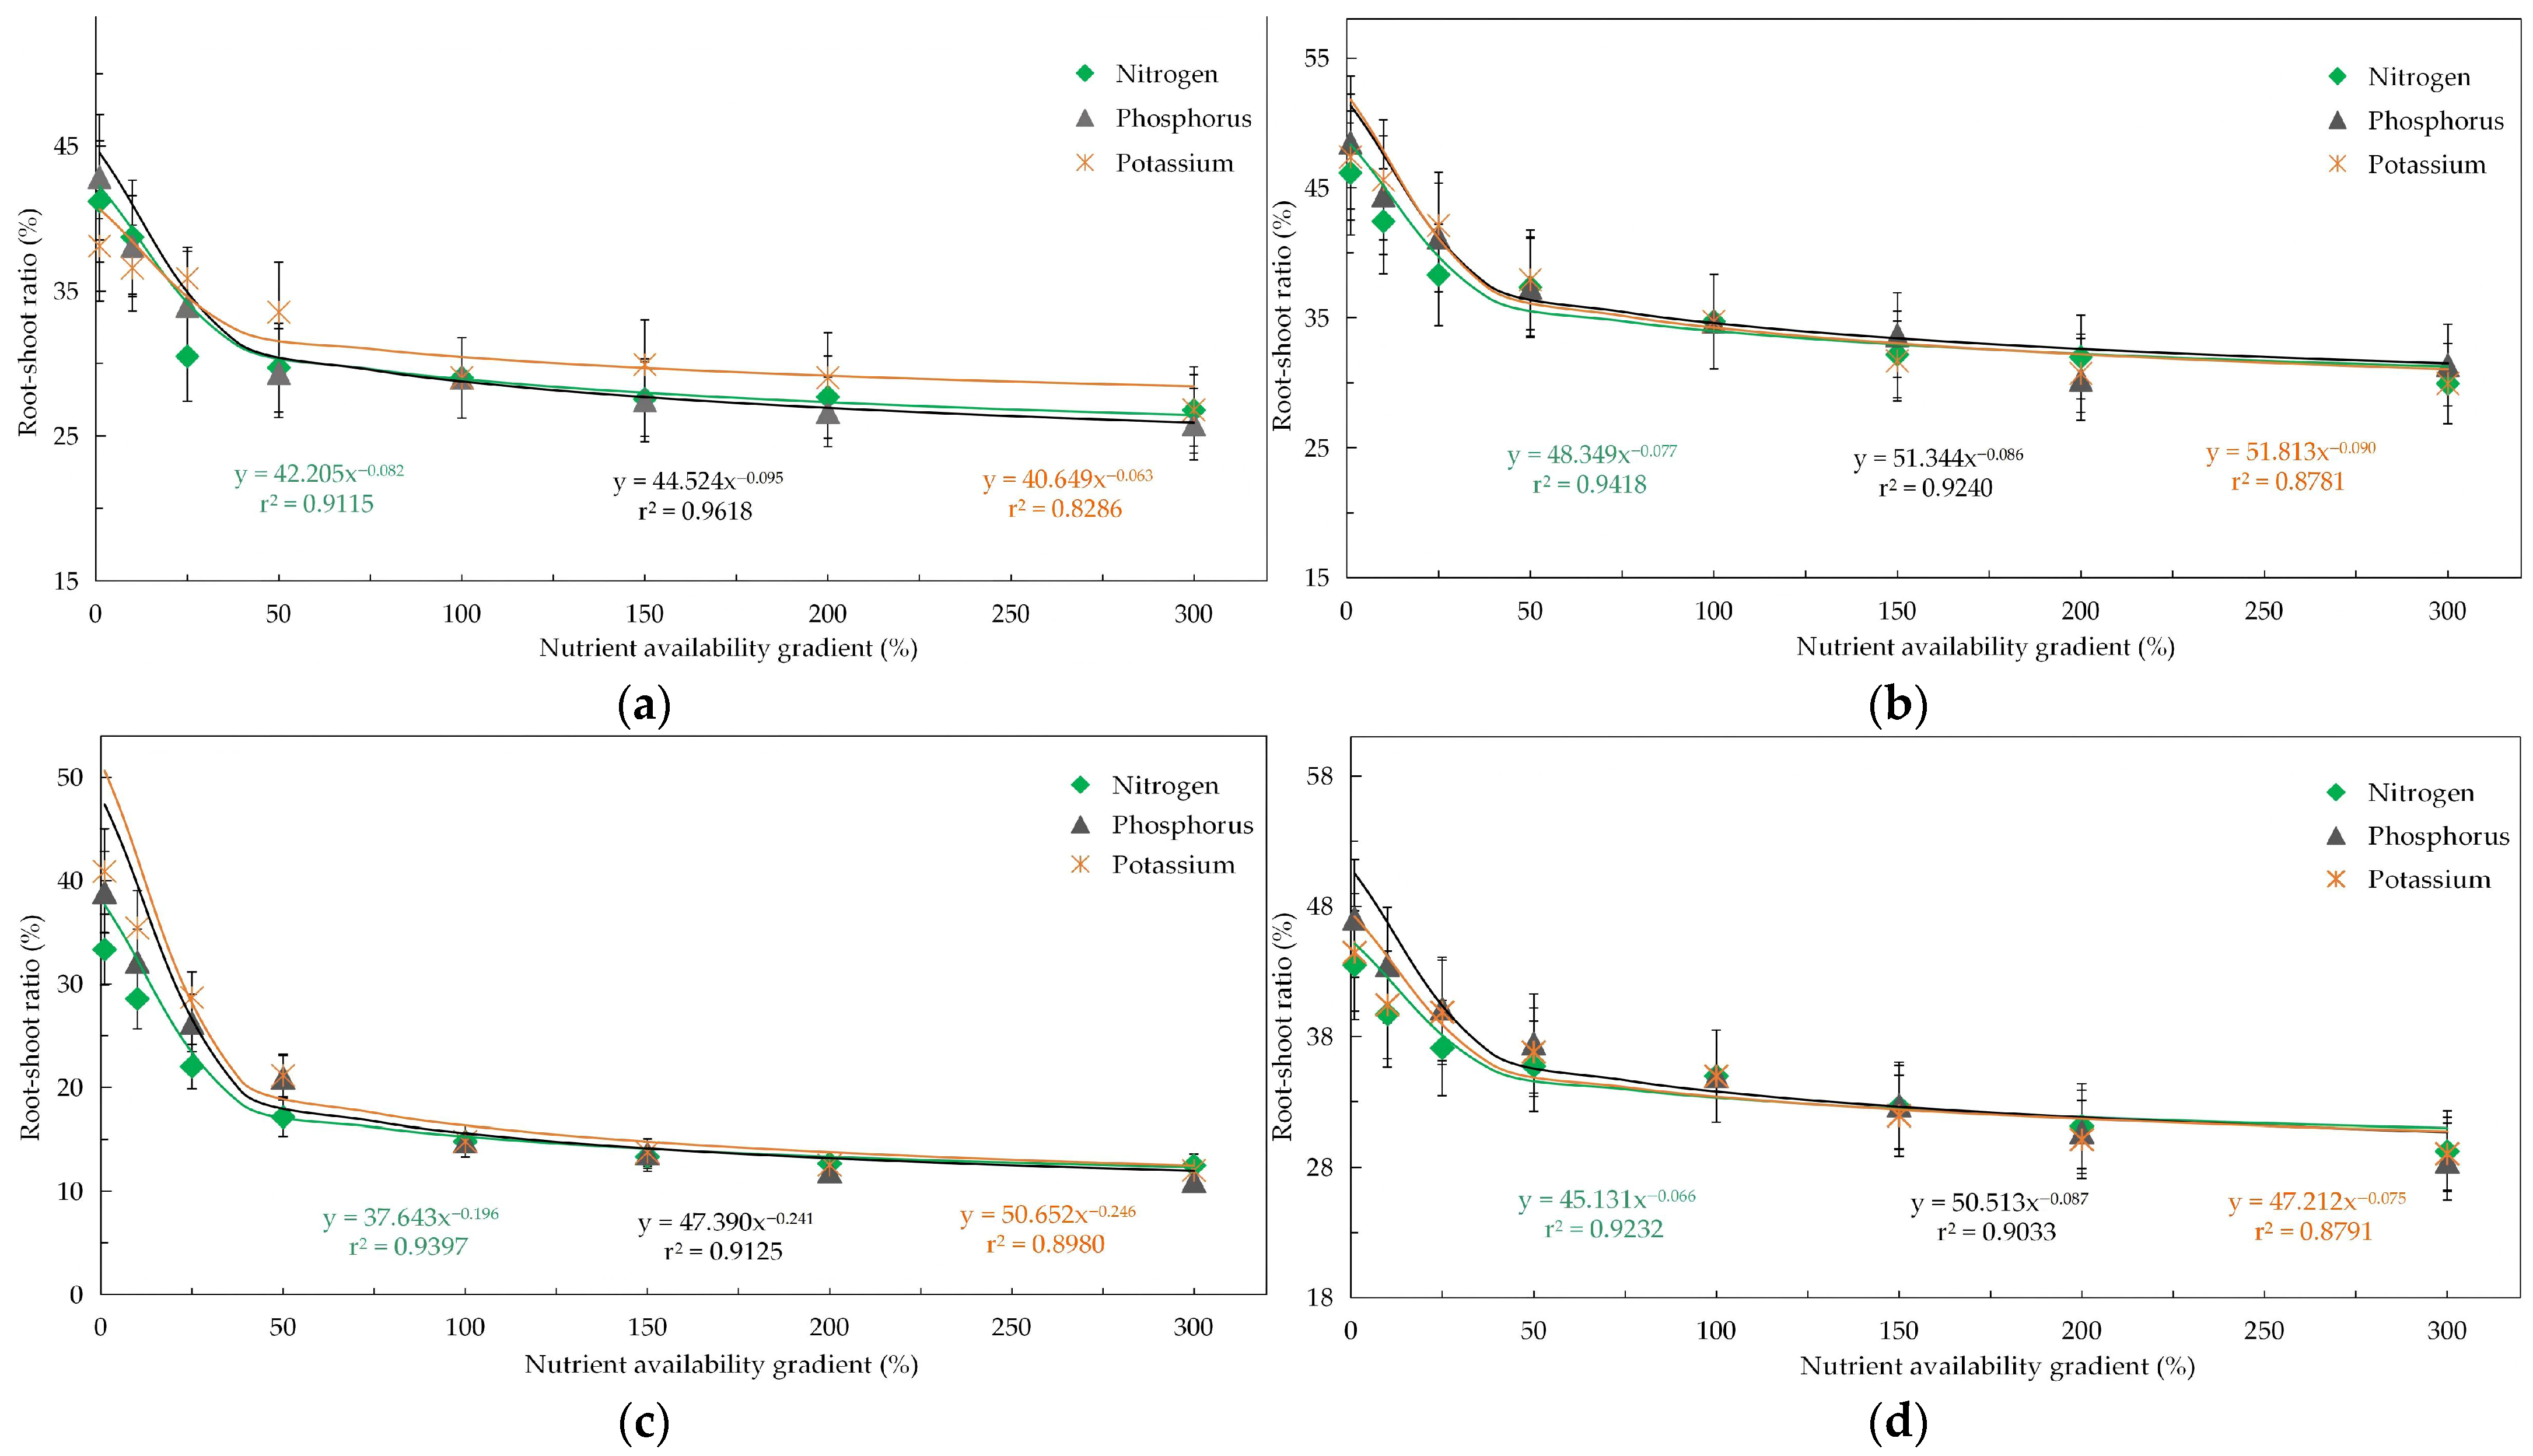
Table A1.
Fitted parameters of the positive linear relationships among stomatal conductance, transpiration rate, and photosynthetic rate of the four plant species under nitrogen (N), phosphorus (P), and potassium (K) availability gradients.
Table A2.
Fitted parameters of the negative exponential model describing root–shoot ratio dynamics in four plant species under nitrogen (N), phosphorus (P), and potassium (K) availability gradients.
Table A3.
One-way ANOVA results (p-values) for the effects of nitrogen, phosphorus, and potassium treatments on physiological, photosynthetic, and growth traits of the four experimental species (Triticum aestivum L., Zea mays L., Ipomoea aquatica Forssk., and Canna glauca L.).
References
- Ma, D.; Teng, W.; Mo, Y.-T.; Yi, B.; Chen, W.-L.; Pang, Y.-P.; Wang, L. Effects of nitrogen, phosphorus, and potassium fertilization on plant growth, element levels in plants and soil, and the relationships among nutrient concentrations, plant yield, and nutrient status in Erythropalum scandens (Blume). J. Plant Nutr. 2024, 47, 82–96. [Google Scholar] [CrossRef] [Scilit]
- Ma, J.; Chen, T.; Lin, J.; Fu, W.; Feng, B.; Li, G.; Li, H.; Li, J.; Wu, Z.; Tao, L.; et al. Functions of nitrogen, phosphorus and potassium in energy status and their influences on rice growth and development. Rice Sci. 2022, 29, 166–178. [Google Scholar] [CrossRef] [Scilit]
- Sileshi, G.W. Dose-response models to guide site-specific nutrient management and lessons for fertiliser trial design in sub-Saharan Africa. Exp. Agric. 2022, 58, e2. [Google Scholar] [CrossRef] [Scilit]
- Veresoglou, S.D.; Begum, N. Dose-response curves: The next frontier in plant ecology. Trends Plant Sci. 2024, 29, 971–977. [Google Scholar] [CrossRef] [Scilit]
- Swift, J.; Alvarez, J.M.; Araus, V.; Gutiérrez, R.A.; Coruzzi, G.M. Nutrient dose-responsive transcriptome changes driven by Michaelis–Menten kinetics underlie plant growth rates. Proc. Natl. Acad. Sci. USA 2020, 117, 12531–12540. [Google Scholar] [CrossRef] [Scilit] [PubMed]
- Przybylska, M.S.; Mahaut, L.; Violle, C.; Vile, D.; Munoz, F.; Scheepens, J.F.; Le Roux, X.; Kazakou, E.; Exposito-Alonso, M.; Bossdorf, O.; et al. An evolutionary perspective on the response-effect framework. Funct. Ecol. 2026, 40, 298–310. [Google Scholar] [CrossRef] [Scilit]
- Mohanbabu, N.; Veldhuis, M.P.; Jung, D.; Ritchie, M.E. Integrating defense and leaf economic spectrum traits in a tropical savanna plant. Front. Plant Sci. 2023, 14, 1185616. [Google Scholar] [CrossRef] [Scilit] [PubMed]
- Li, R.; Cheng, X.; Dai, P.; Zhang, M.; Li, M.; Chen, J.; Hassan, W.u.; Wang, Y. Plant architectural structure and leaf trait responses to environmental change: A meta-analysis. Plants 2025, 14, 1717. [Google Scholar] [CrossRef] [Scilit] [PubMed]
- Weemstra, M.; Zambrano, J.; Bauman, D.; Fortunel, C.; Umaña, M.N. Leaf nitrogen and wood density, but not root traits, explain the growth and survival of temperate tree species. J. Ecol. 2026, 114, e70212. [Google Scholar] [CrossRef] [Scilit]
- Wang, X.; Chen, J.; Ju, W.; Zhang, Y. Seasonal variations in leaf maximum photosynthetic capacity and its dependence on climate factors across global FLUXNET sites. J. Geophys. Res.-Biogeosci. 2022, 127, e2021JG006709. [Google Scholar] [CrossRef] [Scilit]
- Ni, L.; Gu, D.; Qin, J.; He, W.; Huang, K.; Otieno, D. Synergistic effects of leaf nitrogen and phosphorus on photosynthetic capacity in subtropical forest. Theor. Exp. Plant Physiol. 2024, 36, 97–111. [Google Scholar] [CrossRef] [Scilit]
- Luo, J.; Li, J.; Sun, Y.; Degen, A.A.; Wang, X.; Xiong, J.; Aqueel, M.; Xie, S.; Dong, T.; Li, F.; et al. Differential resource acquisition strategies of herbaceous and woody plants in temperate forests. BMC Plant Biol. 2026, 26, 196. [Google Scholar] [CrossRef] [Scilit]
- Matsuo, T.; van Der Sande, M.T.; Amissah, L.; Dabo, J.; Mohammed Abdul, S.; Poorter, L. Herbaceous species and dry forest species have more acquisitive leaf traits than woody species and wet forest species. Funct. Ecol. 2024, 38, 194–205. [Google Scholar] [CrossRef] [Scilit]
- Du, J.; Li, X.; Sun, Q.; Yang, L.; Li, Y.; Dong, S. Functional differentiation and adaptive responses of absorptive and transport roots in alpine grassland plants under nitrogen and phosphorus addition. Front. Plant Sci. 2025, 16, 1747072. [Google Scholar] [CrossRef] [Scilit]
- Su, Y.; Tang, Y.; Hu, Y.; Liu, M.; Lu, X.; Duan, B. Exploring plant adaptation strategies to phosphorus limitation induced by nitrogen addition: Foliar phosphorus allocation and root functional traits analysis in two dominant subalpine tree species. J. Plant Ecol. 2024, 17, rtae060. [Google Scholar] [CrossRef] [Scilit]
- Georgieva, M.; Vassileva, V. Stress management in plants: Examining provisional and unique dose-dependent responses. Int. J. Mol. Sci. 2023, 24, 5105. [Google Scholar] [CrossRef] [Scilit] [PubMed]
- Poorter, H.; Niinemets, Ü.; Walter, A.; Fiorani, F.; Schurr, U. A method to construct dose–response curves for a wide range of environmental factors and plant traits by means of a meta-analysis of phenotypic data. J. Exp. Bot. 2010, 61, 2043–2055. [Google Scholar] [CrossRef] [Scilit] [PubMed]
- Liu, J.; Wang, D.; Yan, X.; Jia, L.; Chen, N.; Liu, J.; Zhao, P.; Zhou, L.; Cao, Q. Effect of nitrogen, phosphorus and potassium fertilization management on soil properties and leaf traits and yield of Sapindus mukorossi. Front. Plant Sci. 2024, 15, 1300683. [Google Scholar] [CrossRef] [Scilit]
- Xu, X.; Zhang, X.; Ni, W.; Liu, C.; Qin, H.; Guan, Y.; Liu, J.; Feng, Z.; Xing, Y.; Tian, G.; et al. Nitrogen–potassium balance improves leaf photosynthetic capacity by regulating leaf nitrogen allocation in apple. Hortic. Res. 2024, 11, uhad253. [Google Scholar] [CrossRef] [Scilit]
- Cao, W.; Sun, H.; Shao, C.; Wang, Y.; Zhu, J.; Long, H.; Geng, X.; Zhang, Y. Progress in the study of plant nitrogen and potassium nutrition and their interaction mechanisms. Horticulturae 2025, 11, 930. [Google Scholar] [CrossRef] [Scilit]
- Yue, H.-F.; Zhou, M.; Hou, X.-K.; Yang, X.; Zhao, H.; Xu, M.-S.; Wang, L.; Liu, H.-M.; Wuyun, T.-N.; Zhu, G.-P.; et al. Effects of nitrogen, phosphorus and potassium on phenotype, photosynthesis and biomass accumulation at juvenile phase of Prunus Armeniaca × Sibirica. Pak. J. Bot. 2022, 54, 577–588. [Google Scholar] [CrossRef] [Scilit] [PubMed]
- Kakabouki, I.; Tataridas, A.; Mavroeidis, A.; Kousta, A.; Roussis, I.; Katsenios, N.; Efthimiadou, A.; Papastylianou, P. Introduction of alternative crops in the Mediterranean to satisfy EU Green Deal goals. A review. Agron. Sustain. Dev. 2021, 41, 71. [Google Scholar] [CrossRef] [Scilit]
- Ghorbani, M.; Konvalina, P.; Neugschwandtner, R.W.; Kopecký, M.; Amirahmadi, E.; Moudrý, J., Jr.; Menšík, L. Preliminary findings on cadmium bioaccumulation and photosynthesis in rice (Oryza sativa L.) and maize (Zea mays L.) using biochar made from C3-and C4-originated straw. Plants 2022, 11, 1424. [Google Scholar] [CrossRef] [Scilit]
- Li, Z.; Cheng, L.; Li, S.; Liu, G.; Liu, S.; Xu, D.; Yang, R.; Feng, F.; Wang, J.; Zheng, C. Physiological, ionomic, transcriptomic and metabolomic analyses reveal molecular mechanisms of root adaption to salt stress in water spinach. BMC Genom. 2025, 26, 231. [Google Scholar] [CrossRef] [Scilit]
- Karungamye, P.N. Potential of Canna indica in constructed wetlands for wastewater treatment: A review. Conservation 2022, 2, 499–513. [Google Scholar] [CrossRef] [Scilit]
- Togawa-Urakoshi, Y.; Ueno, O. Photosynthetic nitrogen- and water-use efficiencies in C3 and C4 subtype grasses grown under two nitrogen supply levels. Plant Prod. Sci. 2022, 25, 183–194. [Google Scholar] [CrossRef] [Scilit]
- Arthaud, F.; Toury, J.; Romestaing, C.; Bornette, G. Photosynthetic and morphological traits control aquatic plant distribution according to light stress. Evol. Ecol. 2021, 35, 739–760. [Google Scholar] [CrossRef] [Scilit]
- Gorné, L.D.; Díaz, S.; Minden, V.; Onoda, Y.; Kramer, K.; Muir, C.; Michaletz, S.T.; Lavorel, S.; Sharpe, J.; Jansen, S.; et al. The acquisitive–conservative axis of leaf trait variation emerges even in homogeneous environments. Ann. Bot. 2022, 129, 709–722. [Google Scholar] [CrossRef] [Scilit]
- Van Delden, S.H.; Nazarideljou, M.J.; Marcelis, L.F. Nutrient solutions for Arabidopsis thaliana: A study on nutrient solution composition in hydroponics systems. Plant Methods 2020, 16, 72. [Google Scholar] [CrossRef] [Scilit]
- Tominaga, J.; Kawamitsu, Y. Combined leaf gas-exchange system for model assessment. J. Exp. Bot. 2024, 75, 2982–2993. [Google Scholar] [CrossRef] [Scilit]
- Ma, B.; Ge, J.; Zhao, C.; Xu, W.; Xu, K.; Xie, Z. Plant economics spectrum governs leaf nitrogen and phosphorus resorption in subtropical transitional forests. BMC Plant Biol. 2024, 24, 764. [Google Scholar] [CrossRef] [Scilit]
- Gille, C.E.; Hayes, P.E.; Ranathunge, K.; Liu, S.; Newman, R.P.G.; de Tombeur, F.; Lambers, H.; Finnegan, P.M. Life at the conservative end of the leaf economics spectrum: Intergeneric variation in the allocation of phosphorus to biochemical fractions in species of Banksia (Proteaceae) and Hakea (Proteaceae). New Phytol. 2024, 244, 74–90. [Google Scholar] [CrossRef] [Scilit]
- Nam, S.W.; Yim, S.; Choi, C.I.; Park, I.; Joung, K.-W.; Song, I.-A. Effects of remimazolam on hemodynamic changes during cardiac ablation for atrial fibrillation under general anesthesia: A propensity-score-matched retrospective cohort study. Can. J. Anesth. 2023, 70, 1495–1503. [Google Scholar] [CrossRef] [Scilit]
- Montero, J.A. A Structured guide to univariate test selection based on normality, variance homogeneity, and graphical data exploration. J. Surg. Res. 2026, 318, 230–240. [Google Scholar] [CrossRef] [Scilit]
- de Souza, R.S., Jr.; Borges, E.M. Teaching descriptive statistics and hypothesis tests measuring water density. J. Chem. Educ. 2023, 100, 4438–4448. [Google Scholar] [CrossRef] [Scilit]
- Robinson, D. OPT-ing out: Root− shoot dynamics are caused by local resource capture and biomass allocation, not optimal partitioning. Plant Cell Environ. 2023, 46, 3023–3039. [Google Scholar] [CrossRef] [Scilit] [PubMed]
- Gilbert, G.S.; Diaz, A.; Bregoff, H.A. Seed disinfestation practices to control seed-borne fungi and bacteria in home production of sprouts. Foods 2023, 12, 747. [Google Scholar] [CrossRef] [Scilit]
- De la Riva, E.G.; Querejeta, J.I.; Villar, R.; Pérez-Ramos, I.M.; Marañón, T.; Galán Díaz, J.; De Tomás Marín, S.; Prieto, I. The economics spectrum drives root trait strategies in Mediterranean vegetation. Front. Plant Sci. 2021, 12, 773118. [Google Scholar] [CrossRef] [Scilit]
- Li, Y.; Tao, F.; Hao, Y.; Tong, J.; Xiao, Y.; He, Z.; Reynolds, M. Unfolding the leaf economics spectrum for wheat: Trait analysis and genomic associations across cultivars. Environ. Exp. Bot. 2024, 226, 105928. [Google Scholar] [CrossRef] [Scilit]
- Gómez-Fernández, A. Reconstructing the evolutionary history of herbaceous crops through trait-based ecology. Am. J. Bot. 2025, 112, e70107. [Google Scholar] [CrossRef] [Scilit] [PubMed]
- Bossonia, G.E.B.; Stata, M.; Almeida, A.M.; Constantin, R.P.; Marchiosi, R.; Ferrarese-Filho, O.; Sage, R.F.; Dos Santos, W.D. Assessing the cell wall nitrogen use efficiency–Can the differences between cell wall architectures contribute to the nitrogen economy of plants? Plant Physiol. Biochem. 2025, 229, 110548. [Google Scholar] [CrossRef] [Scilit]
- Poorter, H.; Knopf, O.; Wright, I.J.; Temme, A.A.; Hogewoning, S.W.; Graf, A.; Cernusak, L.A.; Pons, T.L. A meta-analysis of responses of C3 plants to atmospheric CO2: Dose–response curves for 85 traits ranging from the molecular to the whole-plant level. New Phytol. 2022, 233, 1560–1596. [Google Scholar] [CrossRef] [Scilit]
- Lamont, B.B. The species richness–resource availability relationship is hump-shaped. Perspect. Plant Ecol. 2024, 65, 125824. [Google Scholar] [CrossRef] [Scilit]
- Lee, M.A.; Burger, G.; Green, E.R.; Kooij, P.W. Relationships between resource availability and elevation vary between metrics creating gradients of nutritional complexity. Oecologia 2021, 195, 213–223. [Google Scholar] [CrossRef] [Scilit]
- Pabón-Garcés, G.; Vásquez-Hernández, L.; Yaguana-Jiménez, G.; Aguirre-Mejía, P. Vegetative growth analysis of Schoenoplectus californicus (Totora): Dynamics and physiological mechanisms in high-altitude Andean Lakes. Ecologies 2025, 6, 71. [Google Scholar] [CrossRef] [Scilit]
- Abdulraheem, M.I.; Xiong, Y.; Moshood, A.Y.; Cadenas-Pliego, G.; Zhang, H.; Hu, J. Mechanisms of plant epigenetic regulation in response to plant stress: Recent discoveries and implications. Plants 2024, 13, 163. [Google Scholar] [CrossRef] [Scilit] [PubMed]
- Ashapkin, V.V.; Kutueva, L.I.; Aleksandrushkina, N.I.; Vanyushin, B.F. Epigenetic mechanisms of plant adaptation to biotic and abiotic stresses. Int. J. Mol Sci. 2020, 21, 7457. [Google Scholar] [CrossRef] [Scilit] [PubMed]
- Zhang, H.; Zhang, X.; Xiao, J. Epigenetic regulation of nitrogen signaling and adaptation in plants. Plants 2023, 12, 2725. [Google Scholar] [CrossRef] [Scilit] [PubMed]
- Goldberg, E.E.; Price, T.D. Effects of plasticity on elevational range size and species richness. Am. Nat. 2022, 200, 316–329. [Google Scholar] [CrossRef] [Scilit]
- Vleminckx, J.; Barrantes, O.V.; Fortunel, C.; Paine, C.E.T.; Bauman, D.; Engel, J.; Petronelli, P.; Dávila, N.; Rios, M.; Sandoval, E.H.V.; et al. Niche breadth of Amazonian trees increases with niche optimum across broad edaphic gradients. Ecology 2023, 104, e4053. [Google Scholar] [CrossRef] [Scilit]
- Herrera-Alsina, L.; Parvanova, R.; Guirguis, J.; Bocedi, G.; Trethowan, L.; Lancaster, L.T.; Travis, J.M. Disentangling evolutionary, geometric and ecological components of the elevational gradient of diversity. Evol. Lett. 2025, 9, 51–64. [Google Scholar] [CrossRef] [Scilit] [PubMed]
- Rico-Chávez, A.K.; Franco, J.A.; Fernandez-Jaramillo, A.A.; Contreras-Medina, L.M.; Guevara-González, R.G.; Hernandez-Escobedo, Q. Machine learning for plant stress modeling: A perspective towards hormesis management. Plants 2022, 11, 970. [Google Scholar] [CrossRef] [Scilit]
- Zhang, C.; Xue, W.; Xue, J.; Zhang, J.; Qiu, L.; Chen, X.; Hu, F.; Kardol, P.; Liu, M. Leveraging functional traits of cover crops to coordinate crop productivity and soil health. J. Appl. Ecol. 2022, 59, 2627–2641. [Google Scholar] [CrossRef] [Scilit]
- Cummings, J.A.; Parker, I.M.; Gilbert, G.S. The influence of nitrogen and phosphorus addition on growth of the unvasive C4 grass Saccharum spontaneum. Int. J. Plant Biol. 2023, 14, 474–482. [Google Scholar] [CrossRef] [Scilit]
- Ahmad, U.; Hussain, M.A.; Ahmad, W.; Javed, J.; Arshad, Z.; Akram, Z. Impact of global climate change on maize (Zea mays): Physiological responses and modern breeding techniques. Trends Biotechnol. Plant Sci. 2024, 2, 62–77. [Google Scholar] [CrossRef] [Scilit]
- Sales, C.R.G.; Wang, Y.; Evers, J.B.; Kromdijk, J. Improving C4 photosynthesis to increase productivity under optimal and suboptimal conditions. J. Exp. Bot. 2021, 72, 5942–5960. [Google Scholar] [CrossRef] [Scilit]
- Tambussi, E.A.; Maydup, M.L.; Carrión, C.A.; Guiamet, J.J.; Araus, J.L. Ear photosynthesis in C3 cereals and its contribution to grain yield: Methodologies, controversies, and perspectives. J. Exp. Bot. 2021, 72, 3956–3970. [Google Scholar] [CrossRef] [Scilit]
- Mao, L.; Zhao, Y.; Xi, H.; Zhang, Q.; Feng, H.; Yi, X.; Liu, Y. Mycorrhizal responsiveness of modern hexaploid wheat and ancestral species under different soil fertility conditions. Plant Soil 2023, 482, 333–346. [Google Scholar] [CrossRef] [Scilit]
- Liu, A.; Ku, Y.; Contador, C.A.; Lam, H.M. The impacts of domestication and agricultural practices on legume nutrient acquisition through symbiosis with rhizobia and arbuscular mycorrhizal fungi. Front. Genet. 2020, 11, 583954. [Google Scholar] [CrossRef] [Scilit]
- Isaac, M.E.; Nimmo, V.; Gaudin, A.C.; Leptin, A.; Schmidt, J.E.; Kallenbach, C.M.; Martin, A.; Entz, M.; Carkner, M.; Rajcan, I.; et al. Crop domestication, root trait syndromes, and soil nutrient acquisition in organic agroecosystems: A systematic review. Front. Sustain. Food Syst. 2021, 5, 716480. [Google Scholar] [CrossRef] [Scilit]
- Li, Y.; Chen, H.; Gu, L.; Wu, J.; Zheng, X.; Fan, Z.; Pan, D.; Li, J.; Shu, W.; Rosendahl, S.; et al. Domestication of rice may have changed its arbuscular mycorrhizal properties by modifying phosphorus nutrition-related traits and decreasing symbiotic compatibility. New Phytol. 2024, 243, 1554–1570. [Google Scholar] [CrossRef] [Scilit] [PubMed]
- Hu, J.; Chan, P.T.; Wu, F.; Wu, S.; Zhang, J.; Lin, X.; Wong, M. Arbuscular mycorrhizal fungi induce differential Cd and P acquisition by Alfred stonecrop (Sedum alfredii Hance) and upland kangkong (Ipomoea aquatica Forsk.) in an intercropping system. Appl. Soil Ecol. 2013, 63, 29–35. [Google Scholar] [CrossRef] [Scilit]
- Jampeetong, A.; Brix, H.; Kantawanichkul, S. Effects of inorganic nitrogen forms on growth, morphology, nitrogen uptake capacity and nutrient allocation of four tropical aquatic macrophytes (Salvinia cucullata, Ipomoea aquatica, Cyperus involucratus and Vetiveria zizanioides). Aquat. Bot. 2012, 97, 10–16. [Google Scholar] [CrossRef] [Scilit]
- Khan, M.Z.; Islam, M.A.; Azom, M.G.; Amin, M.S. Short term influence of salinity on uptake of phosphorus by Ipomoea aquatica. Int. J. Plant Soil Sci. 2018, 25, 1–9. [Google Scholar] [CrossRef] [Scilit]
- Li, C.; Ma, X.; Wang, Y.; Sun, Q.; Chen, M.; Zhang, C.; Ding, S.; Dai, Z. Root-mediated acidification, phosphatase activity and the phosphorus-cycling microbial community enhance phosphorus mobilization in the rhizosphere of wetland plants. Water Res. 2024, 255, 121548. [Google Scholar] [CrossRef] [Scilit]
- Maranho, L.T.; Gomes, M.P. Morphophysiological adaptations of aquatic macrophytes in wetland-based sewage treatment systems: Strategies for resilience and efficiency under environmental stress. Plants 2024, 13, 2870. [Google Scholar] [CrossRef] [Scilit]
- Jiang, Z.; Luo, W.; Zhu, E.; Zhao, Y.; Liu, C.; Zhou, L.; Feng, X. Changing plant phosphorus acquisition strategies in relation to altered soil phosphorus fractions after wetland drainage. Funct. Ecol. 2024, 38, 2433–2446. [Google Scholar] [CrossRef] [Scilit]
- Zhang, Q.; Wang, Z.; Xia, S.; Zhang, G.; Li, S.; Yu, D.; Yu, X. Hydrologic-induced concentrated soil nutrients and improved plant growth increased carbon storage in a floodplain wetland over wet-dry alternating zones. Sci. Total Environ. 2022, 822, 153512. [Google Scholar] [CrossRef] [Scilit]
- Patel, K.F.; Fansler, S.J.; Campbell, T.P.; Bond-Lamberty, B.; Smith, A.P.; RoyChowdhury, T.; McCue, L.A.; Varga, T.; Bailey, V.L. Soil texture and environmental conditions influence the biogeochemical responses of soils to drought and flooding. Commun. Earth Environ. 2021, 2, 127. [Google Scholar] [CrossRef] [Scilit]
- Zheng, H.; Zheng, F. Functional Traits and Ecological Adaptation of Garden Plants Based on Leaf Economics Spectrum. Appl. Ecol. Environ. Res. 2025, 23, 11717–11734. [Google Scholar] [CrossRef] [Scilit]
- Kurze, S.; Engelbrecht, B.M.; Bilton, M.C.; Tielbörger, K.; Álvarez-Cansino, L. Rethinking the plant economics spectrum for annuals: A multi-species study. Front. Plant Sci. 2021, 12, 640862. [Google Scholar] [CrossRef] [Scilit] [PubMed]
- Huang, G.; Srivastava, A.K.; Zou, Y.; Wu, Q.; Kuča, K. Exploring arbuscular mycorrhizal symbiosis in wetland plants with a focus on human impacts. Symbiosis 2021, 84, 311–320. [Google Scholar] [CrossRef] [Scilit]
- Moshood, A.Y.; Abdulraheem, M.I.; Li, L.; Zhang, Y.; Raghavan, V.; Hu, J. Deciphering nutrient stress in plants: Integrative insight from metabolomics and proteomics. Funct. Integr. Genom. 2025, 25, 38. [Google Scholar] [CrossRef] [Scilit]
- Zhou, Y.; Kishchenko, O.; Stepanenko, A.; Chen, G.; Wang, W.; Zhou, J.; Pan, C.; Borisjuk, N. The dynamics of NO3− and NH4+ uptake in duckweed are coordinated with the expression of major nitrogen assimilation genes. Plants 2021, 11, 11. [Google Scholar] [CrossRef] [Scilit]
- Zhang, J.; Su, J.; Ma, C.; Hu, X.; Teng, H. Periphytic microbial response to environmental phosphate (P) bioavailability and its relevance to P management in paddy fields. Appl. Environ. Microbiol. 2021, 87, e01201-21. [Google Scholar] [CrossRef] [Scilit] [PubMed]
- Wang, J.; Ouyang, F.; An, S.; Wang, L.; Xu, N.; Ma, J.; Wang, J.; Zhang, H.; Kong, L. Variation, coordination, and trade-offs between needle structures and photosynthetic-related traits across five Picea species: Consequences on plant growth. BMC Plant Biol. 2022, 22, 242. [Google Scholar] [CrossRef] [Scilit] [PubMed]
- Hu, H.; Xu, K.; He, L.; Wang, G. A model for the relationship between plant biomass and photosynthetic rate based on nutrient effects. Ecosphere 2021, 12, e03678. [Google Scholar] [CrossRef] [Scilit]
- Rehling, F.; Sandner, T.M.; Matthies, D. Biomass partitioning in response to intraspecific competition depends on nutrients and species characteristics: A study of 43 plant species. J. Ecol. 2021, 109, 2219–2233. [Google Scholar] [CrossRef] [Scilit]
- Khan, F.; Siddique, A.B.; Shabala, S.; Zhou, M.; Zhao, C. Phosphorus plays key roles in regulating plants’ physiological responses to abiotic stresses. Plants 2023, 12, 2861. [Google Scholar] [CrossRef] [Scilit]
- Gonzalez, J.E.; Hernández, V.E.; Trejo, E.O.; Martínez, J.D.; Moreno, J.C.M.; Sánchez, F.L. Assessing the Nutritional Effect of Lupinus montanus on Zea mays HS-2 (Intercropping) and Identification of Nodular Bacteria through the Use of Rhizotrons. Int. J. Plant Biol. 2023, 14, 910–921. [Google Scholar] [CrossRef] [Scilit]
- Poirier, Y.; Jaskolowski, A.; Clúa, J. Phosphate acquisition and metabolism in plants. Curr. Biol. 2022, 32, R623–R629. [Google Scholar] [CrossRef] [Scilit]
- Marschner, P. Processes in submerged soils–linking redox potential, soil organic matter turnover and plants to nutrient cycling. Plant Soil 2021, 464, 1–12. [Google Scholar] [CrossRef] [Scilit]
- Lundgren, M.R.; Des Marais, D.L. Life history variation as a model for understanding trade-offs in plant–environment interactions. Curr. Biol. 2020, 30, R180–R189. [Google Scholar] [CrossRef] [Scilit]
- Nguyen, J.; Lara-Gutiérrez, J.; Stocker, R. Environmental fluctuations and their effects on microbial communities, populations and individuals. FEMS Microbiol. Rev. 2021, 45, fuaa068. [Google Scholar] [CrossRef] [Scilit] [PubMed]
- Hamann, E.; Blevins, C.; Franks, S.J.; Jameel, M.I.; Anderson, J.T. Climate change alters plant–herbivore interactions. New Phytol. 2021, 229, 1894–1910. [Google Scholar] [CrossRef] [Scilit]
- Westerband, A.C.; Funk, J.L.; Barton, K.E. Intraspecific trait variation in plants: A renewed focus on its role in ecological processes. Ann. Bot. 2021, 127, 397–410. [Google Scholar] [CrossRef] [Scilit] [PubMed]
- Griffiths, M.; York, L.M. Targeting root ion uptake kinetics to increase plant productivity and nutrient use efficiency. Plant Physiol. 2020, 182, 1854–1868. [Google Scholar] [CrossRef] [Scilit]
- Delalandre, L.; Violle, C.; Fort, F.; Tschambser, J.; Saugier, L.; Fourtier, G.; Garnier, E. Plant response to nutrients differs among traits and depends on species’ nutrient requirements. Ann. Bot. 2025, 136, 1525–1535. [Google Scholar] [CrossRef] [Scilit] [PubMed]
- Malimbayeva, A.; Amangaliev, B.; Zhusupbekov, E.; Soltanayeva, A.; Sagimbayeva, A.; Oshakbayeva, Z.; Rustemova, K.; Batyrbek, M. Effects of different mineral, foliar macro- and micronutrient, and biofertilizer fertilization strategies on oil flax (Linum usitatissimum L.) yield and seed Quality under semi-arid rainfed conditions. Int. J. Plant Biol. 2026, 17, 19. [Google Scholar] [CrossRef] [Scilit]
- Lawson, T.; Matthews, J. Guard cell metabolism and stomatal function. Annu. Rev. Plant Biol. 2020, 71, 273–302. [Google Scholar] [CrossRef] [Scilit] [PubMed]
- Grossiord, C.; Buckley, T.N.; Cernusak, L.A.; Novick, K.A.; Poulter, B.; Siegwolf, R.T.W.; Sperry, J.S.; McDowell, N.G. Plant responses to rising vapor pressure deficit. New Phytol. 2020, 226, 1550–1566. [Google Scholar] [CrossRef] [Scilit]
- Hofmann, T.A.; Atkinson, W.; Fan, M.; Simkin, A.J.; Jindal, P.; Lawson, T. Impact of climate-driven changes in temperature on stomatal anatomy and physiology. Philos. Trans. R. Soc. Lond. B Biol Sci. 2025, 380, 20240244. [Google Scholar] [CrossRef] [Scilit]
- Yetgin, A. Exploring the dynamic nature of root plasticity and morphology in the face of changing environments. Ecol. Front. 2024, 44, 112–119. [Google Scholar] [CrossRef] [Scilit]
- Lopez, G.; Ahmadi, S.H.; Amelung, W.; Athmann, M.; Ewert, F.; Gaiser, T.; Gocke, M.I.; Kautz, T.; Postma, J.; Rachmilevitch, S.; et al. Nutrient deficiency effects on root architecture and root-to-shoot ratio in arable crops. Front. Plant Sci. 2023, 13, 1067498. [Google Scholar] [CrossRef] [Scilit] [PubMed]
- Wang, M.-Z.; Li, H.-L.; Liu, C.-X.; Dong, B.-C.; Yu, F.-H. Adaptive plasticity in response to light and nutrient availability in the clonal plant Duchesnea indica. J. Plant Ecol. 2022, 15, 795–807. [Google Scholar] [CrossRef] [Scilit]
- Weigelt, A.; Mommer, L.; Andraczek, K.; Iversen, C.M.; Bergmann, J.; Bruelheide, H.; Fan, Y.; Freschet, G.T.; Guerrero-Ramírez, N.R.; Kattge, J.; et al. An integrated framework of plant form and function: The belowground perspective. New Phytol. 2021, 232, 42–59. [Google Scholar] [CrossRef] [Scilit]
- Abdulraheem, M.I.; Moshood, A.Y.; Li, L.; Taiwo, L.B.; Oyedele, A.O.; Ezaka, E.; Chen, H.; Farooque, A.A.; Raghavan, V.; Hu, J. Reactivating the potential of Lima bean (Phaseolus lunatus) for enhancing soil quality and sustainable soil ecosystem stability. Agriculture 2024, 14, 976. [Google Scholar] [CrossRef] [Scilit]
- Xu, M.-P.; Wang, J.-Y.; Zhu, Y.-F.; Han, X.-H.; Ren, C.-J.; Yang, G.-H. Plant biomass and soil nutrients Mainly explain the variation of soil microbial communities during secondary succession on the loess plateau. Microb. Ecol. 2022, 83, 114–126. [Google Scholar] [CrossRef] [Scilit] [PubMed]
- Zhang, X.; Li, J.; Shao, L.; Qin, F.; Yang, J.; Gu, H.; Zhai, P.; Pan, X. Effects of organic fertilizers on yield, soil physico-chemical property, soil microbial community diversity and structure of Brassica rapa var. Chinensis. Front. Microbiol. 2023, 14, 1132853. [Google Scholar] [CrossRef] [Scilit]
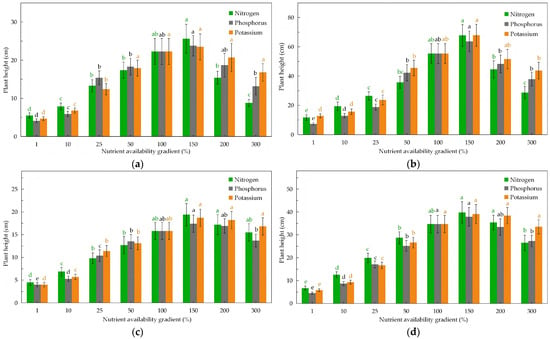
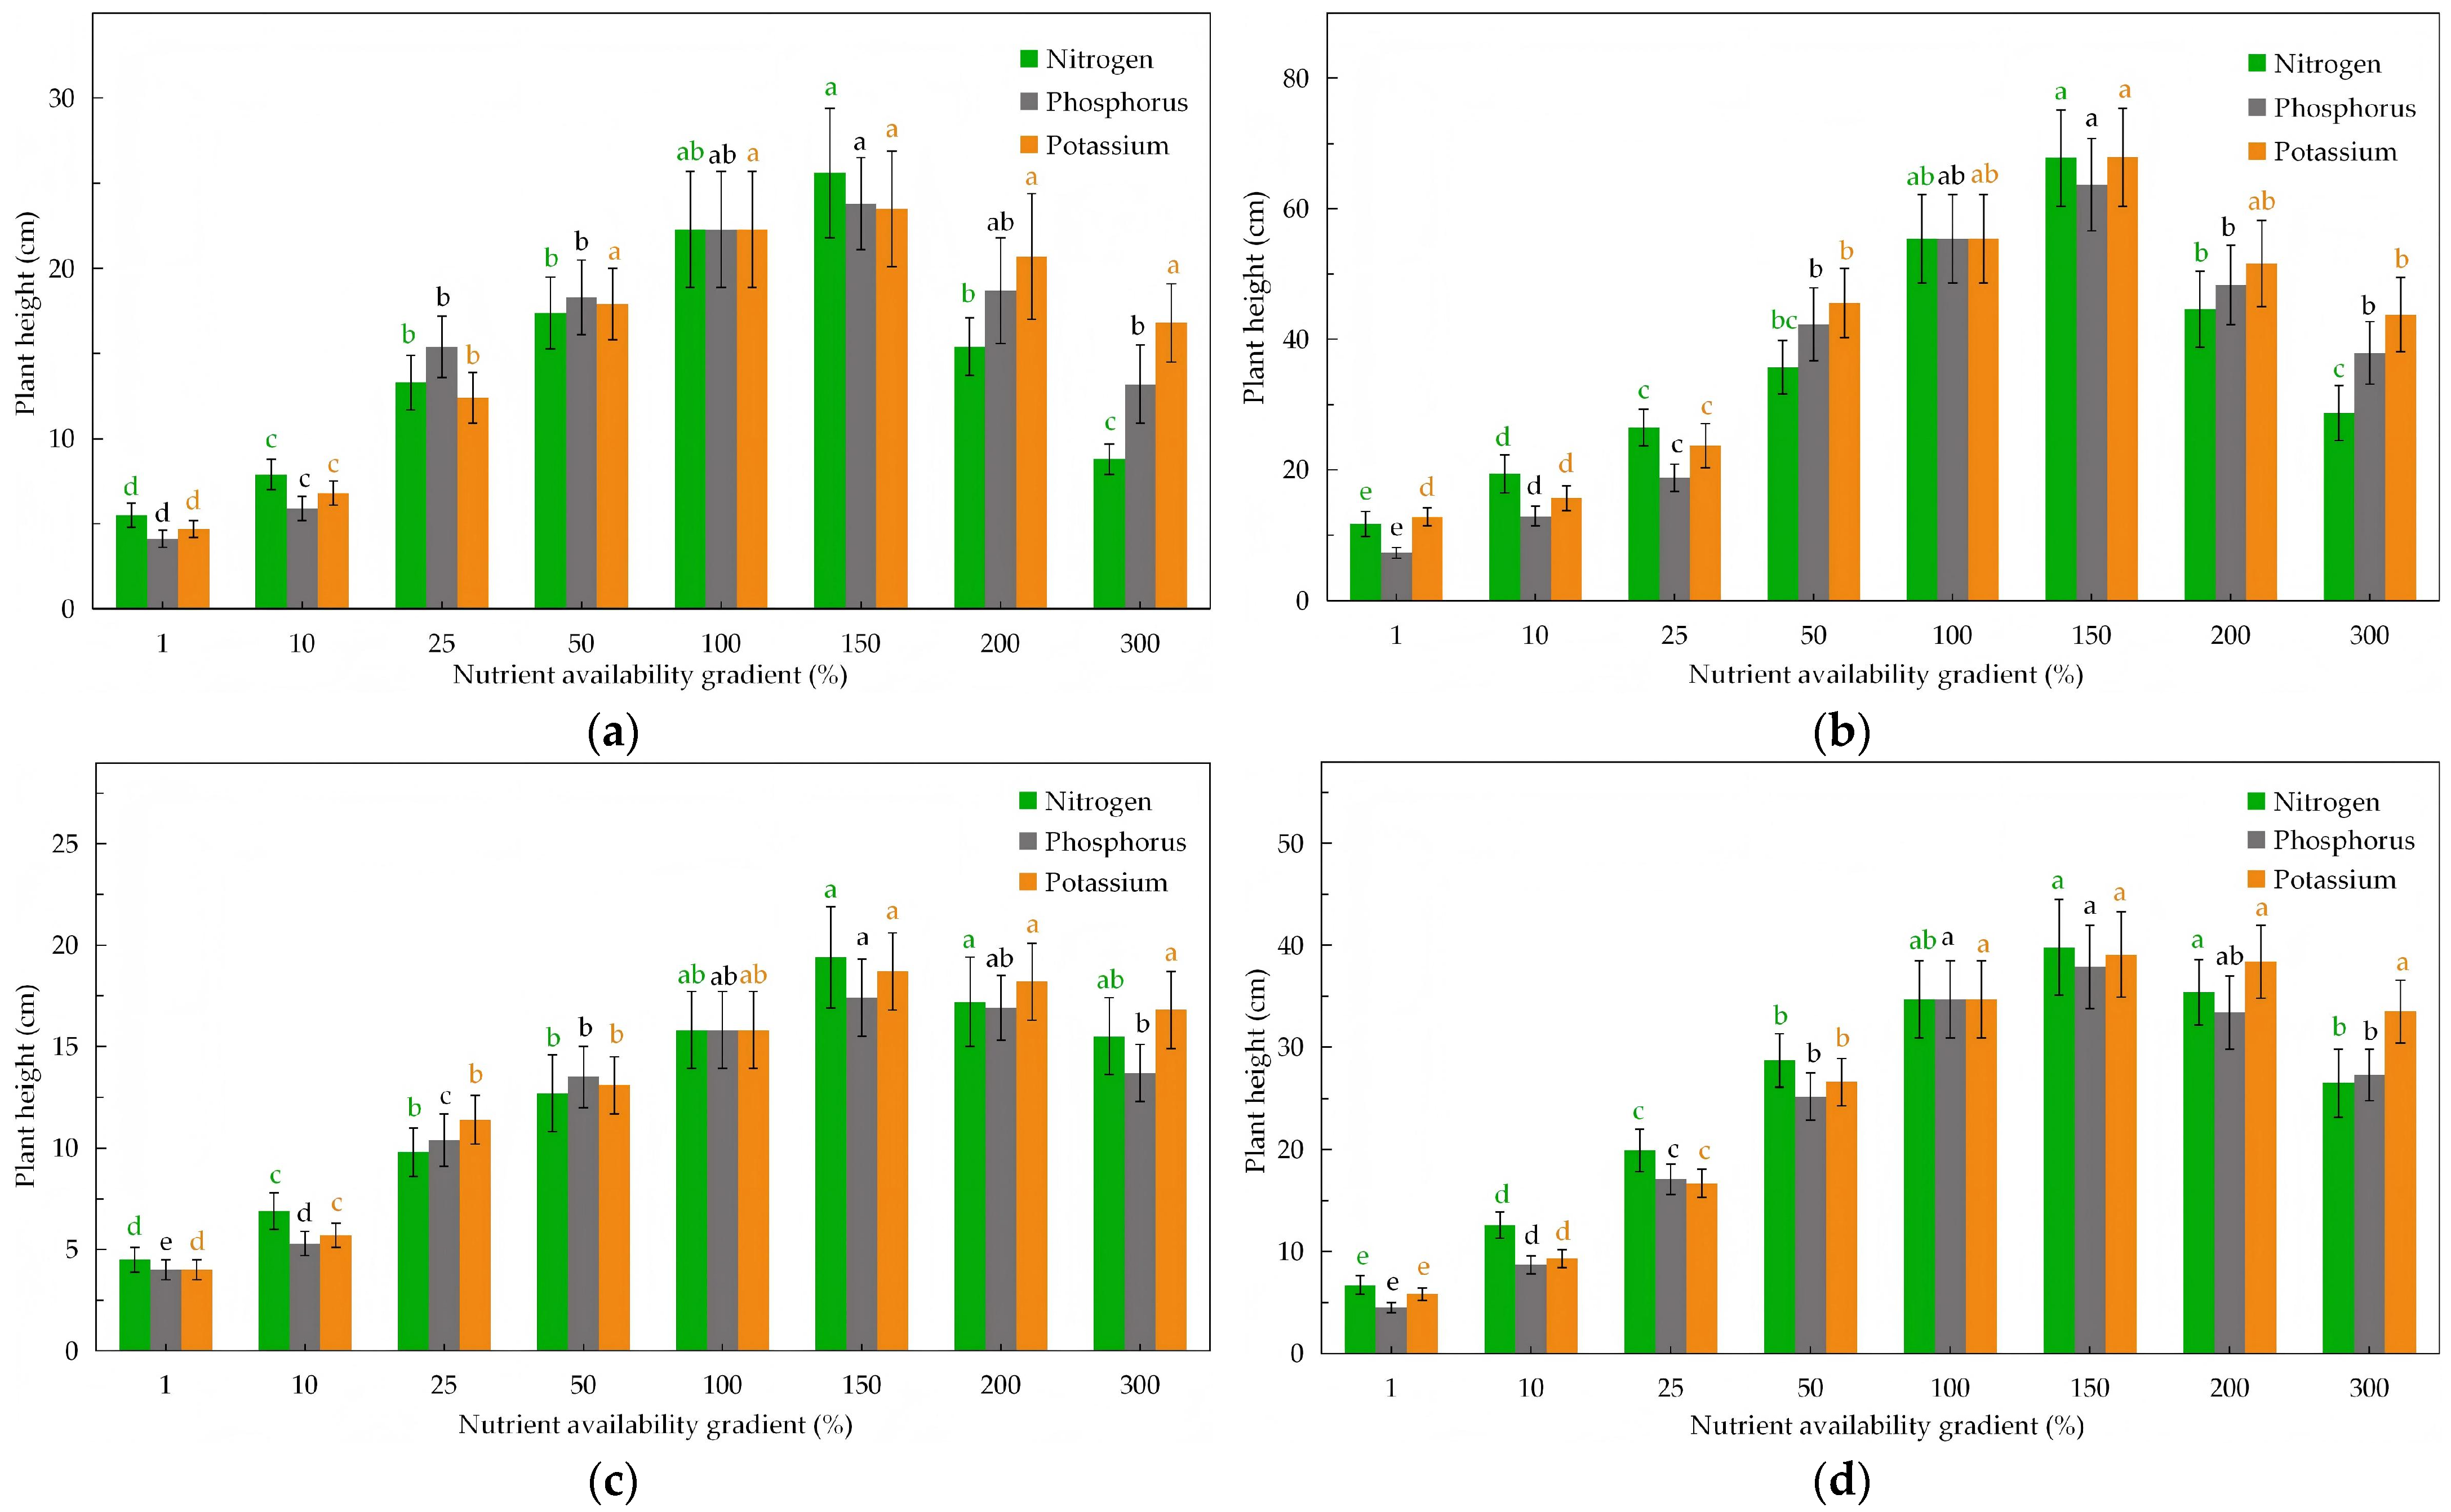
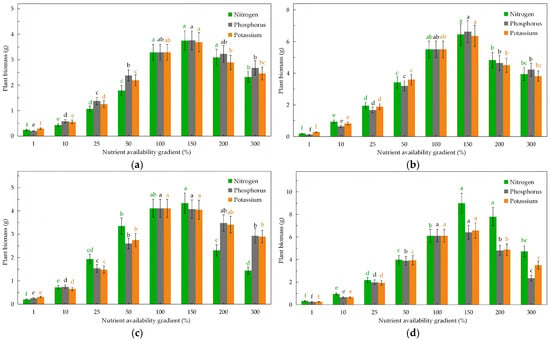
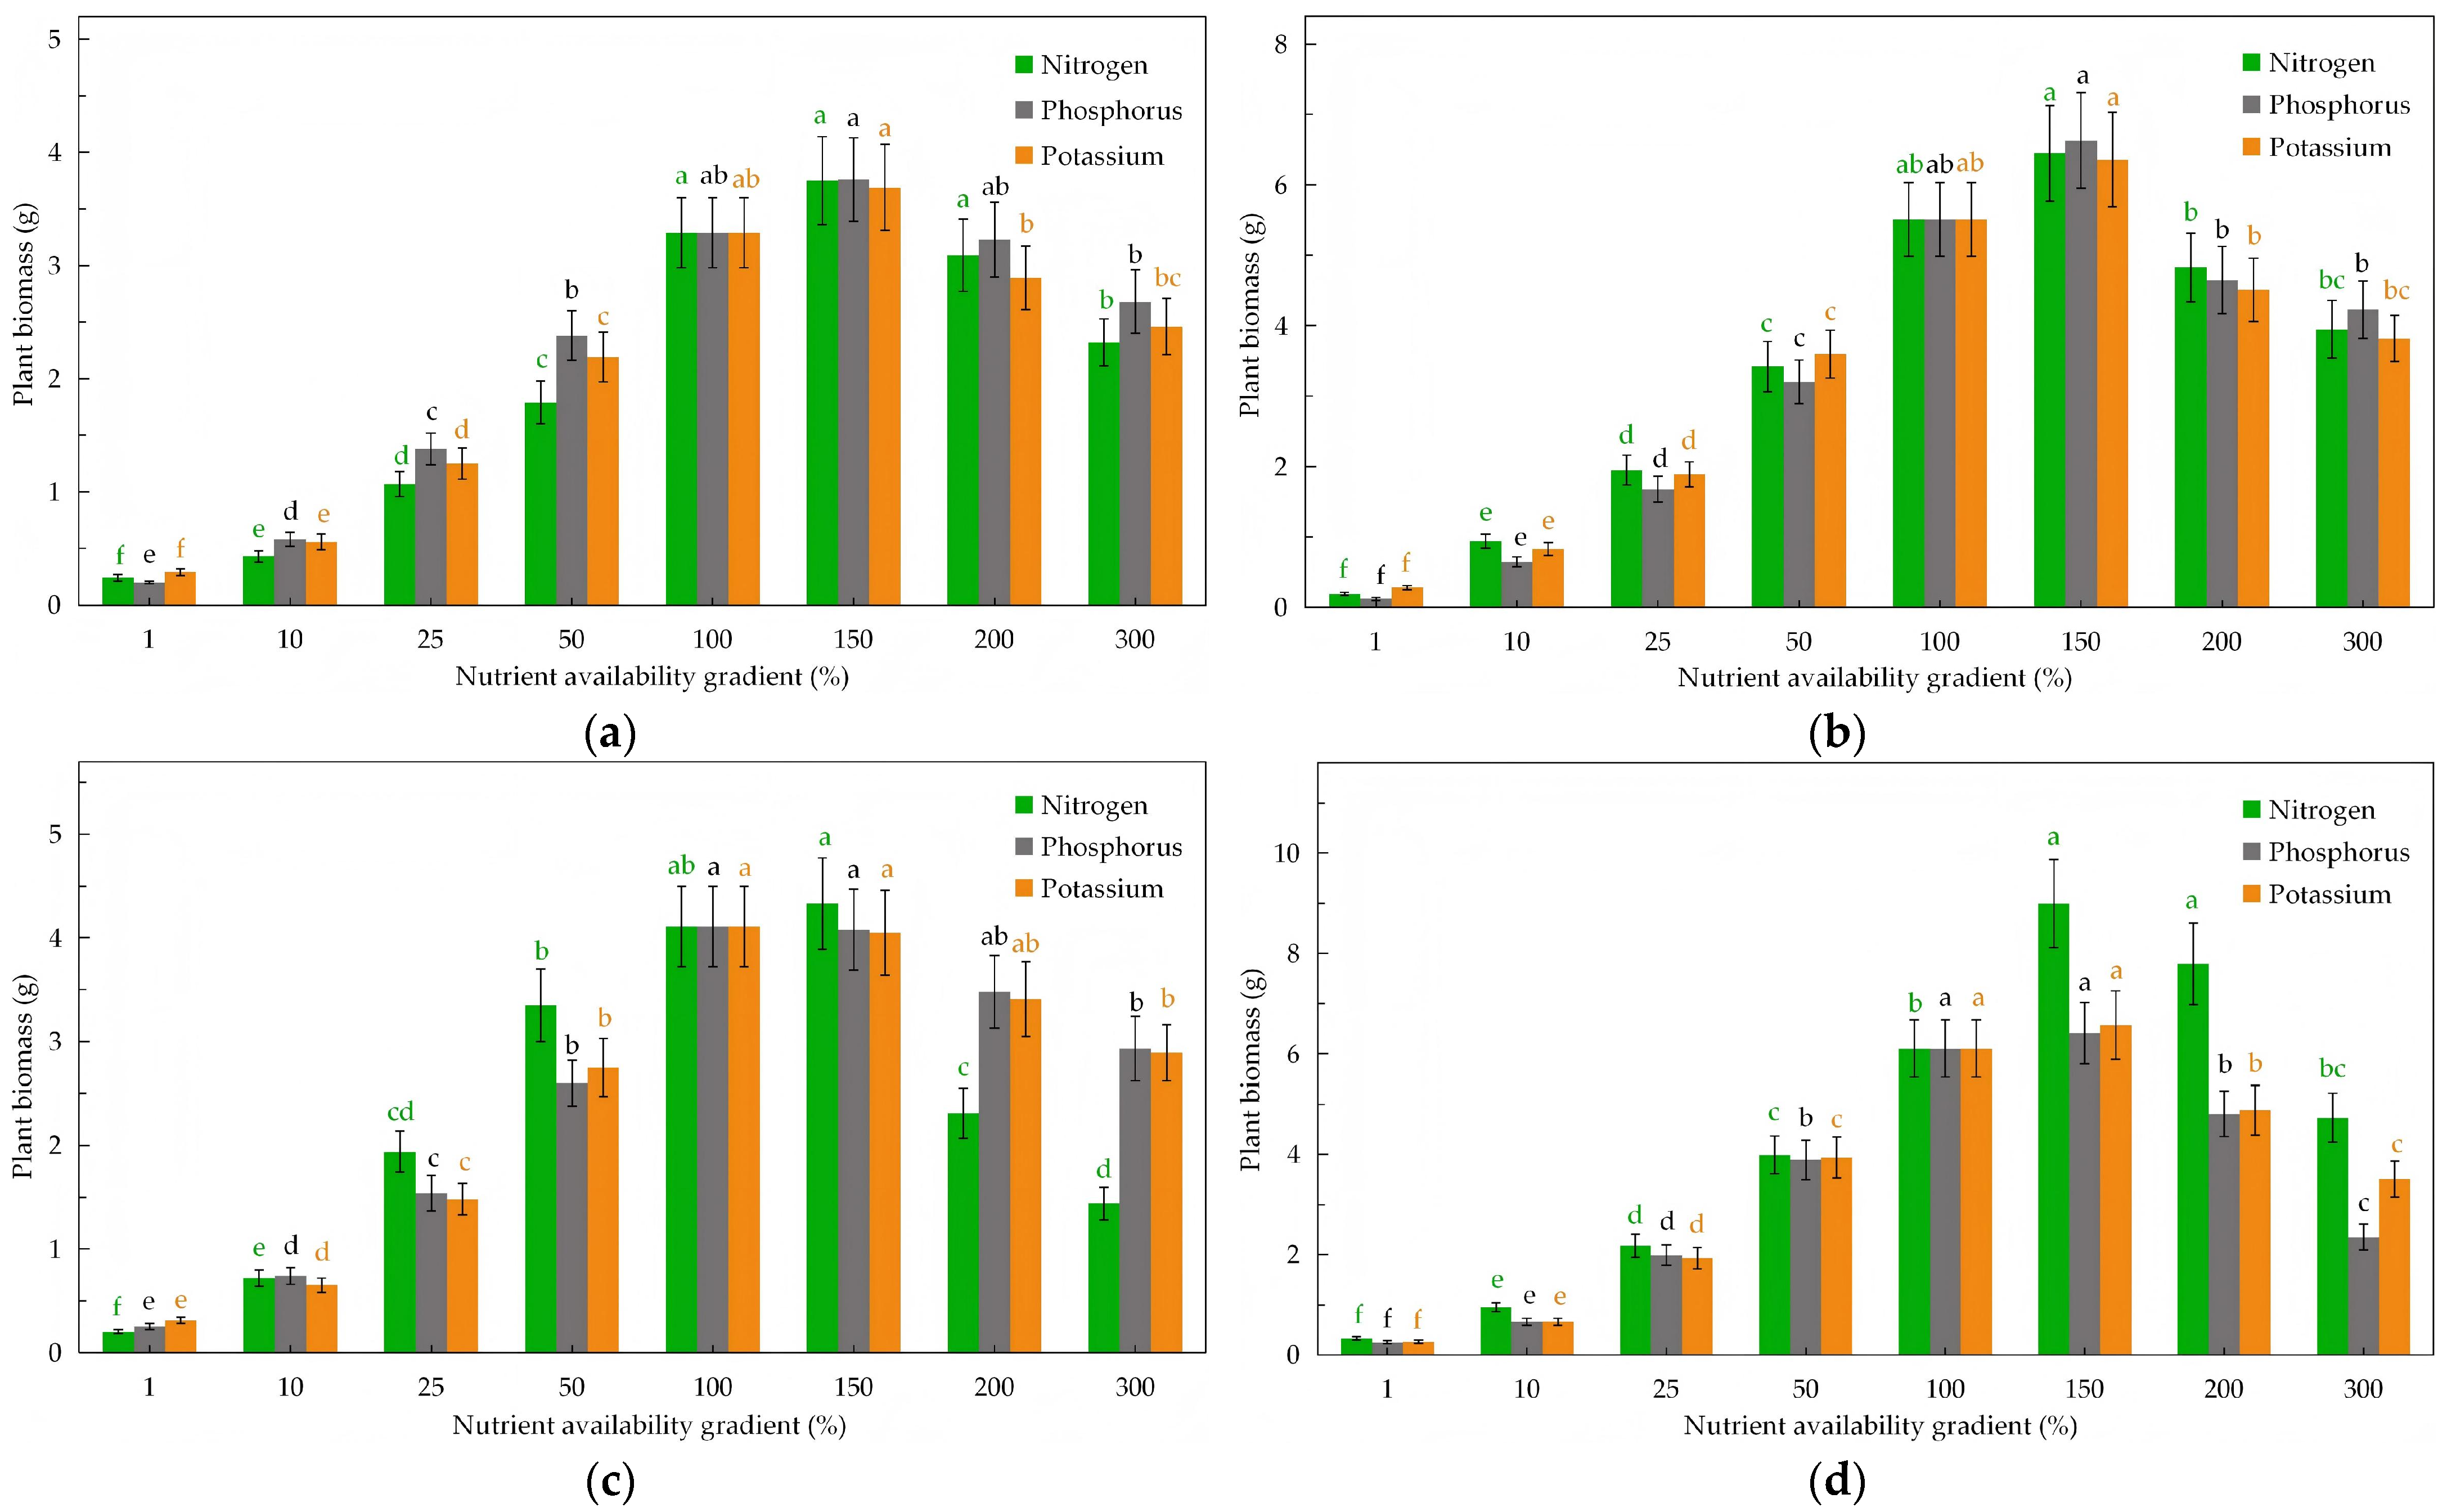
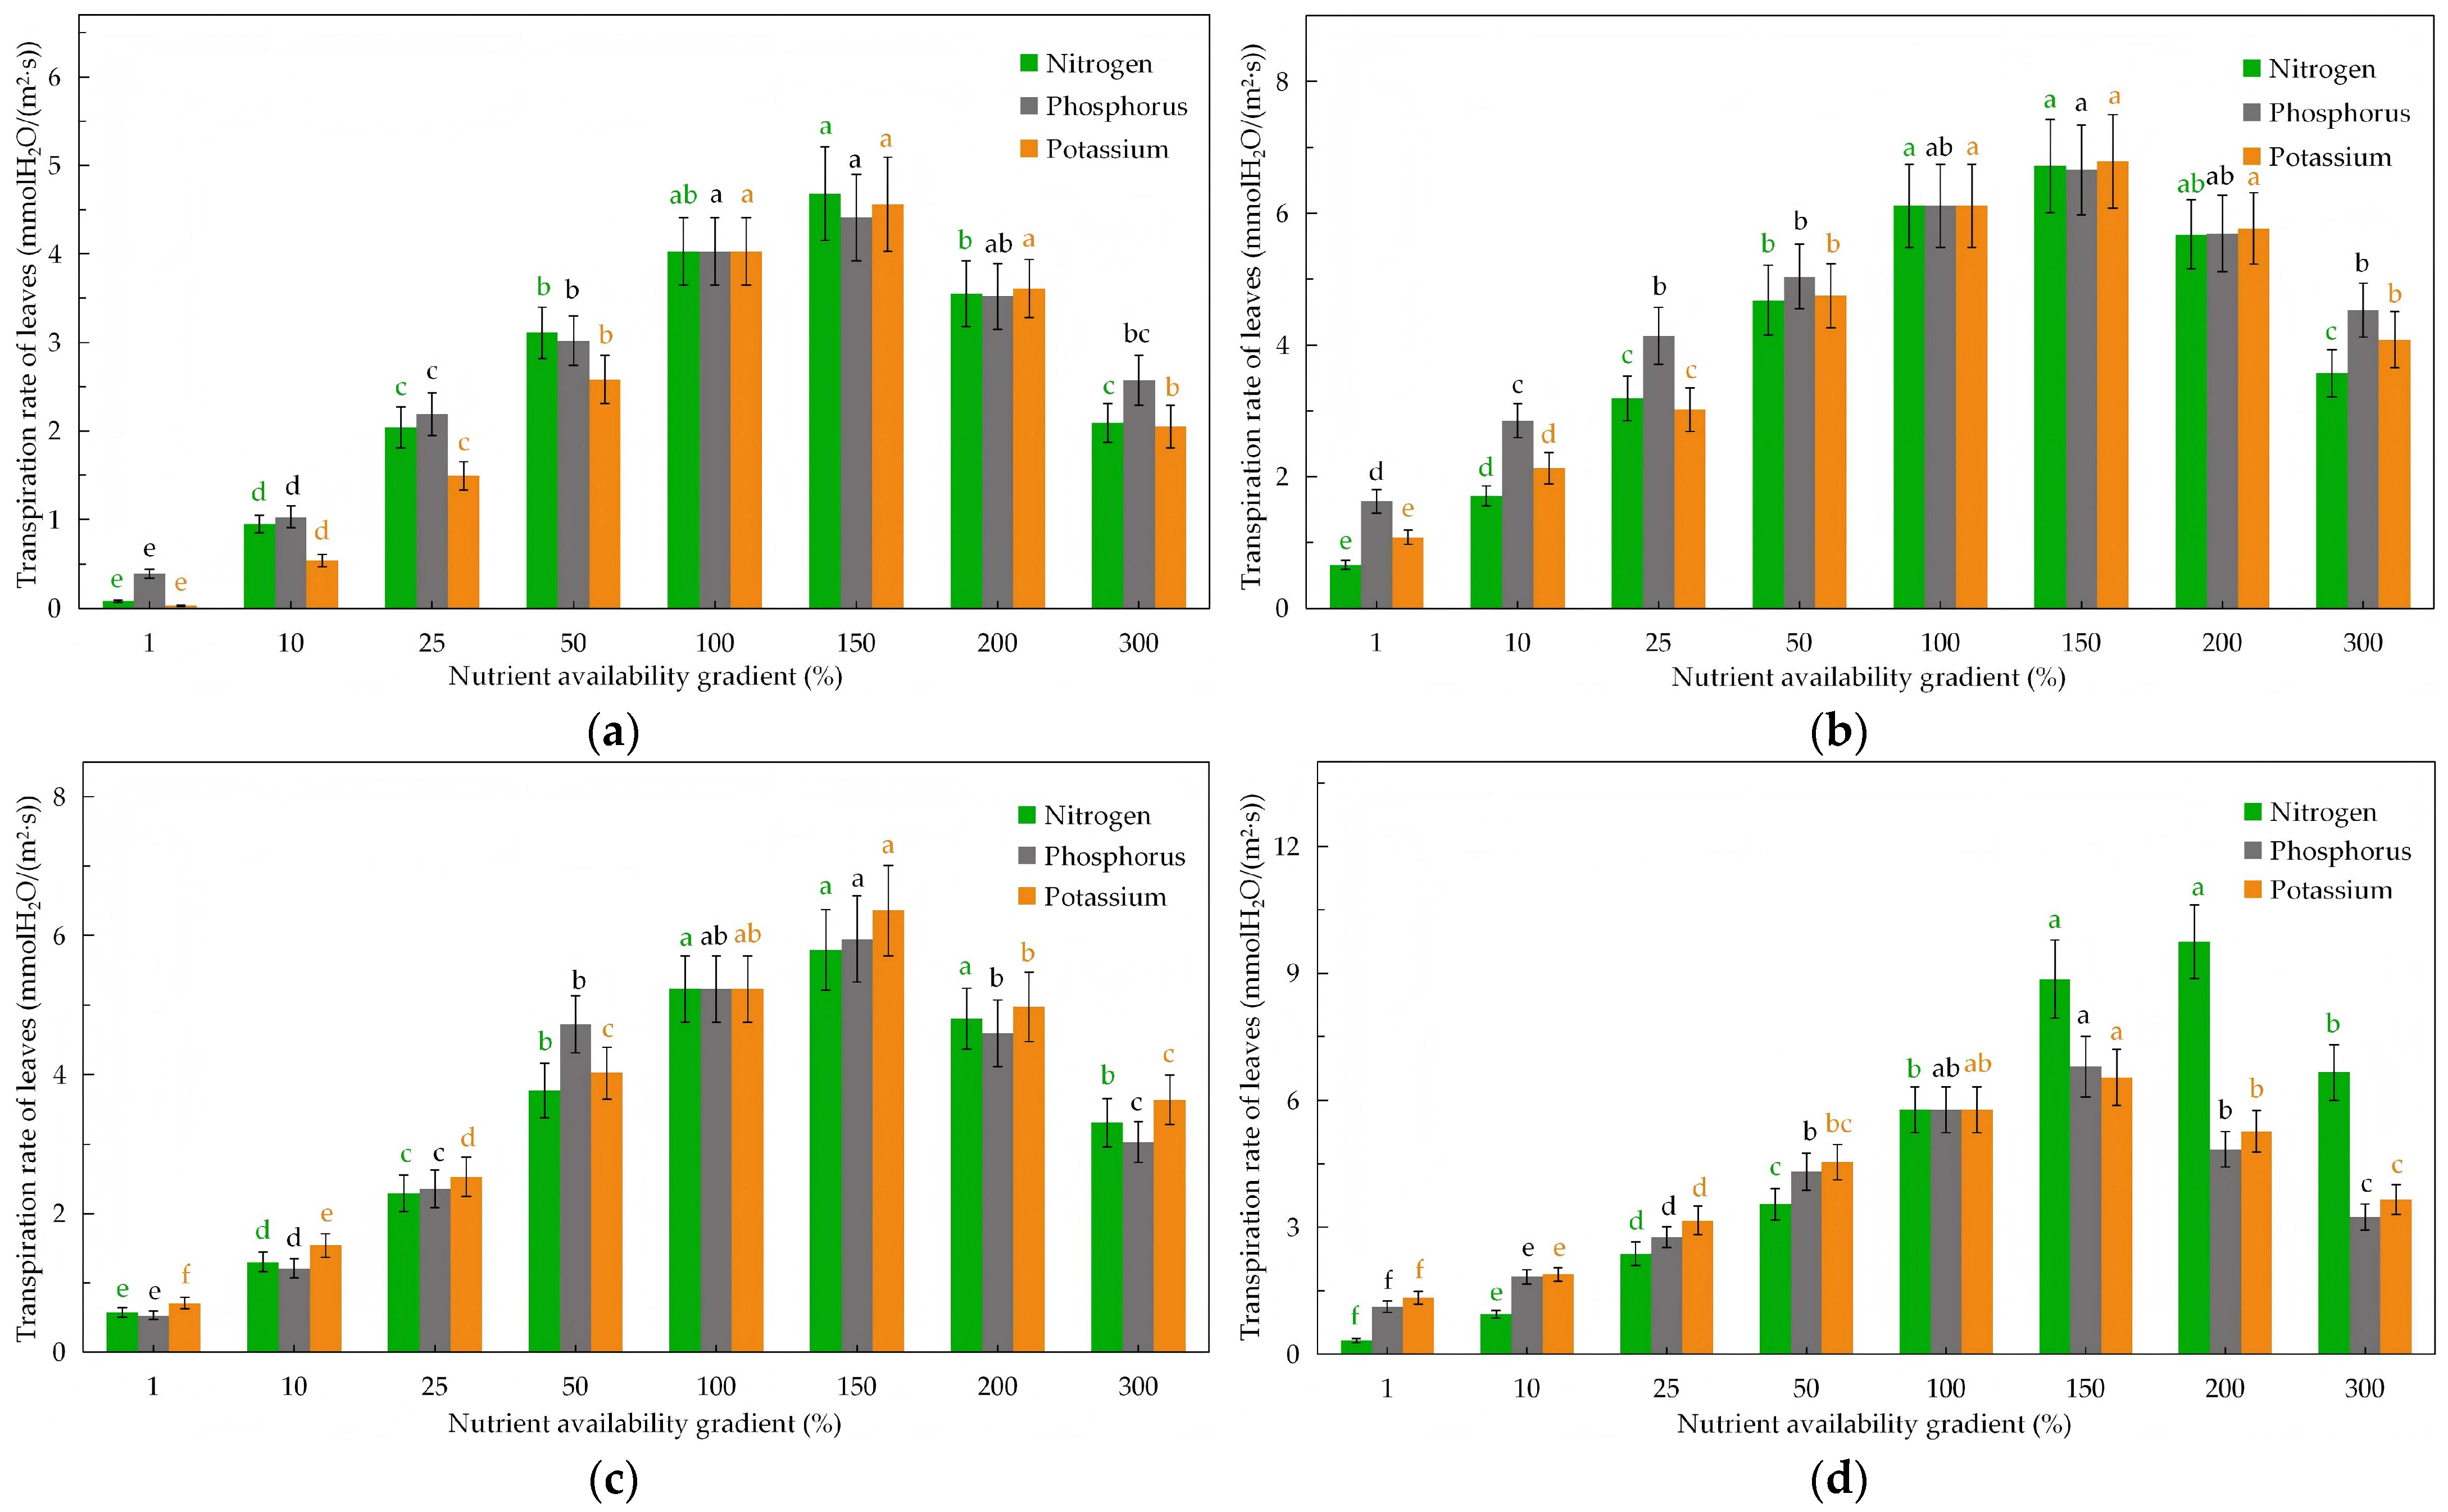
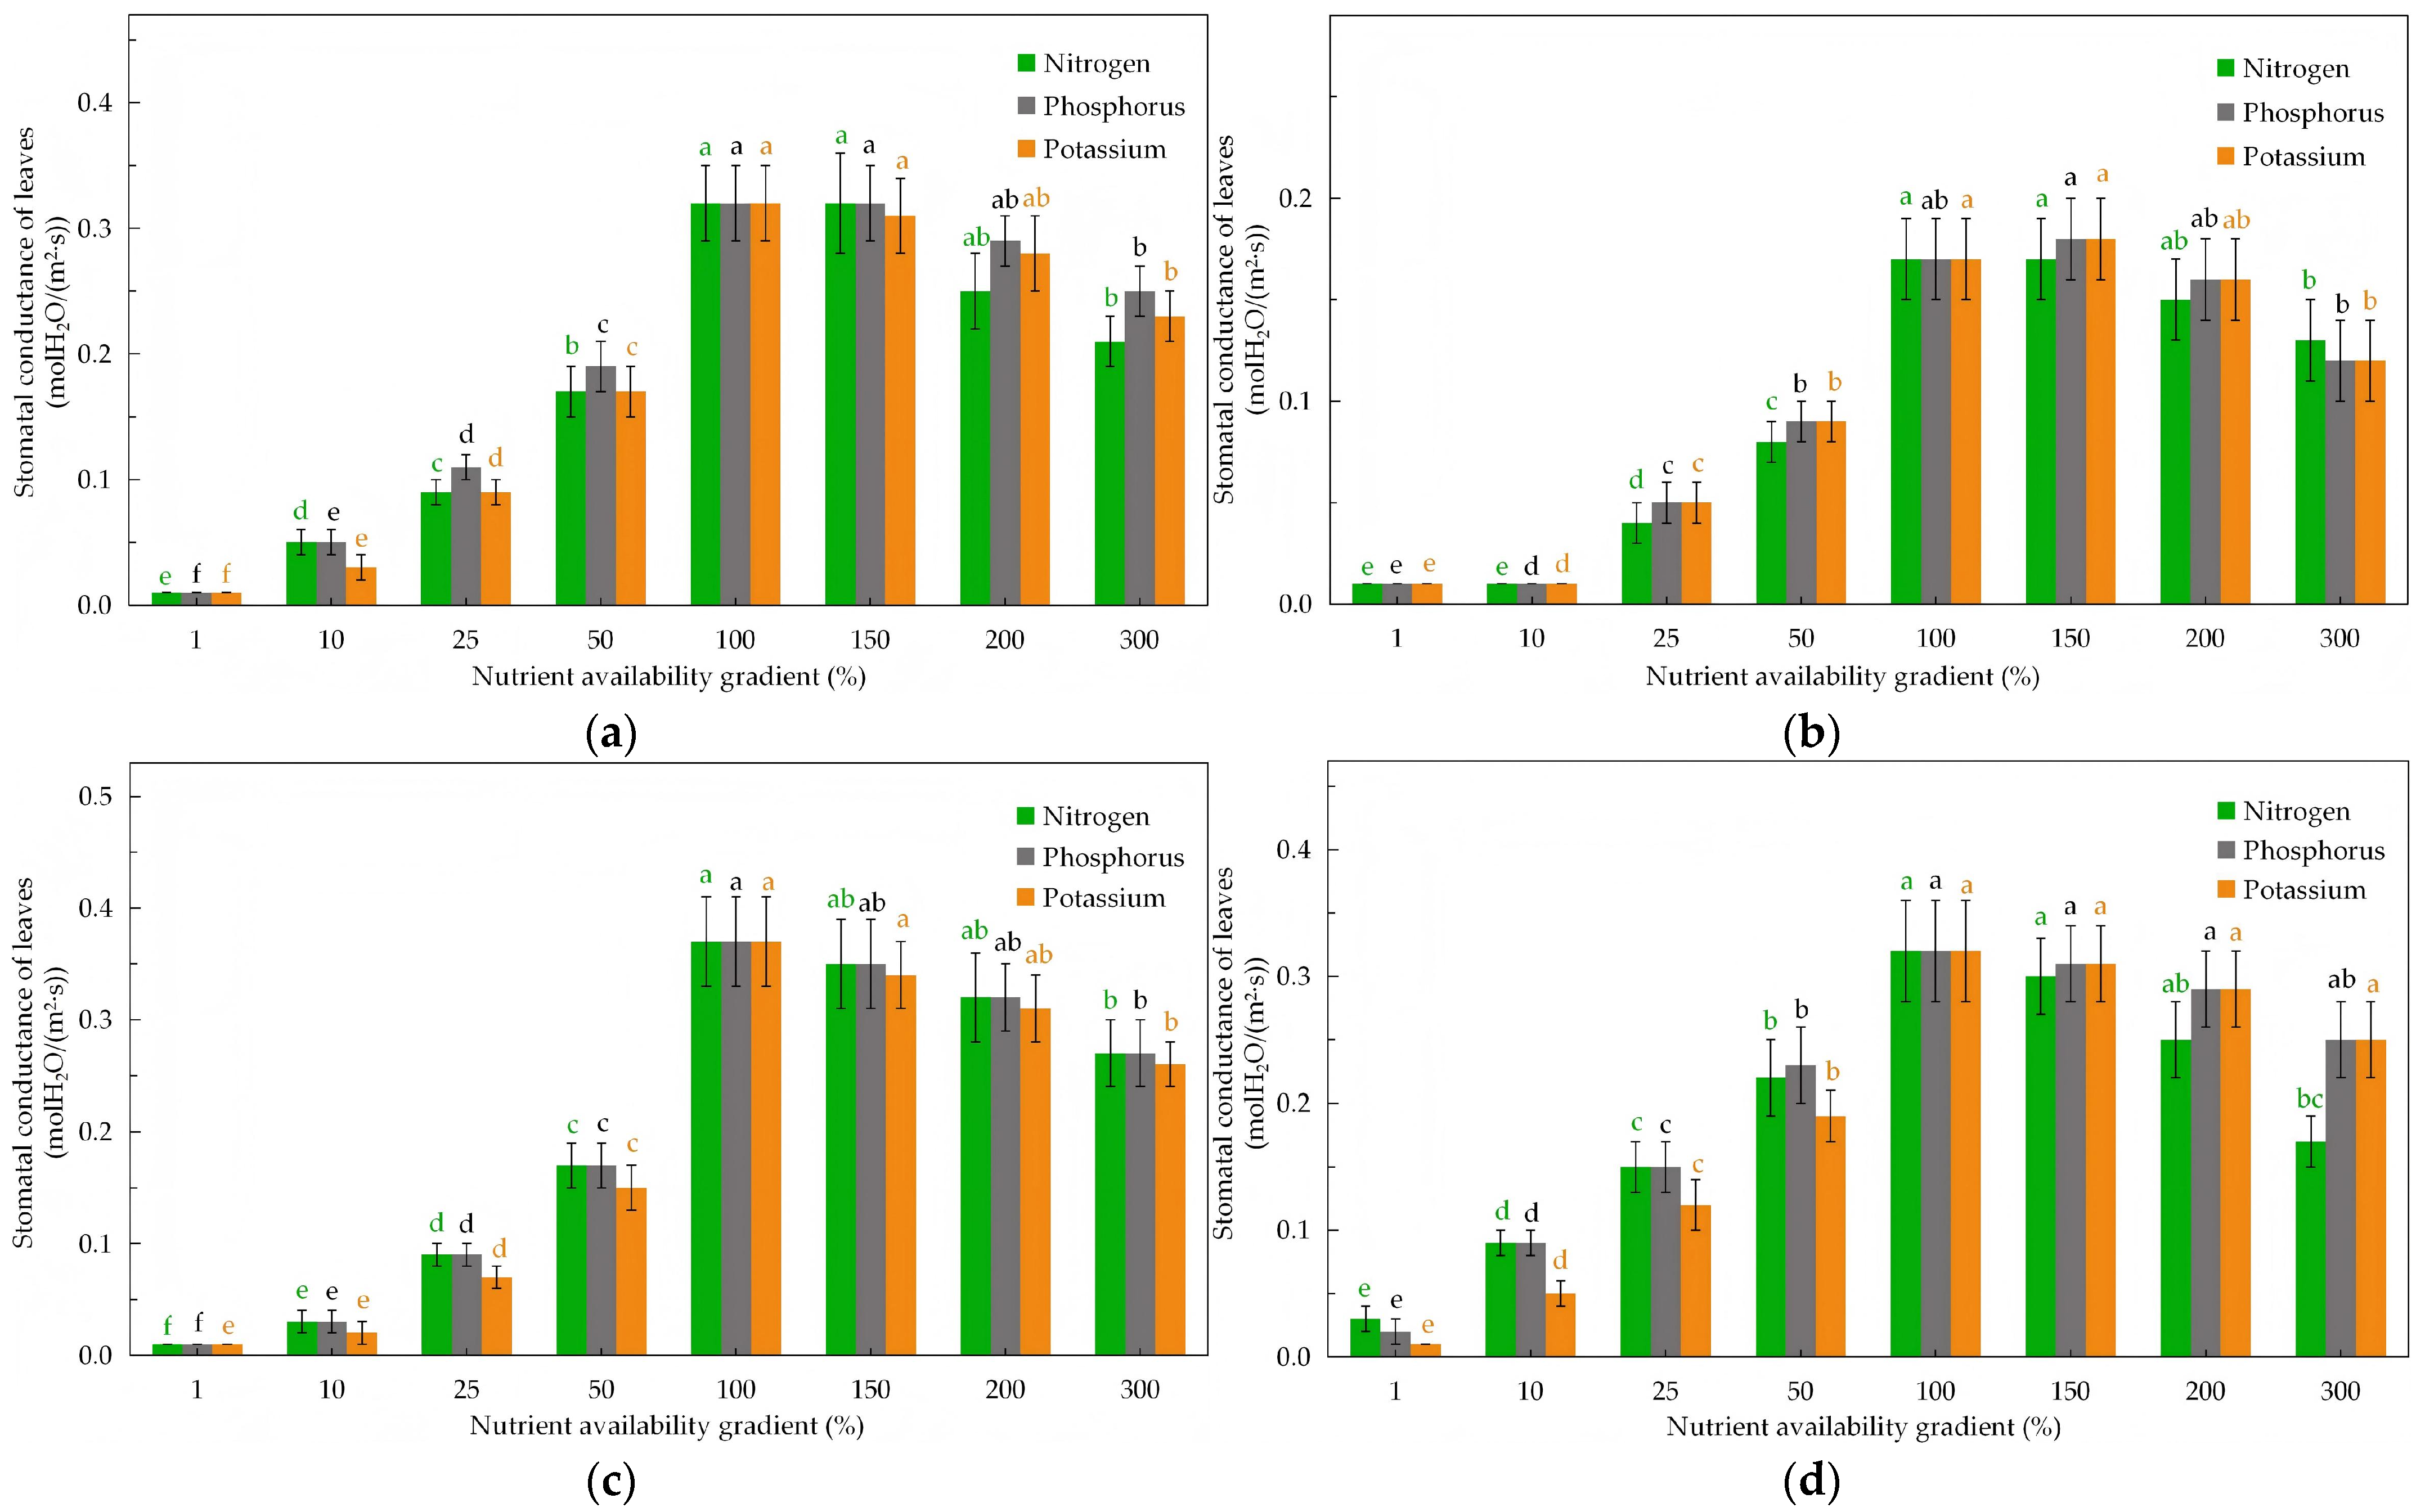
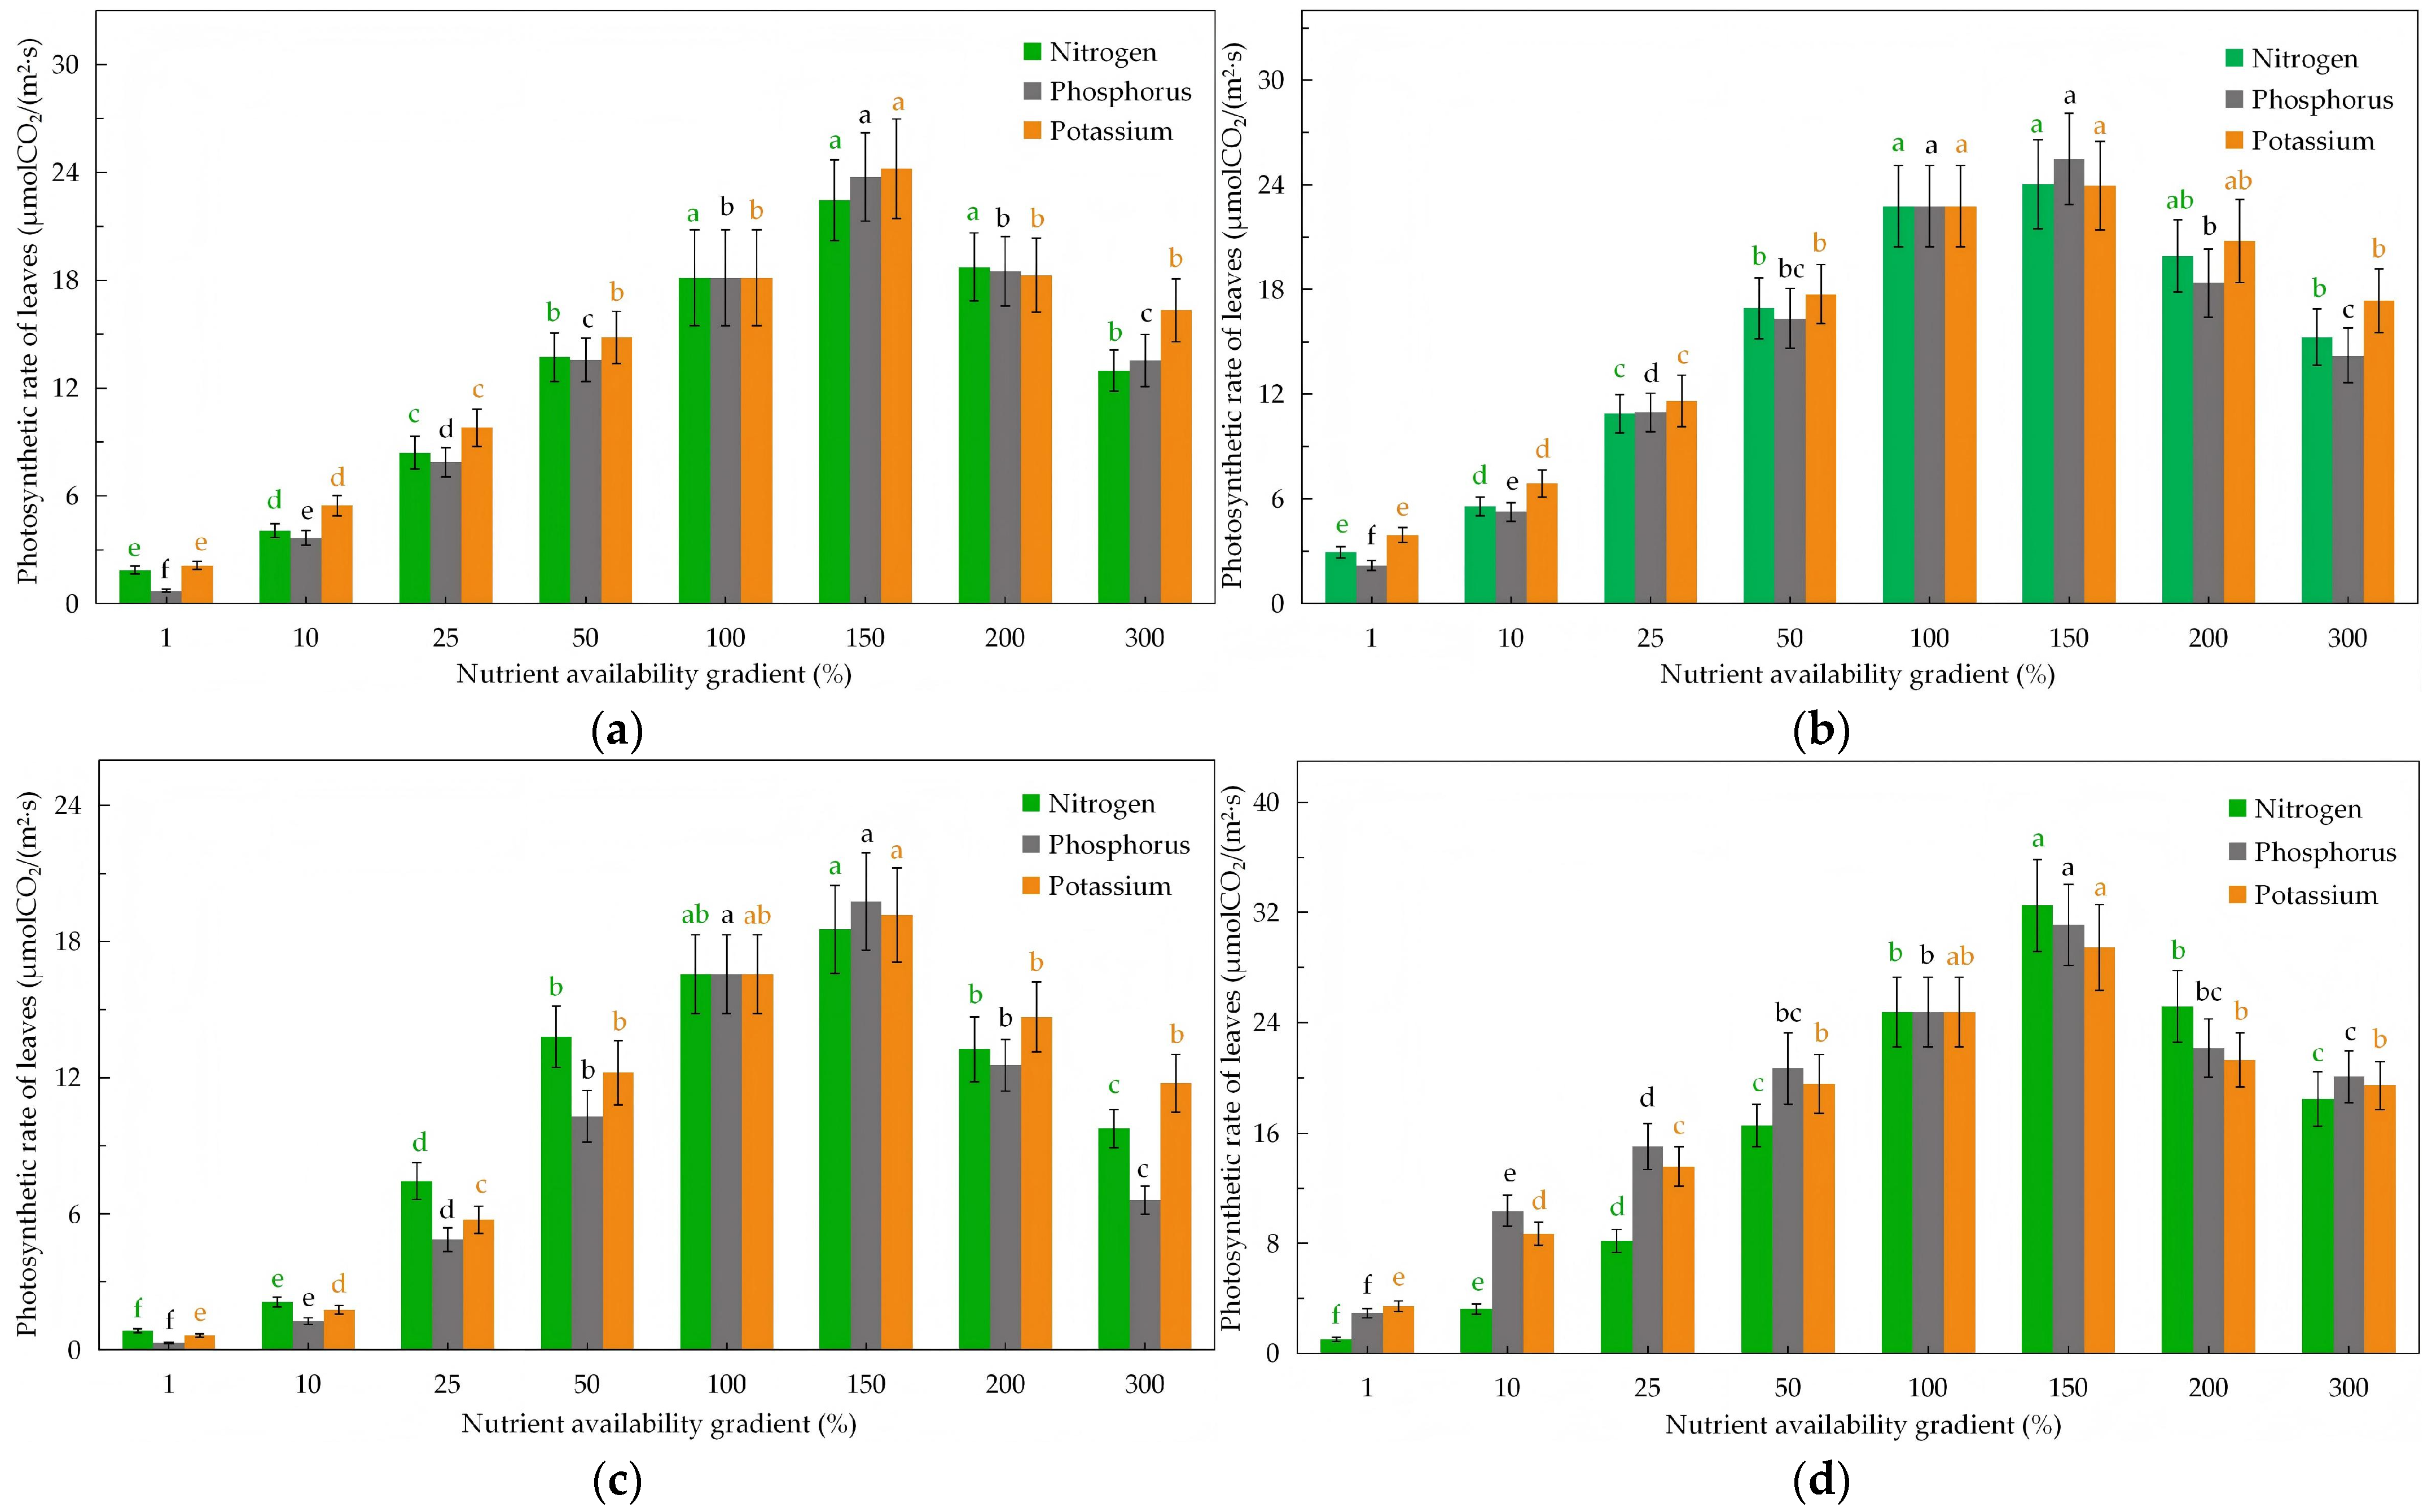
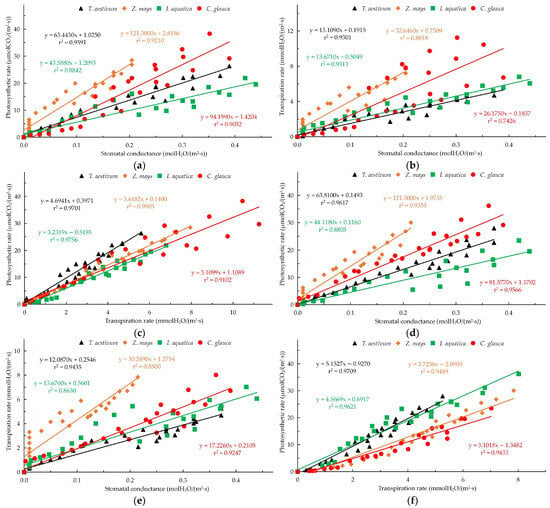
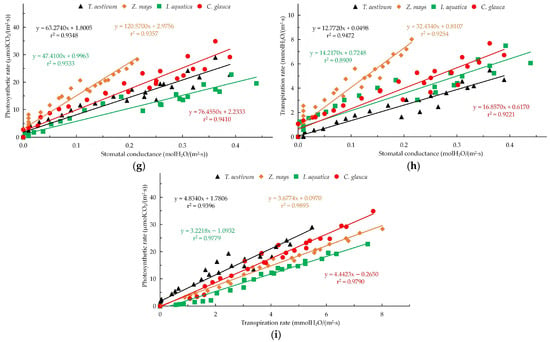
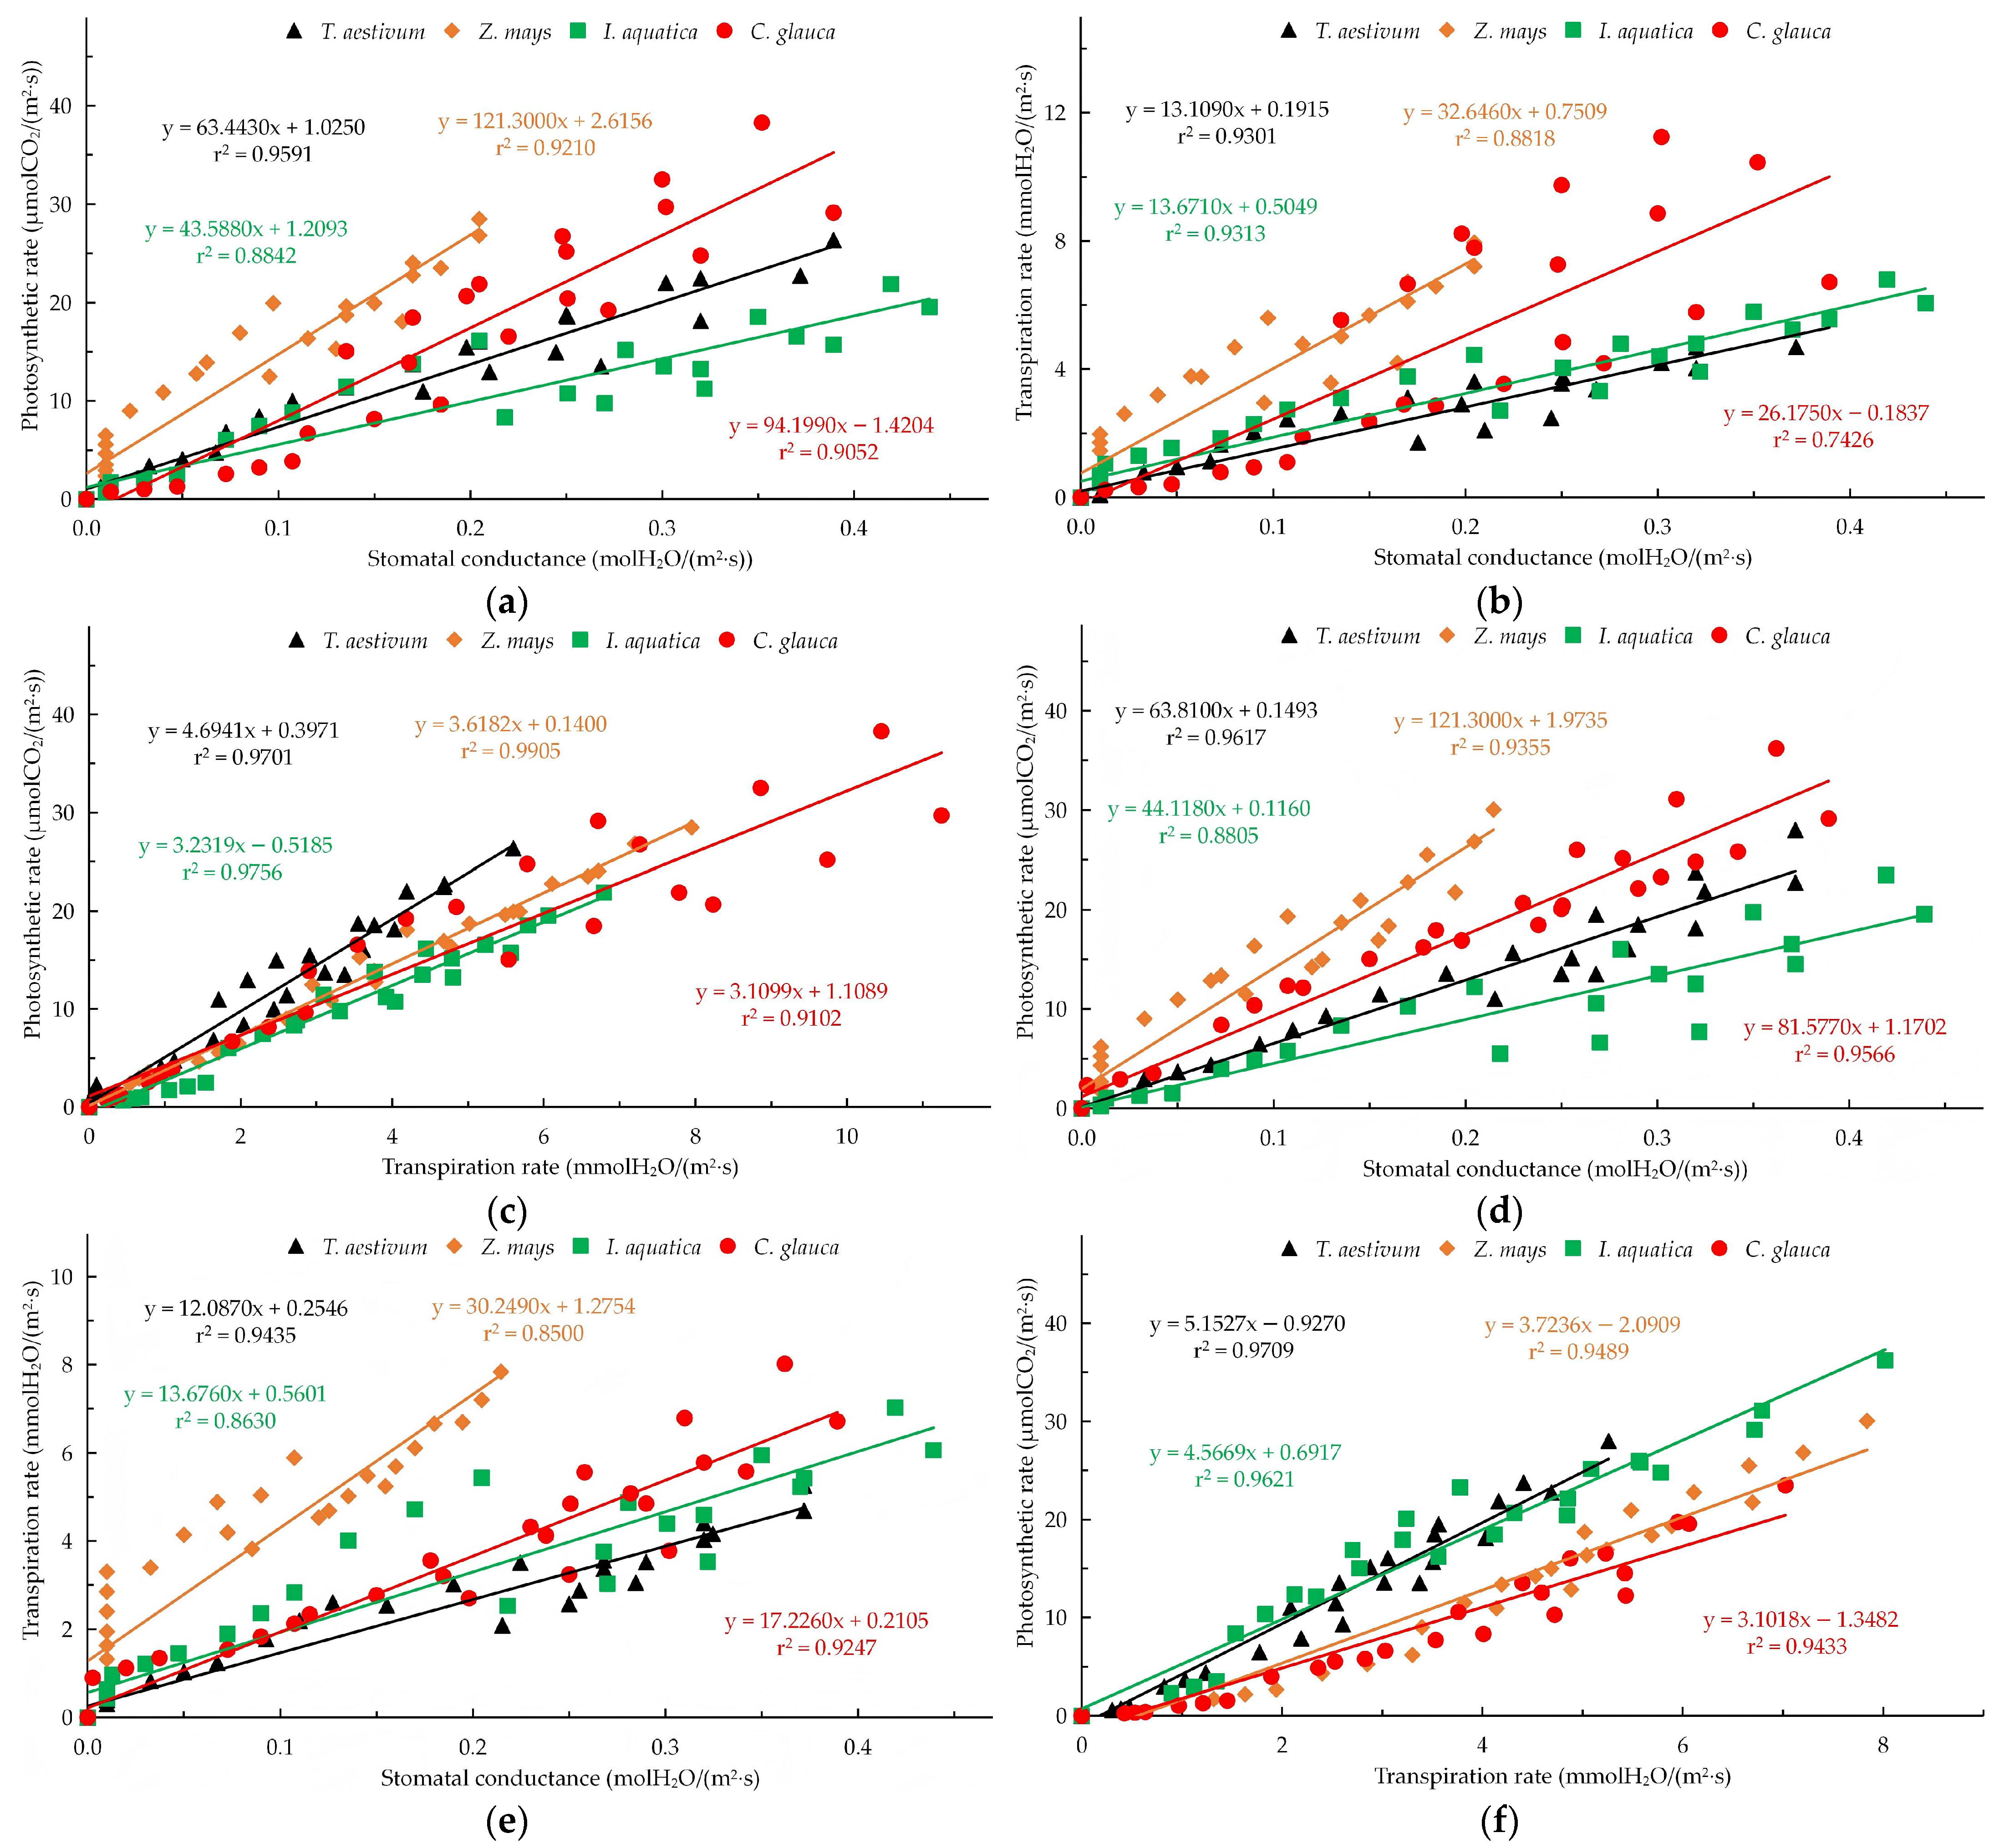
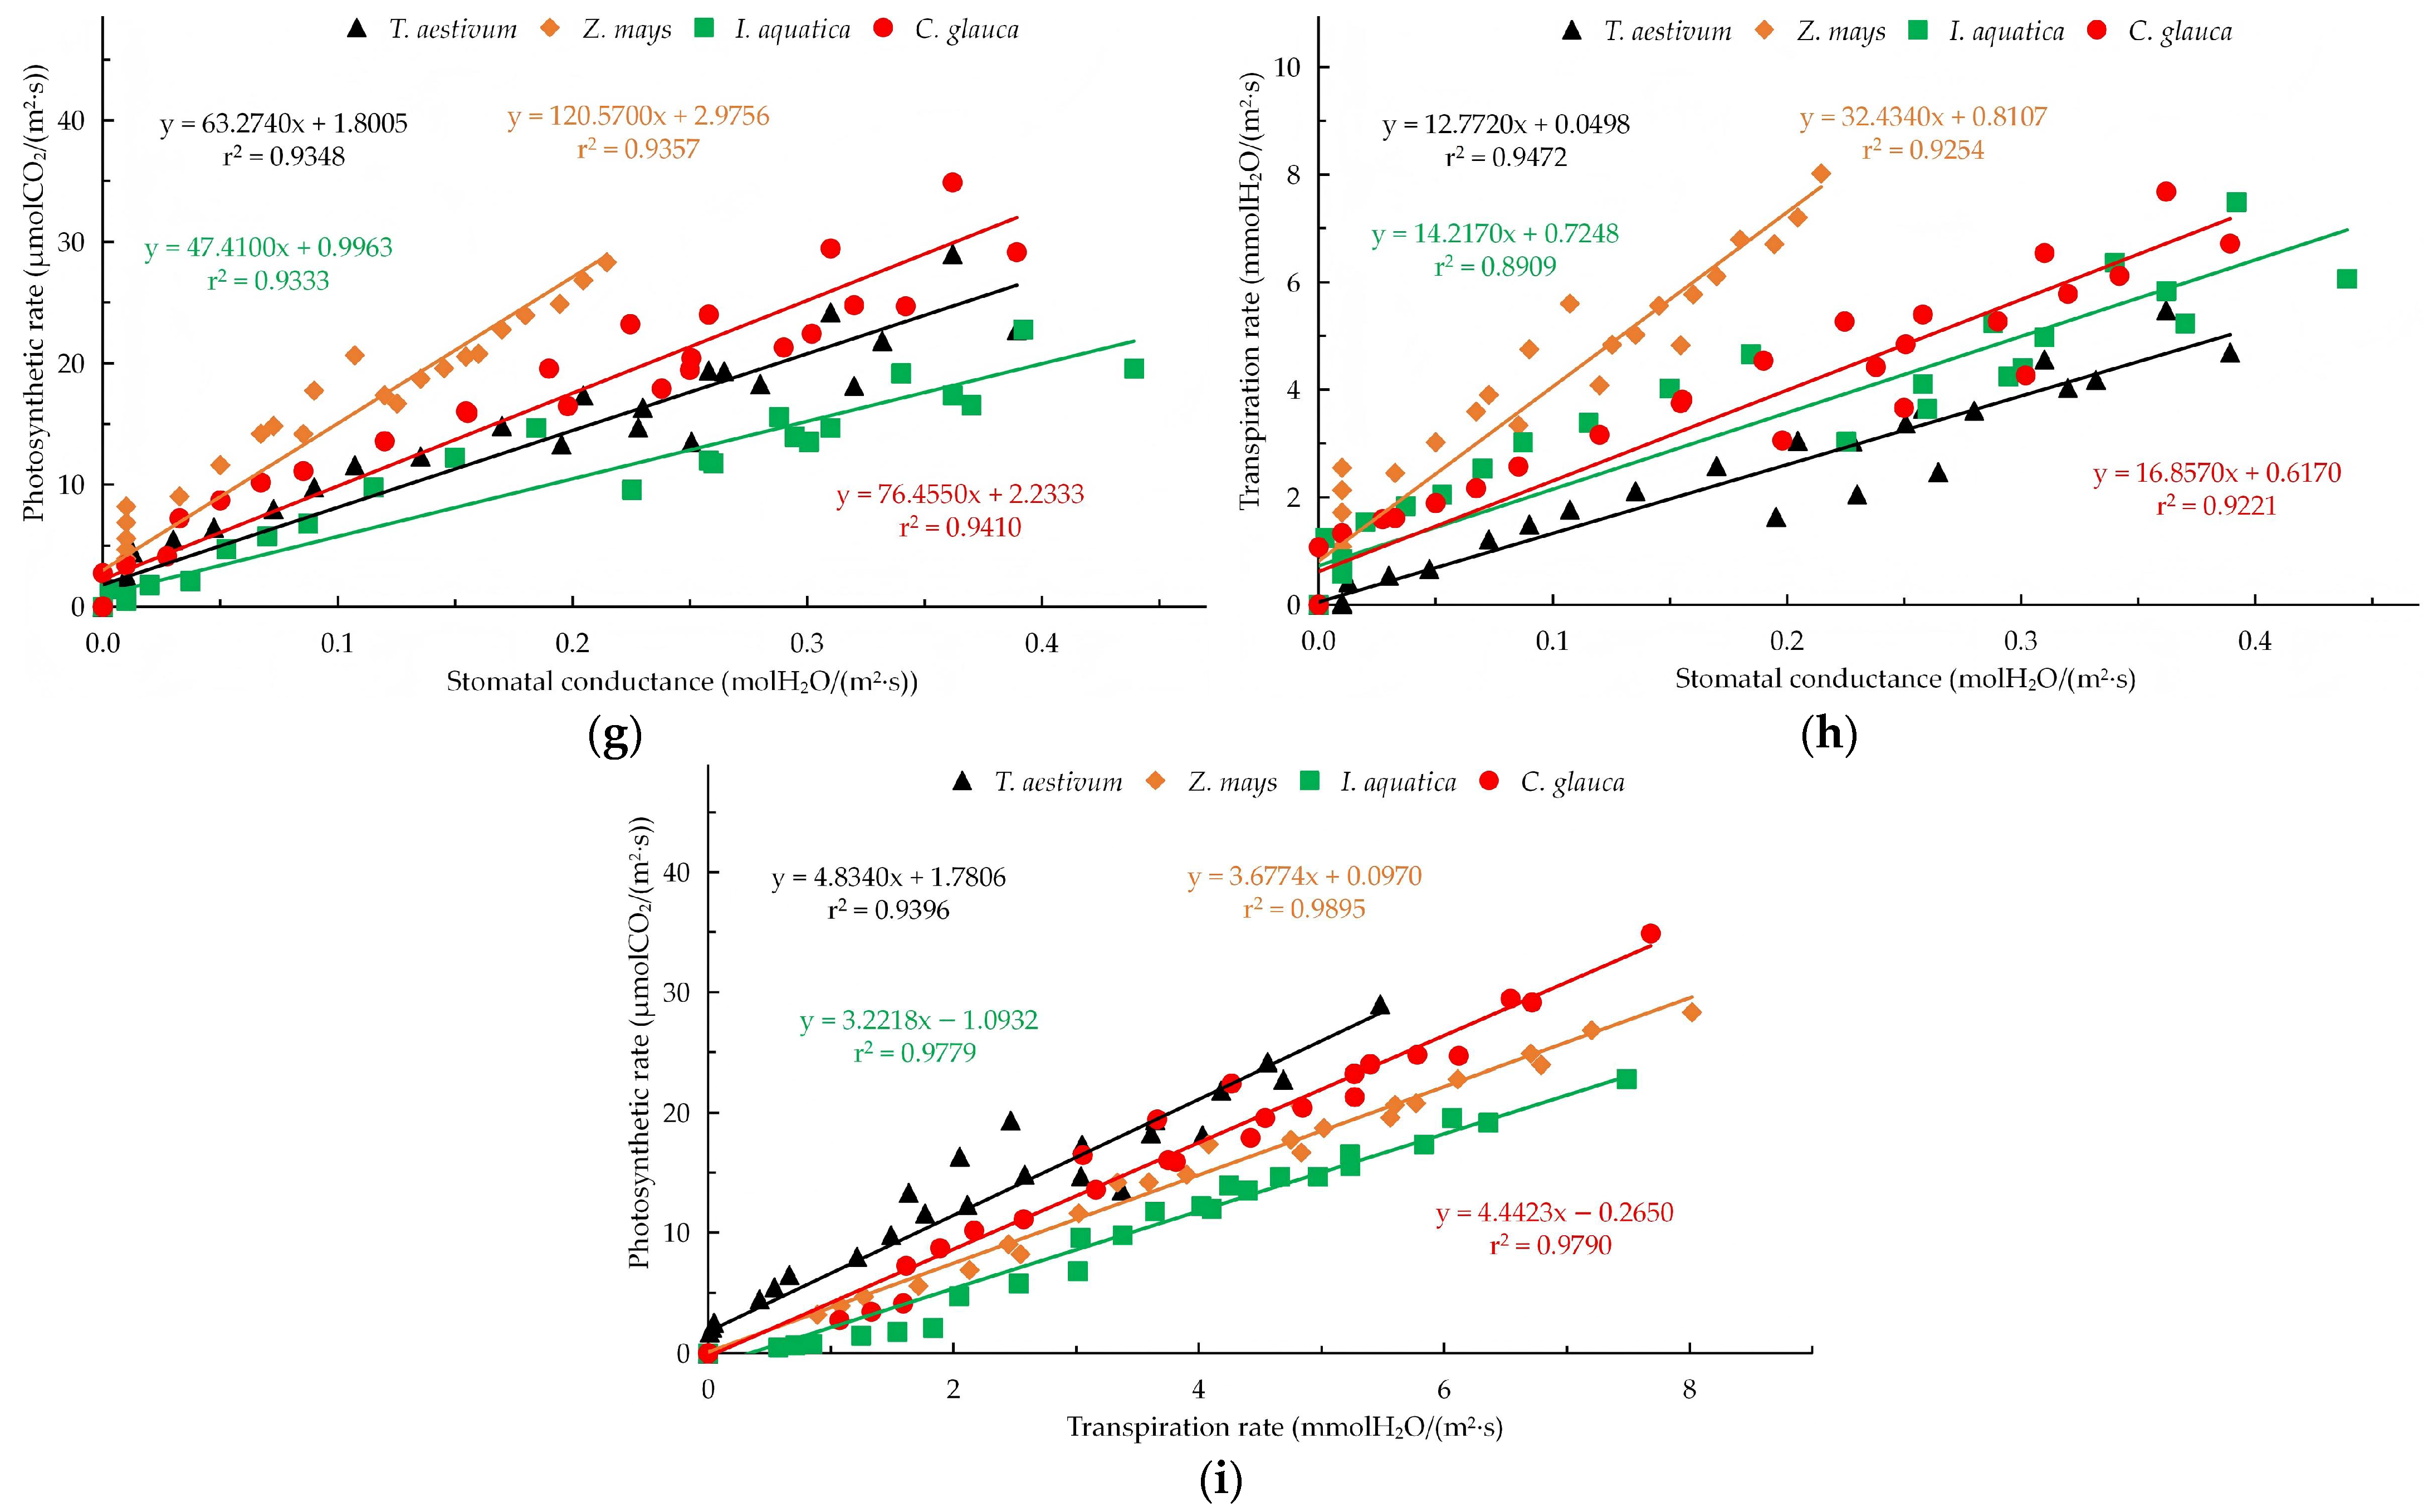
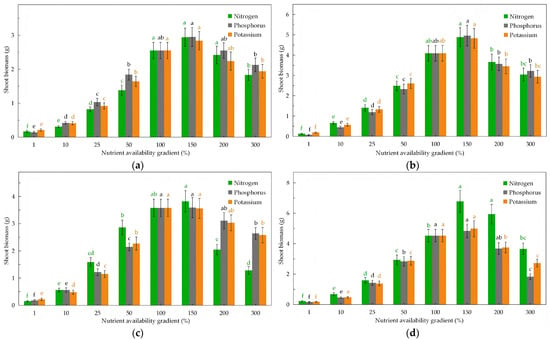
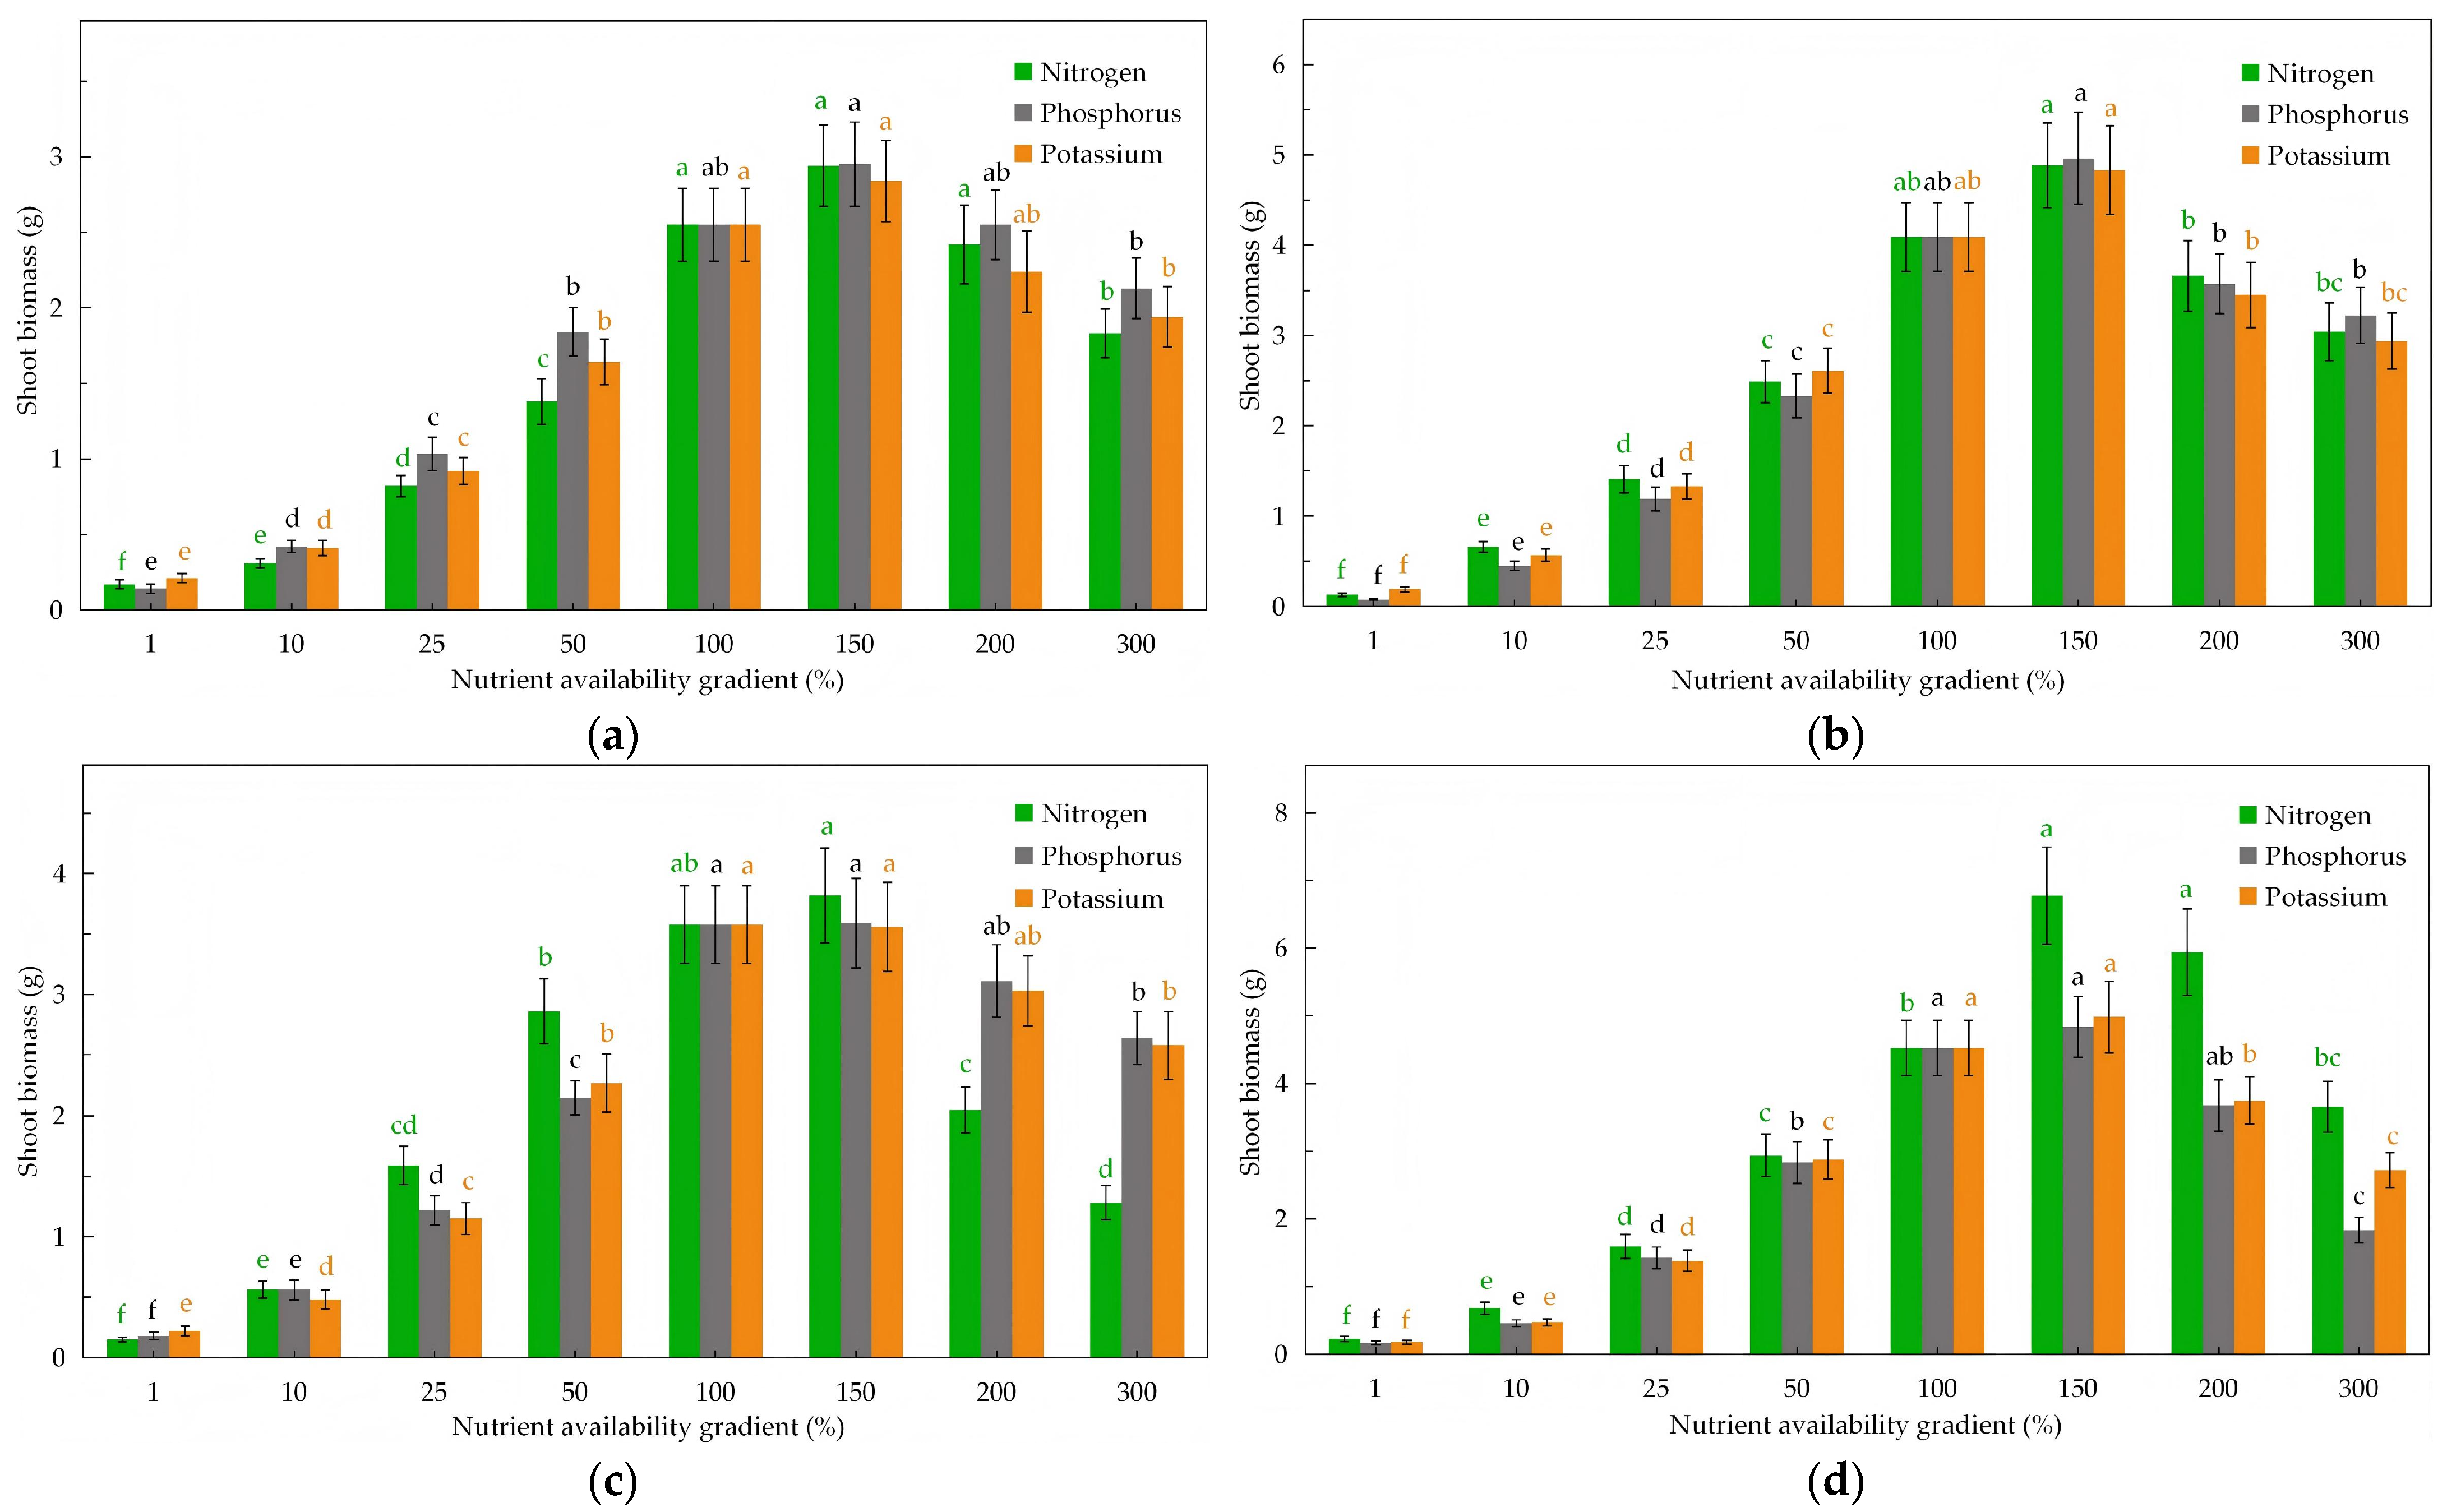
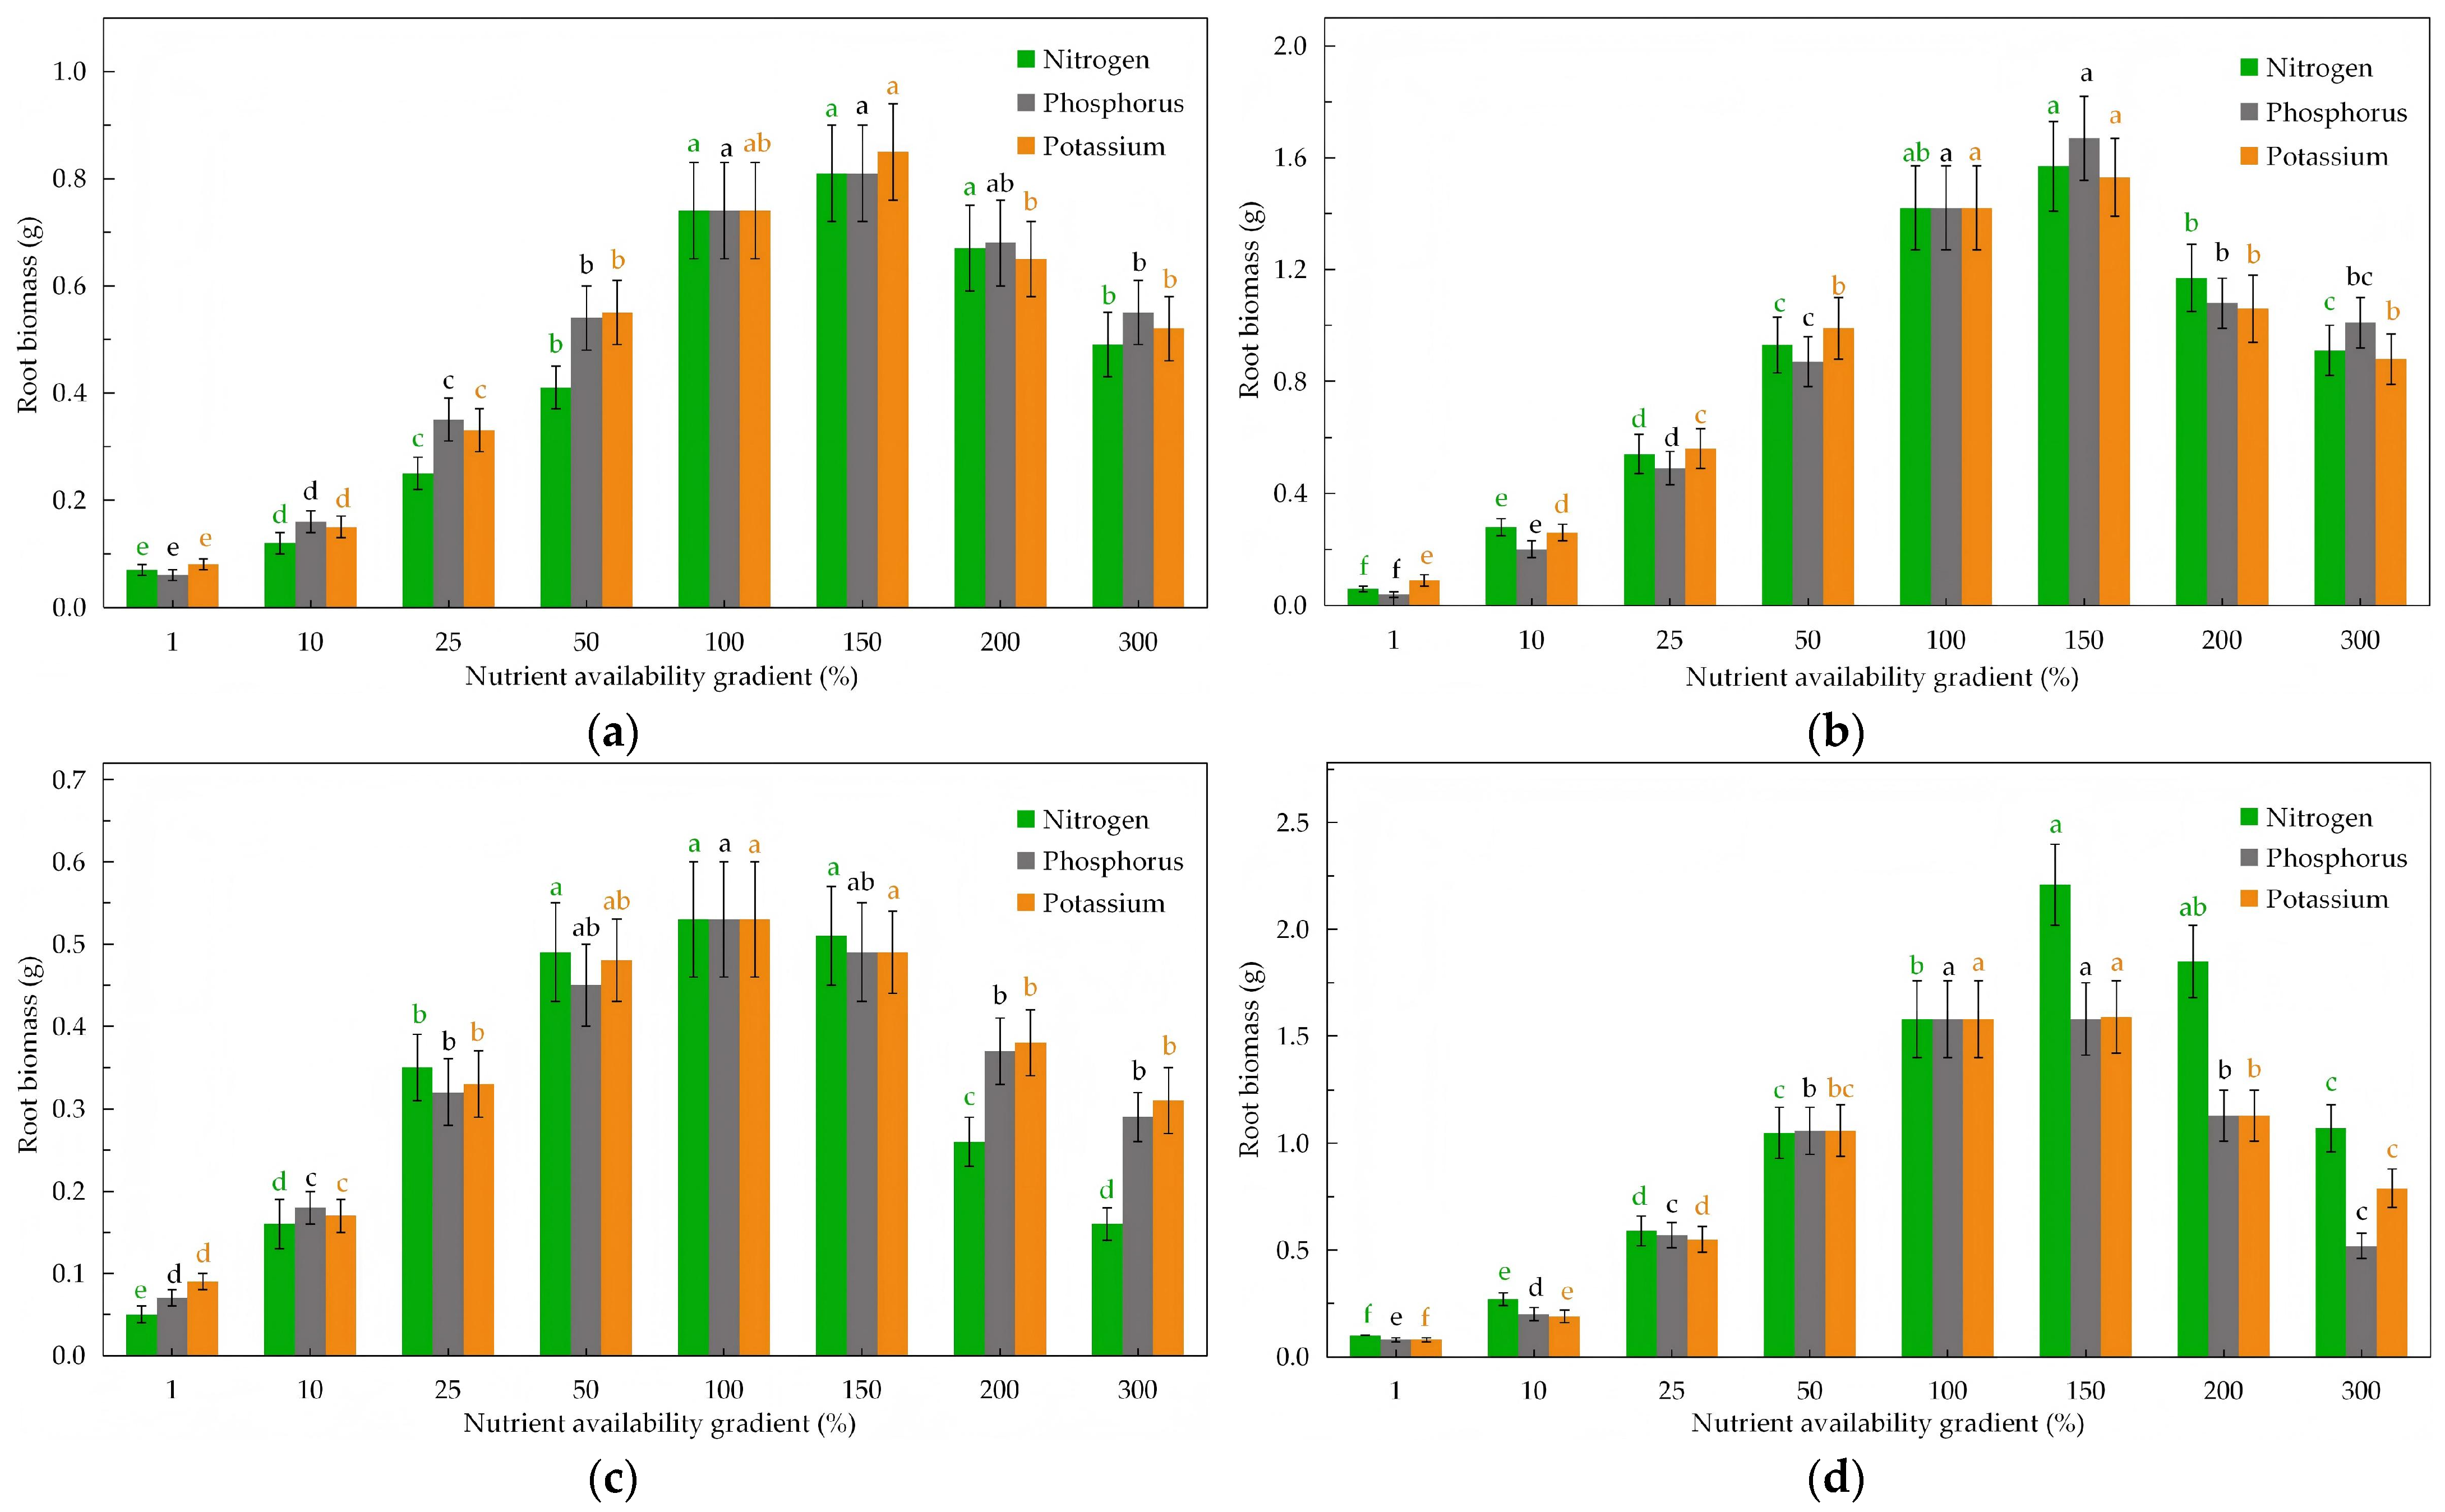

Disclaimer/Publisher’s Note: The statements, opinions and data contained in all publications are solely those of the individual author(s) and contributor(s) and not of MDPI and/or the editor(s). MDPI and/or the editor(s) disclaim responsibility for any injury to people or property resulting from any ideas, methods, instructions or products referred to in the content. |
© 2026 by the authors. Licensee MDPI, Basel, Switzerland. This article is an open access article distributed under the terms and conditions of the Creative Commons Attribution (CC BY) license.