


Abstract
Repetitive transcranial magnetic stimulation (rTMS) is a non-invasive neurostimulation therapy with established evidence in the treatment of depression. Despite its clinical use, the mechanism(s) underlying the therapeutic effects of rTMS for depression is not yet understood. The excitation–inhibition (E–I) imbalance framework suggests that disruptions in the balance between excitatory and inhibitory neural activity contribute to the pathophysiology of several neuropsychiatric disorders, and it proposes a candidate explanation for how rTMS exerts its antidepressant effect. Understanding the mechanism of action of rTMS enables the refinement of rTMS protocols for better efficacy and positions rTMS as an intervention in disorders where excitation/inhibition imbalance contributes to the underlying etiology. In this narrative review, we review evidence for E–I imbalance in depression, describe the effects of rTMS on excitatory and inhibitory systems at the molecular, cellular, and cortical levels, and integrate these findings to evaluate whether the restoration of E–I balance is a plausible mechanism of action. While findings are mixed and adequately powered, longitudinal, controlled studies are needed, the available evidence is broadly consistent with an E–I model of rTMS in depression. This review and our proposed model can serve as a foundation for future mechanistic work in this field.
1. Introduction
Repetitive transcranial magnetic stimulation (rTMS) is a non-invasive neuromodulation modality for stimulating neurons in superficial cortical regions of the brain. rTMS induces electrical currents by applying repetitive magnetic pulses to a target region in the brain [1]. This results in depolarization of the neurons and initiation of action potentials, which activates post-synaptic neurons [2].
The stimulation of neural circuits in this manner has promising clinical applications that are under investigation. Some areas of interest for rTMS include pain, movement disorders, multiple sclerosis, substance use disorders, and mood disorders [3]. Of these areas, rTMS has demonstrated strong evidence in the treatment of depression, neuropathic pain, and motor recovery after stroke [3].
rTMS is an effective treatment for major depressive disorder (MDD), with a reported remission rate of approximately 35% in treatment-resistant depression [4]. Modern rTMS protocols involve stimulation to the dorsolateral prefrontal cortex (DLPFC)—a region known to be dysfunctional in depression. While it is known that targeting this region ameliorates depressive symptoms, the neurophysiological mechanism behind these improvements is unclear. Knowledge of the underlying mechanism would provide insight as to what makes a patient a responder, which improves patient selection and treatment efficacy. The aim of this review is therefore to propose a mechanistic framework, grounded in existing evidence, for the antidepressant effect of rTMS.
2. Methods
This narrative review aimed to synthesize the available literature on excitation–inhibition balance in depression before and after receiving rTMS therapy. The literature search was performed using PubMed in June 2026. Only papers published in English were reviewed. The following search terms were used: (transcranial magnetic stimulation OR rtms) AND (gamma aminobutyric OR gamma aminobutyric acid OR GABA OR gamma aminobutyric OR glutamates OR glutamic acid OR excitability OR excitable OR excitation OR excitations OR excite OR excited OR excites OR inhibit OR inhibitable OR inhibit OR inhibited OR inhibits OR inhibiting OR inhibition OR inhibitive) AND (depressed OR depression OR depressive disorder OR depressive OR depressive OR depressiveness OR depressives). We also identified additional articles by reference list/hand searching. Study eligibility was broad to compensate for the limited existing research, particularly the lack of randomized control trials. Preclinical and clinical studies on depression (including unipolar and bipolar depression) were included to broaden the search. There was no limit on the publication period. Microsoft Word Copilot was used for language editing (Microsoft® Word for Microsoft 365 MSO (Version 2610 Build 16.0.20527.20150) 64-bit).
3. Results
3.1. Excitation–Inhibition Imbalance Framework
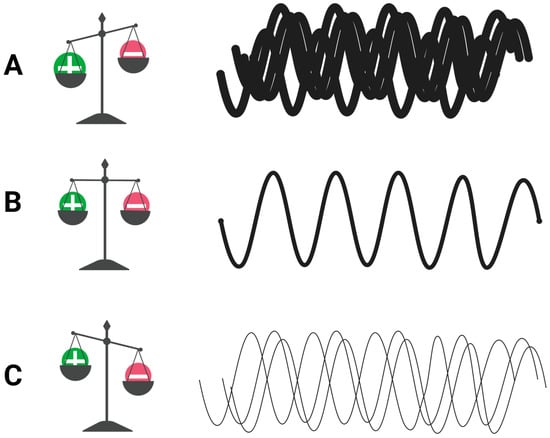
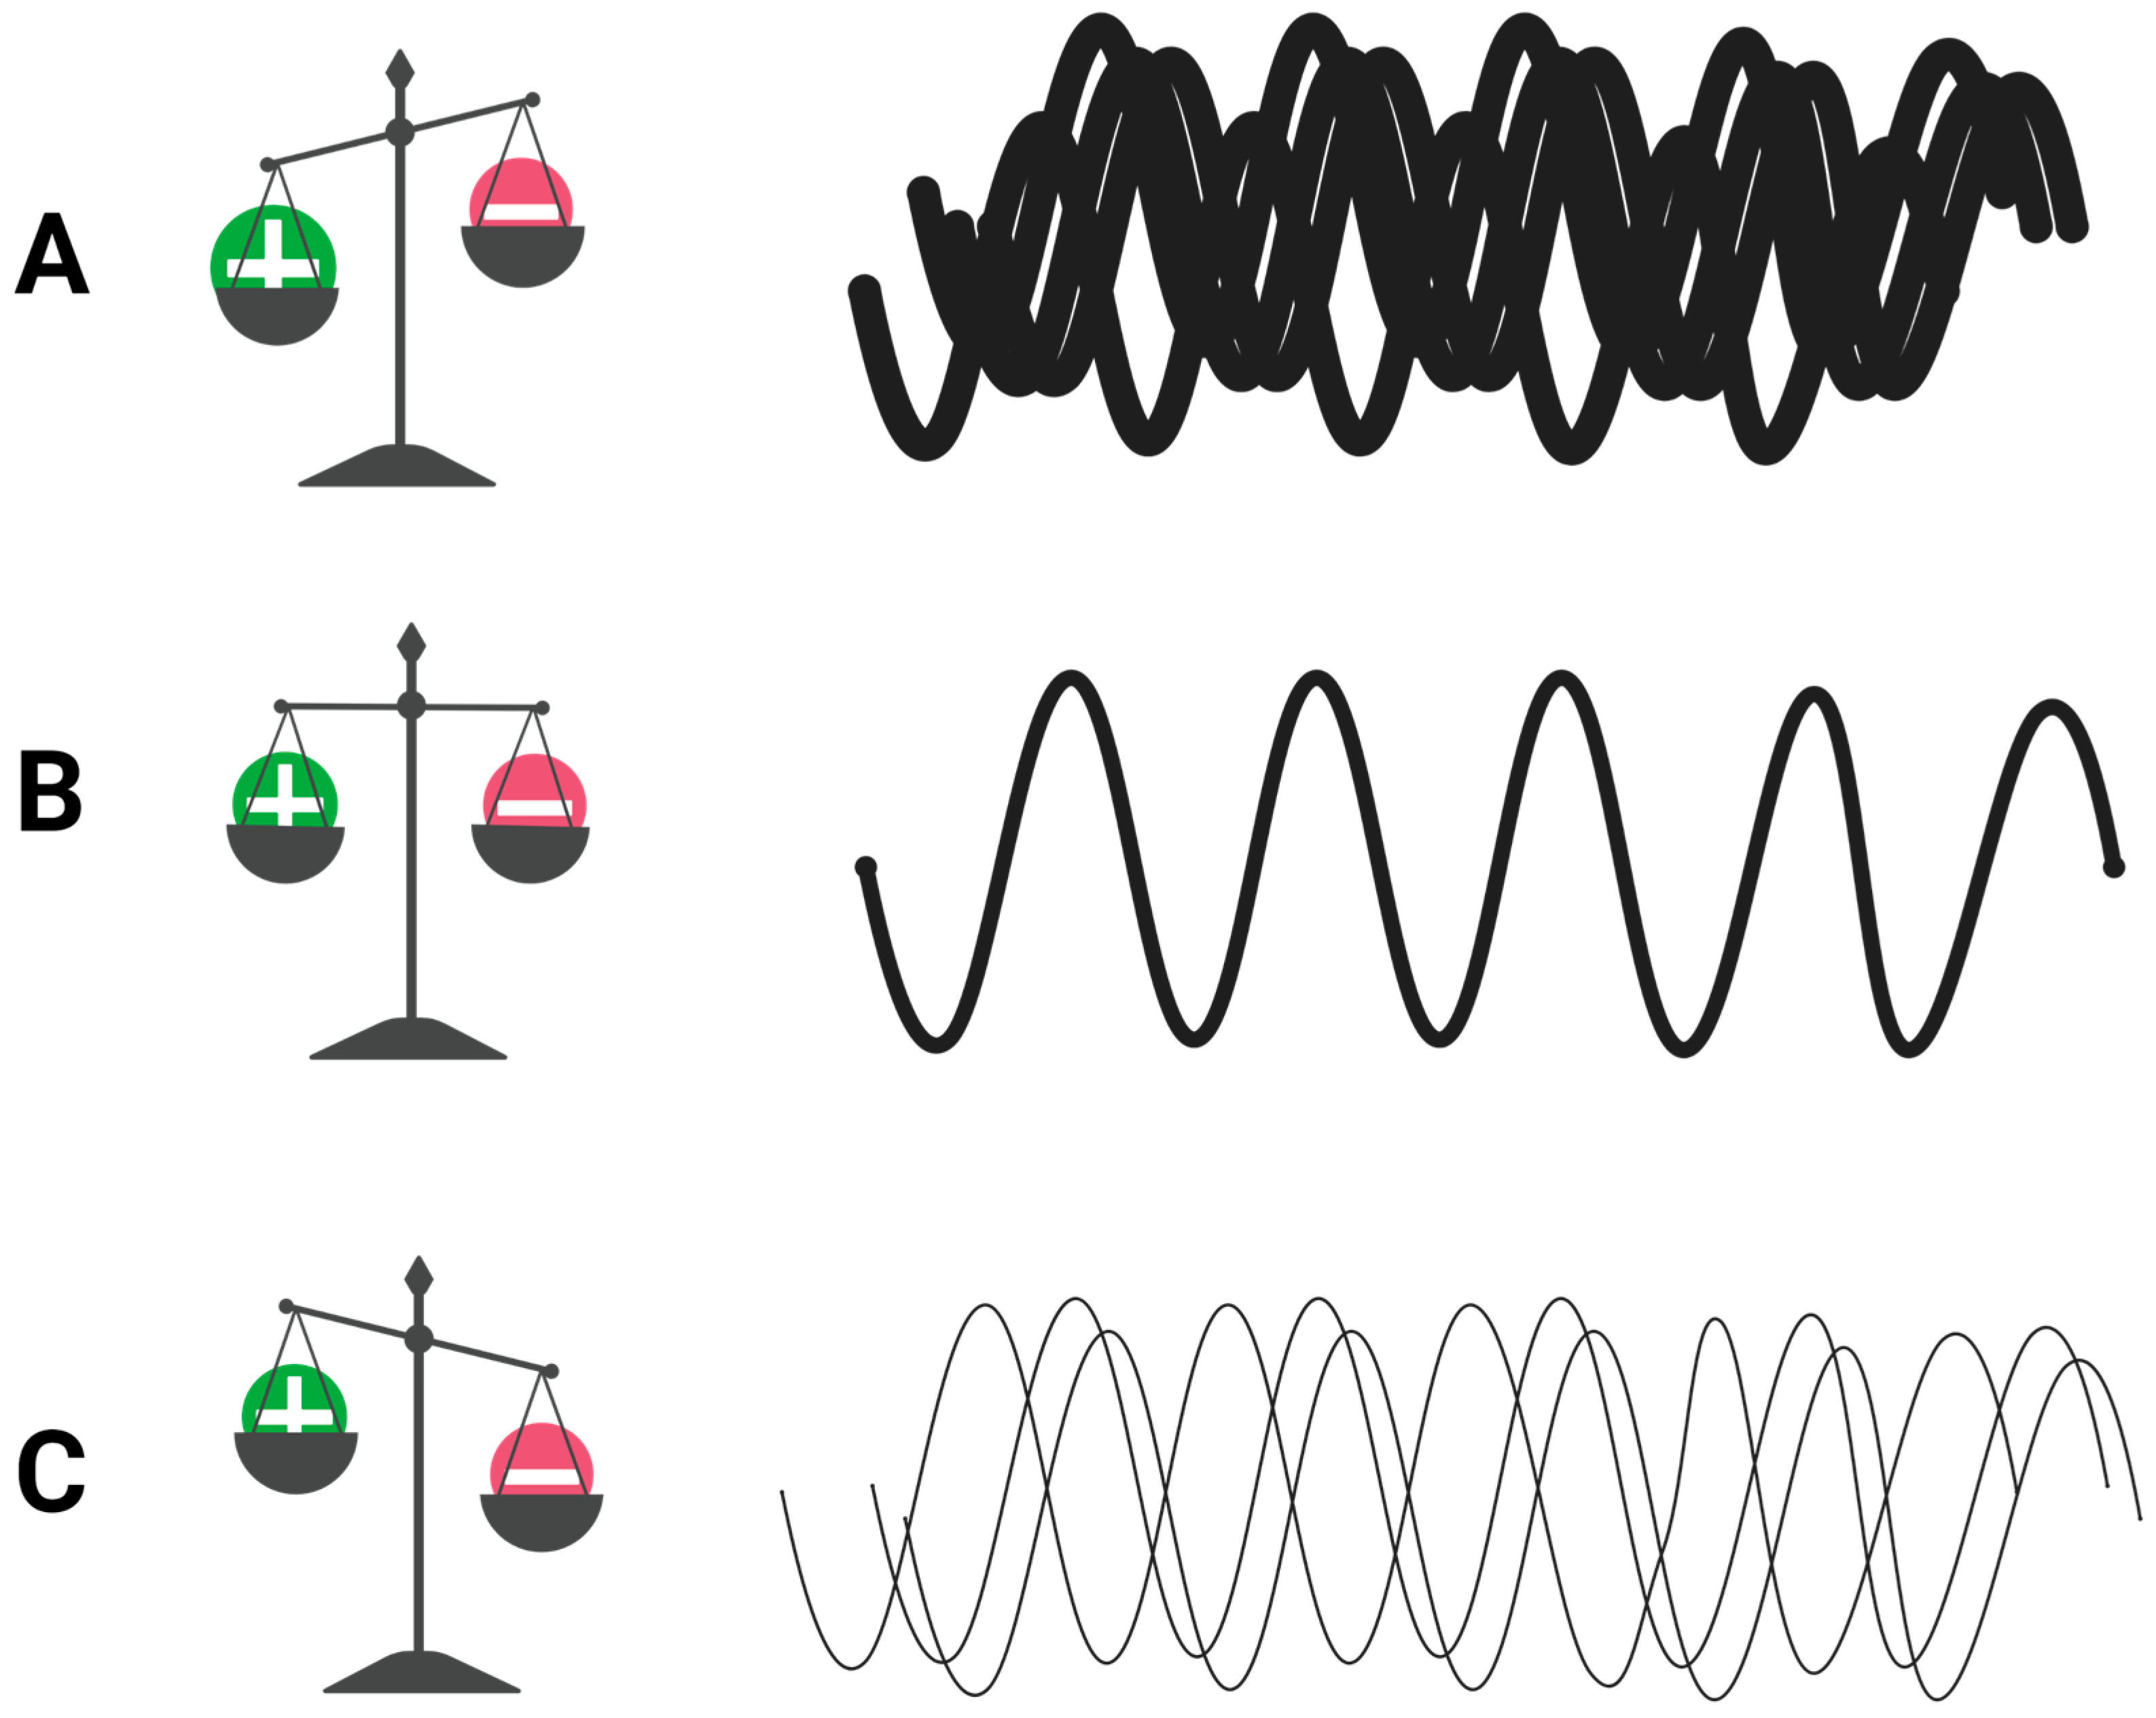
The excitation–inhibition (E–I) imbalance is a conceptual framework proposing that disruptions in the balance between excitatory and inhibitory processes contribute to dysfunctional neural circuits in neuropsychiatric disorders. This theory was first proposed in 2003 when Rubenstein and Mezenich hypothesized that some forms of autism might be caused by disproportionately high levels of excitation (or weak inhibition) in neural circuits that mediate language and social behaviors [5]. E–I imbalance has since been explored as a framework for numerous other disorders, including Alzheimer’s disease [6], schizophrenia [7], and major depressive disorder [8]. E–I balance is maintained by the interplay of systems operating at the molecular, cellular, and cortical levels. We consider each in turn before examining how each is altered in depression. In this review, E–I balance refers to a multiscale conceptual framework rather than a simple measurable biological ratio. It describes how excitatory and inhibitory processes interact within a defined spatial, temporal, and methodological context. Accordingly, molecular concentrations, cellular markers, cortical physiological responses, and network activity provide complementary but non-equivalent information about E–I regulation. Available methods indirectly assess specific E–I-related processes (Figure 1).
Figure 1.
This conceptual diagram depicts the signal-to-noise ratio, with overlapping waveforms depicting noise and wavelength thickness depicting signal strength. (A) The noise ratio is elevated relative to signal. Increased excitation or decreased inhibition creates a hyperexcitable circuit with reduced efficacy of signal transmission. (B) The signal-to-noise ratio is balanced. Excitatory and inhibitory activity are balanced, and signal transmission is optimal. (C) The ratio of signal is low relative to noise. Decreased excitation or increased inhibition causes decreased efficacy of signal transmission. Created with BioRender.com.
3.1.1. Molecular Level
At the molecular level, γ-aminobutyric acid (GABA) and glutamate are the principal inhibitory and excitatory neurotransmitters, respectively. Glutamic acid decarboxylase (GAD) is the enzyme responsible for GABA synthesis from glutamate. GAD is expressed in GABAergic neurons and is considered a marker for GABAergic activity. GAD67, an isoform of GAD, produces over 90% of the brain’s basal GABA and is critical for neuronal function [9]. The inhibitory effect of GABA on nerve cells is achieved by stimulating the GABAA receptor, which is the drug target for benzodiazepines [10]. Reduced GAD expression results in lower GABA synthesis and, together with reductions in GABA receptor expression or function, may contribute to impaired inhibitory neurotransmission. Glutamate is generated by the tricarboxylic acid cycle, which requires the carboxylation of pyruvate by pyruvate carboxylase to eventually form glutamine, which is converted to glutamate in the neuron [11]. The excitatory effect of glutamate is achieved by binding to receptors: ionotropic receptors such as N-methyl-D-aspartate receptors (NMDA) and α-amino-3-hydroxy-5-methyl-4-isoxazolepropionic acid receptors (AMPA), and metabotropic receptors (mGlu) [11]. Five high-affinity glutamate transporters are known: excitatory amino acid transporters (EAATs) 1 to 5, which are primarily responsible for glutamate uptake in the brain [11]. Alterations in pyruvate carboxylase, glutamate receptors, or transporter function would each be expected to affect cortical excitation.
3.1.2. Cellular Level
In the cerebral cortex, roughly 80% of the neurons are excitatory glutamatergic neurons and 20% are inhibitory GABAergic neurons [5]. The balance of excitation to inhibition in the cortex is controlled by the density and organization of synapses and relative numbers and activities of these glutamatergic and GABAergic neurons. According to Rubenstein and colleagues, these activity levels are regulated by extrinsic excitatory (glutamatergic thalamic afferents), mixed excitatory/inhibitory (serotonin, norepinephrine, dopamine and acetylcholine afferents from the hindbrain, midbrain, and basal forebrain, respectively), and exclusively inhibitory (from the zona incerta) inputs to the cortex [5].
3.1.3. Cortical and Network Level
Sohal and Rubenstein propose that E–I imbalance causes “noisy” circuits with less efficient information processing. “Noise” in this case indicates input that is not meaningful. If inhibition is too high, there is a reduced signal output relative to the noise. If excitatory activity is elevated, then noise is increased relative to the signal output. Therefore, both noise levels and signal strength need to be optimal for effective neural communication. E–I balance exists on a single-neuron level based on the numbers of inhibitory and excitatory synapses, as well as large-scale cortical circuits based on the relative numbers of inhibitory and excitatory cortical neurons. E–I balance is thus dynamic, in that the E–I ratio may vary between neurons and cortical regions while attempting to maintain overall cortical homeostasis [12]. E–I balance is not limited to a single neural network but involves the interplay of the activity of the entire brain. Inhibition in one area of the brain can result in excitation in another to maintain homeostasis of the overall system.
Interestingly, antidepressant therapy targets like serotonin and norepinephrine may produce their clinical effects through upstream alterations of GABA and glutamate, which may explain the delayed onset of clinical benefit [13]. GABA and glutamate may reflect potential endpoints where changes affect the depressive phenotype and could account for the clinical effects of rTMS, electroconvulsive therapy (ECT), and antidepressant therapy, which all interact with GABA and glutamate balance.
3.2. E–I Imbalance in Depression
Studies have found various alterations to GABAergic and glutamatergic systems at the molecular, cellular, circuit, and network levels in depression.
3.2.1. Molecular Level
In depression, studies of gene expression of GABAergic and glutamatergic components for neural circuitry suggest deficits in the GABA system, particularly the somatostatin (SST) GABA neurons, which regulate signal input [14]. Human post-mortem studies have reported decreased SST gene expression in the DLPFC, pregenual anterior cingulate cortex (PACC), and amygdala of MDD patients as compared with healthy controls [15,16,17,18].
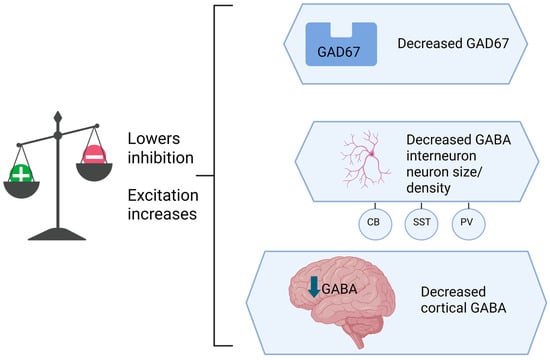
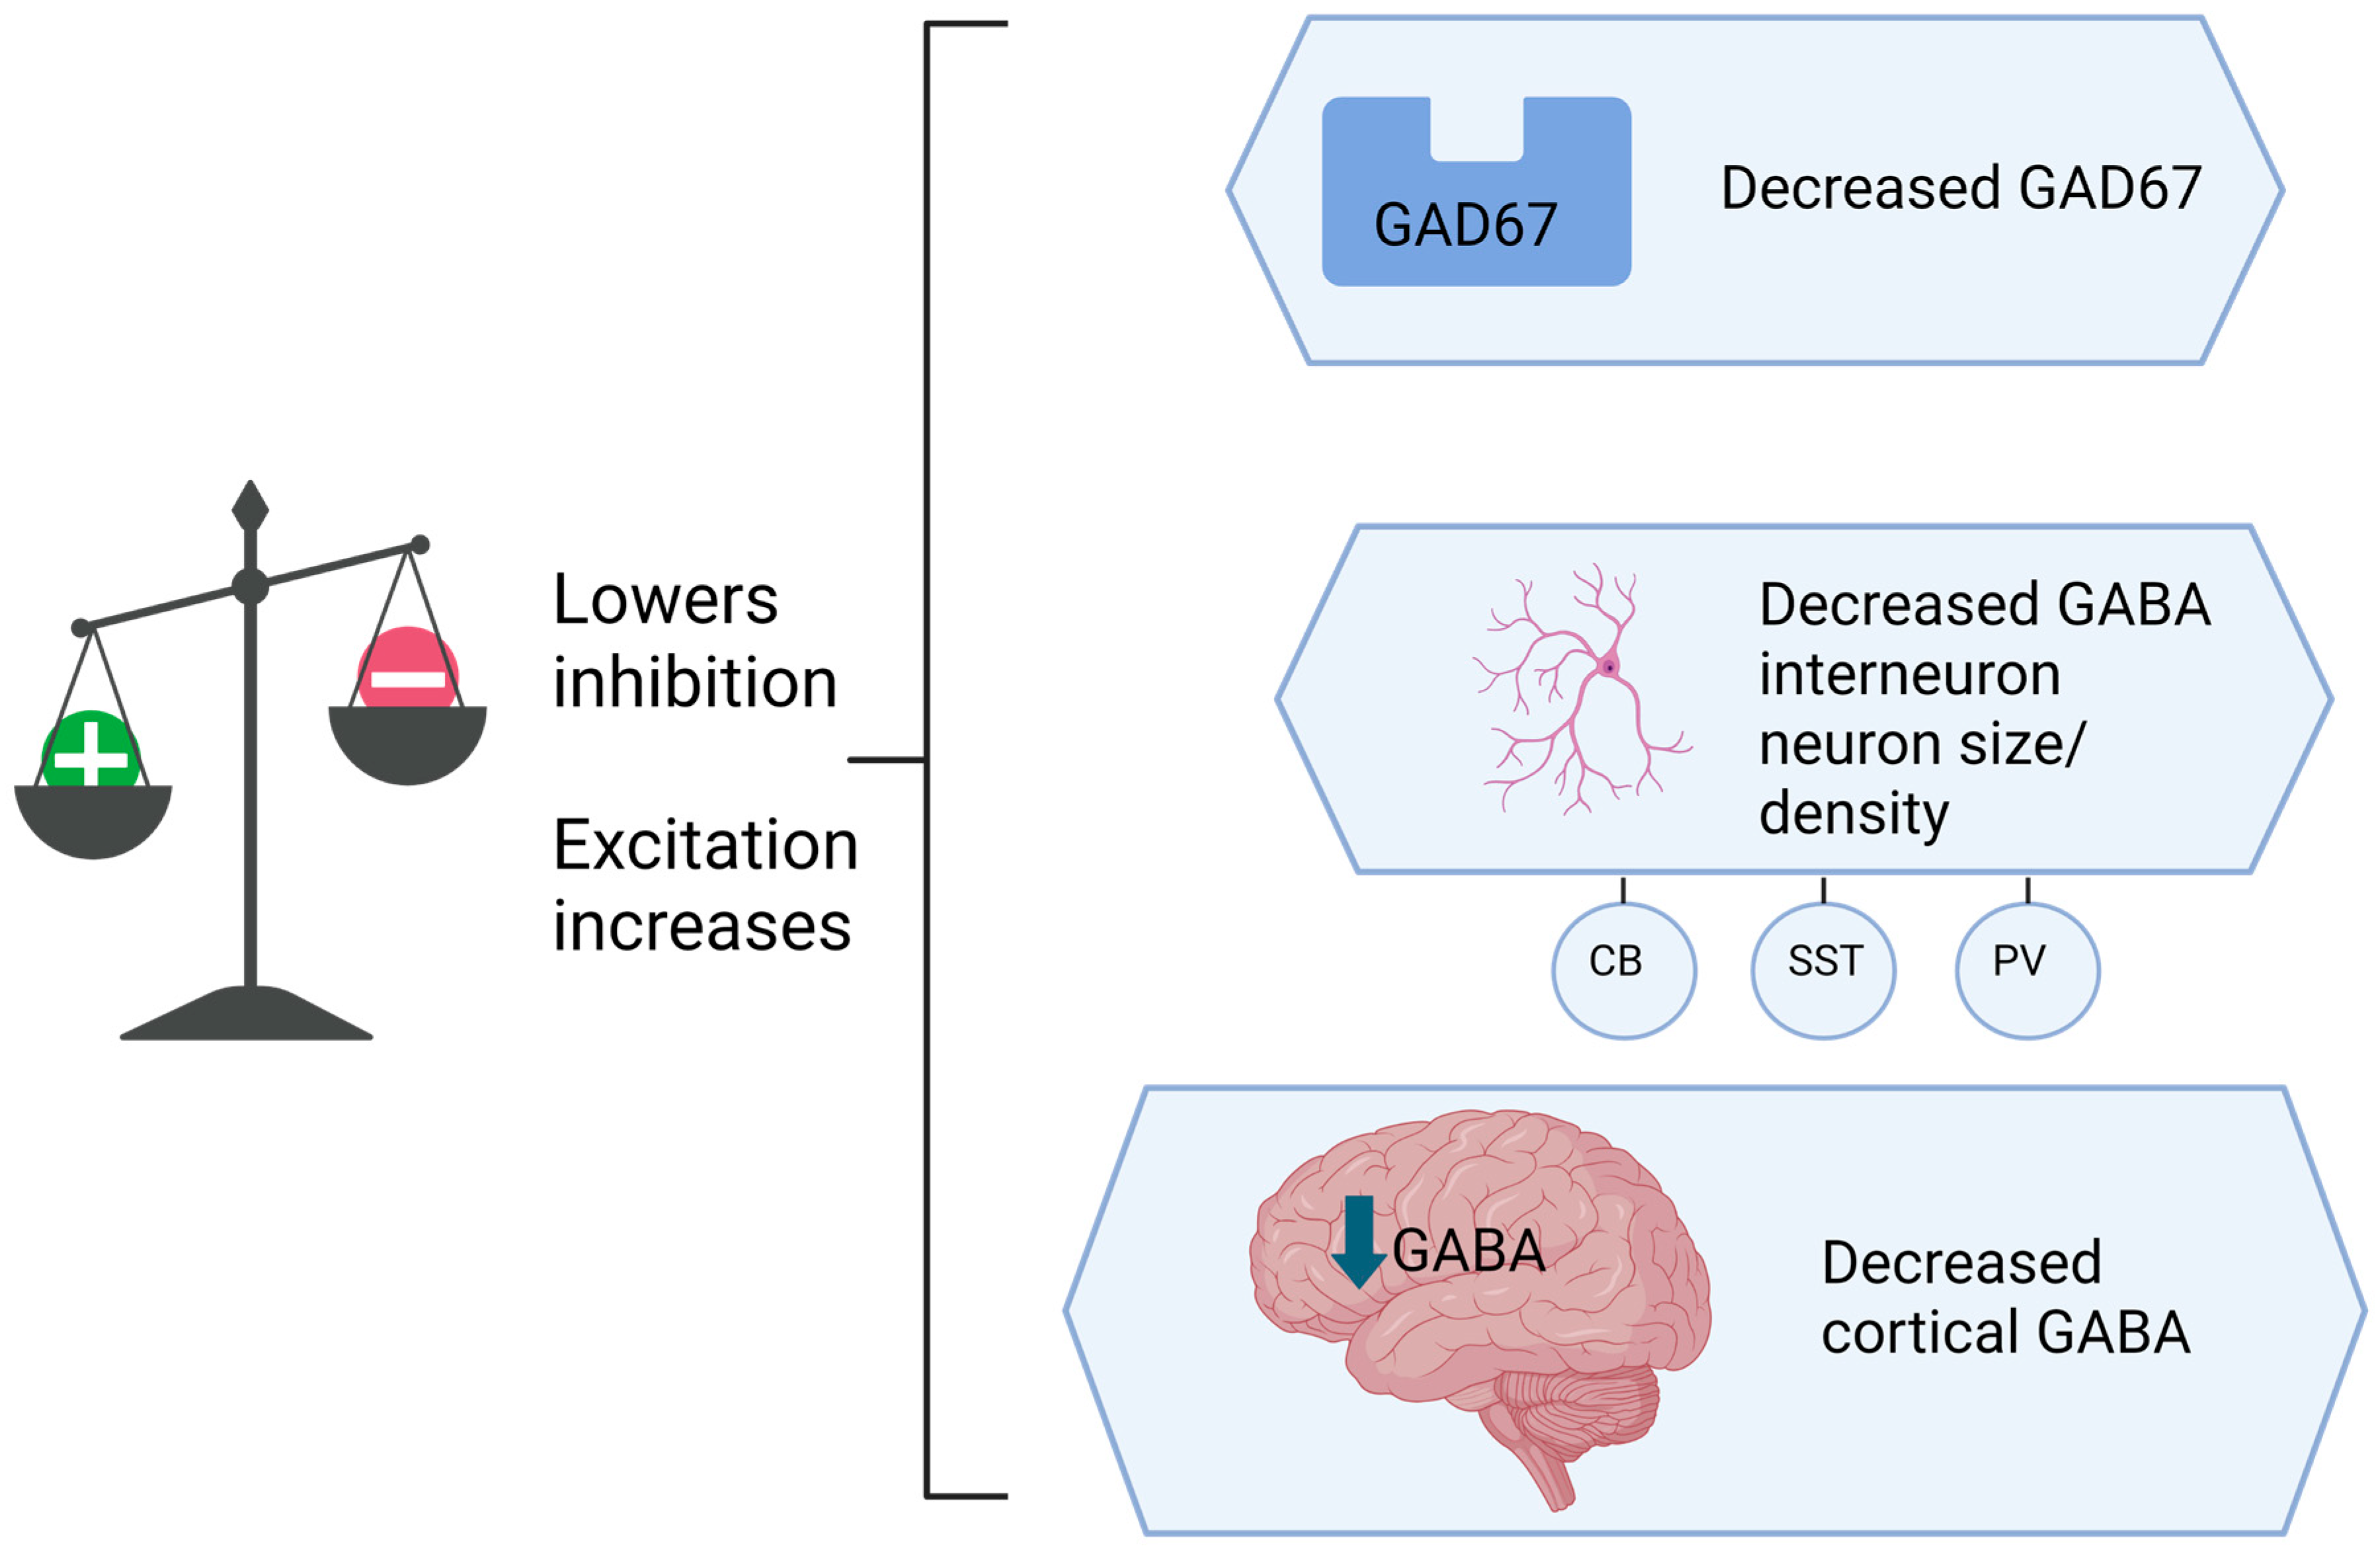
GABA is an essential neurotransmitter for intercellular communication and is primarily derived from glutamate and GAD67. A preclinical study shows GAD67 gene removal is associated with substantial deficits in GABAergic transmission to pyramidal neurons in the prefrontal cortex and results in hyperexcitability, suggesting that levels of GAD67 directly affect the balance of excitatory and inhibitory activity in the brain [9]. Studies have found that GAD67 in the DLPFC is significantly decreased in patients with depression compared with matched controls [19]. Decreased density of GAD65 and GAD67 was also reported in the hypothalamic paraventricular nucleus and orbitofrontal cortex [20,21]. Other preclinical studies found decreased GAD67 in the medial prefrontal cortex and nucleus accumbens with an induced depression protocol [22,23]. These changes suggest impaired GABA synthesis and decreased inhibition at the affected brain regions (Figure 2).
Figure 2.
This conceptual diagram depicts decreased Glutamic acid decarboxylase (GAD) levels, decreased neuronal size and density, and decreased cortical inhibition, which may contribute to a hyperexcitable state. Created with BioRender.com.
In depression, there is impaired function of both GABAA and GABAB receptors, resulting in decreased inhibitory activity [24,25]. These changes are evidenced by deficits in short- and long-interval cortical inhibition (SICI, LICI), which are measured by transcranial magnetic stimulation (TMS) evoked electromyogram (EMG) potentials in the motor cortex and electroencephalogram (EEG) potentials in other cortical areas. SICI and LICI are indicators of GABAA and GABAB receptor inhibition, respectively.
3.2.2. Cellular Level
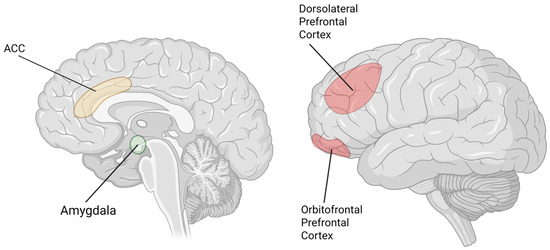
Neuronal size and density are indicators of neuronal activity, with decreased size and density corresponding to decreased activity levels. Several studies in patients with MDD have indicated a reduction in neuronal size in layers 5 and 6 of the anterior cingulate cortex (ACC), the DLPFC, and layers 2 and 3 of the orbitofrontal cortex (OFC) compared to healthy controls [26,27]. Another study found reduced neuronal soma size in MDD was present in all layers deep to layer 2 in the prefrontal cortex, with more marked reductions in layer 5 [28]. Cortical layers with a greater number of pyramidal neurons had greater reductions in size and density in MDD, suggesting that pyramidal neurons are particularly vulnerable [28] (Figure 3).
Figure 3.
This diagram shows areas of altered neuronal size and density in patients with Major Depressive Disorder (MDD). dorsolateral prefrontal cortex (DLPFC) and orbitofrontal prefrontal cortex (OFPFC) have decreased neuronal size and density in layers 2 and 3, while the amygdala has increased neuronal density. The Anterior Cingulate Cortex (ACC) exhibited decreased neuronal density in layer 6 but increased in layer 5, with reductions in neuron size in both layers 5 and 6. Created with BioRender.com.
Reported neuronal density in patients with MDD varies based on brain region and cortical layer. In the ACC, neuronal density was increased in layer 5 [26,28] but decreased in layer 6 [26]. Glial densities were reduced in the DLPFC and OFC [27] and increased in the amygdala [29]. In a study by Cobb and colleagues, neuronal density in the hippocampus was not significantly different between patients with MDD and controls, but became significantly increased with the duration of illness [30].
In a post-mortem study, reductions were found in the average density and size of GABAergic cortical neurons in DLPFC in patients with MDD compared to controls [31].
3.2.3. Circuit and Network Levels
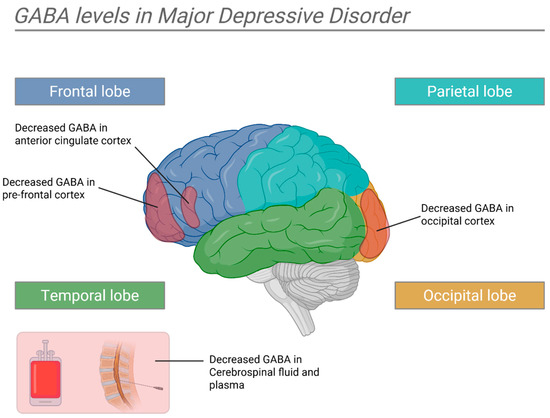
Patients with MDD exhibit altered cortical brain activity and neurochemistry compared with healthy controls. Specifically, decreased GABAergic activity is a well-replicated finding in depression. Numerous studies have also documented reduced GABA concentrations in the cerebrospinal fluid (CSF) [32,33,34] and plasma [35] of depressed patients. In vivo magnetic resonance spectroscopy (MRS) has more recently demonstrated region-specific reduction of GABA levels in the occipital cortex (OC) [36,37,38,39] in treated and untreated depressed patients [36,40] and in the prefrontal cortex (PFC) [41,42] and ACC [37,42,43,44] of depressed patients. These studies demonstrate reduced GABA levels in the OC, PFC, and ACC of depressed patients, which could represent a net reduction in cortical inhibition in these areas and contribute to the depressive phenotype.
Interestingly, one study noted that GABAergic abnormalities were dependent on the depressive subtype [36]. According to that study, the largest and most consistent GABA reductions were reported in patients with melancholic features, whereas GABA concentrations were normal or near-normal in most patients with atypical depression [36] A few small studies support stratified GABA abnormalities by subtype. In a study by Roy and colleagues, there was a significant difference in CSF GABA concentrations in depressed and control subjects, but only when they limited the analysis to melancholic patients against controls [36]. A study by Petty and colleagues reported that the lowest concentrations of GABA appeared in subjects with melancholic depression [45]. These findings suggest that different depressive phenotypes may have different underlying neurophysiological imbalances, and may require targeted interventions for each subtype (Figure 4).
Figure 4.
This diagram summarizes GABA level changes in depression. GABA levels are decreased in the frontal and occipital cortices and Cerebrospinal fluid (CSF) in Major Depressive Disorder (MDD). Created with BioRender.com.
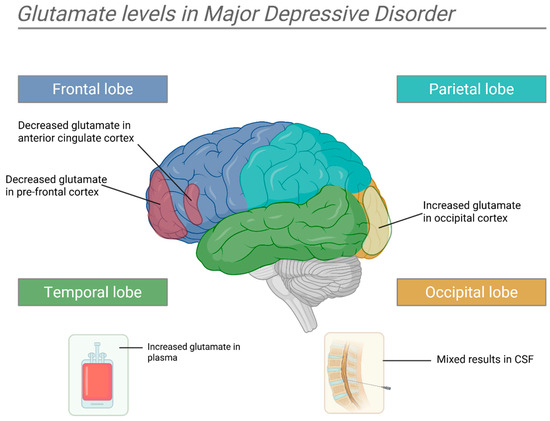
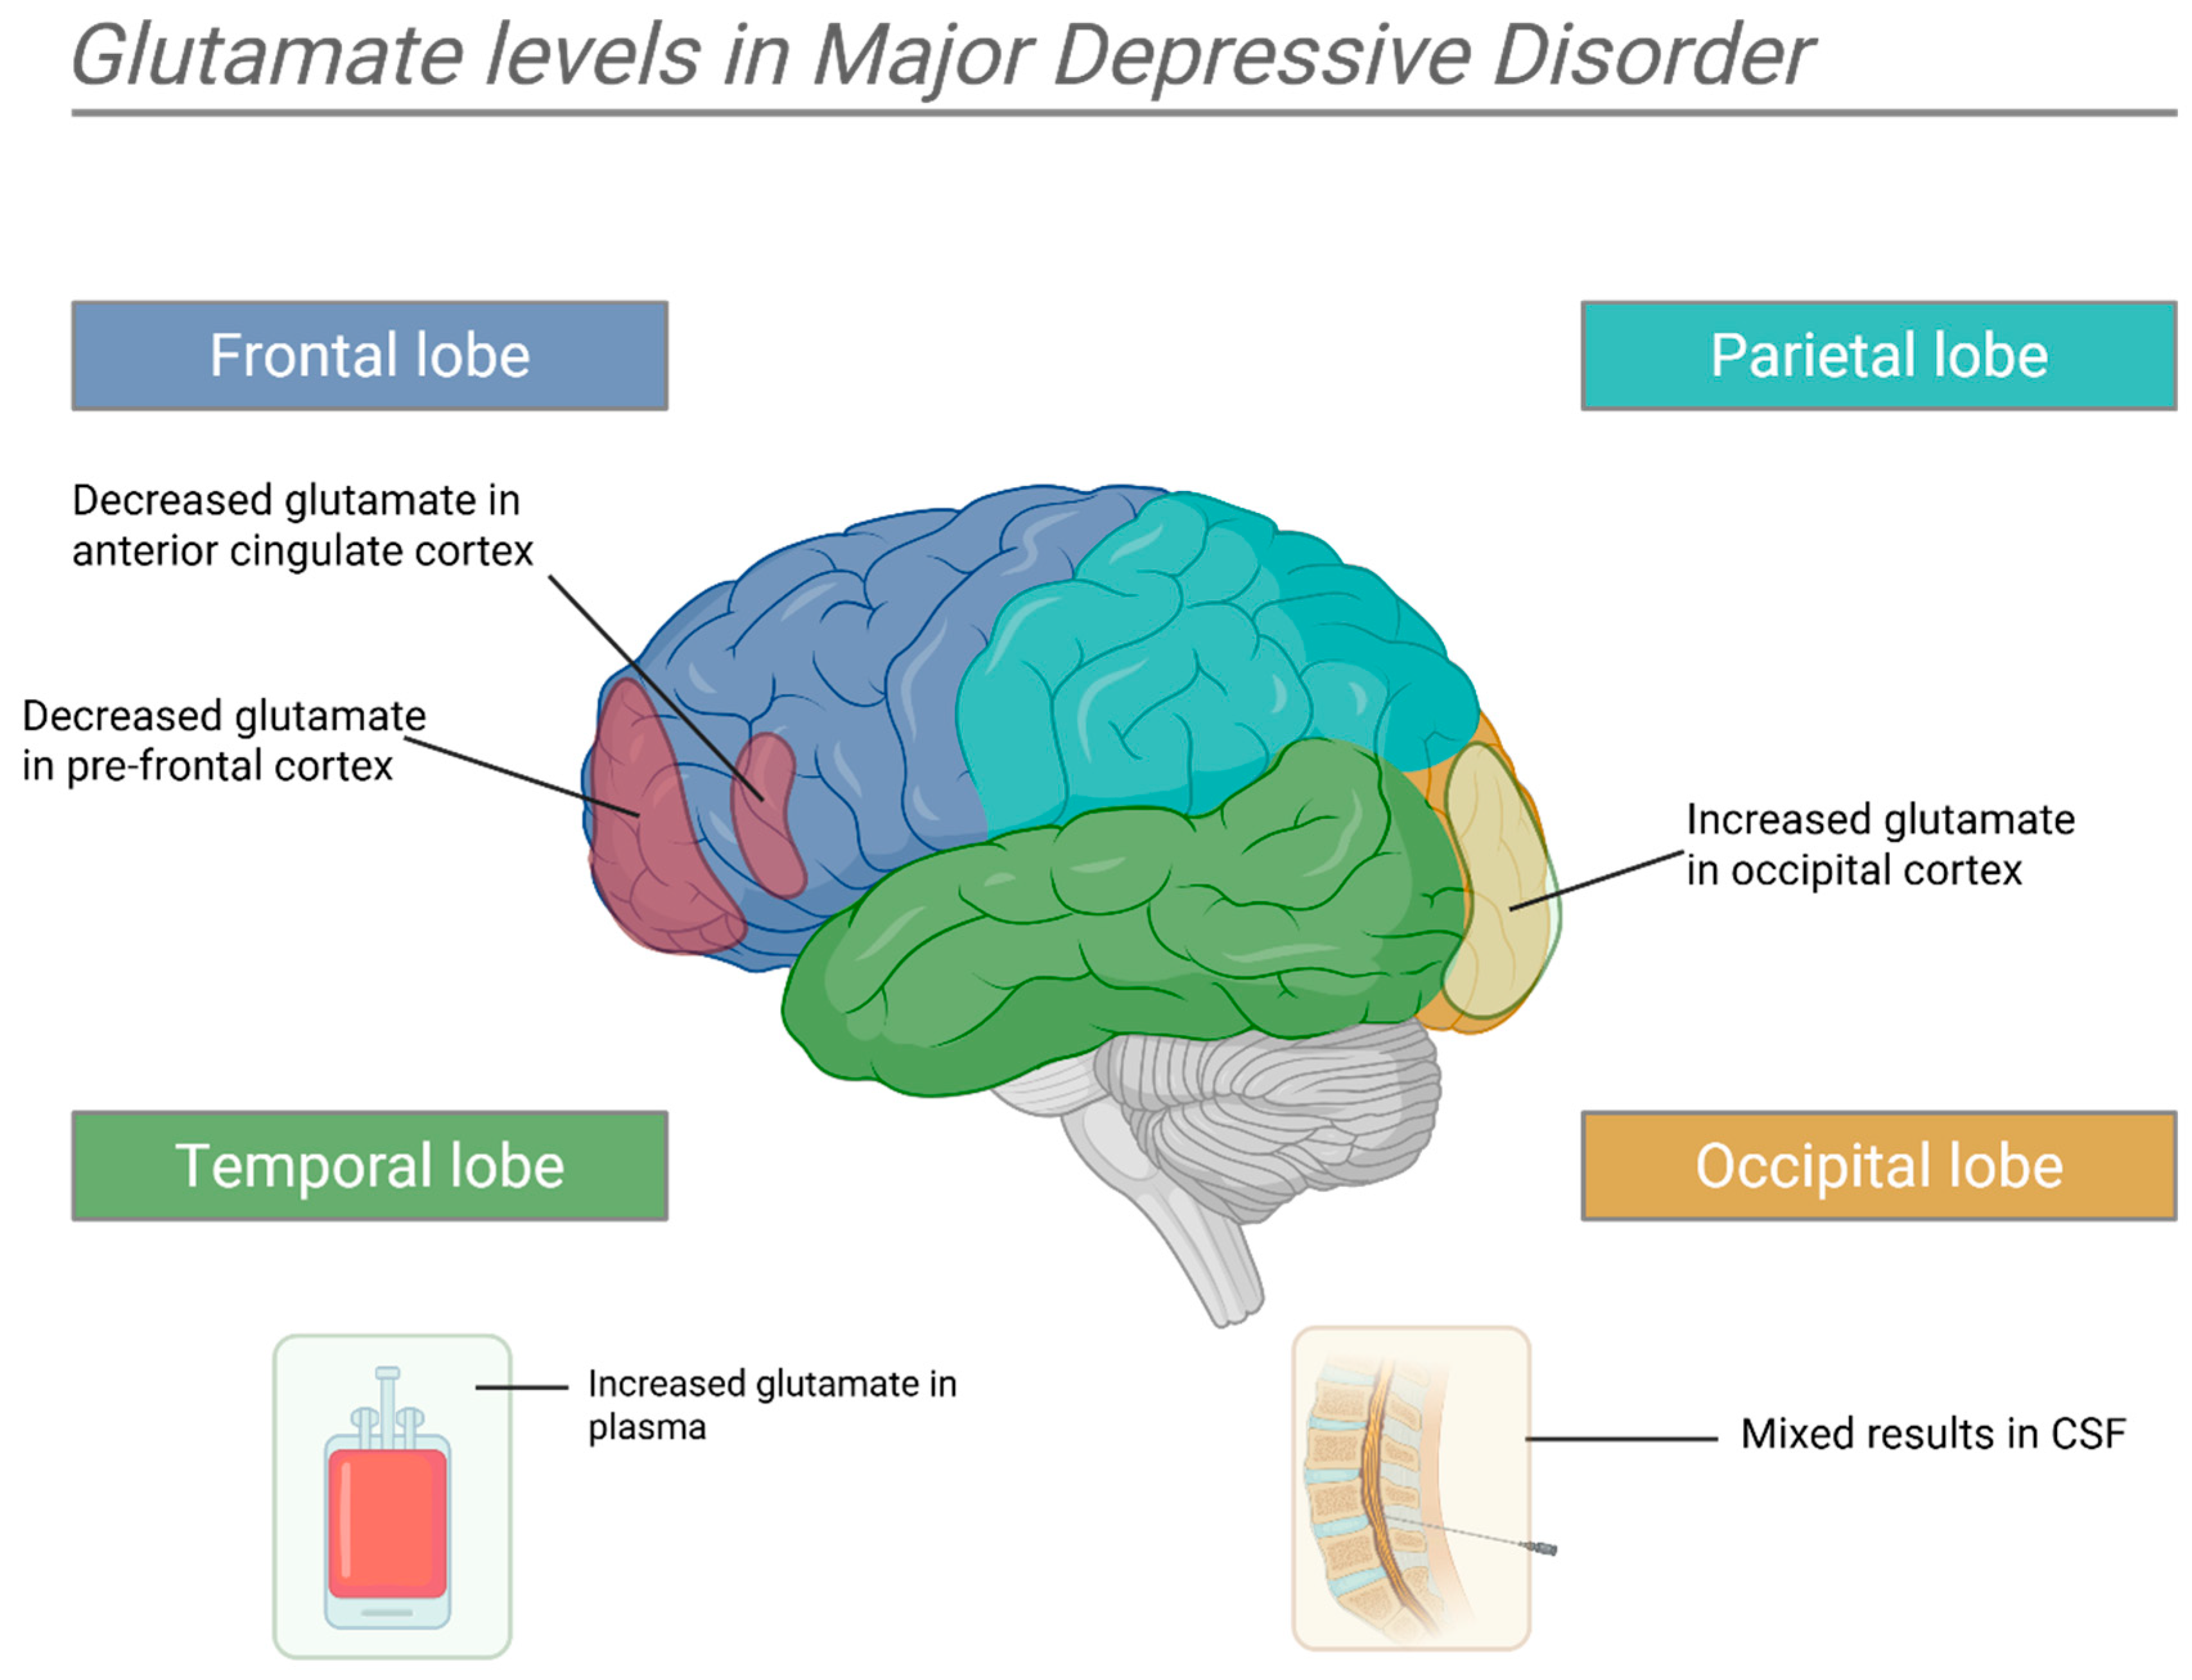
While studies in GABAergic changes in depression have been consistent in their direction across brain regions, glutamatergic changes vary by brain area and are less consistent. Several studies have suggested that plasma glutamate levels are elevated in depressed patients compared with healthy controls [46,47,48]. Similar to GABA, there is some evidence that the differences between these groups can be corrected with antidepressant therapy [49,50]. In the ACC, studies found decreased glutamate levels [51,52,53,54], which were reversed with ECT treatment [51]. In the CSF, results have been mixed [55,56]. Decreased levels are also present in the DLPFC of depressed patients [42,57,58] and animals [59] but are elevated in the OC [36]. In contrast, one post-mortem study found increased glutamate levels in the frontal cortex of unipolar and bipolar patients compared with controls; however, patients were not necessarily depressed at the time of death [60]. A meta-analysis found a significant decrease in glutamate in the frontal lobe of depressed adults [61] (Figure 5).
Figure 5.
This diagram summarizes glutamate level changes in depression. Glutamate levels are decreased in the Anterior Cingulate Cortex (ACC) and Prefrontal Cortex (PFC) and increased in the Occipital Cortex (OCC) and plasma. Created with BioRender.com.
In summary, there is evidence that patients with depression have decreased plasma and cortical GABA levels, including in the DLPFC, ACC, and OC. Glutamate levels are increased in the plasma and OC and decreased in the ACC and DLPFC, although evidence is less consistent. Both imbalances have shown some evidence of reversal through antidepressant therapy and ECT.
3.3. Effect of rTMS on E–I Imbalance in Depression
rTMS has notable effects on the balance of excitatory and inhibitory activity at the molecular, cellular, and cortical levels. Adjusting this balance may optimize the signal-to-noise ratio in synaptic transmission. If rTMS can restore a favorable signal-to-noise ratio in neural communication by altering the E–I balance in individuals with depression, with clinical response to rTMS, it would support the hypothesis that the mechanism for clinical improvement in rTMS is mediated by correcting E–I imbalance.
Studies indicate that low-frequency rTMS (≤1 Hz) increases inhibition in the stimulated cortex [62] whereas high-frequency rTMS (>1 Hz) increases excitation [63]. One proposed mechanism of action for the therapeutic effects of rTMS in depression is the restoration of the balance between excitatory and inhibitory neural circuits. By applying rTMS to stimulate inhibitory or excitatory activity in these areas of the brain, it is hypothesized that the favorable E–I balance may optimize the signal-to-noise ratio of synaptic transmission, thus improving clinical symptoms (Table 1 and Table 2).
3.3.1. Gene Expression
In a study on mice, rTMS altered the expression of genes encoding neurotransmitter transporters for glutamate, GABA, and glycine [64]. rTMS-treated mice showed upregulation of these transporters, which may alter the balance of excitatory and inhibitory activity. Another small animal study found that genes such as Metrn and Map1b, which are associated with neurogenesis, were enriched by repetitive sessions of low-frequency rTMS [65].
3.3.2. Molecular Markers
An animal study from Zorzo and colleagues found that cytochrome c oxidase activity, a marker of metabolic activity, and c-Fos, a marker of neuronal activity, were increased in limbic areas of the brain three days post-rTMS [66].
Brain-derived neurotrophic factor (BDNF) is a marker of synaptic plasticity known for its functions in neurogenesis, migration and differentiation of neurons, the growth of dendrites and axons, and synapse formation [67]. rTMS has been found to increase BDNF levels in depressed patients, indicating changes in neuronal architecture [68].
3.3.3. Enzyme Regulation
Evidence that rTMS alters GAD expression is mixed and appears to be protocol-dependent. Some evidence suggests that rTMS alters GAD67 and GAD65 expressions. One animal study reported that intermittent theta-burst stimulation (iTBS), continuous theta-burst stimulation (cTBS), and low-frequency rTMS each produced an acute decrease in frontal-cortex GAD67 followed by a strong and sustained increase lasting up to seven days; changes in GAD65 depended on the protocol, with low-frequency stimulation producing steady increases while iTBS- and cTBS-induced changes reversed within a day [68]. GAD67 upregulation post-rTMS has also been reported in other regions, including the globus pallidus [69]. Some studies have found evidence of reduced GAD67 expression post-rTMS.
One study found that iTBS in rats led to reduced GAD67 expression, while cTBS was associated with the upregulation of GAD65. Interestingly, this study found that learning a tactile task during iTBS weakened the decrease in GAD67 in rats, indicating sensory activity interfered with the iTBS effect. Other studies corroborate findings of decreased GAD67 expression post-rTMS [70,71,72,73].
Transient reductions in GAD67 expression may facilitate excitatory plasticity before homeostatic mechanisms restore inhibitory function. Overall, these studies suggest rTMS may alter GAD67 expression and GABAergic inhibition.
3.3.4. Cellular Level
Animal studies in rats have found an increase in synaptic density in the hippocampus post-rTMS and increased synaptophysin (SYN) levels—a biomarker associated with increased synaptic density [74].
An animal study found that rTMS after subacute cerebral ischemia increased Bcl-2-expressing cells, which are known to decrease apoptosis, and decreased Bax-expressing cells, which are known to increase apoptosis, in the peri-ischemic area compared to controls [75].
Parvalbumin (PV) and calbindin (CB)-expressing interneurons are involved in the feedback inhibition of pyramidal cells. Studies have found a general hypoactivity and reduced number of PV- and CB-expressing interneurons post-iTBS, leading to lower basal inhibitory activity caused by decreased excitatory inputs to these interneurons [70,71,72,73].
3.3.5. Receptor Number and Function
GABA and NMDA receptors play a role in long-term potentiation (LTP) and long-term depression (LTD)—long-term increases or decreases in neuronal signal strength. These changes are thought to be key mechanisms in changes in post-neural stimulation. Binding glutamate to NMDA receptors induces a cascade of changes resulting in increased glutamate sensitivity and upregulation of glutamate receptors, leading to LTP. rTMS has been found to decrease both GABAA and GABAB receptor activity and increase NMDA receptor activity.
rTMS increases the expression of neuronal NMDA receptors in the ventromedial thalamus [76]. High-frequency stimulation leads to upregulation of the AMPA receptors consistent with long-term potentiation [77]. rTMS also reduced 5-HT2 receptors, similar to antidepressant therapy [78].
Neurophysiological markers of GABA receptor-mediated inhibition, N45 and N100, are altered post-rTMS. N45 and N100 refer to negative transcranial magnetic stimulation evoked potentials (TEPs) recorded on EEG, which peak at 45 and 100 msec, respectively, and have been hypothesized to reflect GABA receptor activation based on animal studies. N45, associated with GABAA receptor activation, decreased in patients post-rTMS. N100, which is associated with GABAB receptor activation, decreased concordantly with depressive symptoms. These changes were not induced by sham treatment [79]. These markers are, however, sensitive to artifacts generated by the TMS equipment. Noise, physical sensation, and cranial muscle activation from the rTMS coil contaminate these signals and may limit interpretation. In patients with spinal cord injuries, it was found that GABA receptors were upregulated post-rTMS [80]. In rats, isolation induced upregulation of GABA(A) receptors in the hippocampus, which was reversed by rTMS [81]. In a study of patients with unipolar or bipolar depression, no significant changes were found in GABAA receptor availability post iTBS [82].
3.3.6. Cortical Level
The neurophysiological effects of rTMS are an ongoing area of research. There are two methods available to investigate the neurochemical changes in the brain evoked by rTMS. The first is proton magnetic resonance spectroscopy (MRS). MRS is a non-invasive technique based on nuclear magnetic resonance (NMR) that can measure in vivo biochemical or metabolite concentrations in localized areas [83]. The second method is using transcranial magnetic stimulation combined with electromyography (EMG) or electroencephalography (EEG). Cortical inhibition by GABA inhibitory neurons can be measured by delivering a paired-pulse TMS to the target cortical region and measuring the suppression of motor evoked potentials via EMG or resulting TEP waveforms on EEG. While TMS–EMG is limited to the motor cortex, TMS–EEG can measure inhibition in other cortical areas. Different TMS paradigms, such as long interval cortical inhibition (LICI) or cortical silent period (CSP), are thought to reflect GABAB receptor inhibitory neurotransmission, while short interval cortical inhibition (SICI) reflects inhibition through GABAA receptors [84]. Applying these tools to different brain regions in individuals pre- and post-rTMS allows us to monitor GABAergic and glutamatergic changes.
GABA
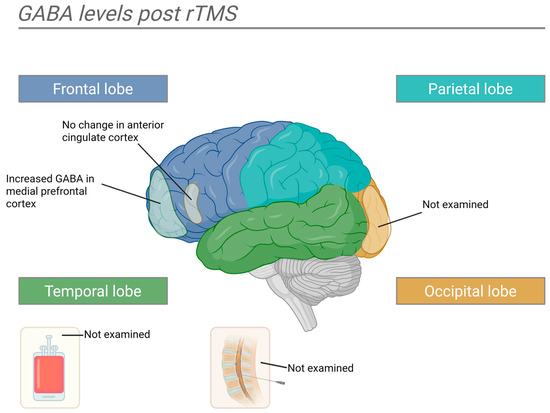
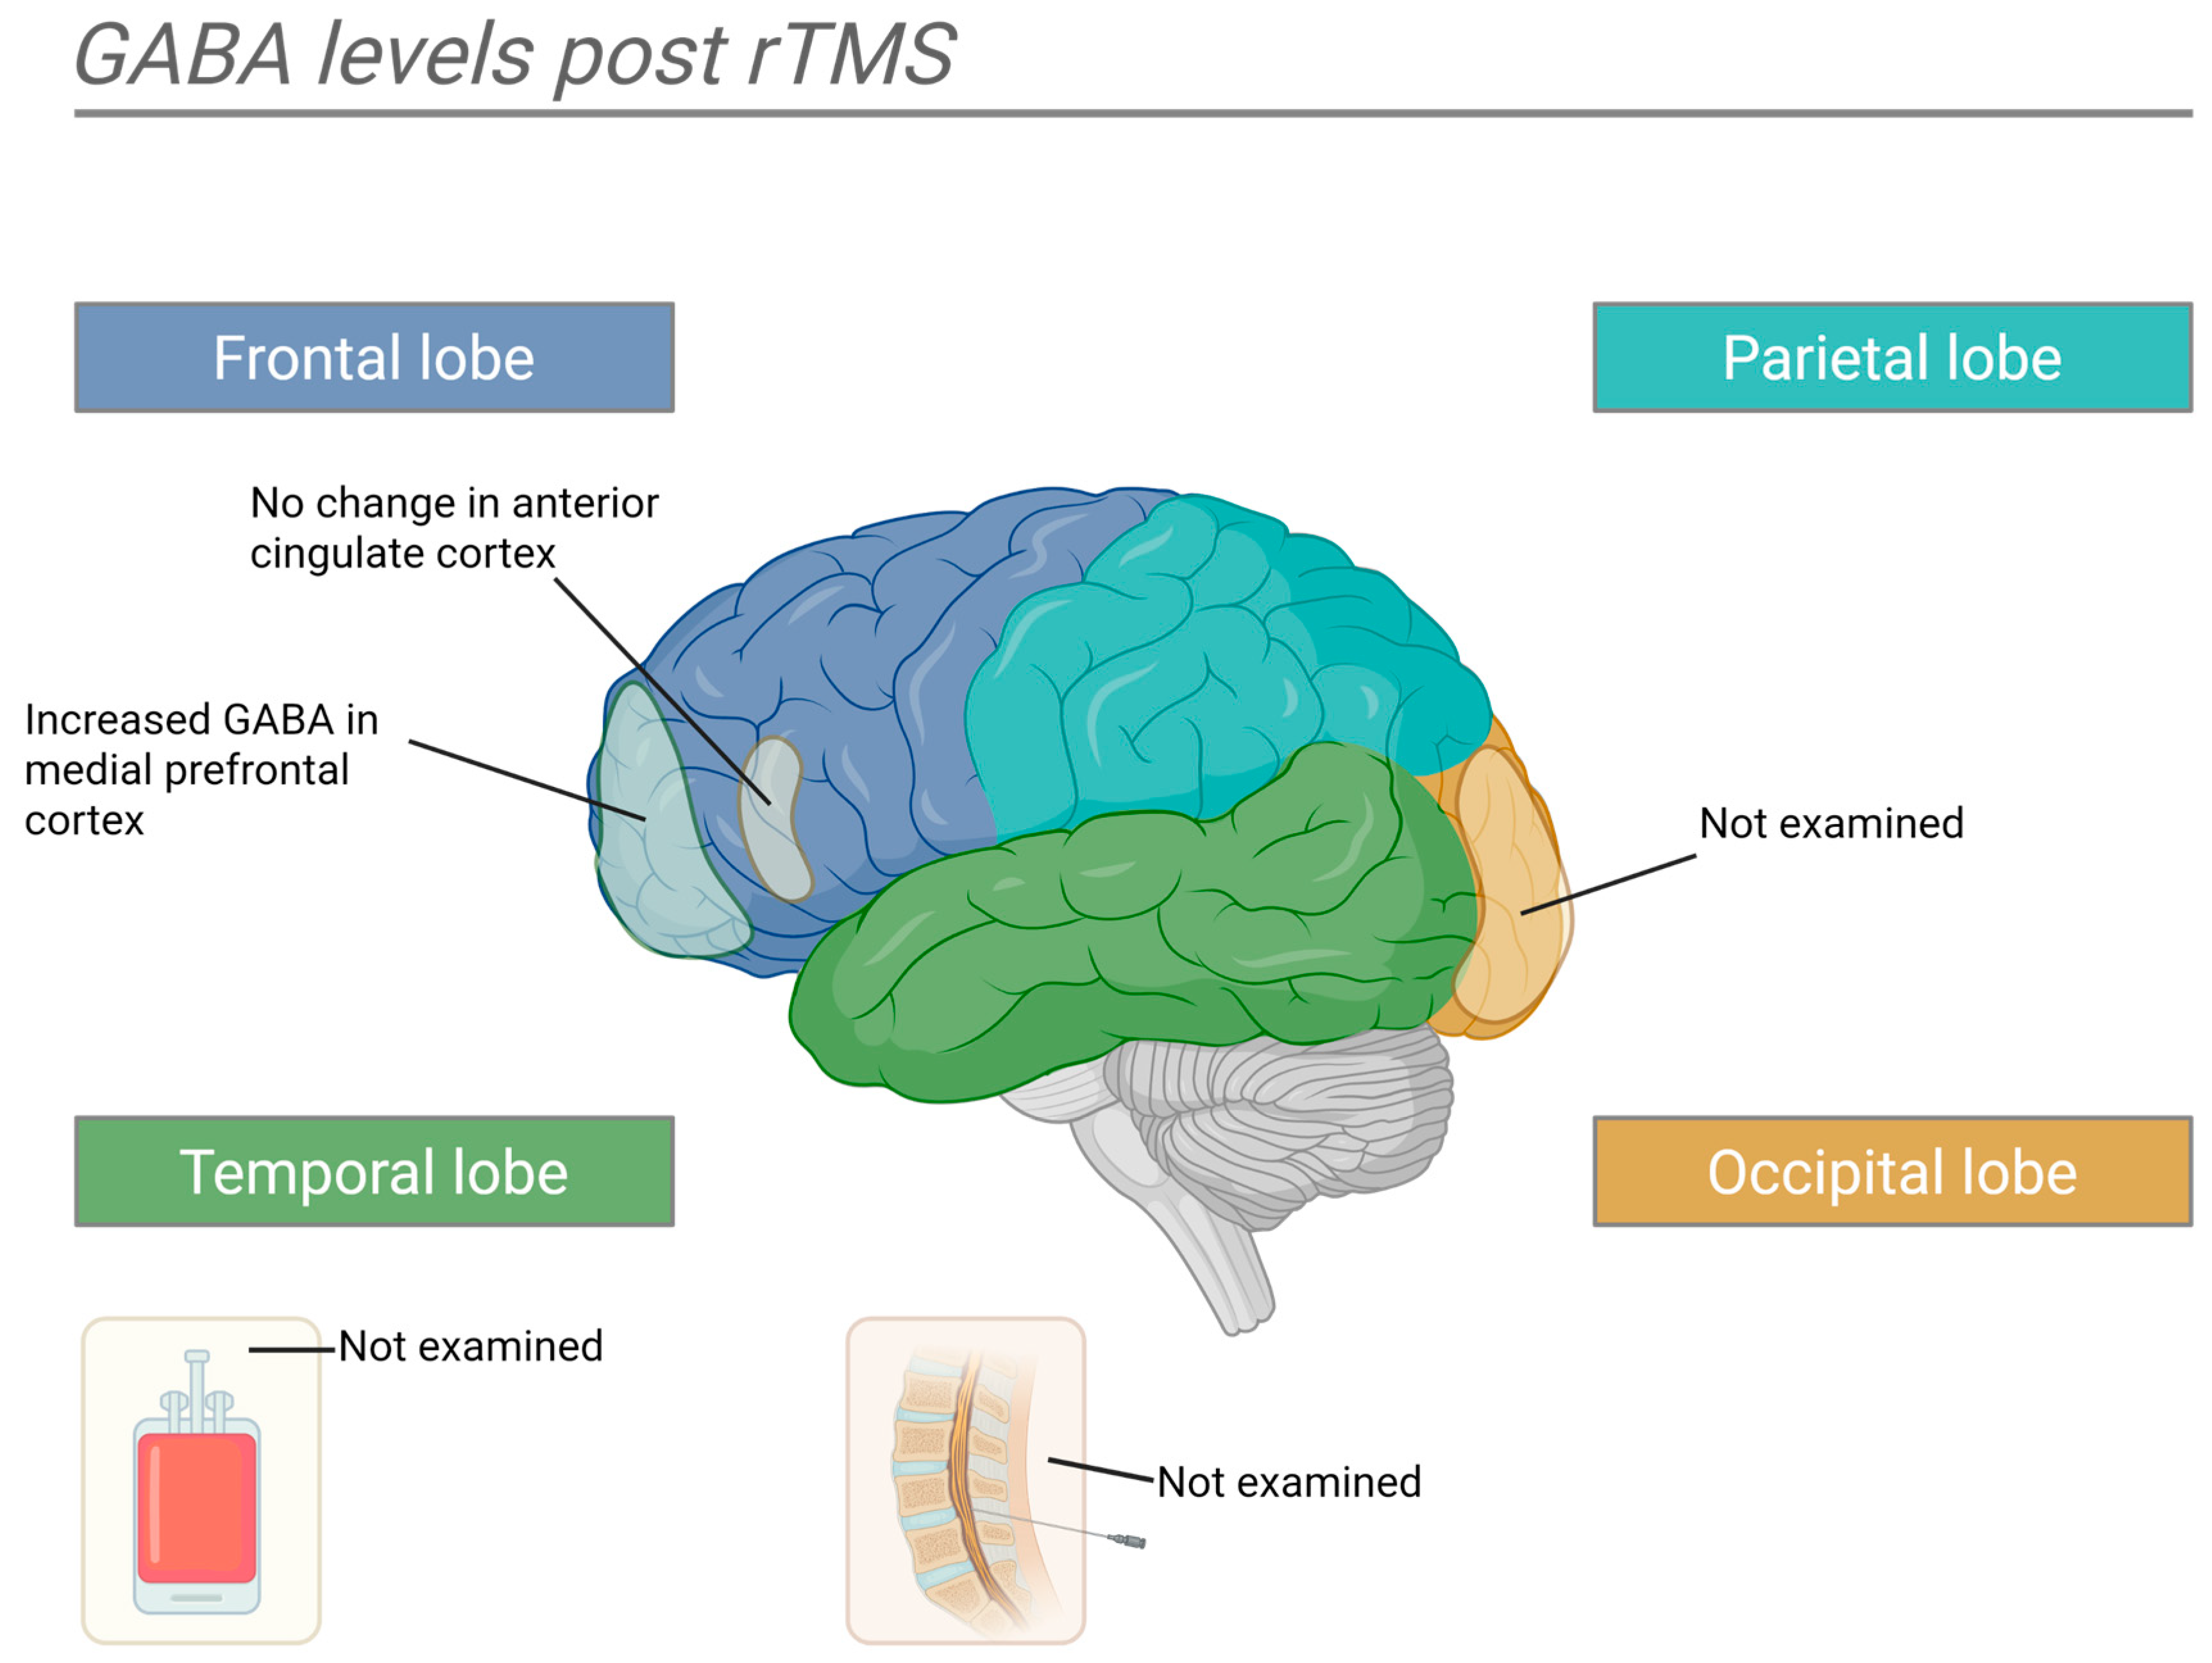
MRS studies have been conducted in various brain regions and patient samples. These studies are limited by their small sample sizes, but in summation, they can provide clues about the neurochemical changes occurring with rTMS. Various areas of the prefrontal cortex have been studied. The medial prefrontal cortex (mPFC) shows an increase in GABA levels post-rTMS in both unipolar and bipolar depression [85,86]. In patients with treatment-resistant depression, GABA levels in the left DLPFC did not change post-rTMS [87], while another study found an insignificant increase [88]. In the right DLPFC, GABA decreases in response to rTMS were insignificant. GABA levels in the ACC have not shown a significant decrease post-rTMS [88]. In the basolateral amygdala of mice which underwent a protocol to mimic posttraumatic stress disorder (PTSD) symptoms, GABA levels increased post-rTMS treatment [89]. In a group of healthy males who underwent rTMS, GABA levels were elevated post-rTMS in the primary motor cortex [90], but the changes were not significant in a study conducted in healthy mice [91]. Two other animal studies examined hippocampal changes post-rTMS—one finding increased GABA levels and the other finding a decrease [92,93]. In addition, one of these studies found decreased GABA levels in the hypothalamus, no change in the midbrain, and increased levels in the striatum [93].
Bourla and colleagues showed that an increase in resting motor threshold during rTMS therapy may predict response to treatment [94]. This is relevant because an increase in resting motor threshold has been attributed to improvement in GABAergic activity in the brain [95] (Figure 6).
Figure 6.
This diagram summarizes GABA level changes after rTMS therapy. GABA levels increase in the medial prefrontal cortex post-rTMS, while changes in the Dorsolateral Prefrontal Cortex (DLPFC) were mixed or non-significant. Created with BioRender.com.
Glutamate
Similar to GABA, changes in the concentration of glutamate in various brain regions have been explored with MRS. These studies face similar limitations due to small sample sizes. Glutamate is an excitatory neurotransmitter in the brain, and in these studies, changes are typically expressed as either glutamate alone or Glx (glutamate + glutamine). While glutamine is an inactive metabolite rather than an excitatory neurotransmitter, the acid hydrolysis generally used in the sequencing of amino acids converts glutamine into glutamate. Therefore, labs are unable to determine the original molecule, and they are measured together. Glutamine and glutamate also exhibit similar radio frequencies, making them difficult to separate on MRI and are instead grouped together. As a result, changes in Glx may not accurately reflect changes in glutamate and should be interpreted cautiously.
In the mPFC, one study reported no change in glutamate levels in response to rTMS [85]. In adults with depression, a study found that lower pre-rTMS glutamate concentrations in the left DLPFC predicted response to treatment. Moreover, rTMS resulted in an increase in DLPFC glutamate in responders [96]. An additional study of adults with treatment-resistant depression found a decrease in Glx levels in the ACC post-rTMS, but these results were not significant [88]. Several studies examined the change in the left DLPFC post-rTMS. One study found Glx levels significantly increased in the left DLPFC post-rTMS in patients with treatment-resistant depression; however, this increase did not correlate with treatment response [97]. Two studies found a non-significant increase in Glx post-treatment [87,88]. In the right DLPFC, one study found an insignificant increase [88]. A study of mice under a protocol to induce PTSD symptoms, rTMS, led to decreased glutamate in the amygdala [89]. In the hippocampus, two studies found rTMS in rats led to significantly elevated glutamate [92,93]. In the sensorimotor cortex, two studies found no significant changes in Glx post-rTMS [90,91]. One of these studies did find that glutamine levels increased significantly, but the effects were transient and returned to baseline after 2 weeks [91]. In the striatum, a study of rats found a significant increase in glutamate post-rTMS [93]. The same study found no changes in glutamate levels in the midbrain, but a significant decrease in the hypothalamus. A 2024 meta-analysis of rTMS and MRS studies showed rTMS in clinical responders increased glutamatergic metabolites [98]. A meta-analysis of MRS studies across depression treatment modalities, including pharmacotherapy, ketamine, rTMS, and ECT, found significantly increased prefrontal Glx levels after treatment among responders [99].
Table 1.
Summary of pre-clinical studies examining changes in excitatory and inhibitory neural systems post-rTMS. Studies are listed in chronological order of publication.
Table 2.
Summary of clinical studies examining changes in excitatory and inhibitory neural systems post-rTMS. Studies are listed in chronological order of publication.
4. Discussion
This study examines E–I balance as a model for the neurophysiologic mechanism underlying rTMS in the treatment of depression. Current literature suggests dysregulation of excitatory and inhibitory balance in depression, with an overall decrease in inhibitory activity and a hyperactive state. This is reflected by changes in GABA, such as decreased levels of GAD67, the enzyme responsible for GABA synthesis; impaired GABA receptor function; decreased cortical GABA, particularly in the ACC, PFC, and OC. Overall neuronal size and density are also decreased in depressed patients.
E–I-related processes may contribute to rTMS effects, but whether normalization causally mediates these effects remains unclear. Several rTMS-induced changes are consistent with a reversal of this hyperexcitable state, most directly the increases in cortical GABA observed across multiple regions on MRS, alongside increased synaptic density and elevated markers of neuroplasticity such as BDNF. At the same time, the mechanistic picture is not uniform. Some molecular and receptor-level findings in animal studies—including protocol-dependent reductions in GAD67, reduced PV/CB interneuron activity after iTBS, and decreased GABAA and GABAB receptor activity—point in the opposite direction, and standard high-frequency rTMS to the left DLPFC is itself an excitatory protocol. These apparent contradictions may reflect genuine regional and protocol-specific heterogeneity in how rTMS reshapes E–I balance, differences between local and network-level effects, and varied models and time points across studies. An adequate mechanistic account will need to reconcile increased cortical GABA with the co-occurring reductions in some inhibitory markers, rather than treating the evidence as uniformly supporting increased inhibition.
Applying the E–I balance model to rTMS highlights potential markers for identifying patients who stand to benefit from rTMS and a means of monitoring their response. If rTMS improves depressive symptoms by restoring E–I balance, then patients with depressive symptoms who do not have this underlying imbalance may be less likely to benefit. On the contrary, it could be hypothesized that patients with a profound imbalance may be more likely to have a meaningful response. This hypothesis invites the development of well-designed clinical studies assessing the change in depressive symptoms post-rTMS in depressed patients with and without evidence of altered excitatory or inhibitory activity to investigate the relationship between E–I balance and the depressive phenotype. TMS EEG measures such as SICI, LICI, and CSP, as well as neurophysiological changes identified on MRS such as cortical GABA, GAD enzymes, and GABA receptors, offer objective markers that may provide the means to identify and monitor E–I imbalance. Other antidepressant therapies such as ECT, pharmacotherapy, and even psychotherapy show evidence of interacting with E–I balance, and characterizing how rTMS interacts with this system may offer insights into tailoring other interventions.
The proposed E–I framework generates some testable predictions. First, if restoring E–I balance contributes to the antidepressant mechanism of rTMS, changes in E–I balance should precede improvement in depressive symptoms. Randomized controlled trials studies assessing E–I-related measures at baseline, during treatment, and following treatment could help clarify whether changes in these measures contribute to the antidepressant effects of rTMS. Improvement in depressive symptoms without changes in E–I-related measures, or changes in these measures without clinical improvement, would challenge the hypothesis that modulation of E–I-related processes mediates the antidepressant effects of rTMS. E–I-related changes should also be significantly greater in the treatment group than in the sham group. Second, early changes in E–I-related measures should be associated with and may predict subsequent clinical response to rTMS therapy.
Several limitations impact the ability to draw conclusions regarding E–I balance in rTMS. First, a major limitation of the current evidence is that E–I-related abnormalities in depression and changes in E–I measures after rTMS do not show that these changes mediate clinical improvement. Most studies rely on within-group changes, symptom correlations, or responder subgroup analyses, none of which can establish causality. Moreover, the studies are limited in number, sample size, and methodological rigor. Larger samples with longitudinal randomized controlled trials examining markers of E–I balance before and after rTMS in patients with depression in both responders and non-responders would better evaluate the role of E–I imbalance restoration in the treatment of depression with rTMS, but without sham-controlled longitudinal designs, temporal precedence, and formal mediation analyses. Future studies should aim to characterize changes to the glutamatergic and GABAergic systems in depression and perform systematic assessments of GABA and glutamate changes before, during, and after rTMS. Following these changes over time would determine if these changes were sustained. While patterns of GABA dysregulation in depression may be indicated, the pattern of other key neurotransmitters like glutamate needs more investigation. Studies of E–I imbalance in depression vary widely, so their findings should be interpreted in light of each method’s limitations. MRS estimates regional brain concentrations of GABA and glutamate but cannot distinguish between intracellular and extracellular levels. Moreover, MRS does not directly measure synaptic release, receptor-mediated inhibition, or a functional E–I ratio. Similarly, TMS–EEG measures such as N45/N100 and TMS–EMG measures such as SICI/LICI are associated with GABA receptor function but do not directly measure it. One potential limitation to future studies is the impact of other antidepressant treatments, such as pharmacotherapy, confounding changes in the E–I balance.
While findings are mixed and adequately powered, longitudinal, controlled studies are required; the available evidence is broadly consistent with an E–I model of rTMS in depression.
Author Contributions
Acquisition, review, and synthesis of existing literature were conducted by L.G.T. and S.H., and M.N. conducted a regular review of the article, including the final version, and assisted in the conception of the paper. All authors have read and agreed to the published version of the manuscript.
Funding
This research received no external funding.
Institutional Review Board Statement
Not applicable.
Data Availability Statement
No new data were created or analyzed in this study. Data sharing is not applicable to this article.
Conflicts of Interest
The authors declare no conflicts of interest.
References
- George, M.S.; Post, R.M. Daily left prefrontal repetitive transcranial magnetic stimulation for acute treatment of medication-resistant depression. Am. J. Psychiatry 2011, 168, 356–364. [Google Scholar] [CrossRef] [Scilit] [PubMed]
- Baker, A. An Introduction to the Basic Principles of Magnetic Nerve Stimulation. J. Clin. Neurophysiol. 1991, 8, 26–37. [Google Scholar] [CrossRef] [Scilit] [PubMed]
- Lefaucheur, J.P.; Aleman, A.; Baeken, C.; Benninger, D.H.; Brunelin, J.; Di Lazzaro, V.; Filipović, S.R.; Grefkes, C.; Hasan, A.; Hummel, F.C.; et al. Evidence-based guidelines on the therapeutic use of repetitive transcranial magnetic stimulation (rTMS): An update (2014–2018). Clin. Neurophysiol. 2020, 131, 474–528. [Google Scholar] [CrossRef] [Scilit] [PubMed]
- Vida, R.G.; Sághy, E.; Bella, R.; Kovács, S.; Erdősi, D.; Józwiak-Hagymásy, J.; Zemplényi, A.; Tényi, T.; Osváth, P.; Voros, V. Efficacy of repetitive transcranial magnetic stimulation (rTMS) adjunctive therapy for major depressive disorder (MDD) after two antidepressant treatment failures: Meta-analysis of randomized sham-controlled trials. BMC Psychiatry 2023, 23, 545. [Google Scholar] [CrossRef] [Scilit] [PubMed]
- Rubenstein, J.L.R.; Merzenich, M.M. Model of autism: Increased ratio of excitation/inhibition in key neural systems. Genes Brain Behav. 2003, 2, 255–267. [Google Scholar] [CrossRef] [Scilit] [PubMed]
- Maestú, F.; de Haan, W.; Busche, M.A.; DeFelipe, J. Neuronal excitation/inhibition imbalance: Core element of a translational perspective on Alzheimer pathophysiology. Ageing Res. Rev. 2021, 69, 101372. [Google Scholar] [CrossRef] [Scilit] [PubMed]
- Canitano, R.; Pallagrosi, M. Autism spectrum disorders and schizophrenia spectrum disorders: Excitation/inhibition imbalance and developmental trajectories. Front. Psychiatry 2017, 8, 69. [Google Scholar] [CrossRef] [Scilit] [PubMed]
- Hu, Y.T.; Tan, Z.L.; Hirjak, D.; Northoff, G. Brain-wide changes in excitation-inhibition balance of major depressive disorder: A systematic review of topographic patterns of GABA- and glutamatergic alterations. Mol. Psychiatry 2023, 28, 3257–3266. [Google Scholar] [CrossRef] [Scilit] [PubMed]
- Lazarus, M.S.; Krishnan, K.; Huang, Z.J. GAD67 deficiency in parvalbumin interneurons produces deficits in inhibitory transmission and network disinhibition in mouse prefrontal cortex. Cereb. Cortex 2015, 25, 1290–1296. [Google Scholar] [CrossRef] [Scilit] [PubMed]
- Gielen, M.C.; Lumb, M.J.; Smart, T.G. Benzodiazepines modulate GABA A receptors by regulating the preactivation step after GABA binding. J. Neurosci. 2012, 32, 5707–5715. [Google Scholar] [CrossRef] [Scilit] [PubMed]
- Olsen, G.M.; Sonnewald, U. Glutamate: Where does it come from and where does it go? Neurochem. Int. 2015, 88, 47–52. [Google Scholar] [CrossRef] [Scilit] [PubMed]
- Sohal, V.S.; Rubenstein, J.L.R. Excitation-inhibition balance as a framework for investigating mechanisms in neuropsychiatric disorders. Mol. Psychiatry 2019, 24, 1248–1257. [Google Scholar] [CrossRef] [Scilit] [PubMed]
- Mitchell, N.D.; Baker, G.B. An update on the role of glutamate in the pathophysiology of depression. Acta Psychiatr. Scand. 2010, 122, 192–210. [Google Scholar] [CrossRef] [Scilit] [PubMed]
- Lin, L.C.; Sibille, E. Reduced brain somatostatin in mood disorders: A common pathophysiological substrate and drug target? Front. Pharmacol. 2013, 4, 110. [Google Scholar] [CrossRef] [Scilit] [PubMed]
- Tripp, A.; Oh, H.; Guilloux, J.-P.; Martinowich, K.; Lewis, D. Brain-Derived Neurotrophic Factor Signaling and Subgenual Anterior Cingulate Cortex Dysfunction in Major Depressive Disorder. Am. J. Psychiatry 2012, 169, 1194–1202. [Google Scholar] [CrossRef] [Scilit] [PubMed]
- Sibille, E.; Morris, H.M.; Kota, R.S.; Lewis, D.A. GABA-related transcripts in the dorsolateral prefrontal cortex in mood disorders. Int. J. Neuropsychopharmacol. 2011, 14, 721–734. [Google Scholar] [CrossRef] [Scilit] [PubMed]
- Guilloux, J.; Douillard-guilloux, G.; Kota, R.; Wang, X.; Martinowich, K.; Tseng, G.C.; A Lewis, D.; Sibille, E. the amygdala of female subjects with Major Depression. Mol. Psychiatry 2013, 17, 1130–1142. [Google Scholar] [CrossRef] [Scilit] [PubMed]
- Tripp, A.; Kota, R.; Lewis, D.; Sibille, E. Reduced Somatostatin in Subgenual Anterior Cingulate Cortex in Major Depression. Neurobiol. Dis. 2011, 42, 116–124. [Google Scholar] [CrossRef] [Scilit] [PubMed]
- Karolewicz, B.; MacIag, D.; O’Dwyer, G.; Stockmeier, C.A.; Feyissa, A.M.; Rajkowska, G. Reduced level of glutamic acid decarboxylase-67 kDa in the prefrontal cortex in major depression. Int. J. Neuropsychopharmacol. 2010, 13, 411–420. [Google Scholar] [CrossRef] [Scilit] [PubMed]
- Gao, S.F.; Klomp, A.; Wu, J.L.; Swaab, D.F.; Bao, A.M. Reduced GAD65/67 immunoreactivity in the hypothalamic paraventricular nucleus in depression: A postmortem study. J. Affect. Disord. 2013, 149, 422–425. [Google Scholar] [CrossRef] [Scilit] [PubMed]
- Thompson, M.; Weickert, C.S.; Wyatt, E.; Webster, M.J. Decreased glutamic acid decarboxylase67 mRNA expression in multiple brain areas of patients with schizophrenia and mood disorders. J. Psychiatr. Res. 2009, 43, 970–977. [Google Scholar] [CrossRef] [Scilit] [PubMed]
- Ma, K.; Xu, A.; Cui, S.; Sun, M.R.; Xue, Y.C.; Wang, J.H. Impaired GABA synthesis, uptake and release are associated with depression-like behaviors induced by chronic mild stress. Transl. Psychiatry 2016, 6, e910. [Google Scholar] [CrossRef] [Scilit] [PubMed]
- Ma, K.; Zhang, H.; Wang, S.; Wang, H.; Wang, Y.; Liu, J.; Song, X.; Dong, Z.; Han, X.; Zhang, Y.; et al. The molecular mechanism underlying GABAergic dysfunction in nucleus accumbens of depression-like behaviours in mice. J. Cell. Mol. Med. 2019, 23, 7021–7028. [Google Scholar] [CrossRef] [Scilit] [PubMed]
- Radhu, N.; de Jesus, D.R.; Ravindran, L.N.; Zanjani, A.; Fitzgerald, P.B.; Daskalakis, Z.J. A meta-analysis of cortical inhibition and excitability using transcranial magnetic stimulation in psychiatric disorders. Clin. Neurophysiol. 2013, 124, 1309–1320. [Google Scholar] [CrossRef] [Scilit] [PubMed]
- Fee, C.; Banasr, M.; Sibille, E. Somatostatin-positive GABA Interneuron Deficits in Depression: Cortical Microcircuit and Therapeutic Perspectives. Physiol. Behav. 2017, 176, 139–148. [Google Scholar]
- Cotter, D.; Mackay, D.; Landau, S.; Kerwin, R.; Everall, I. Reduced glial cell density and neuronal size in the anterior cingulate cortex in major depressive disorder. Arch. Gen. Psychiatry 2001, 58, 545–553. [Google Scholar] [CrossRef] [Scilit] [PubMed]
- Rajkowska, G.; Miguel-Hidalgo, J.J.; Wei, J.; Dilley, G.; Pittman, S.D.; Meltzer, H.Y.; Overholser, J.C.; Roth, B.L.; Stockmeier, C.A. Morphometric evidence for neuronal and glial prefrontal cell pathology in major depression. Biol. Psychiatry 1999, 45, 1085–1098. [Google Scholar] [CrossRef] [Scilit] [PubMed]
- Chana, G.; Landau, S.; Beasley, C.; Everall, I.P.; Cotter, D. Two-dimensional assessment of cytoarchitecture in the anterior cingulate cortex in major depressive disorder, bipolar disorder, and schizophrenia: Evidence for decreased neuronal somal size and increased neuronal density. Biol. Psychiatry 2003, 53, 1086–1098. [Google Scholar] [CrossRef] [Scilit] [PubMed]
- Helm, K.; Viol, K.; Weiger, T.M.; Tass, P.A.; Grefkes, C.; Del Monte, D.; Schiepek, G. Neuronal connectivity in major depressive disorder: A systematic review. Neuropsychiatr. Dis. Treat. 2018, 14, 2715–2737. [Google Scholar] [CrossRef] [Scilit] [PubMed]
- Cobb, J.A.; Simpson, J.; Mahajan, G.J.; Overholser, J.C.; Jurjus, G.J.; Dieter, L.; Herbst, N.; May, W.; Rajkowska, G.; Stockmeier, C.A. Hippocampal volume and total cell numbers in major depressive disorder. J. Psychiatr. Res. 2013, 47, 299–306. [Google Scholar] [CrossRef] [Scilit] [PubMed]
- Rajkowska, G.; Dwyer, G.O.; Teleki, Z.; Stockmeier, C.A.; Miguel-hidalgo, J. GABAergic neurons immunoreactive for calcium binding proteins are reduced in the prefrontal cortex in major depression. Neuropsychopharmacology 2007, 32, 471–482. [Google Scholar] [CrossRef] [Scilit] [PubMed] [PubMed Central]
- Gerner, R.H.; Hare, T.A. CSF GABA in normal subjects and patients with depression, schizophrenia, mania, and anorexia nervosa. Am. J. Psychiatry 1981, 138, 1098–1101. [Google Scholar] [CrossRef] [Scilit] [PubMed]
- Kasa, K.; Otsuki, S.; Yamamoto, M.; Sato, M.; Kuroda, H.O.N. Cerebrospinal fluid gamma-aminobutyric acid and homovanillic acid in depressive disorders. Biol. Psychiatry 1982, 17, 877–883. [Google Scholar] [PubMed]
- Gerner, R.H.; Fairbanks, L.; Anderson, G.M.; Young, J.G.; Scheinin, M.; Linnoila, M.; Hare, T.A.; Shaywitz, B.A.; Cohen, D.J. CSF neurochemistry in depressed, manic, and schizophrenic patients compared with that of normal controls. Am. J. Psychiatry 1984, 141, 1533–1540. [Google Scholar] [CrossRef] [Scilit] [PubMed]
- Berrettini, W.H.; Nurnberger, J.I.J.; Hare, T.A.; Simmons-Alling, S.; Gershon, E.S.; Post, R.M. Reduced plasma and CSF gamma-aminobutyric acid in affective illness: Effect of lithium carbonate. Biol. Psychiatry 1983, 18, 185–194. [Google Scholar] [PubMed]
- Sanacora, G.; Gueorguieva, R.; Epperson, C.N.; Wu YTe Appel, M.; Rothman, D.L.; Krystal, J.H.; Mason, G.F. Subtype-specific alterations of γ-aminobutyric acid and glutamate in patients with major depression. Arch. Gen. Psychiatry 2004, 61, 705–713. [Google Scholar] [CrossRef] [Scilit] [PubMed]
- Bhagwagar, Z.; Wylezinska, M.; Jezzard, P.; Evans, J.; Boorman, E.; Matthews, P.M.; Cowen, P.J. Low GABA concentrations in occipital cortex and anterior cingulate cortex in medication-free, recovered depressed patients. Int. J. Neuropsychopharmacol. 2008, 11, 255–260. [Google Scholar] [CrossRef] [Scilit] [PubMed]
- Price, R.B.; Shungu, D.C.; Mao, X.; Nestadt, P.; Kelly, C.; Collins, K.A.; Murrough, J.W.; Charney, D.S.; Mathew, S.J. Amino Acid Neurotransmitters Assessed by Proton Magnetic Resonance Spectroscopy: Relationship to Treatment Resistance in Major Depressive Disorder. Biol. Psychiatry 2009, 65, 792–800. [Google Scholar] [CrossRef] [Scilit] [PubMed]
- Sanacora, G.; Mason, G.F.; Rothman, D.L.; Krystal, J.H. Increased occipital cortex GABA concentrations in depressed patients after therapy with selective serotonin reuptake inhibitors. Am. J. Psychiatry 2002, 159, 663–665. [Google Scholar] [CrossRef] [Scilit] [PubMed]
- Sanacora, G.; Mason, G.F.; Rothman, D.L.; Behar, K.L.; Hyder, F.; Petroff, O.A.C.; Berman, R.M.; Charney, D.S.; Krystal, J.H. Reduced cortical γ-aminobutyric acid levels in depressed patients determined by proton magnetic resonance spectroscopy. Arch. Gen. Psychiatry 1999, 56, 1043–1047. [Google Scholar] [CrossRef] [Scilit] [PubMed]
- Draganov, M.; Vives-Gilabert, Y.; de Diego-Adeliño, J.; Vicent-Gil, M.; Puigdemont, D.; Portella, M.J. Glutamatergic and GABA-ergic abnormalities in First-episode depression. A 1-year follow-up 1H-MR spectroscopic study. J. Affect. Disord. 2020, 266, 572–577. [Google Scholar] [CrossRef] [Scilit] [PubMed]
- Hasler, G.; Van Der Veen, J.W.; Tumonis, T.; Meyers, N.; Shen, J.; Drevets, W.C. Reduced prefrontal glutamate/glutamine and γ-aminobutyric acid levels in major depression determined using proton magnetic resonance spectroscopy. Arch. Gen. Psychiatry 2007, 64, 193–200. [Google Scholar] [CrossRef] [Scilit] [PubMed]
- Plante, D.T.; Jensen, J.E.; Schoerning, L.; Winkelman, J.W. Reduced γ-aminobutyric acid in occipital and anterior cingulate cortices in primary insomnia: A link to major depressive disorder. Neuropsychopharmacology 2012, 37, 1548–1557. [Google Scholar] [CrossRef] [Scilit] [PubMed]
- Gabbay, V.; Mao, X.; Klein, R.G.; Ely, B.A.; Babb, J.S.; Panzer, A.M.; Alonso, C.M.; Shungu, D.C. Anterior cingulate cortex γ-aminobutyric acid in depressed adolescents: Relationship to anhedonia. Arch. Gen. Psychiatry 2012, 69, 139–149. [Google Scholar] [PubMed]
- Petty, F.; Kramer, G.L.; Gullion, C.M.; John Rush, A. Low plasma γ-aminobutyric acid levels in male patients with depression. Biol. Psychiatry 1992, 32, 354–363. [Google Scholar] [CrossRef] [Scilit] [PubMed]
- Kim, J.S.; Schmid-Burgk, W.; Claus, D.; Kornhuber, H.H. Increased serum glutamate in depressed patients. Arch. Psychiatr. Nervenkr. 1982, 232, 299–304. [Google Scholar] [CrossRef] [Scilit] [PubMed]
- Altamura, C.A.; Mauri, M.C.; Ferrara, A.; Moro, A.R.; D’Andrea, G.; Zamberlan, F. Plasma and platelet excitatory amino acids in psychiatric disorders. Am. J. Psychiatry 1993, 150, 1731–1733. [Google Scholar] [CrossRef] [Scilit] [PubMed]
- Mitani, H.; Shirayama, Y.; Yamada, T.; Maeda, K.; Ashby, C.R.; Kawahara, R. Correlation between plasma levels of glutamate, alanine and serine with severity of depression. Prog. Neuro-Psychopharmacol. Biol. Psychiatry 2006, 30, 1155–1158. [Google Scholar] [CrossRef] [Scilit] [PubMed]
- Mauri, M.C.; Ferrara, A.; Boscati, L.; Bravin, S.; Zamberlan, F.; Alecci, M.; Invernizzi, G. Plasma and Platelet Amino Acid Concentrations in Patients Affected by Major Depression and under Fluvoxamine Treatment. Neuropsychobiology 1998, 337, 124–129. [Google Scholar] [CrossRef] [Scilit] [PubMed]
- Maes, M.; Verkerk, R.; Vandoolaeghe, E.; Lin, A.; Scharpé, S. Serum levels of excitatory amino acids, serine, glycine, histidine, threonine, taurine, alanine and arginine in treatment-resistant depression: Modulation by treatment with antidepressants and prediction of clinical responsivity. Acta Psychiatr. Scand. 1998, 97, 302–308. [Google Scholar] [CrossRef] [Scilit] [PubMed]
- Pfleiderer, B.; Michael, N.; Erfurth, A.; Ohrmann, P.; Hohmann, U.; Wolgast, M.; Fiebich, M.; Arolt, V.; Heindel, W. Effective electroconvulsive therapy reverses glutamate/glutamine deficit in the left anterior cingulum of unipolar depressed patients. Psychiatry Res.-Neuroimaging 2003, 122, 185–192. [Google Scholar] [CrossRef] [Scilit] [PubMed]
- Auer, D.P.; Pütz, B.; Kraft, E.; Lipinski, B.; Schill, J.; Holsboer, F. Reduced glutamate in the anterior cingulate cortex in depression: An in vivo proton magnetic resonance spectroscopy study. Biol. Psychiatry 2000, 47, 305–313. [Google Scholar] [CrossRef] [Scilit] [PubMed]
- Rosenberg, D.R.; Mirza, Y.; Russell, A.; Tang, J.; Smith, J.M.; Banerjee, S.P.; Bhandari, R.; Rose, M.; Ivey, J.; Boyd, C.; et al. Reduced anterior cingulate glutamatergic concentrations in childhood OCD and major depression versus healthy controls. J. Am. Acad. Child Adolesc. Psychiatry 2004, 43, 1146–1153. [Google Scholar] [CrossRef] [Scilit] [PubMed]
- Rosenberg, D.R.; MacMaster, F.P.; Mirza, Y.; Smith, J.M.; Easter, P.C.; Banerjee, S.P.; Bhandari, R.; Boyd, C.; Lynch, M.; Rose, M.; et al. Reduced anterior cingulate glutamate in pediatric major depression: A magnetic resonance spectroscopy study. Biol. Psychiatry 2005, 58, 700–704. [Google Scholar] [CrossRef] [Scilit] [PubMed]
- Frye, M.A.; Tsai, G.E.; Huggins, T.; Coyle, J.T.; Post, R.M. Low Cerebrospinal Fluid Glutamate and Glycine in Refractory Affective Disorder. Biol. Psychiatry 2007, 61, 162–166. [Google Scholar] [CrossRef] [Scilit] [PubMed]
- Levine, J.; Panchalingam, K.; Rapoport, A.; Gershon, S.; McClure, R.J.; Pettegrew, J.W. Increased cerebrospinal fluid glutamine levels in depressed patients. Biol. Psychiatry 2000, 47, 586–593. [Google Scholar] [CrossRef] [Scilit] [PubMed]
- Ajilore, O.; Haroon, E.; Kumaran, S.; Darwin, C.; Binesh, N.; Mintz, J.; Miller, J.; Thomas, M.A.; Kumar, A. Measurement of brain metabolites in patients with type 2 diabetes and major depression using proton magnetic resonance spectroscopy. Neuropsychopharmacology 2007, 32, 1224–1231. [Google Scholar] [CrossRef] [Scilit] [PubMed]
- Caetano, S.C.; Fonseca, M.; Olvera, R.L.; Nicoletti, M.; Hatch, J.P.; Stanley, J.A.; Hunter, K.; Lafer, B.; Pliszka, S.R.; Soares, J.C. Proton spectroscopy study of the left dorsolateral prefrontal cortex in pediatric depressed patients. Neurosci. Lett. 2005, 384, 321–326. [Google Scholar] [CrossRef] [Scilit] [PubMed]
- Li, C.X.; Wang, Y.; Gao, H.; Pan, W.J.; Xiang, Y.; Huang, M.; Lei, H. Cerebral metabolic changes in a depression-like rat model of chronic forced swimming studied by ex vivo high resolution 1H magnetic resonance spectroscopy. Neurochem. Res. 2008, 33, 2342–2349. [Google Scholar] [CrossRef] [Scilit] [PubMed]
- Hashimoto, K.; Sawa, A.; Iyo, M. Increased Levels of Glutamate in Brains from Patients with Mood Disorders. Biol. Psychiatry 2007, 62, 1310–1316. [Google Scholar] [CrossRef] [Scilit] [PubMed]
- Yildiz-Yesiloglu, A.; Ankerst, D.P. Review of 1H magnetic resonance spectroscopy findings in major depressive disorder: A meta-analysis. Psychiatry Res.-Neuroimaging 2006, 147, 1–25. [Google Scholar] [CrossRef] [Scilit] [PubMed]
- Feng, J.; Zhang, Q.; Zhang, C.; Wen, Z.; Zhou, X. The Effect of sequential bilateral low-frequency rTMS over dorsolateral prefrontal cortex on serum level of BDNF and GABA in patients with primary insomnia. Brain Behav. 2019, 9, e01206. [Google Scholar] [CrossRef] [Scilit] [PubMed]
- Pascual-leone, A.; Valls-solé, J.; Wassermann, E.M.; Hallett, M. Responses to rapid-rate transcranial magnetic stimulation of the human motor cortex. Brain 1994, 117, 847–858. [Google Scholar] [CrossRef] [Scilit] [PubMed]
- Ikeda, T. E ff ects of repetitive transcranial magnetic stimulation on ER stress-related genes and glutamate, γ -aminobutyric acid and glycine transporter genes in mouse brain. Biochem. Biophys. Rep. 2019, 17, 10–16. [Google Scholar] [CrossRef] [Scilit] [PubMed]
- Hwang, W.; Choi, J.K.; Bang, M.S.; Park, W.-Y.; Oh, B.-M. Gene Expression Profile Changes in the Stimulated Rat Brain Cortex After Repetitive Transcranial Magnetic Stimulation. Brain Neurorehabilit. 2022, 15, e27. [Google Scholar] [CrossRef] [Scilit] [PubMed]
- Zorzo, C.; Higarza, S.G.; Méndez, M.; Martínez, J.A.; Pernía, A.M.; Arias, J.L. High frequency repetitive transcranial magnetic stimulation improves neuronal activity without affecting astrocytes and microglia density. Brain Res. Bull. 2019, 150, 13–20. [Google Scholar] [CrossRef] [Scilit] [PubMed]
- Bathina, S.; Das, U.N. Brain-derived neurotrophic factor and its clinical implications. Arch. Med. Sci. 2014, 11, 1164–1178. [Google Scholar] [CrossRef] [Scilit] [PubMed]
- Trippe, J.; Mix, A.; Aydin-Abidin, S.; Funke, K.; Benali, A. Theta burst and conventional low-frequency rTMS differentially affect GABAergic neurotransmission in the rat cortex. Exp. Brain Res. 2009, 199, 411–421. [Google Scholar] [CrossRef] [Scilit] [PubMed]
- Wang, N.; Jia, Y.; Zhou, X.; Wang, X.; Zhou, H.; Xiao, N. Effects of Repetitive Transcranial Magnetic Stimulation on Pallidum GABAergic Neurons and Motor Function in Rat Models of Kernicterus. Brain Sci. 2023, 13, 1252. [Google Scholar] [CrossRef] [Scilit] [PubMed]
- Benali, A.; Weiler, E.; Mix, A.; Petrasch-Parwez, E.; Girzalsky, W.; Eysel, U.T.; Erdmann, R.; Funke, K. Theta-Burst Transcranial Magnetic Stimulation Alters Cortical Inhibition. J. Neurosci. 2011, 31, 1193–1203. [Google Scholar] [CrossRef] [Scilit] [PubMed]
- Hoppenrath, K.; Funke, K. Neuroscience Letters Time-course of changes in neuronal activity markers following iTBS-TMS of the rat neocortex. Neurosci. Lett. 2013, 536, 19–23. [Google Scholar] [CrossRef] [Scilit] [PubMed]
- Volz, L.J.; Benali, A.; Mix, A.; Neubacher, U.; Funke, K. Brain Stimulation Dose-Dependence of Changes in Cortical Protein Expression Induced with Repeated Transcranial Magnetic Theta-Burst Stimulation in the Rat. Brain Stimul. 2013, 6, 598–606. [Google Scholar] [CrossRef] [Scilit] [PubMed]
- Thimm, A.; Funke, K. Multiple blocks of intermittent and continuous theta-burst stimulation applied via transcranial magnetic stimulation differently affect sensory responses in rat barrel cortex. J. Physiol. 2015, 4, 967–985. [Google Scholar] [CrossRef] [Scilit] [PubMed]
- Li, Y.; Li, L.; Pan, W. Repetitive transcranial magnetic stimulation (rTMS) modulates hippocampal structural synaptic plasticity in rats. Physiol. Res. 2019, 68, 99–105. [Google Scholar] [CrossRef] [Scilit] [PubMed]
- Yoon, K.J.; Lee, Y.T.; Han, T.R. Mechanism of functional recovery after repetitive transcranial magnetic stimulation (rTMS) in the subacute cerebral ischemic rat model: Neural plasticity or anti-apoptosis? Exp. Brain Res. 2011, 214, 549–556. [Google Scholar] [CrossRef] [Scilit] [PubMed]
- Kole, M.H.; Fuchs, E.; Ziemann, U.; Paulus, W.; Ebert, U. Changes in 5-HT1A and NMDA binding sites by a single rapid transcranial magnetic stimulation procedure in rats. Brain Res. 1999, 826, 309–312. [Google Scholar] [CrossRef] [Scilit] [PubMed]
- Vlachos, A.; Müller-Dahlhaus, F.; Rosskopp, J.; Lenz, M.; Ziemann, U.; Deller, T. Repetitive magnetic stimulation induces functional and structural plasticity of excitatory postsynapses in mouse organotypic hippocampal slice cultures. J. Neurosci. Off. J. Soc. Neurosci. 2012, 32, 17514–17523. [Google Scholar] [CrossRef] [Scilit] [PubMed]
- Ben-Shachar, D.; Gazawi, H.; Riboyad-Levin, J.; Klein, E. Chronic repetitive transcranial magnetic stimulation alters β- adrenergic and 5-HT2 receptor characteristics in rat brain. Brain Res. 1999, 816, 78–83. [Google Scholar] [CrossRef] [Scilit] [PubMed]
- Voineskos, D.; Blumberger, D.M.; Rogasch, N.C.; Zomorrodi, R.; Farzan, F.; Foussias, G.; Rajji, T.K.; Daskalakis, Z.J. Clinical Neurophysiology Neurophysiological effects of repetitive transcranial magnetic stimulation (rTMS) in treatment resistant depression. Clin. Neurophysiol. 2021, 132, 2306–2316. [Google Scholar] [CrossRef] [Scilit] [PubMed]
- Gao, W.; Yu, L.G.; Liu, Y.L.; Wang, Y.Z.; Huang, X.L. Mechanism of GABA receptors involved in spasticity inhibition induced by transcranial magnetic stimulation following spinal cord injury. J. Huazhong Univ. Sci. Technol. 2015, 35, 241–247. [Google Scholar] [CrossRef] [Scilit] [PubMed]
- Tan, T.; Wang, W.; Xu, H.; Huang, Z.; Wang, Y.T.; Dong, Z. Low-Frequency rTMS Ameliorates Autistic-Like Behaviors in Rats Induced by Neonatal Isolation Through Regulating the Synaptic GABA Transmission. Front. Cell. Neurosci. 2018, 12, 46. [Google Scholar] [CrossRef] [Scilit] [PubMed]
- Steinholtz, L.; Bodén, R.; Wall, A.; Lubberink, M.; Fällmar, D.; Persson, J. Alterations in gamma-aminobutyric acid and glutamate neurotransmission linked to intermittent theta-burst stimulation in depression: A sham-controlled study. Transl. Psychiatry 2025, 15, 133. [Google Scholar] [CrossRef] [Scilit] [PubMed]
- Stanley, J.A. In vivo magnetic resonance spectroscopy and its application to neuropsychiatric disorders. Can. J. Psychiatry 2002, 47, 315–326. [Google Scholar] [CrossRef] [Scilit] [PubMed]
- Farzan, F.; Barr, M.S.; Levinson, A.J.; Chen, R.; Wong, W.; Fitzgerald, P.B.; Daskalakis, Z.J. Reliability of long-interval cortical inhibition in healthy human subjects: A TMS-EEG study. J. Neurophysiol. 2010, 104, 1339–1346. [Google Scholar] [CrossRef] [Scilit] [PubMed]
- Dubin, M.J.; Mao, X.; Banerjee, S.; Goodman, Z.; Lapidus, K.A.B.; Kang, G.; Liston, C.; Shungu, D.C. Elevated prefrontal cortex GABA in patients with major depressive disorder after TMS treatment measured with proton magnetic resonance spectroscopy. J. Psychiatry Neurosci. 2016, 41, E37–E45. [Google Scholar] [CrossRef] [Scilit] [PubMed]
- Diederichs, C.; DeMayo, M.M.; Cole, J.; Yatham, L.N.; Harris, A.D.; McGirr, A. Intermittent Theta-Burst Stimulation Transcranial Magnetic Stimulation Increases GABA in the Medial Prefrontal Cortex: A Preliminary Sham-Controlled Magnetic Resonance Spectroscopy Study in Acute Bipolar Depression. Front. Psychiatry 2021, 12, 665402. [Google Scholar] [CrossRef] [Scilit] [PubMed]
- Bhattacharyya, P.; Anand, A.; Lin, J.; Altinay, M. Left Dorsolateral Prefrontal Cortex Glx/tCr Predicts Efficacy of High Frequency 4- to 6-Week rTMS Treatment and Is Associated With Symptom Improvement in Adults With Major Depressive Disorder: Findings From a Pilot Study. Front. Psychiatry 2021, 12, 665347. [Google Scholar] [CrossRef] [Scilit] [PubMed]
- Baeken, C.; Lefaucheur, J.P.; Van Schuerbeek, P. The impact of accelerated high frequency rTMS on brain neurochemicals in treatment-resistant depression: Insights from 1H MR spectroscopy. Clin. Neurophysiol. 2017, 128, 1664–1672. [Google Scholar] [CrossRef] [Scilit] [PubMed]
- Claverie, D.; Cressant, A.; Thomasson, J.; Castellarin, C.; Grandperret, V.; Barbier, L.; Troubat, R.; Canini, F.; Belzung, C.; El-Hage, W. rTMS mechanisms for posttraumatic stress disorder treatment in a mouse model. J. Psychiatr. Res. 2024, 179, 33–43. [Google Scholar] [CrossRef] [Scilit] [PubMed]
- Stagg, C.J.; Wylezinska, M.; Matthews, P.M.; Johansen-Berg, H.; Jezzard, P.; Rothwell, J.C.; Bestmann, S. Neurochemical effects of theta burst stimulation as assessed by magnetic resonance spectroscopy. J. Neurophysiol. 2009, 101, 2872–2877. [Google Scholar] [CrossRef] [Scilit] [PubMed]
- Seewoo, B.J.; Feindel, K.W.; Etherington, S.J.; Rodger, J. Frequency-specific effects of low-intensity rTMS can persist for up to 2 weeks post-stimulation: A longitudinal rs-fMRI/MRS study in rats. Brain Stimul. 2019, 12, 1526–1536. [Google Scholar] [CrossRef] [Scilit] [PubMed]
- Xu, X.; Xiang, S.; Zhang, Q.; Yin, T.; Kong, W.; Zhang, T. rTMS alleviates cognitive and neural oscillatory deficits induced by hindlimb unloading in mice via maintaining balance between glutamatergic and GABAergic systems. Brain Res. Bull. 2021, 172, 98–107. [Google Scholar] [CrossRef] [Scilit] [PubMed]
- Yue, L.; Xiao-lin, H.; Tao, S. The effects of chronic repetitive transcranial magnetic stimulation on glutamate and gamma-aminobutyric acid in rat brain. Brain Res. 2009, 1260, 94–99. [Google Scholar] [CrossRef] [Scilit] [PubMed]
- Bourla, A.; Mouchabac, S.; Lorimy, L.; Crette, B.; Millet, B.; Ferreri, F. Variability in Motor Threshold during Transcranial Magnetic Stimulation Treatment for Depression: Neurophysiological Implications. Brain Sci. 2023, 13, 1246. [Google Scholar] [CrossRef] [Scilit] [PubMed]
- Palmieri, M.G.; Iani, C.; Scalise, A.; Desiato, M.T.; Loberti, M.; Telera, S.; Caramia, M.D. The effect of benzodiazepines and flumazenil on motor cortical excitability in the human brain. Brain Res. 1999, 815, 192–199. [Google Scholar] [CrossRef] [Scilit] [PubMed]
- Luborzewski, A.; Schubert, F.; Seifert, F.; Danker-Hopfe, H.; Brakemeier, E.L.; Schlattmann, P.; Anghelescu, I.; Colla, M.; Bajbouj, M. Metabolic alterations in the dorsolateral prefrontal cortex after treatment with high-frequency repetitive transcranial magnetic stimulation in patients with unipolar major depression. J. Psychiatr. Res. 2007, 41, 606–615. [Google Scholar] [CrossRef] [Scilit] [PubMed]
- Godfrey, K.E.M.; Muthukumaraswamy, S.D.; Stinear, C.M.; Hoeh, N. Effect of rTMS on GABA and glutamate levels in treatment-resistant depression: An MR spectroscopy study. Psychiatry Res.-Neuroimaging 2021, 317, 111377. [Google Scholar] [CrossRef] [Scilit] [PubMed]
- Pecsok, M.; Mordy, A.; Cristancho, M.; Oathes, D.; Roalf, D. The Glutamatergic Effects of Clinical Repetitive Transcranial Magnetic Stimulation in Depressed Populations: A Preliminary Meta-Analysis of Proton Magnetic Resonance Spectroscopy Studies. Psychopathology 2024, 57, 318–333. [Google Scholar] [CrossRef] [Scilit] [PubMed]
- Godfrey, K.; Douglass, H.; Erritzoe, D.; Muthukumaraswamy, S.; Nutt, D.; Sumner, R. The role of GABA, glutamate, and Glx levels in treatment of major depressive disorder: A systematic review and meta-analysis. Prog. Neuro-Psychopharmacol. Biol. Psychiatry 2025, 141, 111455. [Google Scholar] [CrossRef] [Scilit] [PubMed]
Disclaimer/Publisher’s Note: The statements, opinions and data contained in all publications are solely those of the individual author(s) and contributor(s) and not of MDPI and/or the editor(s). MDPI and/or the editor(s) disclaim responsibility for any injury to people or property resulting from any ideas, methods, instructions or products referred to in the content. |
© 2026 by the authors. Licensee MDPI, Basel, Switzerland. This article is an open access article distributed under the terms and conditions of the Creative Commons Attribution (CC BY) license.