


Abstract
To promote the high-quality development of the new-energy-vehicle industry, this paper takes the provincial panel data from 2016 to 2023 as its research object and adopts the coupling coordination degree model to measure the coupling coordination level of the coupling coordination degree (D) between new-energy-vehicle industrial-chain development capacity (U1) and green innovation (U2), and to analyze its spatiotemporal evolution characteristics. The research shows that China’s new-energy-vehicle industry presents a feature of high coupling and low coordination between new-energy-vehicle industrial-chain development capacity and green innovation, with an overall fluctuating upward trend evolving from imbalance toward coordination. Spatially, the coupling coordination level forms an obvious gradient pattern of high in the east, medium in the central region, and low in the west. Some central–western provinces achieve periodic improvement, accompanied by short-term year-to-year fluctuations.
1. Introduction
1.1. Research Background and Literature Review
Against the backdrop of the ongoing advancement of China’s “Dual Carbon” strategy and the 15th Five-Year Plan’s focus on developing an intelligent, connected new-energy-vehicle industry, NEVs have become a pivotal driver for the nation’s green industrial transformation, cultivation of high-quality productive forces, and establishment as a global automotive powerhouse. National strategies emphasize strengthening supply-chain resilience, fostering green technological innovation, and promoting regional coordination, setting clear directions for the sector’s high-quality development. While China’s NEV industry currently leads globally in scale, challenges such as supply-chain risk resilience, efficiency in green innovation, and regional development disparities remain significant. Enhancing synergy between supply-chain resilience and green innovation is not only crucial for industrial security and sustainable development but could also provide a key breakthrough for implementing national strategies and driving industrial modernization. Studying their interdependent relationships and spatiotemporal evolution patterns will deepen theoretical understanding of NEV industry development while providing scientific foundations for tailored regional policies and collaborative industrial advancement, carrying substantial practical significance and application value.
Research on supply-chain resilience has been conducted relatively early internationally, primarily focusing on its conceptual framework, measurement systems, and influencing factors. Mi Zhou et al. (2024) [1] and Zhao et al. (2026) [2] developed a resilience evaluation system for the new-energy-vehicle industry chain based on the CSCE principles, emphasizing that resistance capacity is the core dimension determining resilience. In the context of green innovation, Li et al. (2024) [3] investigated the interplay between technological innovation, environmental policies, and industrial development, establishing a well-established framework centered on green technology adoption, low-carbon transition, and supply-chain security. Guo et al. (2026) [4] and Zhang et al. (2026) [5] examined supply-chain collaboration and technology diffusion mechanisms, demonstrating that green transformation among leading enterprises significantly drives green innovation across the entire chain. However, research examining the coupling and coordination between supply-chain resilience and green innovation in the new-energy-vehicle sector remains relatively limited.
Domestic research has yielded substantial achievements across three key dimensions: industrial-chain resilience, green innovation, and coupling coordination. Regarding industrial-chain resilience, Zhang Lanyue et al. (2026) [6], employing the “4R” theory, identified a spatial pattern characterized by higher resilience in eastern regions compared to central and western areas. Tian Juying et al. (2026) [7] and Guo Yueda et al. (2026) [8] demonstrated significant regional heterogeneity in how artificial intelligence and the digital economy enhance industrial-chain resilience. In terms of green innovation, Li Yangyang et al. (2025) [9] and Wang Xin et al. (2021) [10] highlighted that environmental regulations and green finance are pivotal drivers of technological innovation. With respect to coupling coordination, Sun Xiaoxiao et al. (2026) [11] and Fu Weizhong et al. (2021) [12] applied coupling models to green production and industrial digitalization, revealing a continuous improvement trend in dual-system synergy. Within the new-energy-vehicle sector, existing studies primarily focus on policy frameworks, technological advancements, carbon neutrality targets, and vehicle–grid interaction, while integrated analyses combining new-energy-vehicle industrial-chain development capacity with green innovation remain scarce. While foreign automakers leverage global supply chains and unified carbon standards to achieve deep integration between resilience and green innovation, their research struggles to account for China’s regional disparities—where domestic industries dominate yet face shortcomings in core components and regional coordination. The current literature lacks cross-cultural comparative perspectives, providing a critical starting point for this study.
Through literature review and analysis, existing studies have demonstrated the positive impacts of technological innovation, the digital economy, and environmental regulation on enhancing industrial-chain resilience, while confirming that the coupling coordination model is suitable for analyzing dual-system synergy. However, several limitations remain: first, most studies focus solely on either new-energy-vehicle industrial-chain development capacity or green innovation, with insufficient research on their coupling mechanisms; second, analyses of spatiotemporal evolution and regional heterogeneity specifically in the new-energy-vehicle industry are limited; third, empirical studies integrating new-energy-vehicle industrial-chain development capacity with green innovation using provincial panel data are relatively scarce. Therefore, this paper takes new energy vehicles as the research subject to investigate the coupling and coordination relationship between new-energy-vehicle industrial-chain development capacity and green innovation, which not only advances existing research on industrial synergy but also provides empirical support for the high-quality development of the new-energy-vehicle industry. Accordingly, this paper adopts a descriptive empirical index evaluation framework instead of causal identification. It constructs two comprehensive evaluation systems and employs the coupling coordination model to characterize the coordinated development status of new-energy-vehicle industrial-chain resilience and green innovation at China’s provincial level. Three focused research questions are proposed as follows:
- RQ1: What are the overall level and temporal evolution characteristics of coupling coordination between new-energy-vehicle industrial-chain resilience and provincial green innovation across Chinese provinces?
- RQ2: What spatial gradient and regional heterogeneity patterns exist among eastern, central, and western China?
- RQ3: What major bottlenecks restrict coordinated development, and what targeted policy implications can be drawn for regional industrial governance?
Existing studies mostly conduct separate evaluation for either industrial-chain resilience or green innovation, while few construct a targeted coupling coordination analytical framework for the new-energy-vehicle sector. Prior literature lacks fine-grained discussion of provincial-level regional heterogeneity characteristics within China. Previous works rarely distinguish between the effects of domestic industrial policies and international carbon-trade-related rules under the coupling coordination analytical framework. Against this background, this paper carries out relevant empirical analysis.
1.2. Theoretical Mechanism Analysis
1.2.1. The Explanation Provided by the Coupling Coordination Theory
Coupling coordination theory [13] is an applied theory derived from systems science and synergy theory, used to explain the dynamic process by which two or more independent yet interacting systems evolve from disorder to order and transition from mutual constraints to synergistic coexistence. The coupling coordination degree (D) serves as a metric quantifying the strength of inter-system correlations, measuring the extent of interaction and influence between multiple systems. When applied to the analysis of the new-energy-vehicle industry, this theory scientifically elucidates the intrinsic connections, interactive dynamics, and co-evolutionary characteristics between the new-energy-vehicle industrial-chain development capacity system and the green innovation system, providing a theoretical foundation for assessing their balanced development and identifying critical bottlenecks.
1.2.2. Internal Mechanism of Two-Way Coupling Between Dual Systems
The new-energy-vehicle industry chain and green innovation share an intrinsic mechanism of mutual reinforcement and synergistic coupling [14]. On one hand, new-energy-vehicle industrial-chain development capacity provides essential support for green innovation [15]. A stable and resilient supply chain can withstand supply-chain fluctuations, market risks, and external shocks, ensuring sustained stability in R&D investment, production operations, and factor supply. This creates a reliable environment for green technology development, commercialization, and industrialization, further driving continuous innovation. On the other hand, green innovation enhances new-energy-vehicle industrial-chain development capacity [16]. Through technological breakthroughs, structural optimization, and low-carbon transformation, green innovation improves self-reliance in critical processes, reduces dependence on high-energy consumption, strengthens industries’ adaptability to policy shifts and market changes, and solidifies the foundation for industrial-chain security. These two systems mutually reinforce each other through positive interaction, forming a collaborative mechanism where “resilience stabilizes industries while innovation enhances resilience”, collectively promoting high-quality development of China’s new-energy-vehicle industry. Developed countries leverage globally decentralized supply chains and unified low-carbon regulations to achieve a balanced synergy between new-energy-vehicle industrial-chain development capacity and green innovation. In contrast, China faces regional disparities in its supply chains, high dependence on foreign core technologies, and additional challenges from domestic and international policy fluctuations, resulting in a significant gap compared to other countries in the coupled development of these dual systems.
1.2.3. Mechanism of Differences in the Collaborative Development of Industrial Chains at Home and Abroad
Relying on globalized division of labor, sound carbon constraint systems, and evenly distributed innovation resources across all regions, developed countries have built a balanced collaborative system integrating new-energy-vehicle industrial-chain development capacity and green innovation: leading multinational enterprises coordinate global supply chains to diversify external risks, and unified carbon standards force the iteration of low-carbon technologies throughout the whole chain, enabling the synchronous and balanced development of the two major systems.
China’s industrial collaboration bears distinct local characteristics. First, the concentration of supply chains varies drastically across regions: the eastern regions gather all high-quality production factors, while the central and western regions only undertake low-end manufacturing links. Second, the self-sufficiency rate of core components remains insufficient, resulting in prominent weaknesses in industrial-chain resilience. Third, policy-driven features are prominent, with domestic and foreign policies such as vehicle purchase tax and CBAM continuously disrupting the collaborative rhythm of the dual systems. Disparities in domestic and foreign industrial endowments, policy constraints, and supply-chain layouts directly lead to gaps in the level of coupled and coordinated development as well as evolutionary paths.
1.2.4. Coupling Disturbance Mechanism of Exogenous Policy Shocks
The mechanism involves the coupling of exogenous policy shocks and disturbance factors. Both new-energy-vehicle industrial-chain development capacity and green innovation are simultaneously affected by external policy disturbances such as purchase tax and CBAM. The purchase tax exerts a bidirectional impact on both systems from the demand side: slowing policy reduction rates collectively accelerate improvement; CBAM increases carbon costs for upstream raw materials in exporting provinces, undermining new-energy-vehicle industrial-chain development capacity while compelling green innovation and leading to misalignment in subsystem development. The coupled spatiotemporal characteristics result from the combined effects of endogenous synergies and external policies. Subsequent analyses examine and validate these policy disturbance effects across different time periods and regions.
2. Materials and Methods
2.1. Establishing a Measurement Index System
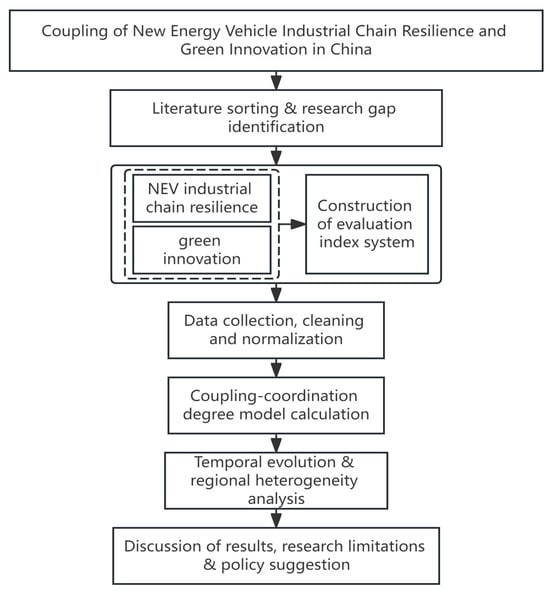
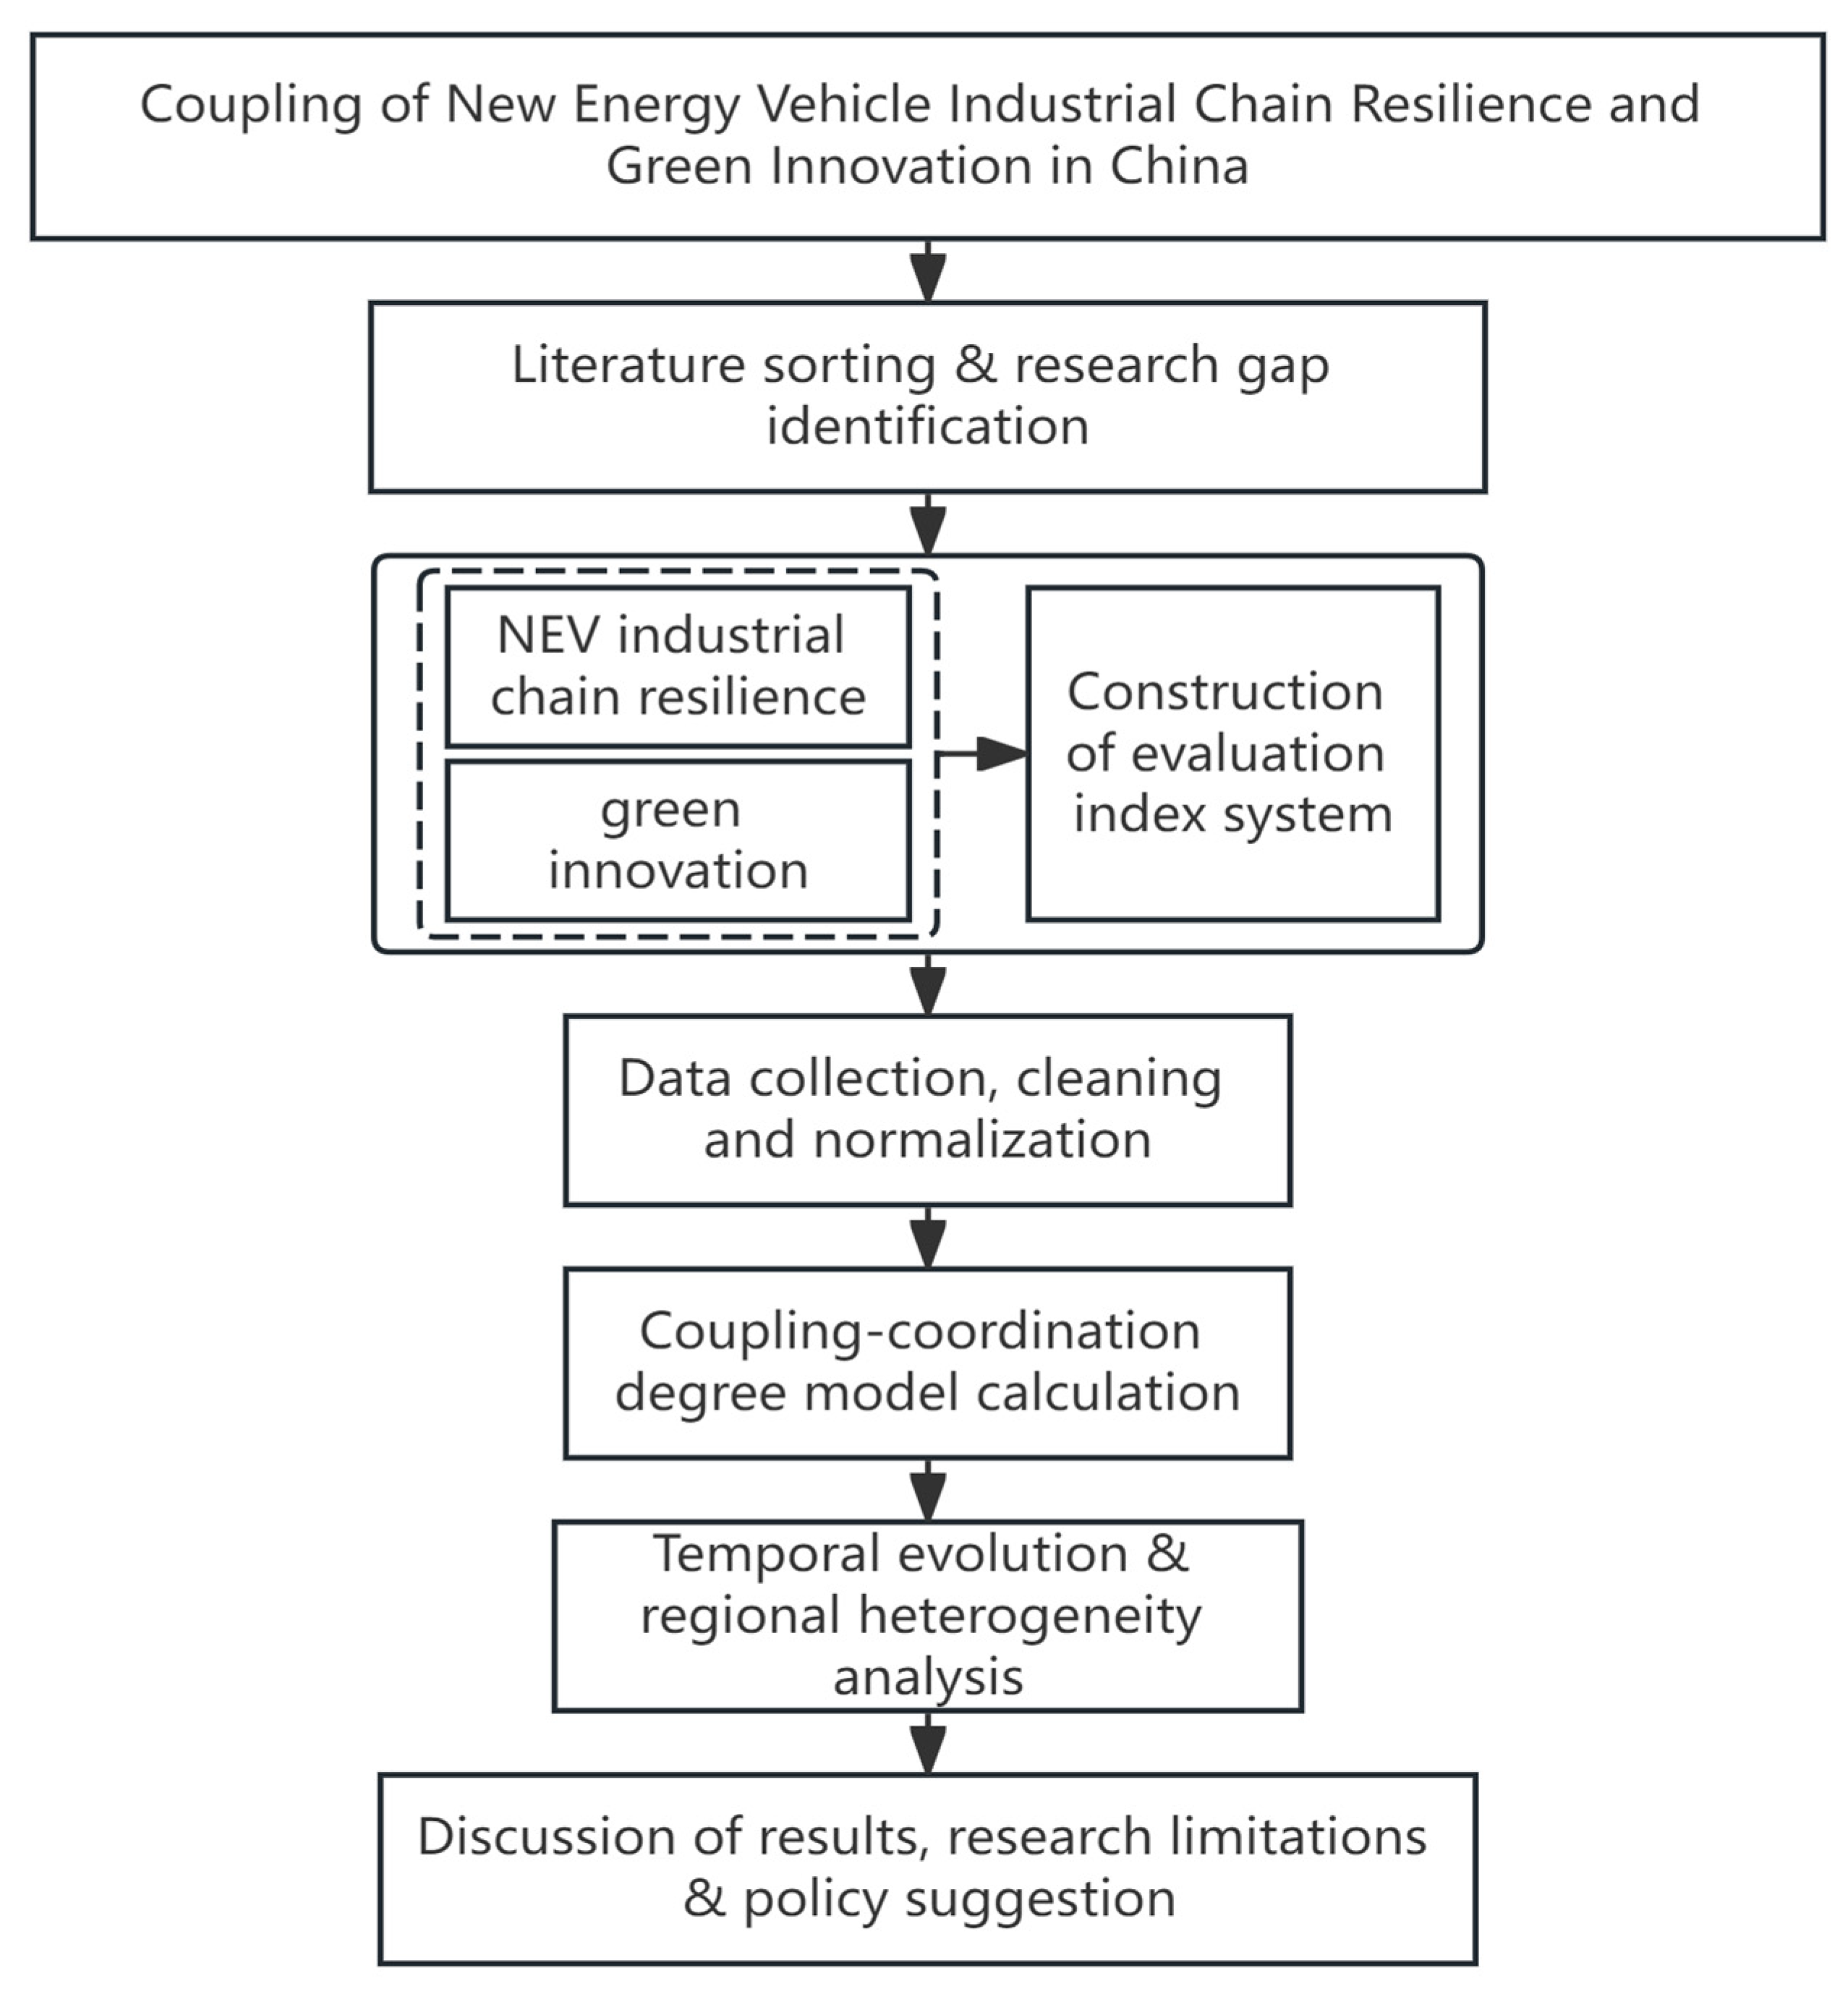
The overall research workflow of this paper is shown in Figure 1.
Figure 1.
Overall workflow of this study.
This paper builds upon existing research to establish two evaluation systems for the resilience of the new-energy-vehicle industry chain [17] and green innovation [18]. The industry-chain resilience system (U1) measures four indicators—new-energy-vehicle production volume, automotive manufacturing revenue, R&D expenditure in large-scale industries, and the number of valid invention patents in large-scale industries—across four dimensions: supply assurance, industrial scale, innovation foundation, and technological autonomy. The green innovation system (U2) is calculated based on innovation human resources [19], innovation outcomes, green support, and low-carbon performance, encompassing four indicators: full-time equivalent R&D personnel [20], total number of invention patents granted in the province [21], fiscal expenditure on energy conservation and environmental protection [22], and energy consumption per unit of GDP [23]. Specific indicators are presented in Table 1.
Table 1.
Comprehensive indicator system for new-energy-vehicle industrial-chain development capacity and green innovation.
It is worth noting that, constrained by provincial-level public data availability, the proxy indicators for new-energy-vehicle industrial-chain development capacity cannot capture typical resilience dimensions including supplier concentration, import dependence, and post-disruption recovery. Similarly, the green-innovation index adopts province-wide general innovation metrics instead of new-energy-vehicle-specific patent data (e.g., battery, powertrain, and recycling-related patents). Granular firm-level patent and supply-chain micro-data are required to construct more targeted indicators in future studies.
It should also be noted that, limited by the consistency and continuity of provincial official panel data from 2016 to 2023, this study selects front-end input–output indicators of green innovation. Indicators such as innovation commercialization rate, technology transfer scale, and start-up ecosystem are not included in this evaluation framework. Relevant indicators can be supplemented in follow-up research if complete long-term statistical data are accessible.
Considering that this study aims to analyze the overall coupling and coordination relationship between the NEV industrial-chain resilience system and green innovation system, rather than identify a single dominant indicator, equal weighting is adopted for all indicators. This setting prevents subjective bias caused by manual weight differentiation and avoids artificially amplifying or weakening the contribution of individual indicators. In addition, equal weighting has been widely adopted in previous coupling coordination studies related to industrial and green development, which facilitates the subsequent comparative analysis with existing literature.
2.2. Construction of the Coupling Coordination Degree Model
2.2.1. Data Preprocessing
Positive indicators (a larger value indicates a better system performance):
Reverse indicator (a smaller value indicates a better system performance):
Here, denotes the original value of the -th province’s -th indicator, while and represent its maximum and minimum values, respectively.
2.2.2. Calculation of the Comprehensive Development Level of Indicators
Eight tertiary indicators are employed to measure new-energy-vehicle industrial-chain development capacity and green innovation. To calculate the results for both systems, the equal-weight arithmetic mean method is used to compute the composite scores U1 (industrial-chain resilience) and U2 (green innovation).
Overall level of resilience development across the industrial chain:
Comprehensive level of green innovation development:
Here, represent the standardized values of the three-level indicators for new-energy-vehicle industrial-chain development capacity and green innovation, respectively, with ; higher values indicate a more advanced level of system development.
2.2.3. Measurement of Coupling Coordination Degree (D)
- (1)
- Calculate the coupling coordination degree (D), which reflects the intensity of interaction between the two systems.
: The closer is to 1,the tighter the interaction between the two systems; the closer it is to 0, the lesser the correlation.
- (2)
- The coupling coordination degree (D) only reflects the strength of association and cannot reflect the coordination level of the system’s overall development; therefore, a coupling coordination index D is introduced.
, where a larger value of indicates a higher level of coordinated development between the two subsystems. is defined as the comprehensive coordination index, which captures the overall development status of new-energy-vehicle industrial-chain development capacity and green innovation. and denote the weight coefficients of the two subsystems. From an industrial development perspective, the high-quality advancement of the new-energy-vehicle sector necessitates the synchronous development of new-energy-vehicle industrial-chain development capacity and green innovation. From a policy perspective, China’s Dual Carbon strategy is plausibly associated with industrial-chain supply security alongside low-carbon transformation, without biased policy support for either subsystem alone. Considering that the two evaluation systems in Table 1 adopt an identical number of indicators and carry equivalent strategic significance, we assign equal weights, with . Beyond the identical number of sub-indicators for the two systems, from the perspective of national dual-carbon goals and industrial-security requirements, new-energy-vehicle industrial-chain development capacity and green innovation are of equal strategic importance for high-quality industrial development, which further supports our equal-weight assignment for baseline estimation. It should be emphasized that the coupling coordination model adopted in this paper is only a descriptive tool for evaluating the statistical balance between two composite subsystem scores. This model cannot empirically identify causal effects or verify real-world mutual reinforcement relationships between systems. Mathematically, a high coupling coordination degree (D) C may also occur when both U1 and U2 take low but close values, which merely reflects numerical balance of the constructed indexes rather than high-level real-world interaction. Therefore, the coupling coordination degree D combining both coupling coordination degree (D) C and comprehensive development index T serves as our core indicator for judging practical coordinated performance.
2.2.4. Classification of Coupling Coordination Levels
Referring to existing research consensus standards, this study categorizes coupling coordination levels into five grades: severe dyscoordination, mild dyscoordination, borderline dyscoordination, good coordination, and excellent coordination, as shown in Table 2.
Table 2.
Grading Criteria for Coupling Coordination Levels.
2.3. Data Sources
This study selects panel data on new energy vehicles from 30 provinces (autonomous regions and municipalities) in China between 2016 and 2023 as the sample, excluding Xizang and the Hong Kong, Macao, and Taiwan regions. The raw data are sourced from provincial statistical yearbooks such as the National Bureau of Statistics, the China Industrial Statistical Yearbook, China Automotive Industry Yearbook and Technology Statistical Yearbook, the China Statistical Yearbook, and the China Energy Statistical Yearbook. Data processing and analysis were performed using R (version 4.4.1) programming language, with missing values supplemented by linear interpolation. Given the varying dimensions and magnitudes of the selected indicators, range normalization was applied to both positive and negative indicators to eliminate dimensionality effects, ensuring that all indicator values fall within the interval [0, 1]. All variables contain a clear definition, statistical unit, and corresponding data source as listed above. The min–max normalization is applied to the full pooled panel dataset covering all provinces across the whole sample period jointly, rather than normalized year by year, to guarantee the comparability of standardized scores across different years.
Missing observations account for less than 5% of the total sample. Linear interpolation is only used for scattered short-gap missing values. To test the sensitivity brought by interpolation, we recalculate core results by dropping all interpolated observations. The overall spatiotemporal patterns and main conclusions remain stable after exclusion of interpolated samples.
3. Results
3.1. Descriptive Statistical Analysis
This study analyzes the current development status of resilience and green innovation in the new-energy-vehicle industry chain, providing descriptive statistics for five key variables: new-energy-vehicle industrial-chain development capacity (U1), green innovation (U2), coupling coordination degree (D) (C), comprehensive coordination index (T), and coupling coordination degree (D) (Table 3). The results demonstrate that the sample data exhibit reasonable ranges, no extreme values, and stable measurement outcomes. On average, green innovation scores (0.356) exceed new-energy-vehicle industrial-chain development capacity scores (0.225), indicating that resilience remains a bottleneck for high-quality industrial development; the comprehensive coordination index average (0.297) is relatively low, while the coupling coordination degree (D) average (0.837) is high, reflecting strong interconnections between system elements; the coupling coordination degree average (0.479) lies near an imbalance threshold, failing to establish effective synergistic effects. Standard deviations across variables remain within acceptable ranges, with significant regional disparities observed between new-energy-vehicle industrial-chain development capacity and coupling coordination degree. Overall, the sector exhibits developmental characteristics marked by “high coupling but low coordination”.
Table 3.
Descriptive statistics of variables.
3.2. Correlation Analysis
To clarify the intrinsic relationships among new-energy-vehicle industrial-chain development capacity (U1), green innovation (U2), and coupling coordination degree (D), a Pearson correlation analysis was conducted. The results show that all core variables exhibit significant positive correlations at the 1% level, indicating strong interrelationships. Specifically, the correlation coefficient between new-energy-vehicle industrial-chain development capacity and green innovation is 0.88, reflecting a highly positive linkage; the coefficients with coupling coordination degree are 0.92 and 0.91, respectively, demonstrating that both new-energy-vehicle industrial-chain development capacity and green innovation are key drivers of enhanced system coupling coordination, and that their development quality directly impacts the effectiveness of synergistic evolution.
3.3. Spatial and Temporal Evolution Analysis of Coupling Coordination Degree
3.3.1. Characteristics of Time Evolution
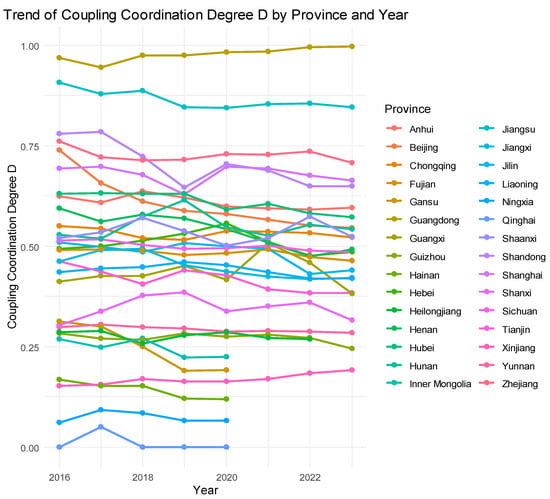
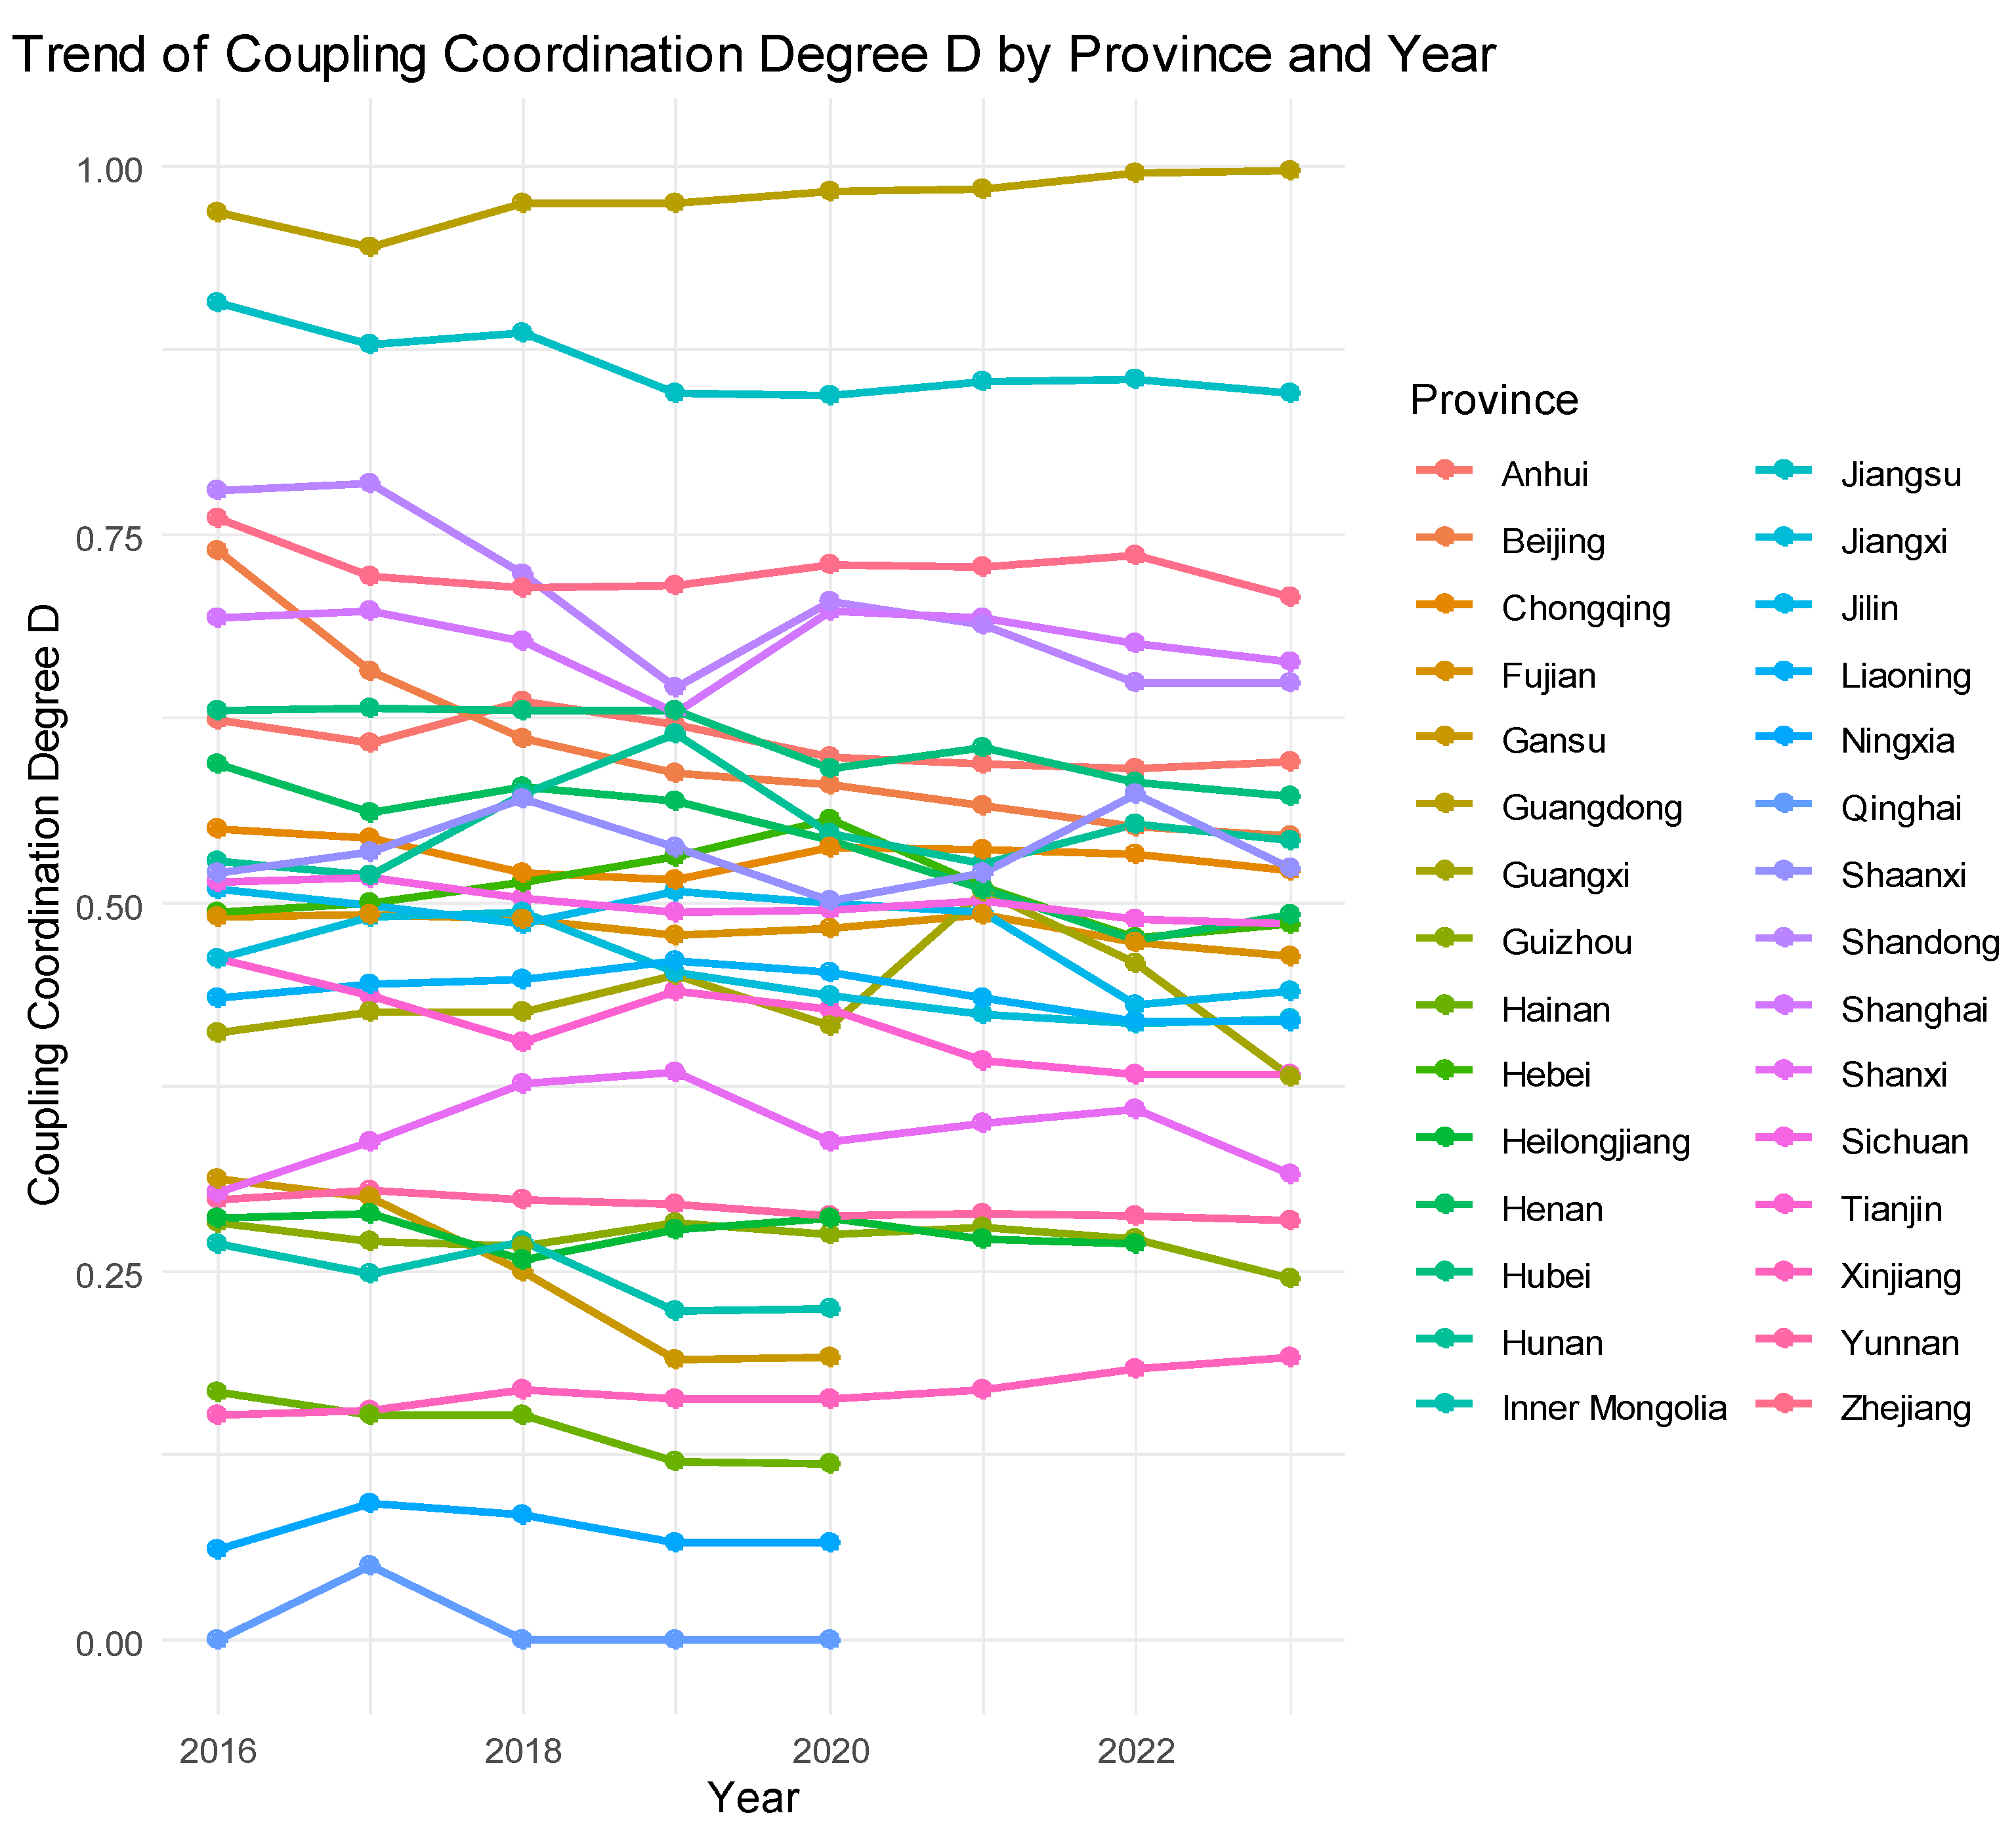
Based on provincial panel data and time-series trend charts (Figure 2) from 2016 to 2023, this study analyzes the evolutionary patterns of dual-system coupling coordination in the new-energy-vehicle industry across time. From 2016 to 2020, the sector experienced a period of simultaneous large-scale expansion and transformational adjustment, characterized by prominent core technological bottlenecks, an underdeveloped upstream–downstream supply-chain ecosystem, raw material price volatility, supply-chain instability, and pandemic impacts, leading to a decline in coupling coordination across most provinces and increasingly evident conflicts between industrial-chain development and green innovation. After 2020, with improved policies, continuous breakthroughs in key component technologies, accelerated industrial chain integration, strengthened green and low-carbon requirements under the Dual Carbon goals, and accelerated automotive industry innovation, regional coupling coordination gradually improved, marking the entry of dual-system collaboration into a phase focused on quality enhancement and efficiency improvement.
Figure 2.
Time-series trends in the coupling coordination degree across provinces.
Among the eastern coastal provinces, Guangdong, Jiangsu, and Zhejiang have maintained a consistently high level of coupling coordination with minimal fluctuations, demonstrating a solid foundation for systematic collaboration and mature linkage mechanisms between their two subsystems, along with relatively stable annual trends. Provinces at medium levels generally exhibit a phased pattern of initial decline followed by improvement; as industrial structures are optimized, green policies are implemented, and innovation investments increase, their coupling coordination has progressively recovered and enhanced. Provinces with low coordination levels start from weak foundations, while some western provinces have long exhibited low coupling coordination levels with more pronounced periodic fluctuations, experiencing relatively slow progress in coordination improvement due to factors such as geographical constraints, underdeveloped industrial systems, and insufficient innovation resources. Nationwide, plausibly associated with policy initiatives and industry cycles, a trend toward coordinated optimization is emerging.
3.3.2. Spatial Distribution Characteristics
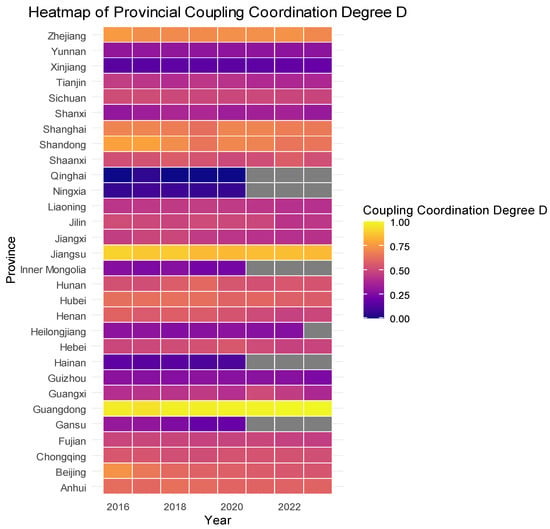
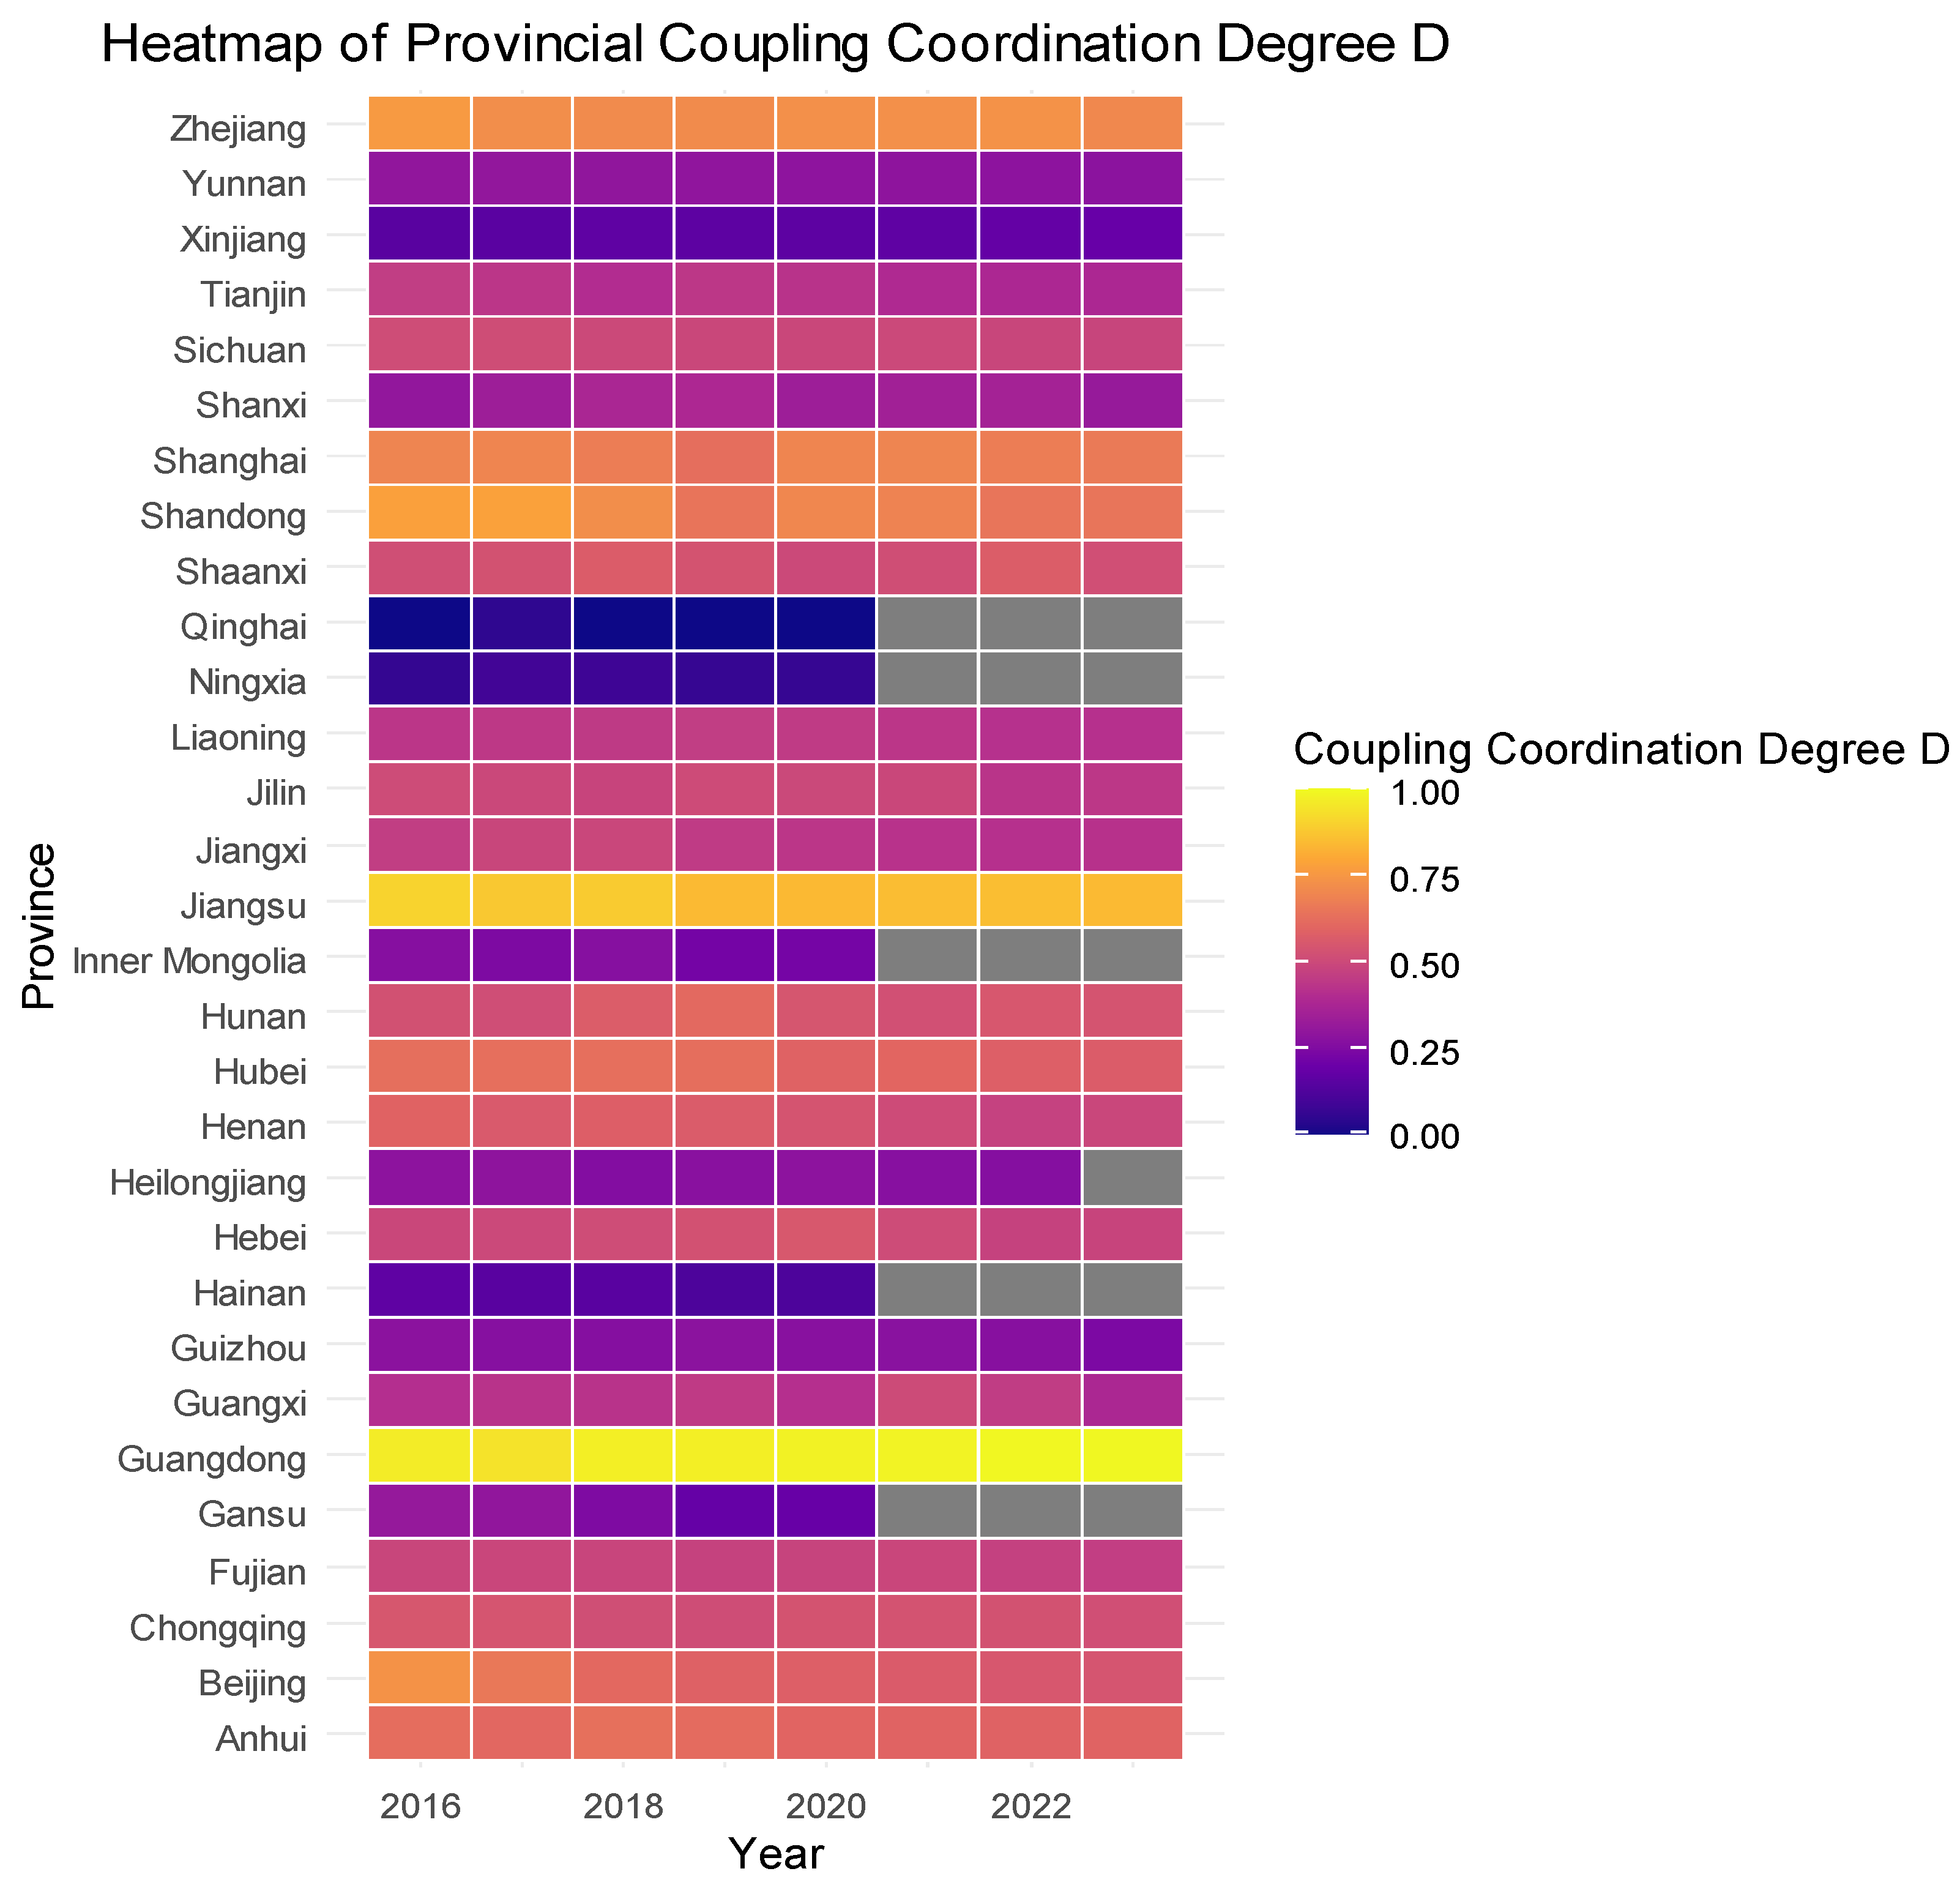
As shown in the spatial distribution heatmap of provincial coupling coordination degree shown in Figure 3, this study reveals that the coupling coordination between the resilience of China’s new-energy-vehicle industry chain and green innovation exhibits a gradient differentiation pattern, with higher values in the eastern regions and lower values in the western regions.
Figure 3.
Spatial distribution heatmap of coupling coordination levels across provinces.
The eastern coastal provinces exhibit predominantly warm color tones and demonstrate significantly higher coupling coordination values. Provinces such as Guangdong, Jiangsu, Zhejiang, and Shandong have consistently remained within the high-coordination range, constituting the core regions of national coordinated development. Leveraging their first-mover advantages, these areas possess a comprehensive industrial system, concentrated innovation resources, swift implementation of green transformation policies, outstanding synergistic effects between new-energy-vehicle industrial-chain development capacity and green innovation, and a solid spatial advantage. The central provinces generally display moderate color tones with medium-level coupling coordination, exhibiting relatively narrow inter-provincial disparities and a more balanced spatial distribution. Leveraging their geographical advantages, western regions have systematically absorbed industrial transfers from the eastern part of China. The new-energy-vehicle manufacturing sector has continued to expand in scale, gradually forming a stable intermediate tier. Overall, the regional color palette exhibits a predominantly cool tone, particularly in provinces such as Qinghai, Gansu, and Guizhou, where hues remain darker and coordination levels have long been suboptimal. Constrained by geographical conditions, industrial structures, talent availability, and technological capabilities, these provinces suffer from incomplete industrial chains, limited investment in green innovation, significant gaps in coordinated development between major industrial systems, and pronounced spatial development disparities. From a temporal and spatial perspective, between 2016 and 2023, the overall color scheme across provinces showed gradual improvement, with colors in central and western regions shifting from cool to warm tones. This indicates that advancements in regional coordination strategies, green and low-carbon policies, and new-energy industry deployment have steadily enhanced collaboration among less developed areas. Nevertheless, some provinces also experience temporary declines in individual years, and descriptive statistics alone cannot confirm sustained narrowing of regional gaps.
3.4. Analysis of Regional Heterogeneity in the Eastern, Central, and Western Regions
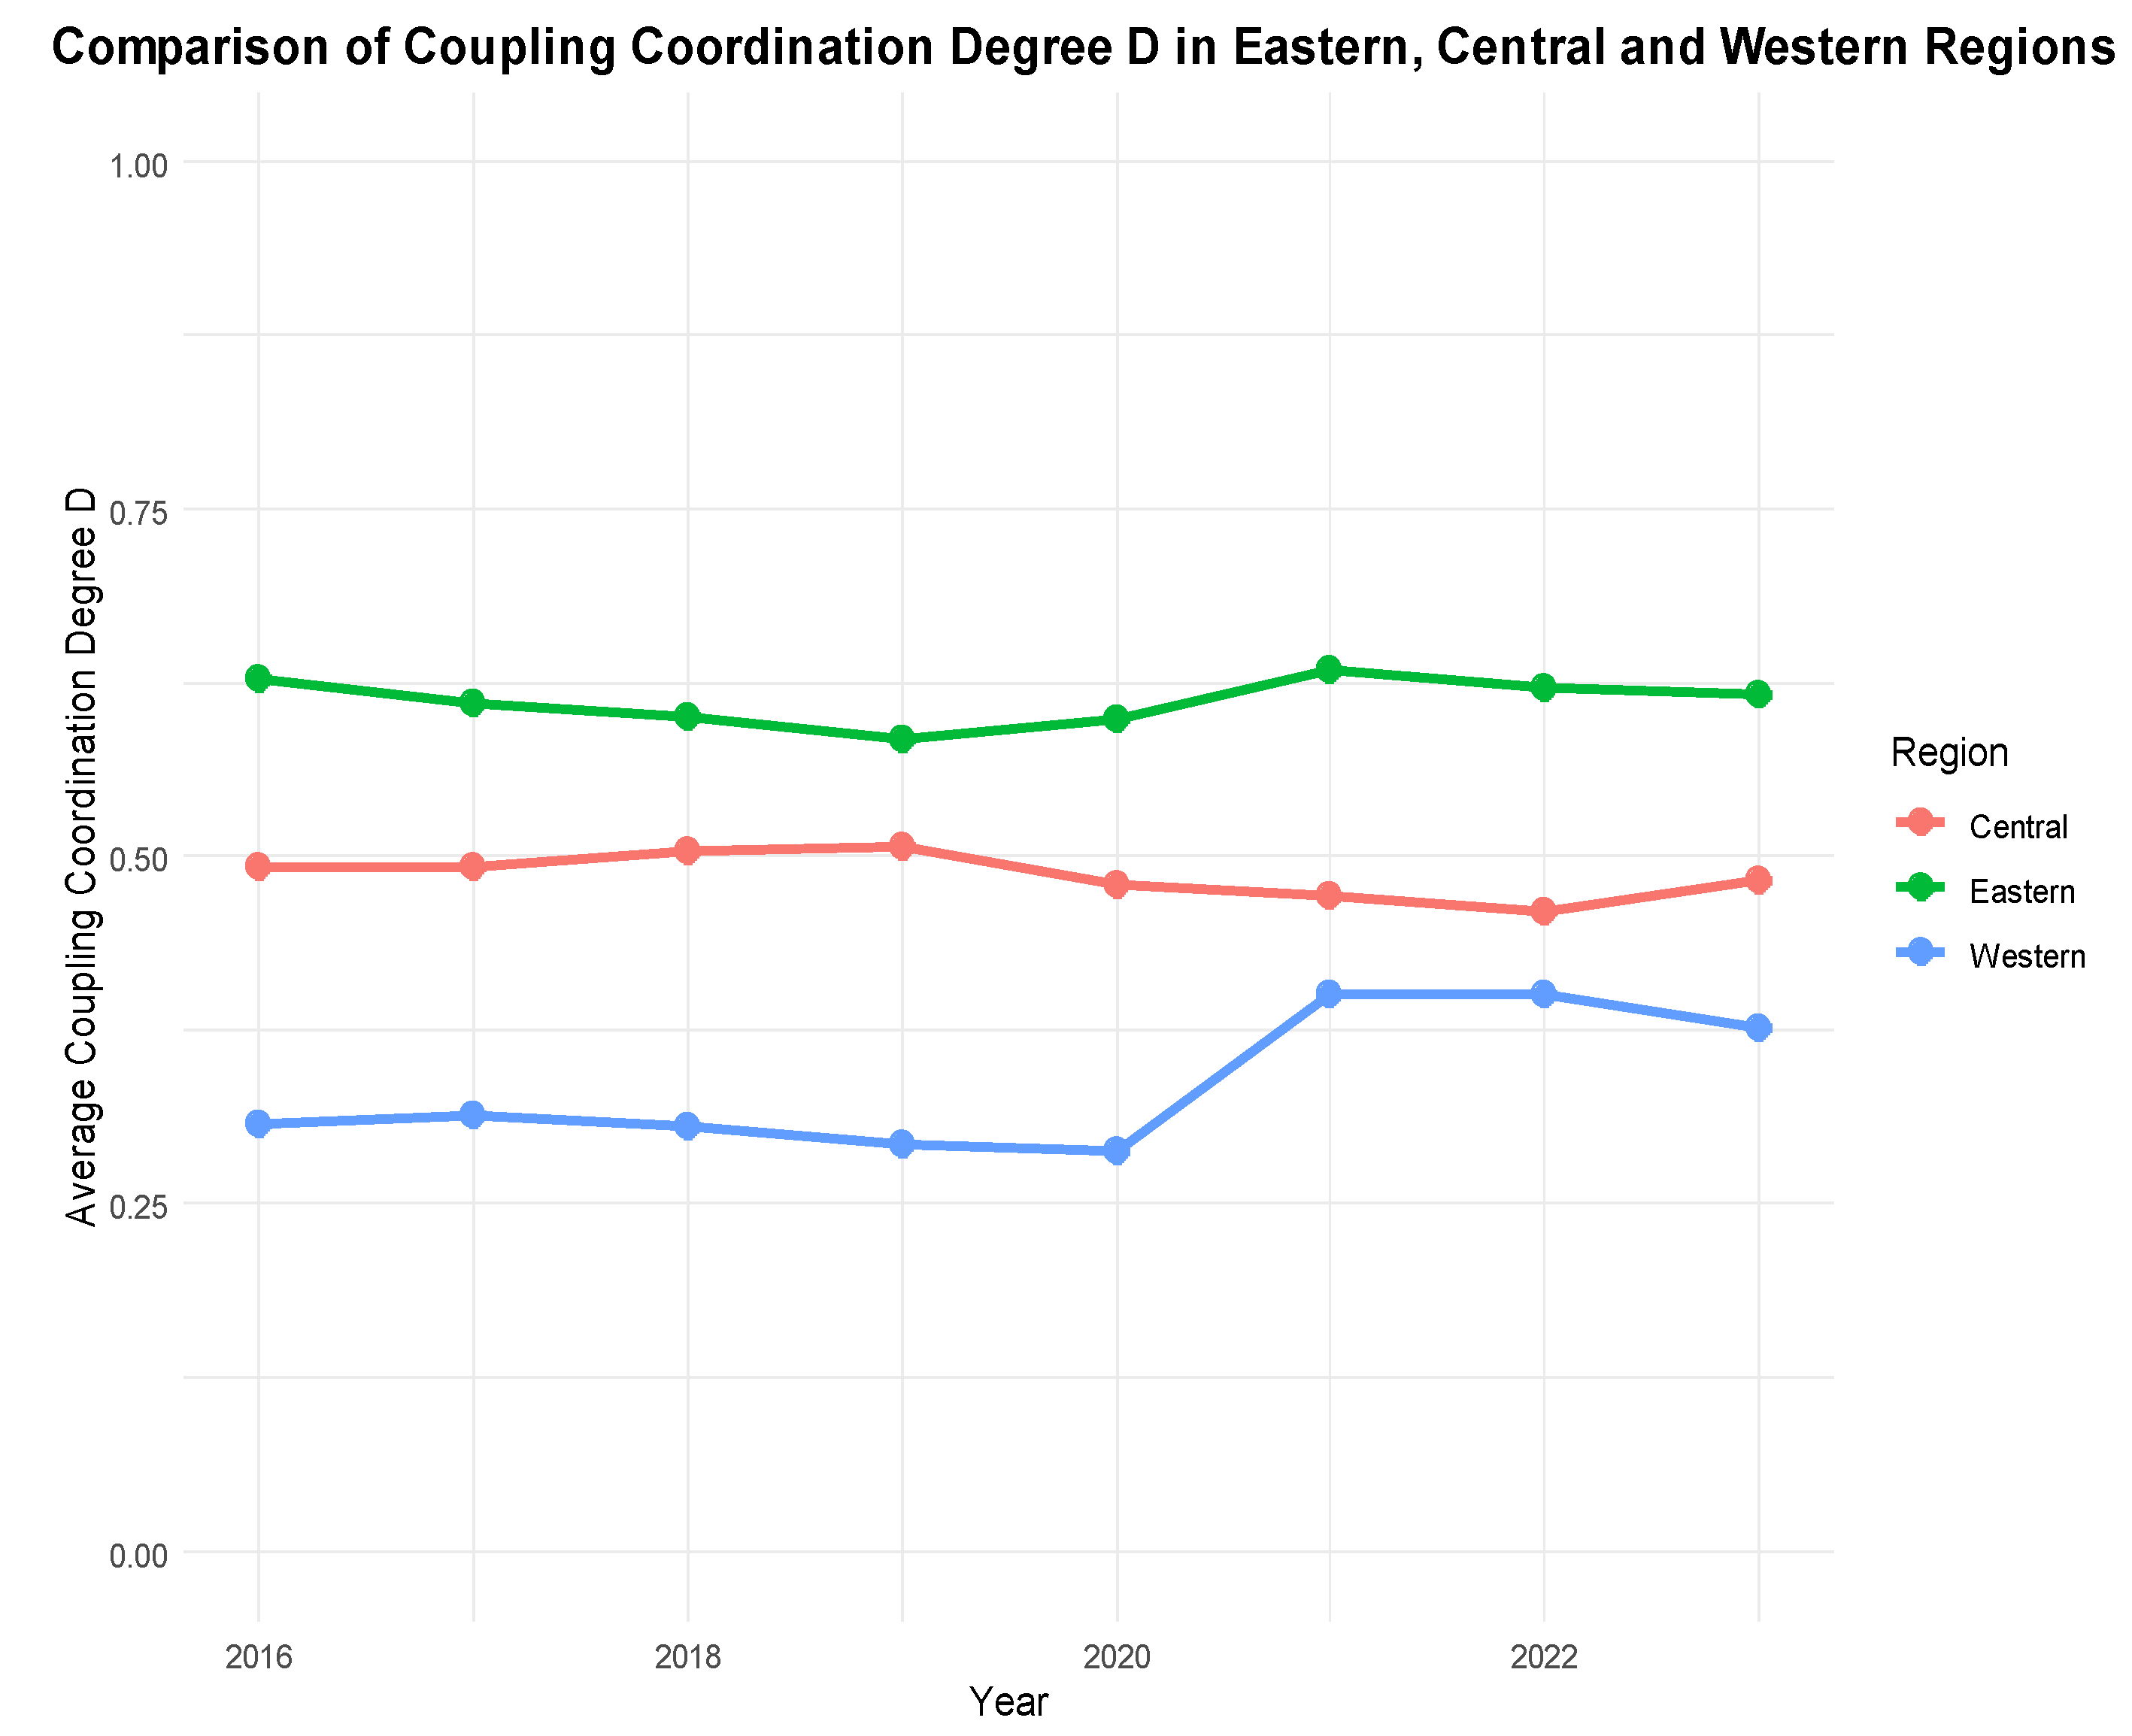
This study adopts the official regional division criteria of the National Bureau of Statistics to categorize provincial samples nationwide into three major regions—eastern, central, and western—calculating the annual average coupling coordination index for each region from 2016 to 2023. The results are presented in Table 4. The coupling coordination index for the eastern region remained within the range of (0.585, 0.635). Most years fall within the good-coordination range, with the new-energy-vehicle industry demonstrating prominent advantages such as comprehensive supporting infrastructure, concentrated innovation resources, and pioneering policy pilots. The industrial chain exhibits deeper integration of resilience and green innovation, while its collaborative development quality leads nationwide. The central region maintains stable coupling coordination levels (0.460–0.507), yet remains near the imbalance state. Despite steady industrial expansion driven by locational and resource advantages from eastern regions, it suffers from relatively weak high-quality innovation capabilities and insufficient momentum for green transformation, reflecting significant challenges in system synergy and slow progress in coordinated development. Western regions generally exhibit lower coordination levels, having long operated in a mildly imbalanced state until 2021 when values surpassed 0.400, indicating modest improvement. Constrained by weak industrial foundations, talent shortages in innovation, and incomplete industrial chains, western regions still lag significantly behind their eastern and central counterparts in collaborative development.
Table 4.
Comparison of average coupling coordination values across eastern, central, and western regions.
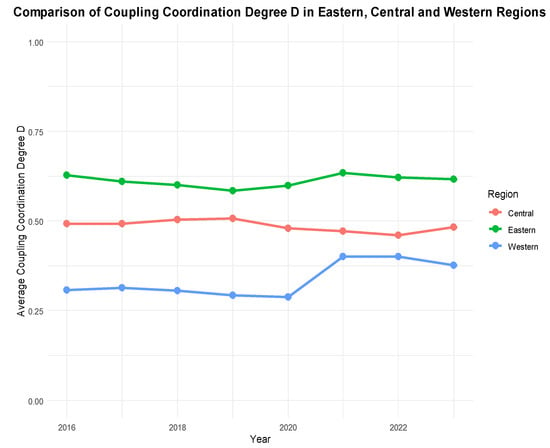
Based on the analysis of regional averages in Table 4 and Figure 4, the coupling coordination degree between the dual systems of China’s new-energy-vehicle industry exhibits a gradient pattern characterized by “leading performance in the eastern region, transitional development in the central region, and lagging progress in the western region”. ① The eastern region has an early start in the new-energy-vehicle industry, high clustering intensity, a well-developed industrial chain, and dense green innovation R&D platforms; its coupling coordination degree has remained consistently stable within a favorable range over the long term, demonstrating outstanding advantages in both integration depth and collaboration quality. ② The central region follows. Leveraging its geographical advantages, the region has attracted the relocation of the new-energy-vehicle industry from eastern China, leading to sustained expansion in industrial scale. However, high-end green innovation and value-added enhancement remain insufficient, with industrial coordination persistently operating at a state of near-disbalance and limited momentum for upgrading. This phenomenon stems from a dual interaction between the scale effects of industrial relocation and constraints on local green innovation capabilities [24]. ③ The western region’s new-energy industry development started relatively late, facing significant challenges such as fragmented industrial chains and inadequate green technology reserves, having long remained in a state of mild imbalance. In recent years, with policy support, new-energy projects have shown modest improvement, yet coordinated development remains notably weak. The domestic eastern region has achieved good coordination, but still lags behind the high levels of collaboration seen in mature industrial clusters in Europe and the United States. Key shortcomings include insufficient autonomy in core technologies and an imbalance in cross-regional innovation allocation.
Figure 4.
Comparison of trends in coupling coordination levels across eastern, central, and western regions.
3.5. Robustness Test
To mitigate measurement biases arising from subjective assignment of indicator weights, this study employs a method of reconstructing differentiated indicator weights for robustness testing. The equal-weight calculation results (baseline-D) serve as the baseline group; by replacing the indicator weights and recalculating the coupling coordination index (robust-D), a control group is formed for comparison. As shown in Table 5, the results indicate that both before and after weight adjustment, the coupling coordination values across eastern, central, and western regions exhibited minimal deviations across years, demonstrating good data fit. In the temporal dimension, the waveforms of the three major regions show consistent dynamic cycles, rising-and-falling nodes, and evolutionary trends. The segmental characteristics show no significant deviation. In the regional dimension, the spatial pattern of gradient differentiation across eastern, central, and western regions remains stable, with neither fundamental changes observed in relative regional disparities nor in the classification of coordination levels, and issues such as regional ranking reversals or pattern deviations are virtually absent. This verification confirms that the core conclusions of this study regarding the spatiotemporal evolution patterns, spatial distribution characteristics, and regional heterogeneity of the coupling and coordination between the resilience of the new-energy-vehicle industry chain and green innovation remain unchanged despite adjustments to indicator weights, demonstrating strong robustness of the findings.
Table 5.
Comparison of robustness tests for the eastern, central, and western regions.
In this robustness test, the entropy-weight method is adopted to generate alternative weight sets for each tertiary indicator. Comparing baseline equal-weight results and entropy-weight results, provincial rank order only generates minor shifts without large-scale rank reversal, and the east–central–west spatial gradient pattern remains stable. Further robustness checks such as alternative normalization approaches and leave-one-indicator-out tests can be carried out in follow-up research.
4. Discussion
4.1. Interpretation of Spatiotemporal Coupling Characteristics
The empirical results reveal a universal “high coupling, low coordination” pattern across Chinese provinces from 2016 to 2023. The high coupling coefficient () verifies tight intrinsic linkage between new-energy-vehicle industrial-chain development capacity and green innovation, consistent with the two-way interaction mechanism elaborated in Section 1.2. However, the average coupling coordination degree merely reaches 0.479 (barely unbalanced), primarily due to the backwardness of industrial-chain resilience ().
Temporally, the coordination level declined before 2020 and rebounded afterward. Prior to 2020, immature supporting chains and raw material volatility restrained the synchronous advancement of the two subsystems. After 2020, breakthroughs in core components and stricter Dual Carbon constraints jointly lifted coordinated development. Spatially, the east–central–west gradient distribution persists, as eastern regions own integrated industrial clusters and sufficient R&D resources to realize well-coordinated status, while western areas suffer fragmented supply chains and insufficient innovative inputs. Though central and western provinces have periodic improvement, regional gaps remain prominent, which aligns with the domestic–foreign development-gap logic proposed earlier: mature overseas new-energy-vehicle clusters maintain sustained high-level coordination without severe regional stratification, whereas China’s unbalanced resource allocation creates obvious hierarchical differences in coupling performance.
It should also be noted that composite index scores are partially correlated with provincial economic scale. Wealthier provinces tend to achieve higher values in both subsystems. Although the pooled-sample min–max normalization partly eliminates absolute magnitude differences, scale confounding effects cannot be completely removed. Future research may adopt per-capita or per-GDP normalized sub-indicators for further sensitivity analysis.
4.2. Impacts of Domestic Policy Shocks
The heterogeneity embedded in the robustness analysis further illustrates how domestic policy disturbances shape coupling coordination performance. Domestic new-energy-vehicle purchase tax incentives act as demand-side stimuli that boost the development of both subsystems during the full exemption period (2016–2020), which accelerates the improvement of coupling coordination degree. After the policy began to phase out from 2021 onward, the growth rate of D slowed moderately, but the long-term upward evolutionary trend was not reversed.
It should be noted that this study lacks detailed provincial export-risk data to carry out empirical assessment of cross-border carbon-tariff shocks such as CBAM. The EU CBAM entered its transitional phase in October 2023, under which only emission reporting and monitoring obligations are required, while formal carbon tariff collection has not yet been implemented. Quantitative empirical analysis of external carbon-border policy impacts is left for future research with more granular export datasets.
4.3. Comparative Analysis with International Industrial Synergy
There may be potential differences between China and major developed economies in the coordinated evolution of new-energy-vehicle industrial-chain resilience and green innovation. Developed economies generally benefit from mature global supply networks and stable long-term carbon regulatory frameworks, which may affect the coupling characteristics of industrial resilience and green innovation.
In contrast, China’s coordinated development is strongly policy-driven and presents obvious regional differentiation. Fragmented industrial layout, insufficient independent core technologies, and phased adjustments of industrial policies jointly restrict the overall coordination quality. The domestic policy portfolio of the Dual Carbon strategy and supply chain security optimization helps improve coupling performance, yet long-term efforts are still required to mitigate regional resource mismatches and strengthen the autonomy of key industrial links.
It should be emphasized that this paper only conducts empirical measurement for Chinese provincial samples due to the limitation of available cross-country panel data. The above qualitative discussion does not come from systematic international empirical comparison. Future research can collect multi-country data to quantitatively identify cross-national differences in coupling coordination.
4.4. Research Limitations and Future Directions
This paper only measures static coupling coordination based on provincial panel data and conducts grouped heterogeneity tests to identify policy interference, without adopting econometric models to quantitatively decompose the contribution of internal synergy and external policy shocks. Additionally, the analysis stays at the provincial macro level, lacking micro-firm evidence to verify transmission paths between the two subsystems.
Constrained by the publication cycle of the China Automotive Industry Yearbook, the sample period of this study covers 2016–2023. Although partial indicators for 2024 and 2025 can be obtained from the National Bureau of Statistics of China, inconsistent data sources make it impossible to construct a complete and unified panel dataset. Following the sustained expansion of the new-energy-vehicle market after 2023, the coordination level between industrial-chain development capacity and green innovation may exhibit new regional characteristics, which can be further examined in future research once updated statistical data become available.
There are several further limitations. First, our composite indicators cannot fully capture genuine supply-chain resilience and NEV-specific green innovation due to provincial-level data constraints. Second, index scores are partially affected by provincial economic scale, and scale-confounding effects cannot be fully eliminated. Third, in terms of indicator selection, this paper adopts front-end green innovation input and output indicators; subsequent research can further expand the indicator boundary by incorporating innovation commercialization, technology transfer, and entrepreneurial ecosystem data. Fourth, this descriptive index-based study cannot implement formal convergence tests. β-convergence or σ-convergence tests are suggested for future work to examine regional convergence hypotheses. Fifth, comparable cross-national regional datasets are unavailable, so formal international benchmarking using the identical evaluation framework cannot be implemented in the current study. Sixth, this study adopts the traditional coupling coordination model and does not construct a spatial econometric framework to test inter-provincial neighborhood effects and spatial spillover dynamics. Further research can combine spatial models to identify the spillover characteristics of NEV industrial-chain resilience and green innovation. Future research may collect cross-country comparable indicators to carry out international comparison.
5. Conclusions
Based on panel data from 30 provinces (autonomous regions and municipalities) in China from 2016 to 2023, this study employs the coupling coordination model to investigate the relationship between the resilience of the new-energy-vehicle industry chain and green innovation. During the sample period, the overall system presents characteristics of “high coupling but low coordination”: the two subsystems are closely interconnected, while the development capacity of the new-energy-vehicle industrial chain significantly lags behind green innovation, forming a potential imbalance with space for synergistic improvement. The coupling coordination degree shows a fluctuating upward trend on the whole, and regional gradient differentiation, namely that “the eastern region leads, the central region follows, and the western region lags”. Uneven distribution of innovation resources, differences in industrial supporting capacity, and differentiated policy implementation jointly shape such spatiotemporal heterogeneity, and the empirical results do not support a simple regional convergence trend. Some central and western provinces achieve periodic improvement, accompanied by short-term declines in individual years. Robustness tests verify the reliability of the above findings. Compared with mature overseas industries, China still has an overall gap in the coupling level of industrial-chain resilience and green innovation, with collaborative bottlenecks concentrated in core technologies and low-carbon supporting systems.
This paper analyzes the coupled development of China’s new-energy-vehicle industry from two systemic perspectives—new-energy-vehicle industrial-chain development capacity and green innovation—revealing the spatiotemporal evolution characteristics and regional disparities of industrial synergistic development to a certain extent. However, this study has certain limitations. It mainly measures and evaluates the coordination level between the two subsystems, without quantifying the impact intensity of external policy shocks such as the new-energy-vehicle purchase tax and the CBAM (Carbon Border Adjustment Mechanism). Future research can adopt panel regression analysis to distinguish endogenous synergies and exogenous policy contributions more comprehensively, so as to identify key driving factors and underlying mechanisms [25].
Targeted policy suggestions matching the heterogeneous empirical findings are put forward as follows. For eastern regions with leading coupling coordination but slowing marginal growth, local governments should strengthen leadership in high-quality green innovation, break through core low-carbon technologies, and expand overseas market presence while releasing industrial spillover effects for inland areas. For central regions faced with weakened catch-up momentum and late-stage decline in coordination values, policymakers need to optimize industrial supporting systems, improve the transformation efficiency of green innovation achievements, and fill key component innovation gaps. For western regions with low baseline coordination, regions should leverage their resource endowments to develop low-carbon upstream supporting industries, improve industrial carrying capacity, and dynamically adjust coping strategies for external policy shocks.
Author Contributions
Conceptualization, C.Y. and X.L.; methodology, R.Z.; software, Y.W.; validation, X.L., C.Y. and R.Z.; formal analysis, Y.W.; investigation, Y.W.; resources, R.Z.; data curation, X.L.; writing—original draft preparation, Y.W.; writing—review and editing, C.Y.; visualization, X.L.; supervision, R.Z.; project administration, R.Z.; funding acquisition, C.Y. All authors have read and agreed to the published version of the manuscript.
Funding
This work was supported by the Innovation and Development Joint Fund of the Natural Science Foundation of Hubei Province (No. 2026AFC0336) and the Doctoral Scientific Research Foundation of Hubei University of Automotive Technology (No. BK202447).
Data Availability Statement
The raw data supporting the conclusions of this article will be made available by the authors on request.
Conflicts of Interest
The authors declare no conflict of interest
References
- Zhou, M.; Li, X.; Shi, Y. Study on the resilience measurement of the new energy vehicle industry chain. Sustainability 2024, 16, 5184. [Google Scholar] [CrossRef] [Scilit]
- Zhao, C.; Xu, X.; Di, Q.; Wang, B. From defense to strategic control: An indicator framework and DEMATEL–ISM analysis of sustainable resilience in the NEV industry chain. Sustainability 2026, 18, 6596. [Google Scholar] [CrossRef] [Scilit]
- Li, F.; Li, J.; Wang, D. Policy instruments and green innovation: Evidence and implications for corporate performance. J. Clean. Prod. 2024, 471, 143443. [Google Scholar] [CrossRef] [Scilit]
- Guo, Y.; Mao, J.; Liu, Y. Can chain leader green transformation drive supply chain member green innovation? Financ. Res. Lett. 2026, 99, 109978. [Google Scholar] [CrossRef] [Scilit]
- Zhang, Y.; Guo, X. Green innovation spillovers from chain leaders: Effects and mechanisms. Financ. Res. Lett. 2026, 104, 110230. [Google Scholar] [CrossRef] [Scilit]
- Zhang, L.; Bu, W. Resilience measurement, dynamic evolution, and regional differences of industrial chains: A perspective based on the “4R” theory. Stat. Decis.-Mak. 2026, 42, 132–137. [Google Scholar]
- Tian, J. Artificial Intelligence and Industrial Chain Resilience: The Moderating Effect of Intellectual Property Protection. Enterp. Econ. 2026, 45, 61–72. [Google Scholar]
- Guo, Y.; Yan, H. Statistical testing of the impact of artificial intelligence on industrial chain resilience. Stat. Decis.-Mak. 2026, 42, 142–148. [Google Scholar]
- Li, Y.; Liu, W. Dual Environmental Regulations, Green Technology Innovation, and High-Quality Economic Development. Stat. Decis.-Mak. 2025, 41, 75–80. [Google Scholar]
- Wang, X.; Wang, Y. Research on How Green Credit Policies Promote Green Innovation. Manag. World 2021, 37, 173–188+11. [Google Scholar]
- Sun, X.; Du, J. The spatiotemporal evolution and driving factors of the coupling coordination between green production and green living in China. Stat. Decis.-Mak. 2026, 42, 66–71. [Google Scholar]
- Fu, W.; Liu, Y. Research on the Coupling and Coordination between Industrial Digitalization and High-Quality Development of Manufacturing: An Empirical Analysis Based on the Yangtze River Delta Region. East China Econ. Manag. 2021, 35, 19–29. [Google Scholar]
- Shu, X.; Min, Z.; Guo, X.; He, Y.; Zhang, Q. Coupling coordination and driving factors between provincial digital economy and high-quality tourism development. Econ. Geogr. 2024, 44, 197–208. [Google Scholar]
- Fang, K. Structure and function of rural public service platforms: A holistic governance perspective—A theoretical and empirical study from “segmentation by administrative units” to “collaborative coupling”. Rural Econ. 2012, 4, 12–15. [Google Scholar]
- Xu, Y. On the intrinsic relationship between whole-process people’s democracy and democratic centralism. Theor. Explor. 2023, 4, 91–98. [Google Scholar]
- Chen, X.; Liu, Y.; Zhou, K. Research on the pathways of digital economy in enhancing the resilience of China’s industrial chain. Econ. Syst. Reform 2022, 1, 95–102. [Google Scholar]
- Zhang, W.; Li, H.; Zhang, T. Resilience measurement of China’s manufacturing industry chain and its spatiotemporal differentiation characteristics. Econ. Geogr. 2023, 43, 134–143. [Google Scholar]
- Xie, M.; Han, Y. How can domestic manufacturing enterprises achieve a “remarkable transformation” through green innovation?—A multi-case study based on the attention-based perspective. Manag. World 2022, 38, 76–106. [Google Scholar]
- Zhu, P.; Zhu, X. A quantile regression study on the scale effects of human capital investment intensity in corporate innovation. Quant. Econ. Tech. Econ. Res. 2007, 3, 69–80. [Google Scholar]
- Liu, X.; Han, Z.; Fu, N.; Xu, Z. Research on the impact of university R&D output on economic development in Henan Province. J. Henan Inst. Educ. (Philos. Soc. Sci. Ed.) 2023, 42, 89–92. [Google Scholar]
- Zhang, M.; Ren, T.; Huang, S. Research on the patent effects of the selection and cultivation policy for specialized, refined, unique and innovative small giants. China Soft Sci. 2023, 5, 33–43+53. [Google Scholar]
- Luo, L. The impact of environmental fiscal expenditure on total factor productivity: A numerical simulation analysis based on the perspective of factor allocation. China Popul. Resour. Environ. 2023, 33, 38–49. [Google Scholar]
- Gu, L.; Bai, Q.; Zheng, X. Exceeding energy-saving targets lays a solid foundation for the successful conclusion of the 14th Five-Year Plan—Progress in energy conservation work in 2024 and prospects for 2025. China Energy 2025, 47, 45–51. [Google Scholar]
- Chatain, O.; Zemsky, P. The horizontal scope of the firm: Organizational tradeoffs vs. buyer-supplier relationships. Manag. Sci. 2007, 53, 550–565. [Google Scholar] [CrossRef] [Scilit]
- Wang, M.; Ji, Z.; Kang, W.; Chen, Y.; Zhang, Y. Key points, impacts and responses to the EU’s Carbon Border Adjustment Mechanism. China Popul. Resour. Environ. 2021, 31, 45–52. [Google Scholar]

Disclaimer/Publisher’s Note: The statements, opinions and data contained in all publications are solely those of the individual author(s) and contributor(s) and not of MDPI and/or the editor(s). MDPI and/or the editor(s) disclaim responsibility for any injury to people or property resulting from any ideas, methods, instructions or products referred to in the content. |
© 2026 by the authors. Published by MDPI on behalf of the World Electric Vehicle Association. Licensee MDPI, Basel, Switzerland. This article is an open access article distributed under the terms and conditions of the Creative Commons Attribution (CC BY) license.