


Abstract
This study aims to show a detailed life cycle assessment (LCA) approach of battery electric vehicles (BEVs) and internal combustion engine vehicles (ICEVs), with an emphasis on determining the electrical carbon intensity at which these vehicles reach life-cycle greenhouse gas (GHG) parity. The analysis was conducted in openLCA v2.0.3 using the Ecoinvent v3.9.1 database under a European use-phase context, with a functional unit of 150,000 km. BEVs were evaluated for two representative lithium-ion battery chemistries (NMC622 and LFP) under three electricity carbon intensity scenarios (50, 400, and 850 g CO2/kWh), while ICEVs were modeled for both gasoline and diesel pathways. Results show that BEV life-cycle GHG emissions vary between 91 and 221 g CO2-eq/km across different combinations of electricity mix, battery chemistry, and end-of-life conditions. When isolating electricity carbon intensity as the primary variable under a fixed BEV configuration, emissions increase approximately linearly with grid emission factor. Under average European electricity conditions (400 g CO2/kWh), BEVs exhibit lower life-cycle GHG emissions than gasoline ICEVs, whereas under coal-intensive electricity conditions (850 g CO2/kWh) this advantage may be reduced or reversed. The break-even electricity carbon intensity is derived by linear interpolation under a fixed BEV configuration (NMC622, 60 kWh, constant lifetime and EoL conditions), yielding a threshold of approximately 600 g CO2/kWh. The results further indicate that this threshold is influenced by battery chemistry, production-related emissions, recycling efficiency, and assumed vehicle lifetime. These findings highlight the importance of simultaneous progress in electricity decarbonization and end-of-life recycling to secure the environmental benefits of vehicle electrification, and they provide a threshold-oriented framework for policy-relevant interpretation of comparative vehicle LCA results.
1. Introduction
In recent years, increasing attention has been directed toward electric mobility in response to major environmental challenges, including climate change, urban air pollution, and concerns over the long-term availability of fossil fuels [1]. Transitioning from conventional internal combustion engines to alternative propulsion systems, particularly electric vehicles (EVs), is widely recognized as a key strategy for reducing both fossil resource consumption and environmental impacts. In this context, numerous countries have established targets for EV adoption and implemented policy measures to accelerate their market penetration [2].
Within the European Union, transport decarbonization policies aim to significantly reduce the use of combustion-engine vehicles, with long-term strategies targeting their gradual phase-out in urban areas by 2050 [3]. At the global scale, EV adoption has expanded rapidly, with countries such as China and Norway playing a leading role. Although earlier projections had estimated global electric vehicle (EV) sales to reach approximately 4 million in 2020 and 18 million by 2025, recent market developments indicate that EV adoption has progressed more rapidly than previously anticipated. According to the International Energy Agency (IEA), global EV sales exceeded 17 million units in 2024, accounting for more than 20% of total car sales worldwide. Moreover, the annual increase of approximately 3.5 million vehicles in 2024 alone was nearly equivalent to the total global EV sales recorded in 2020, highlighting the accelerating pace of market expansion. A similar acceleration is observed in Europe. Data from the European Alternative Fuels Observatory show that battery electric vehicles (BEVs) accounted for approximately 20% of new passenger car registrations at the beginning of 2026, with projections suggesting that this share may approach 25% by the end of the year if current trends continue [4,5,6,7,8].
Electrification of road transport has therefore become a central component of European climate and energy policy. The European Climate Law establishes a legally binding target to reduce greenhouse gas emissions by at least 55% by 2030, while aiming for climate neutrality by 2050. To support these objectives, EU Member States have introduced a comprehensive set of legislative measures and policy frameworks [9].
The second life applications and recycling of waste batteries are crucial actions that can preempt the potential environmental and social ramifications associated with Lithium-Ion Battery (LIB) manufacturing from virgin feedstocks, concurrently offering a sovereign origin of raw materials [10]. While the availability of recovered materials only constitutes a minor fraction of the overall battery material demand in the near term, it holds the capacity to satisfy more than half of the prospective need for cobalt, a key element in LIB production [11]. However, the environmental superiority of BEVs over conventional internal combustion engine vehicles (ICEVs) depends strongly on several interconnected parameters—namely the carbon intensity of the electricity mix, the battery chemistry and manufacturing process, and the efficiency of end-of-life (EoL) recycling systems [12]. Life cycle assessment (LCA) provides a scientifically consistent method to quantify the cumulative environmental impacts of different powertrain technologies across their full life cycles, from raw material extraction to vehicle disposal.
Previous studies have shown that BEVs can significantly reduce life-cycle greenhouse gas (GHG) emissions compared to ICEVs when powered by low-carbon electricity. Ellingsen et al. (2016) [13] reported that the manufacturing phase of EVs generates a 40% to 90% greater volume of greenhouse gases when contrasted with conventional automobiles. The emission intensity of the energy used—that is, the electricity sources used to charge LIBs and the hydrogen used to proton-exchange membrane fuel cells—determines whether these vehicles can compensate for their high initial environmental burden.
To ensure methodological clarity, this study is fully based on a process-based Life Cycle Assessment (LCA) model implemented in openLCA v2.0.3 using the ecoinvent v3.9.1 database with the cut-off system model. While previous studies such as Bieker (2021) [14] provide important reference frameworks, they were used solely for benchmarking purposes and not as primary data sources. All inventory data and modelling assumptions in this study are derived from Ecoinvent datasets to ensure internal consistency and reproducibility. There is a lack of thorough, scenario-based comparisons that incorporate electrical mix variation, battery chemical variety, and recycling system efficiency under a single methodological framework, despite a wealth of research on the topic of this study in the literature. This study aims to fill these gaps by conducting a comparative LCA of BEVs and ICEVs using openLCA v2.0.3 and Ecoinvent v3.9.1, covering cradle-to-grave impacts under three electricity mixes: EU-average (400 g CO2/kWh), coal-dominant (850 g CO2/kWh), and renewable-intensive (50 g CO2/kWh). The research also evaluates the influence of two battery chemistries (NMC622 and LFP)—selected for their suitability in transportation [15,16]—along with two end-of-life (EoL) management routes (linear vs. circular recycling) on the overall global warming potential (GWP) and resource depletion. The findings of this study contribute to the ongoing debate surrounding the true environmental performance of electric mobility. The findings offer policy-relevant insights into how grid decarbonization, battery innovation, and circular material flows collectively impact the sustainability of future transportation systems by combining sensitivity and uncertainty studies. This study addresses this gap by explicitly deriving such a threshold under controlled modeling assumptions and contributes to the literature in three key ways:
- (i)
- To quantify the break-even electricity carbon intensity at which BEVs outperform ICEVs under consistent system boundaries,
- (ii)
- To evaluate the combined influence of capacity, battery chemistry, and recycling efficiency within a unified modeling framework,
- (iii)
- To provide a transparent threshold-based interpretation of BEV environmental performance, enabling more policy-relevant insights than binary comparisons.
Life Cycle Assessment Approach
According to ISO 14040:2006 and ISO 14044:2006, life cycle assessment (LCA) is a standardized approach for assessing environmental consequences over a product’s whole life cycle, from raw material extraction to end-of-life (EoL) [17,18,19]. It provides a comprehensive framework for assessing transportation technologies by integrating all stages, including material extraction, manufacturing, energy generation, vehicle operation, and EoL processes such as recycling or recovery. All impacts are expressed in CO2-equivalent (CO2e) to ensure comparability across greenhouse gases [20].
LCA has been widely used to compare battery electric vehicles (BEVs) and internal combustion engine vehicles (ICEVs). Early studies showed that BEV production, particularly battery manufacturing, leads to higher cradle-to-gate emissions compared to ICEVs [21,22]. However, when electricity supply is decarbonized, BEVs can achieve significantly lower life-cycle emissions. Electricity carbon intensity is therefore the dominant factor influencing BEV performance, with emissions decreasing approximately linearly as renewable energy penetration increases [12,14]. In addition, key modeling assumptions such as battery lifetime, driving conditions, and recycling efficiency have been shown to strongly affect comparative outcomes [23].
In this study, LCA modeling was performed using openLCA v2.0.3 with Ecoinvent v3.9.1 (cut-off system model) under European Union conditions. The system includes raw material extraction, vehicle production, electricity generation, use-phase operation, and EoL recycling. The ReCiPe 2016 Midpoint (H) method was applied, focusing on global warming potential (GWP), cumulative energy demand (CED), and metal depletion (MD). As a functional unit, one mid-size passenger vehicle driven 150,000 km was determined [24,25].
Circular loops prevent the loss of embedded energy and reduce primary resource extraction, directly supporting EU sustainability frameworks such as the Circular Economy Action Plan and Fit-for-55 objectives [26].
System boundaries were divided into three phases: (i) production, including material extraction and vehicle assembly; (ii) use phase, covering electricity or fuel consumption; and (iii) EoL phase, including dismantling, material recovery, and recycling. Scenario modeling included three electricity pathways and two EoL options (linear disposal and circular recycling), where recycling credits were assigned for recovered materials (Al, Cu, Fe, Li, Ni, Co).
Beyond conventional comparisons, this study introduces a threshold-oriented interpretation of life-cycle greenhouse gas emissions. Rather than focusing only on absolute values, it identifies the electricity carbon intensity levels at which BEVs become environmentally competitive with ICEVs. By integrating electricity mix scenarios, battery chemistries, and recycling pathways, the analysis defines the conditions under which electrification provides climate benefits. This approach offers a more decision-relevant perspective by linking LCA results with practical transition thresholds within the European transport system.
Previous research has offered insightful comparisons between BEVs and ICEVs. Many studies approach battery chemistry and recycling impacts separately, apply inconsistent system limits, or fail to clearly define break-even criteria. The necessity for an integrated, threshold-based assessment methodology is driven by these inadequacies. To maintain uniformity and comparability, this research concentrates on a typical C-segment passenger car. This method offers a controlled baseline for assessing relative differences, but it restricts the generalizability of results across all vehicle types and driving situations. The research does not specifically take into consideration variances like urban congestion, high-speed driving, or individual driving behavior because it is predicated on typical driving circumstances. Future research should take these aspects into account since they may have an impact on actual energy use.
2. Methodology
2.1. Goal and Scope
This study’s main goal is to compare the life cycle assessments (LCAs) of internal combustion engine cars (ICEVs) and battery electric vehicles (BEVs), with an emphasis on the environmental effects of each from raw material extraction to end-of-life. In order to provide a clear evaluation of the trade-offs between electrified and traditional mobility modes, the study attempts to quantify global warming potential (GWP) along with other important intermediate impact categories. The implications of battery chemistry, the mix of power generated, and recycling techniques on life-cycle emissions and resource efficiency are given special attention.
All life-cycle inventories (LCIs) were modeled using openLCA v2.0.3 (GreenDelta GmbH, Berlin, Germany), a widely used platform for transparent and reproducible LCA studies. The model follows a cradle-to-grave system boundary covering vehicle production, use, and end-of-life (EoL) stages. The Ecoinvent v3.9.1 database and the European Life Cycle Database (ELCD v3.2) were used as the main background data sources to ensure methodological consistency with European energy, material, and supply-chain conditions.
Impact assessment was performed using the ReCiPe 2016 Midpoint (H) method, which enables harmonized comparison across multiple environmental indicators, including global warming potential (GWP), human toxicity, freshwater ecotoxicity, and metal depletion. The methodological framework is consistent with ISO 14040 and ISO 14044 standards for life cycle assessment. All processes were modeled as system processes in openLCA using hierarchical linking to integrate upstream datasets such as cathode material synthesis, refining, logistics, and electricity generation.
The system includes BEV and ICEV configurations designed to deliver equivalent functional performance in terms of vehicle size, power, and lifetime driving distance. Each scenario represents a mid-size C-segment passenger vehicle with comparable aerodynamic and mass characteristics, enabling a consistent cradle-to-grave comparison. Eight representative scenarios were developed to capture variations in battery chemistry, electricity carbon intensity (50, 400, and 850 g CO2/kWh), and end-of-life treatment (linear and circular recycling). These parameters were selected to reflect relevant and realistic conditions for future mobility assessment in the European context.
While use-phase electricity scenarios were defined using representative European grid conditions, upstream processes, including battery production, were modeled using global average datasets from ecoinvent v3.9.1. Therefore, the model represents a hybrid configuration rather than a fully region-specific European supply chain. This should be considered when interpreting the results, as regional differences in manufacturing electricity mixes may affect absolute GWP values.
NMC and LFP battery chemistries were selected to represent two major lithium-ion technologies currently used in passenger electric vehicles. These chemistries differ substantially in material composition, energy density, and environmental impact profile. NMC batteries are widely used due to their high energy density, but they depend on critical raw materials such as nickel and cobalt, which are associated with higher environmental burdens and supply risks. In contrast, LFP batteries contain neither cobalt nor nickel, offering advantages in terms of material availability, safety, and potentially lower environmental impacts, although with lower energy density.
2.2. Functional Unit
The functional unit of this study is defined as 150,000 km of vehicle operation over the lifetime of a mid-size passenger car. This reference was selected to enable a consistent comparison between internal combustion engine vehicles (ICEVs) and battery electric vehicles (BEVs) under equivalent service conditions.
Using sample mid-size passenger car layouts, vehicle classifications were harmonized to enhance comparability. For similar vehicle classes, baseline curb masses were considered to be between 1450 and 1600 kg.
It is known that BEVs often have higher curb masses because of the inclusion of battery systems, which, depending on battery size, can add 300–500 kg to the overall vehicle weight. However, this analysis uses sample energy consumption numbers drawn from European driving circumstances and literature rather than directly simulating car mass variances. This method provides a useful comparative framework for capturing the combined impacts of vehicle mass, drivetrain efficiency, and operating circumstances.
For BEVs, electricity consumption was assumed to range between 0.18 and 0.22 kWh/km. For ICEVs, fuel consumption was assumed to range between 6.0 and 7.0 L/100 km for gasoline vehicles and 4.5 and 5.5 L/100 km for diesel vehicles. These values were selected to represent realistic real-world vehicle performance under average European operating conditions. Although this approach improves comparability, it represents a simplification. Differences in vehicle mass may influence energy consumption under specific operating conditions, particularly during high-load or high-speed driving.
For BEVs, total electricity consumption includes both traction and auxiliary loads, as well as charging losses estimated at approximately 13–21%, based on European grid conditions [27]. For ICEVs, both Well-to-Tank (WTT) and Tank-to-Wheels (TTW) emissions were included, thereby providing a full Well-to-Wheels (WTW) perspective. To maintain structural consistency, all vehicles were modeled with comparable glider components, including body, chassis, suspension, and interior systems, while differences were limited primarily to the powertrain and fuel systems. Drivetrain performance was standardized to comparable levels, with a 150 kW electric motor assumed for BEVs and a 1.6–1.8 L engine for ICEVs. Maintenance activities, including tire replacement, brake wear, and lubricant use, were also included for both vehicle types to ensure cradle-to-grave consistency.
2.3. System Boundary
Figure 1 shows the system boundary of the life-cycle assessment (LCA) approach for battery electric vehicles (BEVs) and internal combustion engine vehicles (ICEVs), covering the full cradle-to-grave life cycle. The system boundary of this study follows a cradle-to-grave framework encompassing all major life-cycle stages of both battery electric vehicles (BEVs) and internal combustion engine vehicles (ICEVs). The modeled processes include raw material extraction, material processing, vehicle manufacturing and assembly, use phase (operation and fuel/energy supply), and end-of-life (EoL) treatment. The model also incorporates upstream and downstream energy flows, including electricity supply chains and fuel pathways, ensuring a consistent cradle-to-grave comparison under different electricity carbon intensity scenarios.
Figure 1.
System boundary of the cradle-to-grave life-cycle assessment for battery electric vehicles (BEVs) and internal combustion engine vehicles (ICEVs), including production, use phase, and end-of-life stages with recycling pathways.
Critical elements including lithium, nickel, cobalt, manganese, copper, and graphite are extracted and refined for the BEV pathway’s upstream operations. These materials are necessary for the creation of cathodes, anodes, and conductors. During the battery production process, these materials are converted into cell and module components. The final vehicle assembly, which includes the glider, electric motor, and inverter system, comes next. During the use phase, energy flows from electricity production through transmission and charging infrastructure to the vehicle’s battery and motor, modeled as the Pump-to-Wheels (PTW) segment. Three electricity-mix scenarios (400, 850, 50 g CO2/kWh) were applied to represent average, coal-intensive, and renewable-intensive grids, respectively.
The ICEV pathway begins with crude oil extraction and transport, proceeds through refining and distribution, and culminates in fuel combustion within the internal combustion engine. Both gasoline and diesel pathways are included, providing comprehensive Well-to-Wheels (WTW) coverage. Production of engine, transmission, exhaust, and fuel-system components are modeled separately, while shared subsystems (body, chassis, electronics) are treated as common across vehicle types. The end-of-life (EoL) stage is divided into two alternative configurations:
- Linear (non-recycling)—minimal recovery, primarily shredding and disposal;
- Circular (recycling)—recovery of Al, Fe, Cu, and Li–Ni–Co materials through established mechanical and hydrometallurgical routes.
In the circular scenario, recovered materials are modeled using a substitution approach that credits the system for avoided virgin production. For batteries, hydrometallurgical recycling yields recovery efficiencies of 80–95% for Ni and Co, 50–70% for Li, and >95% for Cu and Al.
2.4. Background Databases
Background processes were primarily sourced from the ecoinvent v3.9.1 database using the allocation, cut-off system model, complemented by selected datasets from the European Life Cycle Database (ELCD v3.2). Ecoinvent was used as the primary background framework due to its comprehensive coverage, consistent system modeling, and well-documented uncertainty structure. ELCD datasets were incorporated only where no equivalent or representative processes were available in ecoinvent, particularly for specific European electricity and material flows. To ensure methodological consistency, all ELCD-based processes were harmonized with the ecoinvent cut-off system model in terms of system boundaries, functional units, and allocation rules. Electricity generation was modeled based on EU-28 grid compositions, while fuel pathways (gasoline and diesel) were represented using European refinery averages. Logistics, metal processing, and waste-treatment processes were also based on European industrial averages to maintain geographic coherence within the system boundaries.
Battery production was modeled using global average datasets from ecoinvent v3.9.1. This approach was adopted to ensure consistency with available inventory data, as region-specific datasets for battery manufacturing are limited and highly variable. However, since battery production emissions are strongly influenced by electricity carbon intensity, the use of global averages introduces uncertainty. To prevent double counting, substituted ELCD datasets were carefully screened, and overlapping ecoinvent processes were excluded. The final model represents a consistent hybrid database structure anchored in the ecoinvent cut-off system, with selectively integrated ELCD processes.
2.5. Foreground Modelling and Vehicle Subsystems
Foreground models for BEV and ICEV configurations were developed as system processes in openLCA and linked hierarchically to background datasets from ecoinvent v3.9.1.
Each vehicle system was structured into the following sub-assemblies:
- Glider/body structure (steel, aluminum, plastics)
- Powertrain (electric motor and inverter for BEV; engine and transmission for ICEV)
- Battery system (cell, module, and pack levels, including cathode, anode, electrolyte, and cooling system)
- Electronic and auxiliary systems (BMS, lighting, sensors)
- Tires and braking system
- Fluids and maintenance consumables
- End-of-life subsystem (recycling, dismantling, disposal)
The battery subsystem was modeled for two chemistries (NMC622 and LFP), including cathode precursor synthesis, electrode coating, and pack assembly. For ICEVs, engine block casting, transmission machining, and exhaust after-treatment systems (catalyst and DPF) were explicitly represented. Fuel pathways were modeled from crude oil extraction through refining and distribution to combustion, consistent with the Well-to-Wheels framework.
Battery production was modeled using global average datasets from ecoinvent v3.9.1, representing a mix of technologies and geographic regions. Since emissions from battery production are highly sensitive to electricity carbon intensity, this creates uncertainty, and it would be more accurate to interpret the results as representing average conditions rather than region-specific results. End-of-life modeling was based on a system expansion approach. Recovered materials (Li, Ni, Co, Al) were assumed to substitute equivalent primary materials, generating avoided production credits. To ensure consistency with the cut-off system model and prevent double counting, substitution credits were applied only to outputs leaving the system, while all recycling process burdens were fully accounted for within system boundaries. The circular scenario assumes recovery rates of 80–95% for critical materials based on literature values.
2.6. Electricity Mix Scenarios
Electricity data were parameterized to enable scenario switching in openLCA v2.0.3, covering three carbon-intensity levels:
- Average EU mix: 400 g CO2/kWh
- Coal-intensive mix: 850 g CO2/kWh
- Renewable-intensive mix: 50 g CO2/kWh
Each mix was modeled as a separate electricity provider process within openLCA, allowing the user to assign it to both manufacturing and use-phase energy inputs. This structure permits a consistent comparison across policy and decarbonization scenarios.
Electricity generation mix is one of the most decisive factors influencing the life-cycle impacts of battery electric vehicles (BEVs), especially during the use phase and battery production. To capture this variability, three distinct electricity mix scenarios were implemented within the openLCA model. Each scenario represents a different carbon-intensity condition reflecting the potential spectrum of European and global power systems.
- Scenario 1 (EU-Average Mix, 400 g CO2/kWh):The European electricity mix used in this study is based on publicly available statistics from Eurostat and the International Energy Agency (IEA), representing approximate shares of 35% renewables, 25% nuclear, and 40% fossil-based generation for recent years [28]. These statistics comprise approximately 35% renewable sources (wind, hydro, solar), 25% nuclear, and 40% fossil-based generation (coal, natural gas, and oil). This scenario provides the reference condition for current European BEV operation.
- Scenario 2 (Coal-Intensive Mix, 850 g CO2/kWh):The second scenario models a carbon-intensive energy context dominated by coal and lignite combustion, typical of emerging or fossil-dependent economies. It is used to test the sensitivity of BEV life-cycle emissions to unfavorable grid conditions. Electricity production processes for this scenario were created by modifying ecoinvent datasets to reflect 65–70% coal input shares.
- Scenario 3 (Renewable-Intensive Mix, 50 g CO2/kWh):The low-carbon scenario simulates a decarbonized future grid dominated by renewable energy sources (>85%) with minimal fossil contributions. This condition approximates the European 2050 decarbonization target and represents the upper boundary of BEV sustainability potential.
The defined electricity mixes were consistently applied to both use-phase charging and electricity-dependent upstream processes, including battery and vehicle manufacturing, ensuring internal consistency within the system boundary. All scenarios were implemented as parameterized processes in openLCA, enabling automated sensitivity analysis and full traceability of results. This integrated approach allows for the evaluation of how electricity decarbonization influences the life-cycle environmental performance of battery electric vehicles (BEVs) relative to internal combustion engine vehicles (ICEVs). The high-carbon scenario (850 g CO2/kWh) represents electricity systems dominated by fossil-based generation, particularly coal. Although this value exceeds current European averages, it is included as a boundary condition to capture worst-case scenarios and to extend the applicability of the results to regions with carbon-intensive electricity systems. It should therefore not be interpreted as representative of present-day European electricity mixes. Table 1 summarizes the modeled scenarios, which vary by powertrain type, battery chemistry, battery capacity, fuel type, electricity mix, and end-of-life (EoL) management pathway. This scenario structure enables a systematic assessment of how technological configurations and energy sources influence life-cycle greenhouse gas emissions.
Table 1.
Summary of Modeled Scenarios for BEV and ICEV Life-Cycle Assessment.
Use-phase energy consumption is defined explicitly for each vehicle type and scenario. For BEVs, base electricity consumption is set to 18.5 kWh/100 km (0.185 kWh/km) under WLTP-based European driving conditions, excluding charging losses. Charging losses are modeled separately and assumed to range between 13% and 21%, resulting in a total grid electricity demand of 20.9–22.4 kWh/100 km. For ICEVs, fuel consumption is defined as 6.5 L/100 km for gasoline and 5.0 L/100 km for diesel vehicles, consistent with mid-size European fleet averages and adjusted to reflect real-world driving conditions.
In the base case, energy consumption is assumed to be independent of battery chemistry (NMC and LFP). However, a sensitivity adjustment of +5–10% is applied for heavier battery configurations, particularly LFP systems, to account for potential mass-related efficiency penalties. Grid electricity demand is calculated as the ratio of battery-level consumption to charging efficiency (η = 0.79–0.87), ensuring that charging losses are applied only once at the electricity supply stage and are not embedded in base consumption values. All use-phase emissions are calculated by combining these energy consumption values with scenario-specific electricity carbon intensities (50, 400, and 850 g CO2/kWh) for BEVs and well-to-wheels emission factors for ICEVs, ensuring a consistent and transparent representation of operational energy demand across scenarios.
2.7. Impact Assessment Methodology
Environmental impact calculations were performed using the ReCiPe 2016 Midpoint (H) method implemented in openLCA v2.0.3. This method provides a midpoint-oriented characterization framework consistent with ISO 14040:2006 and ISO 14044:2006, enabling transparent comparison across multiple environmental impact categories. The following midpoint indicators were selected:
- Global Warming Potential (GWP, kg CO2-eq)
- Human Toxicity (cancer/non-cancer, CTUh)
- Freshwater Ecotoxicity (kg 1,4-DCB-eq)
- Metal Depletion (kg Fe-eq)
- Cumulative Energy Demand (MJ)
System expansion via substitution was applied to account for material recovery at the end-of-life stage. Recovered materials (Al, Cu, Fe, Ni, Co, Li) were credited by subtracting the avoided impacts of equivalent primary production. A cut-off criterion of 1% of total mass or energy flow was applied to exclude negligible contributions while retaining all significant processes. All results were calculated using ReCiPe characterization factors integrated within openLCA and were normalized to the defined functional unit (per vehicle and per kilometer).
A sensitivity-based uncertainty assessment was conducted using parameter variation within openLCA’s scenario manager. Key parameters included electricity carbon intensity, battery chemistry, and recycling efficiency, enabling identification of the dominant drivers of life-cycle impacts. The ReCiPe method was selected due to its comprehensive midpoint coverage and compatibility with ecoinvent v3.9.1, ensuring methodological consistency and comparability with previous vehicle LCA studies.
2.8. Sensitivity Analysis and Uncertainty Assessment
Sensitivity analysis was performed in openLCA v2.0.3 using parameterized scenario modeling to evaluate the influence of major life-cycle variables on total global warming potential (GWP).
Three parameters were identified as dominant sources of variation: (i) the electricity mix carbon intensity, (ii) the battery chemistry and capacity, and (iii) the recycling efficiency applied in the end-of-life (EoL) phase. Each parameter was varied within realistic technical and policy ranges derived from the European literature [29].
All scenarios were organized as parameterized model variants within openLCA, enabling automated recalculation for each configuration:
- Battery chemistry (NMC622/LFP)
- Electricity mix (50/400/850 g CO2 kWh−1)
- Fuel type (gasoline/diesel)
- End-of-life pathway (linear/recycling)
This structure ensures full reproducibility, allowing downstream verification of the contribution analysis and sensitivity results.
2.9. Decision-Oriented Threshold Definition
This study presents a threshold-based analytical methodology to understand life cycle assessment results in addition to traditional life cycle impact assessment. In terms of life-cycle greenhouse gas (GHG) emissions, this methodology determines the electrical carbon intensity at which BEVs and ICEVs become equivalent. As a result, it offers an open and pertinent statistic for assessing how well electric cars perform environmentally under different electrical and recycling settings. The approach enables direct evaluation of the circumstances in which BEVs retain a climatic advantage over conventional cars by converting life-cycle data into threshold values.
2.9.1. Break-Even Electricity Threshold
A key metric defined in this study is the break-even electricity carbon intensity, which represents the grid emission factor (g CO2/kWh) at which battery electric vehicles (BEVs) and internal combustion engine vehicles (ICEVs) exhibit equal life-cycle greenhouse gas (GHG) emissions.
To evaluate this threshold, the analysis was performed using a fixed BEV configuration (NMC622, 60 kWh) while holding other major parameters constant, including vehicle lifetime, energy consumption assumptions, and end-of-life (EoL) pathway. The break-even condition is defined as the point at which:
where EFgrid denotes the electricity carbon intensity.
GWPBEV(EFgrid) = GWPICEV
In the present model, electricity carbon intensity affects not only the BEV use phase (charging), but also electricity-dependent upstream processes such as battery and vehicle manufacturing. Therefore, he BEV life-cycle GWP can be expressed as a function of electricity carbon intensity:
where GWPfixed includes life-cycle contributions assumed to be independent of the modeled electricity carbon intensity, GWPelec(EFgrid) represents the electricity-dependent contribution from both use-phase and upstream electricity consumption, and GWPEoL corresponds to end-of-life impacts or credits.
GWPBEV(EFgrid) = GWPfixed + GWPelec(EFgrid) + GWPEoL
For interpretive purposes, the relationship between total BEV life-cycle GWP and electricity carbon intensity was assumed to be approximately linear within the modeled range. This assumption is justified because the dominant electricity-sensitive contributions—particularly use-phase charging emissions—scale proportionally with the grid emission factor, while upstream electricity-dependent processes introduce a secondary but directionally consistent effect.
Based on this relationship, the break-even threshold was estimated by interpolation between the modeled electricity scenarios (50, 400, and 850 g CO2/kWh). Under the base-case assumptions, the threshold occurs at ~600 g CO2/kWh, indicating the point at which the BEV and the reference ICEV exhibit equivalent life-cycle GHG emissions.
Across the modeled cases, the break-even threshold ranges between approximately 580 and 620 g CO2/kWh, depending on scenario assumptions. These values should therefore be interpreted as scenario-dependent threshold estimates rather than as a single universal constant. Below this range, BEVs generally provide a life-cycle climate advantage over ICEVs, whereas above it, the benefits are reduced or may be reversed.
The threshold value is influenced by several modeling assumptions, including battery production emissions, vehicle energy consumption, recycling credits, and lifetime distance. In particular, because battery production was modeled using global average background datasets.
In this study, the high-carbon scenario (850 g CO2/kWh) is included not as a representation of current average European electricity conditions, but as a boundary condition representing fossil fuel-dominated electricity systems. Its inclusion is intended to support sensitivity analysis and to illustrate the conditions under which BEV environmental performance may deteriorate under carbon-intensive electricity supply.
2.9.2. Recycling Effectiveness Threshold
In this study, recycling is modeled using a system expansion approach, where recovered materials are assumed to substitute primary (virgin) material production. The recycling process includes the recovery of key materials such as aluminum (Al), copper (Cu), iron (Fe), lithium (Li), nickel (Ni), and cobalt (Co), which are commonly present in battery and vehicle components.
Recovery efficiencies were defined based on literature values, with typical ranges of approximately 80–95% for Ni and Co, and lower values for other materials depending on process conditions. These recovered materials generate environmental credits by avoiding the need for primary material extraction and processing [30].
Two end-of-life scenarios were considered: (i) linear disposal, where no material recovery occurs, and (ii) circular recycling, where recovered materials are reintegrated into the production system. The difference between these scenarios represents the environmental benefit of recycling.
It should be noted that the recycling model does not represent a specific industrial process (e.g., hydrometallurgical or pyrometallurgical), but rather a generalized recycling framework based on material recovery efficiencies and substitution assumptions.
A second threshold indicator evaluates the influence of end-of-life (EoL) recycling efficiency on total life-cycle emissions. Recycling effectiveness is defined as the percentage reduction in total GWP relative to a linear (non-recycling) scenario:
Recycling Benefit (%) = [(GWPno-rec − GWPrec)/GWPno-rec] × 100
Results from the openLCA model show that:
- BEVs achieve up to 10–15% GWP reduction with high-efficiency recycling,
- ICEVs show smaller reductions of 5–14%, due to the absence of battery-related recovery benefits.
The environmental benefits of recycling exhibit a diminishing return behavior, with the majority of gains achieved at recovery rates below approximately 70%, while further increases yield progressively smaller reductions in environmental impacts.
The modeling framework is based on the ecoinvent v3.9.1 cut-off system model, in which recycled material inputs are treated as burden-free at the point of entry, and no upstream production burdens are assigned to secondary materials. End-of-life (EoL) recycling is modeled using a system expansion (substitution) approach, where recovered materials generate credits by displacing equivalent primary material production.
A rigorous distinction is made in order to ensure methodological consistency and avoid duplicate counting in this study: replacement credits are only given to materials that are leaving the system at the end of their life cycle, while no credits are given to recycled inputs that enter the system.
The total life-cycle greenhouse gas emissions are calculated as:
where Creditsrecycling are determined based on the quantity of materials recovered at EoL and the avoided burdens of primary production. No substitution credit is applied to recycled inputs used during production, ensuring that recycling benefits are accounted for only once within the system boundary.
[GWPtotal] = [GWPproduction] + [GWPuse] + [GWPEoL] − [Creditsrecycling]
2.9.3. Calculation of Total GWP
The total GWP values reported in this study were calculated using a process-based life cycle assessment (LCA) model implemented in openLCA v2.0.3. All inventory data were derived from the ecoinvent v3.9.1 database (cut-off system model), which provides standardized datasets for material production, energy systems, and transportation processes. The model covers all relevant life-cycle stages, including raw material extraction, vehicle production, use-phase energy consumption, and end-of-life treatment. Total GWP (g CO2-eq/km) was obtained by aggregating emissions across all life-cycle phases and normalizing the results over a functional unit of 150,000 km.
Impact assessment was performed using the ReCiPe 2016 Midpoint (H) method, which converts life-cycle emissions into CO2-equivalent values based on global warming potential characterization factors. Accordingly, the results presented in Table 2 represent model-based LCA outputs derived from standardized and validated database inputs, rather than direct experimental measurements.
Table 2.
Life-Cycle GWP for all vehicle configurations.
2.9.4. Combined Threshold Interpretation
To capture the interaction between energy and material systems, a combined threshold framework is proposed. This framework considers both electricity carbon intensity and recycling efficiency simultaneously, allowing the classification of vehicle configurations into different environmental performance regimes.
Three general operating regions can be defined:
- Low-carbon region:Electricity intensity < 400 g CO2/kWh and high recycling (>70%)→ BEVs clearly outperform ICEVs
- Transition region:Electricity intensity between 400–600 g CO2/kWh→ Relative performance depends on recycling and battery design
- High-carbon region:Electricity intensity > 600 g CO2/kWh→ BEV advantage is significantly reduced or lost
This classification provides a simplified yet robust interpretation of complex LCA results and enables the identification of policy-relevant pathways for decarbonizing the transport sector.
2.9.5. Policy-Relevant Interpretation
The threshold-based approach allows the translation of detailed LCA results into decision-support metrics. Instead of relying solely on scenario-specific results, stakeholders can evaluate whether a given regional system satisfies the conditions required for effective electrification.
In particular, the analysis highlights the following:
- Grid decarbonization is the primary driver of BEV environmental performance,
- Recycling systems significantly enhance long-term sustainability,
- Both factors must be developed simultaneously to maximize emission reductions.
This framework aligns with European climate targets and provides a practical tool for assessing the effectiveness of electrification strategies under real-world conditions.
3. Results and Discussion
3.1. Life-Cycle Global Warming Potential (GWP) Comparison
The life-cycle global warming potential (GWP) results for all BEV and ICEV configurations are summarized in Table 2. The results are expressed per vehicle and normalized per kilometer (g CO2-eq/km) over a functional lifetime of 150,000 km.
Total GWP values were calculated using the openLCA model based on ecoinvent v3.9.1 datasets and the ReCiPe 2016 Midpoint (H) method. To improve interpretability, the effects of electricity carbon intensity, battery chemistry, and recycling are considered both individually and in combination. Electricity carbon intensity influences both use-phase charging emissions and electricity-dependent upstream processes, battery chemistry primarily affects production-related impacts, and recycling reduces end-of-life burdens through avoided primary material production.
The results indicate that battery electric vehicles (BEVs) generally outperform internal combustion engine vehicles (ICEVs) under average and low-carbon electricity conditions. Under the EU-average electricity scenario (400 g CO2/kWh), the mid-size BEV equipped with an NMC622 battery exhibits approximately 21–30% lower life-cycle GWP than the gasoline ICEV reference. Under the renewable-intensive scenario (50 g CO2/kWh), total BEV life-cycle emissions decrease to approximately 91 g CO2-eq/km, corresponding to up to ~50% lower GWP relative to the gasoline baseline.
By contrast, under the coal-intensive scenario (850 g CO2/kWh), BEV life-cycle emissions increase substantially, reaching approximately 221 g CO2-eq/km and exceeding those of the gasoline ICEV by about 21%. This result confirms that the environmental performance of BEVs is highly dependent on electricity carbon intensity and that the climate benefits of electrification may be significantly reduced under carbon-intensive electricity systems.
It should be noted that the values of 91 and 221 g CO2-eq/km correspond to different BEV scenarios that vary not only in electricity carbon intensity, but also in battery chemistry and end-of-life conditions.
End-of-life strategies also have a measurable influence on total life-cycle GWP. The recycling scenario reduces total GWP by approximately 12–16% for BEVs and 5–14% for ICEVs, depending on the modeled configuration. The effect is more pronounced in BEVs because secondary material recovery offsets a larger share of upstream production burdens associated with battery materials. In ICEVs, recycling also provides environmental benefits through the recovery of metals such as steel and aluminum, although the relative improvement remains lower due to the dominance of use-phase fuel-related emissions.
Overall, the results show that the relative environmental advantage of BEVs depends on the combined interaction of electricity carbon intensity, battery-related production burdens, and end-of-life recovery performance. Therefore, comparative interpretation should be made within the context of the modeled scenario assumptions rather than on the basis of a single generalized performance value.
Table 3 illustrates the contribution of each life-cycle stage to total GWP for the representative BEV (NMC622, 400 g CO2/kWh, recycling) and gasoline ICEV (baseline).
Table 3.
Life-cycle stage contribution to total GWP.
The use phase remains the dominant contributor to total life-cycle emissions for both vehicle types, although its relative importance differs significantly. For ICEVs, fuel combustion accounts for more than 70% of total greenhouse gas emissions. In contrast, for BEVs under European-average electricity conditions, the use phase contributes approximately 40–45% of total emissions, while production—particularly battery manufacturing—accounts for around 30–35%.
End-of-life recycling provides a measurable environmental benefit, reducing BEV cradle-to-grave GWP by approximately 15 g CO2-eq/km. However, the magnitude of this benefit is smaller compared to the influence of electricity carbon intensity.
Across the defined electricity scenarios (50, 400, and 850 g CO2/kWh), results clearly demonstrate that electricity carbon intensity is the primary driver of BEV life-cycle performance. Lower-carbon electricity significantly reduces use-phase emissions, while higher-carbon electricity can offset the benefits of zero tailpipe emissions.
Overall, the results indicate that electricity decarbonization and improvements in battery recycling efficiency are the most critical factors for minimizing BEV life-cycle emissions and ensuring their environmental advantage over ICEVs.
3.2. Energy Use and Resource Depletion Analysis
Energy consumption and raw material demand are crucial dimensions in evaluating the overall sustainability of vehicle technologies. While BEVs eliminate direct fuel combustion, they introduce significant upstream energy requirements due to battery and component manufacturing. Conversely, ICEVs rely on continuous fossil fuel consumption during the use phase, making their life-cycle performance heavily dependent on operational energy intensity. The cumulative energy demand (CED) analysis, performed using ReCiPe 2016 Midpoint (H) within openLCA v2.0.3, quantifies total primary energy input across the entire life cycle.
As shown in Table 4, ICEVs exhibit substantially higher total CED values compared with BEVs under both average and renewable electricity scenarios. However, in coal-dominated grids, BEV CED increases due to fossil-based power generation.
Table 4.
Life-cycle cumulative energy demand (CED) results.
Under the average EU mix (400 g CO2/kWh), the BEV exhibits a 15.5% lower cumulative energy demand than the gasoline ICEV. The difference widens to nearly 28% in the renewable-dominated scenario. In contrast, in the coal-intensive case, BEV total energy demand exceeds that of ICEVs by 17.5%. illustrating how fossil-based electricity production can undermine the energy efficiency advantage of electric mobility.
3.3. Metal Depletion and Critical Resource Use
The metal depletion (MD) category provides insight into the long-term resource sustainability of vehicle systems. Table 5 shows that BEVs show higher absolute metal depletion potential than ICEVs, primarily due to the extraction of lithium, nickel, cobalt, and copper used in traction batteries and electric motors. ICEVs, on the other hand, are dominated by iron and aluminum consumption for engine blocks, chassis, and body components.
Table 5.
Life-cycle metal depletion (MD) results (kg Fe-eq/vehicle).
The results indicate that BEV configurations have 25–100% higher metal depletion potential than ICEVs, depending on battery chemistry and recycling efficiency. Among all BEV chemistries, LFP (LiFePO4) shows the lowest metal depletion value due to its cobalt- and nickel-free composition. The NMC622 chemistry exhibit higher depletion levels, reflecting their dependence on critical metals. However, the recycling scenario (EoL-B) substantially mitigates these burdens. By recovering more than 90% of Ni and Co, recycling reduces the metal depletion impact by approximately 20–30% compared with the linear scenario (EoL-A).
From a systems perspective, this indicates that battery chemistry selection and circular material flows are equally important levers as electricity decarbonization in achieving sustainable electric mobility. The openLCA model results confirm that incorporating closed-loop recovery credits can bring BEV metal depletion performance close to ICEV levels in circular economy conditions. While BEVs deliver clear benefits in terms of GWP and operational energy efficiency, their upstream production and material sourcing remain resource-intensive. A fully sustainable transition therefore requires a combination of technological and systemic improvements:
- Low-carbon electricity supply for both manufacturing and use-phase operation,
- Shift to low-impact chemistries such as LFP or solid-state variants,
- Enhanced end-of-life recycling infrastructure to recover critical metals,
- Policy incentives supporting European secondary material markets.
The commitment of the cities participating in the Global Covenant of Mayors (GCoM) is to adopt the necessary measures to achieve a 30–40% reduction in greenhouse gas emissions by 2030, supporting a harmonized and science-based approach to climate action across Europe [31]. These municipal-level climate strategies closely align with the findings of this study, which demonstrate that the integration of low-carbon electricity systems, improved battery chemistries, and high-efficiency end-of-life recycling could collectively reduce the cradle-to-grave energy and resource footprint of BEVs.
Several modeling assumptions adopted in this study may influence the comparative results and should be considered when interpreting the findings.
A fixed vehicle lifetime of 150,000 km is assumed for all vehicle types. Since production-phase emissions are distributed over the lifetime distance, shorter lifetimes increase the per-kilometer impact of manufacturing emissions, particularly for BEVs with higher initial production burdens. For example, reducing the lifetime to 120,000 km would increase production-related emissions per kilometer by approximately 25%, potentially weakening the relative advantage of BEVs.
Battery replacement and second-life applications are not included in the system boundary. Battery replacement would increase total life-cycle emissions due to additional production impacts, whereas second-life applications could partially offset initial burdens by extending battery utilization.
Energy consumption is assumed constant across battery chemistries. However, differences in energy density may affect vehicle mass and thus efficiency. For instance, heavier battery systems (e.g., LFP) may increase energy consumption by approximately 5–10%, leading to higher use-phase emissions, particularly under carbon-intensive electricity scenarios.
Overall, these assumptions introduce uncertainty into the results and highlight the importance of interpreting the findings within the defined system boundaries and parameter choices.
3.4. Sensitivity to Electricity Mix, Battery Chemistry and Capacity, Recycling Efficiency
Sensitivity analysis was performed in openLCA v2.0.3 using parameterized scenario modeling to evaluate the influence of key life-cycle variables on total global warming potential (GWP).
Electricity carbon intensity is identified as the dominant factor affecting the life-cycle performance of BEVs. As shown in Figure 2, BEV emissions increase approximately linearly with electricity carbon intensity due to its direct impact on use-phase emissions. In contrast, ICEV emissions remain relatively constant across scenarios. For the break-even analysis, electricity carbon intensity was varied while keeping the BEV configuration fixed (NMC622, 60 kWh, same lifetime and end-of-life assumption). Because BEV life-cycle emissions rise roughly linearly with electricity carbon intensity under this regulated configuration, it is possible to estimate the break-even point in comparison to gasoline-powered ICEVs. The relative performance of BEVs and ICEVs shifts as a result of this variance. BEVs may have emissions that are similar to or somewhat higher than ICEVs under high-carbon energy conditions, whereas BEVs become the unquestionably lower-emission choice in low-carbon electricity systems.
Figure 2.
Comparison of life-cycle GHG emissions (g CO2-eq/km) for BEVs and ICEVs across different electricity carbon intensity scenarios.
The break-even electricity carbon intensity is defined by the junction of the BEV and ICEV curves, as shown in Figure 2. This threshold is ~600 g CO2/kWh in this investigation. BEVs offer a definite climatic advantage below this threshold, but the benefits decrease above it. This threshold is a useful metric for assessing how environmentally beneficial car electrification is under various power grid conditions.
Figure 2 presents the life-cycle greenhouse gas (GHG) emissions of battery electric vehicles (BEVs) and internal combustion engine vehicles (ICEVs) under different electricity carbon intensity scenarios. The results show that BEV emissions are highly sensitive to the electricity mix, increasing as the carbon intensity of the grid rises. Under low-carbon electricity conditions, BEVs exhibit significantly lower life-cycle emissions compared to ICEVs. However, under carbon-intensive electricity scenarios, this advantage is reduced, and in some cases may approach or exceed ICEV emission levels. In contrast, ICEV emissions remain relatively constant across scenarios, as they are not directly influenced by electricity generation.
3.5. Sensitivity to Battery Chemistry, Capacity, Recycling Efficiency
Battery chemistry strongly affects the manufacturing-phase GWP and metal depletion indicators. Among the modeled chemistries, LFP (LiFePO4) consistently exhibits the lowest cradle-to-gate emissions due to the absence of cobalt and nickel, reducing upstream GWP by approximately 20–25% compared with NMC variants.
Battery chemistry influences primarily the production-phase emissions. For example, LFP-based batteries generally result in lower production-related GWP compared to NMC-based systems due to reduced use of critical materials.
When battery capacity increases from 40 kWh to 60 kWh, total manufacturing emissions rise proportionally, yet the per-kilometer impact remains nearly constant if the larger pack extends vehicle lifetime beyond 150,000 km. This indicates that battery durability and lifetime utilization are as critical as chemistry optimization in improving environmental performance.
Recycling benefits are modeled using a combination of the ecoinvent v3.9.1 cut-off system approach and system expansion at the end-of-life stage. Recycled materials entering the system are treated as burden-free, while recovered materials generate credits by displacing equivalent primary production.
The assumed recovery efficiencies for critical battery materials (e.g., Ni and Co at 80–95%) represent literature-based upper-bound values corresponding to advanced recycling performance. In practice, recovery rates may vary significantly depending on recycling technology, feed composition, and operational conditions. For instance, hydrometallurgical processes can achieve high recovery efficiencies under optimized conditions, whereas lower efficiencies may occur in mixed or less controlled systems.
As a result, real industrial performance is expected to provide smaller but still substantial environmental improvements; thus, the presented findings should be considered as an optimistic estimate of the benefits of recycling. The recycling approaches used in this study were designed as best-case or future scenarios to evaluate the potential environmental benefits of highly efficient material recovery. If lower recovery efficiencies were assumed, the end-of-life credits would decrease and the total life-cycle GWP reduction attributed to recycling would be smaller than the values reported in this study.
For ICEVs, the recycling effect is smaller (4–7%) since avoided impacts are limited to steel and aluminum recovery; however, these savings are still non-negligible in cumulative system accounting. Although LFP batteries exhibit lower production emissions due to the absence of nickel and cobalt, their lower energy density may lead to increased vehicle mass or reduced driving range. This trade-off is not fully captured in the present model, as vehicle energy consumption was assumed constant across battery chemistries. Future studies should incorporate vehicle-level modelling to better capture these effects.
Figure 3 illustrates the effect of recycling efficiency on life-cycle greenhouse gas (GHG) emission reductions for both battery electric vehicles (BEVs) and internal combustion engine vehicles (ICEVs). The results show a clear increase in emission reduction as recycling efficiency rises from 30% to 90%.
Figure 3.
Effect of recycling efficiency on total life-cycle GWP reduction for BEV and ICEV configurations.
For BEVs, GWP reduction increases from 5.3 to 18.7 g CO2-eq/km, representing more than a threefold improvement. In comparison, ICEVs exhibit a lower but still notable reduction, increasing from 2.0 to 7.3 g CO2-eq/km over the same range.
The stronger response observed in BEVs is primarily driven by their higher material intensity, particularly the presence of critical metals such as lithium, nickel, and cobalt in battery systems. Increased recovery of these materials generates significant environmental credits by offsetting primary production. In contrast, ICEVs show lower overall reductions due to their more limited material recovery potential.
Consistent with these results, end-of-life treatment has a significant influence on cradle-to-grave performance, particularly for BEVs. Increasing metal recovery rates from 0% (linear scenario) to 95% (high-efficiency recycling) reduces total GWP by approximately 2.8 t CO2-eq per vehicle, corresponding to a reduction of about 15%.
The environmental benefit follows a diminishing return pattern, where the majority of gains are achieved below approximately 70% recovery, while further increases beyond 90% provide smaller marginal improvements. These findings highlight the importance of circular material strategies in reducing life-cycle emissions, especially for electrified vehicle systems. While electricity decarbonization remains the dominant driver, improvements in recycling efficiency provide an additional and complementary pathway for mitigating the environmental impacts of BEVs.
Figure 4 presents a multi-variable sensitivity grid illustrating the combined influence of electricity carbon intensity and recycling efficiency on the life-cycle GHG emissions of BEVs. The results demonstrate that the interaction between electricity mix and recycling produces the strongest synergistic improvement in BEV sustainability.
Figure 4.
Influence of electricity carbon intensity (g CO2/kWh) on life-cycle GHG emissions (g CO2-eq/km) of BEVs under different grid scenarios.
Under renewable-intensive electricity conditions (50 g CO2/kWh) combined with high recycling efficiency (95%), total BEV GWP decreases to below 13 t CO2-eq per vehicle, corresponding to approximately 90 g CO2-eq/km. This represents a reduction of nearly 50% compared to gasoline ICEVs.
In contrast, under coal-dominant electricity conditions with no recycling, this advantage is largely diminished, and BEV emissions approach those of ICEVs. These findings confirm that system-level decarbonization and material circularity must progress simultaneously to fully realize the environmental benefits of electric mobility.
To enable a clear interpretation of results, the effects of electricity carbon intensity, battery chemistry, and recycling are analyzed individually before evaluating their combined impact. Electricity carbon intensity primarily governs use-phase emissions of BEVs, with higher values leading to proportionally higher life-cycle GWP.
Battery chemistry mainly influences production-phase emissions. For instance, LFP-based systems generally exhibit lower production-related impacts compared to NMC-based batteries due to reduced reliance on energy-intensive materials such as nickel and cobalt. Recycling affects the end-of-life stage by providing material recovery credits, thereby reducing overall life-cycle emissions, particularly for battery-intensive systems.
When considered together, these factors exhibit cumulative and interacting effects. Low-carbon electricity combined with high recycling efficiency and lower-impact battery chemistry results in the lowest life-cycle GWP for BEVs. In contrast, high-carbon electricity coupled with limited recycling can significantly diminish or even eliminate the environmental advantage of BEVs.
3.6. Uncertainty Assessment
To evaluate the robustness of the results, a Monte Carlo simulation was performed within openLCA. Key parameters, including electricity emission factors and vehicle energy consumption values, were assigned lognormal distributions. A ±20% variation was applied to electricity emission factors, while ±15% uncertainty was assigned to energy consumption. A total of 1000 simulation runs were conducted. The reported uncertainty ranges correspond to the 95% confidence interval (2.5th–97.5th percentile). No correlations between parameters were assumed, representing a conservative uncertainty estimation.
A sensitivity analysis was conducted to evaluate the influence of recycling assumptions on life-cycle results and threshold values. Three recycling scenarios were considered:
- -
- Conservative case: lower-bound recovery efficiencies (e.g., Ni/Co ~70%, Li ~40%)
- -
- Base case: mid-range values (Ni/Co ~85%, Li ~60%)
- -
- Optimistic case: upper-bound values (Ni/Co ~95%, Li ~70%)
The results show that increasing recycling efficiency reduces total life-cycle GWP by approximately 5–10% for BEVs. In terms of threshold behavior, higher recovery rates shift the break-even electricity carbon intensity upward by approximately 30–80 g CO2/kWh, whereas lower recovery rates reduce this threshold accordingly.
These findings confirm that recycling assumptions are a secondary but non-negligible driver of threshold values, particularly under low-carbon electricity scenarios.
3.7. Threshold-Based Evaluation of BEV Environmental Performance
A threshold-based interpretation was applied to identify the conditions under which battery electric vehicles (BEVs) outperform internal combustion engine vehicles (ICEVs) in terms of life-cycle greenhouse gas (GHG) emissions. The results confirm that BEV environmental performance is strongly dependent on electricity carbon intensity.
Under the EU-average electricity scenario (400 g CO2/kWh), BEV emissions range between approximately 129 and 145 g CO2-eq/km, corresponding to about 21–30% lower GWP than the gasoline ICEV reference. Under the renewable-intensive electricity scenario (50 g CO2/kWh), BEV emissions decrease further to approximately 90–95 g CO2-eq/km, representing up to ~50% lower life-cycle GWP than the gasoline baseline. In contrast, under the coal-intensive scenario (850 g CO2/kWh), BEV emissions increase to approximately 215–225 g CO2-eq/km, exceeding those of the gasoline ICEV and thereby eliminating the life-cycle climate advantage of electrification.
The break-even analysis indicates that BEVs reach approximate life-cycle GHG parity with ICEVs at an electricity carbon intensity of around 580–620 g CO2/kWh, depending on the modeled configuration. Below this threshold range, BEVs generally provide net climate benefits, whereas above it, their relative advantage is reduced or may be reversed.
The inclusion of recycling improves BEV environmental performance by reducing total life-cycle GWP and shifting the break-even threshold upward. Under the modeled recycling assumptions, BEV emissions decrease by approximately 12–16%, corresponding to roughly 15–30 g CO2-eq/km, depending on the vehicle configuration. This indicates that material recovery can partially compensate for higher upstream and electricity-related burdens, although it does not override the dominant influence of electricity carbon intensity.
A combined interpretation of the results shows that BEVs achieve their strongest environmental performance under conditions of low-carbon electricity and effective end-of-life recovery, with total emissions as low as approximately 90–120 g CO2-eq/km. By contrast, under high-carbon electricity and non-recycling conditions, BEV emissions increase substantially and may exceed those of conventional vehicles. These findings demonstrate that vehicle electrification alone is insufficient to ensure climate benefits and that electricity decarbonization and circular material systems must advance simultaneously.
Sensitivity analysis further indicates that the break-even electricity carbon intensity is influenced by assumptions such as vehicle lifetime, energy consumption, and recycling performance. Longer vehicle lifetimes improve BEV performance by distributing production-related emissions over a greater driving distance, whereas shorter lifetimes increase the relative importance of production burdens and reduce the threshold at which BEVs become environmentally favorable.
From a policy perspective, these findings suggest that the environmental effectiveness of electrification depends not only on replacing combustion engines with electric drivetrains, but also on the carbon intensity of the supporting electricity system and the extent to which circular material recovery is implemented. Therefore, the reported threshold of approximately 600 g CO2/kWh has been considered as an indicative decision support metric under the assumptions of this study, rather than a universally transferable value.
Figure 5 presents a threshold map illustrating the conditions under which battery electric vehicles (BEVs) outperform internal combustion engine vehicles (ICEVs) in terms of life-cycle GWP. The x-axis represents electricity carbon intensity (g CO2/kWh), while the y-axis indicates recycling efficiency (%). The color scale shows the GWP difference (ICEV–BEV), where positive values indicate that BEVs are environmentally preferable. The contour line represents the break-even boundary (ΔGWP = 0), at which BEV and ICEV impacts are equal. The results indicate that BEV environmental performance is primarily governed by electricity carbon intensity, while recycling efficiency plays a secondary but still meaningful role. Under high-carbon electricity conditions (above approximately 650 g CO2/kWh), BEVs tend to lose their life-cycle GWP advantage regardless of recycling performance. In contrast, under low-carbon electricity systems (below approximately 400 g CO2/kWh), BEVs consistently outperform ICEVs across a wide range of recycling efficiencies.
Figure 5.
Combined influence of electricity carbon intensity (g CO2/kWh) and recycling efficiency (%) on life-cycle GHG emissions of BEVs.
Higher recycling efficiency expands the region in which BEVs remain environmentally preferable, but it cannot fully compensate for carbon-intensive electricity. Overall, the results confirm that electricity decarbonization is the dominant driver of BEV life-cycle GWP benefits, while improved recycling strengthens—but does not independently determine—this advantage. This threshold-based framework provides a practical decision-support tool for policymakers by identifying the minimum electricity decarbonization and recycling conditions required for sustainable vehicle electrification.
4. Conclusions
This study presents a comprehensive life cycle assessment (LCA) of battery electric vehicles (BEVs) and internal combustion engine vehicles (ICEVs) using openLCA v2.0.3 (GreenDelta GmbH, Berlin, Germany) with the Ecoinvent v3.9.1 database and ReCiPe 2016 Midpoint (H) method. The analysis covers the full cradle-to-grave system, including production, use phase, and end-of-life (EoL) treatment, across multiple scenarios of battery chemistry, electricity mix, and recycling strategies.
Results show that BEVs achieve 20–30% lower life-cycle GWP than gasoline ICEVs under European-average electricity conditions (400 g CO2/kWh), and up to ~50% lower emissions under low-carbon electricity (50 g CO2/kWh). However, under coal-dominated conditions (850 g CO2/kWh), BEVs may exhibit higher emissions, demonstrating that electrification alone is insufficient without concurrent grid decarbonization.
Battery production represents a major share of BEV life-cycle emissions (≈30–35%), while circular EoL strategies can reduce total GWP by up to 15%. At the same time, BEVs exhibit higher metal depletion potential (35–85%) due to reliance on critical materials, highlighting the importance of alternative chemistries and improved recycling efficiency.
Sensitivity analysis identifies electricity carbon intensity and recycling efficiency as the dominant drivers of BEV environmental performance.
These results demonstrate that the environmental advantages of BEVs rely on an integrated system approach that combines efficient recycling infrastructure, sustainable battery production, and energy decarbonization. To improve long-term evaluations of sustainable transportation transitions, future studies should take into account battery second-life uses, dynamic lifecycle analytic techniques, and changing energy systems.
Funding
This research received no external funding.
Data Availability Statement
The original contributions presented in this study are included in the article. Further inquiries can be directed to the corresponding author.
Conflicts of Interest
The author declares no conflicts of interest.
References
- Biresselioglu, M.E.; Demirbag Kaplan, M.; Yilmaz, B.K. Electric mobility in Europe: A comprehensive review of motivators and barriers in decision making processes. Transp. Res. Part A Policy Pract. 2018, 109, 1–13. [Google Scholar] [CrossRef] [Scilit]
- OECD/IEA. Global EV Outlook 2018. In Towards Cross-Modal Electrification; International Energy Agency: Paris, France, 2018. [Google Scholar]
- EEA. Electric Vehicles in Europe EEA Report; 20/2016; European Environment Agency: Copenhagen, Denmark, 2016. [Google Scholar]
- OECD/IAE. Global EV Outlook 2025; International Energy Agency: Paris, France, 2025. [Google Scholar]
- Pontes, J. European EV Market Starts 2026 with 20% BEV Share. 5 March 2026. Available online: https://alternative-fuels-observatory.ec.europa.eu/general-information/news/european-ev-market-starts-2026-20-bev-share (accessed on 24 March 2026).
- EV Progress Report: EV Sales and Affordability Are Reaching a Tipping Point. 12 March 2026. Available online: https://www.transportenvironment.org/articles/ev-progress-report-2026 (accessed on 24 March 2026).
- Ün, Ç. Advance in lithium-ion batteries: An overview. In Advanced in Applied Science and Technology; Iksad Publication House: Ankara, Türkiye, 2023; Chapter 2. [Google Scholar] [CrossRef]
- Electric Cars to Exceed 40% of World Car Sales by 2030 Under Current Policies—IEA. 15 May 2025. Available online: https://www.zemo.org.uk/news-events/news,electric-cars-to-exceed-40-of-world-car-sales-by-2030-under-current-policie_4735.htm (accessed on 24 March 2026).
- European Commission. Sustainable and Smart Mobility Strategy—Putting European Transport on Track for the Future; COM/2020/789 Final EuR-LEX. 2020. Available online: https://eur-lex.europa.eu/legal-content/EN/TXT/?uri=COM:2020:789:FIN (accessed on 24 March 2026).
- Dunn, J.; Kendall, A.; Slattery, M. Electric vehicle lithium-ion battery recycled content standards for the US—Targets, costs, and environmental impacts. Resour. Conserv. Recycl. 2022, 185, 106488. [Google Scholar] [CrossRef] [Scilit]
- Dunn, J.B.; Gaines, L.; Kelly, J.C.; James, C.; Gallagher, K.G. The significance of Li-ion batteries in electric vehicle life-cycle energy and emissions and recycling’s role in its reduction. Energy Environ. Sci. 2015, 8, 158–168. [Google Scholar] [CrossRef] [Scilit]
- Ellingsen, L.A.W.; Hung, C.R.; Strømman, A.H. Identifying key assumptions and differences in life cycle assessment studies of electric vehicles. Environ. Sci. Technol. 2016, 50, 9754–9768. [Google Scholar]
- Ellingsen, L.A.-W.; Hung, C.R.; Majeau-Bettez, G.; Singh, B.; Chen, Z.; Whittingham, M.S.; Strømman, A.H. Nanotechnology for environmentally sustainable electromobility. Nat. Nanotechnol. 2016, 11, 1039–1051. [Google Scholar] [CrossRef] [Scilit]
- Bieker, G. A Global Comparison of Life-Cycle GHG Emissions from Passenger Cars. 21 July 2021. Available online: https://theicct.org/a-global-comparison-of-life-cycle-ghg-emissions-from-passenger-cars (accessed on 24 March 2026).
- Ün, Ç.; Aydin, K.; Garo, J.P.; Coudour, B.; Gentilleau, M. Experimental study of fire suppression for li-ion electric batteries with H2O. Fresenius Environ. Bull. 2021, 30, 790–801. [Google Scholar]
- Un, C.; Aydın, K. Thermal Runaway and Fire Suppression Applications for Different Types of Lithium Ion Batteries. Vehicles 2021, 3, 480–497. [Google Scholar] [CrossRef] [Scilit]
- ISO 14040:2006; Environmental Management—Life Cycle Assessment—Principles and Framework. International Standart of Organization: Geneva, Switzerland, 2006.
- ISO 14044:2006; Environmental Management—Life Cycle Assessment—Requirements and Guidelines. International Standart of Organization: Geneva, Switzerland, 2006.
- Ün, Ç. Examining the environmental and economic dimensions of producing fuel from medical waste plastics. NOHU J. Eng. Sci. 2024, 13, 279–293. [Google Scholar] [CrossRef] [Scilit]
- Vieira, V.; Baptista, A.; Cavadas, A.; Pinto, G.F.; Monteiro, J.; Ribeiro, L. Comparison of Battery Electrical Vehicles and Internal Combustion Engine Vehicles–Greenhouse Gas Emission Life Cycle Assessment. Appl. Sci. 2025, 15, 3122. [Google Scholar] [CrossRef] [Scilit]
- Hawkins, T.R.; Singh, B.; Majeau-Bettez, G.; Strømman, A.H. Comparative environmental life cycle assessment of conventional and electric vehicles. J. Ind. Ecol. 2013, 17, 53–64. [Google Scholar] [CrossRef] [Scilit]
- Notter, D.A.; Gauch, M.; Widmer, R.; Wäger, P.; Stamp, A.; Zah, R.; Althaus, H.-J. Contribution of Li-Ion Batteries to the Environmental Impact of Electric Vehicles. Environ. Sci. Technol. 2010, 44, 6550–6556. [Google Scholar] [CrossRef] [Scilit] [PubMed]
- Accardo, A.; Dotelli, G.; Musa, M.L.; Spessa, E. Life Cycle Assessment of an NMC Battery for Application to Electric Light-Duty Commercial Vehicles and Comparison with a Sodium-Nickel-Chloride Battery. Appl. Sci. 2021, 11, 1160. [Google Scholar] [CrossRef] [Scilit]
- Hausberger, L.; Lutterbach, J.; Gschösser, F. Modeling the Environmental Impact of Passenger Cars Driven on Hilly Roads in Austria: A More Accurate Valuation of Greenhouse Gas Emissions and Further Environmental Indicators for Integral Life Cycle Assessments of Road Infrastructures. Buildings 2024, 14, 263. [Google Scholar] [CrossRef] [Scilit]
- Ternel, C.; Bouter, A.; Melgar, J. Life cycle assessment of mid-range passenger cars powered by liquid and gaseous biofuels: Comparison with greenhouse gas emissions of electric vehicles and forecast to 2030. Transp. Res. Part D Transp. Environ. 2021, 97, 102897. [Google Scholar] [CrossRef] [Scilit]
- European Council. Fit for 55. Available online: https://www.consilium.europa.eu/en/policies/fit-for-55/ (accessed on 24 March 2026).
- Reick, B.; Konzept, A.; Kaufmann, A.; Stetter, R.; Engelmann, D. Influence of Charging Losses on Energy Consumption and CO2 Emissions of Battery-Electric Vehicles. Vehicles 2021, 3, 736–748. [Google Scholar] [CrossRef] [Scilit]
- Eurostat. Energy Statistics—An Overview. May 2025. Available online: https://ec.europa.eu/eurostat/statistics-explained/index.php?title=Energy_statistics_-_an_overview (accessed on 24 March 2026).
- Majeau-Bettez, G.; Hawkins, T.R.; Strømman, A.H. Life Cycle Environmental Assessment of Lithium-Ion and Nickel Metal Hydride Batteries for Plug-In Hybrid and Battery Electric Vehicles. Environ. Sci. Technol. 2011, 45, 4548–4554. [Google Scholar] [CrossRef] [Scilit] [PubMed]
- Gaines, L. Lithium-ion battery recycling processes: Research towards a sustainable course. Sustain. Mater. Technol. 2018, 17, 2018. [Google Scholar] [CrossRef] [Scilit]
- Ün, Ç. Investigation of Alternative Vehicle Applications for Reducing Greenhouse Gas Emissions in Urban Public Transport: The Case of Adana Province. Eur. Mech. Sci. 2023, 7, 220–229. [Google Scholar] [CrossRef] [Scilit]
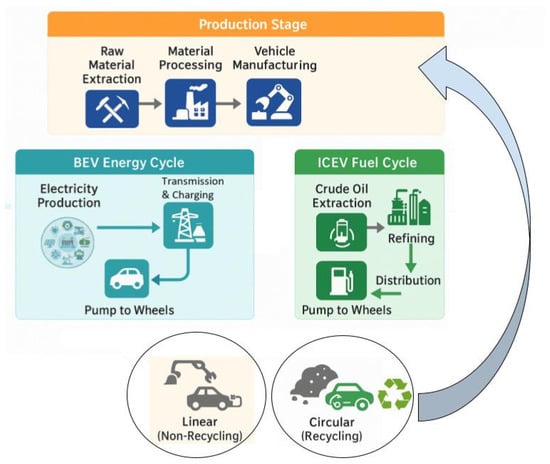
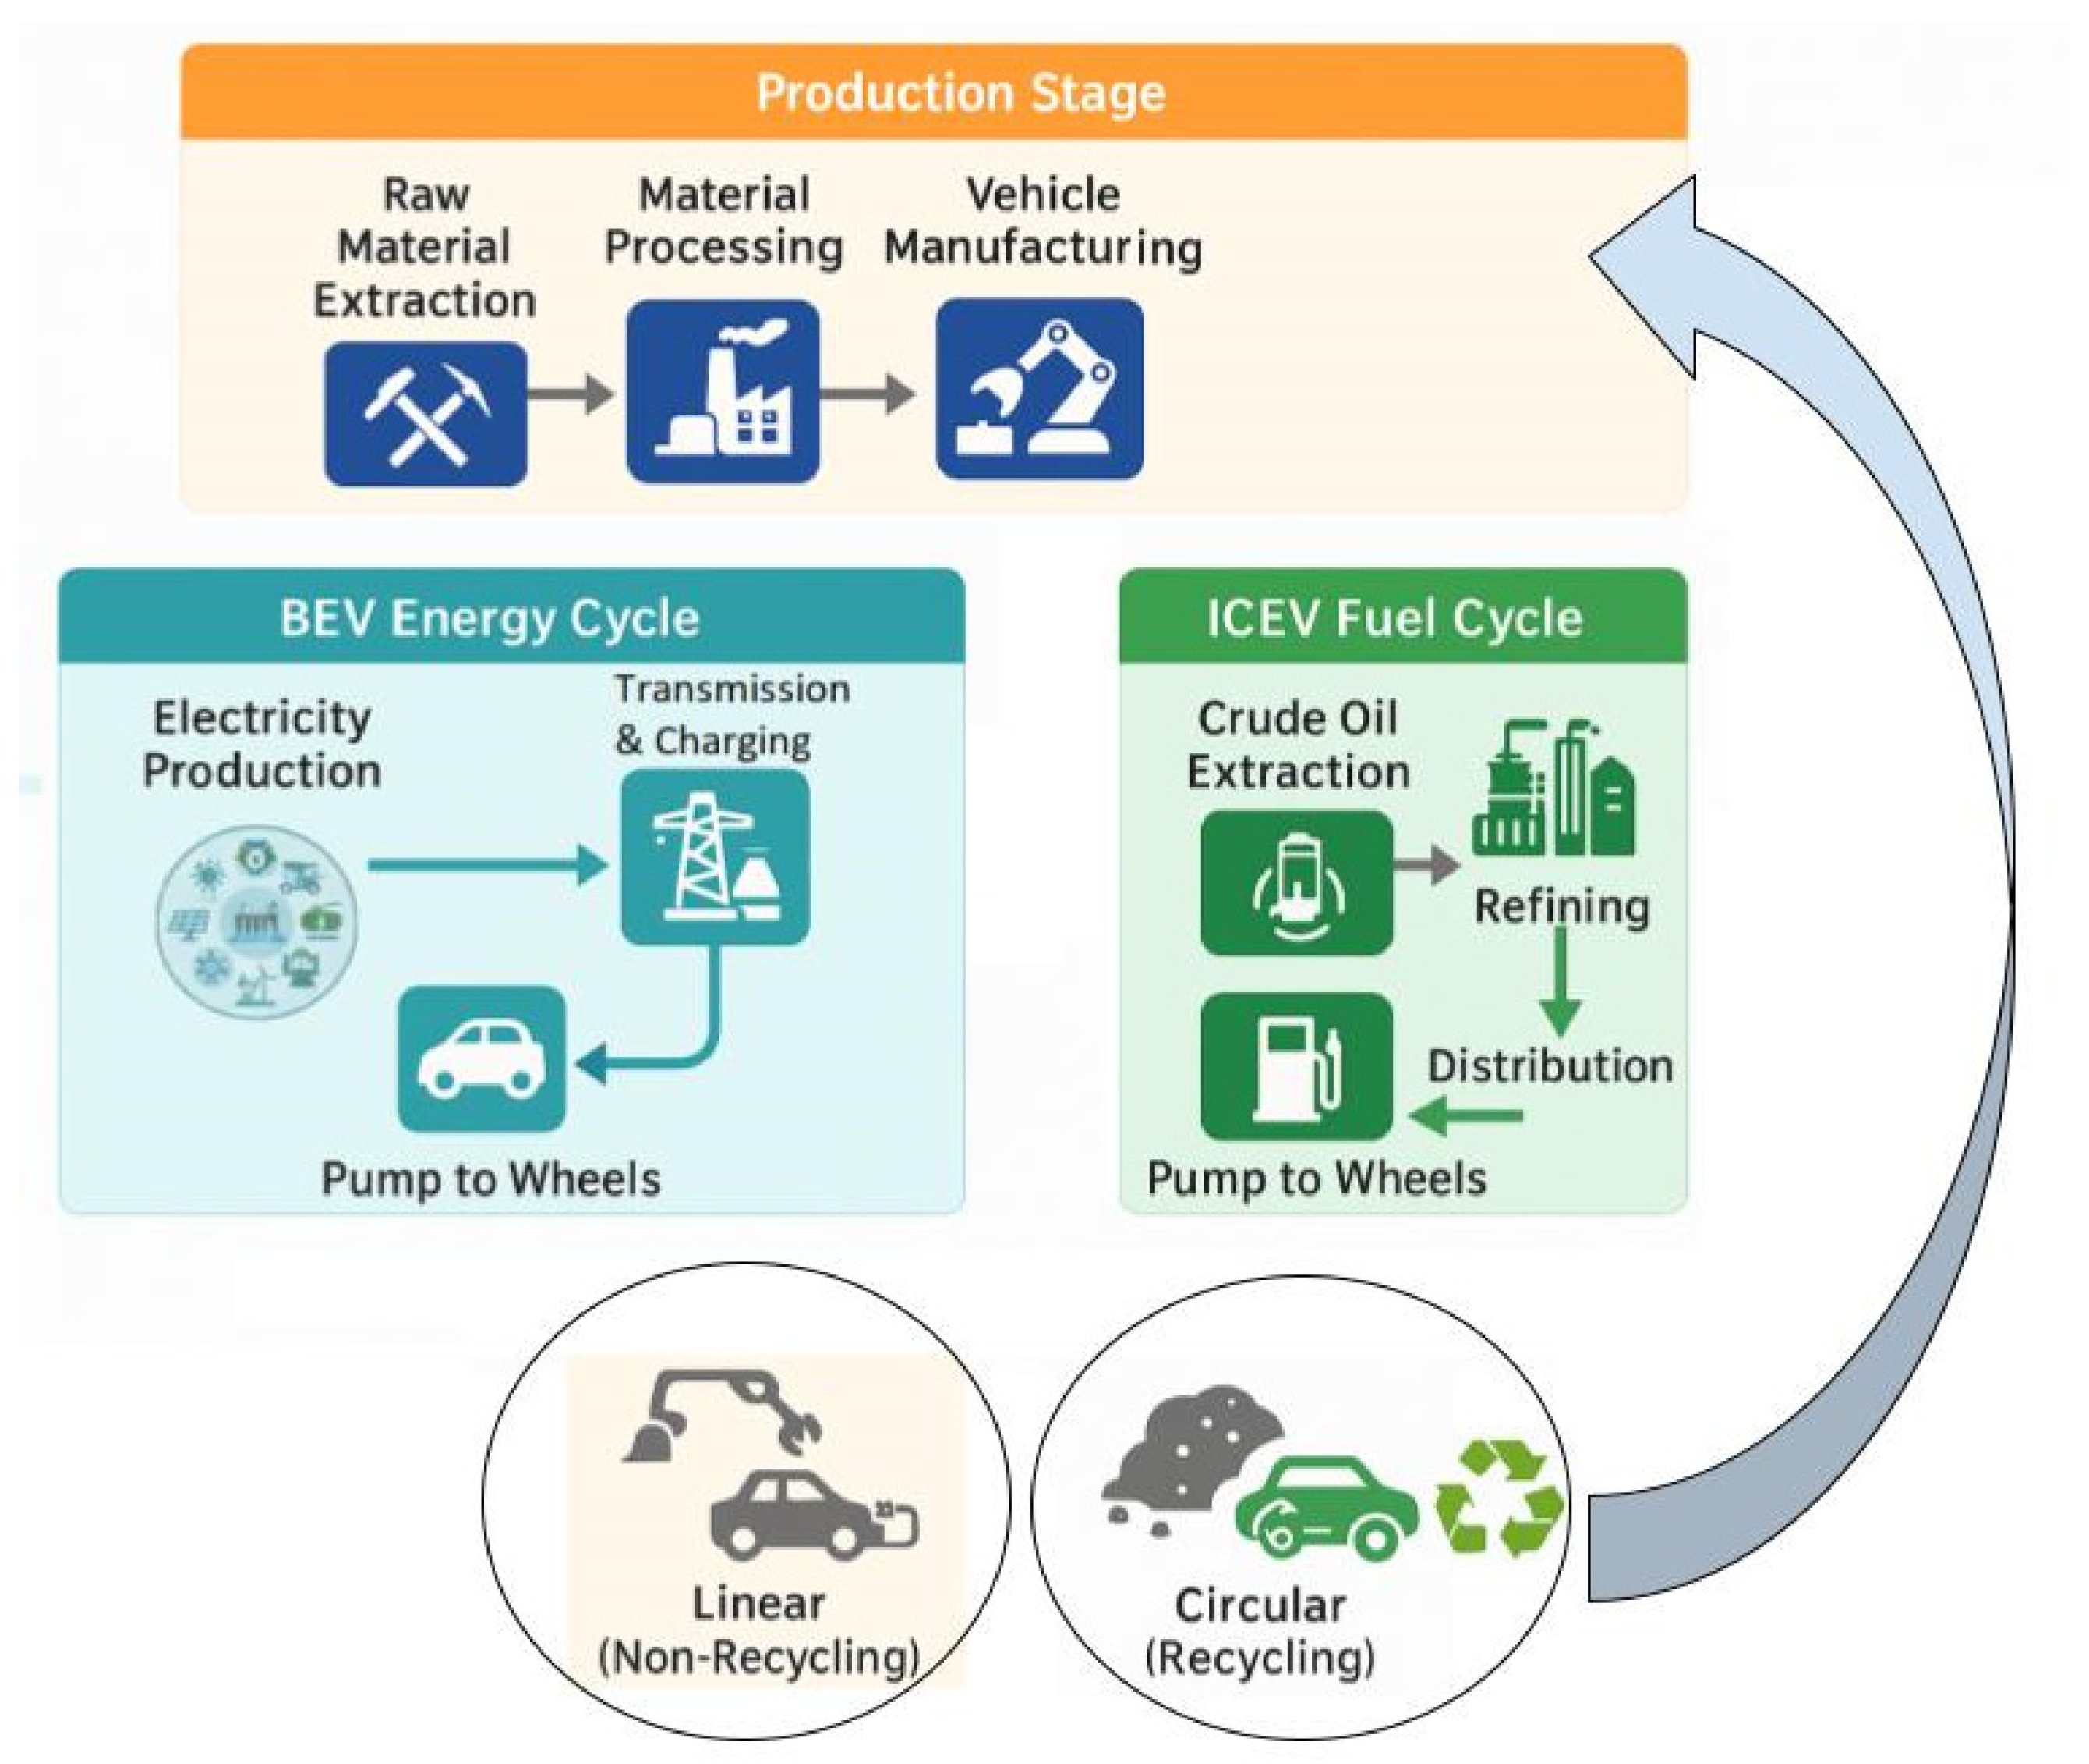
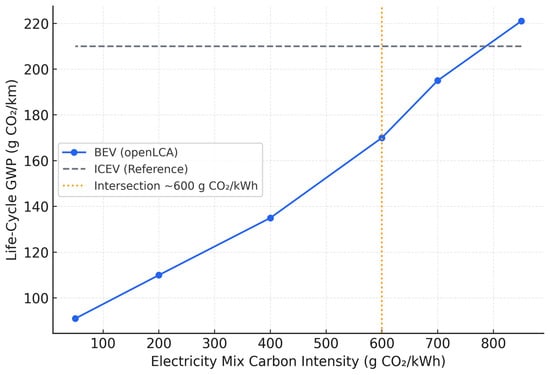
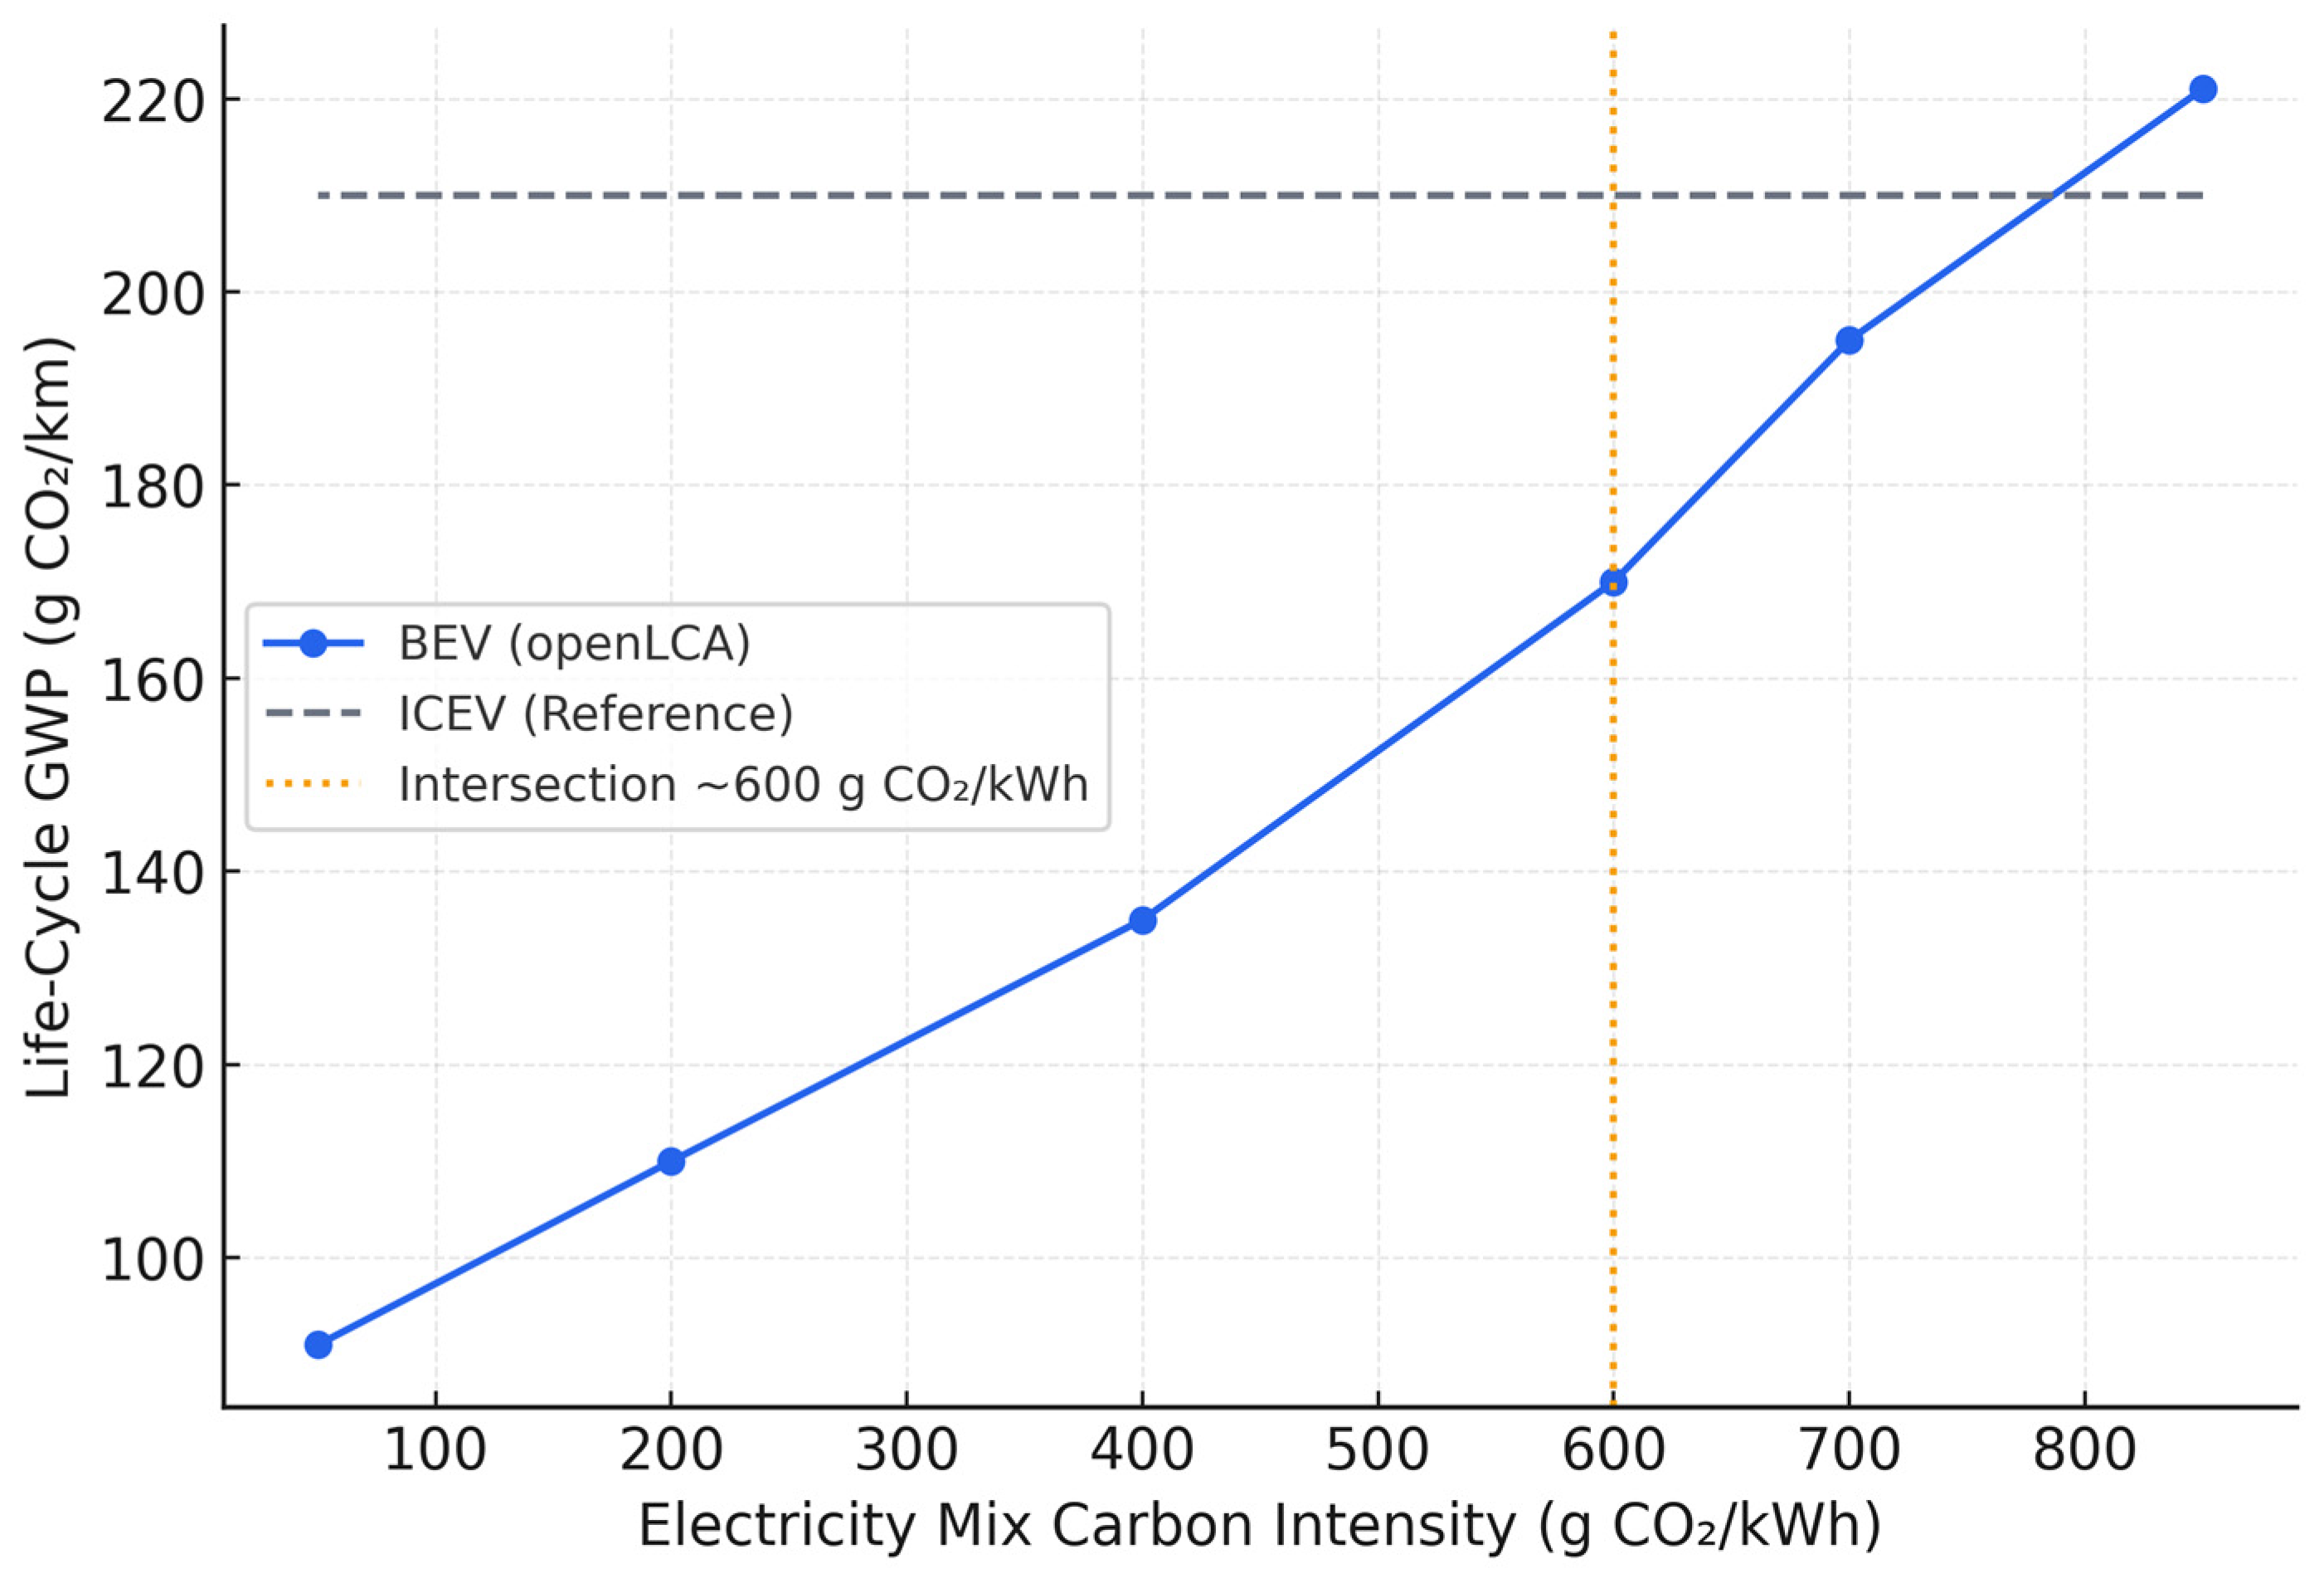
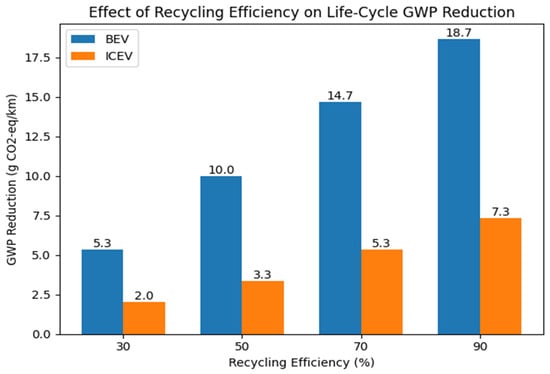
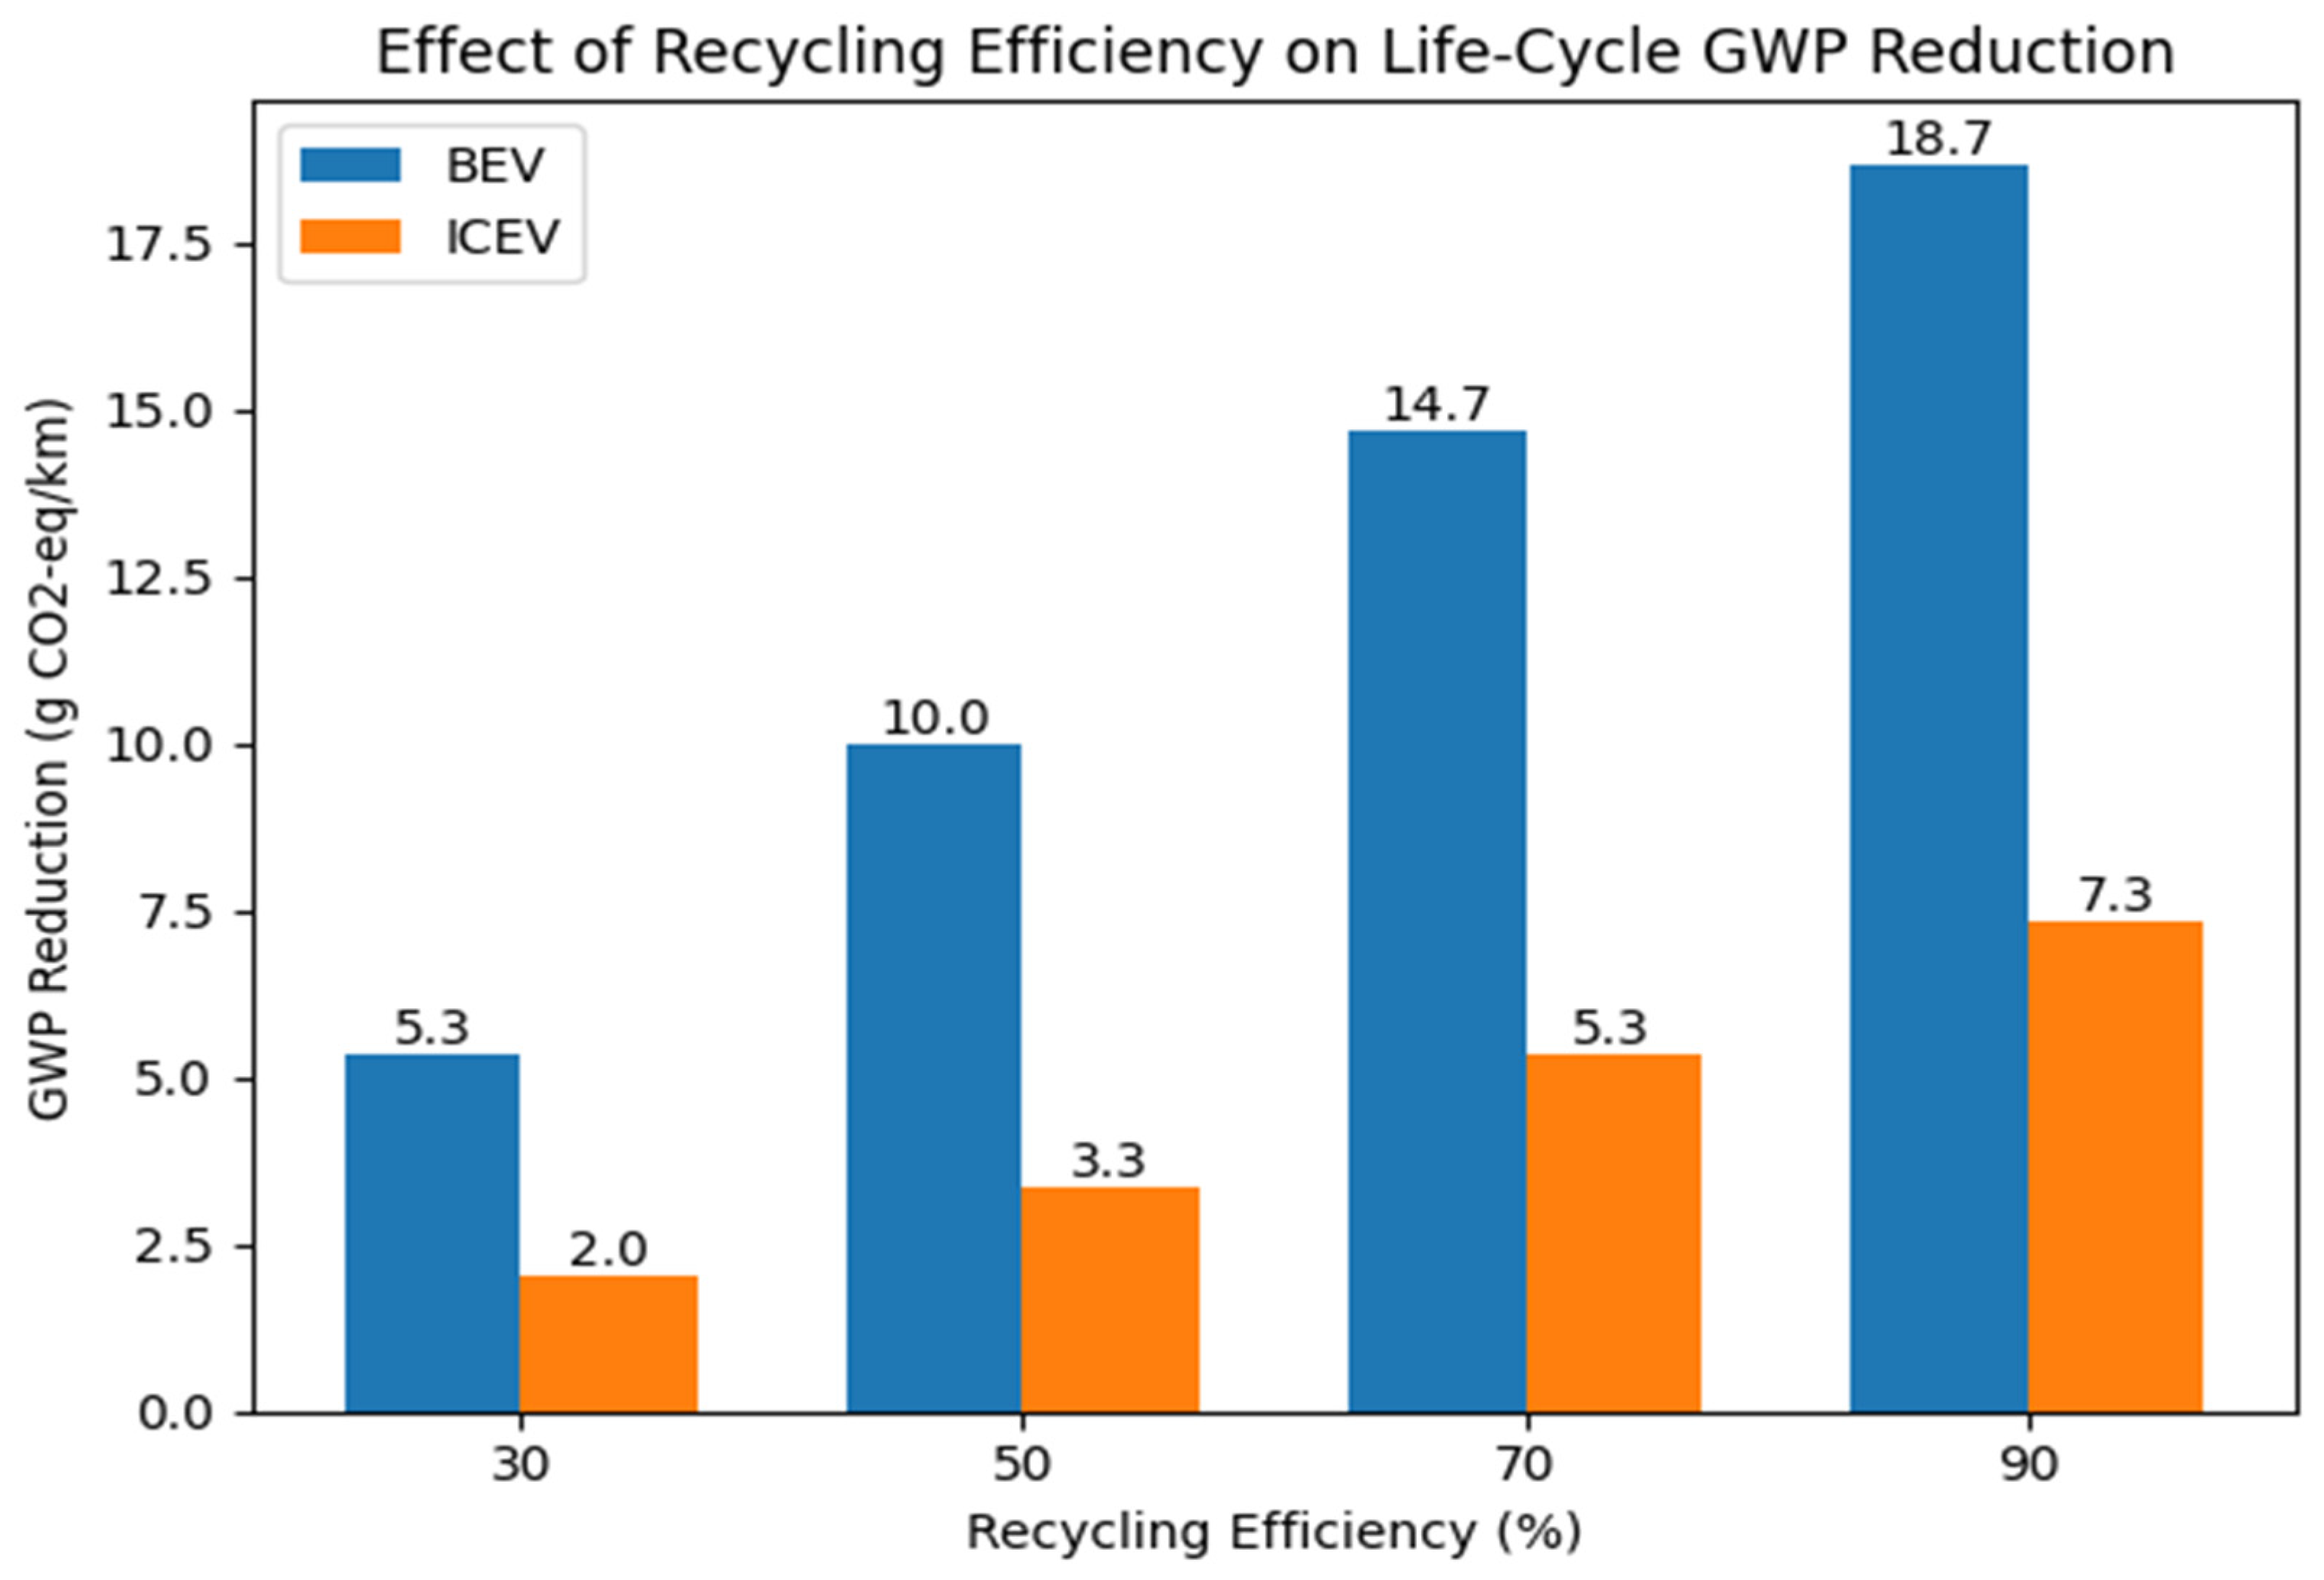
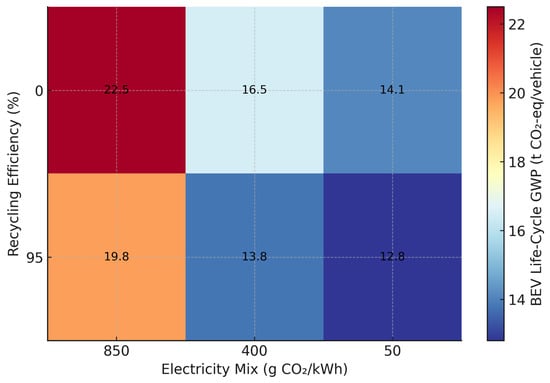
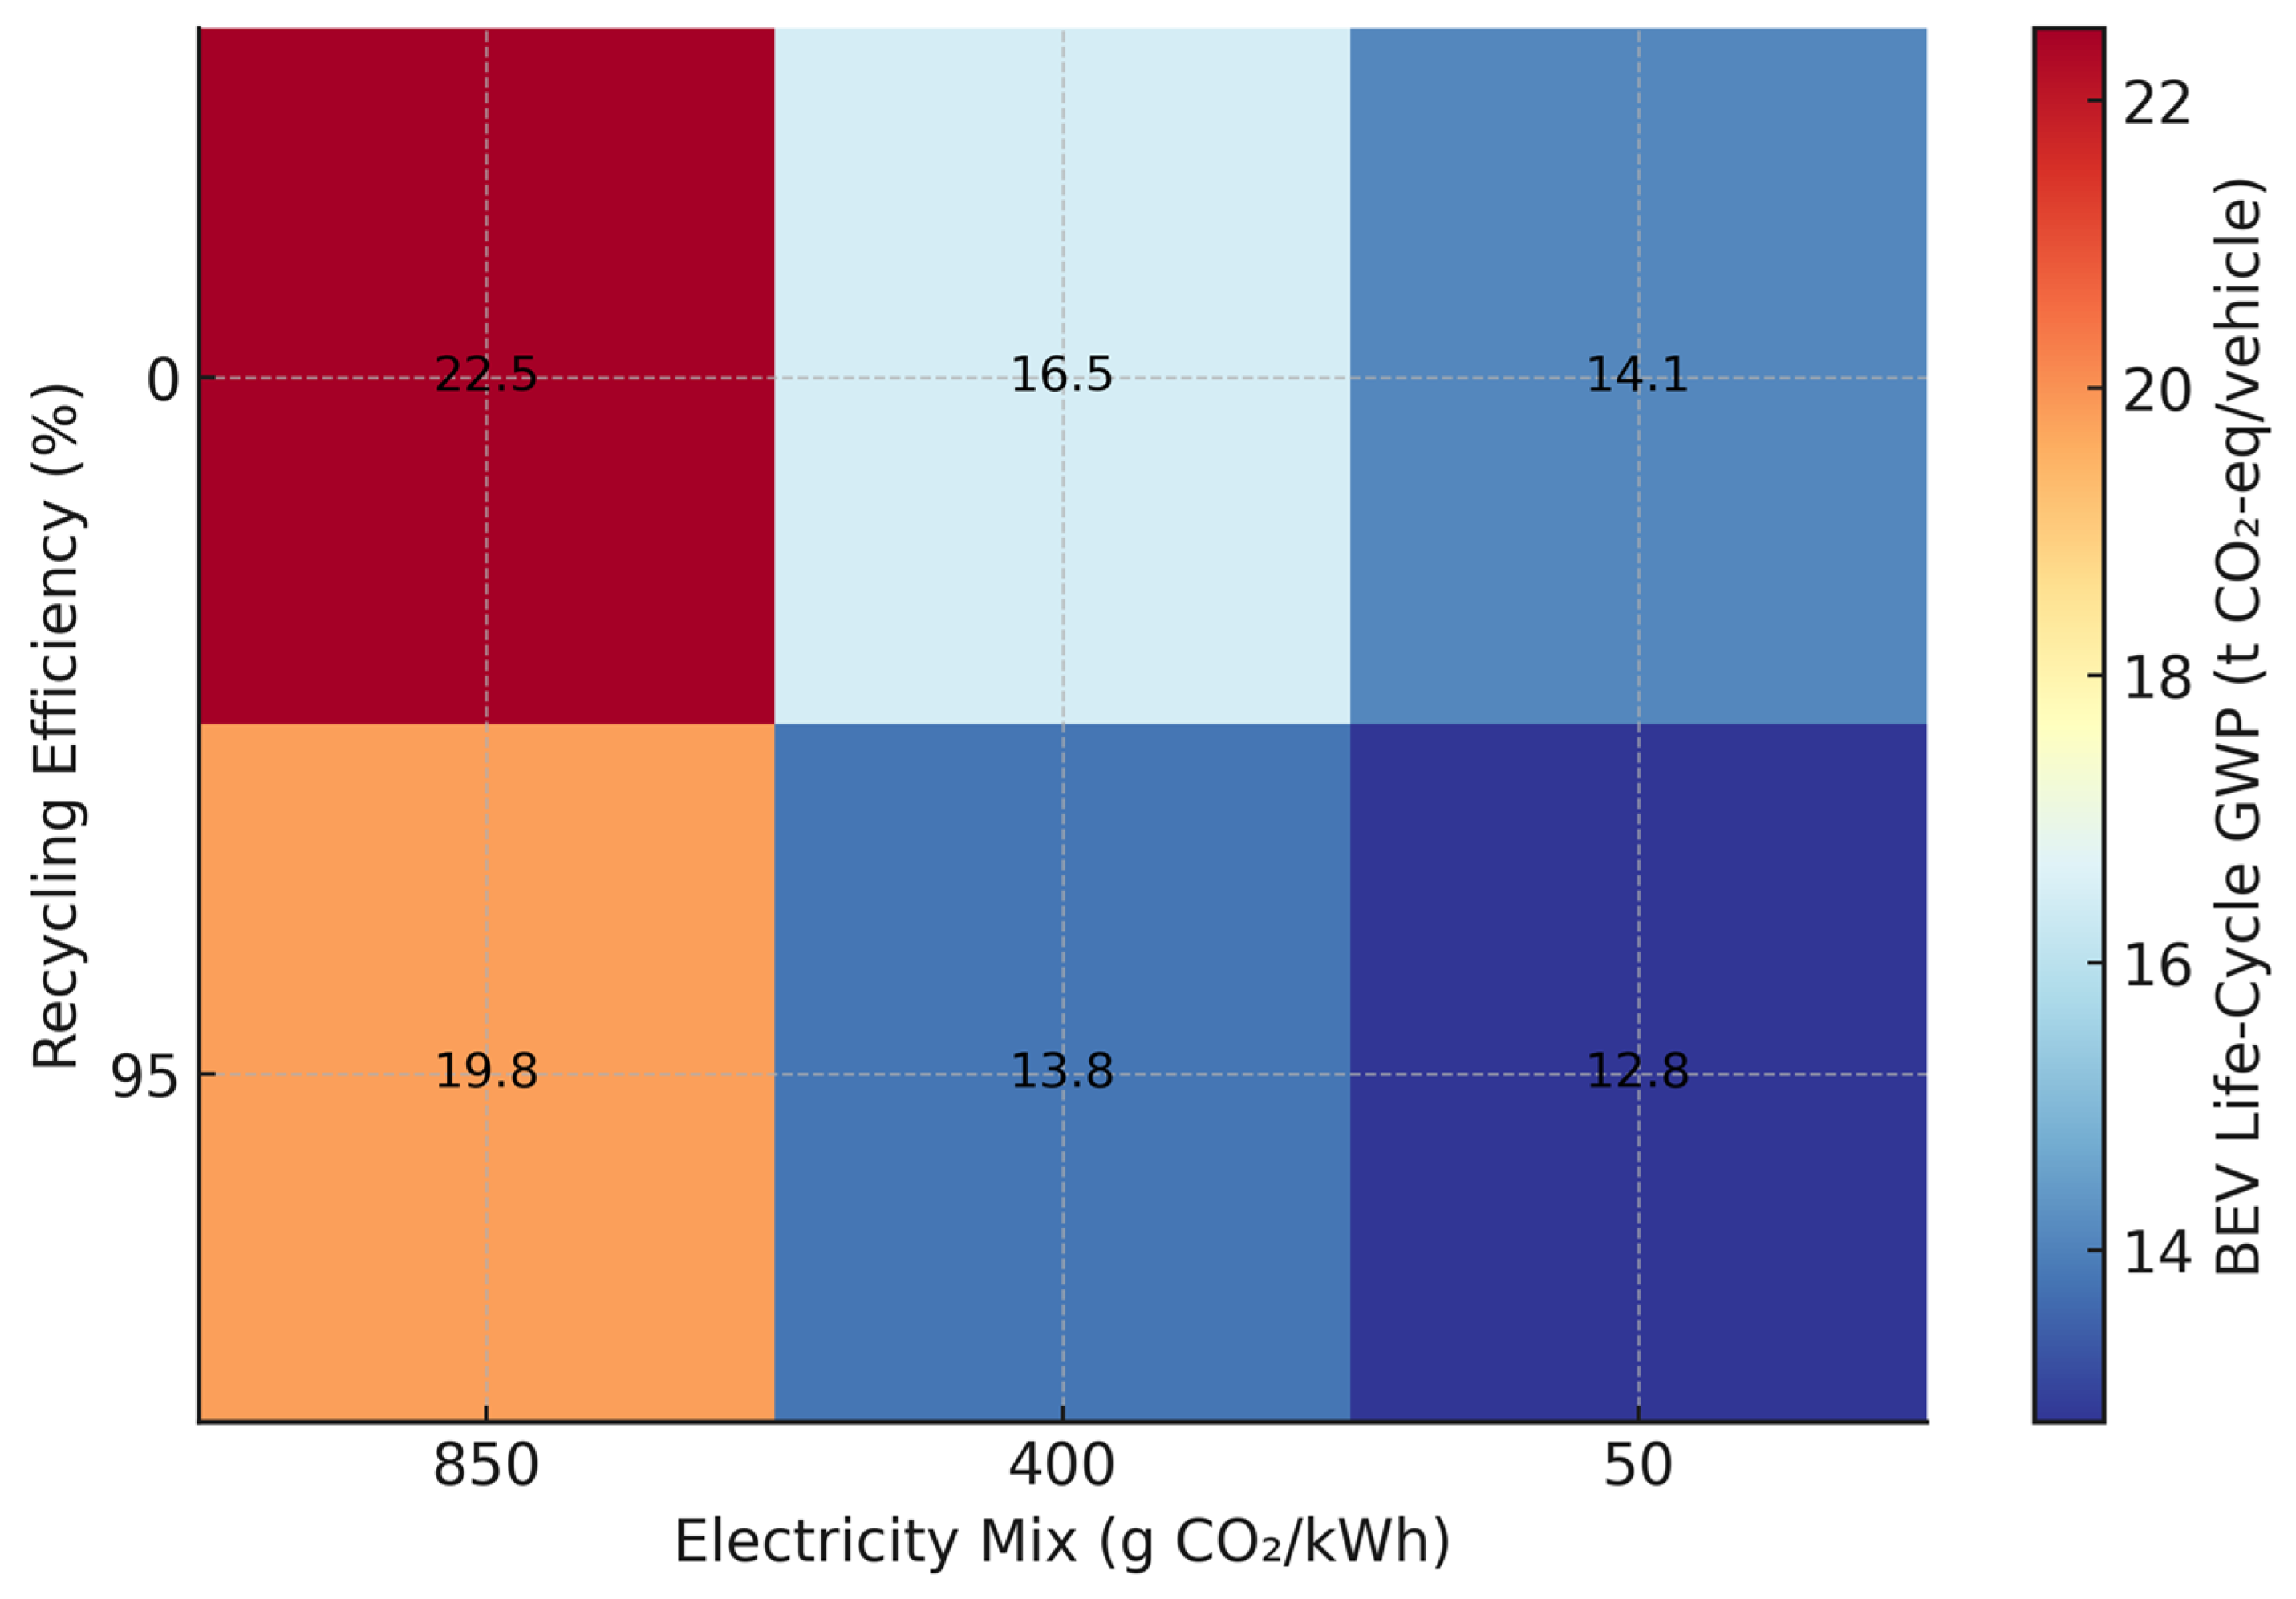
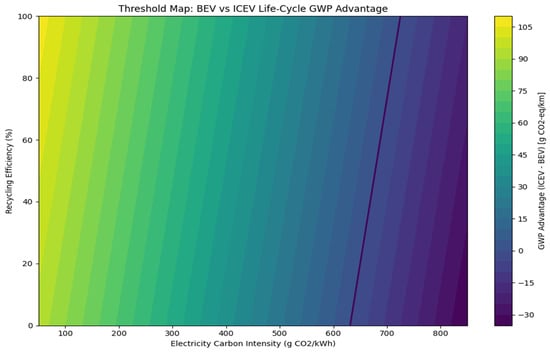

Disclaimer/Publisher’s Note: The statements, opinions and data contained in all publications are solely those of the individual author(s) and contributor(s) and not of MDPI and/or the editor(s). MDPI and/or the editor(s) disclaim responsibility for any injury to people or property resulting from any ideas, methods, instructions or products referred to in the content. |
© 2026 by the author. Published by MDPI on behalf of the World Electric Vehicle Association. Licensee MDPI, Basel, Switzerland. This article is an open access article distributed under the terms and conditions of the Creative Commons Attribution (CC BY) license.