


Abstract
As the number of electric vehicles (EV) increases, the demand for recommending the best charging location when using a large-scale charge network to charge is also increasing. A successful recommendation will utilize the user’s preference and the operational constraints of the charging network to make sure that it also takes into account the real-time operational requirements of the network. Most current papers focus on optimizing individual algorithmic components in isolation; consequently, many of these papers neglect to provide a holistic view of an integrated system. In addition, there are many operational requirements that current research does not consider, such as cold-start personalization for new users and enforcing real-time operational constraints like station availability, power capacity, maintenance windows, etc. This paper describes a deployable multi-stage recommendation system that creates a candidate list based on location and ranks preferences based on user, station and context features. The recommendation system also adds a configurable rule-based re-ranking layer to ensure that both hard constraints (i.e., charger availability and power-cap limits) and soft objectives (i.e., load balancing and operator priority) are enforced. A method for enabling mixed use between stable Bayesian and adaptive Bayesian methods was developed to provide users starting with cold-start performance that do not have adequate histories. Evaluation of this method using 100k+ real charging sessions showed that the fraction of sessions where the ground-truth station appears in the top-two recommendations (Hit@2) for the recommendation system was 0.82, representing a 37% increase in performance compared to proximity-based recommendation methods. The online deployed recommendation system has a 99th-percentile serving latency (P99) of less than 200 ms. The findings of this paper provide a framework for the implementation of operationally-relevant user-centric recommendation systems for EV services at scale.
1. Introduction
The increasing trend toward sustainable transportation throughout the world has resulted in increased use of electric vehicles (EVs), which are expected to continue their rapid development [1,2]. The introduction of these vehicles has required changes to be made in the methods and means of operating and optimizing charging infrastructure. As EVs evolve from a niche-market product into a mass-market one, the need for charging platforms to make informed large-scale decisions when determining the locations to which EV charge demands are directed will be of paramount importance. This is especially true with respect to the determination of where charging stations are located, as this affects both customer satisfaction and network-level operational stability [3,4].
Intelligent charging recommendation matters beyond individual user convenience; at the network level, recommendation outcomes affect station-level load distribution, infrastructure utilization, and congestion dynamics, as shown by both demand/planning studies and survey-style overviews [3,4,5]. To maximize recommendation effectiveness, multiple factors should be considered jointly, including station distance, historical usage behavior, and real-time service feasibility from the operator side. These factors can be represented with operational signals and city-scale system data [6,7,8]. Unfortunately, the current state of research does not adequately account for these three factors. Therefore, there remains a gap in the ability to produce charging recommendations for industry use.
The three gaps that hinder the ability to deploy charging recommendations in the industry are summarized as follows:
- Lack of a unified approach to developing charging recommendations across the three main factors outlined above. Most of the existing research focuses on individual components versus a unified approach to creating charging recommendations. As an example, most of the research work that has been conducted to date has utilized multiple factors independently to support the creation of MCDM models [9], developing treatment recommendations using a decision-theoretic approach [10], and applying grid experience through reinforcement learning methods [7,11]. However, the operational environment in which a recommendation will be delivered generally requires a unified approach that allows for distance, preference, and constraints to be treated in a consolidated view within a single recommendation. This will aid in developing a faster recommendation pipeline.
- Deployment complexity. There is sufficient evidence that advanced recommendation methodologies such as multi-agent reinforcement learning and deep reinforcement learning [11,12] will be much more complicated to deploy in a high-concurrency operational setting. As such, they will have higher training and deployment complexities associated with the application of complex recommendation methodologies. Production systems must meet strict latency targets (e.g., P99 < 200 ms).
- Cold-start and data sparsity. Since charging recommendation applications will operate much less frequently than standard recommendation applications, users will have less of a chance of having sufficient historical data to utilize for personalization. Therefore, users will have less of an opportunity to obtain high-quality recommendations. Because of this sparsity, early personalization is impeded and both the quality of recommendations and the success of the operational outcomes will suffer. In addition to station selection, recommendation services may also cover charging mode or fast-charging decisions. In these cases, user convenience must be balanced against battery wear and lifecycle concerns [13,14].
To overcome these challenges, we built an end-to-end EV charging recommendation system and proved its value through implementation. Our main contributions include the following:
- (1)
- A multi-stage deployable pipeline that brings together distance, preference, and operational considerations to develop one unified framework that provides recall of location-based candidate stations (using user, station, and context features) through supervised ranking and rules-based re-ranking of results. The re-ranking generates results that meet feasibility constraints while maintaining operational goals such as availability thresholds and load balancing. A method for handling cold-starts with sparse histories. We have developed a mechanism that combines population-level priors with limited user-side signals to generate robust recommendations under sparse history conditions. This mechanism reduces cold-start inference overhead by routing new/sparse users to a lightweight fallback path while maintaining recommendation quality.
- (2)
- A configurable policy layer for operational control. We establish a configurable policy layer for managing both hard and soft-constraint filtering. In addition, we provide for the inclusion of algorithmic scoring methods in order to improve the accuracy of matching between user behavior and the most relevant or appropriate items for that user.
- (3)
- Validation on full deployment. Using offline evaluations on 100k+ real charging sessions, we achieved a Hit@2 score of 0.82, which is an improvement of 37% over proximity-based recommendation systems. In an online deployment, we achieved an observed selection-to-completion conversion of 80% for Top-3 recommendations with P99 latencies under 200 ms.
2. Related Work
Charging station recommendation research spans intelligent transportation systems (ITS), recommender systems, and operational decision support [5]. In this section, we position prior methods along three deployment-critical dimensions: real-time latency, scalability, and operational feasibility. Table 1 summarizes this positioning and motivates our design choices in line with representative prior methods [9,10,11,12].
2.1. Proximity/Price Heuristics and Preference-Driven Models
Proximity- and price-based heuristics are widely used because they are simple and fast; however, they do not model user heterogeneity or operational feasibility under congestion and power constraints. Preference-driven methods improve personalization and interpretability, including MCDM approaches such as AHP/TOPSIS [9], user-generated signal mining [15], and candidate-generation + ranking pipelines [16,17,18]. Collaborative filtering and neural preference models further improve personalization [19,20], while lightweight retrieval methods (e.g., hash-based matching) target large-candidate serving efficiency [21].
Table 1.
Comparative positioning of charging recommendation approaches.
2.2. Sequential Decision and Reinforcement Learning
A second research stream models recommendation as sequential decision making, including MDP formulations [10], deep/temporal RL [22,23], and multi-agent or graph-based safe RL for coupled transport–power settings [7,11,12,24,25,26]. Actor–critic variants also trade off user preference with detour/wait costs [27]. These methods are strong in simulation or offline studies, but their industrial deployment can be constrained by nonstationarity, dependence on reliable real-time signals, and model/serving complexity [11,12]. A related line of studies has investigated charging strategy optimization together with battery health objectives [13,14].
2.3. Service Mechanisms, Planning, and City-Scale Systems
Service mechanisms such as reservation, deadline-aware prioritization, and pre-emption directly affect recommendation feasibility [28,29,30,31]. Charging recommendation is also tightly linked to planning/routing and infrastructure decisions, including demand forecasting and station placement [3,4], constrained route optimization [32,33], IoT-based load forecasting [8], and city-scale mobility/energy coordination [6]. Related scenarios include spatiotemporal fleet recommendations and grid/photovoltaic-aware operation as well as battery-swapping recommendation under similar congestion and load-balancing constraints [34,35,36,37,38,39,40].
2.4. Summation and Positioning
In summary, prior work spans heuristics, preference models, and RL-based sequential decision methods [7,9,10,11,12,22]. The key tradeoff is between richer decision modeling and deployment practicality under strict latency/reliability constraints. Table 1 summarizes representative approaches along this tradeoff.
Our work targets this gap by combining distance-aware retrieval, learned preference ranking, and operations-aware re-ranking in one deployable pipeline. We evaluate both offline ranking quality and online operational metrics, showing that this integrated design can satisfy industrial latency constraints while improving recommendation effectiveness.
3. Materials and Methods
3.1. Datasets
We collected and analyzed a large dataset of actual EV charging activity through the commercial charging network within many urban areas across multiple states. Each session includes anonymized user and station identifiers, timestamps, charging duration, energy delivered, payment amount, and contextual metadata. We join these sessions with station metadata (location, charger specifications, pricing, and facility descriptors) and with operational logs (e.g., availability status and aggregate usage statistics) at configurable time granularities.
In terms if the dataset scale and split, our evaluation leverages a large-scale dataset comprising 100k+ charging sessions, 3k+ stations, and 10k+ users collected from a commercial EV charging platform. The data are partitioned chronologically: 80% for training and 20% for held-out testing, which prevents information leakage from future observations.
For data source concatenation and preprocessing, we use five core source tables: the user profile table, charging order table, station table, charger/pile table, and operations table. First, these raw tables are synchronized into an offline data warehouse. Second, we perform request-centered aggregation to build a model-wide table and historical aggregate tables (user-side, station-side, and time window statistics). Third, we apply preprocessing, including normalization/standardization of numeric features, categorical encoding, and missing-value imputation with missingness indicators. We further perform timestamp alignment, data quality checks (deduplication and outlier filtering), and strict temporal cutoff control to avoid information leakage from future records. Finally, labeled training instances are generated with candidate-set construction and negative sampling under the same temporal constraints.
3.2. Experimental Environment
The process of computing features and training machine learning models offline and loading that information into a cloud-based platform is accomplished via cloud-based infrastructure; online, recommendation systems run as distributed services (micro-architecture).
This study was conducted in a production-oriented cloud environment based on operational data from a commercial EV charging platform, rather than in a laboratory setting with dedicated physical experimental equipment.
Specifically, online transactions are streamed to the data warehouse via streaming change capture technology, then aggregated into feature sets using batch-processing jobs run according to a schedule to produce a model-ready table of data and produce incremental updates to that table.
The “feature store” and Redis cache provide “low-latency” feature retrieval. The “preference model” runs as a stateless service (meaning that it does not need to maintain state) and can be load balanced across multiple servers (horizontal scalability).
3.3. Problem Formulation
In our formal problem statement, we present the problem of recommending charging stations via a probabilistic ranking model. Consider a recommendation request from user at geographic location ℓ and time t. The recommendation system observes three categories of information:
- User attributes: Static profile information (e.g., vehicle type, payment preferences) and dynamic behavioral features from historical charging sessions.
- Station attributes: Static and dynamic operational signals of each station include the geographic coordinates and chargers (static) along with the real-time availability, available power head-room, current pricing and current queuing (dynamic) of each station.
- Contextual features: Request-time features of the stations are a combination of request-time signals such as temporal indicators (e.g., hour, day of week, holiday flags) and environmental features.
Historical interaction logs (i.e., charging orders and/or complete sessions) are available offline as supervision to be used in offline training of supervised learning models. They are also used for computing aggregated behavioral features at the user, station, and time window levels. We apply strict temporal cutoffs to avoid information leakage.
The objective of the recommendations is to create a list of ranked charging stations that maximizes the predicted user utility consistent with the constraints of operational feasibility. User utility is defined as a latent measure that is inferred from the selection patterns observed contemporaneously in the historical records. User utility also implicitly accounts for the preferences of users based on distance, wait time, cost, maximum charging rate, and personal preferences. On the other hand, operational constraints include maximum capacity for charging stations, current charging availability, and compatibility with maximum power limits as well as charging countermeasures based on predictive analytics for load balancing and peak management.
Formally, let denote the candidate station set within geographic radius R of the user’s location. The recommendation output is a ranked list of size K. The system objective is to maximize the probability that the user selects a station from the top-K recommendations. It also ensures that all recommended stations satisfy availability, power-compatibility, and operational constraints.
3.3.1. Notation and Optimization Perspective
Let denote the user population and the set of charging stations. For a recommendation request at time t, the system observes contextual information encompassing location coordinates and temporal features. Each candidate station is characterized by attribute vector . This vector combines static properties with dynamic operational signals. We construct the composite feature representation for a user–station pair as
The preference model predicts a score , where denotes the learned scoring function parameterized by . The recommendation list is generated by ranking stations according to and applying constraint-based filtering. The underlying optimization objective can be formulated as
where represents the utility value of station s for user u at time t. This incorporates load-balancing objectives and power-matching compatibility. In practice, direct online optimization of this objective is computationally intractable. Instead, we employ a two-stage approximation. The supervised preference model estimates . Operations-aware re-ranking incorporates through operational constraint enforcement and priority adjustment. The breakdown of this decomposition has led us to develop a multi-stage pipeline for our architecture.
3.3.2. Real-World Constraints
The operational constraints for a charging recommendation system can be classified into two categories: hard constraints and soft constraints. Each type of constraint has its own method of handling the constraint during operation. In this study, we do not seek to optimize for grid-level energy; rather, we use the operational constraints of power feasibility and load-related signals as ranking heuristics to make our system more easily deployable and support a feasible real-time system.
Hard constraints must be met for every valid recommendation:
- Availability: Recommended stations must have at least one operational charger currently available or with acceptable queue length.
- Compatibility: Charger specifications (connector type, power rating) must match the user’s vehicle requirements.
- Power Feasibility: Recommended stations must satisfy power-cap limits and power-headroom requirements for the requested charging mode.
- Safety: Stations under maintenance, with reported hazards, or violating safety thresholds are excluded.
Soft Constraints are platform-level preferences that influence ranking without strictly filtering candidates:
- Load Balancing: Preference for under-utilized stations to distribute demand across the network and reduce peak concentration.
- Load-Aware Adjustment: Penalizes recommendations that worsen local peak load and boosting stations with available power headroom.
- Priorities of the Business: Addition of operator-defined priority scores to reflect strategic goals.
In our architecture, we utilize ‘hard’ constraints (pre-ranking filters) and ‘soft’ constraints (re-ranking score adjustments). The separation of these two types of constraints is an important consideration when deploying our architecture, as it allows for consistency and transparency of decision making as well as improved robustness of our models if certain inputs become temporarily unavailable or delayed in time from the source.
3.4. Data Preprocessing
Preprocessing of data enables the development of strong training preference models. The steps taken for data preprocessing are outlined below.
- Deduplication: Records are deduplicated based on composite keys of session ID and timestamp to eliminate duplicate entries from system retries or logging redundancy.
- Anomaly filtering: Sessions with anomalous characteristics are excluded. These include near-zero energy sessions (energy < 0.1 kWh, including failed charges) and extremely short durations (<1 min, likely erroneous starts). They also include outlier durations exceeding the 99.5th percentile.
- Encoding of categorical features: Low-cardinality categorical variables (e.g., city code, registration channel, station type) are encoded with one-hot encoding. High-cardinality fields (e.g., vehicle brand) use frequency encoding to avoid excessive sparsity.
- Numerical normalization: Continuous features are normalized with min-max scaling to the 0–1 range to improve numerical stability and training convergence.
- Operator-defined tag enrichment: We include operationally maintained user tags (e.g., private car vs. taxi/fleet) and station tags (e.g., five-star vs. standard) as categorical inputs. This enables controllable operational semantics to complement behavior-derived signals.
3.5. Feature Engineering
3.5.1. Feature Construction
To achieve the goal of personalized service at operational grade, we create multiple feature dimensions. This new feature space consists of three complementary types of features: user features, station features, and contextual features. To balance between accuracy (in terms of features) and real-time implementation, we combine dynamic/operational data with static attributes.
The complete list of features continues to grow, and is far too long to present in this document; therefore, we provide a summary of feature groups and representative examples below rather than a complete itemization.
Note that user and station identifiers are used only as keys for data joins, candidate generation, and negative sampling, and are not directly used as model input features in order to avoid overfitting and ID memorization.
All aggregate behavioral statistics (e.g., cumulative user signals and station-level order/revenue metrics) are computed with strict temporal cutoffs (e.g., T + 1 batch features) so that only information available before the recommendation time is used, preventing label leakage.
Categorical features are encoded using one-hot encoding (low-cardinality) and frequency encoding (high-cardinality). Numerical features are min–max normalized. Feature engineering is designed to balance predictive power and online availability. For correlation analysis and complexity control, we did not apply aggressive correlation-based feature dropping as a hard preprocessing step because the Stage-3 model (XGBoost) is relatively robust to correlated predictors through tree-split selection and regularization. Instead, model complexity was controlled by feature-group curation and bounded hyperparameter search in the model-training stage, early stopping in model selection, and post hoc importance inspection. We agree that a dedicated quantitative correlation-reduction study can further strengthen the analysis, and list this as future optimization work.
3.5.2. Capturing Habitual Patterns
The empirical analysis of the charging behavior demonstrates a high level of consistency through habitual patterns. Individuals tend to have a preference for certain time periods and locations to charge. To better capture the stability of individual charging behaviors, we created two separate “habit-encoding” features to represent habitual charging behavior.
Spatial Habit Features: We divide the national map into square spatial grids with side length g km. Each station is assigned to a grid cell based on its GPS coordinates. The grid size is selected according to station density to balance spatial resolution and sparsity. In this study, we set km. For each user, we aggregate historical charging sessions by grid cell. We encode the top-K most frequently visited cells as categorical features. This enables the model to recognize whether a candidate station falls into the user’s habitual charging area.
Temporal Habit Features: We construct a 24-bin histogram representing the user’s charging frequency distribution across hours of the day, normalized to sum to unity. This temporal profile captures individual circadian charging patterns (e.g., morning and evening charging routines commonly observed among commuters), providing long-term preference signals that complement immediate contextual features.
3.5.3. Price Sensitivity Features
User heterogeneity in price sensitivity significantly affects charging station selection. We define price sensitivity through three complementary features:
- Historical Average Price: The mean price per kWh across the user’s historical charging sessions. This reflects their typical price tolerance level.
- Price Variance: The variance of prices in selected sessions. High variance suggests price flexibility, while low variance indicates strong price-driven selection behavior.
- Discount Affinity: The fraction of historical sessions where the user selected a station offering promotional discounts. This captures responsiveness to pricing incentives.
These features enable the model to distinguish between price-sensitive users who optimize for cost and convenience-oriented users who prioritize factors such as proximity and speed over price.
3.5.4. Availability and Reliability Features
Operational reliability critically influences recommendation utility. Recommending an unavailable or unreliable station imposes significant user costs. We engineer the following reliability-oriented features:
- Station Reliability Score: A rolling 7-day availability rate computed as the fraction of time the station had at least one operational charger. This score penalizes stations with frequent outages or maintenance periods.
- Failure Rate: The proportion of charging sessions at the station that terminated abnormally (e.g., charging failures, payment errors) over the past 30 days.
- Short-Term Utilization Trend: The change in available charger count over the preceding 30-min window, computed as . Recommendations based on negative values identify trends in congestion, as they are predictive of queue formation.
Furthermore, the ability to leverage these variables helps the model to predict preferences based on the operational status of the charging network. Recommendations made to users will be limited when there are no historically available or reliable tracks associated with the recommendation.
3.5.5. Load Signals and Power Matching Features
To match the recommendations made with respect to charging-network operations, we incorporate features that represent local load conditions and determine power feasibility:
- Power Matching Ratio (PMR): The ratio of the rated power of the station and the acceptance capacity of the vehicle. The PMR is intended to penalize large deviations from optimal use (under or over) as well as to ensure that the charging power is feasible.
- Station Power Headroom: This represents the amount of real-time available power margin at the station or feeder level. This encourages the system not to recommend stations to users when there would be an increased load on the local area.
- Local Load Index (LLI): A measure of how stressed the grid is based on feeder utilization or peak-period flags. The LLI helps direct users to stations that are loaded less heavily, when such a station exists.
Through the use of these power feasibility and load balancing signals, the Stage 3 ranking model will be able to distinguish between candidates that match the charging power of the vehicle and candidates that support the balancing of local load resources. Stage 4 implements hard constraints that must be satisfied.
3.6. Model Architecture
Model Selection Rationale. The main model architecture used to develop the model for Stage 3 is XGBoost. There are practical reasons (e.g., serving setting and data) for using XGBoost as the main preference scoring model:
- (1)
- Tabular mixed-type features: The core signals in the data are stored as tabular data types and comprised of both continuous variables (e.g., distance, price, power, etc.) and categorical attributes (e.g., station/operator tags, etc.), and some have sparse counts (e.g., historical visits). All of these types of mixed data can be interpreted well by gradient-boosted trees, especially the continuous variables, and also allow for gaps in data that commonly occur in operational logs.
- (2)
- Low latency and stable iteration: XGBoost is a scalable open-source implementation of a gradient-boosted tree model. It is well-suited for online applications, offering predictable inference latency with an easy method for updating its learned models (i.e., re-training). XGBoost provides a good balance between accuracy and latency as well as stable training across multiple iterations.
- (3)
- Clear role separation: XGBoost models are structured into different functional roles, with the model itself focusing on determining preference scores. The rule-based layer, which is responsible for performing additional checks and enforcing policies, places less burden on the original model and maintains operational clarity.
XGBoost fits this use case well because it is able to accomplish two critical objectives: providing high-quality predictions of user preferences, and maintaining low-latency operation.
3.7. Model Training and Optimization
We formulate station recommendation as a ranking problem over candidate user–station pairs, and implement training with a point-wise binary surrogate objective. Each historical charging session forms a positive instance indicating that user u selected station s at time t, while sampled non-selected candidates serve as negatives. The key challenge is to construct informative negatives that preserve geographic and temporal realism.
Negative Sampling Strategy. The sampling strategy for negative training instances significantly impacts the ability of the model to perform well; therefore, care must be taken when creating the negative training sample set. For each positive user–station pair , we construct a negative set comprising stations that satisfied the following criteria at time t. We will apply the geographic proximity criterion by making it mandatory that any charger considered for use must be located within some specified distance from the route of the user. The operational availability criterion requires that there be at least one functioning charger available at the selected time period when the trip is scheduled to take place. The user selection criterion is used to ensure that all valid chargers that meet both geographic proximity and operational availability are considered by the model for selection. An additional design choice made by the authors to reduce the effect of popularity bias on model training was to perform stratified sampling of the negative examples used to train the selection model. To achieve this, we performed sampling such that for each user–station pair, the sampled negative charger candidate locations would include both a high traffic and a low traffic station. To ensure that the negative examples used for training the selection model retain some temporal consistency with the positive examples, we enforced that the sampled negative examples had the same hour-of-day and day-of-week characteristics as the positive example. The combination of enforcing temporal consistency and utilizing a stratified sampling strategy provided significantly more stable model training and improved robustness in the resulting predicted preferences.
Feature Construction. We use the same three feature families summarized in Table 2 (user, station, and context), and construct each candidate tuple with leakage-safe temporal cutoffs as described in Section 3.4. To avoid repetition, detailed feature examples are not duplicated here.
Table 2.
Summary of feature groups and representative examples (non-comprehensive overview).
Method for Performing Training. In order to avoid temporal information leakage and to provide a realistic estimate of performance, we divide our data into sub-parts according to date. We designate the earlier sessions (80% of any given participant) as the training set and the later sessions (20% of any given participant) as the held-out test set. For hyperparameter optimization, we perform time series cross-validation using expanding “windows”. The hyperparameter options include learning rate, depth of the decision tree, regularization coefficients, and subsampling ratios. The objective function is minimization of the binary log loss function (i.e., log loss):
where denotes the regularization term. The primary evaluation metric is Hit@K. It measures the proportion of sessions where the user’s selected station appears within the top-K recommendations. Because the task objective is top-K ranking quality rather than hard class assignment, we report ranking metrics centered on Hit@K (including Hit@2 with confidence intervals) instead of confusion-matrix statistics. For reproducibility, the main XGBoost hyperparameter search ranges are summarized in Table 3. We selected final values using expanding-window time-series cross-validation on the training period, then retrained on the full training split before held-out evaluation.
Table 3.
XGBoost hyperparameter search space and selected values.
Cold-Start Generalization. Cold starts are especially prominent in EV charging recommendation because charging interactions are sparse (often only a few sessions per month). This tendency slows preference learning and extends the cold-start phase. Commercial platforms may also see bursts of first-time users during promotions or partnerships. This makes reliable cold-start handling necessary for early user experiences.
We address this regime through a Bayesian-inspired strategy that combines two components. First, we use early cold-start routing. Second, we employ a mixture mechanism that smoothly interpolates between population-level priors and personalized predictions. For cold-start users with very limited history (), we directly apply a population-based fallback score (defined below). For users with sufficient history, the final preference score is computed as
where denotes the user’s historical session count. The mixing weight increases monotonically with observation count and asymptotes to full personalization as sufficient history accumulates. In implementation, we set and and define
Here, denotes the preference score produced by the supervised model (XGBoost) given the assembled feature vector for the user-station-context tuple. For cold-start requests, is a lightweight population-based scorer that combines a location-cluster popularity prior and station-level quality signals
where denotes a normalized popularity prior within the user’s location cluster (and optional time bucket). Here, is a normalized station quality score constructed from operational metadata (e.g., rated power capacity, operator-defined station tags, and historical ratings). This formulation reduces prediction variance for sparse-history users and preserves the ability to leverage personalization as behavioral evidence accumulates. Although this strategy is Bayesian-inspired, it is not a fully Bayesian model. Specifically, we use prior-guided score mixing for cold-start handling, but do not perform full posterior inference over all model parameters (e.g., MCMC or variational inference) during online serving. This design choice is made in order to preserve low-latency production inference while retaining prior-informed behavior for sparse-history users.
3.8. Evaluation Metrics
We adopt Hit@K as our primary evaluation metric. It measures the proportion of sessions in which the user’s actually-selected station ranked within top-K of the recommendation list. For a set of N test sessions, Hit@K is computed as
where is the indicator function and denotes the position of the ground-truth station in session i. We report Hit@2 as our primary metric. This reflects the practical scenario where users typically view two to three recommendations before deciding. An 82% Hit@2 indicates that 82% of users find their eventually-chosen station within the top-2 recommendations. This is a meaningful threshold for real-world user experience. Mobile apps typically display two to three prominent options.
In addition to offline ranking metrics, we also report an online conversion metric (selection-to-completion) computed from operational event logs. These two metrics evaluate different layers of the system, namely, offline ranking quality versus online behavioral outcomes. These are reported separately, and are not numerically comparable due to different populations, interfaces, and operational factors.
3.9. Offline–Online Recommendation Pipeline
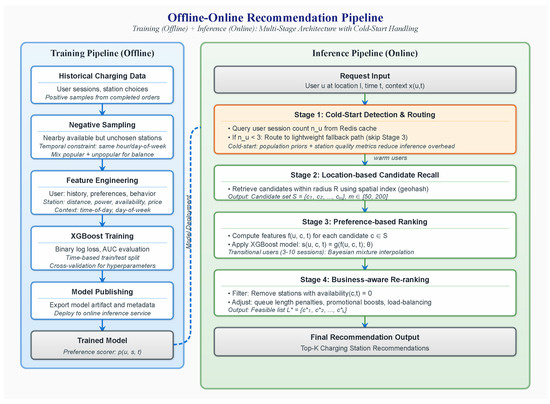
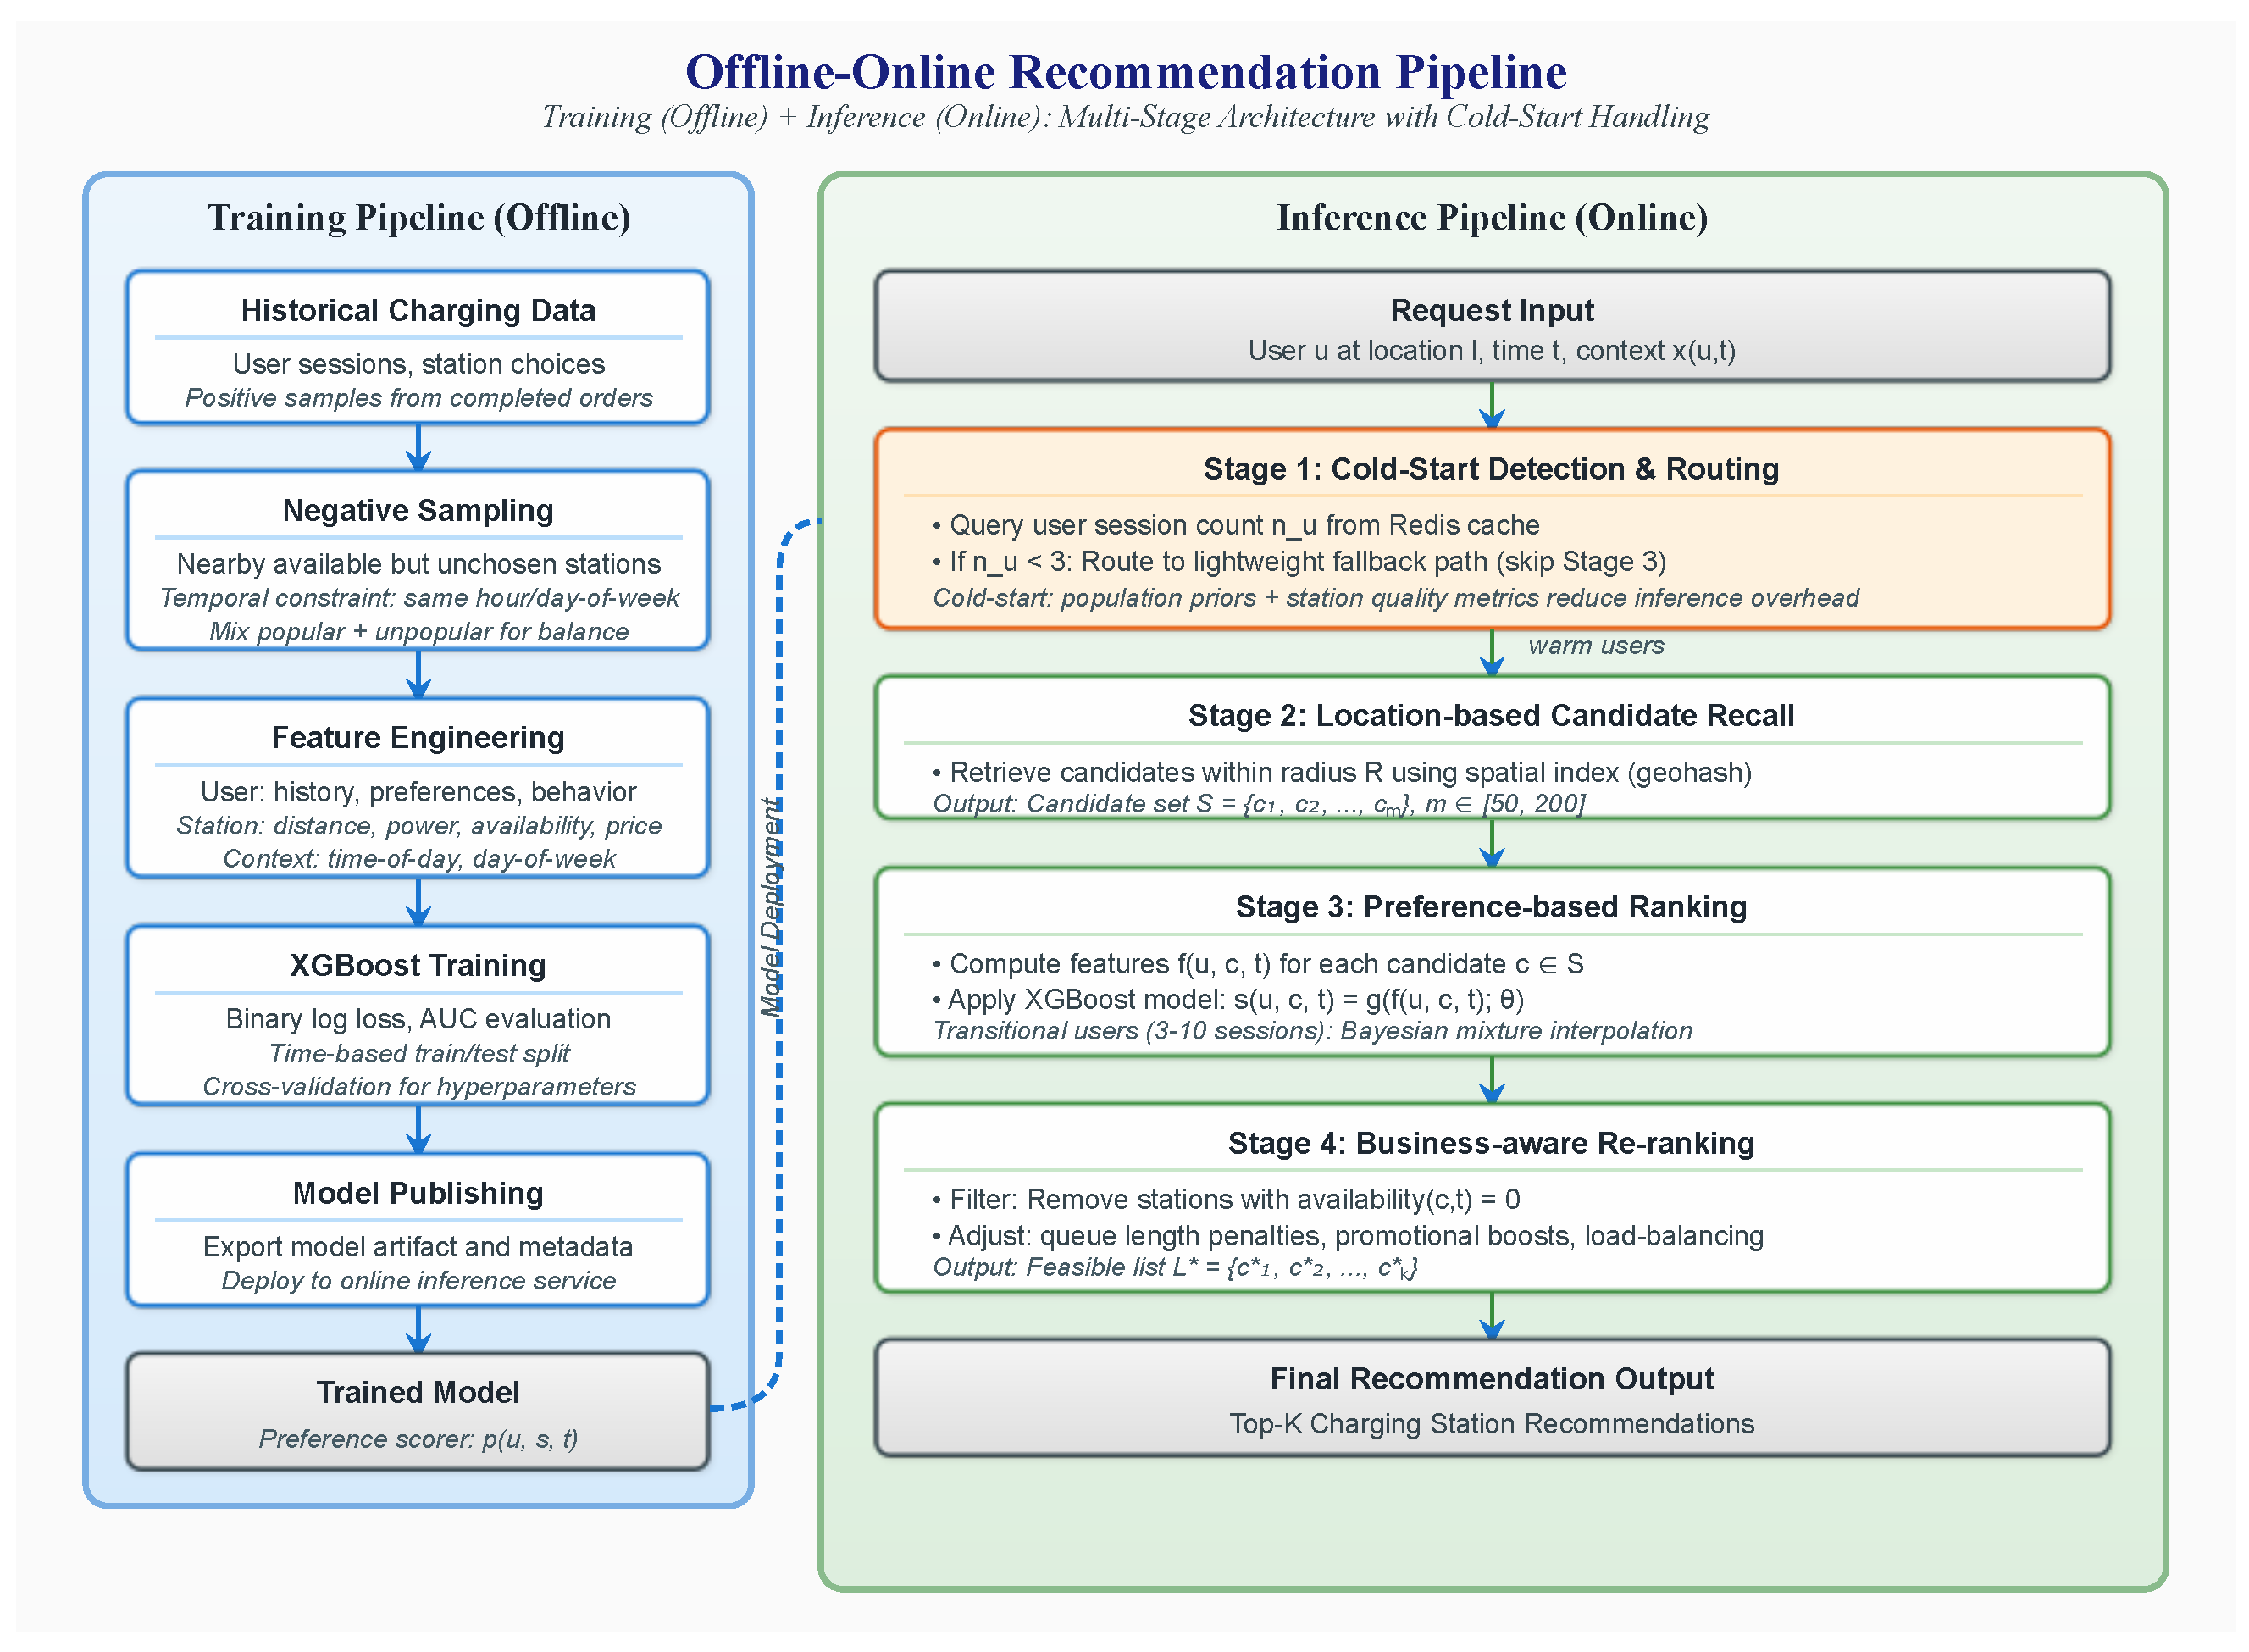
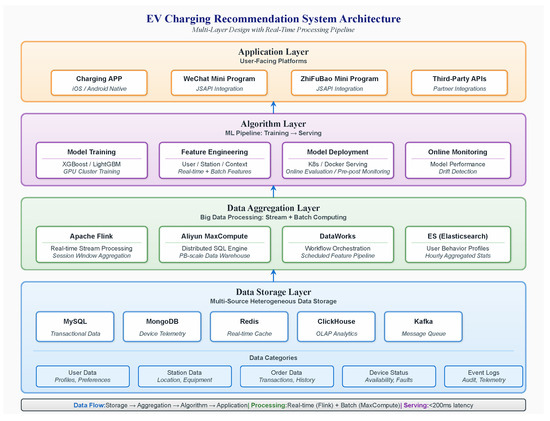
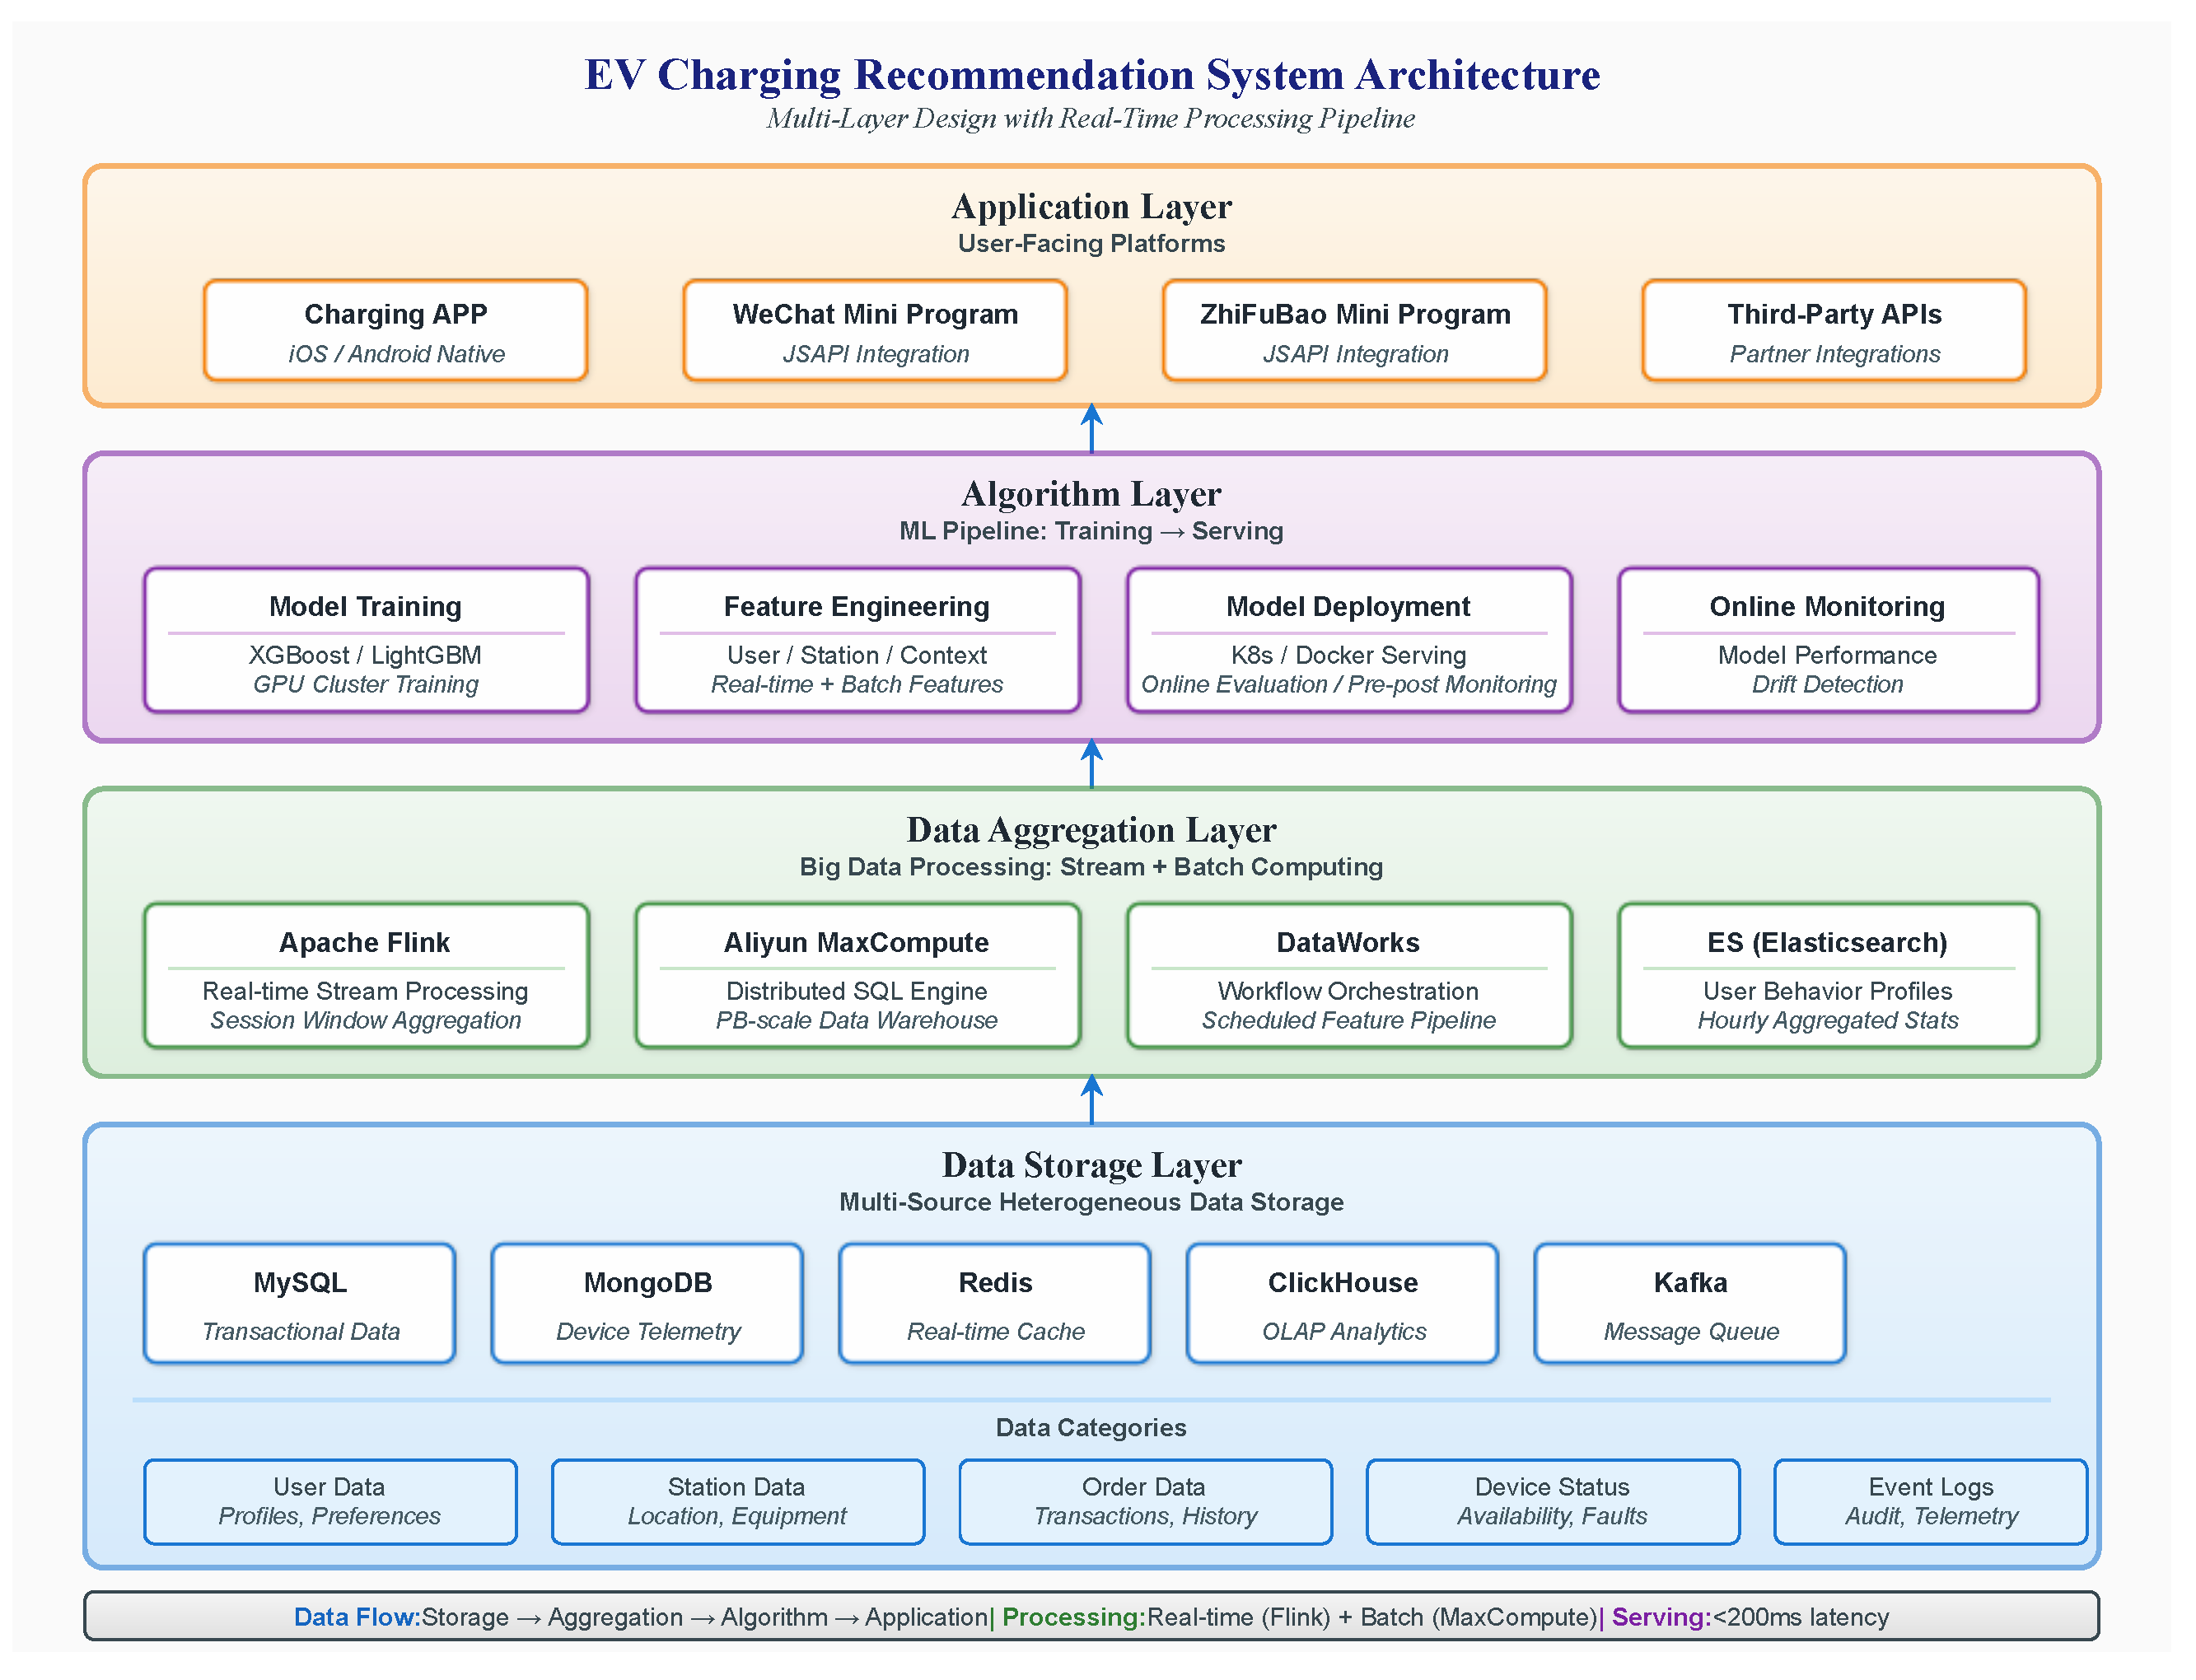
The processes involved in our system are sequential pipelines from the beginning (offline) to the end (online). Offline jobs build training sample sets through aggregated feature extraction from previous historical orders or sessions. They periodically train and publish the preference model (along with new updated user/station feature tables) used in online (real-time) job serving, which implements an online multidimensional pipeline model that systematically balances between computational resource usage, personalization accuracy, and operational feasibility. The online job serving pipeline continues to refine the recommended product list through four stages. Table 4 summarizes the main offline ranking results for the compared recommendation methods. Figure 1 is directly connected to the stage-level results in Table 5. In particular, Stage 3 (preference-aware ranking) corresponds to the row “Stage 2 + Stage 3: Preference ranking”, and Stage 4 (operations-aware re-ranking) corresponds to the row “Stage 2 + Stage 3 + Stage 4: Operationally-constrained re-ranking”. Reading guide: Figure 1 explains algorithmic data flow (Section 3.1 and Section 4 and Table 5), while Figure 2 explains deployment layers and serving context (Section 5, Table 4, and online metrics in Section 5 ).
Table 4.
Comparison of recommendation methods on offline evaluation metrics (evaluated on warm-user test sessions, ).
Figure 1.
Offline-to-online recommendation flowchart with stage-level routing (cold-start detection, candidate recall, preference ranking, and operations-aware re-ranking).
Figure 2.
Four-layer deployment architecture (data storage, data aggregation, algorithm, and application) and real-time serving path.
Stage 1: Cold-Start Detection and Routing. The online service first checks the user’s historical session count and applies the cold-start strategy in Section 3.7. Cold-start users () are routed to a lightweight fallback scorer . Warm users () proceed to the personalized pipeline. For transitional users (), personalized scores can be blended with population-level priors via .
Stage 2: Location-Based Candidate Recall. The system recalls candidate stations within a configurable geographic radius R using a spatial index (geohash), reducing the search space to nearby feasible alternatives.
Stage 3: Preference-Aware Ranking with Operational Signals. Candidates are scored by the preference model using joined user, station, and context features. The model explicitly includes power-matching and local load signals to favor load-balanced choices. The ranked list is then sorted to retain the top-N for subsequent re-ranking. For transitional users (), the mixture mechanism in Section 3.7 can blend personalized scores with population-level priors.
Stage 4: Operationally-Constrained Re-Ranking. The final stage applies hard constraints (e.g., availability, compatibility, and power-cap filtering). It also applies soft operational adjustments (e.g., queue-length penalties, peak-load avoidance, self-operated station prioritization, and load-balancing incentives) to produce the final top-K recommendations.
4. System Architecture and Deployment
Deploying a charging recommendation model requires more than offline accuracy. The online service must be fast, reliable, and easy to operate. It must also enforce feasibility and policy rules. This section summarizes the system architecture used to support those requirements.
4.1. Architecture Overview
The system follows a four-layer architecture (Figure 2). The layers are: (i) Data Storage (business and telemetry data); (ii) Data Aggregation (feature computation); (iii) Algorithm (training and serving); and (iv) Application (APIs and client access). This separation allows each layer to scale and evolve independently. The offline experiments use a 100k-session subset. The deployed service handles substantially higher production traffic. The architecture is designed with that gap in mind. Figure 2 provides the deployment context for the reported metrics: the algorithm and serving layers support the offline ranking outcomes in Table 4 and the stage-level gains in Table 5, while the application layer supports online latency and conversion monitoring.
Table 5.
Stage-level ablation analysis showing incremental Hit@2 improvements.
In the data storage layer, we use multiple storage systems matched to data access patterns:
- A transactional store for core business data (users, stations, orders).
- A telemetry store for charging process traces and device/session logs.
- A cache for hot features and session state to reduce request latency.
- An analytical store for historical aggregates and reporting.
- A message/event bus for streaming logs and asynchronous pipelines.
Data categories include user profiles, station information, charging orders, device status, and system event logs. This polyglot persistence approach allows each data type to be stored in the most appropriate system for its access patterns.
4.2. Data Processing Infrastructure
Data Aggregation Layer. To mitigate the burden on transactional stores from running expensive analytical queries, we process features first in a separate data aggregation layer that publishes these features into “serving-friendly” tables/caches.
The data aggregation layer supports the use of both streaming and batch computing methods:
- Streaming jobs generate instantaneous outputs (availability signals, proxies for queue lengths, short-window demand estimates).
- Scheduled batch jobs aggregate longer time horizons of data (user history features, station popularity).
- The workflow scheduler manages the dependencies between the aggregation layer and is responsible for determining when to refresh the contents of the data aggregates.
- A feature store enables users to consistently access stored features during both model training and at the time of serving predictions.
In the algorithm layer, the MLOps practices used to manage the lifecycle of machine learning models include the following:
- Training and retraining models periodically using updated data and features.
- Consistent preprocessing methods when training and during inference.
- Containerization of model deployments and controlled rollouts.
- Monitoring latency, throughput, score distribution, and feature drift.
For serving reliability, we use health-check-based failover at the service layer and support controlled model rollback through versioned model artifacts in the deployment pipeline. If online quality or latency anomalies are detected, traffic can be shifted back to the previous stable model version.
4.3. Application and Serving
In the application layer, the system exposes recommendations through multiple channels:
- Native Applications: iOS and Android apps provide the primary interface for station discovery, navigation, and charging session management.
- Lightweight embedded clients (e.g., mini programs) integrate payment and location services.
- Partner APIs support third-party navigation and fleet integrations.
All platforms communicate through a unified API gateway handling authentication, rate limiting, and request routing.
Model Serving and Latency Optimization. The online inference service is designed for low latency under high concurrency:
- Request pipeline: candidate retrieval, feature assembly, model inference, and rule-based re-ranking.
- Latency controls: caching and careful feature selection to meet the P99 latency target.
- Horizontal scaling: stateless serving instances behind load balancing and auto-scaling.
5. Results
We report results from three perspectives: offline ranking metrics, online testing, and operational deployment metrics. The goal is to show both recommendation quality and whether the design remains feasible under real serving constraints. We do not optimize grid-level energy objectives. However, recommendation outputs still affect where demand concentrates. Thus, load-related operational effects are reflected in the observed deployment behavior.
5.1. Experimental Setup
Dataset. Our research uses an extensive dataset that includes a large number of allowed charging sessions (over 100,000), stations (over 3000), and users (over 10,000) collected via a private company-owned electric vehicle (EV) charge station. The data were allocated chronologically in keeping with conventional time-based assessment guidelines, with an 80% split designated for training purposes and the remaining 20% held back from being used during training (test set) to avoid using future data. Table 4 and Table 5 show metrics from testing our model against data in the testing dataset.
Comparison points. We contrasted the results of our model with two types of heuristics, as follows:
- Proximity-based ranking [ALL|GEO]: Assigns classes of candidates according to the shortest distance from the user’s current position.
- Social frequency ranking: Assigns classes of candidates based on historical usage.
We additionally included a simple learning-based baseline using a lightweight MLP. The model was implemented as Pipeline(StandardScaler + MLPClassifier).
To ensure feature scaling consistency, the MLP uses two hidden layers (64, 32) with ReLU activation and outputs a binary preference probability for each candidate user–station pair. Training used Adam (), L2 regularization (), max_iter = 200, early_stopping = True, n_iter_no_change = 10, and random_state = 42. During evaluation, candidate stations were ranked by predicted probability within each request group, with metrics computed using the same protocol as other methods (Hit@1/2/3).
Our model’s metrics were assessed using the Hit@K metric, as explained in Section 3.8. The Hit@2 metric is the one we use most frequently, since most users will review two to three recommendations before determining which charging station to use. For statistical uncertainty, the 95% confidence intervals of Hit@2 in Table 4 are estimated by nonparametric bootstrap resampling with runs on the test sessions.
5.2. Offline Evaluation Results
When compared with both heuristic baselines and the learning-based Simple MLP, the proposed method improves all reported cutoffs. In particular, Hit@2 increases from 0.60 to 0.82 (37% relative) versus the proximity heuristic. This matches the product setting, where the client typically displays only a few options.
We additionally conducted ablation studies to quantify the contribution of each pipeline stage and feature group.
Stage-level Ablation: Table 5 presents stage-level ablation results using Hit@2. Following Figure 1, we report the cold-start fallback path first, then the warm-user personalized pipeline (Stages 2 to 4).
Note that the Stage 1 Hit@2 is computed on the cold-start subset defined by . The Stage 2–4 rows are evaluated on warm-user requests that proceed through the personalized path.
For cold-start traffic routed through the fallback path at Stage 1 (defined by rather than manual new-user labels), the population-based recommendation reaches 71% Hit@2 on the cold-start subset. It also avoids the overhead of personalized feature assembly and model inference, which is useful when user history is sparse. In operations, this routing reduces uncertainty from new or infrequent users and helps to stabilize load distribution. In the evaluation cohort, users with at least three historical charging sessions (warm users, ) account for 66.06%, while users with fewer than three sessions (cold-start users, ) account for 33.94%. For users who eventually transition to warm status, the elapsed time from first to third charging session is mean 43.63 days and median 13.14 days.
Stage 3 yields the largest gain over distance-only recall. This shows the value of learning user preferences from historical behavior. Stage 4 then refines the list using request-time feasibility checks and operator policies. These include availability and power-cap filtering, queue penalties, prioritization rules, and load-balancing adjustments. Without Stage 4, the model can still surface candidates that look attractive historically, but which are infeasible or undesirable at request time (e.g., no available chargers or insufficient power headroom).
Operational Radius Setting. The candidate retrieval radius R controls the recall scope and serving cost. In this work, R is not treated as a paper-level tunable hyperparameter. In production, R is configured by business rules rather than per-paper offline re-tuning. The operations team derives a city-specific fixed radius from the station supply distribution and a four-level GPS-grid clustering workflow (province–city–county–grid), with the operational requirement that each service grid contains at least one reachable charging station. Under this policy, the deployed value in our evaluated city is fixed at km. Although R is currently fixed in deployment, it is tunable at the algorithm level, and we leave cross-city quantitative sensitivity analysis of R as future work.
5.3. External Validation on ACN-Data
To strengthen cross-dataset validation, we additionally evaluated the ranking models on ACN-Data [41]. While some operational fields in this dataset differ from our commercial dataset, the model architecture and evaluation protocol remain consistent. Table 6 reports Hit@1/2/3 results, where the baseline is popularity-based ranking.
Table 6.
Offline evaluation on ACN-Data (Hit@1/2/3).
5.4. Supplementary Interpretability Analysis on ACN-Data
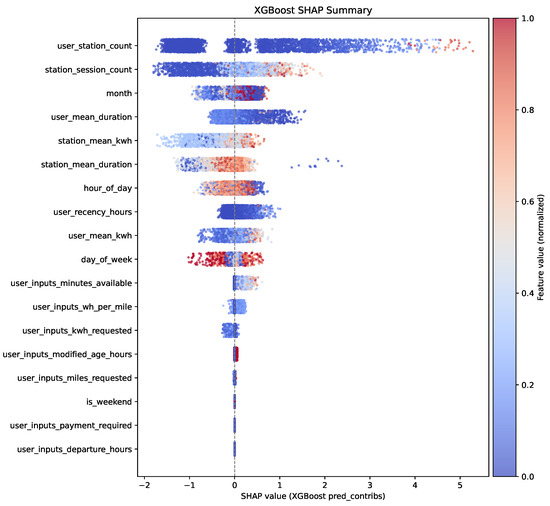
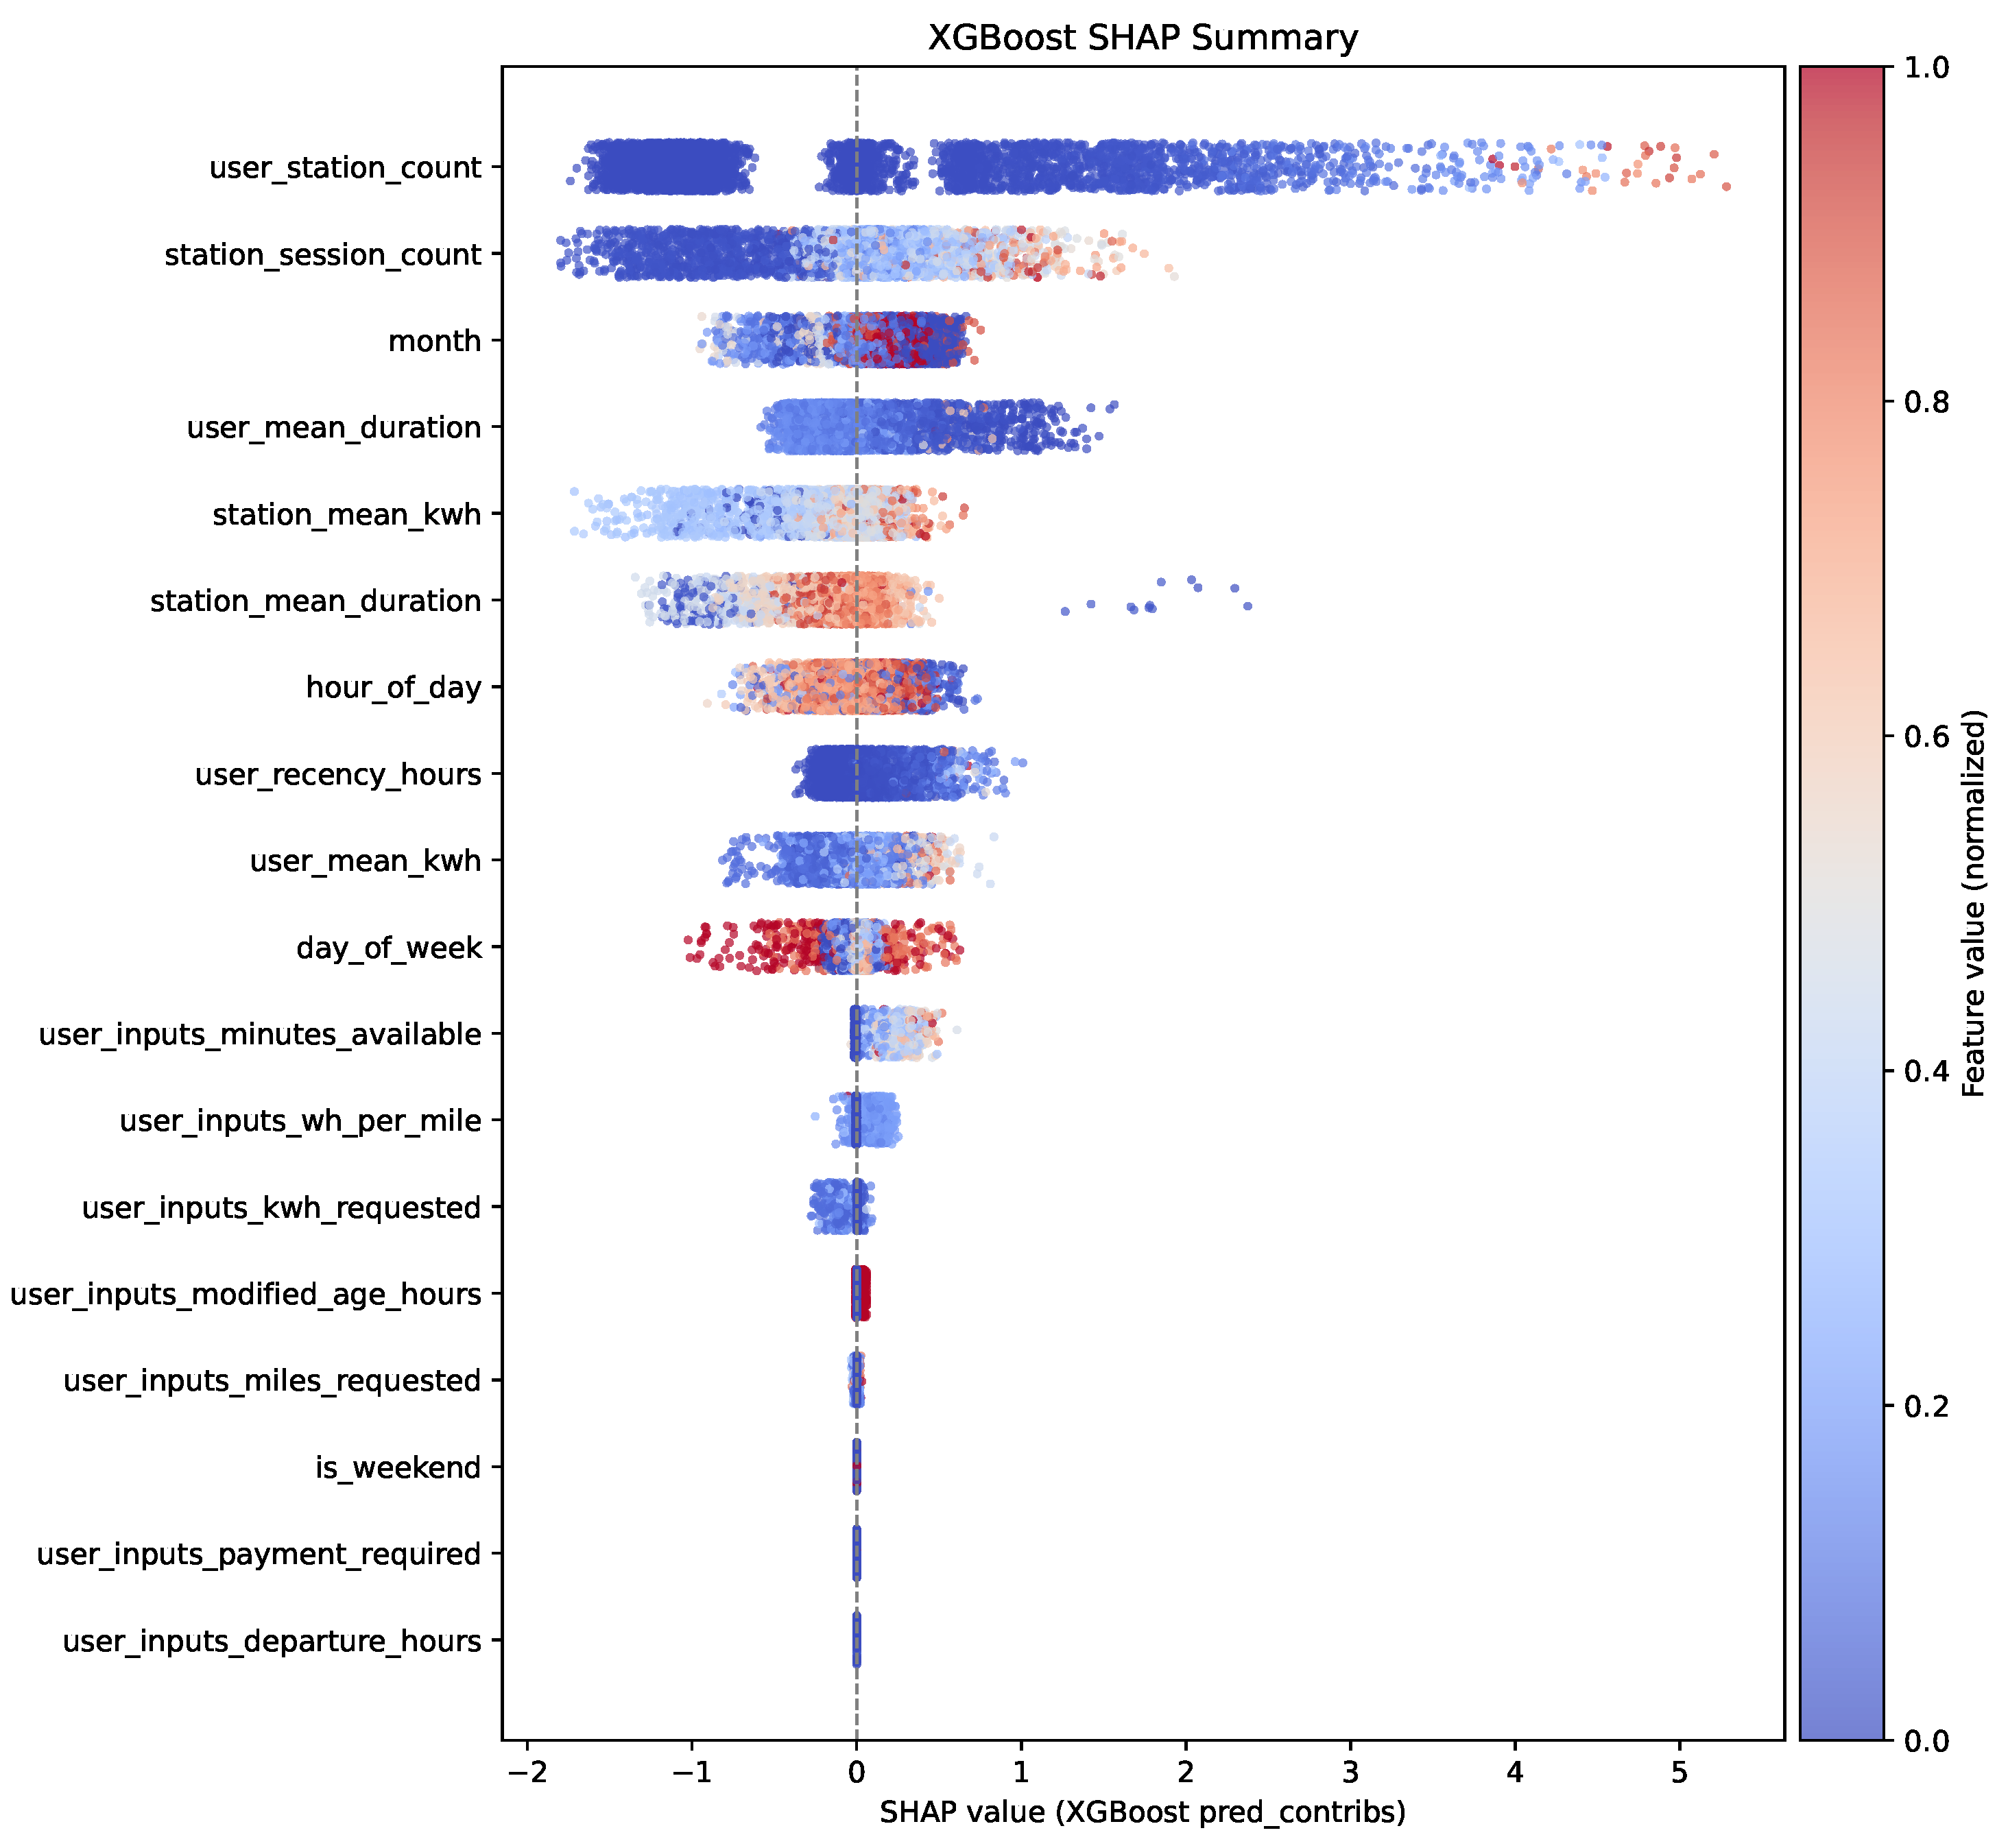
To strengthen operational interpretability, we additionally provide a SHAP-based explanation analysis for the XGBoost model on ACN-Data (Figure 3). Because the ACN-Data fields are not fully identical to our commercial dataset, this analysis is presented as supplementary evidence rather than one-to-one attribution transfer. The figure reports global feature attribution patterns, complementing the rule-based interpretability discussed in Section 6.
Figure 3.
SHAP summary plot of the XGBoost model on ACN-Data (supplementary interpretability evidence).
5.5. Online Testing
Following successful offline validation, the recommendation system was deployed for online testing with comprehensive instrumentation via event tracking logs to measure real-world performance.
Deployment Protocol. The system was deployed in a single metropolitan region for online testing with real-time monitoring of latency distributions and user behavioral metrics. Online evaluation used a pre–post operational comparison rather than a randomized A/B test. Specifically, we evaluated one Kubernetes serving node in one city, comparing a 10-day treatment window using the proposed pipeline against the immediately preceding 10-day control window under the previous strategy. We report the same online metric (selection-to-completion) across both windows. Because this design is non-randomized and temporal, results may be affected by time-varying factors. Therefore, the online findings should be interpreted as operational evidence rather than causal A/B estimates.
Online Metrics via Event Tracking. In online serving, the system displays a Top-3 list of recommended stations per request, and user interaction signals were captured through client-side and server-side instrumentation:
- Station selection: User selects a recommended station.
- Charging completion: User successfully completes charging session at recommended station.
Key Results. In online serving, we observe the following:
- Selection-to-completion conversion: Among recommendation events/sessions where a station was selected from the Top-3 list, 80% subsequently completed charging at that station (an online conversion metric, not a Hit@K ranking metric).
- System latency: P99 < 200 ms under peak traffic conditions.
The reported latency is measured under the observed city-level production load profile of this deployment. This recommendation scenario is not highly concurrent; peak traffic is typically about 1–2 requests per second, with low-request periods (including near-zero traffic) during late-night hours. Therefore, P99 < 200 ms should be interpreted under this operational traffic profile.
These metrics, derived from event tracking log analysis, reflect end-to-end online behavioral outcomes. They should be interpreted separately from offline Hit@K. Offline Hit@K evaluates ranking accuracy on held-out sessions.
6. Discussion
The experimental and deployment results show the practical value of combining user preference modeling with operational constraints in a unified framework. Offline evaluation achieves Hit@2 of 0.82, a 37% relative improvement over proximity baselines. In online deployment, we observe 80% selection-to-completion conversion for the Top-3 display and P99 latency below 200 ms. However, offline and online metrics represent different system layers (ranking quality versus end-to-end behavioral outcomes). Therefore, we report and interpret them separately rather than comparing them directly.
Beyond specific model choices, the key takeaway is architectural: preference learning performs better in production when embedded in a pipeline that enforces feasibility and supports operational control. A single end-to-end model is less practical in this setting for four reasons: hard feasibility constraints must be explicitly enforced, full-catalog ranking is too expensive for low-latency serving, some operational signals change faster than retraining cycles, and cold-start traffic requires staged fallback logic. The proposed multi-stage design addresses these requirements while preserving explainability and governance flexibility.
6.1. Comparative Analysis with State-of-the-Art Approaches
To contextualize our contributions, we compare the proposed framework with representative recent works across four dimensions. These dimensions are architectural scope, computational efficiency, deployment validation, and operational interpretability. Table 7 summarizes this comparison.
Table 7.
Comparative analysis of EV charging recommendation approaches.
- (1)
- Architectural Scope: System-Level vs. Algorithm-Centric Design. Most existing works optimize specific algorithmic components in isolation. Habbal and Alrifaie [9] remain at ranking-level preference aggregation, Lin et al. [10] focus on decision-theoretic decomposition, and RLCharge [12] shows strong offline performance but introduces deployment complexity for real-time serving.In contrast, our work adopts an end-to-end system perspective. We construct a complete four-layer infrastructure (data storage, data aggregation, algorithm, and application) that addresses the full range of operational requirements. This architectural design enables seamless integration of diverse data sources and efficient real-time feature computation. It also enables flexible policy configuration. These are capabilities that algorithm-centric approaches lack.
- (2)
- Computational Efficiency and Production-Grade Latency. Real-time recommendation requires strict latency budgets. Although deep RL approaches are attractive for long-horizon optimization, they often add training/inference overhead that is difficult to sustain at serving time; this applies to both RLCharge-style actor–critic designs [12] and Seq2Seq-augmented safe RL pipelines [11].Our system achieves P99 latency under 200 ms through several engineering innovations. These include: (1) precomputed feature caches in Redis that eliminate real-time aggregation overhead; (2) a lightweight XGBoost ranking model with optimized inference paths; (3) location-based candidate recall enabling sublinear retrieval complexity; and (4) asynchronous feature updates via streaming pipelines that decouple batch computation from serving latency. This performance level enables stable serving under high-volume operational traffic.
- (3)
- Operational Deployment vs. Simulation-Only Validation. Many prior studies rely on simulation or offline-only validation [9,10,11,12]. While methodologically useful, these settings do not fully reflect real operational dynamics or end-to-end user behavior in production charging services.Our work provides deployment validation across three complementary dimensions: (1) large-scale offline evaluation on 100k+ charging sessions with significant metric improvements; (2) online testing with real users confirming behavioral alignment; and (3) system-level deployment readiness with measurable latency performance. The documented 80% selection-to-completion conversion measures users who select a recommended station and then complete charging at that station. This deployment metric is rarely reported in prior work, and requires instrumented event tracking across the complete user journey.
- (4)
- Operational Interpretability for Cross-Functional Collaboration. Industrial recommendation systems require interpretable decision rationale for operations and business teams. Deep RL policies are often hard to debug operationally, while MCDM approaches are transparent but rely on manually specified weights.Our framework emphasizes operationally transparent control through explicit re-ranking rules. These include availability thresholds, power-cap alignment, self-operated station prioritization, and load-balancing policies. These rules are independently configurable without model retraining. This separation between preference ranking and policy-aware re-ranking makes the system easier to debug, and also makes it easier to adjust under evolving operational and business objectives.
Table 7 uses representative methods rather than exhaustive coverage. Other preference-learning families (e.g., collaborative filtering, neural collaborative filtering, actor–critic) provide useful personalization signals [19,20,27] but are commonly evaluated as isolated algorithmic modules instead of full operational systems with explicit feasibility enforcement and serving-SLO constraints.
6.2. Limitations and Future Directions
Limitations. Several limitations deserve mention. First, the model relies on historical patterns. It may lag when user preferences shift suddenly due to new station openings, pricing changes, or promotions. Second, the current system focuses on station recommendation. It does not directly optimize route planning, grid-level demand response, or power-system balancing. Third, although the feature engineering is designed for generality, model parameters are trained on data from one commercial platform. Deployment to different regions or markets may require retraining with local data. We additionally report ACN-Data results in Table 6. While the same modeling pipeline outperforms the popularity-based baseline on ACN-Data, field differences between datasets still limit direct one-to-one comparability with the commercial deployment setting. In addition, although the candidate radius R is tunable at the algorithm level, the current deployment uses a business-fixed value ( km). A quantitative cross-city sensitivity study of R is left for future work. We also monitored score/feature distributions for potential concept drift in production, but this revision does not include a standalone quantitative drift-detection report. We plan to add drift statistics in a future operational analysis update. Another limitation is that charging strategy decisions (e.g., fast-charging use and charging schedules) are out of scope, even though they can interact with user preferences, battery health, and network efficiency [13,14].
Future Directions. Several extensions merit investigation. These include: (1) more adaptive feature refresh strategies to reduce lag under rapid preference changes; (2) integration of dynamic pricing response models that anticipate user reactions to price changes; and (3) coordination with grid-level optimization to support vehicle-to-grid (V2G) objectives and demand response. While this revision adds supplementary SHAP-based interpretability evidence on ACN-Data, future work will extend interpretability analysis with broader cross-dataset and city-level stability checks. For preference modeling, dynamic adaptation under sparse feedback remains an active research area. Global–local attention mechanisms for dynamic preference modeling may help to improve robustness under long-tail and cold-start conditions [42].
7. Conclusions
This paper has presented a deployment-validated and operations-aware charging station recommendation framework. The proposed framework bridges the gap between academic modeling and large-scale operational deployment. Unlike prior algorithm-focused studies that optimized isolated components, our work takes an end-to-end system view. It jointly integrates user preference learning, spatial accessibility, and operational constraints in a unified multi-stage pipeline.
Extensive offline experiments on over 100k real charging sessions show that combining learned user preferences with power-matching and load-aware signals substantially improves recommendation effectiveness. The proposed system achieves Hit@2 of 0.82, a 37% relative improvement over proximity heuristics. Online testing confirms that these accuracy gains translate into real behavioral outcomes. The system keeps P99 latency below 200 ms under peak traffic, and achieves 80% selection-to-completion conversion for Top-3 recommendations. These results provide strong evidence that operationally-constrained re-ranking is not just a theoretical improvement but a necessary component for reliable and scalable charging recommendation services.
Beyond performance gains, this work highlights the importance of separating preference modeling from operational control. By implementing hard feasibility constraints and soft operational objectives as a configurable re-ranking layer, the proposed framework allows for transparent policy adjustment without model retraining. This enables effective collaboration among algorithm, operations, and business teams. The design offers a practical path for deploying intelligent recommendation systems in safety-critical and latency-sensitive charging environments. The multi-stage design also works with different preference-learning modules (e.g., MCDM [9], collaborative filtering [19,20], and preference-aware actor–critic methods [27]). These modules only need to produce ranking scores over feasible candidates.
Looking forward, several research directions are worth exploring. Future work will investigate more adaptive mechanisms for rapid preference changes, and will also investigate tighter integration with route planning and grid-level decision support (e.g., demand response and V2G coordination). Additionally, broader generalization will be explored across different regional markets. We believe the principles shown in this study provide a reusable framework for deploying user-focused and operations-aware recommendation systems in large-scale EV services.
Author Contributions
Conceptualization, J.C.; methodology, J.C.; software, J.C.; validation, J.C.; formal analysis, J.C.; investigation, J.C.; data curation, J.C.; writing: original draft preparation, J.C.; writing: review and editing, J.C. and X.L. All authors have read and agreed to the published version of the manuscript.
Funding
This research received no external funding.
Data Availability Statement
The original contributions presented in this study are included in the article. Further inquiries can be directed to the corresponding authors.
Conflicts of Interest
The authors declare no conflicts of interest.
References
- Tightiz, L.; Dang, L.M.; Yoo, J.; Padmanaban, S. A comprehensive review on AIoT applications for intelligent EV charging/discharging ecosystem. Energy Convers. Manag. X 2025, 27, 101088. [Google Scholar] [CrossRef] [Scilit]
- Satpathy, P.R.; Ramachandaramurthy, V.K.; Radha Krishnan, T.R.; Padmanaban, S. Technological innovations and sustainable strategies for advancing electric vehicle performance and market integration. Energy Strategy Rev. 2025, 60, 101790. [Google Scholar] [CrossRef] [Scilit]
- Jiang, Q.; Zhang, N.; Yueshuai He, B.; Lee, C.; Ma, J. Large-scale public charging demand prediction with a scenario- and activity-based approach. Transp. Res. Part A Policy Pract. 2024, 179, 103935. [Google Scholar] [CrossRef] [Scilit]
- Liu, Q.; Liu, J.; Le, W.; Guo, Z.; He, Z. Data-driven intelligent location of public charging stations for electric vehicles. J. Clean. Prod. 2019, 232, 531–541. [Google Scholar] [CrossRef] [Scilit]
- Zhang, W.; Yuan, Z.; Liu, H. Electric Vehicle Charging Recommendation. In Encyclopedia of GIS; Springer: Cham, Switzerland, 2025; pp. 1–11. [Google Scholar] [CrossRef] [Scilit]
- Nie, J.; Xia, S.; Liu, Y.; Ding, S.; Hu, L.; Zhao, M.; Fan, Y.; Abdel-Aty, M.; Preindl, M.; Jiang, X. A Data-Driven and Human-Centric EV Charging Recommendation System at City-Scale. In Proceedings of the 14th ACM International Conference on Future Energy Systems, Orlando, FL, USA, 20–23 June 2023; pp. 427–438. [Google Scholar] [CrossRef] [Scilit]
- Xu, P.; Zhang, J.; Gao, T.; Chen, S.; Wang, X.; Jiang, H.; Gao, W. Real-time fast charging station recommendation for electric vehicles in coupled power-transportation networks: A graph reinforcement learning method. Int. J. Electr. Power Energy Syst. 2022, 141, 108030. [Google Scholar] [CrossRef] [Scilit]
- Savari, G.F.; Krishnasamy, V.; Sathik, J.; Ali, Z.M.; Abdel Aleem, S.H. Internet of Things based real-time electric vehicle load forecasting and charging station recommendation. ISA Trans. 2020, 97, 431–447. [Google Scholar] [CrossRef] [Scilit]
- Habbal, A.; Alrifaie, M.F. A User-Preference-Based Charging Station Recommendation for Electric Vehicles. IEEE Trans. Intell. Transp. Syst. 2024, 25, 11617–11634. [Google Scholar] [CrossRef] [Scilit]
- Lin, H.; Lin, X.; Labiod, H.; Chen, L. Toward Multiple-Phase MDP Model for Charging Station Recommendation. IEEE Trans. Intell. Transp. Syst. 2022, 23, 10583–10595. [Google Scholar] [CrossRef] [Scilit]
- Liao, Q.; Li, G.; Yu, J.; Gu, Z.; Ma, W. Online prediction-assisted safe reinforcement learning for electric vehicle charging station recommendation in dynamically coupled transportation-power systems. Transp. Res. Part C Emerg. Technol. 2025, 176, 105155. [Google Scholar] [CrossRef] [Scilit]
- Zhang, W.; Liu, H.; Xiong, H.; Xu, T.; Wang, F.; Xin, H.; Wu, H. RLCharge: Imitative Multi-Agent Spatiotemporal Reinforcement Learning for Electric Vehicle Charging Station Recommendation. IEEE Trans. Knowl. Data Eng. 2023, 35, 6290–6304. [Google Scholar] [CrossRef] [Scilit]
- Hegde, B.; Haskara, I. Electric Vehicle Battery Health Aware DC Fast-Charging Recommendation System; SAE Technical Paper Series; SAE: Warrendale, PA, USA, 2024. [Google Scholar] [CrossRef] [Scilit]
- Wang, J.; Jing, H.; Ou, S.S.; Lin, Z. Optimizing Battery Charging Strategies through Q-Learning and Electric Vehicle Powertrain System Modeling; SAE Technical Paper Series; SAE: Warrendale, PA, USA, 2025. [Google Scholar] [CrossRef] [Scilit]
- Li, H.; Han, Q.; Bai, X.; Zhang, L.; Wang, W.; Chen, W.; Xiang, L. Electric Vehicle Charging Station Recommendations Considering User Charging Preferences Based on Comment Data. Energies 2024, 17, 5514. [Google Scholar] [CrossRef] [Scilit]
- Li, X.; Sun, Y.; Shi, M.; Jia, Y. Multi-stage Charging Recommendation of Charging Station Considering User’s Charging Behavior. In Proceedings of the 2023 5th Asia Energy and Electrical Engineering Symposium (AEEES) 2023, Chengdu, China, 23–26 March 2023; pp. 1247–1251. [Google Scholar] [CrossRef] [Scilit]
- Seyedyazdi, M.; Mohammadi, M.; Farjah, E. A Combined Driver-Station Interactive Algorithm for a Maximum Mutual Interest in Charging Market. IEEE Trans. Intell. Transp. Syst. 2020, 21, 2534–2544. [Google Scholar] [CrossRef] [Scilit]
- Teimoori, Z.; Yassine, A. User-centric Charging Service Recommendation for Electric Vehicles. In Proceedings of the 2024 IEEE 22nd Mediterranean Electrotechnical Conference (MELECON), Porto, Portugal, 25–27 June 2024; pp. 739–743. [Google Scholar] [CrossRef] [Scilit]
- Zhao, Y.; Wang, Z.; Man, Y.; Wen, H.; Han, W.; Wang, P. Intelligent charging recommendation model based on collaborative filtering. In Proceedings of the 2021 IEEE International Conference on Electronic Technology, Communication and Information (ICETCI); IEEE: Piscataway, NJ, USA, 2021; pp. 7–10. [Google Scholar] [CrossRef] [Scilit]
- Li, L. An Algorithm Study of Personalized Recommendation for Electric Vehicle Charging Piles Based on Deep Learning Framework. In Proceedings of the International Conference on Image Processing, Machine Learning and Pattern Recognition, Guangzhou, China, 13–15 September 2024; pp. 640–644. [Google Scholar] [CrossRef] [Scilit]
- Xu, H.; You, F. Fast recommendation algorithm for electric vehicle charging stations sharing model based on hash feature matching. In Proceedings of the Third International Conference on Algorithms, Network, and Communication Technology (ICANCT 2024), Wuhan, China, 20–22 December 2025. [Google Scholar] [CrossRef] [Scilit]
- Lin, H.; Li, X.; Cao, Y.; Labiod, H.; Ahmad, N. PDQN: User Preference-Based Charging Station Recommendation. IEEE Trans. Consum. Electron. 2024, 70, 5238–5250. [Google Scholar] [CrossRef] [Scilit]
- Fan, X.; Gao, Y.; Zhang, F. DST: Personalized Charging Station Recommendation for Electric Vehicles Based on Deep Reinforcement Learning and Spatio-Temporal Preference Analysis. 2024 IEEE International Conference on Web Services (ICWS); IEEE: Piscataway, NJ, USA, 2024; pp. 330–341. [Google Scholar] [CrossRef] [Scilit]
- Bachiri, K.; Yahyaouy, A.; Gualous, H.; Malek, M.; Bennani, Y.; Makany, P.; Rogovschi, N. Multi-Agent DDPG Based Electric Vehicles Charging Station Recommendation. Energies 2023, 16, 6067. [Google Scholar] [CrossRef] [Scilit]
- Zhang, W.; Liu, H.; Wang, F.; Xu, T.; Xin, H.; Dou, D.; Xiong, H. Intelligent Electric Vehicle Charging Recommendation Based on Multi-Agent Reinforcement Learning. In Proceedings of the Web Conference 2021; Association for Computing Machinery: New York, NY, USA, 2021; pp. 1856–1867. [Google Scholar] [CrossRef] [Scilit]
- Suanpang, P.; Jamjuntr, P. Optimizing Electric Vehicle Charging Recommendation in Smart Cities: A Multi-Agent Reinforcement Learning Approach. World Electr. Veh. J. 2024, 15, 67. [Google Scholar] [CrossRef] [Scilit]
- Li, C.; Dong, Z.; Fisher, N.; Zhu, D. Coupling User Preference with External Rewards to Enable Driver-centered and Resource-aware EV Charging Recommendation. In Joint European Conference on Machine Learning and Knowledge Discovery in Databases; Lecture Notes in Computer Science; Springer: Cham, Switzerland, 2023; pp. 3–19. [Google Scholar] [CrossRef] [Scilit]
- Cao, Y.; Jiang, T.; Kaiwartya, O.; Sun, H.; Zhou, H.; Wang, R. Toward Pre-Empted EV Charging Recommendation Through V2V-Based Reservation System. IEEE Trans. Syst. Man Cybern. Syst. 2021, 51, 3026–3039. [Google Scholar] [CrossRef] [Scilit]
- Liu, S.; Xia, X.; Cao, Y.; Ni, Q.; Zhang, X.; Xu, L. Reservation-based EV charging recommendation concerning charging urgency policy. Sustain. Cities Soc. 2021, 74, 103150. [Google Scholar] [CrossRef] [Scilit]
- Liu, S.; Cao, Y.; Ruan, W.; Ni, Q.; Nati, M.; Suthaputchakun, C. EV Charging Recommendation Concerning Preemptive Service and Charging Urgency Policy. In 2020 IEEE 92nd Vehicular Technology Conference (VTC2020-Fall); IEEE: Piscataway, NJ, USA, 2020. [Google Scholar] [CrossRef] [Scilit]
- Cao, Y.; Kaiwartya, O.; Zhuang, Y.; Ahmad, N.; Sun, Y.; Lloret, J. A Decentralized Deadline-Driven Electric Vehicle Charging Recommendation. IEEE Syst. J. 2019, 13, 3410–3421. [Google Scholar] [CrossRef] [Scilit]
- Houalef, A.R.; Delavernhe, F.; Senouci, S.M.; Aglzim, E.H. Data-driven, personalized route planning for connected electric vehicles: Optimizing time, energy, and charging stops. Appl. Energy 2025, 402, 126887. [Google Scholar] [CrossRef] [Scilit]
- Ravipati, S.S.R.K.; Jalluri, S.R.; Kunta, S. SAT-Based Optimization Framework for Electric Vehicle Charging Station Routing Under Real-World Constraints. World Electr. Veh. J. 2025, 16, 659. [Google Scholar] [CrossRef] [Scilit]
- Tu, W.; Ye, H.; Mai, K.; Zhou, M.; Jiang, J.; Zhao, T.; Yi, S.; Li, Q. Deep online recommendations for connected E-taxis by coupling trajectory mining and reinforcement learning. Int. J. Geogr. Inf. Sci. 2023, 38, 216–242. [Google Scholar] [CrossRef] [Scilit]
- Suanpang, P.; Jamjuntr, P.; Kaewyong, P.; Niamsorn, C.; Jermsittiparsert, K. An Intelligent Recommendation for Intelligently Accessible Charging Stations: Electronic Vehicle Charging to Support a Sustainable Smart Tourism City. Sustainability 2022, 15, 455. [Google Scholar] [CrossRef] [Scilit]
- Wu, B.; Wang, X.; Sun, G.; Liu, R. A spatiotemporal charging recommendation strategy for electric vehicles considering grid connection mode differences. Int. J. Electr. Power Energy Syst. 2025, 172, 111345. [Google Scholar] [CrossRef] [Scilit]
- Chen, W.; Liu, D.; Cao, J. Personalized-Preference-Based Electric Vehicle Charging Recommendation Considering Photovoltaic Consumption: A Transfer Reinforcement Learning Method. IEEE Trans. Transp. Electrif. 2025, 11, 4121–4132. [Google Scholar] [CrossRef] [Scilit]
- Ran, L.; Wan, Y.; Qin, J.; Fu, W.; Zhang, D.; Kang, Y. A Game-Based Battery Swapping Station Recommendation Approach for Electric Vehicles. IEEE Trans. Intell. Transp. Syst. 2023, 24, 9849–9860. [Google Scholar] [CrossRef] [Scilit]
- Wang, Z.; Hou, S. A real-time strategy for vehicle-to-station recommendation in battery swapping mode. Energy 2023, 272, 127154. [Google Scholar] [CrossRef] [Scilit]
- Zhou, E.; Li, Z.; Liu, D.; Xiang, C.; Chen, J.; Cheng, W. Balancing Electric Scooter Battery Swapping Network by Spatio-Temporal Recommendation. IEEE Trans. Intell. Transp. Syst. 2024, 25, 21315–21326. [Google Scholar] [CrossRef] [Scilit]
- Lee, Z.J.; Li, T.; Low, S.H. ACN-Data: Analysis and Applications of an Open EV Charging Dataset. In Proceedings of the Tenth International Conference on Future Energy Systems (e-Energy 2019); Association for Computing Machinery: New York, NY, USA, 2019. [Google Scholar] [CrossRef] [Scilit]
- Liu, R.; He, L.; Zheng, J. GLARA: A Global-Local Attention Framework for Semantic Relation Abstraction and Dynamic Preference Modeling in Knowledge-Aware Recommendation. Appl. Sci. 2025, 15, 6386. [Google Scholar] [CrossRef] [Scilit]

Disclaimer/Publisher’s Note: The statements, opinions and data contained in all publications are solely those of the individual author(s) and contributor(s) and not of MDPI and/or the editor(s). MDPI and/or the editor(s) disclaim responsibility for any injury to people or property resulting from any ideas, methods, instructions or products referred to in the content. |
© 2026 by the authors. Published by MDPI on behalf of the World Electric Vehicle Association. Licensee MDPI, Basel, Switzerland. This article is an open access article distributed under the terms and conditions of the Creative Commons Attribution (CC BY) license.