


Abstract
The growing adoption of electric vehicles highlights the need for safe and reliable battery thermal management. Hybrid battery thermal management systems (HBTMSs) that combine phase change material (PCM) with liquid cooling improve thermal regulation but also increase reliability challenges due to added component complexity. This research applies fuzzy fault-tree analysis (FFTA) to a hybrid PCM liquid BTMS by extending a previously developed and evaluated deterministic fault tree into the fuzzy domain. Basic events with limited failure rate data are quantified using expert elicitation, linguistic variables, consistency-based weighting, and centre-of-area defuzzification. The baseline point-estimate top event probability is 0.150821 as a dimensionless conditional estimate under the adopted fault-tree structure and input assumptions, while fuzzy-bound propagation produces an uncertainty interval from 0.083095 to 0.276142, with a modal coordinate estimate of 0.150824. Complementary reliability analyses were conducted to examine dominant failure modes, uncertainty propagation, and opportunities for improvement. An additional fuzzy-spread and interval-sensitivity assessment distinguished the relative uncertainty of individual basic-event probabilities from their influence on the overall top event uncertainty, identifying BE10 and BE3 as the most influential events for reducing the propagated uncertainty interval. Sensitivity assessments involving alternative expert-weighting parameters and selected dependent basic-event pairs provided additional examination of the influence of modelling assumptions. Within the adopted model, PCM leakage in the tank and module received the highest reliability priority, followed by bearing failure, transducer drift, PCM degradation, relay inaction, and operational transients. The proposed framework provides an uncertainty-aware, action-oriented foundation for reliability-driven HBTMS design improvement.
1. Introduction
Growing worries about climate change, environmental harm, and shrinking energy resources have pushed people to shift from internal combustion engine (ICE) vehicles to greener ways of getting around. Electric vehicles (EVs) and hybrid electric vehicles (HEVs) have surfaced as viable alternatives, providing diminished greenhouse gas emissions and autonomy from fossil fuels. The lithium-ion (Li ion) battery pack is fundamental to these vehicles, recognised for its high specific energy density, extended cycle life, advantageous stability, and absence of memory effect.
The operating temperature has a significant effect on the performance, safety and lifetime of lithium-ion batteries. The operating temperature has a huge impact on the performance, safety, and life of Li-ion batteries. The maximum performance of conventional Li-ion batteries is generally obtained when the cell temperature is within a fairly narrow range (typically cited as 15 °C to 35 °C) [1,2]. Although some studies report a broader acceptable operating-temperature region extending approximately from −20 °C to 60 °C, this should not be interpreted as the optimal range for sustained battery operation [1]. If the temperature differs from this range, there can be a serious drop in performance. Higher temperatures cause a faster degradation of capacity and accelerate ageing, while lower temperatures increase the internal resistance and thus reduce efficiency and power output. Research shows that cycling the batteries for long periods at temperatures above 45 °C can lead to serious capacity loss, with the cells losing more than 60% of their original capacity after just 600 cycles at 50 °C.
The large amount of heat generated by lithium-ion batteries is a result of the electrochemistry, internal resistance and external factors (particularly when being charged rapidly or under a heavy load). If this heat is not properly managed, it can lead to thermal runaway, which can in turn result in a fire or an explosion. Similarly, an uneven temperature distribution within a battery pack with temperatures between cells of more than 5 °C will accelerate local damage and reduce the pack’s overall reliability.
Given all of that, it is absolutely essential to have an efficient battery thermal management system (BTMS). The BTMS has to keep the battery temperature within the ideal range of operation and ensure that the temperature is evenly distributed across the cells. This will, of course, improve safety, extend the service life and improve energy efficiency. Of the various BTMS methods, phase change materials (PCMs) have attracted interest because of their high heat capacity and their ability to absorb and release thermal energy when undergoing phase changes, which allows them to effectively delay rises in temperature and reduce the risk of overheating. However, because of their inherently low thermal conductivity, hybrid systems must be used, for example, by combining the PCM with liquid cooling, in order to achieve both considerable heat absorption and rapid heat dissipation.
Electric vehicles can be divided into battery electric vehicles (BEVs), hybrid electric vehicles (HEVs), plug-in hybrid electric vehicles (PHEVs), and fuel cell electric vehicles (FCEVs). Even though they are classified in this way, all of the categories are at risk of experiencing thermal runaway, which shows that there is a general need for an effective BTMS [3]. Reviews of BTMS technologies reveal that hybrid configurations which combine PCM with either liquid or forced air cooling always perform better than single-mode cooling methods, in particular when high discharge rates and fast charging are involved [4,5]. It has also been found that incorporating PCM into metal foam or graphite matrices improves the low thermal conductivity of the PCM and thus enhances the transfer of heat to the surrounding coolant [6]. As battery reliability directly influences vehicle safety, performance, and cost of ownership, several studies have identified reliability assessment as an essential complement to thermal design. This has motivated fault tree-based safety evaluation of the electrical and thermal subsystems within the EV powertrain [7,8].
It is necessary to carry out a reliability analysis if the performance and safety of engineering systems are to be evaluated [9,10]. There are a variety of methods available, each with its own advantages and disadvantages. The probabilistic risk assessment (PRA) is a comprehensive method used for examining the reliability of a system by looking at the probability of component and/or system failures [11]. Fault tree analysis (FTA) is an important part of probabilistic risk assessment (PRA) and provides a systematic way of identifying possible failures, both in quantitative and qualitative terms [11].
The Monte Carlo Simulation method is capable of assessing system reliability, especially in the case of dependence structures, load sharing, and damage accumulation [12]. By combining analytical reliability analysis at the component level with system-level simulations, it is possible to take into account the dynamic aspects of system behaviour [12]. The first/second order reliability method (FORM/SORM) is used in order to deal with the uncertainties present in engineering systems [13]. This method calculates the failure probability and the reliability index in order to evaluate the risks and to estimate the consequences of failure [13]. Reliability-based optimal design involves the use of reliability analysis techniques in order to improve the design of electromagnetic devices [14].
Informetric mapping involves the analysis of a large number of papers relating to FTA in order to understand the current state of research and the trends in its development [15]. Fuzzy comprehensive evaluation (FCE) is employed for mid- to long-term reliability assessment, especially in systems where data is sourced from SCADA (supervisory control and data acquisition) systems [16].
Accelerated life testing (ALT) entails exposing components or systems to stress levels that exceed their standard operating parameters to expedite failure occurrences. The collected data is subsequently extrapolated to assess reliability under standard operating settings, facilitating the identification of probable failure modes and design or manufacturing vulnerabilities [17].
FTA is a deductive reasoning methodology that initiates with a possible undesirable top event (system failure) and subsequently identifies the basic events that could precipitate that top event [18]. The top event and basic events are interconnected using logic gates such as AND and OR gates [18]. FTA is applicable for both qualitative and quantitative assessments of system reliability [19].
Classical static fault trees (SFTs) are frequently examined utilising binary decision diagrams (BDD) [20]. Dynamic fault trees (DFTs), being more expressive, can be analysed by state-based methodologies [20]. Fault trees are developed utilising system minimal cuts, and fuzzy top event probabilities can be computed employing the trapezoidal characteristics of primary events [21].
FTA has extensive applications, encompassing power systems, offshore industries, and equipment systems [10,11,19]. It is utilised to discover the critical components inside a system and evaluate combinations of adverse events [10,18].
Fuzzy fault-tree analysis (FFTA) enhances conventional fault tree analysis (FTA) by integrating fuzzy set theory to address uncertainty and imprecision in data [22]. This is especially beneficial when precise failure probabilities are unavailable [23]. FFTA employs fuzzy sets to depict ambiguous and imprecise occurrences, such as human errors [24]. Fuzzy logic is utilised to model the structure of fuzzy systems and to introduce novel fuzzy gates [22]. The likelihood of the occurrence of the bottom event is characterised by fuzzy numbers, and fuzzy mathematics is employed to determine the minimal cut set of the fault tree [25]. FFTA is used in a variety of fields, including wind energy systems, household appliance protection systems, subsea Christmas tree structures, and mine ventilation systems [26,27,28,29]. It is capable of dealing with the ambiguity present in complex systems, such as imperfect data, unclear relationships between the components, and subjective factors [30]. The method helps with the management of the ambiguous probability value for each state in the system [30].
Recent developments in electric and hybrid vehicle modelling have increasingly emphasised the integration of physics-informed approaches, data-driven models and system-level optimisation. Lei et al. [31] developed a physics-informed surrogate-assisted framework for the co-optimisation of fuel cell electric vehicle powertrain configurations and energy management strategies, demonstrating the importance of considering component interactions and vehicle-level performance. Similarly, Lei et al. [32] proposed a theory-constrained neural network with modular interpretability for fuel cell vehicle modelling, highlighting the potential of incorporating physical relationships into interpretable engineering models. In another study, Lei et al. [33] developed physics-informed data-driven models using vehicle bench experimental data to support hybrid powertrain optimisation. These studies demonstrate the growing importance of integrating physical system behaviour, operational data and optimisation in vehicle engineering. However, their primary focus is powertrain performance and energy management rather than the propagation of component-level failures within PCM–liquid hybrid battery thermal management systems.
Because of the growing demand for electric vehicles and the crucial role that battery performance plays in vehicle reliability, advanced designs of battery thermal management systems (BTMSs) together with their reliability evaluation have become a major focus of research. The present study looks at a hybrid battery thermal management system (HBTMS), which combines phase change material with liquid cooling and uses fuzzy fault-tree analysis (FFTA) to assess its reliability and to identify possible failure modes in order to improve safety and performance.
The rest of the paper is organised as follows: Section 2 outlines the operating principles and configurations of BTMS technologies, thereby setting the background for the fault tree and fuzzy reliability framework that comes next. Section 3 gives a detailed account of the fault tree structure of the hybrid BTMS. Section 4 explains the fuzzy fault-tree method for quantifying the probability of the top event under conditions of uncertainty. Section 5 sets out and discusses the reliability results, and Section 6 contains the conclusion.
2. Battery Thermal Management System
Electric vehicles (EVs) use electric motors and thus offer an environmentally friendly alternative to conventional cars with internal combustion engines (ICEs). They are generally divided into four main types: battery electric vehicles (BEVs), hybrid electric vehicles (HEVs), plug-in hybrid electric vehicles (PHEVs), and fuel cell electric vehicles (FCEVs). Although these different types of electric vehicles are distinct, they are all at risk of experiencing thermal runaway, which means that it is necessary to have an efficient BTMS in order to ensure safety, efficiency, and reliability in all vehicle types, whether they are small cars or heavy-duty SUVs and pickups.
A BTMS controls the operating temperature of the battery pack, thereby influencing its performance, charging capability, safety, and service life. Heat is produced within the battery as a result of the electrochemical reactions and internal resistance, as well as via heat transfer from the ambient environment. High temperatures will accelerate degradation and may, in fact, increase the safety risk, whilst low temperatures will lead to reduced energy output and reduced charging efficiency. For the conventional Li-ion batteries used in EVs, the generally accepted optimal operating temperature range is 15 °C to 35 °C [1,2]. This is a performance-based thermal management target rather than a universal operating limit, as the permissible temperature range will vary with cell chemistry, design and indeed with the charging and discharging conditions. The BTMS should therefore aim to keep the battery pack as close as possible to this recommended operating range, whilst also preventing excessive temperature rise and non-uniform temperature distribution.
BTMS designs can be broadly split into three categories: passive, active and hybrid. The passive systems are the simplest in terms of design and operate via natural convection or phase change materials with no external energy input at all. They are cheap but have relatively poor temperature control. The active systems use fans, pumps, and the like to actively circulate the coolant/refrigerant and, as such, provide much better temperature control at the expense of complexity, cost, and energy consumption.
Air cooling, liquid cooling, cooling using phase change materials, cooling with heat pipes, and refrigerant cooling are all common types of battery thermal management systems. The choice of BTMS depends on the type of vehicle, the capacity of the battery, the operational environment, budget constraints, and the required performance specifications. Electric vehicles that require high performance and those used in extreme climates generally use active or hybrid systems, while cheaper cars in temperate areas may use passive designs.
Hybrid Battery Thermal Management System Employing Phase Change Material and Liquid Cooling
In the research described, a hybrid BTMS combines passive thermal storage based on PCMs with active cooling using a liquid to take advantage of the features of both systems. Since PCMs have a high energy density, they enable isothermal heat absorption during phase changes and therefore help to reduce temperature spikes at the local hot spots. On the other hand, liquid cooling ensures continuous heat removal when the system is operating steadily and can also provide heating in cold conditions.
In a typical hybrid setup, the phase change materials are placed in direct contact with the battery cells and absorb the excess heat as they melt. This heat is then passed on to a circulating liquid coolant, which carries it away for rejection in a radiator or evaporator. The device can also incorporate a heater to maintain the battery at its ideal temperature in the event of low ambient temperatures. The PCMs will be responsible for dealing with the temperature changes that occur during transient loads; the liquid cooling system will be responsible for the continuous heat dissipation and will reduce the thermal load on the refrigeration system. A further PCM tank can be incorporated to take up more of the heat from the coolant and thus improve the energy efficiency and increase the driving range.
In the HBTMS architecture under consideration, the battery coolant circuit is the main route for heat removal from the battery pack. The coolant flows through the battery pack, the pump, the PCM tank, and the associated heat exchangers to facilitate heat removal and thermal management. The liquid/liquid heat exchanger facilitates heat exchange between the battery coolant and the connected thermal-management interface, while the refrigerant/air circuit associated with the air-conditioning heat exchanger provides an additional pathway for heat rejection. These thermal interfaces perform distinct functions and should not be interpreted as a single common coolant circuit. Figure 1 illustrates the intended battery coolant pathway and its thermal interaction with the refrigerant/air-side heat exchanger.
Figure 1.
Schematic representation of the HBTMS showing the battery coolant circuit, PCM-based thermal storage, liquid/liquid heat exchanger, and refrigerant/air-side heat exchange interface.
Hybrid BTMSs can be set up in a parallel or series configuration depending on the design specifications. Even though they are more complicated and expensive than conventional methods, PCM liquid systems improve heat distribution, extend the life of the battery, speed up the charging process, and reduce the risk of fire. They have already been incorporated into some high-end electric vehicles, for example, the Tesla Model S and Model X.
In these systems, thermal energy storage is mainly based on latent heat and sensible heat, with latent heat storage having a better energy density. When selecting a PCM, the melting point must be taken as a key criterion so that it matches the battery’s optimal operating temperature, and consistent heat extraction from the PCM is essential if its effectiveness is to be maintained over successive charge and discharge cycles.
The significance of temperature regulation for battery performance means that the efficacy of a BTMS directly influences the reliability and longevity of electric vehicles. The reliability study of HBTMS components—including pumps, heat exchangers, phase change material modules, and sensors—facilitates the identification of probable failure modes, optimisation of designs, and improvement of overall system safety and performance throughout the electric vehicle lifespan. Figure 1 shows a block diagram of the HBTMS of an EV being used for research.
Following the discussion of the architecture and thermal operating principles of the hybrid PCM liquid BTMS, the subsequent section presents the fault tree representation that formalises its reliability behaviour. This representation identifies the top event, intermediate events, and basic events that illustrate how component-level failures can lead to a system-level thermal management failure.
3. Fault Tree Analysis of HBTMS
Fault tree analysis (FTA) is a deductive reasoning method employed to identify and examine the potential causes of system failure [34,35,36]. It is a visual instrument that uses a logic diagram to illustrate the interconnections among events that may culminate in a designated top event, representing the complete breakdown of the system [34]. In safety and reliability engineering, this method is often used in order to evaluate and improve the performance of complex systems in a number of different industries [15].
The FTA involves breaking down a system into a logical diagram, known as a fault tree, in which basic events lead to a specific top event. This top event represents the total failure of the system being analysed [34]. The fault tree consists of events and gates, the events indicating failures or faults, and the gates showing the logical relationships between these events [22]. By applying the probabilities of the basic events through the appropriate gate logic, an evaluation of the system’s reliability is obtained [34].
When constructing a fault tree, a systematic procedure is followed in order to investigate the causes of an undesirable system event. The first step is to define the top event, that is, the specific failure or malfunction which the study is intended to examine [37]. Once the top event has been established, the next task is to identify the basic events—those essential component-level defects or initial failures which could cause the top event to occur [34]. These events are then connected together by means of logical relationships using simple logic gates, such as AND, OR, and NOT gates [22]. An AND gate gives an output only when all of the input events take place, whereas an OR gate produces an output whenever at least one of the input events occurs [22]. Minimal cut sets (MCSs) are obtained through logical arrangement. They represent the smallest combinations of basic events such that if all of them fail at the same time, the top event will result [34]. Having completed the fault tree, probabilities are assigned to each of the basic events by means of sources such as expert opinion, historical data, or relevant information [38]. The probability of the top event is finally calculated by combining the individual probabilities of the basic events in accordance with the structure and logic of the fault tree [39]. The fault tree analysis of the HBTMS is given in Figure 2.
Figure 2.
Fault tree diagram of an HBTMS.
Although BE3 and BE10 are both defined as PCM leakage events, they represent failures at two physically distinct containment locations within the hybrid BTMS. BE3 represents leakage from the inter-cell PCM matrix integrated within the battery module (Stage 1), whereas BE10 represents leakage from the separate external PCM tank connected downstream to the liquid-cooling circuit (Stage 2). These events are therefore distinguished by their physical boundaries, PCM containment structures, and locations within the thermal-management architecture. Leakage from the battery module directly compromises localised thermal buffering around the cells, while leakage from the external tank reduces the secondary thermal-storage capacity of the coolant loop. Although both events share the general failure mechanism of PCM loss, they are retained as separate basic events because they originate from different physical assemblies and represent distinct component-level failure paths.
The fault tree also contains repeated failure-mode descriptions across different component branches. Such repetitions represent potentially similar failure mechanisms occurring at distinct component locations and should not automatically be interpreted as identical physical events. Nevertheless, statistical dependence can arise where different basic events are affected by common operating conditions, common environmental stresses, common coolant contamination, common maintenance deficiencies or other common initiating factors. The assumption of statistical independence used in the baseline reliability calculation is therefore retained as the reference modelling condition, and the potential impact of dependence between physically related basic events is considered separately via a correlation-based sensitivity analysis. This approach ensures that all instances of repeated failure are not automatically treated as common cause failures in the absence of any physical or statistical justification.
The top event Improper heat transfer to PCM () is the loss or failure of the required heat transfer function between the battery thermal management coolant system and the PCM thermal storage subsystem. The functional boundary of this top event includes all of the components and processes which are necessary to effect the required heat transfer function, namely the PCM thermal properties and integrity, the heat exchanger performance, the coolant circulation (pumping, flow control), and the sensing and control functions. Failures of these components are therefore relevant to this top event in the sense that they can lead to a failure of the required heat transfer function and will be included in the intermediate event relationships which lead to the top event. This top event does not represent battery cell overheating, thermal runaway or the complete failure of the vehicle-level thermal management system. These may be potential downstream consequences of the failure of the thermal management system and are outside the functional boundary of the present reliability assessment. The 23 basic events listed in Table 1 are therefore all assigned to this common top event via the relevant intermediate events and the associated logic gate relationships as shown in Figure 2. The vertically merged top event cell in Table 1 is a reflection of this common assignment across the seven intermediate event groups and does not imply that any of the basic events are excluded from the fault tree. The OR gate relationships indicate that a failure of an individual basic event can lead to the associated intermediate or higher-level functional failure once the relevant operational threshold has been exceeded. The fault tree structure adopted is the same as that used in the authors’ previous deterministic reliability study [40], and the present analysis is concerned with the uncertainty in the basic event probabilities.
Table 1.
Qualitative FTA of HBTMS of EV.
In the prior study [40], functional failure propagation was assessed via a threshold mapping approach in which a downstream functional failure is said to occur if the propagated deviation exceeds its allowable operational threshold (ε). The OR-gate representation therefore indicates that a downstream functional failure will be triggered by any one of the input failures that are threshold qualified. It does not mean that every small operational disturbance or every instance of incipient component degradation is automatically sufficient to cause a system-level thermal failure. The OR-gate also reflects the non-redundant reference architecture, which has a single coolant pump, a single heat exchanger loop, a single controller, and the associated sensing elements. Consequently, no AND gates were incorporated to represent simultaneous failures of parallel redundant components.
The scope of the previous deterministic assessment [35] should be distinguished from the validation of the present fuzzy reliability estimates. The earlier study developed and evaluated the HBTMS fault-tree structure using threshold-based functional failure mapping and deterministic reliability calculations. In the present work, this previously established structure is retained as the reference model for incorporating uncertainty in the basic-event probabilities. The use of the previously evaluated fault tree does not, however, constitute independent experimental validation of the present fuzzy assessment. In particular, the current study does not establish that the adopted event definitions, gate relationships, or assigned failure probabilities have been independently verified against operational failure records or experimental observations from an HBTMS. Accordingly, the present results are interpreted as conditional reliability estimates based on the inherited fault-tree structure and the adopted probability inputs.
Nevertheless, the PCM and liquid-cooling mechanisms provide complementary thermal management functions. The PCM absorbs transient heat through latent heat storage, whereas the liquid-cooling circuit supports continuous heat removal. Although the PCM can temporarily moderate temperature increases following liquid-cooling disturbances, its thermal-storage capacity is finite. Furthermore, several physical and functional interactions may exist among the PCM subsystem, coolant circulation, sensing, and control components. For example, PCM leakage (BE3 and BE10) and PCM degradation (BE11) may be influenced by common thermal operating conditions and material ageing. Similarly, pump shutdown (BE16), blockage or clogging (BE17), and bearing failure (BE18) may interact through their effects on coolant circulation. Transducer failure (BE19), transducer drift (BE20), communication failure (BE22), and controller inaction or delay (BE23) may also affect the availability and reliability of information required for coolant-flow regulation. In addition, relay inaction or delay (BE6) and internal short circuit (BE21) may potentially affect multiple functions where shared electrical or control resources are involved. However, the available system description does not establish the existence of specific shared power-supply or control-circuit failure pathways. These interactions may produce common-cause or sequential failure effects that are not explicitly represented by the adopted static fault tree. Consequently, statistical independence is retained as a simplifying assumption for the baseline probability calculations rather than as evidence of complete physical independence. The potential effects of these dependencies and common-cause failures should therefore be considered when interpreting the calculated top event probability, minimal cut sets and importance rankings.
Fault tree analysis can be carried out in either a quantitative or a qualitative way. In the case of quantitative fault tree analysis, probabilities are assigned to the basic events, and the probability of the top event is calculated [39]. This enables a quantitative assessment of system reliability. Qualitative fault tree analysis, on the other hand, focuses on identifying the possible failure modes and the causes thereof without assigning specific probabilities, and this may help in spotting vital components and potential design weaknesses.
In many real-world situations, it is difficult to obtain an accurate failure probability for basic events because of limited data, uncertainty, or vague information [41,42,43]. Fuzzy fault-tree analysis (FFTA) is an improvement on conventional fault tree analysis (FTA) since it incorporates fuzzy logic in order to deal with uncertainties [35,38,41]. By using fuzzy set theory, FFTA is able to represent uncertain or imprecise data, and this enables the incorporation of expert opinions and qualitative data into the analysis [38,41,44].
4. Fuzzy-Based Fault Tree Analysis of a Hybrid BTMS in EVs
Fault tree analysis (FTA) provides a systematic and logical method for understanding the failure characteristics of a physical system; however, conventional fault tree analysis (FTA) comes up against difficulties when accurate failure rate data for all the basic events (BEs) are not available, a situation that often arises in complex systems such as HBTMSs in electric vehicles. A fuzzy integrated fault tree analysis (FTA) technique is employed, utilising the fault tree structure from the authors’ previous deterministic reliability study of the same hybrid BTMS [40] (Section 3), to address this limitation. The failure probability of the top event in the hybrid BTMS is evaluated using fuzzy logic through the following five-step methodology.
All 23 basic events listed in Table 1 are assigned to the single top event, improper heat transfer to PCM (). The top event designation applies to all intermediate-event groups and their associated basic events. The basic events are connected to the top event through the intermediate-event and logic-gate relationships illustrated in Figure 2. The merged cell in the top event column represents this common assignment and does not indicate that any basic event is excluded from the top event.
The six identified-event probability inputs listed in Table 2 are retained from the numerical dataset adopted in the present analysis. Their assignments have been aligned with the failure mechanisms defined in Table 1: BE7 and BE15 represent erosion, BE8 and BE13 represent fouling and scaling, and BE9 and BE14 represent flow maldistribution. These paired events represent similar failure mechanisms at distinct basic-event locations within the fault-tree structure and are therefore retained as separate events, despite having identical numerical probability inputs.
Table 2.
Failure probability inputs assigned to identified basic events.
The previously published deterministic study [40] identifies MIL-HDBK-217F and OREDA as sources of reliability data for the HBTMS assessment. The original component-specific calculation records underpinning the six individual probability inputs in Table 2 were not available for independent verification. It was therefore not possible to independently reconstruct the source-to-event mapping, the original failure rate values, the operating conditions, the units, the exposure periods and the individual rate-to-probability conversion procedures. The numerical inputs are therefore as reported in the adopted dataset, with no claim to independent verification of their original provenance and no attempt to assign a mission time interpretation.
4.1. Computing Failure Possibilities in Terms of Linguistic Variables and Their Corresponding Fuzzy Probability
To get around the limitations of conventional fault tree analysis (FTA) in the case of uncertain or inadequate data, we use the fuzzy FTA approach. This involves the use of linguistic variables to express the uncertain (i.e., unknown) probabilities of failure of the basic events as set out in Table 1. The seven linguistic terms used to do this are listed in Table 3. The qualitative assessments are subsequently transformed into numeric values utilising suitable fuzzy membership functions. The selection and organisation of these functions markedly affect the precision of the outcomes, as highlighted by [45].
Table 3.
Failure possibilities and their corresponding fuzzy number.
Triangular and trapezoidal fuzzy numbers are frequently employed to represent uncertainty and imprecision related to linguistically defined variables [46,47]. The study expresses the failure probabilities of uncertain basic events in the form of fuzzy numbers, as shown in Table 3 [48]. The triangle membership function is employed because of its simplicity to implement and the computational efficiency it offers when evaluating the failure probabilities of the basic events. A conventional triangular fuzzy number is defined as a triplet of values , its membership function being theoretically expressed as proposed by [49].
Here, µ(x) denotes the membership function, with values ranging from 0 to 1, and the parameters aaa, bbb, and ccc stand for the lower limit, the most probable (peak) value, and the upper limit of the fuzzy number, respectively.
When exact failure rates for certain basic events are not available, fuzzy estimates take their place. Experts make these estimates using their knowledge and hands-on experience with similar systems. Three experts provided the assessments used in this study. Table 4 presents their assessments of the ambiguous basic events.
Table 4.
Independent linguistic assessments of failure possibilities for the 17 basic events by three experts.
The expert panel comprised two experts from academia and one from industry. All three experts independently assessed the 17 basic events listed in Table 4. Each expert was requested to assign one linguistic probability category to every basic event using the seven-level scale presented in Table 3: Very Low (VL), Low (L), Reasonable Low (RL), Moderate (M), Reasonably High (RH), High (H), and Very High (VH). The assessments were provided independently, without joint discussion or consensus-based adjustment, thereby retaining the individual judgements of the three experts.
- a.
- Aggregating fuzzy numbers based on experts’ opinions
The probabilities of failure for basic events, as evaluated by several experts mK (where K = 1, 2,…, n), may fluctuate owing to variations in personal assessment. The failure possibilities of 17 basic events were assessed by three experts using the linguistic terms in Table 3. To aggregate the assessments, the expectancy evaluation (EE) of each triangular fuzzy number was calculated first. The pairwise similarity, average agreement degree (AAD), relative agreement degree (RAD), expert weights, and aggregated fuzzy numbers were then recalculated for every fuzzy-assessed event. Three experts were consulted to provide linguistic assessments of the failure possibilities associated with the basic events of the HBTMS. The expert assessments were obtained to incorporate informed judgement into the reliability evaluation where complete historical failure data were unavailable. However, the original study records do not contain sufficiently detailed individual profiles, such as academic qualifications, years of professional experience, specific areas of specialisation, or documented selection criteria, to independently characterise the expertise represented by each expert. Therefore, the present study reports the three expert assessments as obtained and does not claim that the panel was selected through a formally documented competency-scoring procedure. This limitation is acknowledged when interpreting the expert-derived failure estimates.
This study employs the consistency agreement approach proposed by Wei [50]. This method converts the expert-designated linguistic failure terms into corresponding fuzzy numerical values, adhering to the subsequent phases.
The procedures outlined below are used to translate the expert-assigned linguistic failure terms into equivalent fuzzy numerical values.
Step 1: Compute the Similarity Degree.
The degree of similarity measures the degree of concordance between the fuzzy assessments and rendered by two experts mi and mj, respectively.
and are typical fuzzy numbers, both confined to the interval [0, 1]. The similarity is calculated based on their expectancy evaluations (EE), which represent the central tendency of each fuzzy number. The expectation evaluation for a triangular fuzzy number is computed as follows:
Step 2: Finding the Average Agreement Degree (AAD)
The average agreement degree AAD for expert mi is computed based on their resemblance to all other experts.
When an expert is compared to themselves (i.e., when i = j), the similarity degree SDij is regarded as 1. The total number of experts is represented by n.
Step 3: Determining the Relative Agreement Degree (RAD)
The relative agreement degree (RAD) indicates the ratio of consensus among experts mi compared to the entire group of experts.
Step 4: Allocating Weights to Experts
Each expert, denoted as mi, is allocated a weight Wi, which is derived from the amalgamation of their relative agreement degree RADi and their importance measure IM(mi).
This combination is regulated by a relaxation parameter μ, which varies between 0 and 1. The parameter μ denotes the significance attributed to the expert’s importance assessment in relation to their level of agreement. The values of IM(mi) are often established according to expert rating criteria, as indicated by Bryson and Mobolurin [51].
Step 5: Consolidating Expert Perspectives
The aggregated fuzzy evaluation from all experts, represented as , is computed using the subsequent formula.
In this expression, denotes the cumulative fuzzy number for the jth basic event (BE), W signifies the weight allocated to each expert, nnn represents the total number of experts, and indicates the fuzzy value assigned to the jth BE by expert mi.
The aggregated fuzzy values for all basic events pertaining to the fault tree of the HBTMS are calculated using the equations above and presented in Table 5.
Table 5.
Aggregated fuzzy numbers, defuzzification and corresponding FP of each BE.
Because the similarity measure is symmetric,
The complete similarity matrix is
The lower coordinate is
The modal coordinate is
The upper coordinate is
- b.
- Defuzzification of Fuzzy Probabilities in the Hybrid BTMS
The example given earlier showed how the complete process of aggregation and defuzzification was carried out for BE1 in order to ensure procedural transparency. This subsection formalises the defuzzification technique and applies it consistently to all remaining fuzzy-based basic events.
A defuzzification technique is employed to convert fuzzy outputs into accurate numerical values. The fuzzy estimations of failure probabilities obtained are initially transformed into failure possibility scores (FPS). This work employs the centre-of-area defuzzification method (CADM) from a variety of defuzzification strategies documented in the literature [52], owing to its simplicity and efficacy [53]. For a standard triangular fuzzy number , the CADM can be calculated as follows:
Utilising the above equation, the computed FPS values are subsequently converted into failure probabilities (FPs) by a logarithmic transformation, as suggested by Onisawa [54].
where
For further numerical clarification, consider an FPS value of 0.14. Applying the Onisawa transformation gives the following:
The corresponding failure probability is as follows:
This confirms the numerical consistency of the stated transformation and demonstrates the conversion of an FPS value into its corresponding numerical failure probability. The same equation has been applied to the aggregated fuzzy assessments in Table 5.
The Onisawa transformation is a non-linear mapping which takes the dimensionless failure possibility score (FPS) derived from centre-of-area defuzzification and converts it into a numerical estimate of failure probability. The resulting probability is not in any way the same as the original FPS, as the two have very different mathematical meanings. The transformation is monotonically increasing with FPS, but its non-linearity leads to different rates of change over the range of input. The numerical probability assigned to a basic event is thus a function of both the aggregated expert assessment and the transformation selected.
To illustrate this behaviour, the representative FPS values corresponding to the linguistic categories in Table 3 were evaluated using the adopted Onisawa equation. For example, an FPS of 0.04 (Very Low) produces a transformed value of approximately 2.31 × 10⁻⁷, whereas an FPS of 0.96 (Very High) produces approximately 0.15933. These examples demonstrate the nonlinear mapping between the possibility scale and the resulting numerical probability estimates. They should not be interpreted as independent empirical failure probabilities or as evidence of systematic amplification of low-probability events.
The relatively higher transformed probabilities observed for certain basic events in Table 5 primarily reflect their higher aggregated FPS values. Therefore, the resulting estimates should be interpreted in the context of the expert assessments, the adopted aggregation procedure, and the Onisawa transformation, rather than attributing the magnitude of the estimates solely to the transformation itself.
It should be noted that the Onisawa transformation converts the dimensionless failure possibility scores (FPS) obtained from the aggregated fuzzy assessments into numerical failure-probability estimates. However, this mathematical transformation does not independently establish a mission duration or operating exposure period. The original assessment records specifying whether the experts evaluated failure occurrence over a calendar year, a defined number of operating hours, or another exposure period were not available for independent verification. Consequently, the transformed values are retained as dimensionless model inputs, without assigning an unsupported annual or mission-time interpretation.
The conversion is executed utilising the equations above, with the conclusive numbers encapsulated in Table 5.
4.2. Identification of Minimal Cut Sets (MCS) and Estimation of Top Event Failure Probability in the Hybrid Battery Thermal Management System (HBTMS)
The qualitative characterisation of the fault tree is given in Table 1. A quantitative fault tree analysis (FTA) is carried out by calculating the failure probability of the top event. The system’s failure behaviour is studied using cut sets and path sets, which are defined as combinations of basic events (BEs) that can cause system failure [55]. A cut set includes the basic events such that if they all fail at the same time, the system’s functionality will be disrupted. Fault trees generally have more than one cut set.
Yet all of the basic events within a cut set need not fail in order for the top event to take place; in order to deal with this, minimal cut sets (MCS) are identified. These denote the smallest groups of basic events such that their simultaneous failure directly causes the top event, and MCS analysis also helps to avoid redundancy in fault trees when the same events occur more than once.
Figure 1 shows the system components arranged in a series configuration. The fault tree analysis (FTA) shown in Figure 2 connects all the basic events via OR gates, indicating that the occurrence of any one of the basic events is sufficient to cause the top event. In order to evaluate the failure of the top event, the fault tree is converted into a Boolean expression in the way described by Wang [56], as the following illustrates:
The failure probabilities listed in Table 2 and Table 5 are used as numerical inputs in the present reliability assessment. However, the original exposure period associated with the six identified-event inputs in Table 2 could not be independently established from the available calculation records. Therefore, the resulting top event probability is interpreted as a dimensionless conditional estimate based on the adopted input values and the assumed fault-tree structure, rather than as a verified annual failure probability. This distinction is important when comparing the present fuzzy assessment with the previous deterministic study [40], which explicitly evaluated system unreliability over a 10,000 h mission period. Accordingly, the probability values used in this study should not be interpreted as failure rates expressed per year, since no time dimension is assigned to the reported dimensionless estimates.
Because the fault tree contains 23 basic events connected through OR gates, each basic event forms a singleton minimal cut set (MCS) under the adopted fault-tree structure. Consequently, the top event occurs if at least one of the basic events occurs. However, this structural representation should not be interpreted as independent physical evidence that every incipient component disturbance necessarily causes immediate system-level thermal failure. Rather, the basic events represent the functionally significant failure conditions adopted in the original fault-tree model [40].
For statistically independent basic events, the exact probability of the top event is given by:
where Q is the dimensionless conditional top event probability estimate and qi denotes the numerical failure-probability input assigned to the i-th basic event in the adopted dataset. The exposure period associated with these inputs could not be independently verified.
The expression accounts for the probability that none of the 23 basic events occurs and subtracts this value from unity. It is the exact union-probability expression under the assumption of statistical independence. Simply summing the individual basic event probabilities is not exact and can overestimate the union probability. Such summation is only an approximation under appropriate low-probability conditions.
Using the basic event probabilities listed in Table 2 and Table 5, the top event probability is obtained by applying the above equation. The resulting estimate is conditional on the assigned input probabilities, the inherited fault-tree structure, and the independence assumption. The mission-time basis of the identified-event inputs must be verified before the result can be interpreted as a probability over one year.
For clarity, the top event probability reported in this section represents the baseline point estimate obtained using the centroid-defuzzified failure possibility scores of the 17 fuzzy-assessed basic events, the six identified-event probability inputs listed in Table 2, and the exact independent OR-gate expression. This baseline estimate is distinguished from the fuzzy modal top event probability obtained by independently transforming the modal coordinates of the aggregated triangular fuzzy numbers, as described in Section 5.3. Although both calculations use the same identified-event inputs and fault-tree structure, their fuzzy input representations differ. Consequently, the baseline point estimate and the modal-coordinate estimate are reported separately rather than treated as identical quantities. Table 6 shows the F-V importance measure of all MCS.
Table 6.
F-V importance measure of all MCS.
Reference Period and Operating Conditions of Basic Events
The temporal and operational basis of the 23 basic event probability inputs requires clarification. The present dataset does not provide a verifiable common reference period or individual exposure duration for the assigned probabilities. For the 17 fuzzy-assessed basic events, the three experts provided linguistic assessments of failure possibility without a documented calendar-year, operating-hour, or mission-based reference period. Similarly, the six identified-event probabilities (BE7, BE8, BE9, BE13, BE14 and BE15) were retained from the previously adopted numerical dataset; however, their original component-specific failure-rate records, source-to-event mapping, operating conditions and probability-conversion procedures could not be independently reconstructed.
Although the previous deterministic study [40] evaluated system unreliability over a 10,000 h mission period, the available records do not establish that all 23 probability inputs used in the present analysis were derived using that same exposure period. Therefore, assigning a 10,000 h reference period to the current inputs would introduce an unsupported assumption.
The engineering conditions relevant to the basic events include thermal exposure, temperature cycling, electrical loading, coolant flow, mechanical loading, material ageing, sensor operating conditions and control-system performance. However, the specific operating ranges, duty cycles, environmental conditions and failure thresholds associated with the original probability assignments are not available. Table 7 summarises the principal operating variables relevant to each failure mechanism and identifies the absence of a verifiable temporal basis.
Table 7.
Reference period and potential measurable indicators of the basic events.
Accordingly, all 23 probability inputs are retained as dimensionless conditional model inputs rather than time-normalised failure probabilities. The present analysis does not convert these values into annual probabilities, failure rates per operating hour or vehicle-lifetime probabilities. Establishing such measures would require component-specific failure records, documented operating conditions, exposure durations and validated probability-conversion procedures.
4.3. Ranking of Critical Minimal Cut Sets Using the Fussell–Vesely Importance Measure (F–VIM)
The Fussell–Vesely importance measure (F–VIM) is used to assess the contribution of individual basic events to the top event probability and to rank the corresponding minimal cut sets (MCSs). In the adopted fault-tree structure, the 23 basic events are connected through OR gates, so each basic event forms a singleton minimal cut set. The importance analysis therefore identifies the basic events that contribute most significantly to the calculated top event probability and helps prioritise reliability improvement measures. The failure probabilities assigned to the basic events are obtained using the procedures described in Section 4.1, Section 4.2 and Section 4.3. The F–VIM values are then calculated using the probability-based definition described below [57].
For statistically independent basic events connected through OR gates, the Fussell–Vesely importance measure (F–VIM) of basic event i, corresponding to a singleton minimal cut set, is defined as
where Q is the top event probability calculated using all basic events and Q(−i) is the top event probability when the failure probability of basic event i is set to zero while the probabilities of all other basic events remain unchanged. For the independent-OR structure adopted in this study, this expression can also be written as
where qi is the failure probability of basic event i. The F–VIM values were calculated for all 23 minimal cut sets using the top event probability obtained in Section 4.2. The resulting values and rankings are presented in Table 6.
The results identify BE10 as the highest-ranked contributor, with an F–VIM of approximately 0.17814, followed by BE3 (0.17303), BE18 (0.11187), BE20 (0.10788), and BE11 (0.10412). BE2 and BE6 have identical F-VIM values (both approximately 0.10318) and so share the same rank. BE10 and BE3 are the ones that have the highest individual failure probabilities assigned to them in terms of their contribution to the top event probability under the model considered. They therefore provide a quantifiable basis for prioritising further investigation and potential reliability improvement actions.
The rankings must be viewed in the context of the inherited fault tree structure, the assigned basic event probabilities and the assumption of statistical independence. They in no way independently confirm the physical sufficiency of any individual basic event to cause system failure. The importance measure is a measure of the contribution of an event under the current model and does not in itself tell you how much the failure probability would be reduced by an engineering intervention.
5. Results and Discussion
This section presents the reliability results obtained from the fuzzy fault-tree analysis of the hybrid battery thermal management system (HBTMS). The analyses examine basic-event contributions, sensitivity of the top event probability, fuzzy-bound uncertainty, criticality, relative uncertainty, reliability improvement potential, risk classification, and sequential improvement scenarios. All analyses use the same baseline top event probability and the basic event (BE) inputs to ensure consistency across the numerical results and figures. The findings are interpreted conditionally on the inherited fault-tree structure, the assigned failure probabilities, and the assumption that the basic events are statistically independent.
5.1. Component Contribution Index and Pareto Analysis
The component contribution index (CCI) was used to evaluate the contribution of each basic event (BE) to the total failure tendency of the HBTMS. Although the exact Fussell–Vesely importance measure (F-VIM) was kept as the formal fault tree importance measure, the CCI acted as a normalised screening index for use in Pareto visualisations. Thus, the CCI enables the identification of the subset of basic events that account for the majority of the accumulated contribution to system failure.
The CCI for the ith basic event was calculated as follows:
The percentage contribution of each basic event was determined as follows:
Hence, the events were arranged in descending order of CCI, and the cumulative contribution was calculated as follows:
The Pareto plot was created by showing the individual CCI values as bars and the cumulative CCI as a curved line. This type of visual representation makes it easy to identify the main contributors and shows whether the causes of failure are concentrated in a small number of important events or are spread over a number of different events.
The revised Pareto analysis identifies BE10, representing PCM leakage from the tank, as the largest contributor to the normalised additive failure-probability index, with a CCI of 18.97%. BE3, representing PCM leakage from the module, follows with a CCI of 18.44%, while BE18, associated with bearing failure, contributes 12.05%. Together, BE10 and BE3 account for 37.41% of the normalised additive contribution, increasing to 49.46% when BE18 is included.
The cumulative CCI reaches 72.32% after the first five events: BE10, BE3, BE18, BE20, and BE11. BE2 and BE6 have identical assigned failure probabilities and equal CCI values of approximately 11.13%. Including either event raises the cumulative contribution above 80%; including both raises it to approximately 94.58%. Their relative ordering is therefore interchangeable and should not be interpreted as evidence that one is more important than the other.
These findings support prioritising PCM containment and leakage prevention, followed by pump-bearing durability, transducer-drift monitoring, PCM degradation control, relay response, and transient thermal-load management. CCI is used here as a normalised additive screening index, whereas the Fussell–Vesely importance measure (F–VIM) provides the formal importance measure for the adopted fault-tree model. Figure 3 presents the Pareto analysis.
Figure 3.
Pareto analysis of basic event contributions in the hybrid.
5.2. One-at-a-Time Sensitivity Analysis
A one-at-a-time sensitivity analysis was conducted to assess the impact of changes in the probability of each basic event on the exact top event probability. The purpose of this analysis was to determine whether the critical events identified through exact F-VIM and Pareto analysis remain influential when their input failure probabilities are varied. Sensitivity analysis is especially valuable in fuzzy reliability studies, as some basic event probabilities are based on expert judgment and may exhibit epistemic uncertainty.
In this analysis, each basic event probability was independently varied, while the probabilities of the remaining 22 basic events were held at their baseline values. The reduced and increased probabilities were determined as follows:
where is the reduced probability and is the increased probability of the ith basic event.
The exact probability of the top event was recalculated for each perturbed scenario using the independent OR gate equation:
For cases in which the probability of a selected basic event was reduced by 20%, the corresponding modified top event probability was determined as follows:
Conversely, when the probability of the selected basic event was increased by 20%, the modified top event probability was determined as:
The total sensitivity span was computed as follows:
A normalised sensitivity index was also computed as follows:
where Q denotes the baseline exact top event probability. In the present study,
The revised sensitivity analysis identifies BE10 and BE3 as the most influential basic events. When the probability of BE10 is varied by ±20%, the exact top event probability ranges from approximately 0.145447 to 0.156194, giving a sensitivity span of 0.010747. For BE3, the corresponding range is approximately 0.145601 to 0.156040, with a sensitivity span of 0.010438.
The next most influential events are BE18, BE20, BE11, and the tied events BE2 and BE6. This ordering is consistent with the revised F–VIM results. Under the independent OR-gate model, the sensitivity span is proportional to the assigned probability of the varied event. Consequently, this analysis provides a consistency check on the ranking rather than independent validation of the underlying fault-tree structure.
The results indicate that reducing the probabilities assigned to PCM leakage, bearing failure, transducer drift, PCM degradation, relay inaction or delay, and operational transients may provide greater modelled benefits than reducing the probabilities of lower-ranked events. Figure 4 presents the sensitivity analysis.
Figure 4.
Sensitivity of the exact hybrid BTMS top event probability to changes in individual basic event failure probabilities.
The relationship between the one-at-a-time sensitivity analysis and the Fussell–Vesely importance measure (F–VIM) requires clarification. Under the adopted independent OR-gate structure, the normalised sensitivity span resulting from a ±20% variation in the failure probability of an individual basic event is mathematically equal to 0.4 times its F–VIM value. Similarly, the relative reduction in the top event probability resulting from a 50% reduction in an individual basic event probability is equal to 0.5 times its corresponding F–VIM value. Consequently, the matching rankings obtained from these calculations are an expected mathematical outcome of the adopted model rather than independent confirmation of the reliability priorities. The sensitivity analysis is therefore interpreted as illustrating the quantitative response of the top event probability to changes in individual basic event probabilities, rather than as an independent validation of the F–VIM ranking. Nevertheless, it provides a useful measure of the relative influence of individual failure-probability inputs within the adopted fault-tree structure.
5.3. Fuzzy Bound Uncertainty Analysis
Fuzzy probability values in this study were derived from aggregated triangular fuzzy numbers. A triangular fuzzy number is defined as follows:
Here, ai, bi, and ci denote the lower, modal, and upper fuzzy values, respectively. In the baseline analysis, the fuzzy number was defuzzified using the centroid method to yield a single failure possibility score (FPS):
Relying solely on the centroid value can obscure the uncertainty present in the lower and upper bounds of the fuzzy number. To address this, a fuzzy bound uncertainty analysis was conducted by independently transforming the lower, modal, and upper coordinates of the triangular fuzzy number into failure probabilities.
The Onisawa transformation described in the manuscript was applied to each fuzzy coordinate. For a given failure possibility score FPS, the corresponding failure probability was determined as follows:
where
For each fuzzy basic event, the lower, modal, and upper failure probabilities were determined as follows:
Here, , , and represent the lower, modal, and upper failure probabilities of the respective basic event.
The six basic events with identified failure rate data (BE7, BE8, BE9, BE13, BE14, and BE15) remained constant across all three scenarios. The failure probabilities of the fuzzy-derived basic events were varied according to their lower, modal, and upper fuzzy coordinates.
The exact independent OR gate model was subsequently applied to each scenario:
In this context, QL, QM, and QU denote the lower, modal, and upper top event probabilities.
Using the rounded triangular fuzzy coordinates reported in Table 5, the revised fuzzy-bound analysis yields an exact OR-gate top event probability of 0.083095 for the lower-coordinate scenario, 0.150824 for the modal-coordinate scenario, and 0.276142 for the upper-coordinate scenario. The resulting uncertainty interval is therefore 0.083095 to 0.276142.
The interval width is approximately 0.193047, and the ratio of the upper to lower estimate is approximately 3.32. Thus, the upper-bound estimate is more than three times the lower-bound estimate, illustrating the influence of uncertainty in the expert-assigned fuzzy values on the calculated system failure probability.
The modal-coordinate estimate of 0.150824 is close to the baseline top event probability of 0.150821. The small difference results from the nonlinear Onisawa transformation and the use of rounded fuzzy coordinates. The fuzzy-bound interval represents the propagation of the specified fuzzy coordinates; it is not a statistical confidence interval. The modal-coordinate estimate is distinct from the baseline point estimate reported in Section 4.2, as the former uses the modal coordinates of the aggregated fuzzy numbers directly, whereas the latter uses centroid-defuzzified FPS values.
The results indicate that the central estimate alone does not fully represent the uncertainty associated with the fuzzy-derived basic-event probabilities. Figure 5 presents the lower, modal-coordinate, and upper scenarios.
Figure 5.
Lower, most likely, and upper fuzzy bound estimates of the HBTMS top event probability.
5.4. Criticality Map and Risk Reduction Analysis
A criticality map was developed to combine the probability, significance, and potential for risk reduction in the basic events into a single visual format. This allows the numerical reliability rankings to be translated into clear design and maintenance priorities.
The criticality map includes three parameters: the failure probability of the basic event, the risk reduction worth (RRW), and the component contribution index (CCI).
The horizontal axis showed the failure probability and the vertical axis showed the risk reduction worth; bubble size was proportional to the CCI value.
The risk reduction worth for each basic event was determined as follows:
where Q represents the baseline exact top event probability, while Qi(0) denotes the top event probability after the probability of the basic event is set to zero.
The exact top event probability was calculated as follows:
The reduced top event probability, after eliminating the basic event i, was calculated as:
The exact F-VIM was employed as the formal ranking metric and was calculated as follows:
The CCI was used exclusively to scale the bubble size:
where
The figure has been multiplied by 1000 purely for the purpose of visualisation, and this has no effect on the ranking or the interpretation.
In the criticality map, those events which are located in the upper right area are regarded as more critical because they have a higher probability of failure and a greater potential for reducing risk. The bigger the bubbles, the greater the normalised contribution of the events.
The criticality analysis identifies BE10 as the highest-priority event, with a risk reduction worth (RRW) of approximately 1.216747 and an F–VIM of 0.178137. BE3 follows, with an RRW of approximately 1.209231 and an F–VIM of 0.173028. These results identify PCM leakage from the tank and module as the two leading contributors to the top event probability under the adopted model.
BE18, BE20, BE11, BE2, and BE6 form the next priority group. Their results support further investigation of pump-bearing durability, transducer drift, PCM degradation, operational transients, and relay inaction or delay. BE2 and BE6 have equal assigned failure probabilities and equal F–VIM values and should therefore be treated as tied in importance.
The criticality map combines failure likelihood, RRW, and CCI to help communicate the relative priorities for engineering investigation. RRW represents the modelled ratio between the baseline top event probability and the probability obtained after setting a selected event probability to zero. It does not guarantee that a real engineering intervention will achieve the same reduction. Figure 6 presents the criticality map.
Figure 6.
Criticality map of the HBTMS basic events based on failure probability, risk reduction worth, and component contribution index.
5.5. Fuzzy Spread and Top Event Uncertainty Importance
The uncertainty associated with fuzzy-derived failure probabilities requires a distinction between the relative spread of individual basic event estimates and their influence on the overall top event probability. In the present study, the lower, modal, and upper coordinates represent the support and most plausible value of a triangular fuzzy assessment. They are not independent statistical observations or equally probable samples. Consequently, calculating a conventional coefficient of variation by treating these three coordinates as equally weighted observations does not provide a statistically established measure of uncertainty. Accordingly, the present analysis employs a descriptive fuzzy spread index and an additional sensitivity assessment to examine the influence of individual basic events on the top event uncertainty interval.
The relative spread of each fuzzy-derived failure probability was evaluated using the difference between its upper- and lower-transformed probabilities, normalised by its modal value. The resulting fuzzy spread index (FSI) is expressed as follows:
where , , and denote the lower, modal, and upper failure probabilities of basic event i, respectively. This index describes the relative width of the fuzzy-derived probability support around its modal value. It is used as a descriptive measure of fuzzy spread rather than a statistical coefficient of variation or a probability-based uncertainty measure.
Using the rounded triangular fuzzy coordinates reported in Table 5 and their corresponding Onisawa-transformed probabilities, BE1 and BE5 exhibit the largest relative fuzzy spreads, with FSI values of approximately 374.08% and 368.14%, respectively. BE22 follows with approximately 275.58%, while BE23 and BE4 show values of approximately 250.70% and 247.97%, respectively. These results indicate substantial relative variation in the estimated probabilities of these events. However, a large relative spread does not necessarily indicate a substantial contribution to uncertainty in the overall system failure probability, particularly when the corresponding modal failure probability is comparatively small.
To examine the propagation of fuzzy uncertainty across the system, an alpha-cut analysis was additionally performed using membership levels of 0, 0.25, 0.50, 0.75, and 1. For a triangular fuzzy number, the alpha-cut interval was determined as follows:
The lower and upper coordinates at each membership level were transformed into their corresponding failure probabilities using the Onisawa transformation. The resulting probability bounds were then propagated through the independent OR-gate model to calculate the corresponding lower and upper top event estimates.
The propagated top event interval progressively narrowed as the membership level increased. At membership levels of 0, 0.25, 0.50, and 0.75, the resulting intervals were 0.083095–0.276142, 0.096503–0.236733, 0.112013–0.203430, and 0.129977–0.175083, respectively. At membership level 1, the lower and upper estimates converged to the modal-coordinate estimate of 0.150824. This behaviour demonstrates how the system-level fuzzy uncertainty changes across different membership levels. The resulting bounds represent fuzzy possibility-based estimates and should not be interpreted as statistical confidence or prediction intervals.
An additional one-at-a-time interval sensitivity assessment was conducted to identify the basic events with the greatest influence on the top event uncertainty. Each fuzzy-derived basic event was successively fixed at its modal probability, while the alpha-cut bounds of the remaining events were retained. The top event interval was recalculated at each membership level, and the relative reduction in interval width was determined as follows:
where W(α) denotes the original top event interval width at membership level α, and denotes the interval width obtained when the probability of basic event i is fixed at its modal value. The average reduction across membership levels of 0, 0.25, 0.50, and 0.75 was subsequently used to rank the influence of individual inputs on the system-level uncertainty interval.
The results identify BE10 and BE3 as the two most influential events, producing average reductions of approximately 17.21% and 16.86%, respectively, when their fuzzy ranges were fixed at their modal values. BE18, BE20, BE11, BE6, and BE2 form the next priority group, with average reductions ranging from approximately 11.26% to 11.90%. In contrast, BE1 and BE5, despite exhibiting the largest relative fuzzy spreads, produced average reductions of only approximately 0.11% and 0.12%, respectively.
These findings demonstrate that the relative spread of an individual fuzzy-derived probability and its contribution to system-level uncertainty represent different aspects of the reliability assessment. BE1 and BE5 exhibit considerable relative fuzzy spread, whereas BE10 and BE3 have a substantially greater influence on the propagated top event interval. Therefore, priorities for further data collection, component testing, and expert reassessment should consider both the relative fuzzy spread and the influence of each input on the top event uncertainty. The interval sensitivity results provide a model-based screening approach for identifying inputs whose refinement may have the greatest potential to narrow the system-level uncertainty interval. These rankings remain conditional on the adopted fuzzy assessments, Onisawa transformation, and independent OR-gate model. Figure 7 shows the fuzzy uncertainty assessment of HBTMS basic events: (a) relative fuzzy spread index of individual basic events; (b) influence of individual basic event uncertainty on the propagated top event interval width; and (c) propagation of top event probability bounds across different fuzzy membership levels.
Figure 7.
(a) Fuzzy uncertainty assessment of HBTMS basic events: relative fuzzy spread index of individual basic events. (b) Fuzzy uncertainty assessment of HBTMS basic events: influence of individual basic event uncertainty on the propagated top event interval width. (c) Fuzzy uncertainty assessment of HBTMS basic events: propagation of top event probability bounds across different fuzzy membership levels.
5.6. Reliability Improvement Potential (RIP) Analysis
The reliability improvement potential (RIP) analysis evaluates the effect of reducing one basic-event failure probability by 50% while keeping all other basic-event probabilities at their baseline values. For each event, the revised top event probability is calculated using the exact independent OR-gate expression. RIP is expressed as the percentage reduction in the top event probability relative to the baseline value of 0.1508206116.
The analysis identifies BE10 (PCM leakage from the tank) as the event with the greatest individual improvement potential. Reducing its probability by 50% decreases the top event probability to approximately 0.137387, corresponding to an RIP of 8.91%. BE3 (PCM leakage from the module) follows, with an RIP of 8.65%. The next priority group comprises BE18, BE20, BE11, BE2, and BE6, with individual RIP values ranging from approximately 5.16% to 5.59%.
These results indicate that PCM leakage prevention offers the greatest individual modelled improvement potential, followed by measures addressing bearing failure, transducer drift, PCM degradation, operational transients, and relay inaction or delay. BE2 and BE6 have equal assigned probabilities and equal individual RIP values. The results represent mathematical scenarios rather than guaranteed engineering improvements. Figure 8 presents the individual reliability improvement potentials of the basic events.
Figure 8.
Individual RIP of the seven highest-priority basic events under a 50% reduction in each event’s failure probability, with all other basic-event probabilities held at their baseline values.
5.7. Risk Matrix (Likelihood Criticality Matrix)
A likelihood criticality risk matrix was developed to visually classify basic events by their probability of occurrence and contribution to the top event. Unlike the criticality map, which integrates failure probability, risk reduction worth, and the component criticality index (CCI), the likelihood criticality matrix uses a two-dimensional representation based only on failure likelihood and exact Fussell–Vesely importance. This approach enables clear and intuitive communication of risk priorities.
The horizontal axis of the matrix indicates the failure probability associated with each basic event:
The vertical axis denotes the exact Fussell–Vesely importance measure:
where Qi(0) represents the probability of the top event after the selected basic event is set to zero.
The selection of the risk classification thresholds was guided by the distribution of the calculated basic-event failure probabilities and their corresponding Fussell–Vesely importance measures (F-VIM). There are no universally applicable numerical thresholds for this type of likelihood/criticality matrix, so the boundaries we have adopted are treated as study-specific screening criteria rather than as universal risk thresholds. That is in keeping with the ISO 31000 and IEC 31010 approach, which is that the risk criteria and the matrix boundaries should be defined in the context of the specific assessment, its aims and scope [58,59].
In this study, the high-risk probability threshold of 0.01 is used to separate the seven major events (whose failure probabilities are in the range 1.80 × 10⁻² to 3.07 × 10⁻²) from the remainder. The corresponding F-VIM threshold of 0.05 is used to identify those events which are of significant contribution to the calculated top event probability. Intermediate thresholds of 0.0008 for failure probability and 0.005 for F-VIM are used to separate those events which are of moderate likelihood or system-level importance from those which are of comparatively low importance. The use of both measures provides a combined assessment of event occurrence and event contribution to system failure rather than just the magnitude of the individual failure probabilities [45,60]. The thresholds are thus used to aid in the relative prioritisation of events within the HBTMS reliability model and should not be taken as universal engineering acceptance criteria.
Basic events were split into three risk zones. An event was deemed to be high risk if both its failure probability and its exact Fussell–Vesely importance measure (F-VIM) were reasonably high:
and
Events were classified as medium risk if they exhibited either moderate failure probability or moderate importance:
or
excluding events already designated as high risk. All remaining events were classified as low risk.
Using the specified likelihood and F–VIM thresholds, the risk matrix classifies BE10, BE3, BE18, BE20, BE11, BE2, and BE6 as high-risk events. These events combine relatively high assigned failure probabilities with high F–VIM values under the adopted model.
The medium-risk group comprises BE4, BE9, BE12, BE14, BE16, BE17, BE19, and BE21. The low-risk group comprises BE1, BE5, BE7, BE8, BE13, BE15, BE22, and BE23. In particular, BE14, representing flow maldistribution in the coolant flow path, belongs to the medium-risk group, whereas BE15, representing erosion in that flow path, belongs to the low-risk group. This distinction is consistent with the corrected identified-event probabilities.
To examine the influence of the selected classification boundaries, a threshold sensitivity assessment was conducted by simultaneously increasing and decreasing all four numerical cutoffs by 20%, while retaining the original base-event probabilities, fault-tree structure, and independence assumption. The corresponding F-VIM values were recalculated using the exact independent OR-gate expression. When all thresholds were increased by 20%, the high-risk group remained unchanged, comprising BE10, BE3, BE18, BE20, BE11, BE2, and BE6. However, the medium-risk group decreased from eight to three events (BE9, BE14, and BE17), with BE4, BE12, BE16, BE19, and BE21 moving into the low-risk category. Conversely, reducing all thresholds by 20% retained the same seven high-risk events, while BE23 moved from the low-risk to the medium-risk category, increasing the medium-risk group to nine events.
These results demonstrate that the identification of the seven dominant high-risk events is robust to reasonable variations in the selected thresholds. Nevertheless, the classification of events close to the medium–low boundary is sensitive to the numerical cutoffs. Therefore, the risk matrix is interpreted as a supplementary screening and visualisation tool, while the exact F-VIM values and other quantitative reliability results remain the principal basis for prioritising improvement measures. The classification boundaries should consequently be understood as model-specific decision criteria rather than absolute measures of engineering risk.
A comparison of the risk-matrix classification with the continuous F-VIM rankings indicates that both approaches identify the same seven dominant basic events: BE10, BE3, BE18, BE20, BE11, BE2, and BE6. Thus, the adopted risk-matrix thresholds do not change the selection of the principal engineering improvement priorities. However, the risk matrix groups these events into a common high-risk category and therefore does not preserve their relative ordering within that category. The continuous F-VIM values provide additional discrimination, identifying BE10 and BE3 as the leading contributors, followed by BE18, BE20, BE11, and the equally ranked BE2 and BE6. Furthermore, the threshold sensitivity analysis shows that changes in the numerical boundaries mainly affect the classification of events close to the medium–low boundary, while the seven dominant high-risk events remain unchanged. Consequently, the risk matrix provides a supplementary categorical screening tool, whereas continuous F-VIM values remain the principal basis for ranking and allocating engineering improvement priorities.
The classification supports prioritising the high-risk events for further reliability investigation and mitigation. However, the high-, medium-, and low-risk categories depend on the numerical thresholds adopted in this study; they should not be interpreted as universal risk classifications. Figure 9 presents the likelihood–criticality matrix.
Figure 9.
Likelihood criticality risk matrix of HBTMS basic events based on failure probability and exact Fussell–Vesely importance measure.
5.8. Reliability Allocation and Improvement Scenario Study
The reliability improvement potential (RIP) analysis looks at the improvement potential of each basic event on its own. In reality, though, reliability improvement programmes generally deal with a number of failure modes in sequence rather than concentrating on just one event. For this reason, a reliability allocation and improvement scenario analysis was carried out in order to examine the total reduction in the probability of the top event when reliability measures are applied in sequence to the main basic events.
The order in which the improvements were made was decided because, in the F-VIM, Pareto, sensitivity, RIP, and criticality analyses, consistent convergence of the rankings was observed. The sequence chosen was as follows:
Two levels of improvement were evaluated:
and
For each scenario, the improved probability of each selected basic event was calculated as follows:
where the improvement factor is denoted as r. For the 30% improvement scenario,
and for the 50% improvement scenario,
The updated top event probability for each scenario was calculated using
For basic events not included in the improvement scenario,
The percentage reduction in the top event probability was calculated as follows:
where
The allocation analysis compares two sequential improvement scenarios involving the seven dominant basic events: BE10, BE3, BE18, BE20, BE11, BE6, and BE2. The order follows the revised importance and improvement analyses. Because BE2 and BE6 have equal F–VIM values, their relative order is a modelling choice.
In the 30% reduction scenario, sequentially improving all seven events reduces the top event probability from 0.150821 to approximately 0.110138, corresponding to an overall reduction of 26.97%. In the 50% reduction scenario, the probability decreases to approximately 0.082108, corresponding to an overall reduction of 45.56%.
The comparison shows that the assumed degree of improvement in the dominant events substantially affects the calculated system-level result. The reductions are conditional mathematical scenarios under the independent OR-gate model; they are not experimentally demonstrated improvements or forecasts of actual field performance.
The scenario analysis supports prioritising PCM leakage prevention, followed by bearing durability, transducer-drift monitoring, PCM degradation control, relay response, and management of operational transients. Figure 10 compares the sequential 30% and 50% improvement scenarios.
Figure 10.
Reliability allocation scenario analysis showing the reduction in exact top event probability when reliability improvements are sequentially applied to the dominant basic events of the HBTMS.
The reliability improvement scenarios provide a quantitative indication of the potential benefits of reducing the failure probabilities of the seven dominant basic events. However, translating these mathematical reductions into practical engineering improvements requires interventions targeting the physical failure mechanisms represented by the selected events. Accordingly, potential interventions, their relative implementation costs, and supporting experimental evidence are considered below.
For BE10 (PCM leakage from the external tank) and BE3 (PCM leakage from the battery module), potential interventions include improved enclosure design, compatible sealing materials, reinforced encapsulation, and secondary containment. Experimental investigations by Wang [61] demonstrated that incorporating expanded graphite and epoxy into paraffin-based PCM composites improved thermal performance and helped prevent leakage during repeated battery charge–discharge cycles. Similarly, experimental investigations of composite PCM battery modules have demonstrated the importance of enclosure integrity and mechanical reinforcement in preventing leakage under repeated operating conditions. These findings support the technical feasibility of PCM containment improvements, although their effectiveness in the specific HBTMS configuration requires further validation.
For BE18 (pump-bearing failure), improved bearing geometry, lubrication performance, and hydraulic design are potential interventions. Gu [62] investigated lubrication-film breakdown in high-speed electric-vehicle coolant pumps and experimentally validated the identified bearing failure mechanisms. Their findings highlight the importance of controlling unsteady rotor forces and maintaining adequate bearing load capacity. For BE20 (transducer drift), periodic calibration, redundant temperature sensing, and model-based fault detection can improve the reliability of temperature measurements. Experimental studies by [63] demonstrated the application of model-based fault detection, isolation, and estimation for temperature, voltage, and current sensors in lithium-ion battery systems.
For BE11 (PCM degradation), material compatibility assessment, suitable PCM encapsulation, and repeated thermal-cycle qualification are potential improvement measures. Experimental investigations by Stathopoulos [64] examined PCM degradation and containment integrity under repeated thermal cycling, demonstrating the importance of evaluating material stability under application-related conditions. For BE6 (relay inaction or delay), appropriate relay selection, contact monitoring, and electrical endurance testing may reduce the likelihood of undetected contact deterioration. Wang [65] demonstrated the use of accelerated electrical-life testing to identify relay contact degradation through measurements of contact resistance and switching characteristics. Finally, BE2 (operational transients during vehicle operation) may be addressed through improved thermal-control logic, appropriate pump and valve coordination, and gradual control responses under changing operating loads. Experimental verification of electric-vehicle thermal-management systems under driving-cycle conditions provides a practical basis for evaluating such control strategies.
The relative implementation costs of these interventions are expected to differ. PCM enclosure redesign and material qualification may require relatively high engineering and validation expenditure, whereas calibration procedures, diagnostic software, and routine condition monitoring may involve comparatively lower costs when existing instrumentation is available. Bearing redesign, sensor redundancy, and relay upgrades may involve moderate expenditure depending on the extent of component modification and testing required. These cost categories represent qualitative engineering assessments rather than supplier quotations or project-specific cost estimates.
Importantly, the published experimental studies demonstrate the technical feasibility of individual interventions but do not establish that they will reduce the failure probabilities of the selected basic events by exactly 30% or 50%. Therefore, the two improvement levels remain illustrative mathematical assumptions. Their practical achievement would need to be established through controlled component-level experiments, including PCM leakage and thermal-cycling tests, pump-bearing durability tests, sensor drift and calibration assessments, relay endurance testing, and HBTMS validation under representative vehicle operating cycles. The measured failure frequencies obtained before and after intervention could subsequently be used to update the basic event probabilities and reassess the top event probability.
Consequently, the calculated reductions of 26.97% and 45.56% should be interpreted as conditional reliability improvement potentials under the adopted independent OR-gate model, rather than experimentally demonstrated engineering outcomes or guaranteed performance improvements. Table 8. Presents the proposed engineering interventions, relative implementation costs, and experimental validation requirements.
Table 8.
Proposed engineering interventions, relative implementation costs and experimental validation requirements.
5.9. Sensitivity Analysis Under Correlated Basic Events
To examine the influence of potential statistical dependence among repeated failure mechanisms, an additional correlation-based sensitivity analysis was conducted. Three pairs of basic events with repeated failure-mode descriptions were considered: BE7–BE15 (erosion), BE8–BE13 (fouling and scaling), and BE9–BE14 (flow maldistribution). Their marginal failure probabilities were retained as reported in Table 2. BE3 and BE10 were not included in the selected-pair Gaussian copula analysis because they represent leakage events at two physically distinct containment locations rather than repeated failure descriptions of the same mechanism at separate locations. However, their physical distinction does not establish statistical independence. Both events may potentially be influenced by common thermal operating conditions, material ageing or maintenance-related factors. Furthermore, their effects may interact with PCM degradation (BE11) and the performance of the liquid-cooling subsystem. These potential relationships are therefore considered in the additional engineering dependency assessment presented in the Section Engineering Assessment of Additional Dependency Mechanisms, although they cannot be quantified using the available information.
The joint occurrence probability of each selected pair was estimated using a Gaussian copula as follows:
where qi and qj represent the marginal failure probabilities, is the inverse standard normal cumulative distribution function, is the bivariate standard normal cumulative distribution function, and ρij is the assumed dependence parameter. The probability of occurrence of at least one event within each pair was subsequently calculated as follows:
Four scenarios were considered, with dependence parameters of 0, 0.25, 0.50 and 0.75. The zero-correlation scenario represents the original independent-event model. For the remaining scenarios, the dependence parameter was applied consistently to all three selected pairs, while their marginal probabilities were maintained.
The results show a very slight decrease in the calculated top event probability as the assumed positive dependence increases. This is due to the fact that positive dependence increases the overlap between the probabilities of the two events in the pair, thereby reducing the probability of their union when the marginal probabilities are held constant. The top event probability falls from 0.1508206 under the independent baseline to 0.1506302 under the scenario of the strongest dependence we have considered. The change is very small and confirms that the identified event pairs have a very limited impact on the overall top event probability under the dependence assumptions.
It should be pointed out that the dependence parameters are hypothetical sensitivity assumptions rather than experimentally derived correlations, as there is no joint failure data available. Furthermore, the assessment assumes independence between the selected pairs and the remaining basic events. Therefore, the results provide a supplementary evaluation of the influence of potential dependence and do not replace the original independent-event reliability model. Figure 11 shows the effect of assumed correlation among selected duplicated basic events on the top event probability.
Figure 11.
Effect of assumed correlation among selected duplicated basic events on the top event probability.
The correlation-based assessment provides a limited sensitivity examination of selected repeated failure mechanisms rather than a comprehensive treatment of statistical dependence throughout the HBTMS. The assumed correlation coefficients were selected for scenario analysis because empirical joint-failure data were unavailable. Therefore, the relatively small change in the calculated top event probability should be interpreted only within the selected pairs and dependence ranges. Other potential common-cause mechanisms and dependencies remain to be investigated.
Engineering Assessment of Additional Dependency Mechanisms
The correlation-based analysis presented above examines three pairs of repeated failure mechanisms. However, potential dependencies within the HBTMS extend beyond repeated failure descriptions and may also arise from shared functional components, common operating conditions and sequential failure propagation. Therefore, an additional qualitative engineering assessment was undertaken to identify physically plausible relationships among the basic events.
Table 9 summarises the principal potential dependency pathways identified from the HBTMS fault-tree structure.
Table 9.
Potential physical and functional dependencies among selected basic events.
The relationships in Table 9 represent potential engineering interactions rather than statistically established dependencies. In particular, the relationship between PCM leakage and degradation may involve both common material-related influences and changes in the consequences of subsequent thermal disturbances. Similarly, pump and sensor failures may interact through the regulation of coolant circulation, even when their initiating failure mechanisms are different.
The present static fault-tree model does not explicitly represent the temporal order of these failures, conditional changes in component failure probabilities, or feedback between the PCM and liquid-cooling subsystems. Moreover, the available information does not provide sufficient joint-failure observations or detailed electrical and control-system architecture to quantify these additional dependencies reliably. Accordingly, the identified relationships are retained as a qualitative engineering assessment and are not incorporated as additional numerical correlation coefficients in the baseline calculation.
5.10. Sensitivity Analysis of Expert Weighting Parameter
To examine the influence of the relaxation parameter on the fuzzy reliability results, a sensitivity analysis was conducted by varying μ from 0 to 1 using five scenarios: 0, 0.25, 0.50, 0.75, and 1.00. The initial importance measures of the three experts (0.38, 0.32, and 0.30) were retained, while the relative agreement degrees (RADs) were recalculated separately for each of the 17 fuzzy-assessed basic events using the linguistic evaluations in Table 4. For each scenario, the expert weights were recalculated using the weighting equation presented in Section 4.1(a). The resulting weights were then used to recompute the aggregated triangular fuzzy numbers, failure possibility scores (FPS), and corresponding numerical failure probabilities through the Onisawa transformation. The six identified-event probability inputs in Table 2 were held constant throughout the analysis.
The calculated top event probability decreased progressively from 0.154135 at μ = 0 to 0.147931 at μ = 1.00, while the baseline value at μ = 0.50 remained approximately 0.150821. Relative to the baseline, the corresponding changes were approximately +2.20%, +1.06%, 0%, −0.99%, and −1.92%, respectively. This shows that the relaxation parameter does have an effect on the numerical top event probability, albeit a very small one over the range considered.
The F-VIM ranking analysis also showed that BE10 and BE3 were the two highest ranked contributors in all five scenarios. At μ = 0, they were tied for the top spot, with BE10 first and BE3 second in all the other scenarios. BE18, BE20 and BE11 were consistently the next three most important events for μ values between 0.25 and 1.00. Spearman’s rank correlation coefficients against the baseline ranking of all 23 basic events were 0.9499, 0.9792, 1.0000 and 1.0000 for μ values of 0, 0.25, 0.75 and 1.00, respectively. There was some movement in the positions of the intermediate and lower-ranked events, but the general agreement in the ranking was very good.
The sensitivity results show that the principal reliability improvement priorities (again PCM leakage in the case of BE10 and BE3) are fairly stable across the range of expert weighting assumptions considered. The top event probability and the ranking of a number of the less significant events, however, do vary with the chosen balance between initial importance and expert agreement. The value of μ = 0.50, which has been adopted, is therefore a fairly balanced methodological assumption rather than an optimised value derived from the data. The results do indicate a degree of robustness in the principal failure priorities within the adopted fuzzy fault-tree framework, without in any way implying that the results are independent of the expert weighting assumptions. Figure 12 shows the sensitivity of the top event probability to the relaxation parameter μ. Figure 13 shows the sensitivity of the F–VIM values of the dominant basic events under the alternative expert weighting scenarios.
Figure 12.
Sensitivity of top event probability to the relaxation parameter μ.
Figure 13.
Sensitivity of F–VIM values of dominant basic events under alternative expert-weighting scenarios.
The expert-weighting sensitivity analysis examines the influence of the relaxation parameter within the adopted consistency-based aggregation method. Although the leading failure priorities remained relatively stable across the examined scenarios, the analysis does not establish robustness to alternative fuzzy membership functions or probability-conversion methods. These methodological choices may influence the resulting numerical failure probabilities and warrant further investigation using appropriately calibrated alternative formulations and independent reliability data.
5.11. Combined Discussion of the Reliability Analyses
The reliability analyses provide complementary information on the failure behaviour of the HBTMS within the adopted fuzzy fault-tree framework. However, the different ranking indicators should not be interpreted as independent evidence of robustness because some are mathematically related under the assumed independent OR-gate structure. In particular, the component contribution index, Fussell–Vesely importance measure, one-at-a-time sensitivity spans, and individual reliability improvement measures are derived from the same basic event failure probabilities and the same top event probability expression. Their agreement therefore reflects the mathematical properties of the adopted model rather than independent confirmation of the identified failure priorities. Accordingly, these analyses are used to examine different aspects of contribution, sensitivity, risk classification, and potential improvement within the same modelling framework. Additional sensitivity assessments involving alternative expert-weighting parameters and selected dependent basic event pairs provide further examination of the influence of specific modelling assumptions.
To provide a numerical consistency check, the baseline top event probability was evaluated using the exact independent OR-gate expression, , with the 23 basic-event probability inputs reported in Table 2 and Table 5. The resulting baseline estimate was 0.1508206116, corresponding to a complementary probability of 0.8491793884 that none of the basic events occurs under the adopted independence assumption. The same probability expression was applied to the lower, modal, and upper coordinates of the aggregated fuzzy inputs, producing top event estimates of 0.083095, 0.150824, and 0.276142, respectively. The close agreement between the baseline point estimate and the modal-coordinate estimate provides an additional arithmetic consistency check on the probability propagation procedure. However, this numerical verification confirms the application of the adopted mathematical model rather than the physical validity of the inherited fault tree structure or the empirical accuracy of the input probabilities.
The practical interpretation of the baseline top event probability is that it has to be considered in terms of time and operational constraints. The value of 0.150821 that we have calculated is a dimensionless conditional probability of 15.0821% based on the basic event probabilities we have assumed, the fault tree structure, and the assumption of statistical independence. It is not the annual probability of HBTMS failure, nor is it the probability of failure over a given vehicle operating period. It should not be read as the probability of battery thermal runaway, vehicle fire, or complete vehicle-level thermal management failure, as the top event as defined is specifically the probability of improper heat transfer to the PCM.
From an engineering standpoint, the calculated probability and associated importance rankings can be used to do a preliminary reliability screening exercise to identify the components that are of interest. The model has identified PCM containment, pump bearing durability, and transducer performance as the key priorities. This could be used to inform component inspections, condition monitoring, design improvements, and future data collection. It is important to note, however, that the results in themselves do not allow for the determination of maintenance intervals or the quantification of vehicle-level safety risk. The same applies to the determination of warranty failure rates, expected component life, or annual failure rates. Those applications would require validated component-specific failure rates, documented operating exposure, vehicle duty cycle information, and time-stamped field performance data. The results are therefore intended to be of use in a comparative engineering assessment and in the prioritisation of reliability improvements rather than in any direct determination of time-based maintenance, safety risk or warranty decisions.
The Pareto analysis shows that BE10 and BE3 taken together account for around 37.41% of the normalised additive contribution, with the first three events accounting for approximately 49.46%. The cumulative CCI exceeds 80% upon including either of the tied events BE2 and BE6 after the first five ranked events; including both raises the cumulative value to approximately 94.58%.
The uncertainty analysis provides a complementary perspective by distinguishing the relative fuzzy spread of individual basic event probabilities from their influence on the overall top event uncertainty. The fuzzy spread index identifies BE1 and BE5 as having the largest relative spreads in their fuzzy-derived failure probabilities. However, the additional one-at-a-time interval sensitivity assessment identifies BE10 and BE3 as the events with the greatest influence on the propagated top event uncertainty interval, producing average interval-width reductions of approximately 17.21% and 16.86%, respectively, when their fuzzy probability ranges are fixed at their modal values. This distinction indicates that a large relative spread in an individual event does not necessarily correspond to a substantial contribution to system-level uncertainty. Data collection priorities should take into account both the spread of the individual probability estimates and the potential impact of refining those estimates on the overall top event uncertainty interval. BE10 and BE3 are clearly the ones that are of the most significance in terms of reducing system-level uncertainty. BE1 and BE5 are the ones that require further work, as they have the broadest fuzzy probability ranges.
The risk matrix classifies BE10, BE3, BE18, BE20, BE11, BE2, and BE6 as high risk under the study-defined thresholds. BE4, BE9, BE12, BE14, BE16, BE17, BE19, and BE21 are medium risk; the rest are low risk. The categorisation is, of course, dependent on the thresholds selected and should not be taken as some kind of universal risk rating. The conclusion that PCM leakage is the most critical failure mode is based purely on the relative failure probabilities assigned to BE3 and BE10 and their importance in the fuzzy fault-tree model as calculated in this study. There are no independent component-level leakage tests, no field failure data, and no experimental evidence to support the assertion that PCM leakage is the dominant failure mode in reality (i.e., that it is more likely than bearing failure, transducer drift, or any of the other potential failure modes). The ranking is therefore purely a model-based reliability ranking and not an established hierarchy of actual HBTMS failures. The proposed mitigation measures (PCM containment, sealing, leakage detection, pump and bearing monitoring, and sensor diagnostics) are all potential engineering responses to the failure modes identified. Their actual effectiveness will need to be established through subsequent component-level testing and operational validation.
The sequential improvement scenarios show that a 30% reduction in the probabilities of the seven dominant events leads to a modelled reduction of 26.97% in the top event probability, whereas sequential 50% reductions lead to a modelled reduction of 45.56%. They do, of course, demonstrate the potential benefit of a co-ordinated reliability improvement programme; they do not in any way demonstrate that the same level of improvement will be achieved in reality.
The supplementary correlation-based sensitivity study also looked at the effect of potential statistical dependence between the various selected repeated failure mechanisms. The only real difference in the top event probability was a very small one under the various positive dependence scenarios (the most extreme case being a 0.126% reduction relative to the independent baseline). This again confirms that the selected identified event pairs have a very limited impact on the overall probability under the assumptions made. It should be noted that this is all conditional on the selected event pairs and the assumed dependence parameters and does not in any way rule out the existence of other common cause failure mechanisms within the HBTMS.
The additional engineering dependency assessment identifies potential interactions that extend beyond the three repeated failure-mode pairs considered in the Gaussian copula analysis. In particular, the combined effects of PCM leakage and degradation, pump and coolant-flow disturbances, and sensing and control failures may influence the functional performance of the HBTMS. A failure in one subsystem may increase the thermal or operational burden on another subsystem, thereby producing sequential or conditional effects that cannot be fully represented by the independent OR-gate formulation. So the relatively small change that we get from the selected correlation scenarios should not be taken as proof that all the possible dependencies have no impact on the system-level failure probability. It simply reflects the fact that the three pairs of components that we have looked at have a very small effect on the system-level failure probability under the assumed dependence parameters and the fixed marginal probabilities. The top event probability and the fuzzy uncertainty interval are therefore conditional on the independent event model that we have adopted. A more complete quantitative assessment would require component-level joint failure data, verified electrical and control system architecture, and a dynamic reliability model that could account for common cause and sequential failure mechanisms.
Overall, the analysis supports the prioritisation of PCM containment and leakage detection, pump bearing life, transducer drift diagnostics, PCM degradation control, relay response, and transient thermal load management. The findings remain conditional on the inherited fault-tree structure, the assigned basic-event probabilities, and the assumption of statistical independence. Further work should examine dependencies among events, common-cause failures, the physical sufficiency of singleton basic events, and the mission-time basis of the identified-event probabilities. The present study quantifies the adopted model; it does not independently validate the model’s physical structure.
Although the previous deterministic study [40] reported a top event probability of 6.00% over a 10,000 h mission, a direct numerical comparison with the present fuzzy assessment is not appropriate. The previous study explicitly defined its mission duration and used database-derived constant failure rates, whereas the mission-time basis of the expert-transformed and identified-event inputs in the present study could not be independently established. Furthermore, the two assessments employ different input representations and analytical approaches. Therefore, the results are discussed as complementary reliability assessments rather than directly comparable estimates over an equivalent operating period.
The difference between the present fuzzy-derived estimates and the earlier deterministic reliability results should not be attributed exclusively to the Onisawa transformation. The present approach incorporates linguistic assessments from three experts, combines them through a consistency-based weighting procedure, and subsequently converts the aggregated fuzzy values into numerical estimates using centre-of-area defuzzification and the Onisawa transformation. Accordingly, the resulting values reflect the combined influence of expert-assigned possibility levels, expert aggregation weights, and the nonlinear probability-conversion function. Although the Onisawa transformation produces a nonlinear mapping, the available information does not establish that the expert assessments are systematically conservative or that the transformation independently amplifies low-probability failure events. Such a conclusion would require an independent benchmark or alternative probability-conversion models.
A direct comparison after conversion to an 8760 h mission period could not be performed reliably because the original exposure periods associated with the expert assessments and the six identified-event inputs were unavailable for independent verification. Applying a common mission duration without establishing the original time basis would introduce an unsupported assumption. Therefore, the present results are interpreted as conditional numerical estimates under the adopted fuzzy-assessment and fault-tree framework, rather than as directly comparable annual or 8760 h failure probabilities.
An additional limitation concerns the documentation of expert selection and assessment. Although the expert panel comprised two academic experts and one industry expert, individual qualification profiles, years of professional experience, specific areas of specialisation, and formal selection records were not available for retrospective verification. Furthermore, the initial importance measures were based on judgement-based recommendations made during academic discussions rather than a separately documented quantitative assessment of professional competence. Consequently, the assigned expert weights should be interpreted as methodological assumptions adopted for the present analysis rather than objectively measured indicators of professional competence. In future work, it would be appropriate to establish clear criteria for expert selection, document the relevant experience and qualifications, and consider the use of a formal expert elicitation process to improve the reproducibility of the assessment.
An additional limitation concerns the representation of component dependencies and common-cause failures. Although potential physical and functional interactions among PCM, coolant circulation, sensing, and control components have been identified, their joint occurrence probabilities and temporal propagation effects could not be established because of the absence of component-level operational and joint-failure data. The independent OR-gate formulation therefore provides a reference reliability assessment rather than a comprehensive representation of all possible HBTMS failure interactions. Future investigations should incorporate verified component architecture, common-cause failure modelling and dynamic fault-tree or Markov-based reliability approaches to examine conditional and sequential failure behaviour.
5.12. Broader Engineering Implications and Future Research Directions
The reliability of the HBTMS has important implications for vehicle-level energy efficiency, battery availability and operating performance. PCM leakage (BE3 and BE10) may reduce thermal-storage capacity and limit the absorption of transient heat during battery operation. Similarly, pump shutdown (BE16) and bearing failure (BE18) may interrupt coolant circulation and reduce heat removal. Sensor drift (BE20) may affect temperature monitoring and thermal-control decisions, while erosion (BE7 and BE15), fouling and scaling (BE8 and BE13), flow maldistribution (BE9 and BE14), and blockage or clogging (BE17) may progressively reduce heat-transfer effectiveness. These conditions may increase battery thermal stress, contribute to temperature-related power derating, restrict charging and discharging capability, and reduce vehicle availability. Such effects are particularly relevant to long-haul applications involving sustained power demand and extended operating periods. However, the present study does not quantitatively evaluate these vehicle-level effects. The system-level modelling perspective discussed by Lei et al. [31] provides a potential direction for extending component-level reliability assessment towards integrated powertrain performance and energy-management analysis.
The energy and environmental implications of the HBTMS should also account for the additional resources required for its installation and operation. PCM, containment structures, coolant, pumps, and heat exchangers increase system mass and may consequently increase vehicle traction energy consumption. Coolant circulation will require auxiliary pumping power, and active heat rejection may add to the energy demand. Passive PCM heat absorption can provide thermal buffering during transients and may in turn reduce the immediate demand on the active cooling components. Maintenance (coolant servicing, pump replacement, preventing PCM leakage, heat exchanger maintenance, etc.) will also have an impact on operating costs and lifecycle environmental impacts. The net energy and environmental benefits will therefore be a function of the balance between the added mass, the auxiliary energy required, the manufacturing and maintenance costs and the potential benefits in terms of improved battery thermal management and life. Quantifying this balance would require a vehicle-level energy assessment and lifecycle analysis, which is outside the scope of the present reliability-focused study.
Further work would be required to validate the fuzzy fault-tree under real operating conditions via a staged experimental approach, starting with component-level testing and progressing through to controlled battery module experiments and then vehicle-level experiments. Charge and discharge experiments under representative current profiles and ambient temperatures would be used to record battery cell and module temperatures, PCM temperatures, coolant inlet and outlet temperatures, coolant flow rates, and system pressure. Controlled fault injection and accelerated component testing could be used to investigate specific mechanisms such as PCM leakage, pump failure, sensor drift and coolant flow degradation. The resulting data could be compared with the failure modes in the fault tree to assess the physical validity of the tree. Battery temperature histories would provide information on the frequency, magnitude and duration of thermal excursions, while the charge and discharge current profiles and ambient temperature records would provide information on the operating stresses and environmental exposure. Maintenance records, component inspection reports and component replacement histories would provide evidence of actual failures. The actual failures could be related to appropriate exposure measures (e.g., operating hours, charge/discharge cycles) to allow the derivation of component-specific failure rates and probabilities. These estimates could then be used in place of the initial expert-derived assessments via Bayesian updating or some other statistically sound methodology. The updated basic event probabilities could then be used to recalculate the top event probability and re-assess component importance. The combination of statistical observations with the fuzzy expert assessments would, of course, require a well-defined methodology for the treatment of the two different forms of uncertainty. Such validation and data-driven refinement would be future work, as the present study did not have access to sufficiently detailed operational and experimental data.
Another potential direction is to integrate the fuzzy reliability framework with an interpretable physics-based thermal model. Following the theory-constrained and modular interpretability approach discussed by Lei et al. [32], such integration could establish physical relationships between selected basic events and measurable operating indicators. The thermal model could incorporate battery heat generation, heat transfer, coolant-flow behaviour, PCM melting and solidification, and the influence of battery state of charge (SOC). For example, PCM leakage (BE3 and BE10) could be monitored through PCM level, containment pressure, and temperature measurements, whereas pump-related failures (BE16 and BE18) could be associated with pump current, rotational speed, vibration, and coolant-flow measurements. Flow maldistribution (BE9 and BE14) could be examined through branch-wise flow rates, pressure distribution and temperature differences, while sensor-related failures (BE19 and BE20) could be assessed using measurement residuals and reference-sensor comparisons. These examples illustrate how physical predictions and measured deviations could support failure identification and subsequent refinement of the associated failure probabilities. The physics-based model would provide an interpretable representation of thermal and hydraulic behaviour, while the fuzzy fault-tree would retain its role in assessing the contribution of individual failure events to overall system reliability. The development and experimental validation of this integrated framework remain beyond the scope of the present study.
A further extension could involve jointly optimising HBTMS component sizing and operating control parameters within a reliability-informed optimisation framework. PCM volume, tank dimensions, pump capacity, sensor redundancy and coolant-flow control could be treated as design and operational variables. The optimisation objectives could include minimising the top event probability, auxiliary pumping energy, additional system mass and lifecycle cost while maintaining acceptable battery temperature and thermal uniformity. The fuzzy fault-tree model could evaluate the reliability implications of alternative component configurations and operating strategies, while a complementary thermal-hydraulic model could assess heat-transfer performance, PCM behaviour, coolant circulation and battery temperature under different operating conditions. Relevant constraints would include battery temperature limits, available installation space, pump operating capacity, and system cost. Such an integrated framework could identify configurations and control strategies that balance reliability, thermal performance, energy consumption and cost. Its implementation would require validated relationships between component design parameters, operating conditions and failure probabilities, supported by appropriate experimental and operational data. Therefore, reliability-informed component sizing and control optimisation represents a potential future research direction beyond the scope of the present study.
6. Conclusions
Fuzzy fault-tree analysis was applied to a hybrid phase change material (PCM) liquid battery thermal management system for electric vehicles, building on a previously developed and evaluated deterministic fault tree to address uncertainty in basic event probabilities. Expert judgments were combined using consistency-based weighting and converted to failure probabilities through centre-of-area defuzzification and the Onisawa transformation. The exact independent OR-gate model estimated the baseline point-estimate top event probability at 0.150821 as a dimensionless conditional estimate. The fuzzy-bound analysis produced an uncertainty interval from 0.083095 to 0.276142, with a modal-coordinate estimate of 0.150824. The baseline estimates are conditional on the adopted basic-event probabilities and fault-tree structure under the statistical independence assumption, while selected dependence scenarios were examined separately through an additional correlation-based sensitivity assessment. The additional uncertainty assessment distinguished the relative fuzzy spread of individual basic-event probabilities from their influence on the overall top event uncertainty interval. Although BE1 and BE5 exhibited the largest relative fuzzy spreads, the interval sensitivity assessment identified BE10 and BE3 as the most influential events for reducing system-level uncertainty. This distinction provides a more appropriate basis for prioritising further data collection and expert reassessment alongside engineering reliability improvements. Within the adopted fuzzy fault-tree model, PCM leakage from the external tank and battery module received the highest reliability priority based on the assigned failure probabilities and calculated importance measures. Bearing failure, transducer drift, PCM degradation, relay inaction, and operational transients formed the subsequent priority group. These rankings represent conditional model-based assessments rather than experimentally verified failure frequencies or an independently established hierarchy of physical failures. The additional expert-weighting sensitivity analysis showed that BE10 and BE3 remained the leading contributors across the examined relaxation parameter values, although the numerical top event probability varied with the selected weighting assumptions. Furthermore, the selected positive-dependence scenarios produced only a marginal change in the calculated top event probability, with a maximum reduction of approximately 0.126% relative to the independent baseline. The reliability allocation scenarios further illustrated that assumed reductions in the probabilities of the seven dominant basic events could reduce the calculated top event probability by 26.97% under the 30% reduction scenario and by 45.56% under the 50% reduction scenario. These values are illustrative numerical outcomes under the adopted independent OR-gate model and do not represent experimentally demonstrated improvements. The findings therefore provide a basis for prioritising future engineering investigations and validation of PCM containment, pump durability, sensor diagnostics, and component robustness.
Author Contributions
S.H.: Original draft preparation, conceptualisation, methodology, software, and data curation. H.A.: Supervision, reviewing, and editing. M.A.: Supervision, reviewing and editing. A.S.: Formal analysis, reviewing, and editing. P.K.: Formal analysis, reviewing, and editing. R.K.: Formal analysis, supervision, reviewing, and editing, validation. All authors have read and agreed to the published version of the manuscript.
Funding
This research received no external funding.
Data Availability Statement
The original contributions presented in this study are included in the article. Further inquiries can be directed to the corresponding author.
Conflicts of Interest
The authors declare no conflicts of interest.
References
- Ma, S.; Jiang, M.; Tao, P.; Song, C.; Wu, J.; Wang, J.; Deng, T.; Shang, W. Temperature Effect and Thermal Impact in Lithium-Ion Batteries: A Review. Prog. Nat. Sci. Mater. Int. 2018, 28, 653–666. [Google Scholar] [CrossRef] [Scilit]
- Kumar, N.; Agrawal, A.; Kumar, R.; Badoni, M. Autoencoder-Based Latent Representation Learning, SoH Estimation, and Anomaly Detection in Electric Vehicle Battery Energy Storage Systems. Vehicles 2026, 8, 81. [Google Scholar] [CrossRef] [Scilit]
- Sanguesa, J.A.; Torres-Sanz, V.; Garrido, P.; Martinez, F.J.; Marquez-Barja, J.M. A Review on Electric Vehicles: Technologies and Challenges. Smart Cities 2021, 4, 372–404. [Google Scholar] [CrossRef] [Scilit]
- Kumar, N.; Kundu, K.; Kumar, R. Comparative Study of Recurrent Neural Networks for Electric Vehicle Battery Health Assessment. World Electr. Veh. J. 2026, 17, 178. [Google Scholar] [CrossRef] [Scilit]
- Alami, A.H.; Maghrabie, H.M.; Abdelkareem, M.A.; Sayed, E.T.; Yasser, Z.; Salameh, T.; Rahman, S.M.A.; Rezk, H.; Olabi, A.G. Potential Applications of Phase Change Materials for Batteries’ Thermal Management Systems in Electric Vehicles. J. Energy Storage 2022, 54, 105204. [Google Scholar] [CrossRef] [Scilit]
- Alrashdan, A.; Mayyas, A.T.; Al-Hallaj, S. Thermo-Mechanical Behaviors of the Expanded Graphite-Phase Change Material Matrix Used for Thermal Management of Li-Ion Battery Packs. J. Mater. Process. Technol. 2010, 210, 174–179. [Google Scholar] [CrossRef] [Scilit]
- Ali, Z.M.; Calasan, M.; Gandoman, F.H.; Jurado, F.; Abdel Aleem, S.H.E. Review of Batteries Reliability in Electric Vehicle and E-Mobility Applications. Ain Shams Eng. J. 2023, 15, 102442. [Google Scholar] [CrossRef] [Scilit]
- Tohir, M.Z.M.; Martín-Gómez, C. Electric Vehicle Fire Risk Assessment Framework Using Fault Tree Analysis. Open Res. Eur. 2023, 3, 178. [Google Scholar] [CrossRef] [Scilit] [PubMed]
- Kim, W.; Yoon, H.; Lee, G.; Kim, T.; Youn, B.D. A New Calibration Metric That Considers Statistical Correlation: Marginal Probability and Correlation Residuals. Reliab. Eng. Syst. Saf. 2020, 195, 106677. [Google Scholar] [CrossRef] [Scilit]
- Volkanovski, A.; Čepin, M.; Mavko, B. Application of the Fault Tree Analysis for Assessment of Power System Reliability. Reliab. Eng. Syst. Saf. 2009, 94, 1116–1127. [Google Scholar] [CrossRef] [Scilit]
- Mariana Panaitescu, D.; Fănel-Viorel Panaitescu, D.; Eng Ionuț Voicu, A.; Laurențiu-George Dumitrescu, S. Fault Tree Analysis Used in Offshore Industry. Hidraulica 2018, 42–48. [Google Scholar]
- Yang, K.; Younis, H. A Semi-Analytical Monte Carlo Simulation Method for System’s Reliability with Load Sharing and Damage Accumulation. Reliab. Eng. Syst. Saf. 2005, 87, 191–200. [Google Scholar] [CrossRef] [Scilit]
- Libotte, G.B.; Neto, F.D.M.; Lobato, F.S.; Platt, G.M. Second-Order Inverse Reliability Analysis: A New Methodology to the Treatment of Reliability in Engineering System. In EngOpt 2018 Proceedings of the 6th International Conference on Engineering Optimization; Springer: Cham, Switzerland, 2019; pp. 855–866. [Google Scholar] [CrossRef] [Scilit]
- Ren, Z.; Zhang, D.; Koh, C.S. Investigation of Reliability Analysis Algorithms for Effective Reliability-Based Optimal Design of Electromagnetic Devices. IET Sci. Meas. Technol. 2016, 10, 44–49. [Google Scholar] [CrossRef] [Scilit]
- Pan, K.; Liu, H.; Gou, X.; Huang, R.; Ye, D.; Wang, H.; Glowacz, A.; Kong, J. Towards a Systematic Description of Fault Tree Analysis Studies Using Informetric Mapping. Sustainability 2022, 14, 11430. [Google Scholar] [CrossRef] [Scilit]
- An, J.; Hu, X.; Gong, L.; Zou, Z.; Zheng, L.R. Fuzzy Reliability Evaluation and Machine Learning-Based Fault Prediction of Wind Turbines. J. Ind. Inf. Integr. 2024, 40, 100606. [Google Scholar] [CrossRef] [Scilit]
- Shohan, A.A.A.; Ganesan, H.; Alsulamy, S.; Kumar, A.; Almujibah, H.R.; Petrounias, P.; Muruga Lal Jeyan, J.V. Developments on Energy-Efficient Buildings Using Phase Change Materials: A Sustainable Building Solution. Clean Technol. Environ. Policy 2024, 26, 263–289. [Google Scholar] [CrossRef] [Scilit]
- Jaise, J.; Ajay Kumar, N.B.; Shanmugam, N.S.; Sankaranarayanasamy, K.; Ramesh, T. Power System: A Reliability Assessment Using FTA. Int. J. Syst. Assur. Eng. Manag. 2013, 4, 78–85. [Google Scholar] [CrossRef] [Scilit]
- Che, J.; Lv, M.; Yang, Z.; Wang, Z.; Xu, F. Equipment Systems Reliability Analysis Based on FTA. In Proceedings of 2012 International Conference on Quality, Reliability, Risk, Maintenance, and Safety Engineering (ICQR2MSE 2012); IEEE: New York, NY, USA, 2012; pp. 293–296. [Google Scholar] [CrossRef] [Scilit]
- Basgöze, D.; Volk, M.; Katoen, J.P.; Khan, S.; Stoelinga, M. BDDs Strike Back: Efficient Analysis of Static and Dynamic Fault Trees. In NASA Formal Methods; Lecture Notes in Computer Science (LNCS, Volume 13260); Springer: Cham, Switzerland, 2022; pp. 713–732. [Google Scholar] [CrossRef] [Scilit]
- Chanda, R.S.; Bhattacharjee, P.K. A Reliability Approach to Transmission Expansion Planning Using Fuzzy Fault-Tree Model. Electr. Power Syst. Res. 1998, 45, 101–108. [Google Scholar] [CrossRef] [Scilit]
- Pan, H.S.; Yun, W.Y. Fault Tree Analysis with Fuzzy Gates. Comput. Ind. Eng. 1997, 33, 569–572. [Google Scholar] [CrossRef] [Scilit]
- Purba, J.H.; Sony Tjahyani, D.T.; Susila, I.P.; Widodo, S.; Ekariansyah, A.S. Fuzzy Probability and α-Cut Based-Fault Tree Analysis Approach to Evaluate the Reliability and Safety of Complex Engineering Systems. Qual. Reliab. Eng. Int. 2022, 38, 2356–2371. [Google Scholar] [CrossRef] [Scilit]
- Lin, C.T.; Wang, M.J.J. Hybrid Fault Tree Analysis Using Fuzzy Sets. Reliab. Eng. Syst. Saf. 1997, 58, 205–213. [Google Scholar] [CrossRef] [Scilit]
- Du, L.; Li, Q. Fuzzy Fault Tree Analysis of Conventional Propellant Temperature Control System. In Proceedings of the 2016 11th Systems of Systems Engineering Conference (SoSE), Kongsberg, Norway, 12–16 June 2016. [Google Scholar] [CrossRef] [Scilit]
- Akhtar, I.; Kirmani, S. An Application of Fuzzy Fault Tree Analysis for Reliability Evaluation of Wind Energy System. IETE J. Res. 2020, 68, 4265–4278. [Google Scholar] [CrossRef] [Scilit]
- Wang, H.L. Reliability Evaluation of Household Appliance Protection System Based on Fuzzy Fault Tree Analysis. In Proceedings of the 2015 12th International Conference on Fuzzy Systems and Knowledge Discovery (FSKD 2015); IEEE: New York, NY, USA, 2016; pp. 564–569. [Google Scholar] [CrossRef] [Scilit]
- Meng, J. Reliability Analysis of Ventilation System Based on Fuzzy Fault Tree. Adv. Mat. Res. 2013, 634–638, 3670–3677. [Google Scholar] [CrossRef] [Scilit]
- Jia, P.; Liu, Z.; Liu, P.; Yin, F.; Zhou, L.; Pang, N.; Shi, L. Reliability Analysis of Subsea Christmas Tree Structure Based on Fuzzy Fault Tree. In Proceedings of the International Conference on Mechanical Design and Simulation (MDS 2022), Wuhan, China, 20 September 2022; SPIE: Bellingham, WA, USA, 2022; Volume 12261, pp. 694–706. [Google Scholar]
- Wang, Q.; Yu, J.; Xia, R.; Liu, Q.; Tong, S.; Shen, Y. A Reliability Analysis Method for Fuzzy Multi-State System with Common Cause Failure Based on Improved the Weakest T-Norm. J. Frankl. Inst. 2024, 361, 106940. [Google Scholar] [CrossRef] [Scilit]
- Lei, N.; Zhang, H.; Pang, Z.; Hu, J.; Chen, H.; Hu, Z.; Wang, Z. Physics-Informed Surrogate-Assisted Co-Optimization of Fuel Cell Electric Vehicle Powertrain and Energy Management for Long-Haul Heavy-Duty Applications. Appl. Energy 2026, 414, 127828. [Google Scholar] [CrossRef] [Scilit]
- Lei, N.; Zhang, H.; Wang, H.; Hu, Z.; Chen, H.; Hu, J.; Wang, Z. Theory-Constrained Neural Network with Modular Interpretability for Fuel Cell Vehicle Modeling. IEEE Trans. Veh. Technol. 2025, 74, 8907–8920. [Google Scholar] [CrossRef] [Scilit]
- Lei, N.; Zhang, H.; Li, R.; Yu, J.; Wang, H.; Wang, Z. Physics-Informed Data-Driven Modeling Approach for Commuting-Oriented Hybrid Powertrain Optimization. Energy Convers. Manag. 2024, 299, 117814. [Google Scholar] [CrossRef] [Scilit]
- Sawyer, J.P.; Rao, S.S. Fault Tree Analysis of Fuzzy Mechanical Systems. Microelectron. Reliab. 1994, 34, 653–667. [Google Scholar] [CrossRef] [Scilit]
- Yang, Z.X.; Suzuki, K.; Shimada, Y.; Sayama, H. Fuzzy Fault Diagnostic System Based on Fault Tree Analysis. IEEE Int. Conf. Fuzzy Syst. 1995, 1, 165–170. [Google Scholar] [CrossRef] [Scilit]
- Yao, Z.; Wang, Z. Fault Diagnosis Analysis of Gear Based on Fuzzy Fault Tree. Adv. Mat. Res. 2011, 204–210, 1994–1997. [Google Scholar] [CrossRef] [Scilit]
- Chang, Z.; He, X.; Fan, H.; Guan, W.; He, L. Leverage Bayesian Network and Fault Tree Method on Risk Assessment of LNG Maritime Transport Shipping Routes: Application to the China–Australia Route. J. Mar. Sci. Eng. 2023, 11, 1722. [Google Scholar] [CrossRef] [Scilit]
- Purba, J.H.; Sony Tjahyani, D.T.; Ekariansyah, A.S.; Tjahjono, H. Fuzzy Probability Based Fault Tree Analysis to Propagate and Quantify Epistemic Uncertainty. Ann. Nucl. Energy 2015, 85, 1189–1199. [Google Scholar] [CrossRef] [Scilit]
- Ferdous, R.; Khan, F.; Veitch, B.; Amyotte, P.R. Methodology for Computer Aided Fuzzy Fault Tree Analysis. Process Saf. Environ. Prot. 2009, 87, 217–226. [Google Scholar] [CrossRef] [Scilit]
- Husain, S.; Ashfaq, H.; Asjad, M.; Kumari, P.; Kumar, R. Reliability Analysis of a PCM–Liquid Hybrid Battery Thermal Management System for Electric Vehicles. World Electr. Veh. J. 2026, 17, 348. [Google Scholar] [CrossRef] [Scilit]
- He, L.P.; Huang, H.Z.; Zuo, M.J. Fault Tree Analysis Based on Fuzzy Logic. In Proceedings of the 2007 Annual Reliability and Maintainability Symposium; IEEE: New York, NY, USA, 2007; pp. 77–82. [Google Scholar] [CrossRef] [Scilit]
- Duan, R.; Fan, J. Reliability Evaluation of Data Communication System Based on Dynamic Fault Tree under Epistemic Uncertainty. Math. Probl. Eng. 2014, 2014, 674804. [Google Scholar] [CrossRef] [Scilit]
- Kumar, M.; Kaushik, M. System Failure Probability Evaluation Using Fault Tree Analysis and Expert Opinions in Intuitionistic Fuzzy Environment. J. Loss Prev. Process Ind. 2020, 67, 104236. [Google Scholar] [CrossRef] [Scilit]
- Gmytrasiewicz, P.; Hassberger, J.A.; Lee, J.C. Fault Tree Based Diagnostics Using Fuzzy Logic. IEEE Trans. Pattern Anal. Mach. Intell. 1990, 12, 1115–1119. [Google Scholar] [CrossRef] [Scilit]
- Markowski, A.S.; Mannan, M.S. Fuzzy Risk Matrix. J. Hazard. Mater. 2008, 159, 152–157. [Google Scholar] [CrossRef] [Scilit] [PubMed]
- Wolkenhauer, O. Fuzzy Mathematics. In Data Engineering: Fuzzy Mathematics in Systems Theory and Data Analysis; John Wiley & Sons, Inc.: Hoboken, NJ, USA, 2001; pp. 197–212. [Google Scholar] [CrossRef] [Scilit]
- Ferdous, R.; Khan, F.; Sadiq, R.; Amyotte, P.; Veitch, B. Fault and Event Tree Analyses for Process Systems Risk Analysis: Uncertainty Handling Formulations. Risk Anal. 2011, 31, 86–107. [Google Scholar] [CrossRef] [Scilit] [PubMed]
- Purba, J.H. Fuzzy Probability on Reliability Study of Nuclear Power Plant Probabilistic Safety Assessment: A Review. Prog. Nucl. Energy 2014, 76, 73–80. [Google Scholar] [CrossRef] [Scilit]
- Wang, L.-X. A Course in Fuzzy Systems and Control; Prentice-Hall, Inc.: Hoboken, NJ, USA, 1996. [Google Scholar]
- Wei, C.P.; Qiu, W.H.; Wang, X.Z. A New Approach of Group Decision Making under Fuzzy Preference. Syst. Eng. Theory Pract. 2001, 7, 81–86. [Google Scholar]
- Bryson, N.; Mobolurin, A. An Approach to Using the Analytic Hierarchy Process for Solving Multiple Criteria Decision Making Problems. Eur. J. Oper. Res. 1994, 76, 440–454. [Google Scholar] [CrossRef] [Scilit]
- Ross, T.J. Fuzzy Logic with Engineering Applications; John Wiley & Sons, Inc.: Hoboken, NJ, USA, 2005. [Google Scholar]
- Miri, L.M.R.; Wang, J.; Yang, Z.; Finlay, J. Application of Fuzzy Fault Tree Analysis on Oil and Gas Offshore Pipelines. Int. J. Mar. Sci. Eng. 2011, 1, 29–42. [Google Scholar]
- Onisawa, T. An Approach to Human Reliability in Man-Machine Systems Using Error Possibility. Fuzzy Sets Syst. 1988, 27, 87–103. [Google Scholar] [CrossRef] [Scilit]
- Lavasani, S.M.; Zendegani, A.; Celik, M. An Extension to Fuzzy Fault Tree Analysis (FFTA) Application in Petrochemical Process Industry. Process Saf. Environ. Prot. 2015, 93, 75–88. [Google Scholar] [CrossRef] [Scilit]
- Wang, Y.H. Safety System Engineering; Press of Tianjin University: Tianjin, China, 1999. [Google Scholar]
- Modarres, M. Risk Analysis in Engineering: Techniques, Tools, and Trends; CRC Press: Boca Raton, FL, USA, 2006. [Google Scholar]
- ISO 31000:2018; Risk Management—Guidelines. International Standards Organization: Geneva, Switzerland, 2018.
- IEC 31010:2019; Risk Management—Risk Assessment Techniques. IEC: Geneva, Switzerland, 2019. Available online: https://www.iso.org/standard/72140.html (accessed on 1 November 2026).
- Vesely, A.M.L.I.; Daly, S.A. Fault Tree Handbook with Aerospace Applications; NASA Office of Safety and Mission Assurance: Washington, DC, USA, 2002.
- Wang, Z.; Li, X.; Zhang, G.; Lv, Y.; Wang, C.; He, F.; Yang, C.; Yang, C. Thermal Management Investigation for Lithium-Ion Battery Module with Different Phase Change Materials. RSC Adv. 2017, 7, 42909–42918. [Google Scholar] [CrossRef] [Scilit]
- Gu, Y.; Yang, A.; Böhle, M.; Zhao, W. Investigation of Hydrodynamic Lubricant Film Breakdown between the Journal and Bearing in a High-Speed Coolant Pump of Electric Vehicles. Eng. Fail. Anal. 2024, 160, 108218. [Google Scholar] [CrossRef] [Scilit]
- Dey, S.; Mohon, S.; Pisu, P.; Ayalew, B. Sensor Fault Detection, Isolation, and Estimation in Lithium-Ion Batteries. IEEE Trans. Control Syst. Technol. 2016, 24, 2141–2149. [Google Scholar] [CrossRef] [Scilit]
- Stathopoulos, N.; Belessiotis, G.; Oikonomou, P.; Papanicolaou, E. Experimental Investigation of Thermal Degradation of Phase Change Materials for Medium-Temperature Thermal Energy Storage and Tightness during Cycling inside Metal Spheres. J. Energy Storage 2020, 31, 101618. [Google Scholar] [CrossRef] [Scilit]
- Wang, S.; Yu, Q.; Ren, L.; Ren, W. Study on Contact Failure Mechanisms of Accelerated Life Test for Relay Reliability. IEICE Trans. Electron. 2009, E92.C, 1034–1039. [Google Scholar] [CrossRef] [Scilit]
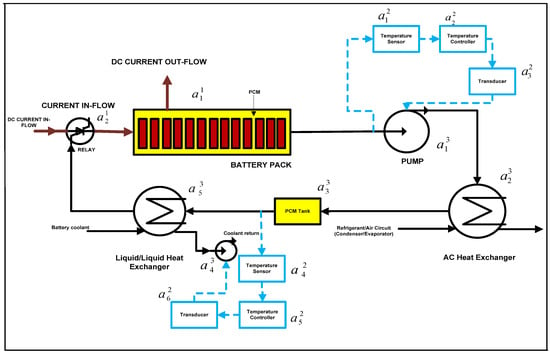
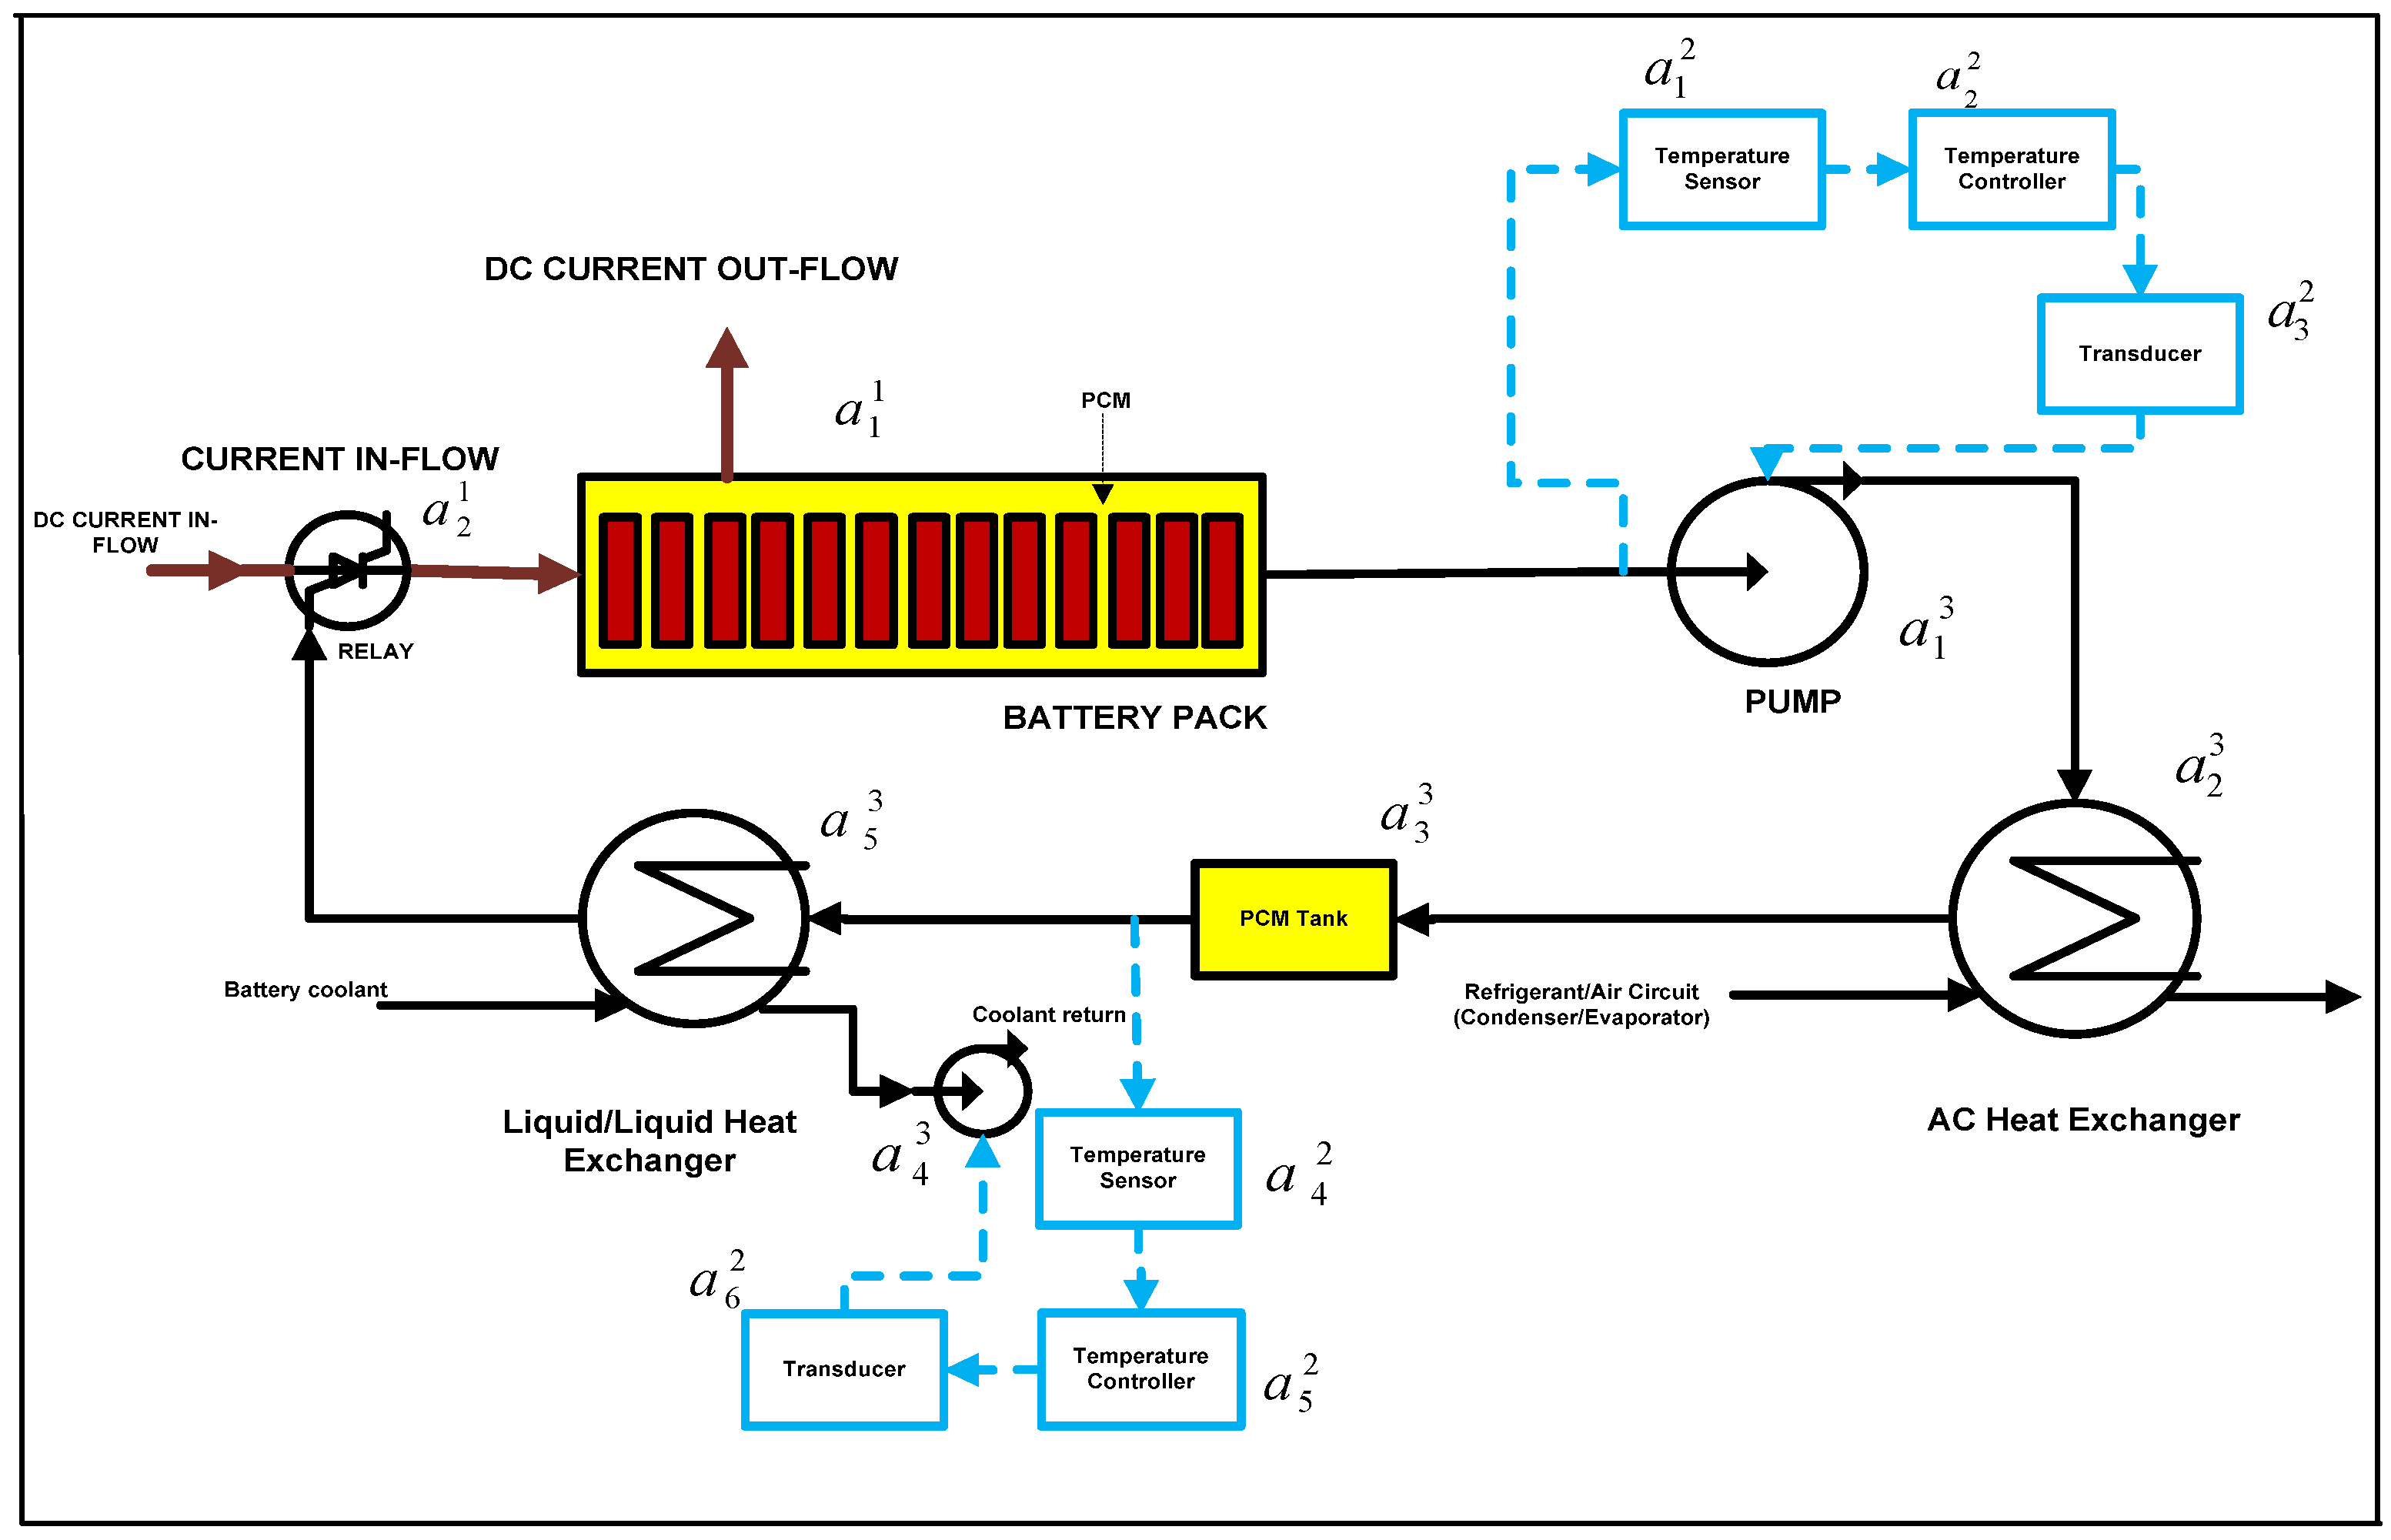
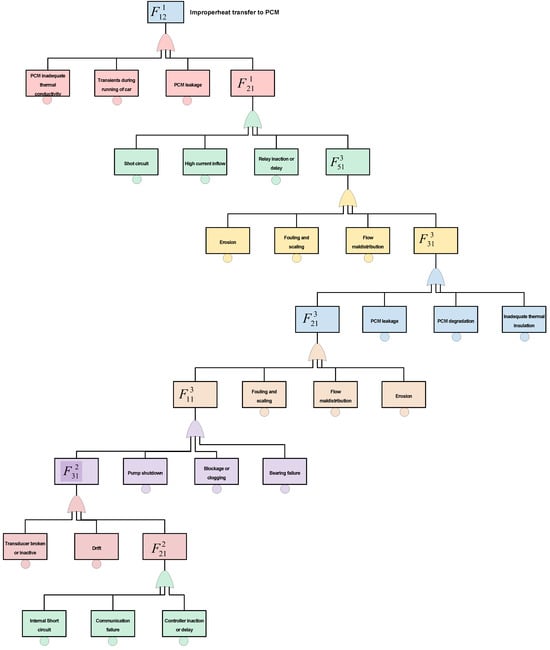
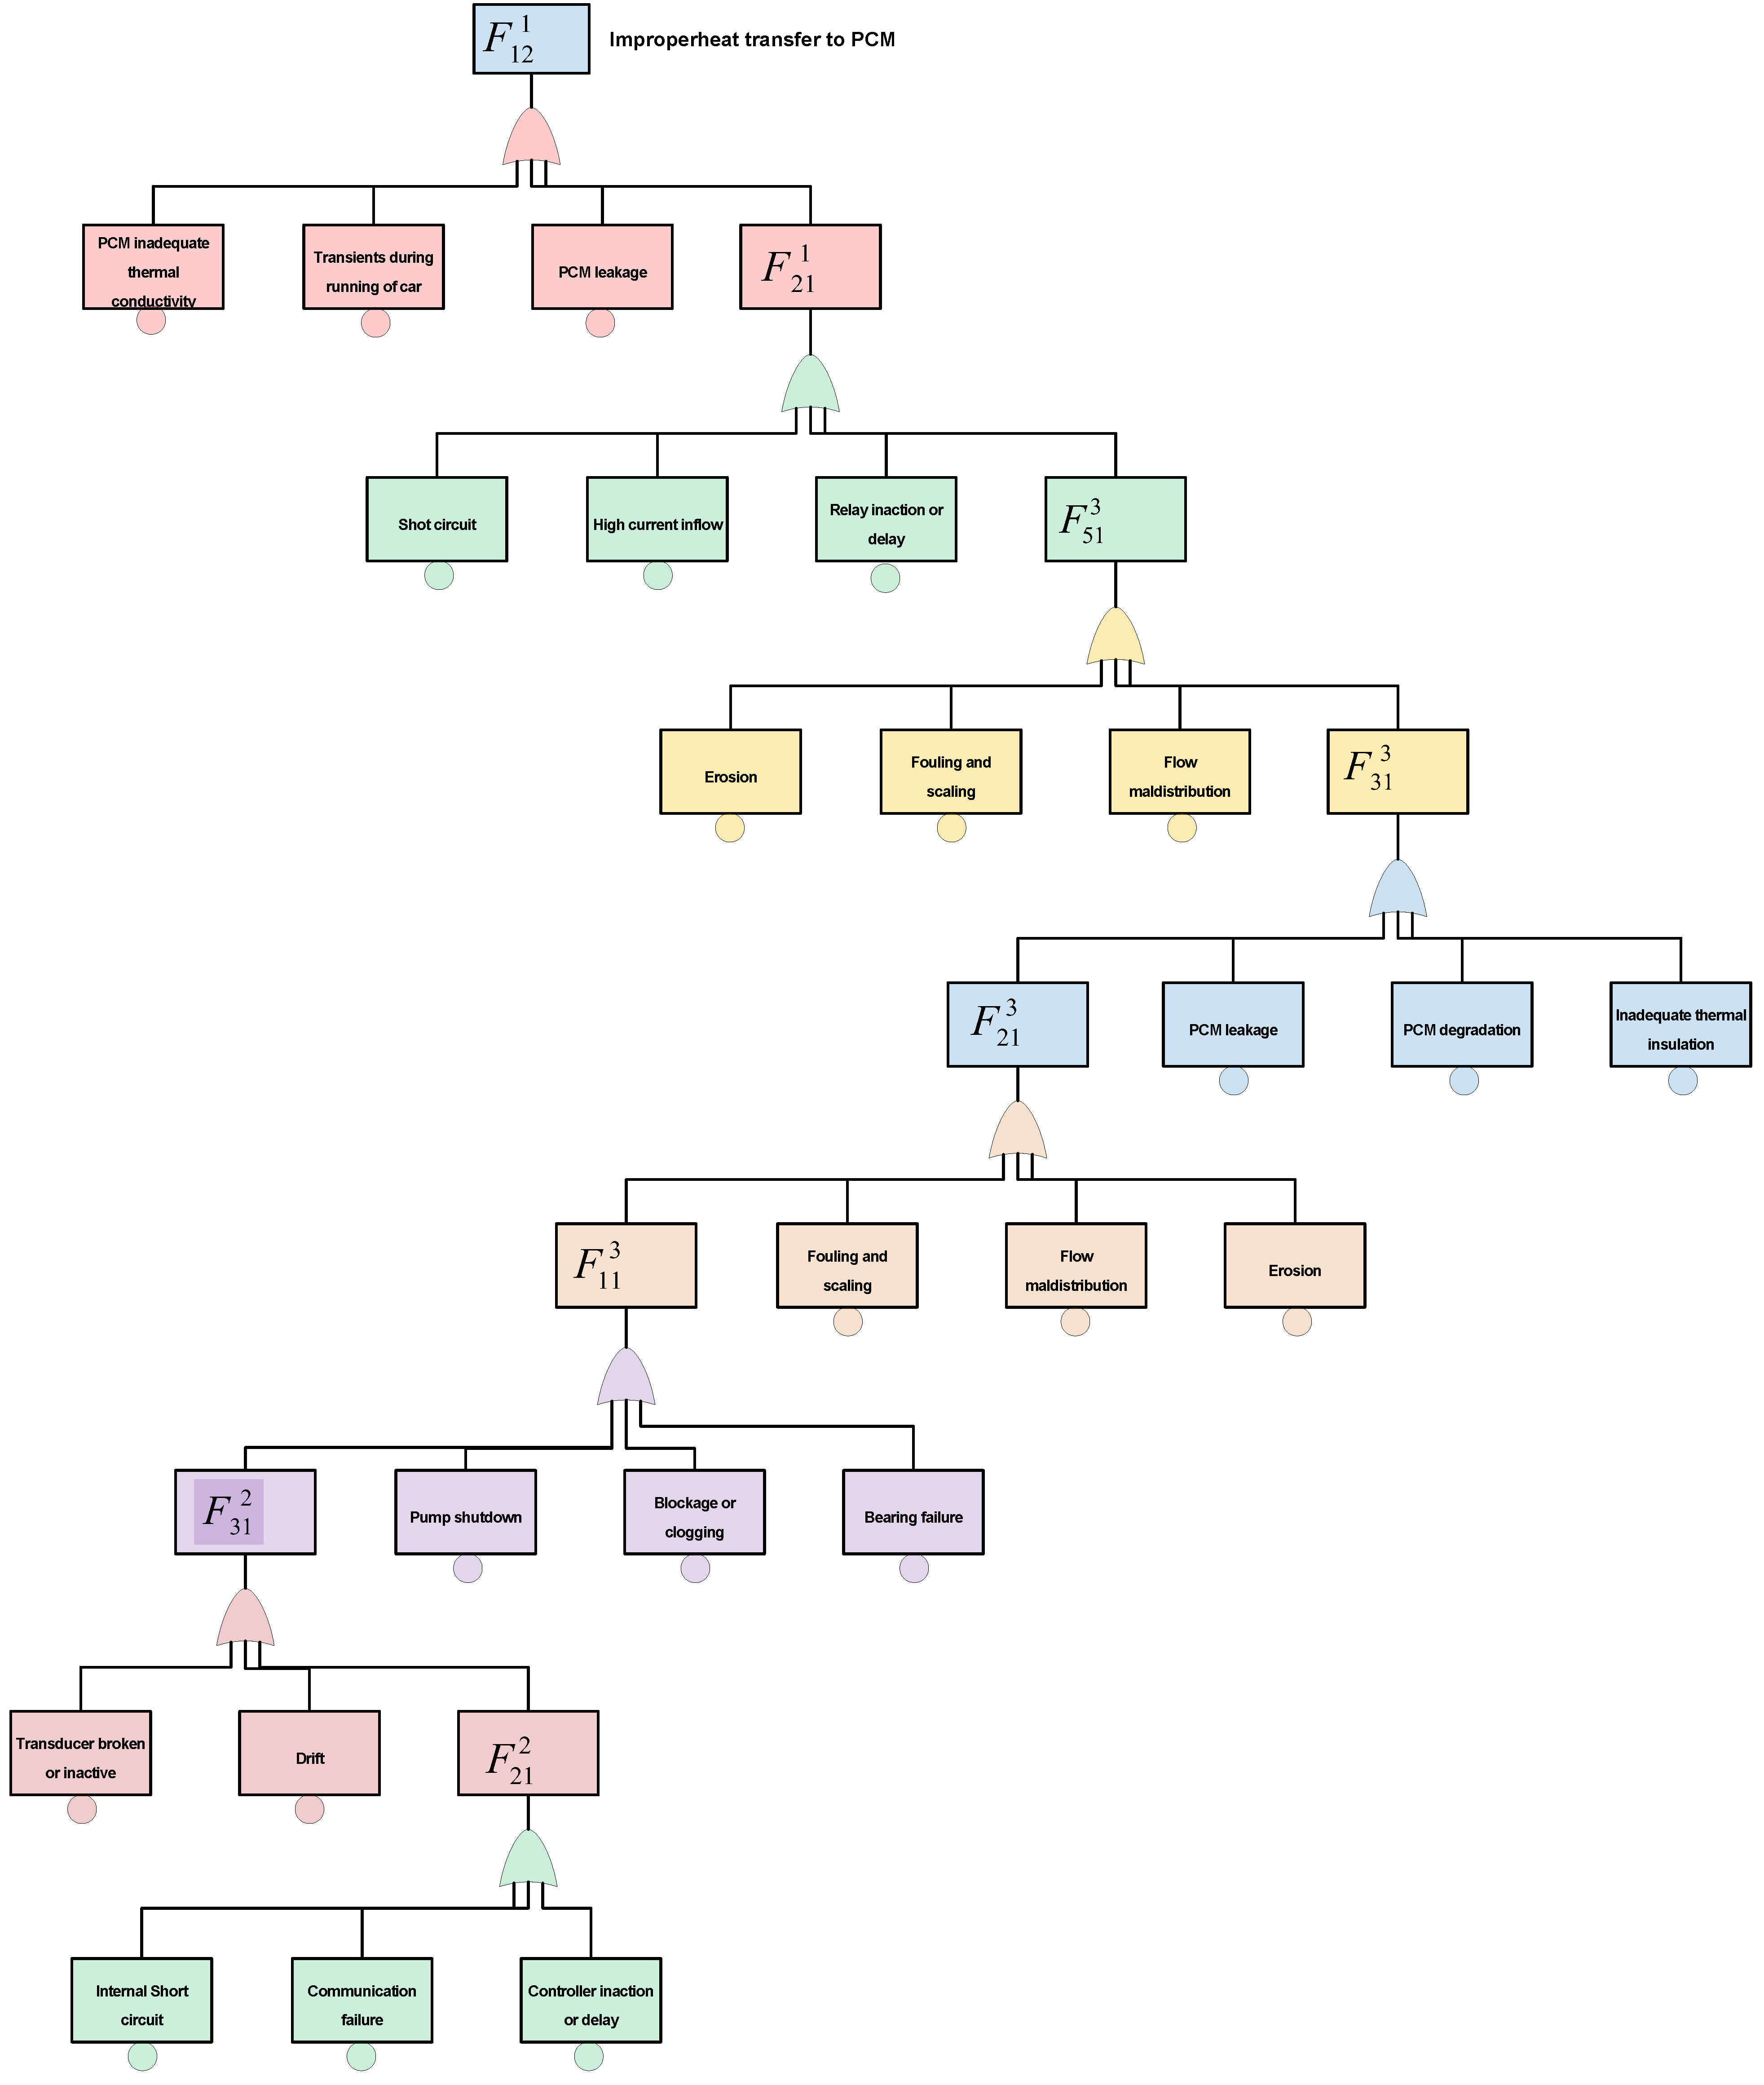
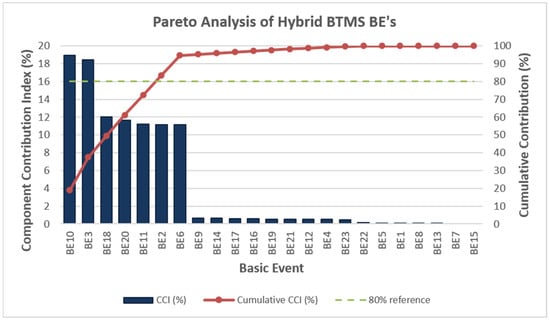
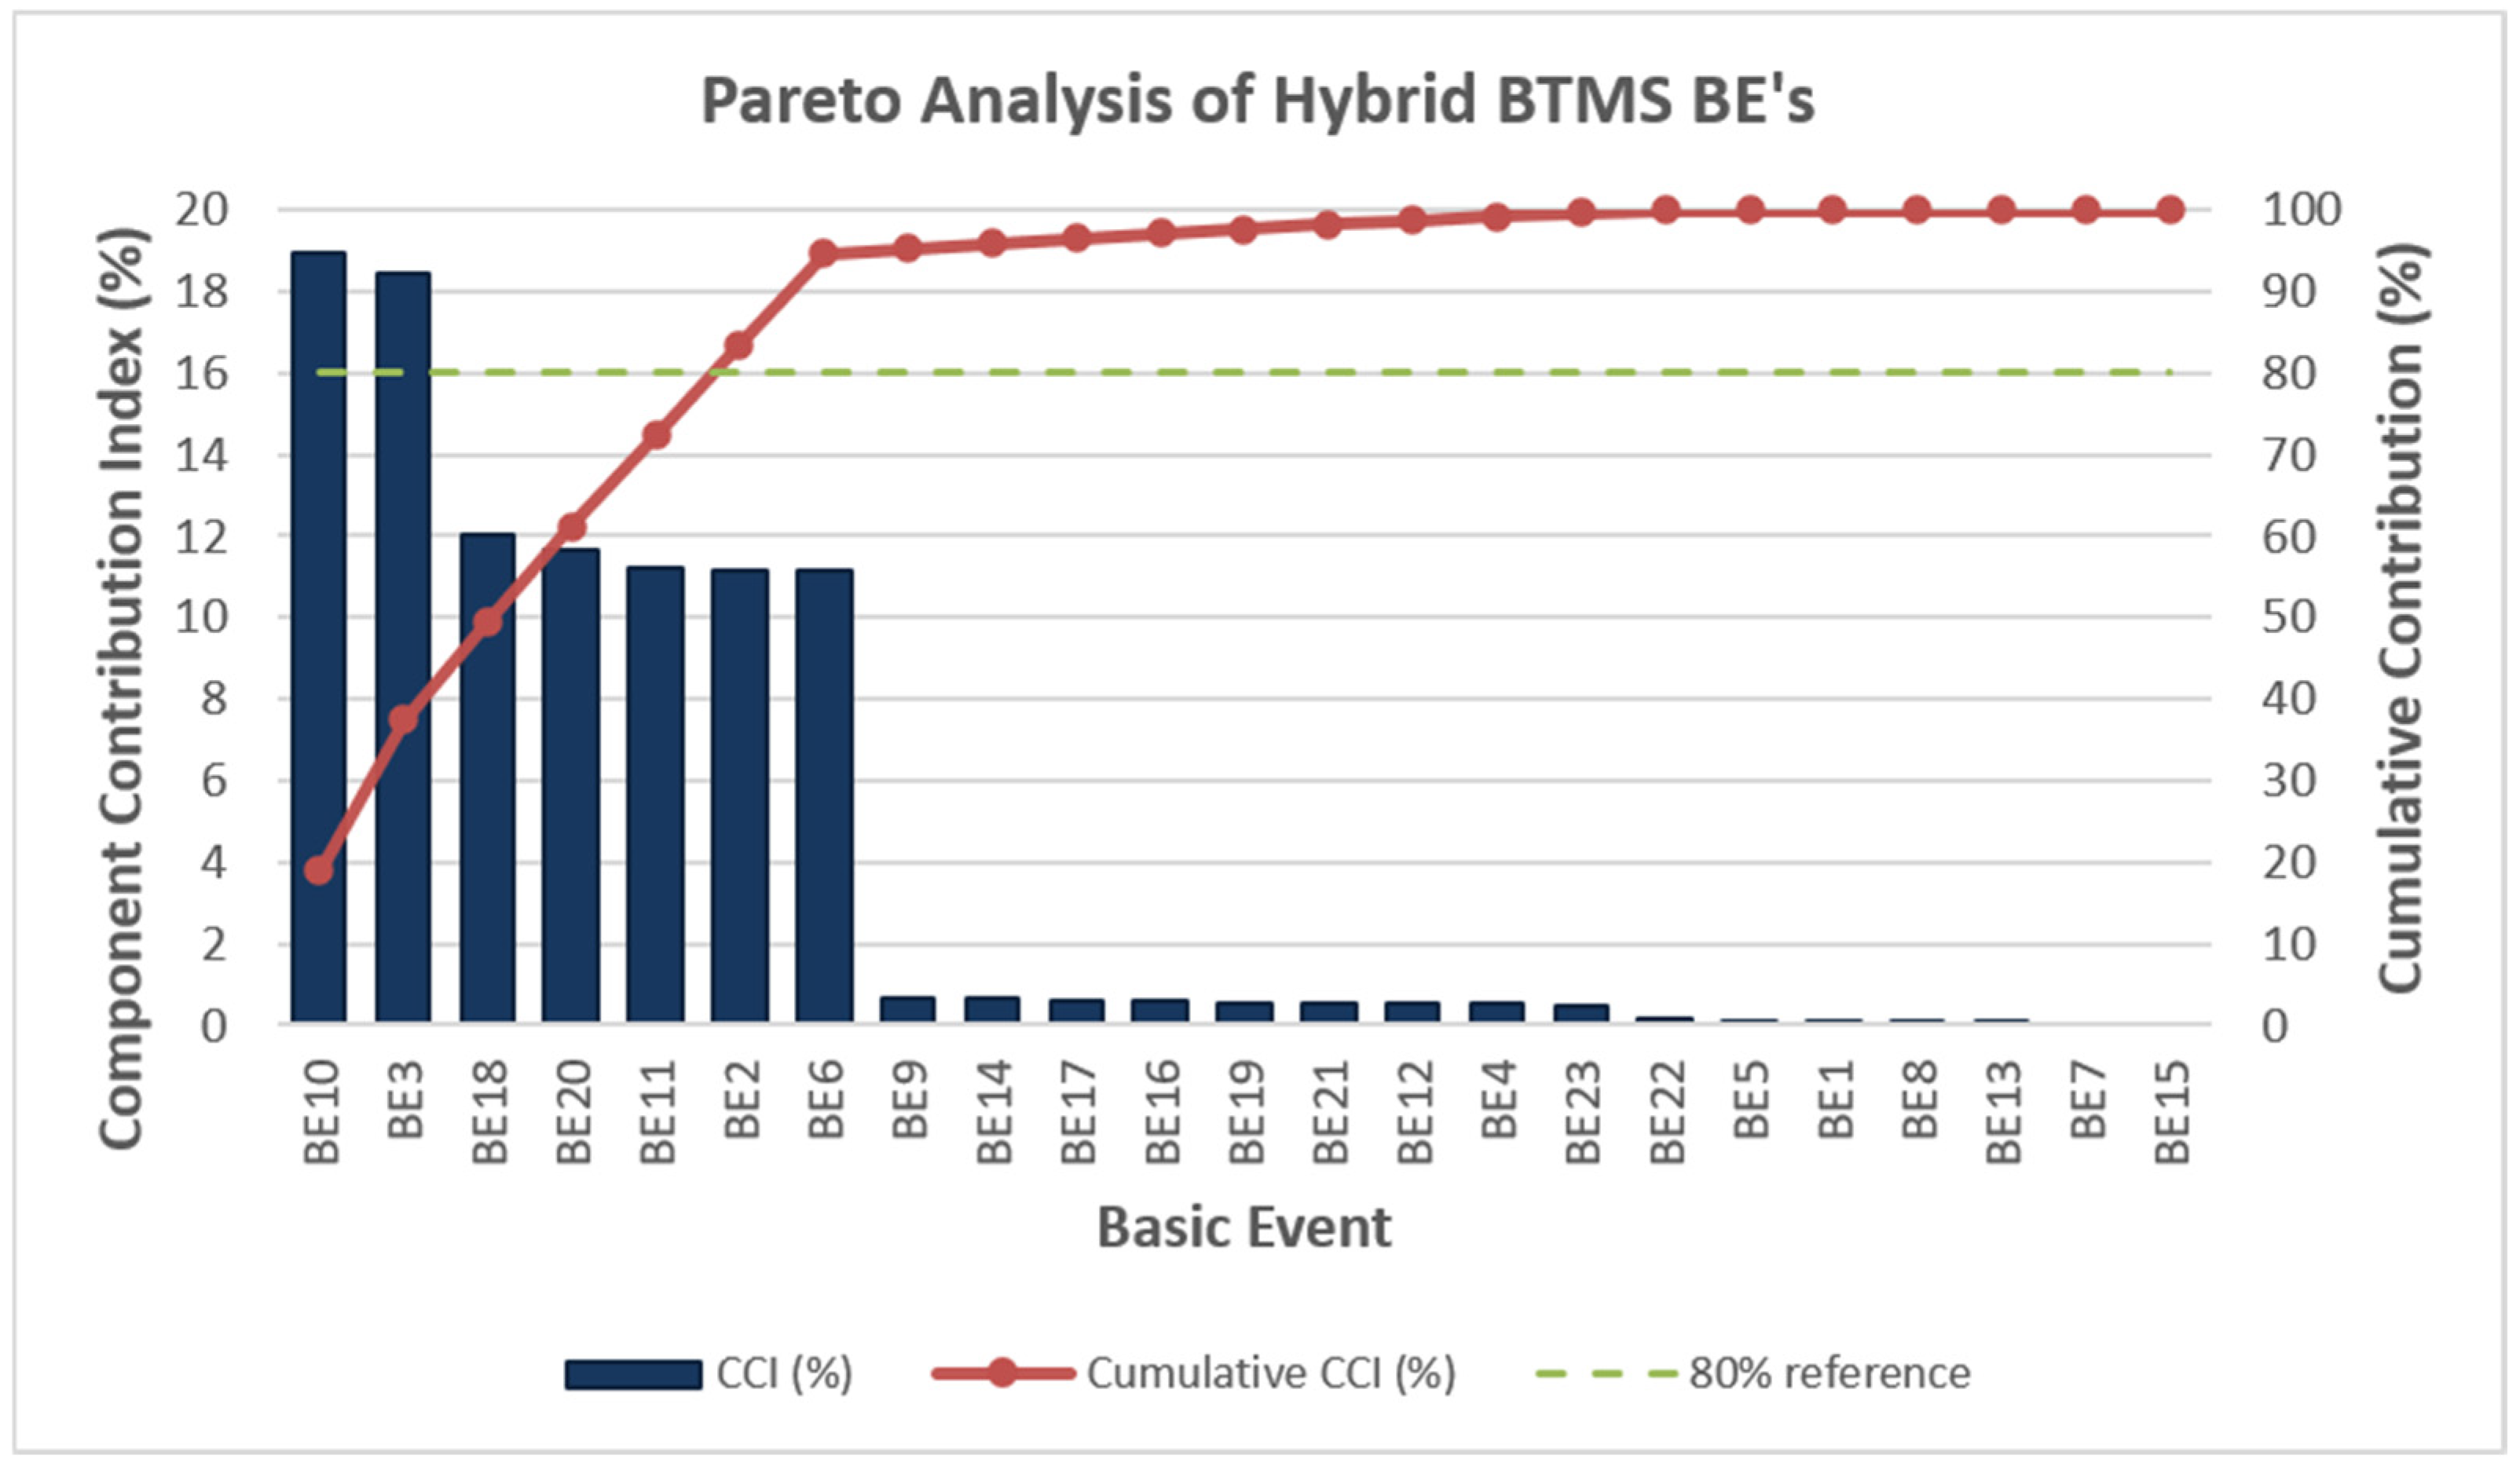
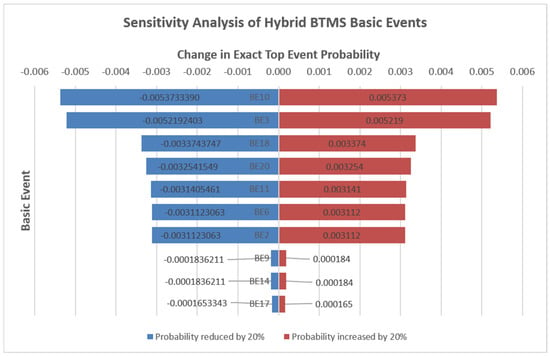
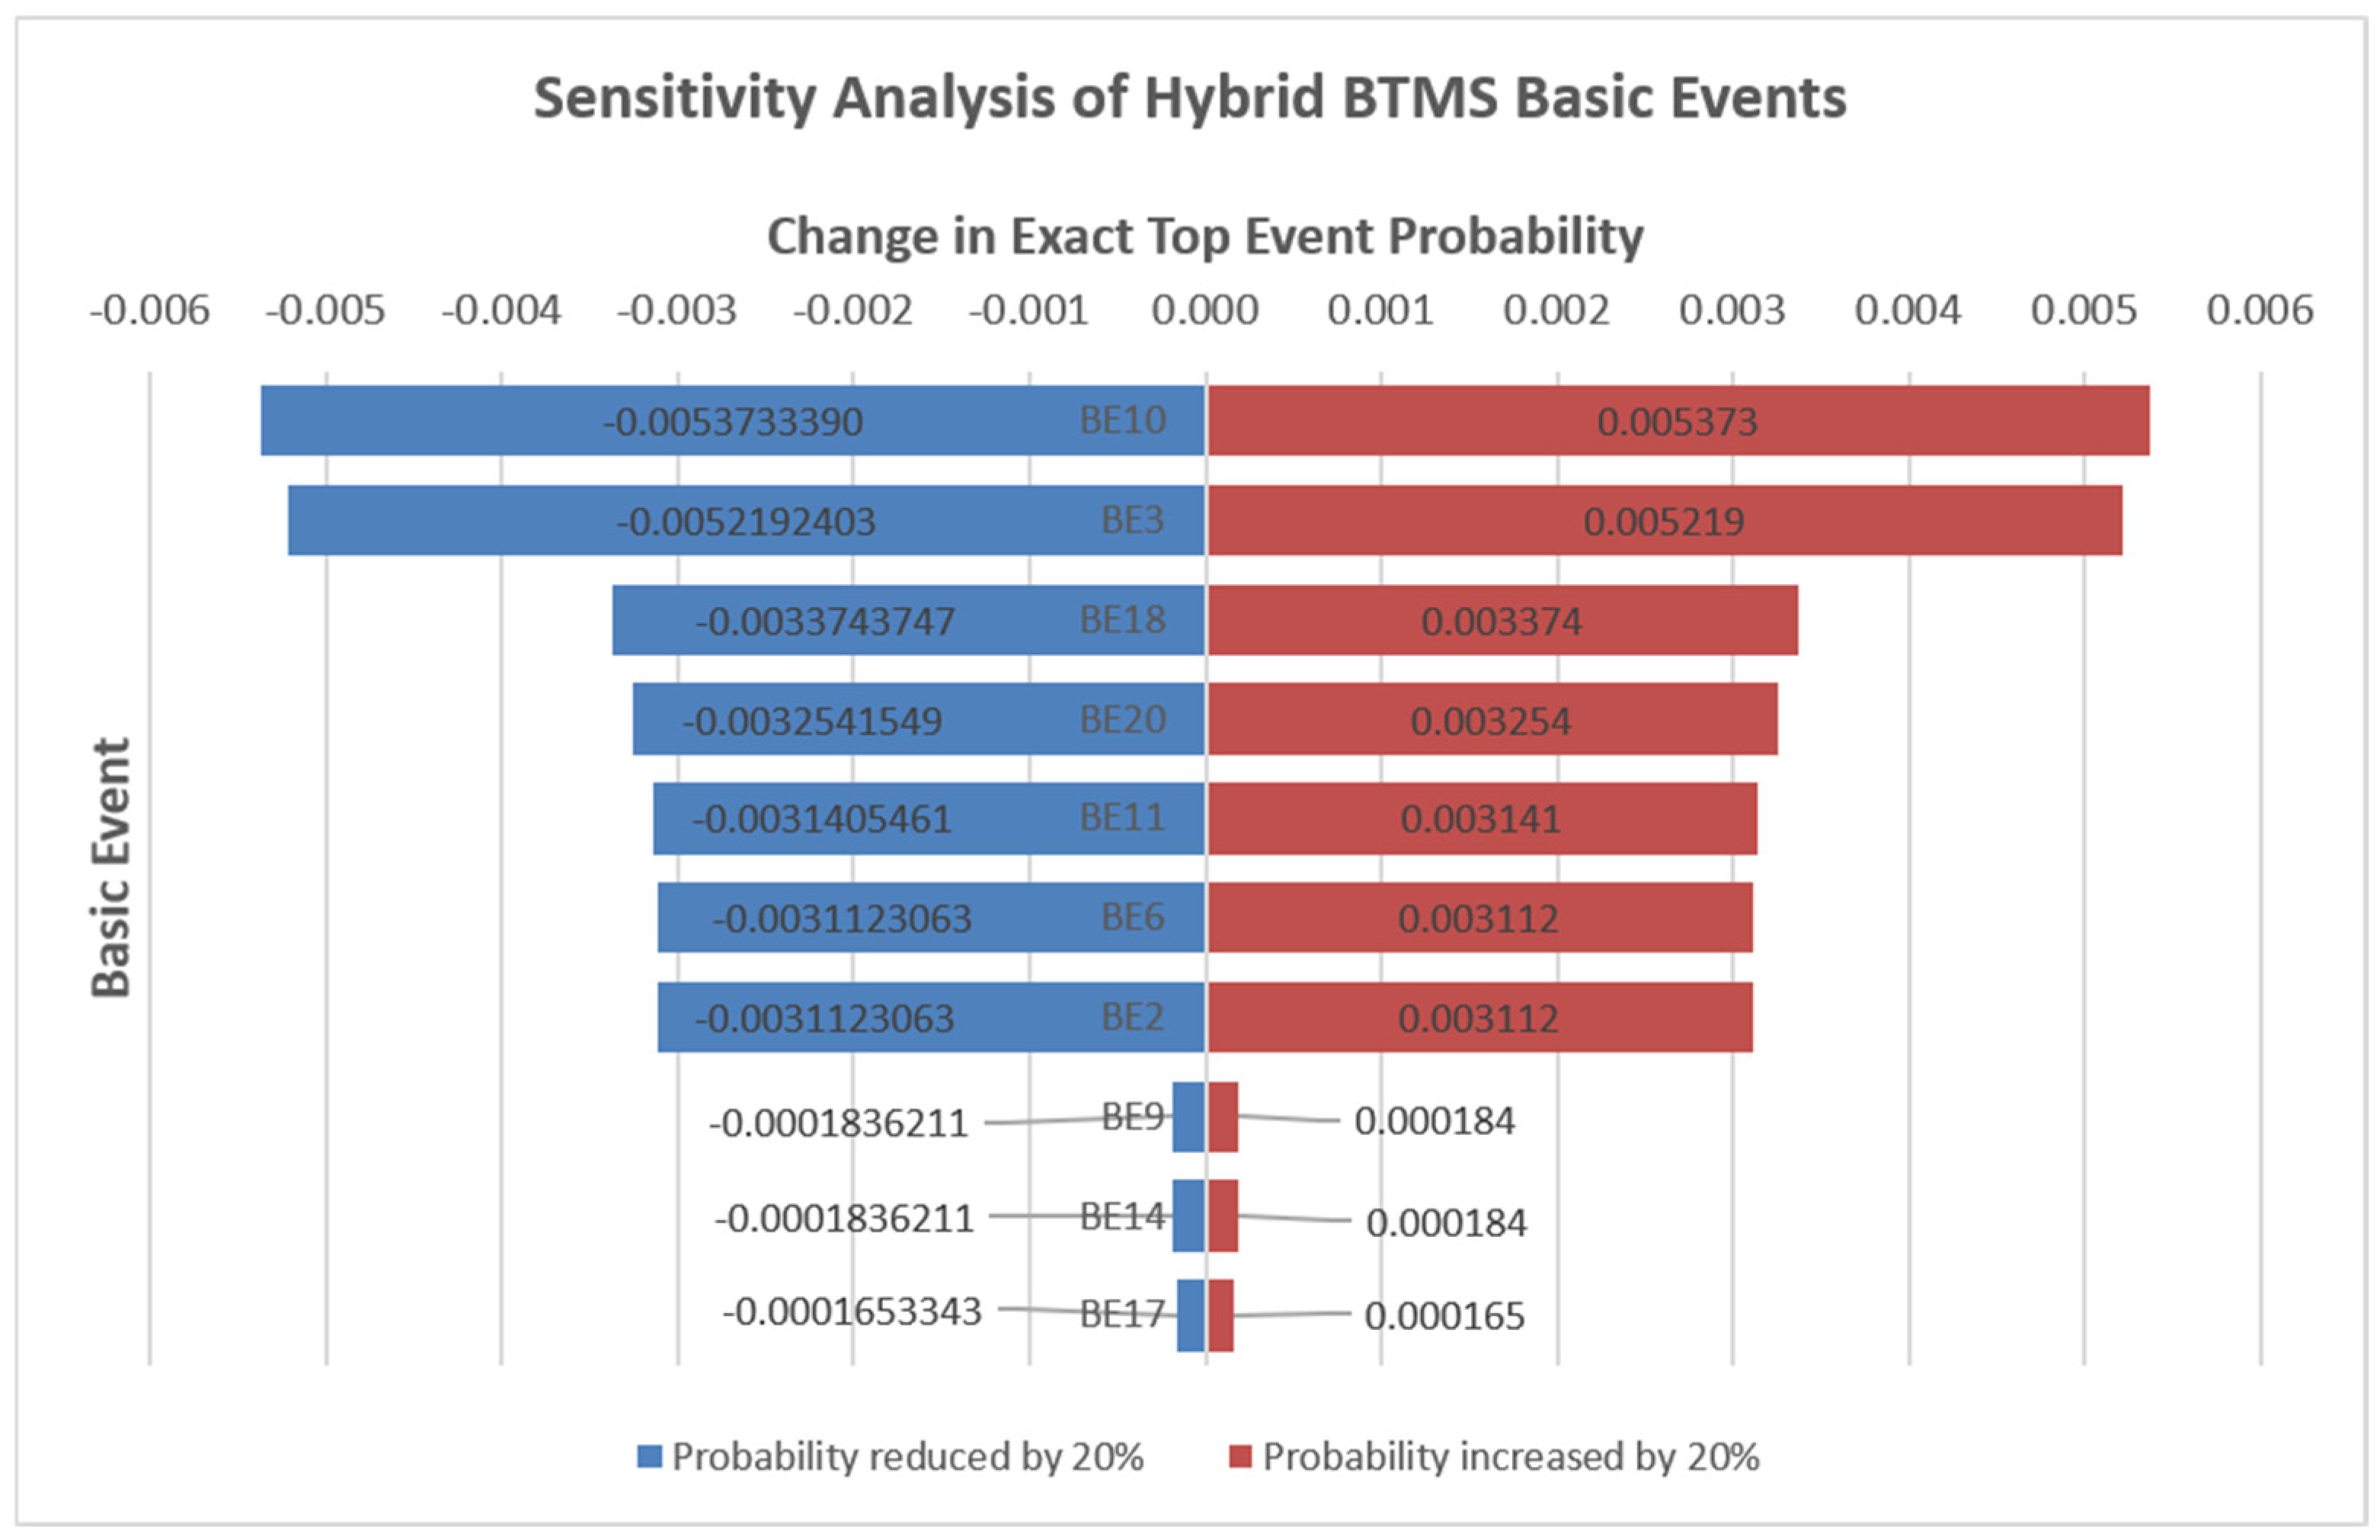
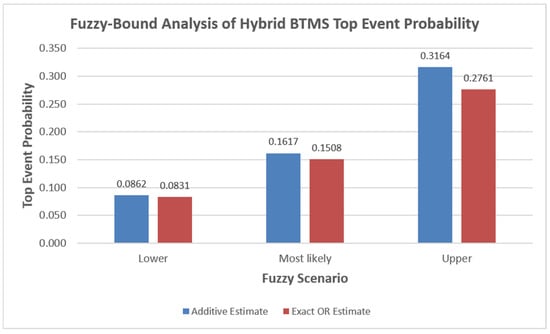
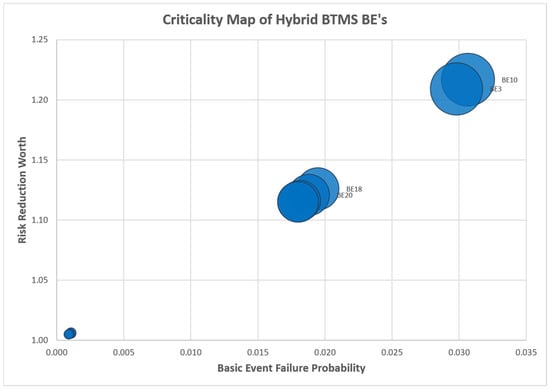
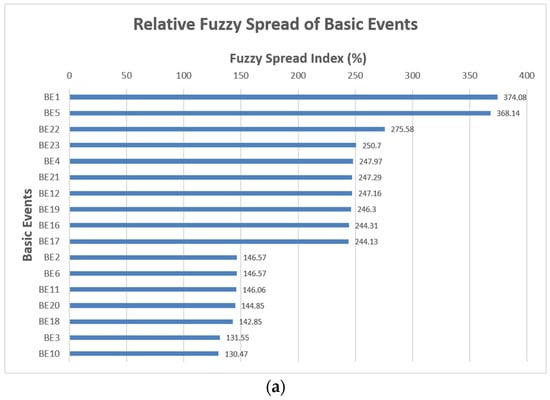
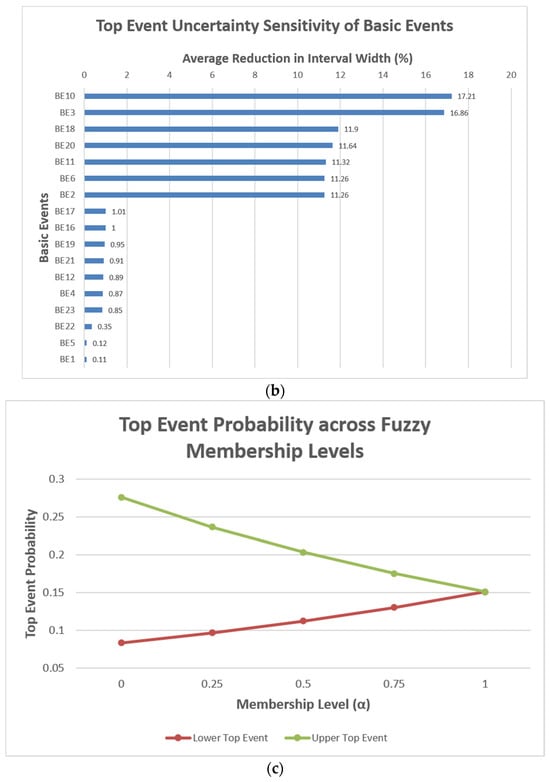
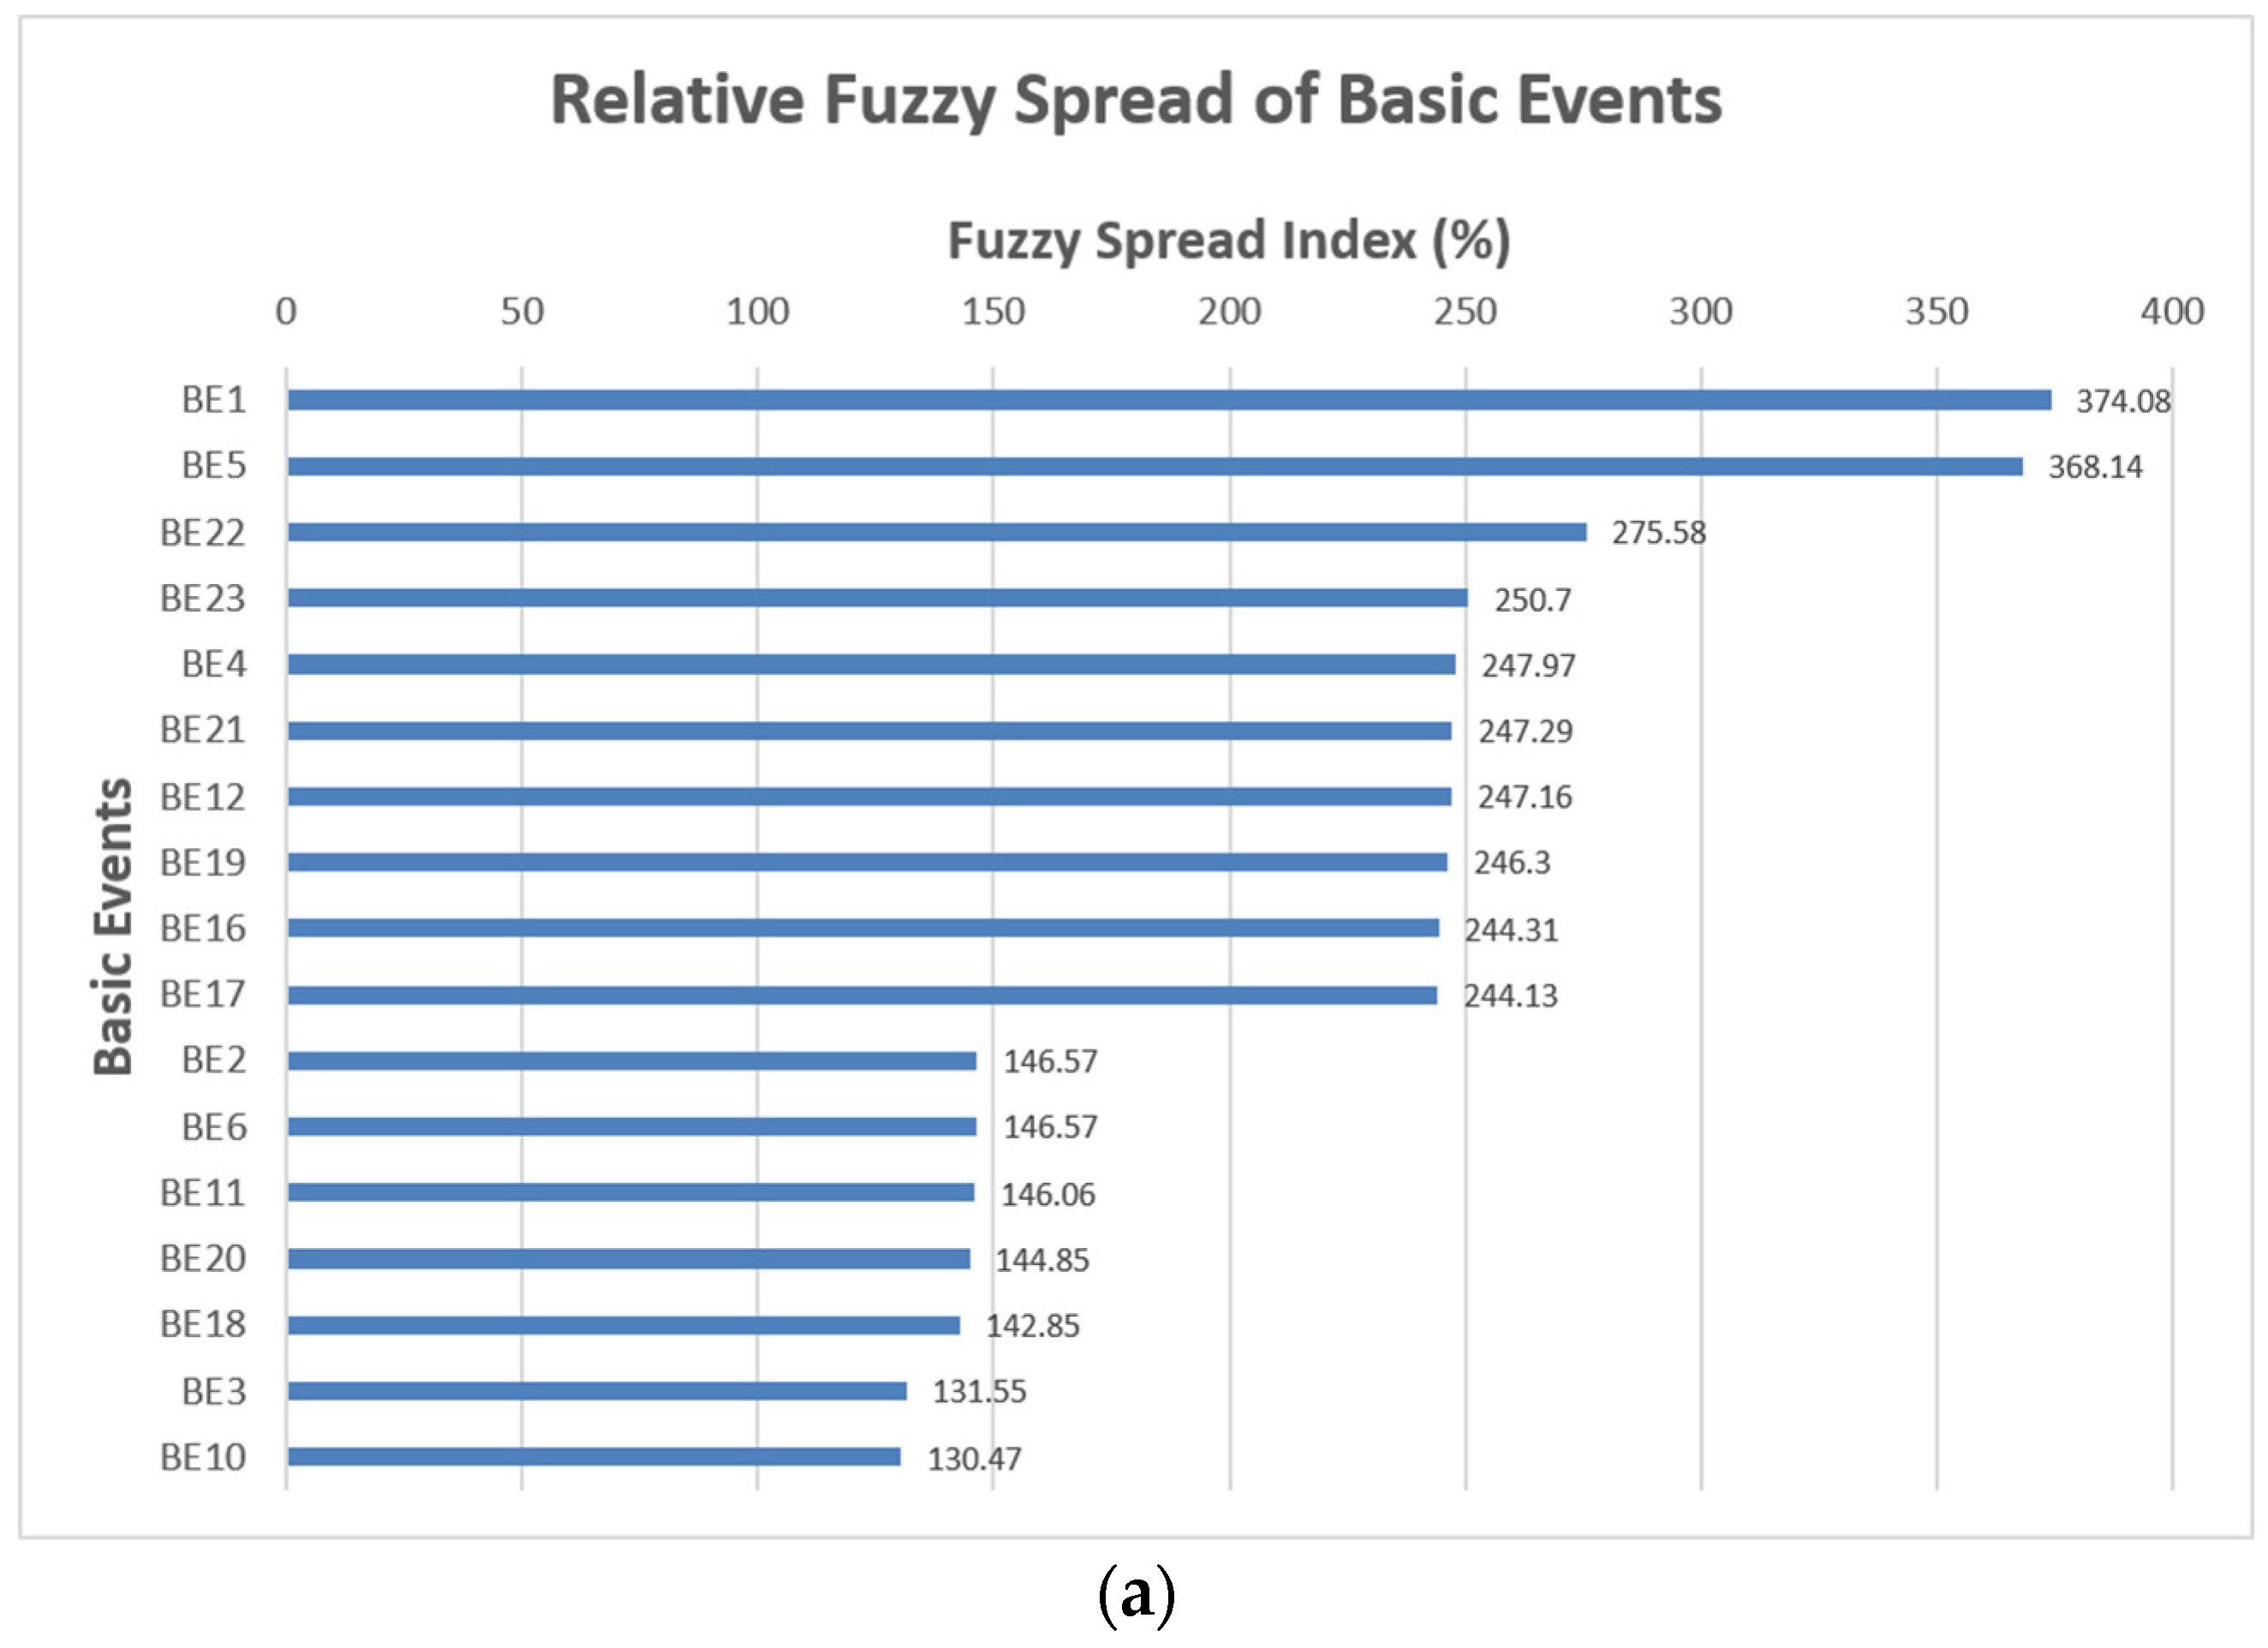
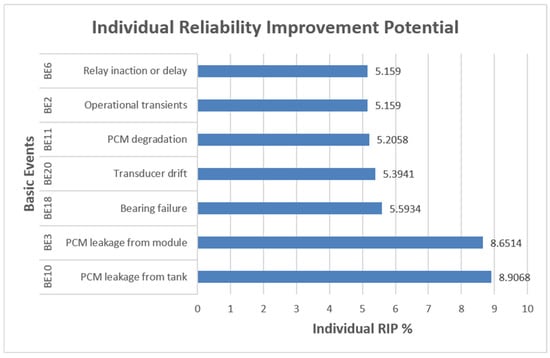
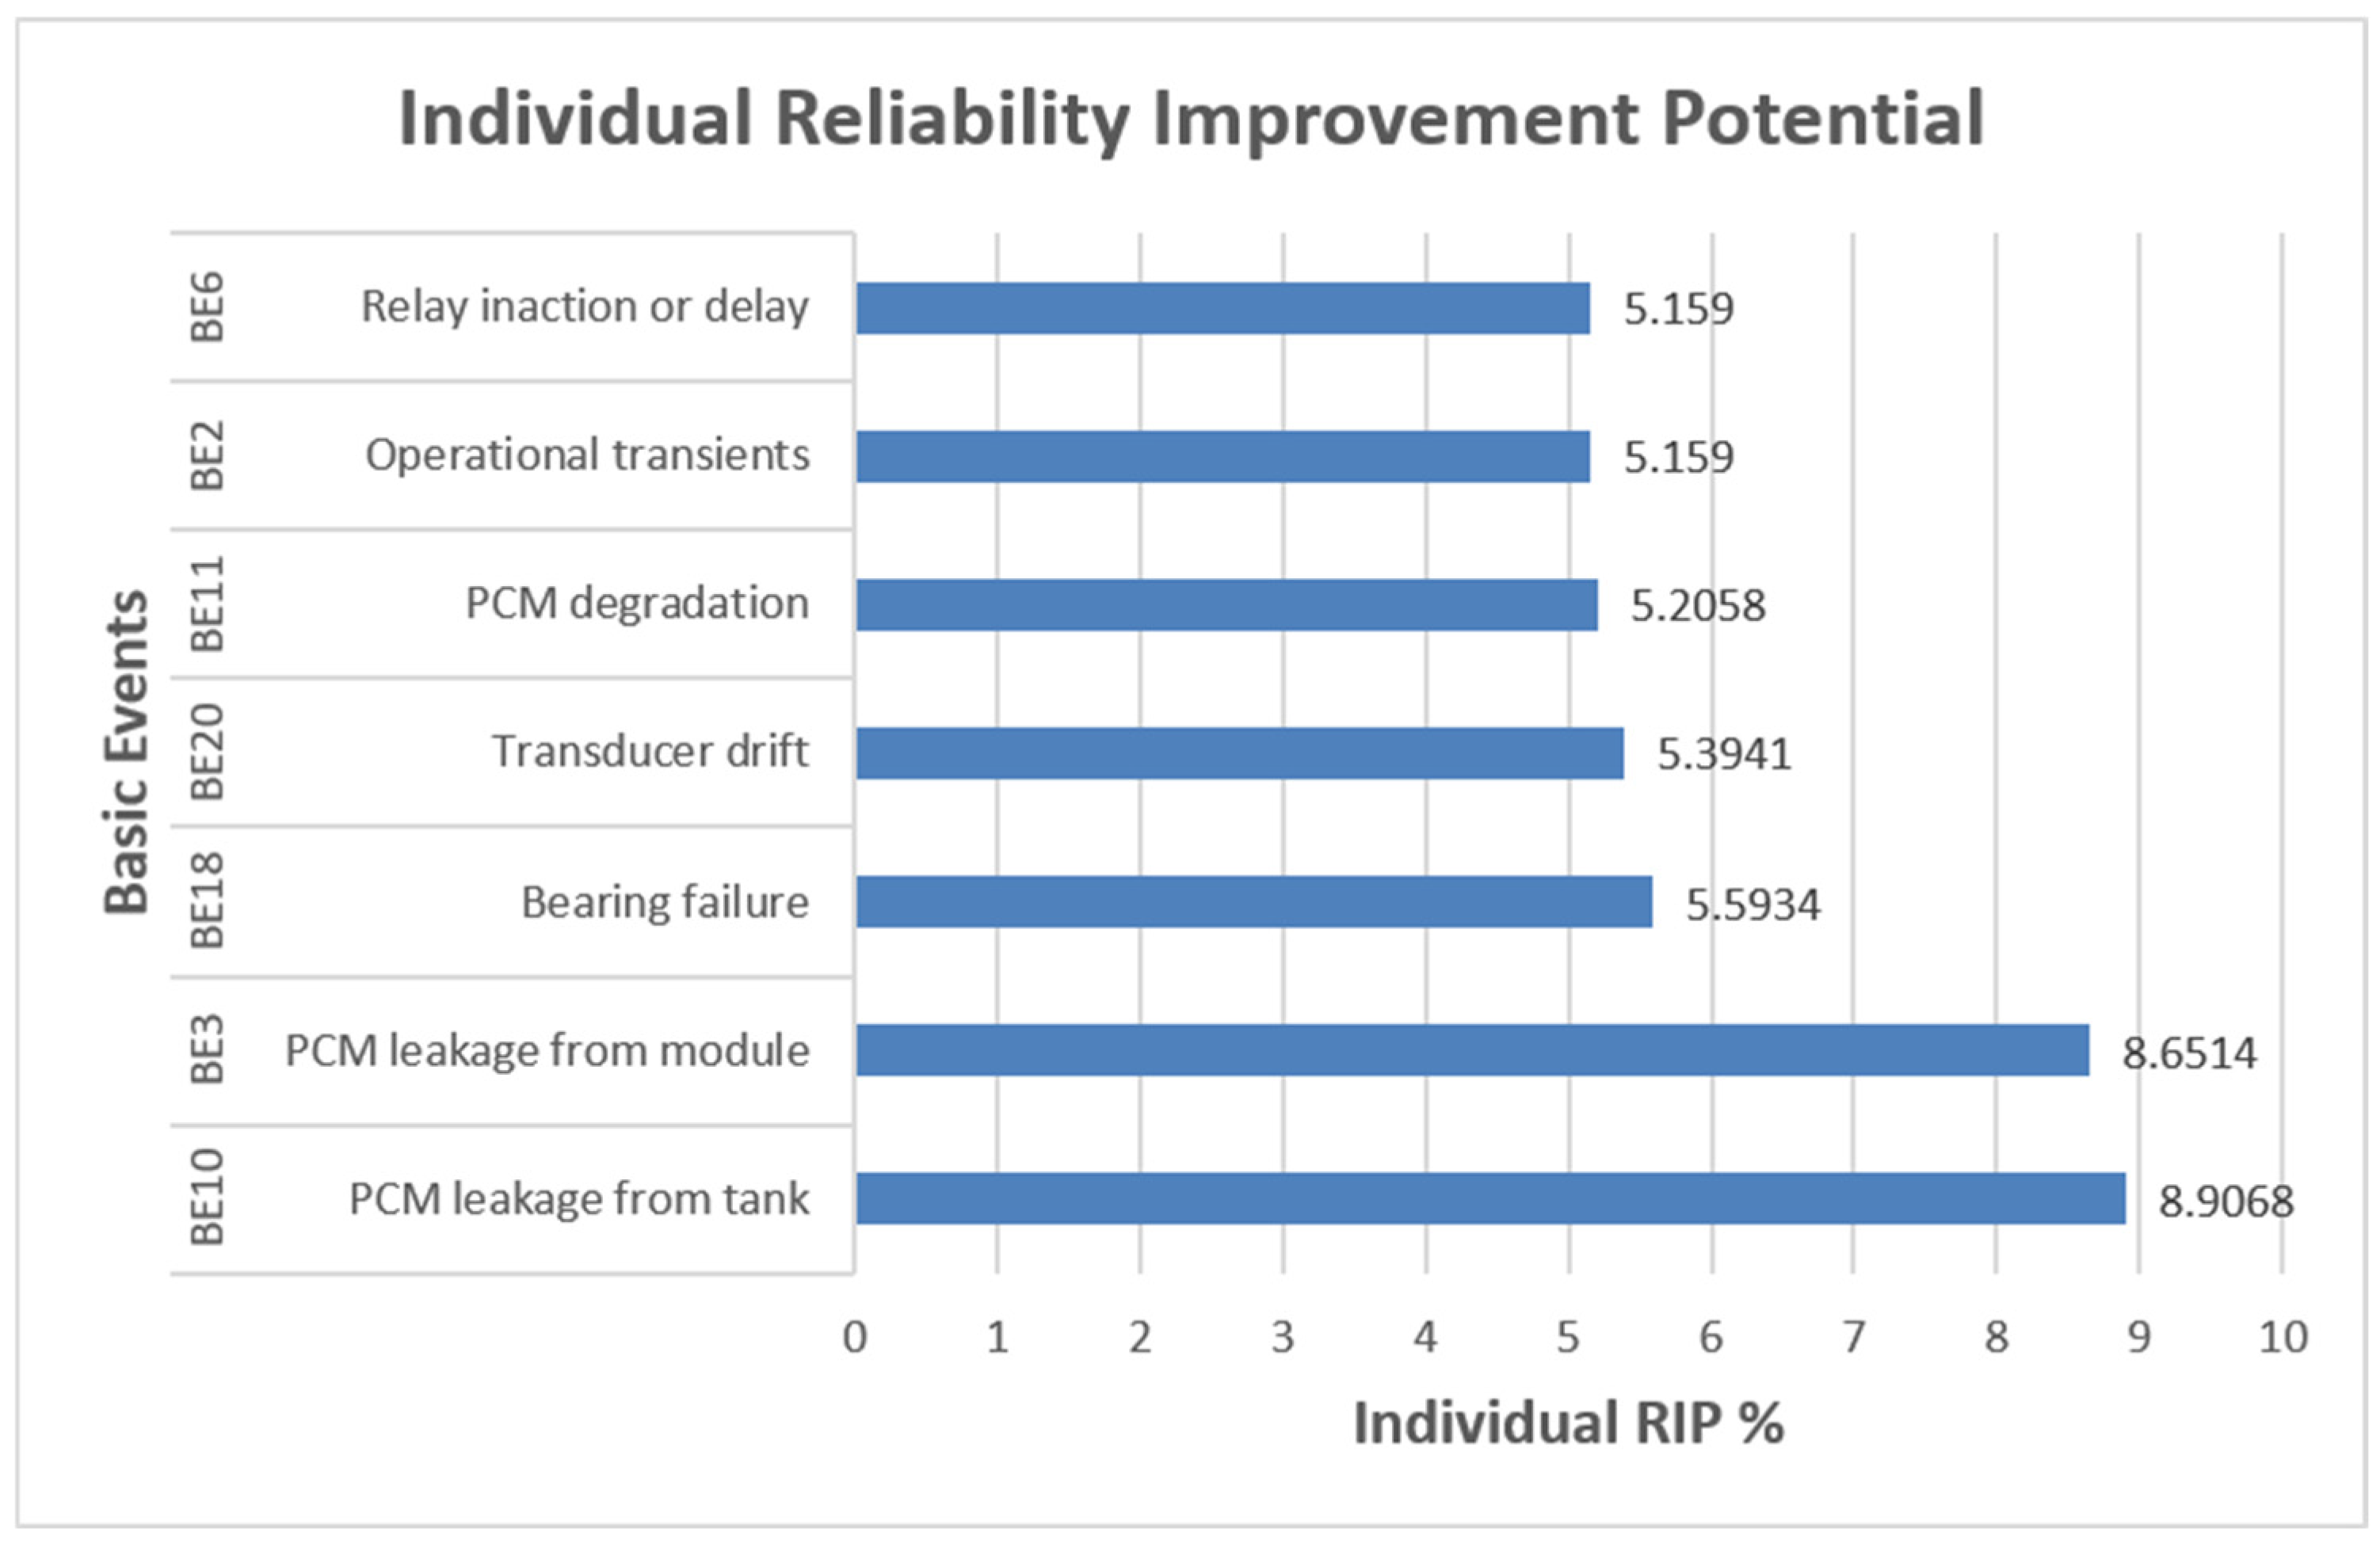
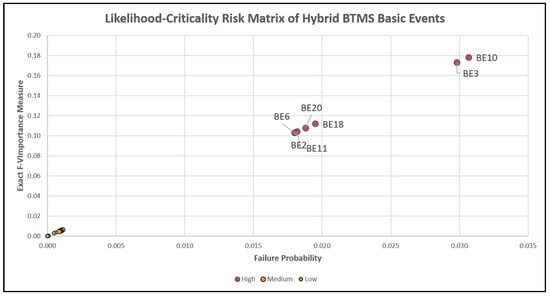
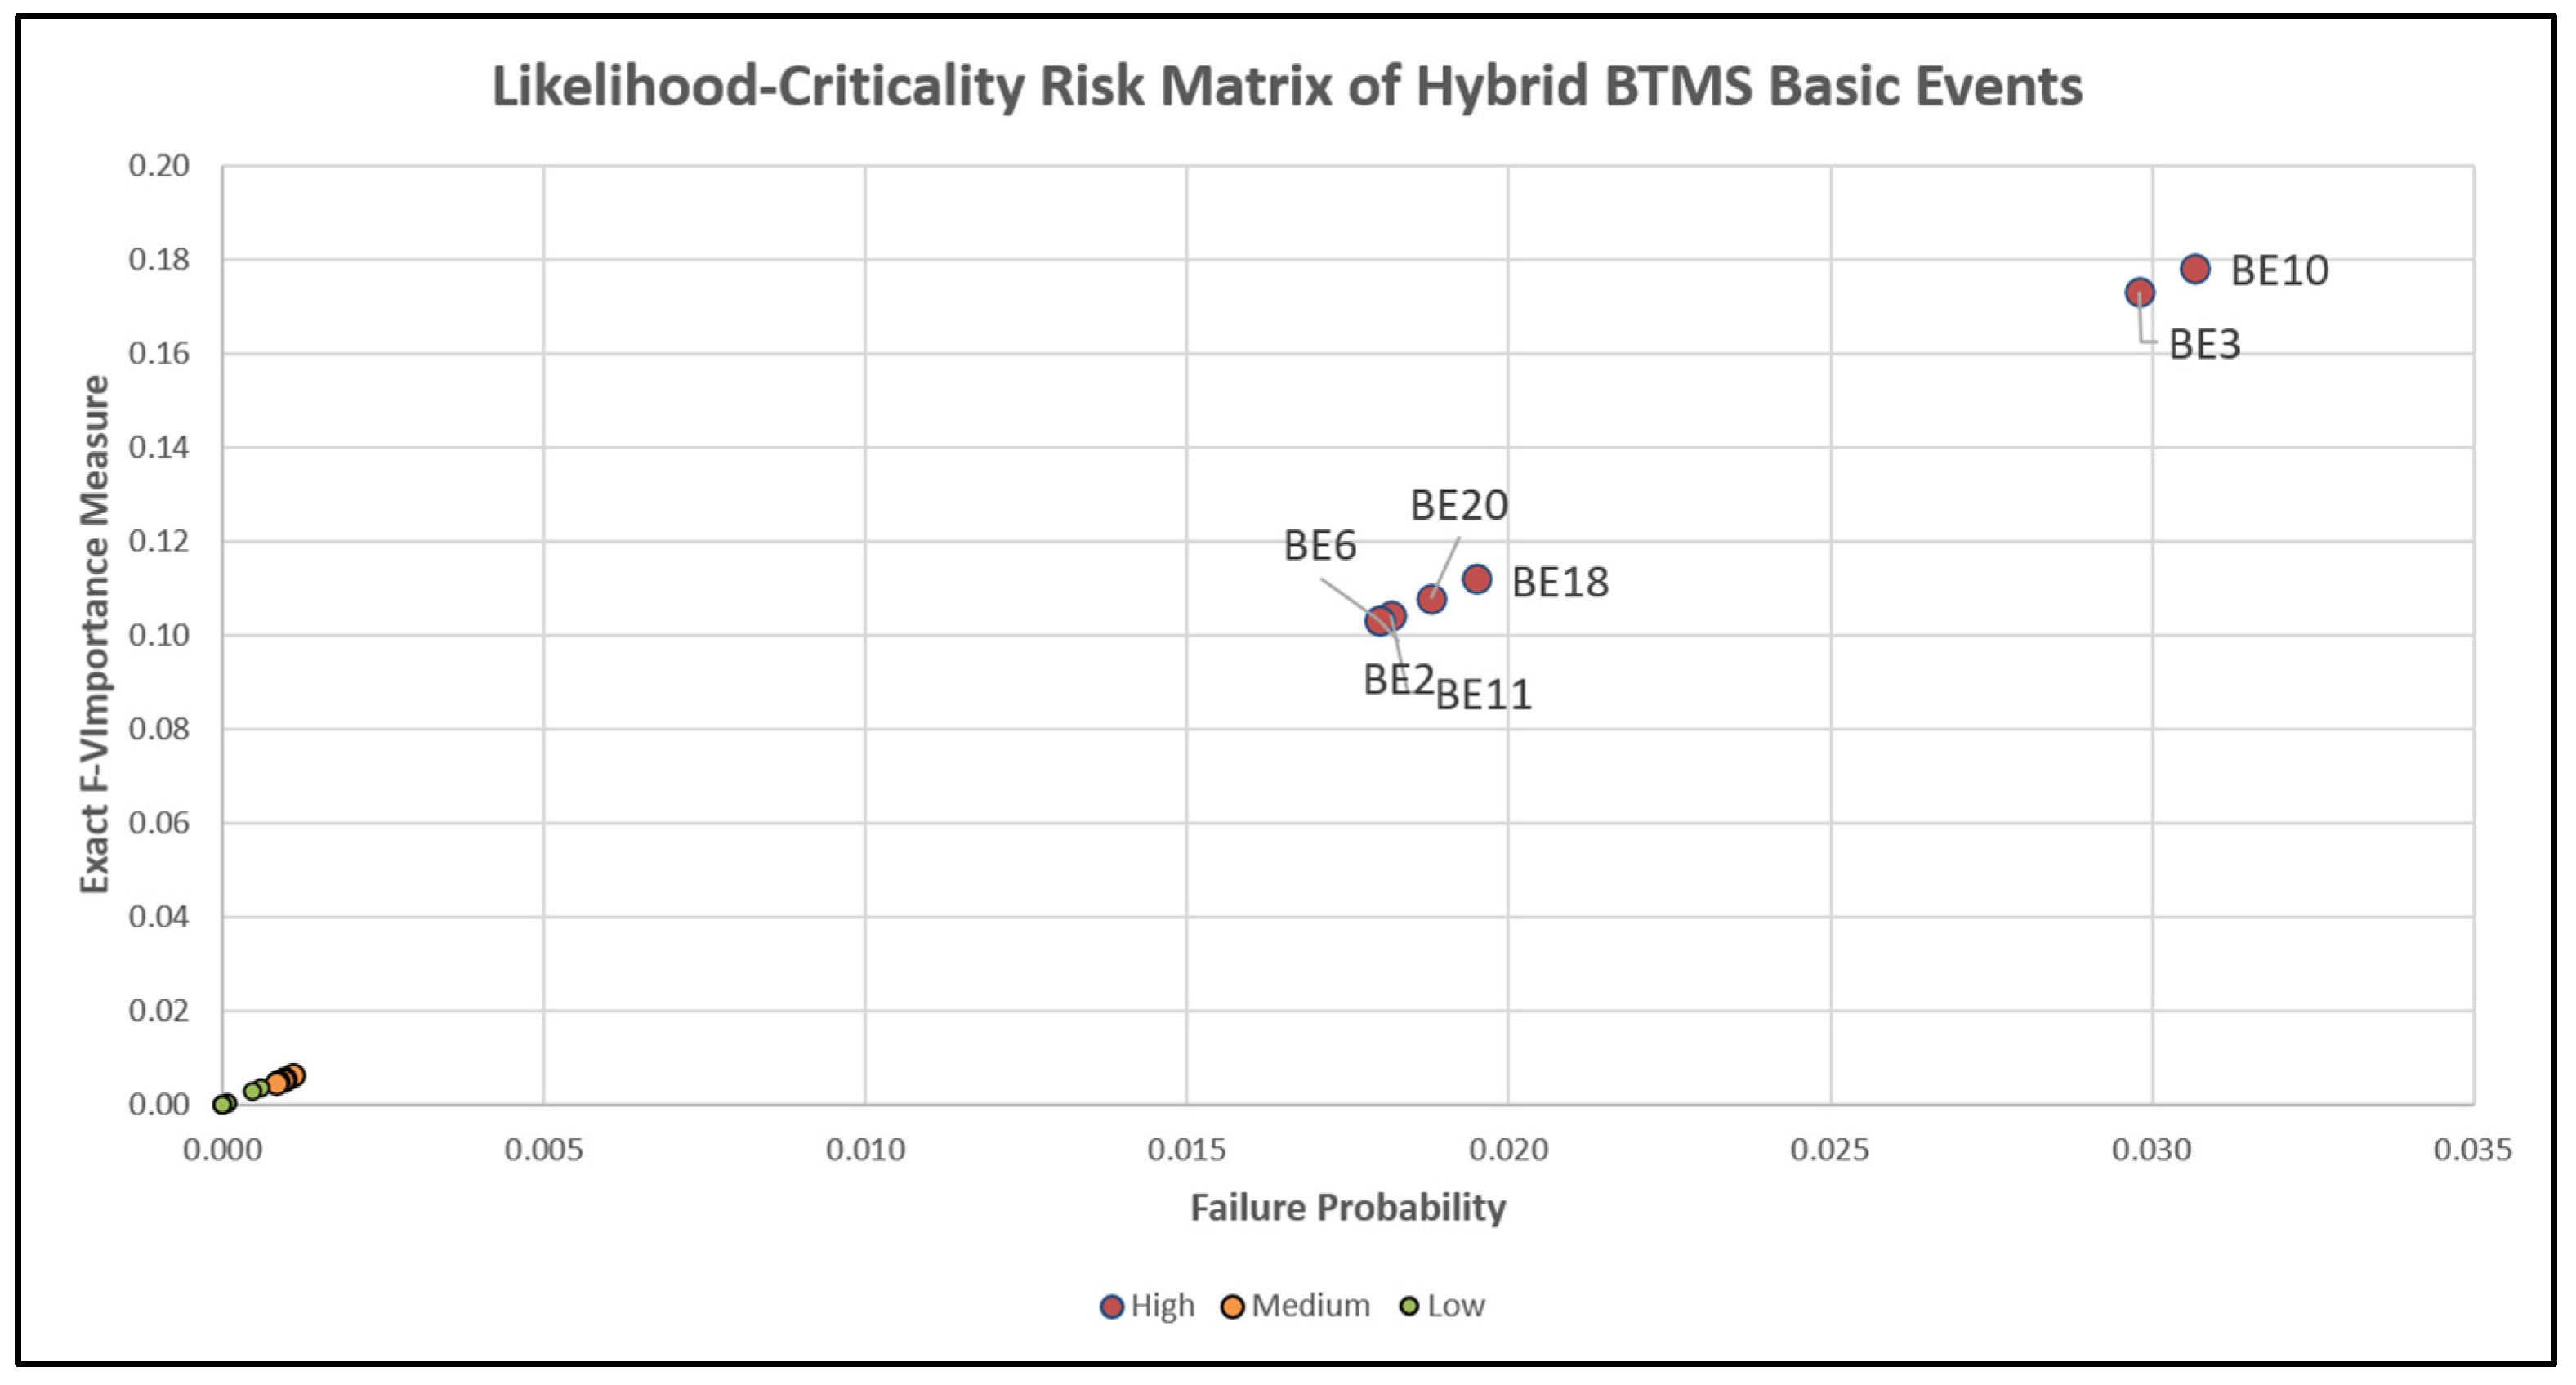
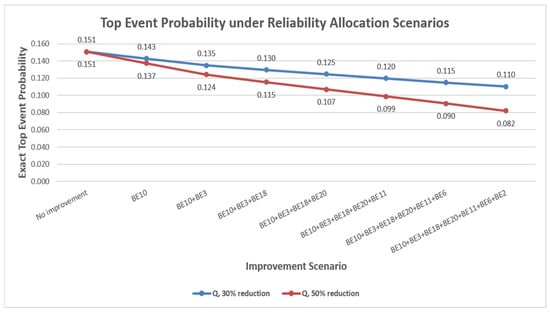
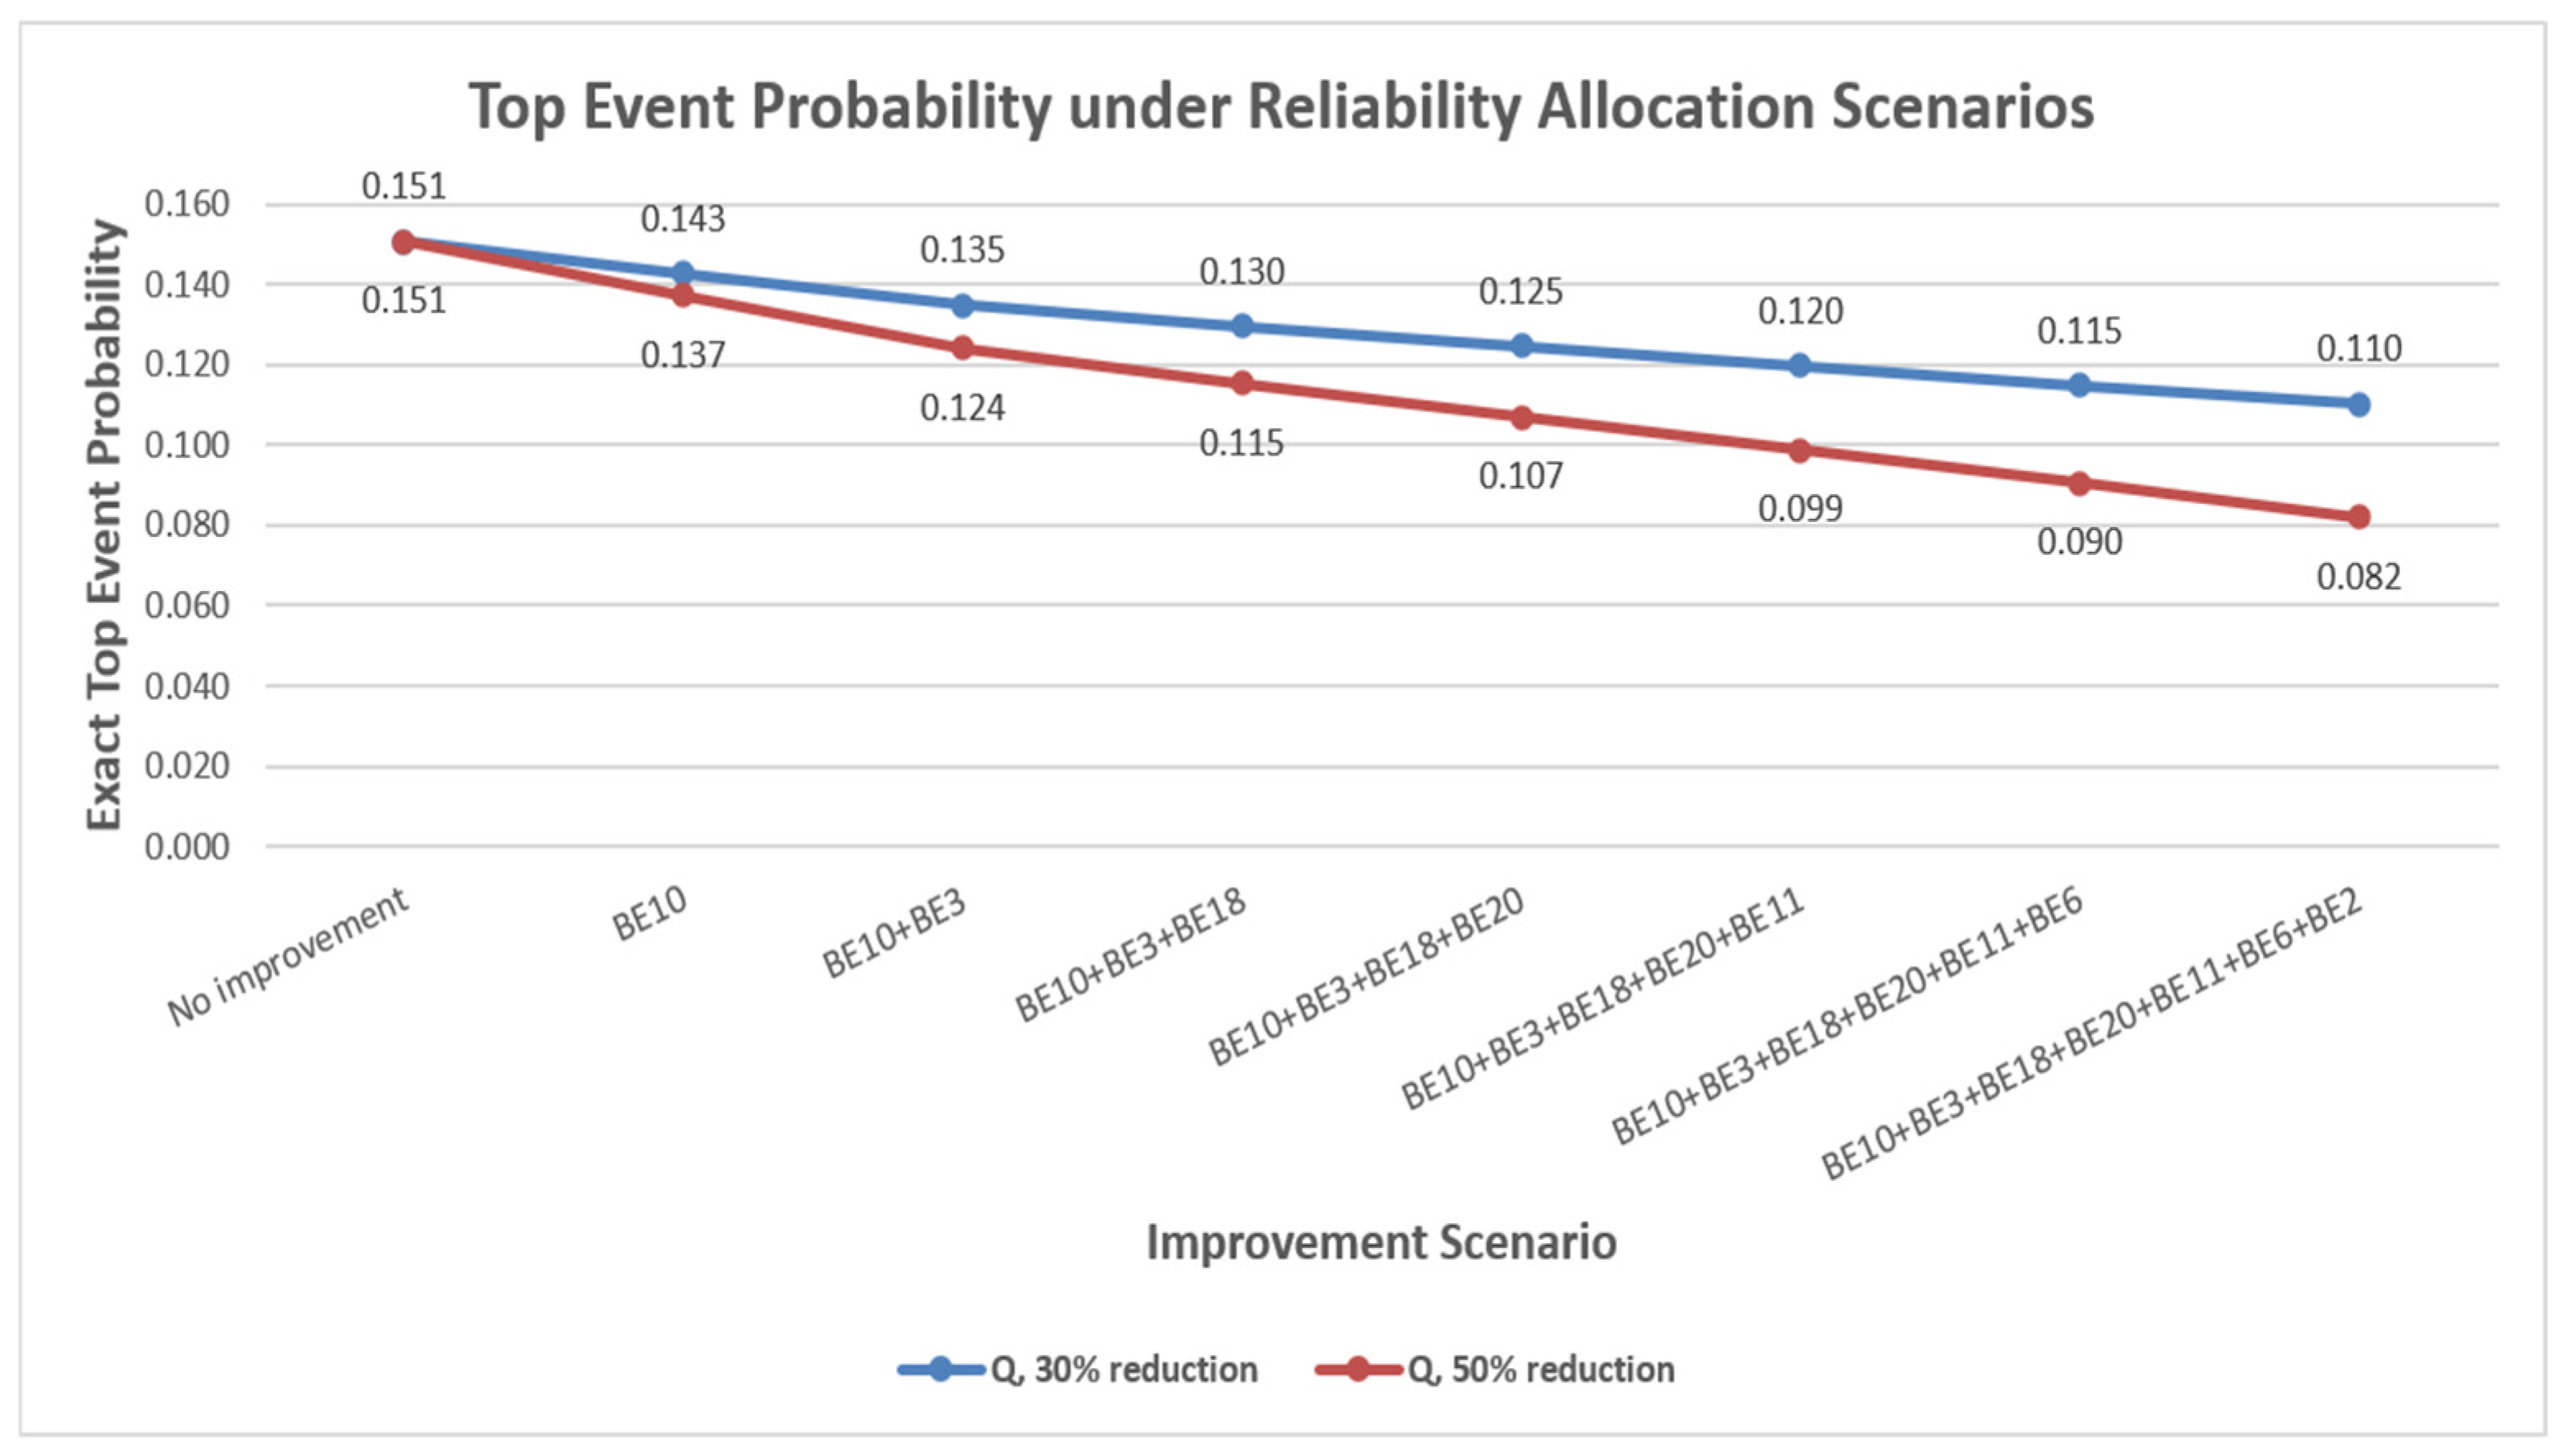
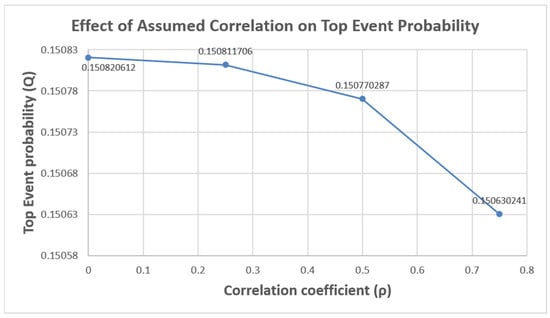
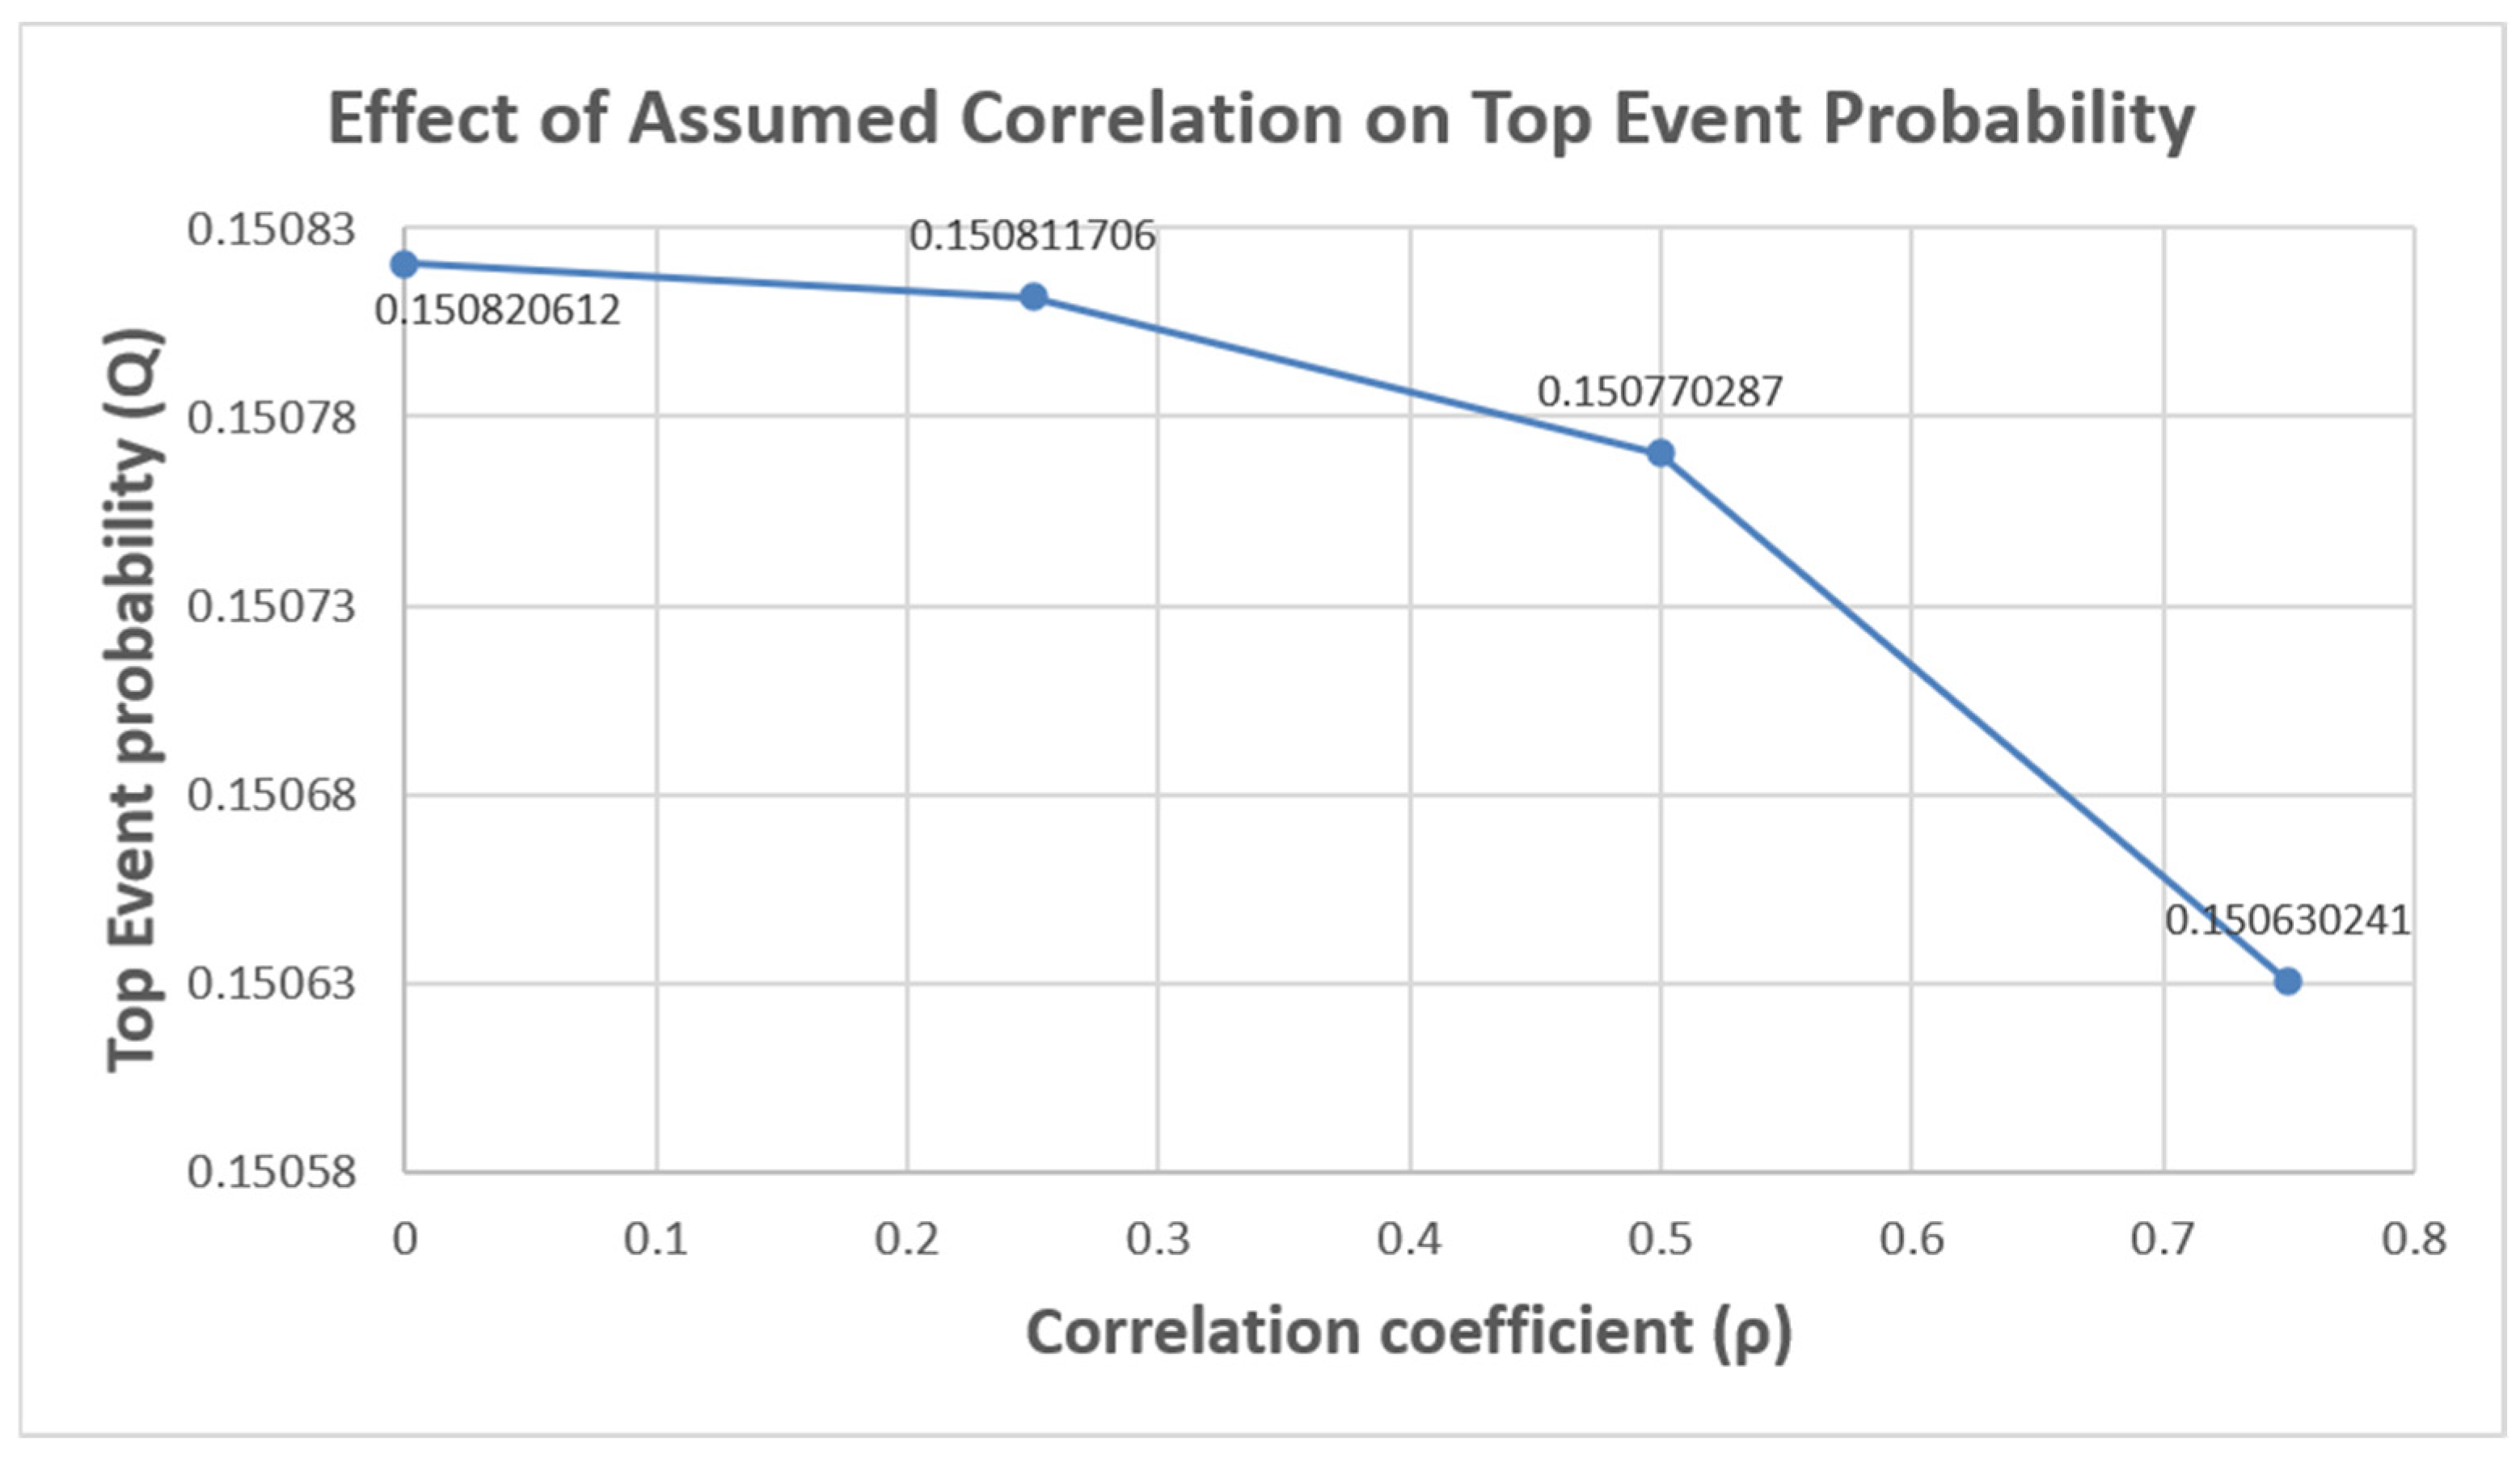
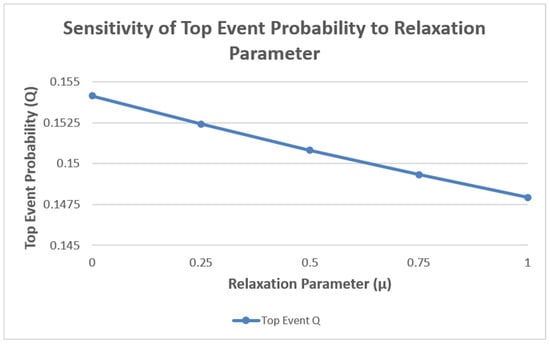
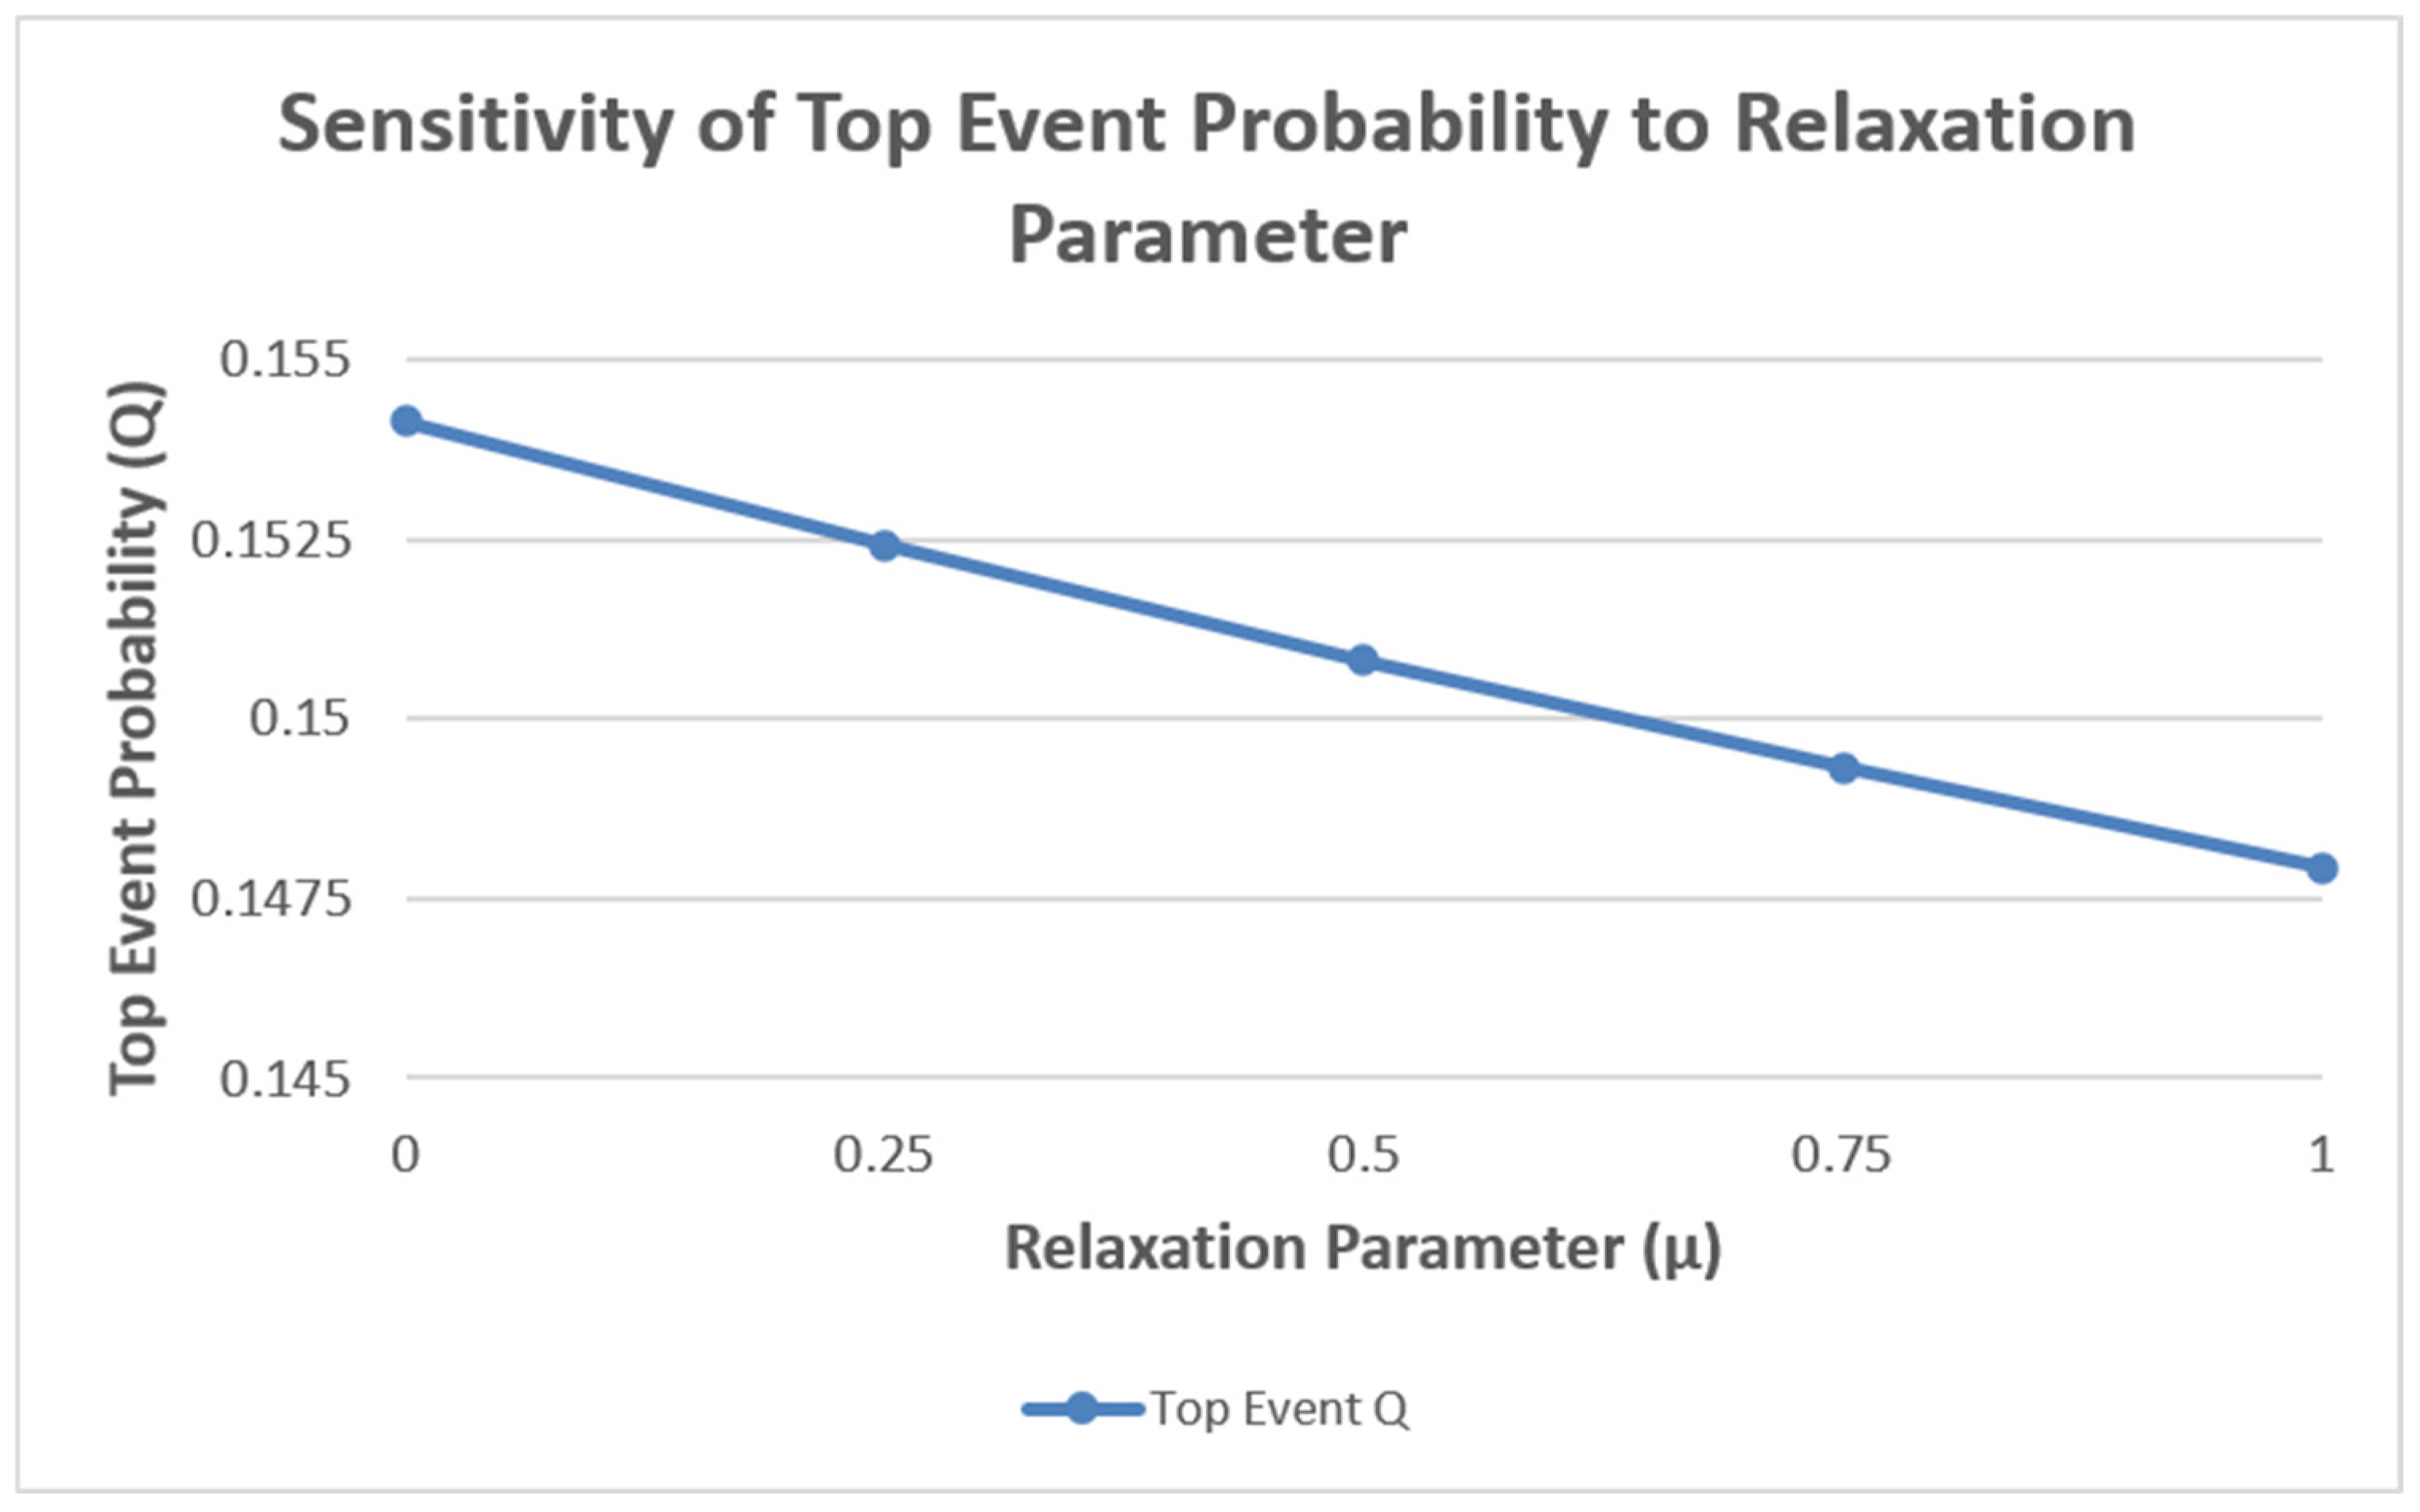
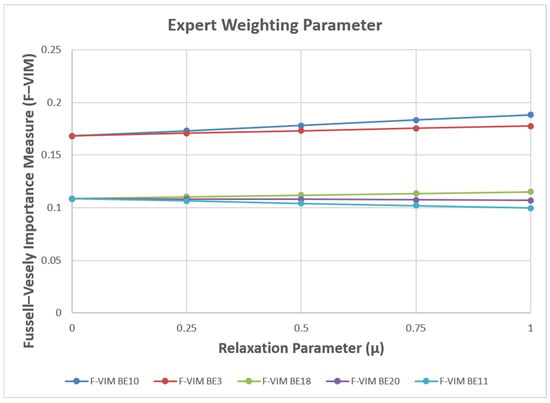
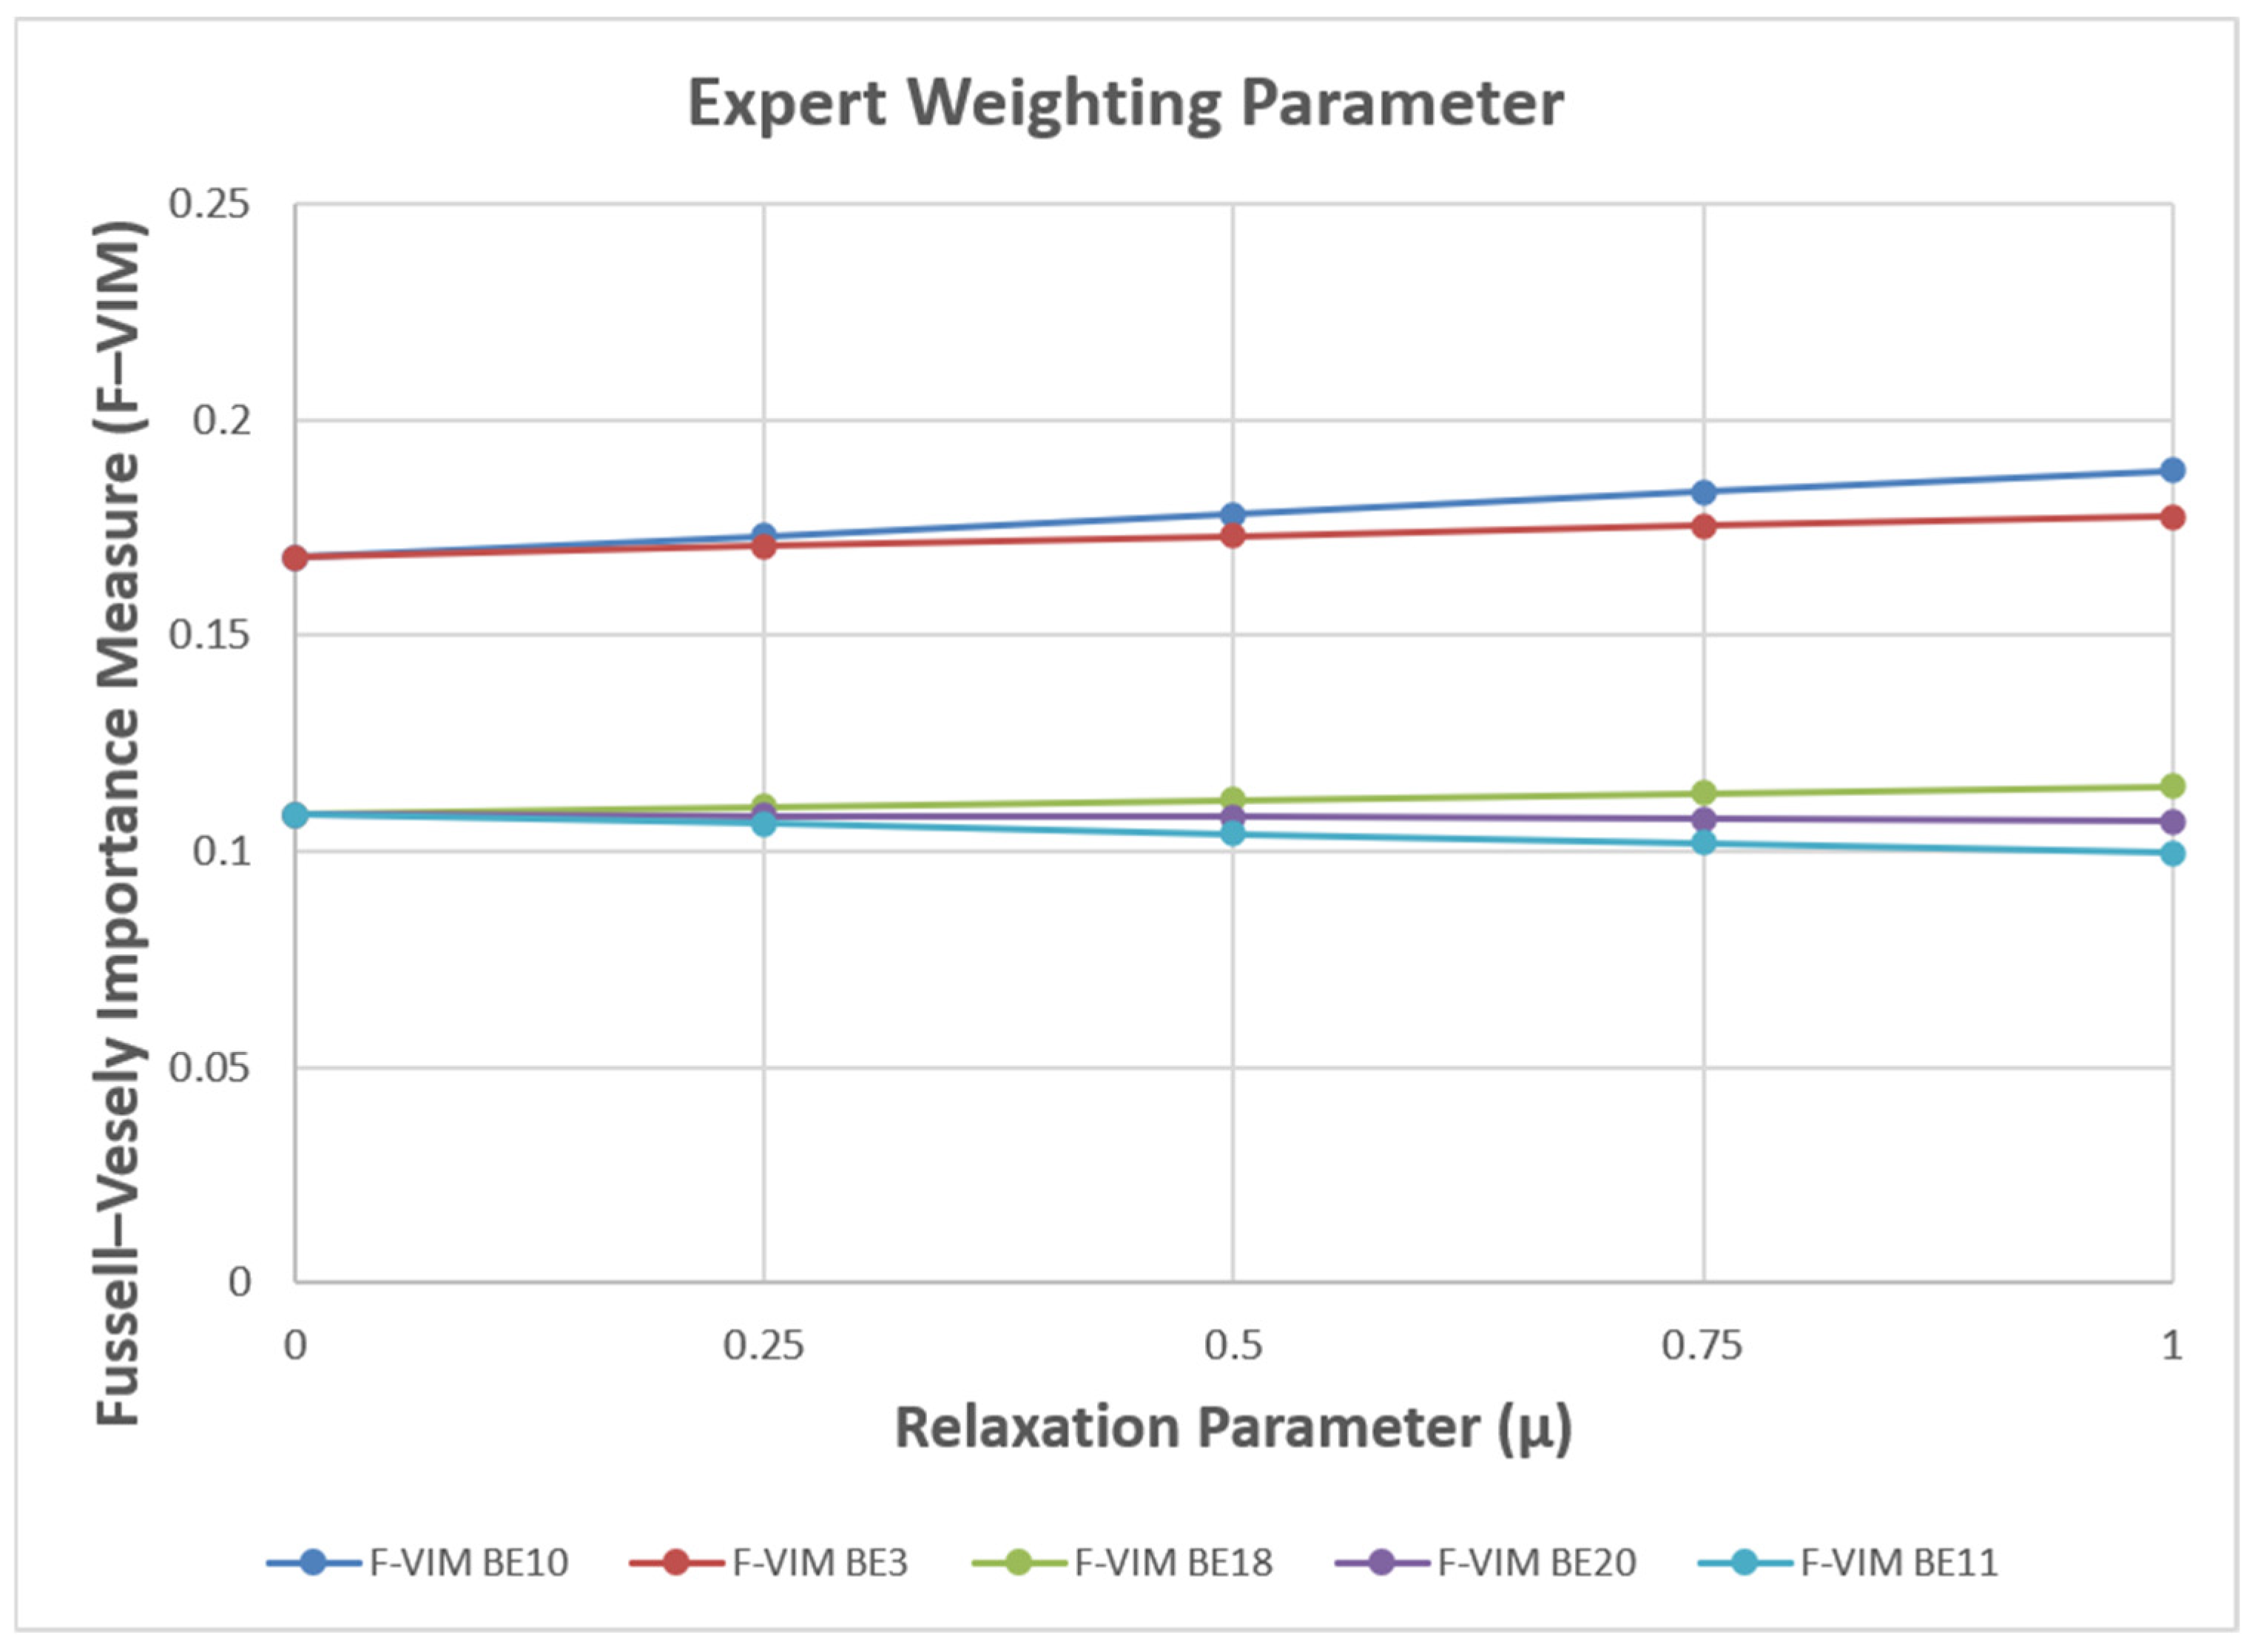

Disclaimer/Publisher’s Note: The statements, opinions and data contained in all publications are solely those of the individual author(s) and contributor(s) and not of MDPI and/or the editor(s). MDPI and/or the editor(s) disclaim responsibility for any injury to people or property resulting from any ideas, methods, instructions or products referred to in the content. |
© 2026 by the authors. Published by MDPI on behalf of the World Electric Vehicle Association. Licensee MDPI, Basel, Switzerland. This article is an open access article distributed under the terms and conditions of the Creative Commons Attribution (CC BY) license.