


Abstract
Electric cars and electric two-wheelers are transforming urban mobility along two parallel tracks, yet the two are usually studied separately, and evidence from a single policy environment in which both diffuse simultaneously remains scarce. Using monthly full-population vehicle registration records for 2000–2026 and official public charging and parking statistics from Macao, we compare the diffusion dynamics of the two tracks within one dense city. Threshold-crossing analysis shows that around the 2022 replacement subsidy and the accompanying build-out of public charging spots, the electric share of new two-wheeler registrations rose from 5% to 25% within 18 months, less than half the 37 months taken by cars; from 2024 to 2026, the two-wheeler share reached parity with and in most months exceeded that of cars. Lead-lag tests indicate that charging-spot expansion precedes two-wheeler fleet growth (Granger lag-1 p = 0.030; unfiltered distributed-lag joint p < 0.001), a pattern that weakens under seasonal adjustment and detrending (p = 0.186); no such precedence appears on the car track. Ample car parking plausibly favors private charging—a hypothesis, not a measured mechanism: parking spots do not establish charger access. Where two-wheelers are numerous and private parking scarce, public charging may enable their electrification, pending charging-access data.
1. Introduction
In the dense cities of East and Southeast Asia, two-wheelers carry a substantial share of motorized mobility, and the parallel uptake of electric cars and electric two-wheelers has become two tracks of urban transport decarbonization. The literature on electric two-wheeler adoption has accumulated evidence centered on intentions and preferences. Discrete-choice and acceptance studies in Vietnam and India identify the roles of purchase cost, usage cost, range anxiety, and social factors in adoption intentions [1,2,3]; the early experience of mototaxi riders in Lomé reveals the constraint structure under operating conditions [4]; a choice experiment in Jakarta compares the relative effectiveness of subsidies and non-monetary instruments [5]; and evidence at the energy-policy level places barriers and willingness to pay at the core of conversion decisions [6]. This literature is dominated by stated-preference evidence, supplemented by a small number of policy-level diffusion case studies, such as the green-utilization diffusion of electric motorcycles in Taiwan [7]. Where facilities do appear, they enter as perceived attributes; how adoption unfolds month by month in city-level registration data, and how it couples with measured infrastructure, remains largely undocumented.
Research on charging infrastructure and electric-vehicle adoption, in parallel, deals almost exclusively with four wheels. Swedish evidence finds public charging access positively but modestly associated with the propensity to buy [8]; a quasi-experimental study from California assesses the relative contribution of charging investment and purchase subsidies [9]; an Indian system-dynamics simulation compares the marginal roles of the two instruments [10]; and European survey evidence stresses the foundational role of private charging availability in purchase readiness [11]. Methodologically, monthly evidence from a German ZIP-code panel finds that public charging expansion precedes vehicle registrations, with a positive but small effect in which consumers care more about charging speed than about plug counts [12], and subsequent U.S. studies extend this path with nonlinear and graph-theoretic variants [13,14]. The answer this literature offers concerns one track: the direction and timing of charging effects on car adoption. When a car and a two-wheeler share the same roads, the same tax regime, and the same charging network of a single city, whether the two tracks respond to that network identically has hardly been touched—the facility factor in two-wheeler research remains at the perception level, and infrastructure research contains no two-wheeler sample.
Macao offers a comparable setting for the question. The city’s fleet structure is representative of East Asia: of roughly 254,700 registered motor vehicles in mid-2026; motorcycles account for about 123,900, nearly on par with cars; and two-wheeler ownership per thousand population ran ahead of cars until 2025. The tightness of public and curbside parking and the parking ratios of residential buildings create parking ecologies for two-wheelers that differ sharply from those for cars. Existing Macao studies cover willingness-to-pay measurement for electric motorcycles [15], acceptance surveys [16], an evolutionary-game analysis of payment willingness [17], and fleet mitigation estimates [18]; none uses registration data. Macao further satisfies four conditions: full-population monthly registration records covering 26 years, separable by cars and motorcycles; official monthly and quarterly series for public charging spots and parking spots; a common tax baseline for both tracks since 2002; and a set of 2022 policies with distinguishable timing, comprising a two-wheeler-only replacement subsidy, charging fees applying to both tracks, and a concentrated build-out of charging spots. A same-frame comparison of both tracks within one policy environment is precisely the evidence format missing from the two separate literatures—and its value goes beyond sample addition: common city-level shocks can be differenced out in a two-track design, a policy targeting one track provides a natural contrast, and infrastructure measured on a single official scale makes lead–lag relationships directly comparable across tracks. These three contrast conditions are difficult for individual surveys and cross-country panels to satisfy simultaneously.
This paper accordingly poses three research questions. First, within the same city and period, is the electrification diffusion of the two tracks asymmetric in timing and speed? Second, does the lead–lag relationship between public charging-spot expansion and fleet growth differ across tracks in direction or strength? Third, can structural differences in parking endowment explain such differences? The answers draw on the six methods defined; the monthly frequency and long coverage of administrative data shape the choice: threshold-crossing indicators characterize diffusion stages nonparametrically, the lead–lag battery is organized around the timing structure of the 2022 build-out, event study and counterfactual trends carry the dynamic interpretation of the policy shift, and the stock–flow identity recovers the fleet-renewal structure.
The contribution is threefold. First, the paper provides city-level, full-population, monthly, same-frame evidence that moves electric two-wheeler research from stated-preference dominance to the dynamics of realized adoption, compared alongside the car track. Second, it presents contrast evidence on whether charging-infrastructure expansion precedes fleet growth across two tracks, linking the contrast to parking endowment. Third, it documents the dynamic imprint of a policy package with distinguishable timing on its target track, offering a reference for infrastructure investment and subsidy sequencing in dense cities.
2. Policy Context
Macao is a densely built urban economy whose motor-vehicle mix is representative of East Asia: of 254,739 registered motor vehicles in July 2026, cars account for 130,753 and motorcycles for 123,926, two classes of nearly equal size. The same roads, the same tax regime, and the same charging network must therefore serve four-wheel and two-wheel users simultaneously, which makes it possible to compare the two electrification tracks within a single policy environment. Existing research on electric vehicles in Macao has focused on an evolutionary-game analysis of residents’ willingness to pay [17], the lifecycle carbon value of bus electrification [19], and mitigation estimates for the light-duty fleet [18]; no study has used registration data. An accurate account of the institutional setting is a precondition for the empirical analysis that follows.
On the demand side, Macao has long maintained a stable tax preference for electric vehicles. Under Article 6(2) of the Regulation on Motor Vehicle Tax, enacted by Law No. 5/2002, new motor vehicles powered solely by alternative fuels to petroleum are exempt from the motor vehicle tax; the Regulation, complemented by Dispatch No. 52/2002 of the Secretary for Economy and Finance, took effect on 17 July 2002 under the statutory rule of entering into force thirty days after publication, and its current version has been amended by Laws No. 1/2012 and No. 14/2015. Electric light cars and electric motorcycles are likewise exempt from the annual motor vehicle license tax. Throughout almost the entire observation window, in other words, the relative tax burden on electric vehicles of both classes saw no discrete change: the electrification that occurred before 2022 unfolded against a stable preferential baseline rather than being triggered by a tax reform.
The discrete shocks arrived in 2022, forming a policy package with distinguishable timing. First, Dispatch No. 5/2022 of the Secretary for Transport and Public Works (published in the Official Gazette of the Macao SAR on 14 February 2022) established a subsidy scheme for phasing out old motorcycles and replacing them with new electric motorcycles—MOP 3500 per replacement, administered by the Environmental Protection and Energy Conservation Fund, with applications opening on 1 March 2022 (the application period was later extended in stages to 31 May 2025). The scheme targets motorcycles only. Second, Administrative Regulation No. 25/2022 and Chief Executive Dispatch No. 105/2022 ended free public charging: from 28 July 2022, fees of MOP 1.42–4.40 per kilowatt-hour applied by charging mode and time of day, a cost shock common to both tracks. Third, public charging spots underwent a concentrated build-out from mid-2022 to early 2023: motorcycle spots rose from 2 (a level unchanged through March 2022) to 52 from April 2022 and 490 by January 2023, while car spots climbed from a plateau of 168 (June 2020 to April 2022) to 1076 by January 2023, including a single-month addition of 451 in December 2022. The three measures were not synchronous—the replacement subsidy preceded the fees and the build-out by roughly one quarter—and that sequencing provides the time structure for the dynamic empirical analysis that follows. Table 1 summarizes the full institutional timeline.
Table 1.
Policy timeline for vehicle electrification in Macao, 2002–2026.
The implications of this institutional framework deserve attention before presenting the data. The continuity of tax preferences since 2002 means there was no purchase-tax break affecting both tracks within the window, so pre-2022 differences between the tracks cannot be attributed to tax changes. The replacement subsidy applied to motorcycles alone, while charging fees and the build-out touched both classes; the ordering among the three offers month-level time structure for distinguishing the onset of demand-side support from that of supply-side relief. And because both classes share the same macroeconomic and tourism environment, city-level common shocks can be differenced out in a two-series design. Macao’s policy structure is thus not a clean single-policy experiment but a policy package with distinguishable timing, and this determines the analytic framework of this paper: identifying shifts in diffusion speed rather than discrete level breaks.
Later policies continued along the twin track of demand-side support and usage-cost adjustment. Chief Executive Dispatch No. 66/2024 cut public charging fees for the first time, effective 1 May 2024. Dispatch No. 39/2025 of the Secretary for Transport and Public Works (published 6 October 2025) extended the replacement subsidy to all gasoline motorcycles, with applications accepted from 15 October 2025 at MOP 3500 in the first year, declining annually to MOP 1500, through October 2030. Phase three of the old diesel-vehicle scrappage scheme began in January 2026, and Chief Executive Dispatch No. 1/2026 reduced charging fees by roughly a tenth from 1 February 2026. A 2024 proposal by the Transport Bureau to extend the tax exemption to extended-range electric vehicles—discussed at the Traffic Advisory Committee and followed by a Legislative Assembly enquiry on implementation—never became law and is not treated as a policy break here.
One further shock common to both classes was the pandemic-era border regime. Monthly visitor arrivals fell from a 2019 average of about 3.28 million to 2.35 million in 2023 before recovering to 3.34 million in 2025, and household income and consumption came under pressure over 2020–2022. Such common shocks are absorbed by month fixed effects in the two-series design developed later in this paper, but their overlap in time with the 2022 package remains a reason for restraint in interpreting the package’s effects.
3. Data and Methods
3.1. Data
The core data are the monthly vehicle registration statistics of Macao’s Statistics and Census Service (DSEC), full-population administrative records covering 319 months from January 2000 to July 2026. The registration tree provides stocks (registered motor vehicles) and flows (new registrations), each split by cars (light/heavy) and motorcycles (light/heavy), with an “of which: electric” sub-item under every class; together with class totals and industrial vehicles, the tree comprises 26 monthly indicators. The electric sub-item of industrial vehicles is an absolute zero throughout the sample and plays no role in the analysis. All series come from the official DSEC statistical database and pass two identity checks: monthly sums of new registrations equal the official annual values in all 26 years, with zero maximum residual, and class totals equal the sum of their sub-classes (cars = light + heavy; total = cars + motorcycles + industrial) in all 319 months, again with zero residual. One convention matters for practice: in the DSEC tables, “-” denotes an absolute zero rather than a missing value, and this directly shapes how logarithmic transformations and share calculations are handled.
Public charging data come from the Transport Bureau (DSAT) charging-spot dataset on the Macao open data platform (data.gov.mo), on an “in open use” basis, split by light cars and motorcycles, covering 87 months from January 2019 to March 2026. This basis differs from the “installed” counts cited in government communiqués—the latter include spots not yet open and car parks managed by the Municipal Affairs Bureau—so the open-data basis is used throughout and noted wherever charging spots are reported. Parking structure comes from the DSEC quarterly statistics on parking spots (48 quarters, 2014Q3–2026Q2), split by cars and motorcycles and by use: residential buildings, commercial buildings, and public car parks.
Auxiliary series comprise the origin of newly registered vehicles (11 countries/regions, monthly, from 2000); driving-license stocks by vehicle class (monthly, from 2013); motorization rates of cars and motorcycles per thousand population (annual); the fleet of new-energy public buses (DSAT open data, January 2020 to December 2025, by company and fuel type); and monthly visitor arrivals (sea, land, and air combined, from 2008). Data vintages differ—registrations end July 2026, charging spots March 2026, parking 2026Q2, buses December 2025—and every contemporaneous comparison in the text flags the aligned endpoint. Table 2 summarizes the complete set of data sources, frequencies, coverage periods, and statistical bases.
Table 2.
Data sources and coverage.
Across the observation window, the two vehicle classes exhibit distinct patterns of electrification and differing exposure to parking and charging infrastructure. Table 3 presents the summary descriptive statistics for all primary variables utilized in the analysis.
Table 3.
Descriptive statistics of the main variables.
3.2. Methods
The empirical strategy comprises six components, each addressing a corresponding research question raised in Section 1. Table 4 provides a summary, after which formal definitions, identifying assumptions, and scope boundaries are detailed.
Table 4.
Overview of methods.
Share variables are within-class ratios: and , where j ∈ {car,moto} and N is the class total. Because monthly registrations are volatile and seasonal, threshold crossing is judged on the right-aligned 12-month rolling mean—the first month in which the mean of the trailing twelve months including the current one reaches 5% and 25%—and the duration between the two thresholds measures diffusion speed. Right alignment, rather than centering, avoids importing the following six months into the current month’s judgement, so crossing dates are identifiable in real time by a policy observer; 5% and 25% correspond to take-off confirmation and substantive penetration in the diffusion literature, and the raw monthly series are plotted alongside for readers to check the sensitivity of conclusions to the smoothing choice. This local-speed metric does not depend on the asymptote of a fitted diffusion curve, estimates of which are unstable before saturation; curve fits serve only as a goodness-of-fit reference, and no point estimate of the ceiling is reported. Logistic and Gompertz curves have been the standard toolkit for durable-goods adoption since the Bass model [20], with recent applications to the joint diffusion of electric vehicles and residential photovoltaics [21] and to new-energy vehicle diffusion under multi-subsidy phase-down [22]; we follow that tradition but anchor the reporting in the data-driven threshold crossings.
The stock–flow identity underpins the recovery of implied deregistrations:
where Dereg collects deregistrations and transfers out of the register. The recovered series passes a validity check: negative values total 17 months (light cars: 5, heavy cars: 9, light motorcycles: 1, and heavy motorcycles: 2), of which 11 fall in 2002–2012, the remainder scattered through 2016, the latest in March 2020—consistent with re-classification between registers; negative months are not censored and offset in annual aggregation. The same identity applied to electric sub-items yields their implied deregistrations, but with tiny early bases these are used only when describing fleet-renewal structure at the class level. Recovering fleet structure from the stock–flow identity parallels long-run national fleet characterization [23].
Deregj,t = Newj,t − (Stockj,t − Stockj,t−1)
The lead–lag battery constitutes the core evidence for RQ2. Granger non-causality tests measure the predictive increment that one variable’s own history adds to another’s current change; their meaning is temporal precedence, not structural causation [24]. Monthly evidence from Germany finds public charging expansion preceding vehicle market diffusion, with a positive but small effect in which consumers care more about charging speed than about plug counts [12]; U.S. studies at the national and regional level report nonlinear-Granger and graph-theoretic extensions of the same relationship [13,14]. We applied the same family of tests with multi-variant safeguards for a small sample: on the log-growth series Δ ln EVstock and Δ ln Spots, we report Granger F tests under three variants—raw, detrended (13-month centered rolling mean; this two-sided filter imports future information and is retained as a robustness variant read against the right-aligned one), and seasonally adjusted (month-dummy residuals; seasonal adjustment plus detrending as a combined variant)—with lag 1 as the primary order and lags 3 and 6 also reported; the sample is split at December 2022 to examine where the identifying variation sits. The unfiltered log-growth pairing is the primary specification throughout—seasonal adjustment and detrending are robustness variants because month-dummy adjustment uses full-sample means and centered detrending imports future information—and the family of related tests multiplies the chance of occasional significance, so we read consistent direction across specifications rather than any single p-value. As cross-validation, we estimate the distributed-lag regression:
with Newey–West heteroskedasticity- and autocorrelation-robust (HAC, 4 lags) standard errors [25], testing β0 = β1 = β2 = β3 = 0 jointly. The Engle–Granger test [26] finds no co-integration in either track (cars p = 0.209; motorcycles p = 0.509), so all tests run on growth rates; the gain is avoiding spurious regression in levels, the cost is forgoing a long-run/short-run decomposition. Pre-tests also leave a unit root unrejected in the car track’s raw growth series (ADF [27] p = 0.953); the seasonally adjusted and detrended series entering the distributed-lag regression is stationary (p < 0.001; Appendix A Table A1), so the caveat bears mainly on the car track’s Granger null results rather than on the regression series. The two tracks’ equations are additionally estimated jointly as seemingly unrelated regressions [28] to test whether the charging response differs across tracks in magnitude rather than only in detectability; Breusch–Godfrey diagnostics and HAC-bandwidth-robust Wald re-examinations of the headline tests are collected in Appendix A Table A1.
The event study runs on the differenced series. Let , the motorcycle-minus-car electric share of new registrations; we regress it on quarterly dummies with the subsidy quarter of 2022Q1 as the reference,
with Newey–West HAC (4 lags) standard errors. The quarterly indicators span all quarters with 2022Q1 as the omitted reference category, so no separate intercept is identified: the normalization absorbs it, and each coefficient reads as that quarter’s deviation from the reference quarter in percentage points. The differenced form is equivalent in point estimates to the two-series panel with month fixed effects and mirrors the trajectory analyzed in our subsequent empirical findings. With only two series, panel-clustered and heteroskedasticity-robust inference cannot support valid inference under serial correlation [29], so the single-series HAC standard errors are the basis, assisted by placebo designs. No class-specific linear trend enters Equation (3): under month effects (or the equivalent differencing) and saturated quarterly dummies, such a trend is weakly identified from within-quarter month positions, producing huge uninterpretable coefficients—our own early estimates ranged from −140 to +122 percentage points—and Appendix Table A2 reports the trend-augmented contrast to document the choice. As a further contrast, placebo breaks show that the baseline difference-in-differences specification produces significant estimates at a quiet date (June 2018) and at the pandemic shock month (March 2020) alike (Table A2): the design alarms on any differential dynamics, level-break causal estimates are unusable, and this paper’s dynamic reading is explicitly descriptive—timing alignment rather than causal attribution. The event-study window ends in December 2024 to isolate the main policy episode from the second-round subsidy launched in October 2025 (with full-window estimates documented in the Appendix A).
The counterfactual trend extrapolates a pre-policy log-linear fit: for each track, ln sstock in January 2015–February 2022 (the absolute-zero exclusion rule is never triggered—neither pre-window contains a zero month) is regressed on time, the fitted line is extrapolated beyond March 2022, and the actual path is compared against it; both tracks use the same window and functional form. The method is transparent but bounded—the two tracks’ pre-period fits differ sharply in quality, so any “difference in displacements” between tracks would carry no causal reading. We report each track’s deviation from its own trend and state this limit in the discussion.
4. Results
4.1. Dual-Track Diffusion: Stylized Facts
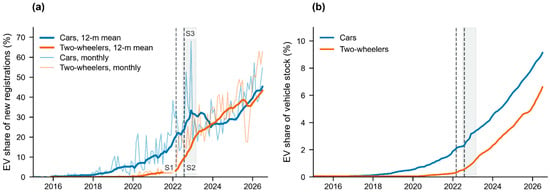
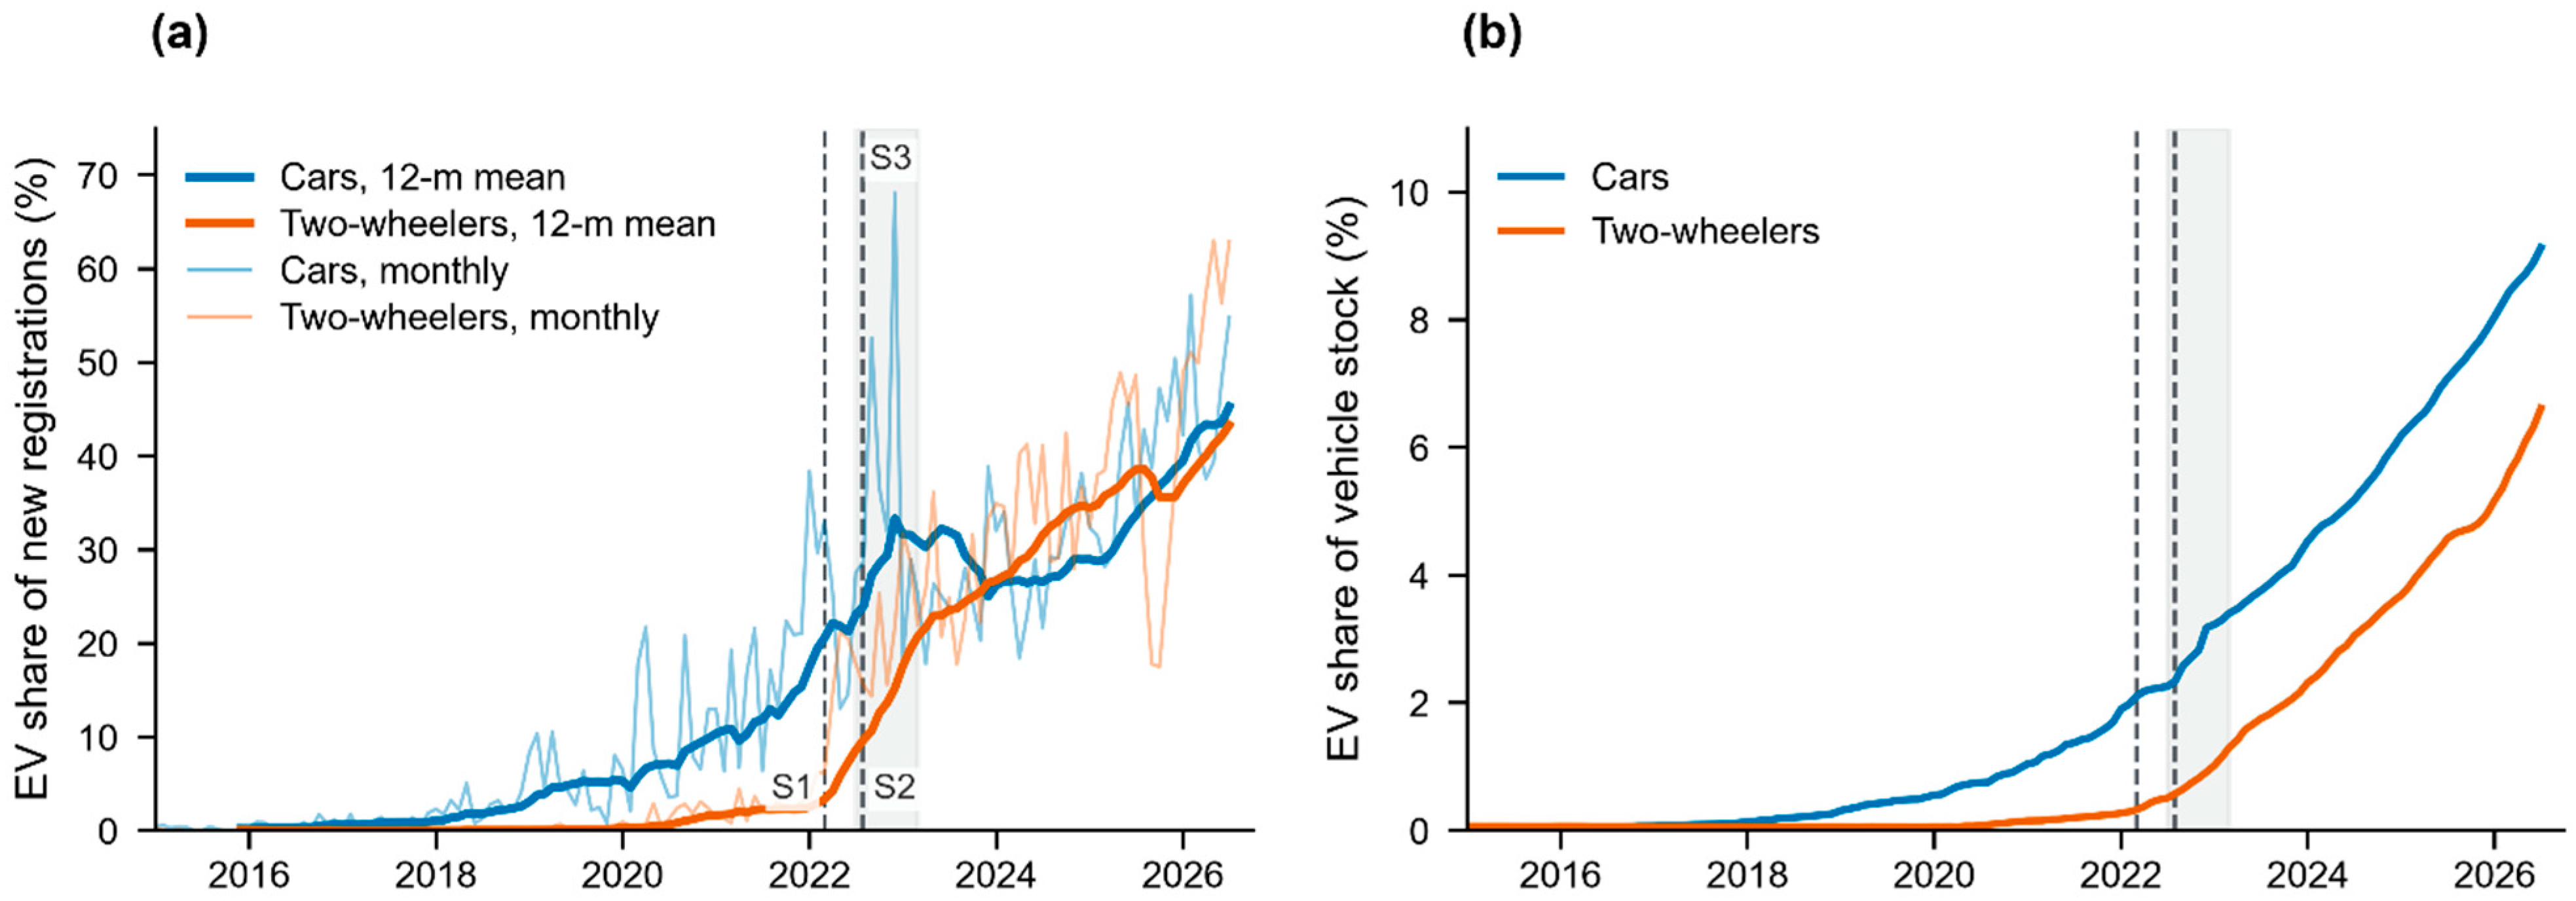
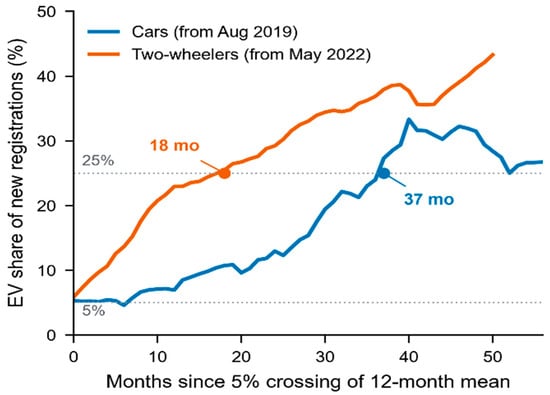
Figure 1 traces the full path of the two electric shares. Measured by the 12-month rolling mean, the car track first crossed 5% in August 2019 and 25% in September 2022, taking 37 months between thresholds; the two-wheeler track did not cross 5% until May 2022 yet needed only 18 months to reach 25% by November 2023—less than half the car track’s duration. Starting points nearly three years apart and a second segment twice as fast: this “late-starting but steep” shape is the point of departure for all mechanism analysis that follows. The gap in starting points is consistent with the supply environment. When cars crossed 5% in 2019, the mainland-China origin share was still below 5%; early car electrification rested on a handful of models through established import channels and on the stable tax baseline in place since 2002. Two-wheelers had no comparable model supply, and their flow majority began to convert only when the policy package and mainland products arrived together.
Figure 1.
Dual-track electric shares. (a) Electric share of new registrations; (b) electric share of vehicle stock. Note: in panel (a), thin lines represent monthly observations and thick lines depict 12-month rolling averages. Vertical dashed lines mark the replacement subsidy launched in March 2022 (S1) and the introduction of public charging fees on 28 July 2022 (S2). The shaded region (S3) denotes the concentrated charging-spot build-out from July 2022 to March 2023. The proximity of S2 to the left boundary of the S3 band reflects their historical concurrence.
It is worth noting, the two-wheeler monthly share was already above the car track in May and June 2022 (21.2% against 13.0% in May)—precisely when the track crossed 5%—before falling back. From 2024 onward, monthly shares above the car track became the norm: 9 of 12 months higher in 2024, exactly half (6 months) in 2025, and 6 of the first 7 months of 2026, for a combined 21 of 31 months, a majority. The margin is not persistent: 2025 saw a single-month reversal as large as 29.7 percentage points (in October 2025, the month the new-round replacement subsidy opened for applications, plausibly a registration-timing effect that we do not interpret causally), and on the 12-month-mean basis the two tracks remained near parity through July 2026 (cars 45.3%, two-wheelers 43.3%), with monthly readings of 54.8% against 62.9%. We therefore describe the pattern as “parity with a majority of months higher”. The stock side lags the flow side: in July 2026 the electric shares of the car and two-wheeler stocks stood at 9.13% and 6.61%, corresponding to 11,936 and 8196 vehicles, so the rapid shift in new registrations has yet to pass through to the fleet in proportion.
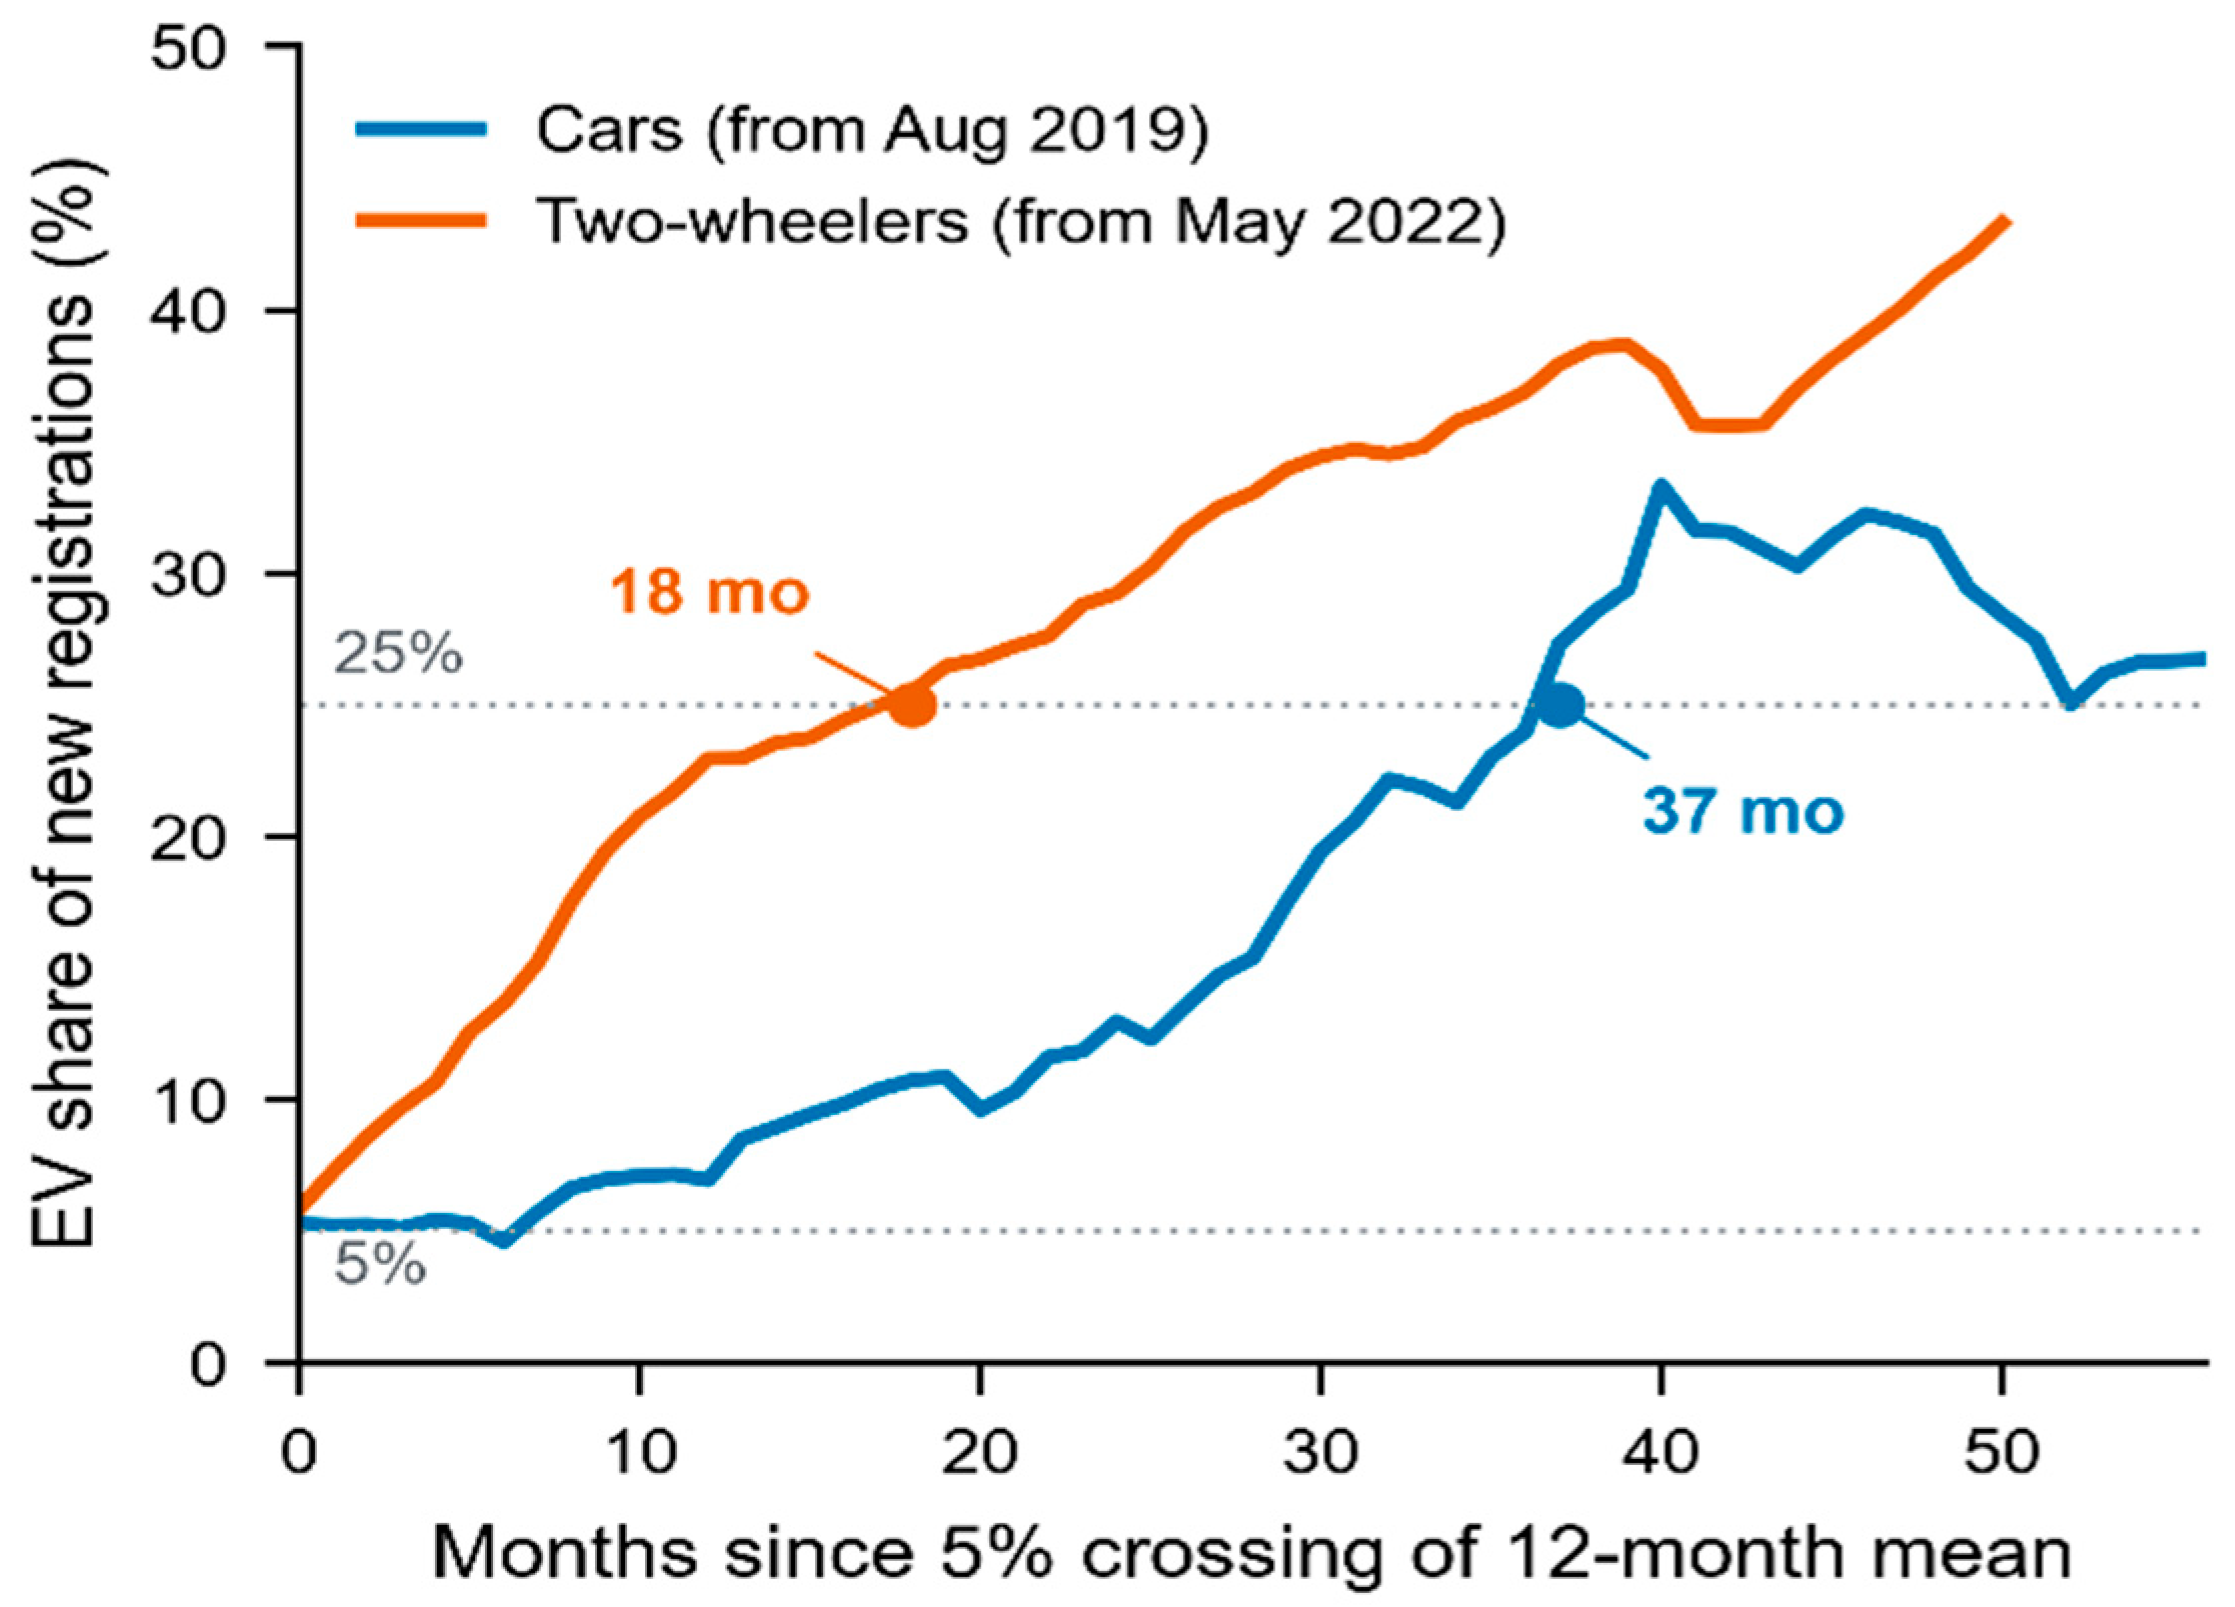
Figure 2 aligns the two tracks on their own event-time axes: the horizontal zero is each track’s 5%-crossing month. The car curve climbs gently; the two-wheeler curve surges after crossing 5%, and the two curves hit the 25% reference line at 37 and 18 months. This alignment removes the three-year head start from the comparison and converts the question from “who electrified first” to “who moved faster within the same threshold band”—the answer points clearly to two-wheelers. This speed advantage is not an artifact of the threshold pair, across alternative pairs on the 12-month mean (3–30%, 5–30%, 10–30%, 3–10%, and 10–25%), the two-wheeler band traversal is shorter in every case; the less-than-half ratio is specific to the 5–25% pair, and at 10–30% the two tracks nearly converge (21 versus 23 months). The reading also survives the smoothing and aggregation choices, 6- and 24-month windows give 13 versus 37 and 21 versus 34 months, and registration-weighted annual shares cross the two thresholds a year apart for two-wheelers (2022 to 2023) against about three years for cars (2019 to 2022).
Figure 2.
Diffusion speed across tracks aligned at the 5% adoption threshold. Note: month 0 denotes the 5% electric share crossing for each track. Leader lines mark the 25% thresholds and associated durations. The event window covers 0–51 months (bounded by the motorcycle series), with the car series evaluated across the identical horizon.
The macro-backdrop shifted directionally as well. Cars per thousand population rose from 128 in 2000 to 188 in 2025, while two-wheelers peaked at 203 in 2016 and fell to 181 by 2025; the two tracks tied at 184 in 2024, and 2025 marked the first-year cars that exceeded two-wheelers in the data. Consistent with this, the geography of supply was reorganizing: the mainland-China share of new registrations climbed from 2.7% in 2015 and 4.2% in 2019 to 23.9% in 2022 and 40.8% in 2025, while the Japanese share drifted downward (32.4% in 2019 against 30.7% in 2025). Since 2017, the month-level correlation between the combined two-track electric share and the mainland-origin share is 0.992 (car track: 0.920, two-wheeler track: 0.944; 0.907 even after first-differencing). Both series climb, so the correlation is dominated by the common trend and is reported purely as a supply-side accompaniment; origin statistics are not split by vehicle class, and we present no causal reading. Public buses constitute a third transition mode: extended-range electric buses grew from 2 in early 2020 to 912 by the end of 2025, about 96% of the fleet, but in procurement-driven steps, two bus companies each introduced entire batches in 2022H2 and early 2023, a shape extremely different from the month-by-month climb of the private market.
The two-wheeler track is itself heterogeneous. Light electric two-wheelers crossed 5% as early as November 2020, before the 2022 package, and by July 2026 their electric share of new registrations had reached 99.2%, approaching completed conversion; the flow majority—heavy motorcycles—crossed 5% in May 2022 together with the package and stood at 53.1% in July 2026, with their internal-combustion stock falling by roughly 1900 vehicles in each of 2024 and 2025, the replacement channel in plain view. On the same 12-month basis at the subclass level, the light segment traversed 5% to 25% in 17 months (November 2020 to April 2022), whereas the heavy segment needed 38 months (May 2022 to July 2025)—within the range of the car segments (light cars: 29 months, heavy cars: 41)—so the aggregate two-wheeler speed is carried by the light segment’s surge, and the subsidy-targeted heavy majority traversed the band at car-like speed. On the same 12-month basis at the subclass level, the light segment traversed 5% to 25% in 17 months (November 2020 to April 2022), whereas the heavy segment needed 38 months (May 2022 to July 2025)—within the range of the car segments (light cars: 29 months, heavy cars: 41)—so the aggregate two-wheeler speed is carried by the light segment’s surge, and the subsidy-targeted heavy majority traversed the band at car-like speed. The identifiable margin of the 2022 package thus falls mainly on the heavy segment, while the light segment’s head start reflects gradual product penetration; the track’s 18-month threshold traversal is a joint product of the two, and our reading of the policy displacement stays restrained accordingly. The deterioration of the aggregated track’s pre-trend partly reflects the light segment’s early conversion—both a reason the parallel-trends check fails and a marker locating the displacement interpretation on the heavy stock segment. Table 5 summarizes the milestones.
Table 5.
Diffusion milestones by track, monthly full-population registration data, 2000–2026.
4.2. Parking Structure and the Charging Divide
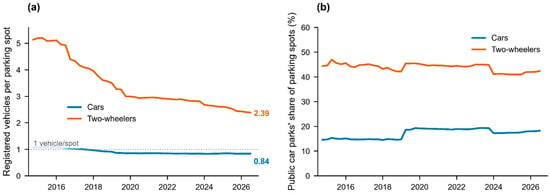
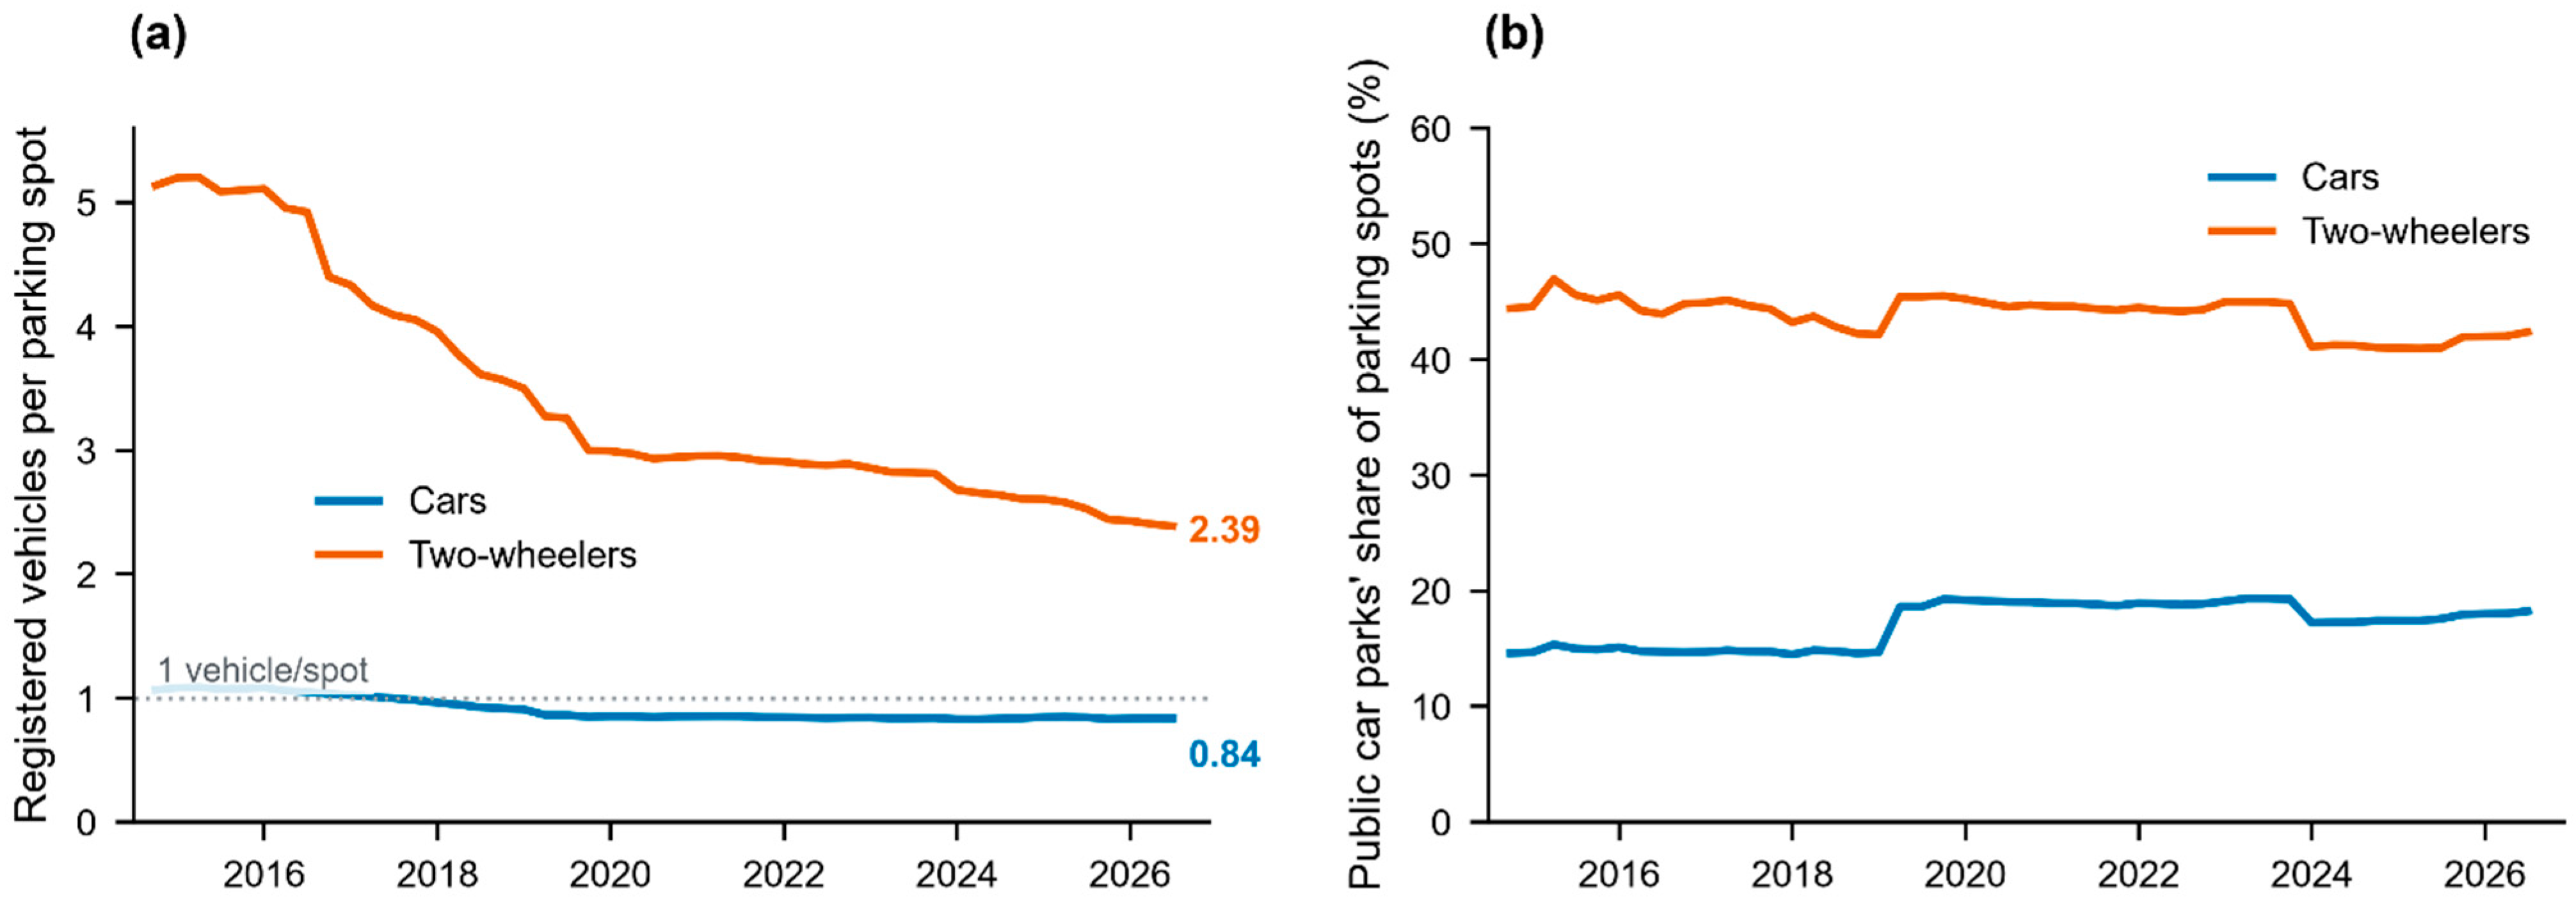
How much each track relies on public charging is hypothesized to be rooted in the parking endowment it faces. Panel (a) of Figure 3 shows that in 2014Q3 each registered parking spot corresponded to 1.07 cars (about 0.93 spots per car); parking supply then outgrew the fleet, and by 2026Q2 the ratio had fallen to 0.84 vehicles per spot—parking spots (155,394) now outnumber the car stock (about 131,000). Two-wheelers remained in shortage throughout: vehicles per spot fell from 5.14 to 2.39, an improvement but still more than double the spot count in 2026. Use composition widens the gap: public car parks hold only 18.2% of car spots, more than four-fifths sit in residential and commercial buildings, which is consistent with the physical conditions for private charging being widely available; 42.4% of two-wheeler spots are in public car parks, an ecology structurally reliant on public parking. Supply-side stagnation is equally visible: new two-wheeler parking spots in completed buildings reached 1753 in 2010, 2175 in 2019, and only 165 in 2024.
Figure 3.
Parking-structure asymmetry. (a) Registered vehicles per parking spot; (b) public car parks’ share of parking spots. Note: in panel (a), the horizontal dotted line indicates parity at one registered vehicle per available parking spot.
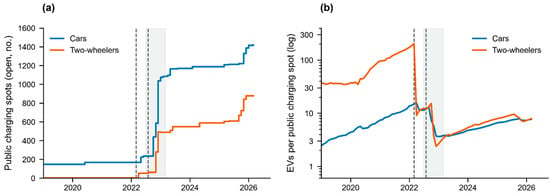
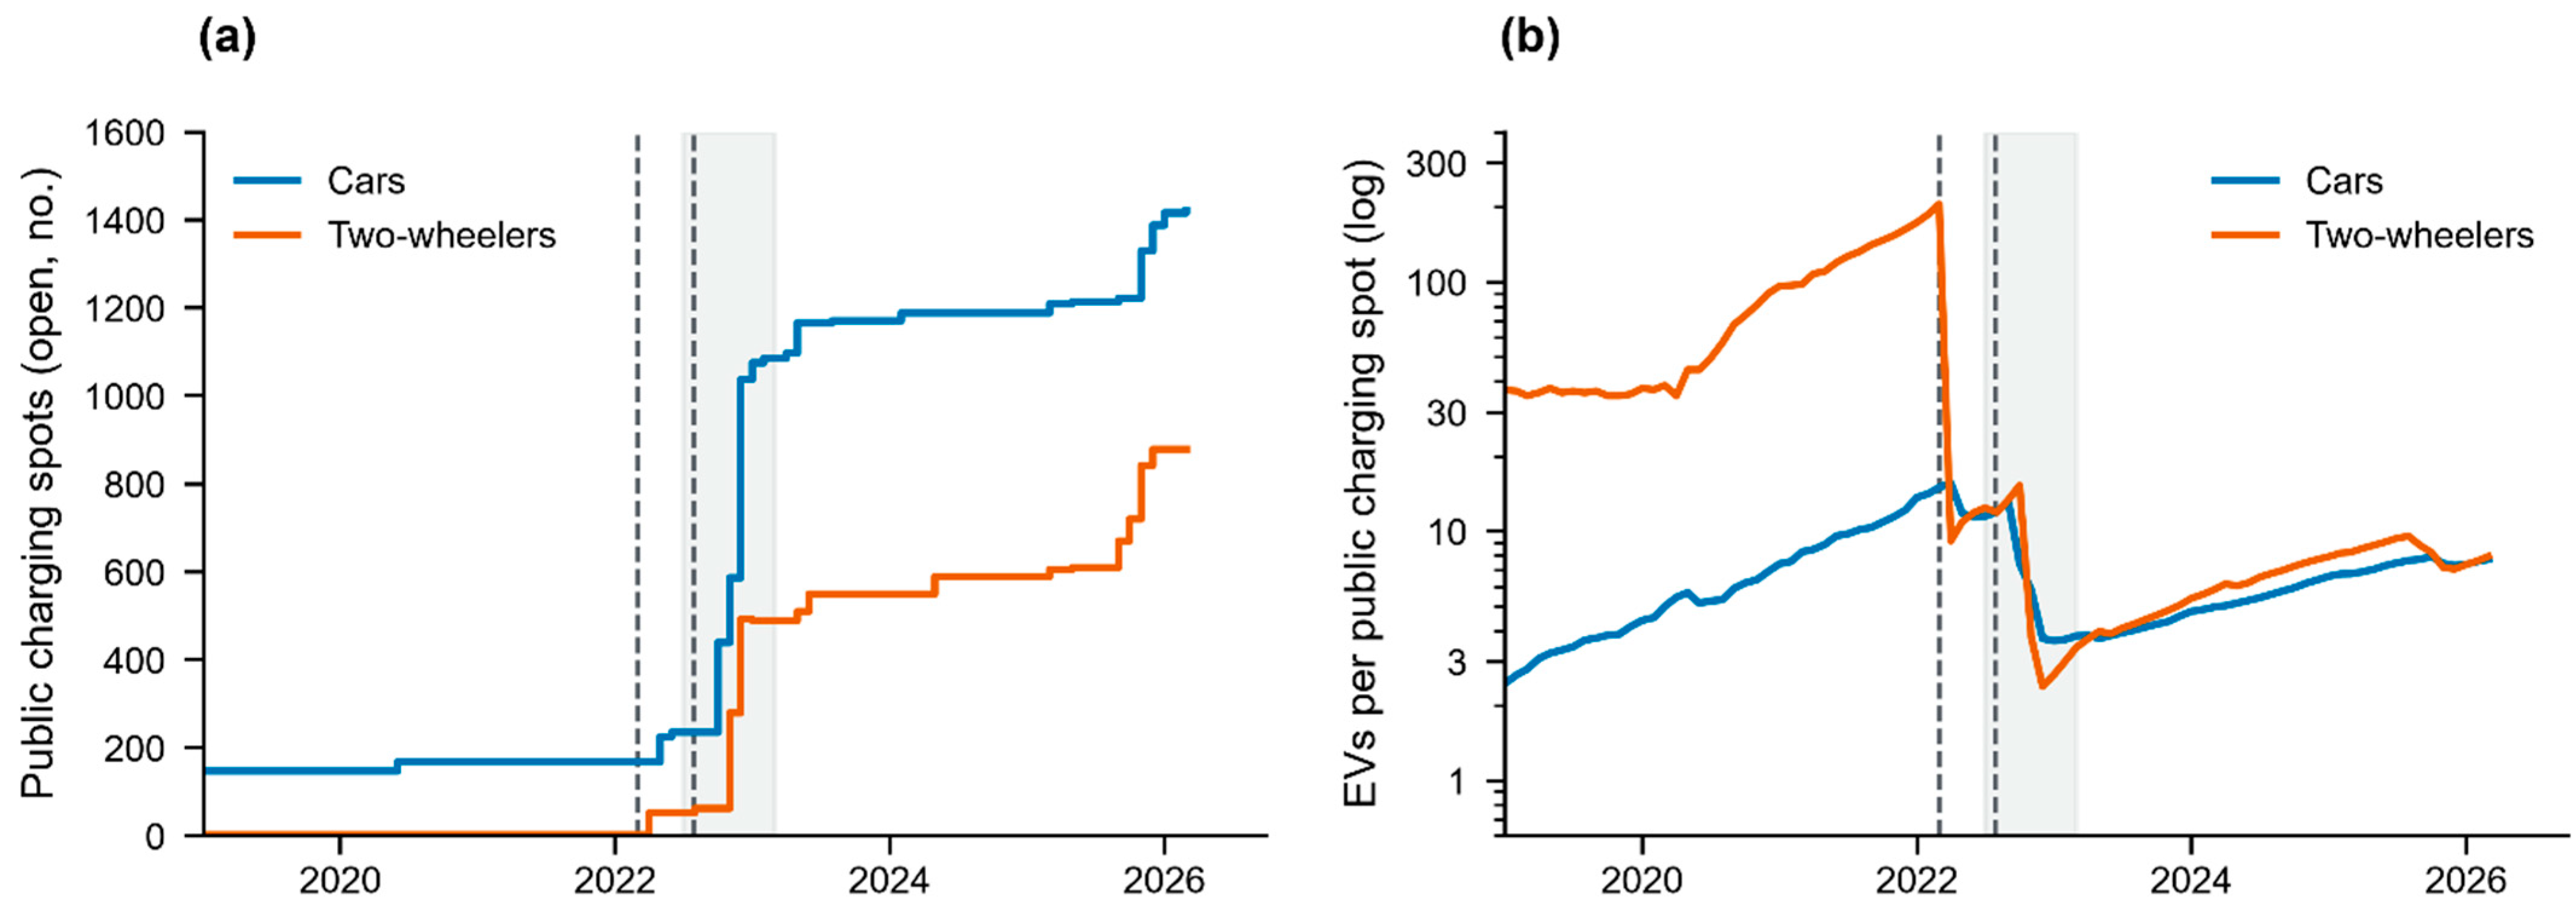
Panel (a) of Figure 4 gives the expansion path: car charging spots grew from 148 in early 2019 to 1421 in March 2026, two-wheeler spots from 2 to 878, with the bulk added between mid-2022 and early 2023. Relative to public car-park parking spots, charger penetration rose from 0.60% to 5.09% for cars and from 0.01% to 4.06% for two-wheelers (the numerator excludes Municipal Affairs Bureau car parks while the denominator includes them, so levels are slightly understated without affecting trends or the two-track contrast). The EV-per-spot ratio in panel (b) captures the race between infrastructure and fleet: cars peaked at 15.6 EVs per spot in April 2022 and eased to 7.7; two-wheelers spiked to an extreme of 205.5 in March 2022 before the build-out brought the ratio down to 7.9. Both peaks straddle the policy quarter, suggesting that what the build-out relieved was an already taut constraint. This structural reading is consistent with European survey evidence that private charging availability shapes readiness to buy [11]; we summarize it as a hypothesized mechanism chain: parking endowment plausibly shapes the charging mode, and the charging mode plausibly shapes the track’s sensitivity to public-infrastructure expansion; parking spots do not themselves establish charger installation, electrical capacity, or access, so the chain awaits charging-access and utilization data for direct validation.
Figure 4.
Public charging-spot expansion and EVs per charging spot. (a) Cumulative public charging spots “in open use”; (b) EVs per spot (log scale). Note: in panel (a), two-wheeler spots remained at 2 through March 2022 before expanding to 52 in April 2022; the early segment closely tracing the horizontal axis reflects this actual historical magnitude. The vertical dashed lines and the shaded band correspond to the policy and build-out timelines defined in Figure 1.
Appendix A Table A3 provides the endpoint comparison. Between 2014Q3 and 2026Q2, car parking spaces expanded from 105,634 to 155,394, with the public share edging up from 14.6% to 18.2%. Over the same period, two-wheeler spaces grew from 23,926 to 51,776, while their public share remained steady at roughly 40% (minor official reporting discrepancies in recent quarters do not alter these trends).
4.3. Lead–Lag Evidence and the Policy Shift
Table 6 reports the battery, with the unfiltered log-growth pairing as the primary specification. On the two-wheeler track, the Granger test rejects non-causality from charging-spot expansion to fleet growth at lag 1 (p = 0.030 raw, p = 0.028 detrended), and the reverse direction does not reject (p = 0.172 and 0.876), indicating a unidirectional precedence. The unfiltered distributed-lag regression times the effect—charging-spot growth occurs significantly at the contemporaneous and first lag (+0.027 and +0.032, both p < 0.001; joint p < 0.001), with a cumulative effect of +0.074 (95% CI +0.011 to +0.138). In economic terms, a 10% month-on-month expansion of the charging network associates with roughly 0.7% additional two-wheeler EV stock growth within four months, and the pattern persists under seasonal adjustment (joint p = 0.008), right-aligned detrending (p = 0.021), and the filtered (seasonally adjusted + detrended) variant of Table 6 (p = 0.040). Excluding the concentrated build-out window (July 2022 to March 2023) or the five largest expansion months leaves the joint test significant (p < 0.001 in each case), though the cumulative point effect becomes imprecise once the largest expansion months are removed (95% CI −0.51 to +0.22): the effect magnitude is identified chiefly by the 2022 episodes, which is where the policy variation sits, and we scale the claim to a detectable precedence pattern rather than a precise magnitude. Excluding those months from the lag-1 Granger test likewise renders it insignificant (p = 0.407), consistent with the identifying variation residing in the 2022 episodes, as the subsample rows already indicate. On the car track, the monthly pairwise tests are all insignificant (in quarterly aggregation, its reverse lag-2 reaches p = 0.053, borderline). The joint test is significant in both the unfiltered (p = 0.038) and the filtered (p = 0.017, sign-alternating) variants of Table 6, but this reflects a population mismatch—the public charging series covers light cars only—so we re-align the vehicle side to light cars, which renders the joint test insignificant (p = 0.15; cumulative −0.02, 95% CI −0.06 to +0.01). The reverse direction becomes significant in the raw pairing (light-EV growth preceding expansion, p = 0.006) but is entirely concentrated in the five largest build-out months (excluding them, p = 0.971), consistent with reactive build-out rather than a steady lead–lag structure. Estimating the two equations jointly as seemingly unrelated regressions (cross-equation residual correlation: 0.11) cannot reject equality of the cumulative charging response across tracks (χ2(1)=1.83, p = 0.18; likewise non-rejected in the filtered variant, p = 0.36): the asymmetry rests on where a stable, same-signed pattern is detectable. The two-wheeler track’s individually significant contemporaneous and first-lag terms against the car track’s sign-alternating, individually insignificant terms, not on a demonstrable difference in response magnitude. Set side by side, precedence appears only on the track plausibly dependent on public charging—matching the parking-structure hypothesis proposed earlier. Because Breusch–Godfrey tests [30] detect residual autocorrelation beyond lag 4 in these regressions (Appendix A Table A1), all headline tests are re-examined with HAC-robust Wald statistics: the two-wheeler charging-to-fleet direction shifts from p = 0.030 to below 0.001 under bandwidths of 4 and 8 lags and under autoregression-enriched specifications (two-wheelers p < 0.001; cars p = 0.078, direction unchanged). The reverse direction remains insignificant (p ≥ 0.15), and the car track remains insignificant in both directions under the HAC-robust construction (Appendix Table A4 reports the complete coefficient outputs).
Table 6.
Lead–lag tests between public charging-spot expansion and EV fleet growth, January 2019–March 2026.
After seasonal adjustment, the two-wheeler lag-1 test weakens to p = 0.186; the two subsamples that split in December 2022 give p = 0.092 and p = 0.197; and quarterly aggregation is likewise insignificant. The pattern is consistent with identifying variations concentrated around the 2022 build-out and equally compatible with insufficient power in small subsamples (n = 35 and 26). Against the German monthly evidence [12], where charging availability mattered positively but modestly and speed mattered more than plug counts, what we found stronger unidirectional precedence on the two-wheeler track; the contrast track shows that when private charging is plausibly widely available, public expansion and fleet growth show no stable monthly link once the vehicle population is aligned to the light-car charging network.
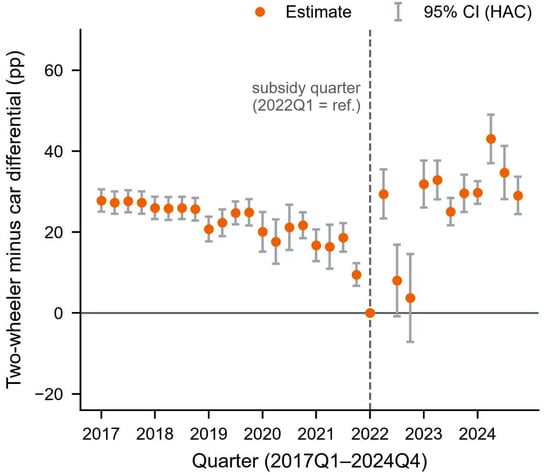
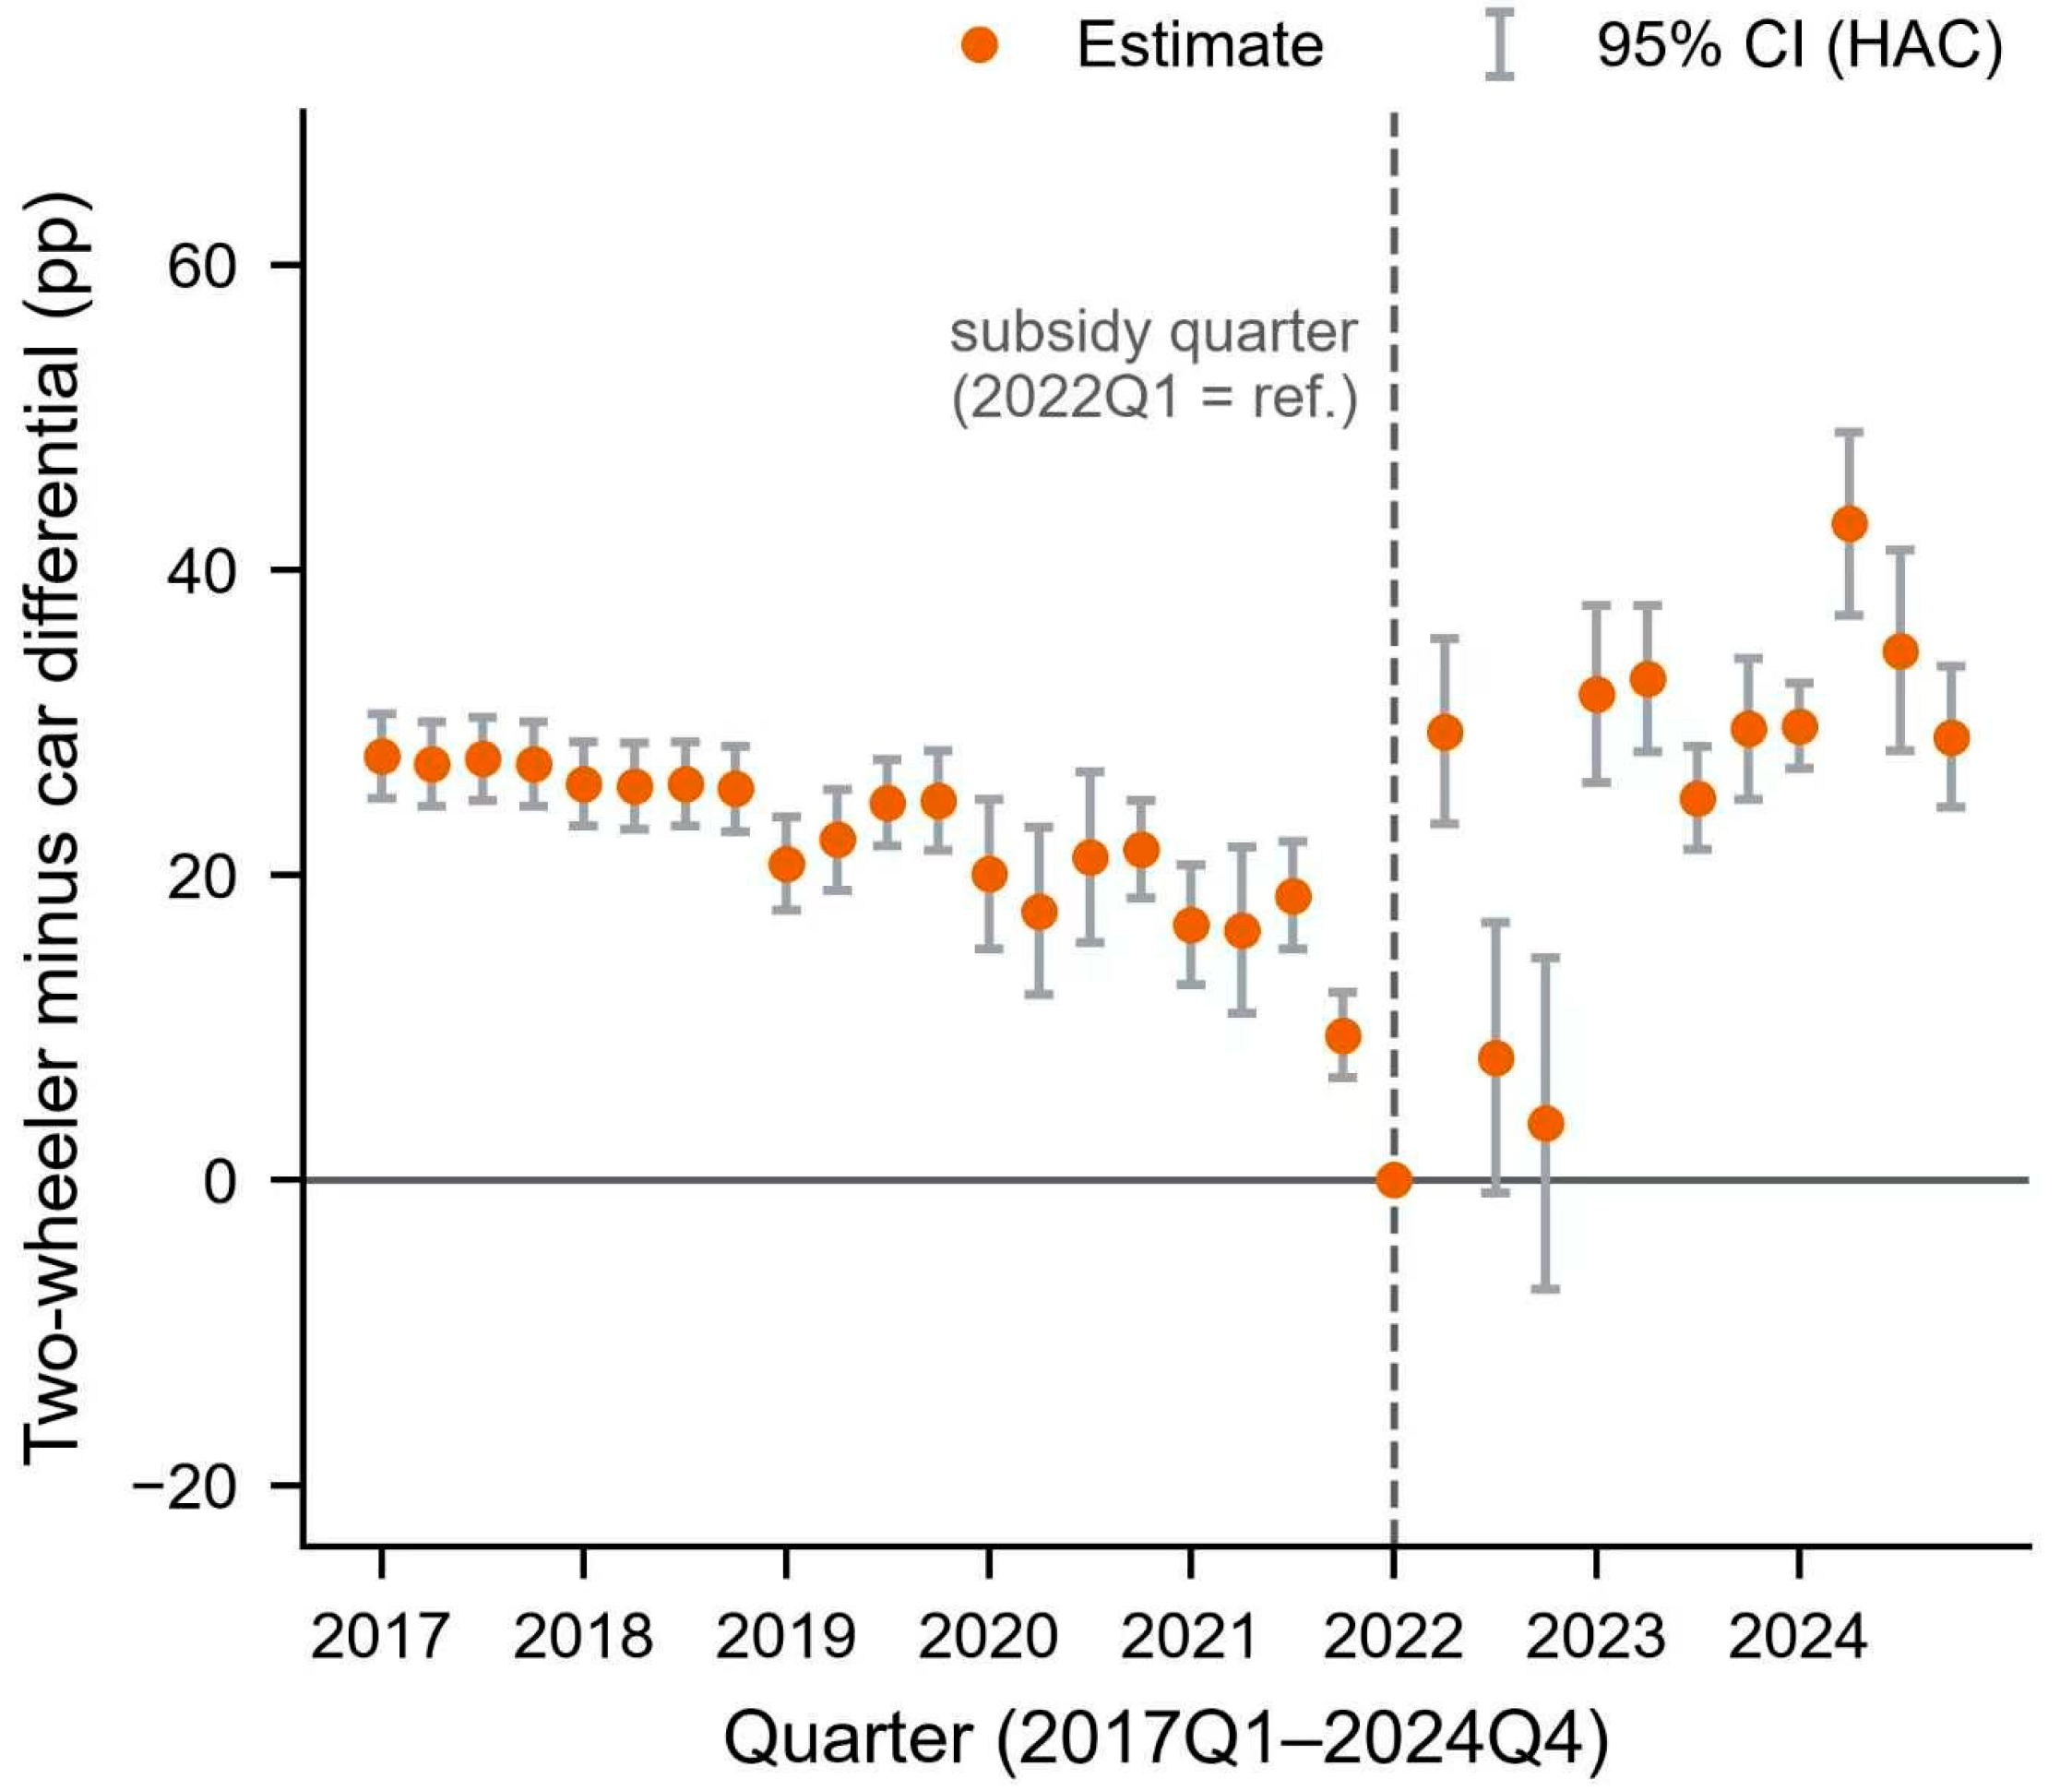
Two complementary descriptive lines characterize the timing of the 2022 package; neither carries structural causal identification (Appendix A Table A2). The first is the event study (Figure 5). Relative to the 2022Q1 reference, the two-wheeler-minus-car share differential deteriorated for five years to reach its trough at the subsidy quarter (+27.8 pp in 2017 to baseline). It then surged to +29.4 pp in 2022Q2 (95% CI [+23.4, +35.5]), briefly receded in Q3–Q4 to levels indistinguishable from the reference, and climbed steadily from 2023Q1 onward (+25 to +43 pp, with every quarterly interval excluding zero). This surge–settle–climb trajectory aligns closely with the completion of the charging build-out (reaching 490 motorcycle spots in January 2023) no worse than with the initial subsidy launch. Because pre-reference Q1-to-Q2 movements averaged near zero (−0.4 pp), differential seasonality cannot account for the Q2 jump. Furthermore, as documented in Appendix A Table A2, conventional difference-in-differences designs produce spurious significance during quiet placebo periods, confirming that empirical focus applies to these dynamic diffusion-speed shifts rather than static level breaks.
Figure 5.
Event study: quarterly dynamics of the two-wheeler-minus-car share differential. Note: error bars denote 95% confidence intervals constructed using Newey–West HAC standard errors (4 lags). The vertical dashed line indicates the subsidy launch quarter (2022Q1), which serves as the reference period.
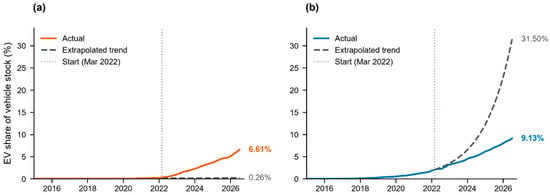
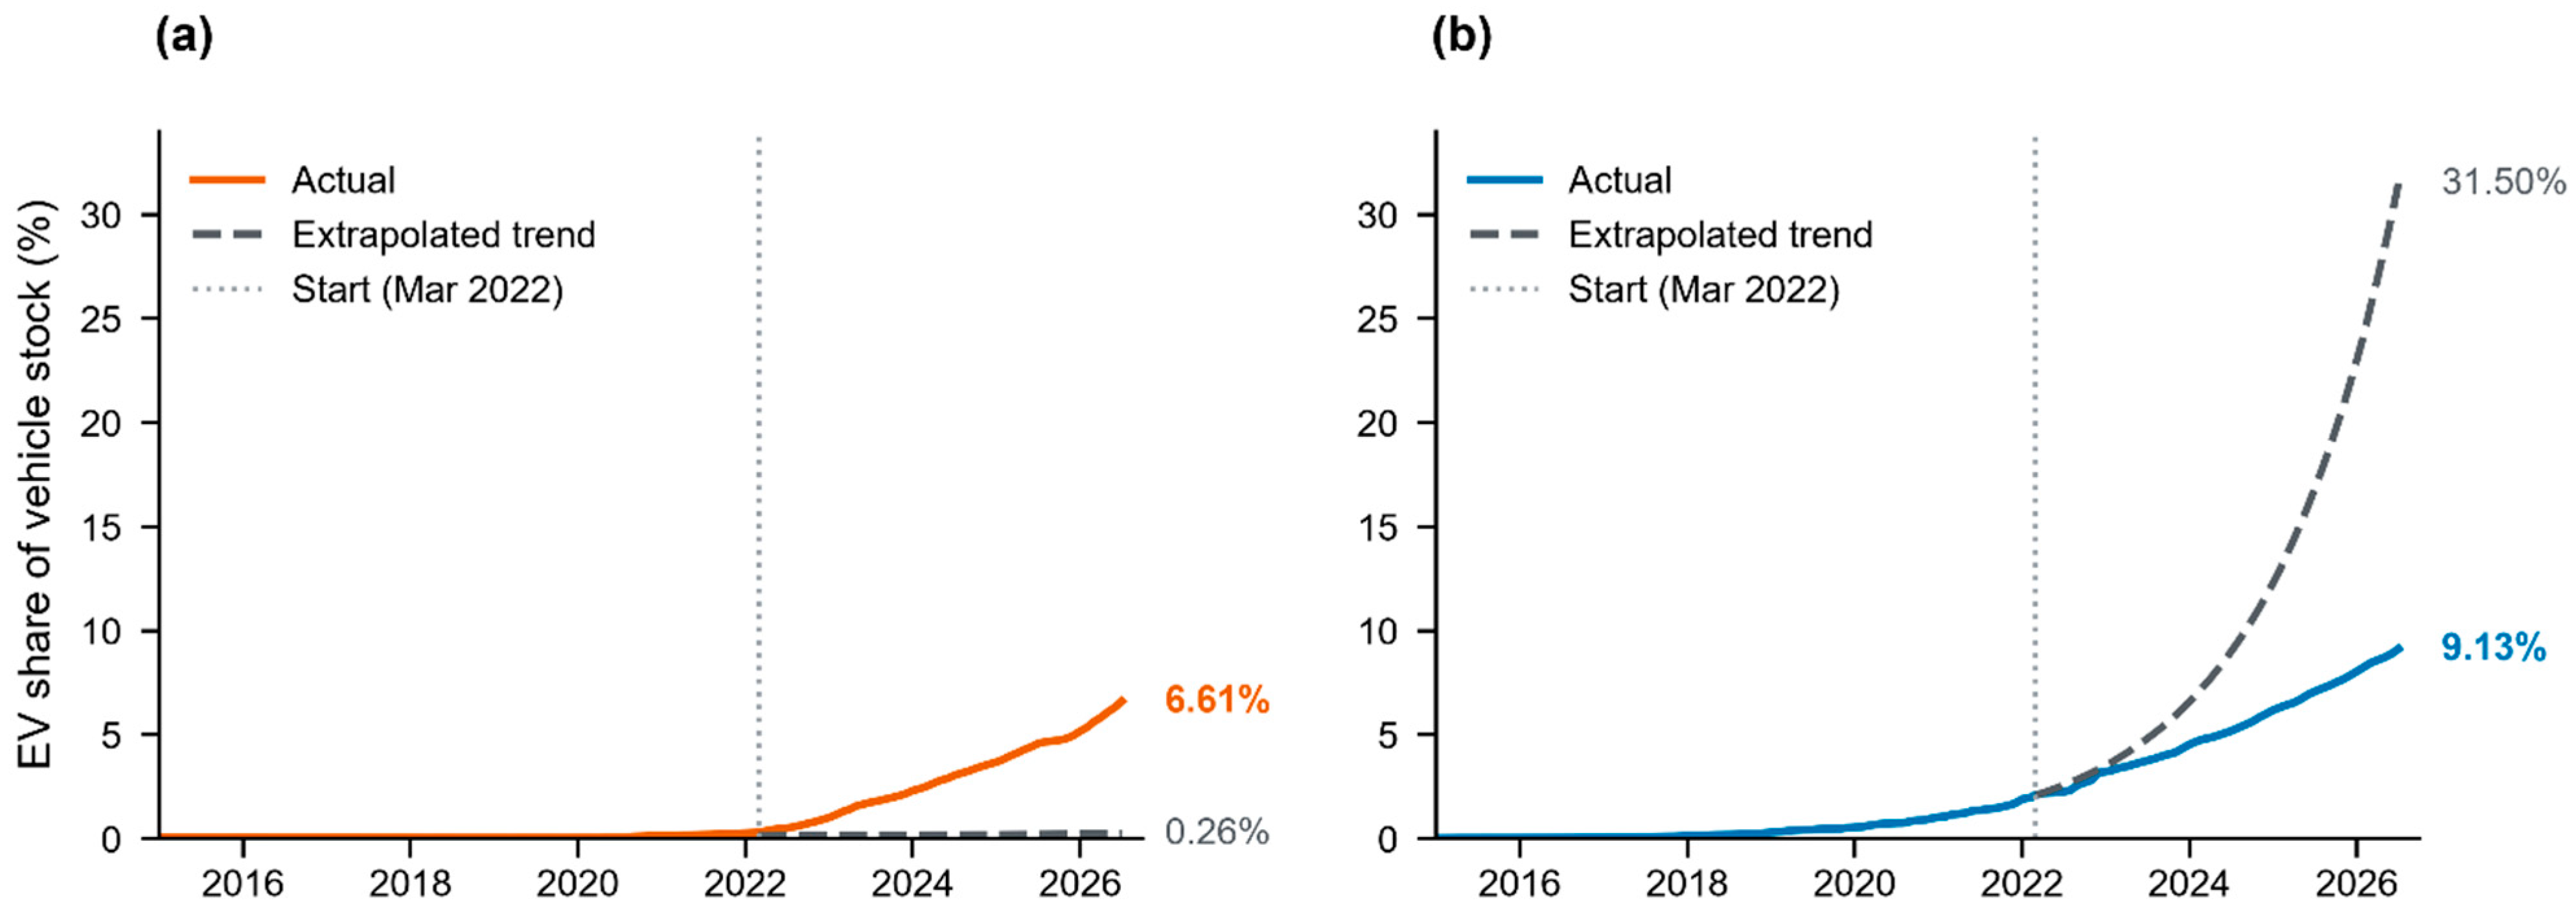
The second line examines counterfactual trends (Figure 6). Prior to 2022, the two-wheeler log trend grew at just +1.23% monthly (fit quality: 0.44), reflecting virtual stagnation; the actual stock share of 6.61% by July 2026 far outstrips the extrapolated 0.26%, indicating an adoption surge well beyond baseline projections. Conversely, the car track was already expanding exponentially at +5.36% monthly (fit quality: 0.99) before 2022, and its actual 9.13% value falls below the 31.5% linear extrapolation—a pattern consistent with natural saturation along an S-curve. The two-wheeler excess is robust to the fitting window: under five windows spanning start dates 2015–2019 and end dates December 2019, June 2021, and February 2022, the actual July 2026 share exceeds the 95% prediction interval of the pre-policy trend in every case, whereas the specific catch-up horizon ranges from 11 months to unbounded as the window varies. The car track lies below its interval’s lower bound in all windows, so both extrapolations are unstable and the two-track contrast rests on direction rather than point accuracy. Bounded diffusion benchmarks fitted over the same pre-policy window tell the same directional story: logistic projections with fixed ceilings (25–100%) put the two-wheeler 2026 level at 0.26% and the car level at 14–24%, against actuals of 6.6% and 9.1%. A pre-policy hold-out check tempers the exercise: the two-wheeler log-linear fit is already miscalibrated in the 2021–2022 hold-out (0 of 14 months inside the 95% interval, reflecting the light-segment acceleration that began before the policy), whereas the car fit is well-calibrated (14 of 14). The counterfactual is therefore a transparent descriptive benchmark, not a forecast. Because the two series reflect fundamentally distinct baseline diffusion stages and fit qualities, we evaluate their shifts in trajectory qualitatively without imposing a combined causal difference estimate.
Figure 6.
Counterfactual diffusion trends across vehicle classes. (a) Two-wheelers; (b) cars. Note: dashed lines represent counterfactual extrapolations based on pre-2022 log-linear trends projected from March 2022 onward; the vertical dotted line indicates the extrapolation cutoff. Both panels share an identical vertical scale to facilitate direct visual comparison.
Read together, the three strands of evidence amount to this: the two-wheeler track shows a clear upward shift in diffusion and infrastructure precedence around the subsidy and build-out, while the car track shows no monthly sensitivity to public charging. Allowing for the partial overlap of subsidy and build-out in time, the more defensible statement is that the two formed a policy package with distinguishable timing—the subsidy started demand first, the build-out relieved the charging constraint within months, and their combined force on the two-wheeler track contrasts with the calm on the car track.
5. Discussion
5.1. From Adoption Intentions to Adoption Dynamics: Positioning in the Two-Wheeler Literature
The first set of findings moves the dominant evidence format of electric two-wheeler research one step forward. The contribution is empirical—single-city, dual-track, full-population administrative data in one policy environment—rather than methodological, as the toolkit (threshold crossings, event study, Granger tests, distributed-lag models, and trend extrapolation) is standard and draws its value from the rarely observed comparison environment. The existing literature centers on intentions and preferences: discrete-choice studies in Vietnam and India identify the roles of purchase cost, usage cost, range, and charging accessibility in adoption intentions [1,2]; evidence on conversion barriers and willingness to pay places swap costs at the core of the decision [6]; and a Macao attitude study finds environmental concern and status-display motives shaping purchase intentions [15,31]. What the intention research answers is “whether people are willing”; what our full-population registration series answers is “when it happens and how fast.” Joining the two yields a proposition worth testing: the barrier structure that intention research identifies is more likely to constrain the take-off date than the post-threshold speed at the city level—once past the threshold, the two-wheeler track covered the same threshold band in half the car track’s time. Heterogeneity within the two-wheeler track refines the point. Light electric two-wheelers approached completed conversion before the policy package; what started in line with the subsidy was the heavy-stock majority, whose internal-combustion stock fell by about 1900 vehicles per year in 2024–2025. The segment with accessible product supply converted on its own; stock replacement needed the joint trigger of policy and infrastructure. What the city-level data show is segmented unlocking rather than a single threshold—a direction consistent with the segmented-adoption perspective [32], and one that extends the interpersonal-diffusion mechanism of early adopters [33] into the stock-replacement phase it does not cover. In the two-wheeler context, the swap-cost structure is more likely than word of mouth to explain post-threshold speed, a reading offered as testable rather than proven.
5.2. The Conditionality of Charging Infrastructure’s Precedence: A Hypothesis to Be Tested
The second set of findings stands in a complementary relationship to the German monthly evidence [12], and setting the two side by side brings a conditional interpretation into focus. The German ZIP-code panel study of the four-wheel market found that public charging availability matters positively but modestly, with consumers caring more about charging speed than about plug counts; we find unidirectional precedence on the two-wheeler track and no stable monthly link on the car track under the light-car alignment. The three results fit one conditional framework: the precedence of public charging depends on the parking and charging ecology of the marginal adopter. In the German car market, private charging was becoming widespread and public expansion carried limited marginal information. In Macao’s car track, private conditions are widely available (0.84 vehicles per spot, more than four-fifths private), so public expansion plausibly carries no marginal information for the purchase decision. Macao’s two-wheelers, at 2.39 vehicles per spot with about two-fifths in public car parks, plausibly face public charging as a binding enabler. From this, we advance a mechanistic conjecture: where a four-wheel market’s marginal adopters include a substantial share of urban residents without a fixed parking space, public charging expansion will carry marginal information for adoption. The conjecture is consistent with European survey evidence on the foundational role of private charging availability [11] and with nonlinear-Granger evidence of two-way interaction between charging infrastructure and vehicle adoption in U.S. metro areas [14]; its direct test requires individual-level parking and charging data and is left to future work. We restate the evidence grade here: lead–lag is temporal precedence, and the subsidy and the build-out overlap in time. Separating their independent contributions requires observations in which they arrive out of sync.
5.3. Policy-Package Sequencing, Tool Complementarity, and Demand Planning
The third evaluation speaks to policy design. Macao’s 2022 experience was a policy package with distinguishable timing: the subsidy led by roughly one quarter and the fees and the build-out followed within months. The event study shows the differential bottoming out at the subsidy quarter and rebounding the next, and the counterfactual trend shows the subsequent path outside the 95% prediction intervals of every pre-policy fit examined (five windows), with the pre-policy miscalibration disclosed in Section 4.3. The relative contributions of the two instruments cannot be separated, but the “support demand first, relieve the constraint next” sequencing is itself a replicable design variable, echoing modeling results that charging investment and purchase subsidies are complementary rather than substitutes [9]. The symmetric risk of subsidy dependence belongs in the same ledger. Synthetic-control evidence shows a sizable adoption drop when purchase subsidies terminate in a four-wheel market [34]; if a similar dependence exists for two-wheelers, the pacing of withdrawal and the backfilling of infrastructure will determine how much of the transition survives. The October 2025 launch of the second-round subsidy provides a relevant observation window; however, analyzing its registration-timing effects and causal impacts lies beyond the scope of our data and is left for future research. For demand planning, the coexistence of a fast flow transition and a slow stock transition—stock shares below one-tenth in mid-2026—argues for sizing charging infrastructure on the evolution of the stock rather than on new-registration shares. Equal penetration across the two networks (5.09% against 4.06%) with precedence appearing only on the two-wheeler track suggests that, in two-wheeler-heavy cities with predominantly public parking, the adoption return on directing marginal public investment to the two-wheeler charging network may be higher—a proposition awaiting cost and effect-size data for the two networks. The equity dimension deserves equal priority; if build-out concentrates in advantaged locations, the distribution of electrification’s benefits may stratify along the spatial structure of the parking ecology [35]. The engineering side of such build-outs—charging-station siting co-optimized with traffic patterns and distribution-network operation [36,37]—consumes demand projections of precisely the stock-based kind motivated here.
5.4. Limitations and External Validity
Five limitations restrict this analysis. First, the external validity of a single-city study is limited, as the specific combination of parking endowment and policy measures cannot be directly transferred—though the underlying mechanism chain, where parking ecology plausibly shapes charging modes, is empirically testable. Second, the charging-spot data capture stock counts on an “in open use” basis without accounting for charging mode, power capacity, or utilization rates; thus, an increase in spot counts does not necessarily translate to a proportional expansion in service capability. Third, because the replacement subsidy and charging build-out overlapped in time, our empirical design cannot isolate their independent contributions and only characterizes the dynamic imprint of the joint policy package. Fourth, Granger tests and distributed-lag regressions capture temporal precedence rather than causality. The weaker statistical significance after seasonal adjustment and sample splitting implies that identifying variation is largely concentrated around the 2022 build-out, requiring all inferences to be contextualized within this evidence tier. Fifth, given that origin statistics are not disaggregated by vehicle class and implied electric deregistrations rely on very small early bases, our interpretations of supply and scrappage structures remain strictly descriptive.
6. Conclusions
This paper used Macao’s monthly full-population registration data for 2000–2026, together with official public-charging and parking series, to compare the electrification of electric cars and electric two-wheelers within a single policy environment. Three findings form a coherent story.
First, diffusion is asymmetric: the two-wheeler track covered the 5–25% threshold band in 18 months—less than half the 37 months required by cars—and thereafter maintained parity with cars, surpassing them in most months. Second, the underlying mechanism is asymmetric: cars benefit from an ample parking endowment that is over four-fifths private, whereas two-wheelers face a deficit of 2.39 vehicles per spot, with roughly two-fifths located in public car parks. This parking difference is consistent with a divide in charging modes. Third, the temporal precedence is asymmetric: charging-spot expansion precedes two-wheeler fleet growth, with effects concentrated within a zero-to-one-month horizon. In contrast, the car track shows no stable monthly link to public charging once aligned to light cars. The event study and counterfactual trends further show the two-wheeler share bottoming out and reversing in the policy quarter, with its subsequent path exceeding the prediction intervals of all pre-policy baseline fits—a descriptive benchmark rather than a forecast, as the pre-policy hold-out check in Section 4.3 demonstrates—while the car track follows the decelerating segment of a natural diffusion curve.
The external validity of these findings hinges on three institutional preconditions: a significant two-wheeler fleet share, a structural reliance on public parking, and a sequenced policy package pairing purchase incentives with charging infrastructure. Under these conditions, the evidence is consistent with public charging expansion enabling two-wheeler electrification, a mechanism that remains a hypothesis until validated by charging-access and utilization data, since parking endowment measures the availability of spaces rather than chargers. Altering any of these structural features warrants caution when extrapolating our conclusions to other urban contexts; the natural comparators are dense, two-wheeler-heavy cities with constrained private parking, where the parking-ecology precondition is likely binding, rather than car-dominant, low-density environments.
Author Contributions
Conceptualization, C.W.; methodology, Y.Y. (Yifen Yin); validation, Y.Y. (Yifen Yin); formal analysis, W.I.H.; investigation, Y.Y. (Yuanyuan Yu); data curation, W.I.H. and Y.Y. (Yuanyuan Yu); writing—original draft preparation, W.I.H.; writing—review and editing, Y.Y. (Yifen Yin), Y.Y. (Yuanyuan Yu) and C.W.; visualization, W.I.H.; supervision, C.W.; project administration, C.W. All authors have read and agreed to the published version of the manuscript.
Funding
This research received no external funding.
Data Availability Statement
The original data presented in the study are openly available in FigShare at https://doi.org/10.6084/m9.figshare.34096809.
Acknowledgments
Generative AI tools were used for language translation (Chinese to English) and text polishing. All research design, data analysis, interpretation of results, and substantive content are the authors’ own work.
Conflicts of Interest
The authors declare no conflicts of interest.
Abbreviations
The following abbreviations are used in this manuscript:
| DSEC | Statistics and Census Service |
| DSAT | Transport Bureau |
Appendix A
Table A1 completes the diagnostics battery for the lead–lag tests: augmented Dickey–Fuller (ADF) unit-root tests [27] and Engle–Granger co-integration tests [26] on the log-level and growth series, Breusch–Godfrey (BG) Lagrange-multiplier tests for residual autocorrelation [30] in the distributed-lag and VAR(1) equations, and HAC-bandwidth-robust Wald re-examinations of the direction tests. Residual autocorrelation beyond lag 4 is present in both tracks’ regressions—precisely the dependence the Newey–West covariance guards against—and under the robust Wald construction, every headline inference in Section 4.3 is unchanged, indeed strengthened, while the reverse and cross-track null results remain null.
Table A1.
Stationarity and residual-diagnostics battery for the lead–lag tests, January 2019–March 2026.
Table A2.
Contrast specifications for the event study and placebo tests, January 2017–December 2024 (n = 192).
Table A3.
Parking structure by track, quarterly, 2014Q3 and 2026Q2.
Table A4.
Complete distributed-lag regression outputs under alternative specifications (HAC, 4 lags; entries are coefficients with p-values in parentheses).
References
- Trung, N.T.; Urmee, T. Electrifying Vietnam’s streets: Identifying the determinants of electric two-wheelers uptake. Transp. Res. Part D Transp. Environ. 2024, 129, 104116. [Google Scholar] [CrossRef] [Scilit]
- Bhat, F.A.; Verma, A. Electric two-wheeler adoption in India—A discrete choice analysis of motivators and barriers affecting the potential electric two-wheeler buyers. Transp. Policy 2024, 152, 118–131. [Google Scholar] [CrossRef] [Scilit]
- Chakraborty, R.; Chakravarty, S. Factors affecting acceptance of electric two-wheelers in India: A discrete choice survey. Transp. Policy 2023, 132, 27–41. [Google Scholar] [CrossRef] [Scilit]
- Amedokpo, Y.T. Tracking early adoption of electric motorcycles: The mototaxi riders’ experience in Lome. Transp. Res. Part D Transp. Environ. 2024, 131, 104184. [Google Scholar] [CrossRef] [Scilit]
- Choi, S.; Kwak, K.; Yang, S.; Lim, S.; Woo, J. Effects of policy instruments on electric scooter adoption in Jakarta, Indonesia: A discrete choice experiment approach? Econ. Anal. Policy 2022, 76, 373–384. [Google Scholar] [CrossRef] [Scilit]
- Rizki, M.; Rossolov, O.; Susilo, Y.O. The barriers, determinants, and willingness-to-pay in electric motorcycle conversion (EMC) adoption. Energy Policy 2024, 195, 114361. [Google Scholar] [CrossRef] [Scilit]
- Huang, S.P.K.; Kuo, L.; Chou, K.-L. The impacts of government policies on green utilization diffusion and social benefits—A case study of electric motorcycles in Taiwan. Energy Policy 2018, 119, 473–486. [Google Scholar] [CrossRef] [Scilit]
- Kristoffersson, I.; Pyddoke, R.; Kristofersson, F.; Algers, S. Access to charging infrastructure and the propensity to buy an electric car. Transp. Res. Part D Transp. Environ. 2025, 139, 104588. [Google Scholar] [CrossRef] [Scilit]
- Liao, Y.J.; Luo, B.; Spiller, E. A tale of two investments: Charging stations and purchase subsidies for EV adoption. Transp. Res. Part A Policy Pract. 2025, 202, 104703. [Google Scholar] [CrossRef] [Scilit]
- Dhanshyam, M.; Srivastava, A.; Raj, A.; Bansal, P. Accelerating electric vehicle adoption in India: A system dynamics approach considering purchase and charging infrastructure subsidies. Transp. Res. Part A Policy Pract. 2026, 212, 105148. [Google Scholar] [CrossRef] [Scilit]
- Patt, A.; Aplyn, D.; Weyrich, P.; van Vliet, O. Availability of private charging infrastructure influences readiness to buy electric cars. Transp. Res. Part A Policy Pract. 2019, 125, 1–7. [Google Scholar] [CrossRef] [Scilit]
- Illmann, N.; Kluge, U. Public charging infrastructure and the market diffusion of electric vehicles. Transp. Res. Part D Transp. Environ. 2020, 86, 102413. [Google Scholar] [CrossRef] [Scilit]
- Alrasheedi, F.S.; Ali, H.H. A graph-theoretic approach for exploring the relationship between EV adoption and charging infrastructure growth. Vehicles 2025, 7, 54. [Google Scholar] [CrossRef] [Scilit]
- Afzal, H.; Hawkins, J. Electric vehicle and supply equipment adoption dynamics in the United States. Energy Policy 2024, 193, 114275. [Google Scholar] [CrossRef] [Scilit]
- Zhu, L.C.; Song, Q.B.; Sheng, N.; Zhou, X. Exploring the determinants of consumers’ WTB and WTP for electric motorcycles using CVM method in Macau. Energy Policy 2019, 127, 64–72. [Google Scholar] [CrossRef] [Scilit]
- Liu, Y.D.; Lai, I.K.W. The effects of environmental policy and the perception of electric motorcycles on the acceptance of electric motorcycles: An empirical study in Macau. SAGE Open 2020, 10, 2158244019899091. [Google Scholar] [CrossRef] [Scilit]
- Cai, R.J.; Li, L.; Lei, W.C. Are residents willing to pay for electric cars? An evolutionary game analysis of electric vehicle promotion in Macao. World Electr. Veh. J. 2024, 15, 371. [Google Scholar] [CrossRef] [Scilit]
- Song, Q.B.; Wu, Y.; Li, J.H.; Wang, Z.S.; Yu, D.F.; Duan, H.B. Well-to-wheel GHG emissions and mitigation potential from light-duty vehicles in Macau. Int. J. Life Cycle Assess. 2018, 23, 1916–1927. [Google Scholar] [CrossRef] [Scilit]
- Xu, X.K.; Han, L.Y. Operational lifecycle carbon value of bus electrification in Macau. Sustainability 2020, 12, 3784. [Google Scholar] [CrossRef] [Scilit]
- Bass, F.M. A new product growth for model consumer durables. Manag. Sci. 1969, 15, 215–227. [Google Scholar] [CrossRef] [Scilit]
- Uribe, S.; Morcillo, J.D.; Zapata, S. Modeling the diffusion of residential photovoltaic systems and electric vehicles: A comprehensive scenario-based analysis. Energy Rep. 2025, 14, 5718–5731. [Google Scholar] [CrossRef] [Scilit]
- Wu, Y.; Liu, Z.Y.; Wang, X.Y.; Yin, A.R.; Zhang, S.H. Research on new energy vehicle diffusion via multi-subsidy trade-in policy analysis. Transp. Res. Part D Transp. Environ. 2026, 159, 105540. [Google Scholar] [CrossRef] [Scilit]
- Köksal, M.A.; Tekeli, Ş.E.; Aksoy, S.A.; Kızıltan, A.; Kızıltan, M.; Duran, N.; Akış, K.B.; Güllü, G. Long term characterization of the vehicle stock in Turkey. Transp. Res. Part D Transp. Environ. 2021, 99, 102988. [Google Scholar] [CrossRef] [Scilit]
- Granger, C.W.J. Investigating causal relations by econometric models and cross-spectral methods. Econometrica 1969, 37, 424–438. [Google Scholar] [CrossRef] [Scilit]
- Newey, W.K.; West, K.D. A simple, positive semi-definite, heteroskedasticity and autocorrelation consistent covariance matrix. Econometrica 1987, 55, 703–708. [Google Scholar] [CrossRef] [Scilit]
- Engle, R.F.; Granger, C.W.J. Co-integration and error correction: Representation, estimation, and testing. Econometrica 1987, 55, 251–276. [Google Scholar] [CrossRef] [Scilit]
- Dickey, D.A.; Fuller, W.A. Distribution of the estimators for autoregressive time series with a unit root. J. Am. Stat. Assoc. 1979, 74, 427–431. [Google Scholar] [CrossRef] [Scilit]
- Zellner, A. An efficient method of estimating seemingly unrelated regressions and tests for aggregation bias. J. Am. Stat. Assoc. 1962, 57, 348–368. [Google Scholar] [CrossRef] [Scilit]
- Bertrand, M.; Duflo, E.; Mullainathan, S. How much should we trust differences-in-differences estimates? Q. J. Econ. 2004, 119, 249–275. [Google Scholar] [CrossRef] [Scilit]
- Godfrey, L.G. Testing against general autoregressive and moving average error models when the regressors include lagged dependent variables. Econometrica 1978, 46, 1293–1301. [Google Scholar] [CrossRef] [Scilit]
- Lampo, A.; Silva, S.C.; Duarte, P. The role of environmental concern and technology show-off on electric vehicles adoption: The case of Macau. Int. J. Emerg. Mark. 2025, 20, 561–583. [Google Scholar] [CrossRef] [Scilit]
- Cheranchery, M.F.; Binu, M.; Sujil, H.; Padannapilakkal, F.H. Time to adopt a segmented approach to accelerate electric car adoption in emerging economies? Evidences from Indian metro cities. Transp. Policy 2026, 181, 104083. [Google Scholar] [CrossRef] [Scilit]
- Seebauer, S. Why early adopters engage in interpersonal diffusion of technological innovations: An empirical study on electric bicycles and electric scooters. Transp. Res. Part A Policy Pract. 2015, 78, 146–160. [Google Scholar] [CrossRef] [Scilit]
- Creutzburg, C.; Doerr, L.M. The impact of purchase subsidy termination on electric vehicle adoption: A synthetic control approach. Transp. Res. Part A Policy Pract. 2026, 211, 105035. [Google Scholar] [CrossRef] [Scilit]
- Hopkins, E.; Potoglou, D.; Orford, S.; Cipcigan, L. Can the equitable roll out of electric vehicle charging infrastructure be achieved? Renew. Sustain. Energy Rev. 2023, 182, 113398. [Google Scholar] [CrossRef] [Scilit]
- Alizadeh, M.; Amani, A.M.; Meegahapola, L.; Jalili, M.; Hill, O. Optimal traffic-informed design and operation of EV charging stations in power distribution grids. IEEE Trans. Transp. Electrif. 2026, 12, 4375–4387. [Google Scholar] [CrossRef] [Scilit]
- Alizadeh, M.; Amani, A.M.; Meegahapola, L.; Jalili, M.; Hill, O. Optimal integration of EV charging stations into distribution network planning and operation. IEEE Trans. Ind. Inform. 2025, 21, 7120–7130. [Google Scholar] [CrossRef] [Scilit]

Disclaimer/Publisher’s Note: The statements, opinions and data contained in all publications are solely those of the individual author(s) and contributor(s) and not of MDPI and/or the editor(s). MDPI and/or the editor(s) disclaim responsibility for any injury to people or property resulting from any ideas, methods, instructions or products referred to in the content. |
© 2026 by the authors. Published by MDPI on behalf of the World Electric Vehicle Association. Licensee MDPI, Basel, Switzerland. This article is an open access article distributed under the terms and conditions of the Creative Commons Attribution (CC BY) license.