


Abstract
Failures in vehicle-to-vehicle (V2V) communication and millimeter-wave radar affect connected vehicle platoon operation. This study links an ISO 26262-oriented preliminary risk assessment and Hazard and Operability Study (HAZOP) to role-specific degraded control. Long-distance adaptive cruise control (ACC), variable-speed cruise control (CC), and fixed-speed CC are selected according to the remaining information. Evaluation combines a 16-condition PreScan-Simulink matrix, represented by 12 trajectory files with shared communication-case results, and electric micro-vehicle tests under externally supplied fault labels. Conditional gap and delay inequalities describe forward-clearance requirements under specified motion bounds. The records demonstrate mode switching and spacing responses under the tested conditions, with spacing-target shortfalls in simultaneous-loss bend cases. Each 20 m/s straight-road file contains an unresolved Vehicle 3 acceleration sample near −8.94 m/s2 at 20.01 s, and near-identical Vehicle 2 trajectories limit comparison between two cases. The supplied records support output reanalysis; complete controller reproduction and trial-level uncertainty remain unresolved. The results support implementation feasibility at the supervisory-control layer, with safety validation requiring verified motion bounds and end-to-end fault detection.
1. Introduction
Vehicle-to-Everything (V2X) technology has accelerated the development of vehicle platooning, and recent reviews continue to identify platooning as a promising way to improve traffic efficiency, reduce energy use, and enhance road safety [1]. Corridor-scale evaluation has also reported measurable energy and environmental benefits for truck platooning under realistic freight operations [2]. Experimental evidence further shows that a communication topology using the two vehicles immediately ahead can substantially improve traffic capacity and stability in connected autonomous platoons [3]. Recent evaluation studies have additionally compared platooning spacing policies from the perspectives of energy consumption, emission, and efficiency [4].
The safe operation of a platoon depends on reliable V2V communication and onboard perception. Balador et al. reviewed the wireless-communication requirements, standards, and open issues of cooperative truck platooning [5]. Chen et al. examined quantized-feedback cooperative driving for connected and automated vehicle (CAV) platoons under limited channel bandwidth, highlighting the need to balance communication-load reduction with car-following performance [6]. Zheng et al. developed a platooning system with guaranteed stability and robustness against degradation caused by communication disruption [7]. Li et al. designed a reliable cooperative control strategy to maintain platoon string stability under communication cyberattacks [8]. Liu et al. further showed that platoon maintenance strategies should explicitly account for communication failures [9].
In a cooperative adaptive cruise control (CACC) platoon, each following vehicle normally uses both self-state information and messages from surrounding vehicles to reduce time headway and improve string stability. Millimeter-wave radar provides local distance and relative-speed perception, while V2V communication provides motion states that are not directly observable by onboard sensors. The loss of either information source changes the control problem from coordinated platooning to degraded individual following, and the transition must be handled before the safety driver can intervene.
ISO 26262-3 describes item definition, hazard analysis and risk assessment, and the functional-safety concept [10]. This study uses that structure for preliminary design screening. Following the terminology in [11], fail-operational denotes continued nominal performance after a fault; fail-degraded denotes continued functionality at reduced performance while maintaining a safe state; fail-safe denotes discontinuing the intended function while reaching or maintaining a safe state. Here, the intended response retains longitudinal operation but sacrifices cooperative performance and compact spacing while requesting takeover. These objectives define the intended fail-degraded strategy. Its safety performance remains subject to the motion and switching limitations discussed in Section 2.5 and Section 4.
Recent work on diagnosis and tolerant control has improved degraded platoon operation. Wang et al. proposed periodic event-triggered fault detection for safe platooning control [12]. Lopes and Araujo developed an active fault diagnosis method for vehicles in platoon formation [13]. Viadero-Monasterio et al. designed a fault-tolerant robust output-feedback controller that explicitly considers measurement noise and road disturbances [14]. Gratzer et al. reported string-stable and collision-safe model predictive platoon control [15].
More recent studies have also addressed robustness under realistic imperfections. Wang et al. proposed a robust cooperative control strategy against simultaneous sensor and control errors in real-world driving environments [16]. Zhao et al. investigated adaptive fault-tolerant platoon control with prescribed tracking performance [17]. Shen et al. analyzed distributed platoon control under communication delays and packet dropouts [18]. Yang et al. studied robust platoon control with multiple-predecessor following topology under communication loss [19]. Shen et al. further examined cooperative spacing control over analog fading networks [20]. Thormann et al. studied safe and efficient cooperative platooning from a system-level perspective [21].
Recent studies have additionally considered real-time safety assessment and safe-spacing design. Sun et al. proposed a real-time evidence-aware safety assessment method for perception reliability [22]. Ma et al. analyzed time-headway selection for connected automated vehicle platoons under noisy V2V communication [23]. Wang et al. recently combined adaptive spacing policy with distributed sliding-mode control under communication interruption [24].
The present study focuses on the connection between preliminary hazard analysis and information-dependent fallback selection, including simultaneous V2V and radar loss. ISO 26262-3 and HAZOP provide the concept-phase and hazard-identification structures [10,25], respectively. It complements the diagnosis and controller-design approaches reviewed above.
In highway platooning, a failure can change the objective from compact cooperative following to a temporary degraded response pending takeover. The design objectives are increased spacing and limited acceleration variation. The selected controller must use information that remains available, and continued operation without external feedback requires an explicit bound on the duration and surrounding-vehicle motion.
For connected electric vehicles, the method operates at the platoon-management and longitudinal-reference layers: the available radar and V2V information determines the following controller and its reference. The electric micro-vehicle platform evaluates the connection between this supervisory logic and electric actuation.
This study extends the architecture and role-dependent ACC/CC fallback in [26] by linking hazardous information-loss cases to explicit degraded reference policies. Table S5 maps hazards to safety objectives and test cases; Section 2.5 describes policy selection from the remaining V2V and radar inputs; and Equations (1)–(7) define their references, errors and switching rules. Section 2.5.1 gives conditional spacing and delay bounds. Recorded spacing and acceleration responses and electric micro-vehicle switching cases provide the evaluation evidence. Table 1 identifies the inherited elements, while Table S9 compares the technical scope with representative methods. This qualitative comparison does not establish a performance improvement over [26] under matched conditions.
Table 1.
Relationship between prior work [26] and the present study.
2. Materials and Methods
2.1. Fail-Degraded Framework Construction
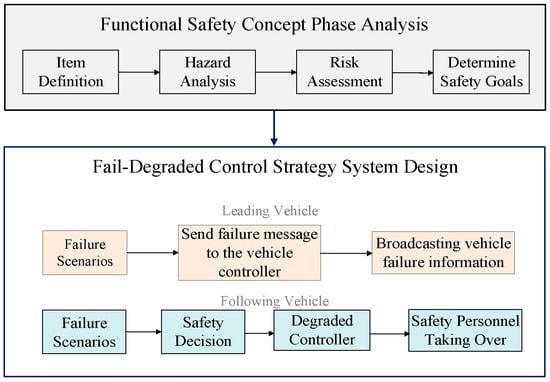
The framework combines preliminary functional-safety concept analysis with fail-degraded strategy design. Item definition, hazard identification, risk screening and safety objectives organize the design [10,25]. Remaining information then determines the longitudinal controller, as shown in Figure 1. This preliminary assessment guides the controller-selection objectives.
Figure 1.
Fail-degraded framework. Gray denotes functional-safety concept analysis; peach and light-blue boxes denote leading- and following-vehicle actions, respectively. The blue outline encloses strategy design, and the blue arrow links the two stages. Colors group the functions and vehicle roles.
2.2. Functional-Safety Analysis Outputs
Table 2 summarizes the analysis boundary. Supplementary Table S5 provides the event-level scenario, severity/exposure/controllability assumptions, conditional classification, safety objective and corresponding test coverage.
Table 2.
Preliminary functional-safety analysis and validation boundary.
The highest conditional classifications concern dry straight-road V2V loss and following-vehicle radar loss. These classifications motivate conservative fallback selection within the preliminary assessment.
The item definition in this study focuses on the longitudinal safety of a three-vehicle highway platoon. The leading vehicle is driven by a human driver, and the following vehicles execute automated longitudinal control. The relevant hardware components include the V2V communication unit, the millimeter-wave radar, the platoon controller, and the roadside unit used for failure injection in the experiment. The functional boundary covers longitudinal platoon driving and the degraded transition after a hardware failure.
The Hazard and Operability Study (HAZOP)-based hazard identification emphasizes deviations of information availability. For V2V communication, the primary deviation is loss of transmitted vehicle state information. For radar, the key deviation is loss of relative distance and relative speed to the preceding vehicle. These deviations may occur in the leading vehicle or in a following vehicle, and the safety impact of these deviations depends on the role of the failed vehicle. A failure in a following vehicle is generally more critical because it directly affects autonomous longitudinal control, whereas a leading-vehicle failure mainly affects the information available to the following vehicles.
The preliminary assessment uses severity (S), exposure (E) and controllability (C). Dry straight-road exposure is assumed to exceed 10% of operating time (E4), with 1–10% assumed for the other listed situations (E3). Severe collision consequences and difficult driver intervention in compact following motivate the stated S and C assumptions. These exposure and controllability assumptions remain unverified. Table S5 retains conditional classes for H1–H9 and H11. H10 and H12 are marked “Not assigned” because their severity and role-conversion speed assumptions, respectively, cannot be reconciled from the available descriptions. Their hazards and safety objectives remain in the assessment, without supporting a definite ASIL conclusion. The conditional classes do not establish verified controller safety capability.
The control architecture implements actions associated with these preliminary safety objectives. The manually driven leader broadcasts fault information only while its communication remains available. Following vehicles retain reduced longitudinal control and request a Dynamic Driving Task (DDT) fallback by the driver. The present tests supply known fault labels and do not evaluate autonomous fault diagnosis.
2.3. Vehicle Platoon Control Architecture
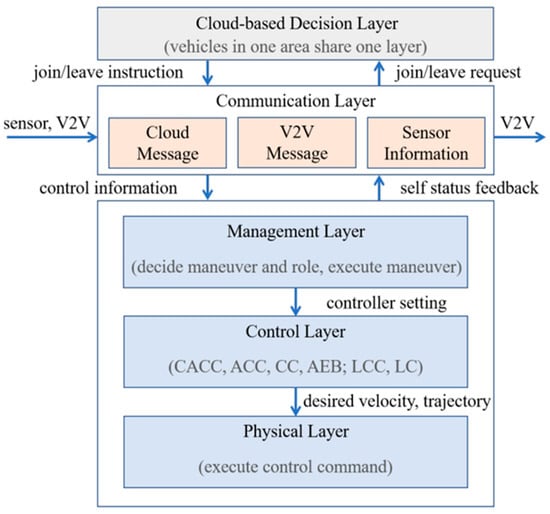
The inherited vehicle platoon architecture [26] contains five layers, as shown in Figure 2. The cloud-based decision layer provides traffic and management instructions; the communication layer exchanges V2V, cloud, and sensor messages; the management layer selects maneuvers, roles, and fail-degraded decisions; the control layer calculates desired velocity and trajectory through CACC, ACC, CC, automatic emergency braking (AEB), and lateral controllers; and the physical layer executes the commands. The present extension adds preliminary hazard-to-action mapping and explicit degraded reference policies to this architecture.
Figure 2.
Vehicle platoon software system architecture, adapted from [26]. Gray denotes cloud-based decision-making, peach denotes communication message categories, and light blue denotes the management, control and physical layers. Blue arrows show information or command flow; colors distinguish architectural roles.
SG1–SG4 concern collision prevention after following-vehicle V2V loss, leading-vehicle V2V loss, following-vehicle radar loss, and radar-impaired leading-to-following role conversion, respectively. SG5 adds the objective of managing simultaneous V2V/radar loss in a follower by a limited temporary speed fallback and takeover request; no separate ASIL is assigned to this added case. The validation cases are leading-vehicle communication failure, following-vehicle communication failure, following-vehicle radar failure, and simultaneous V2V/radar failure in a follower. Leading-vehicle radar failure, leading-vehicle simultaneous loss, and several weather/ramp hazards in Table S5 are outside the validation scope.
2.4. Leading-Vehicle Fail-Degraded Strategy
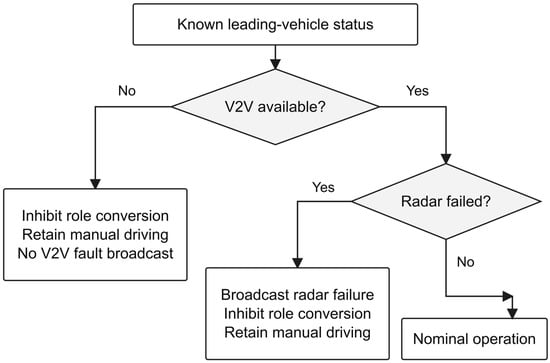
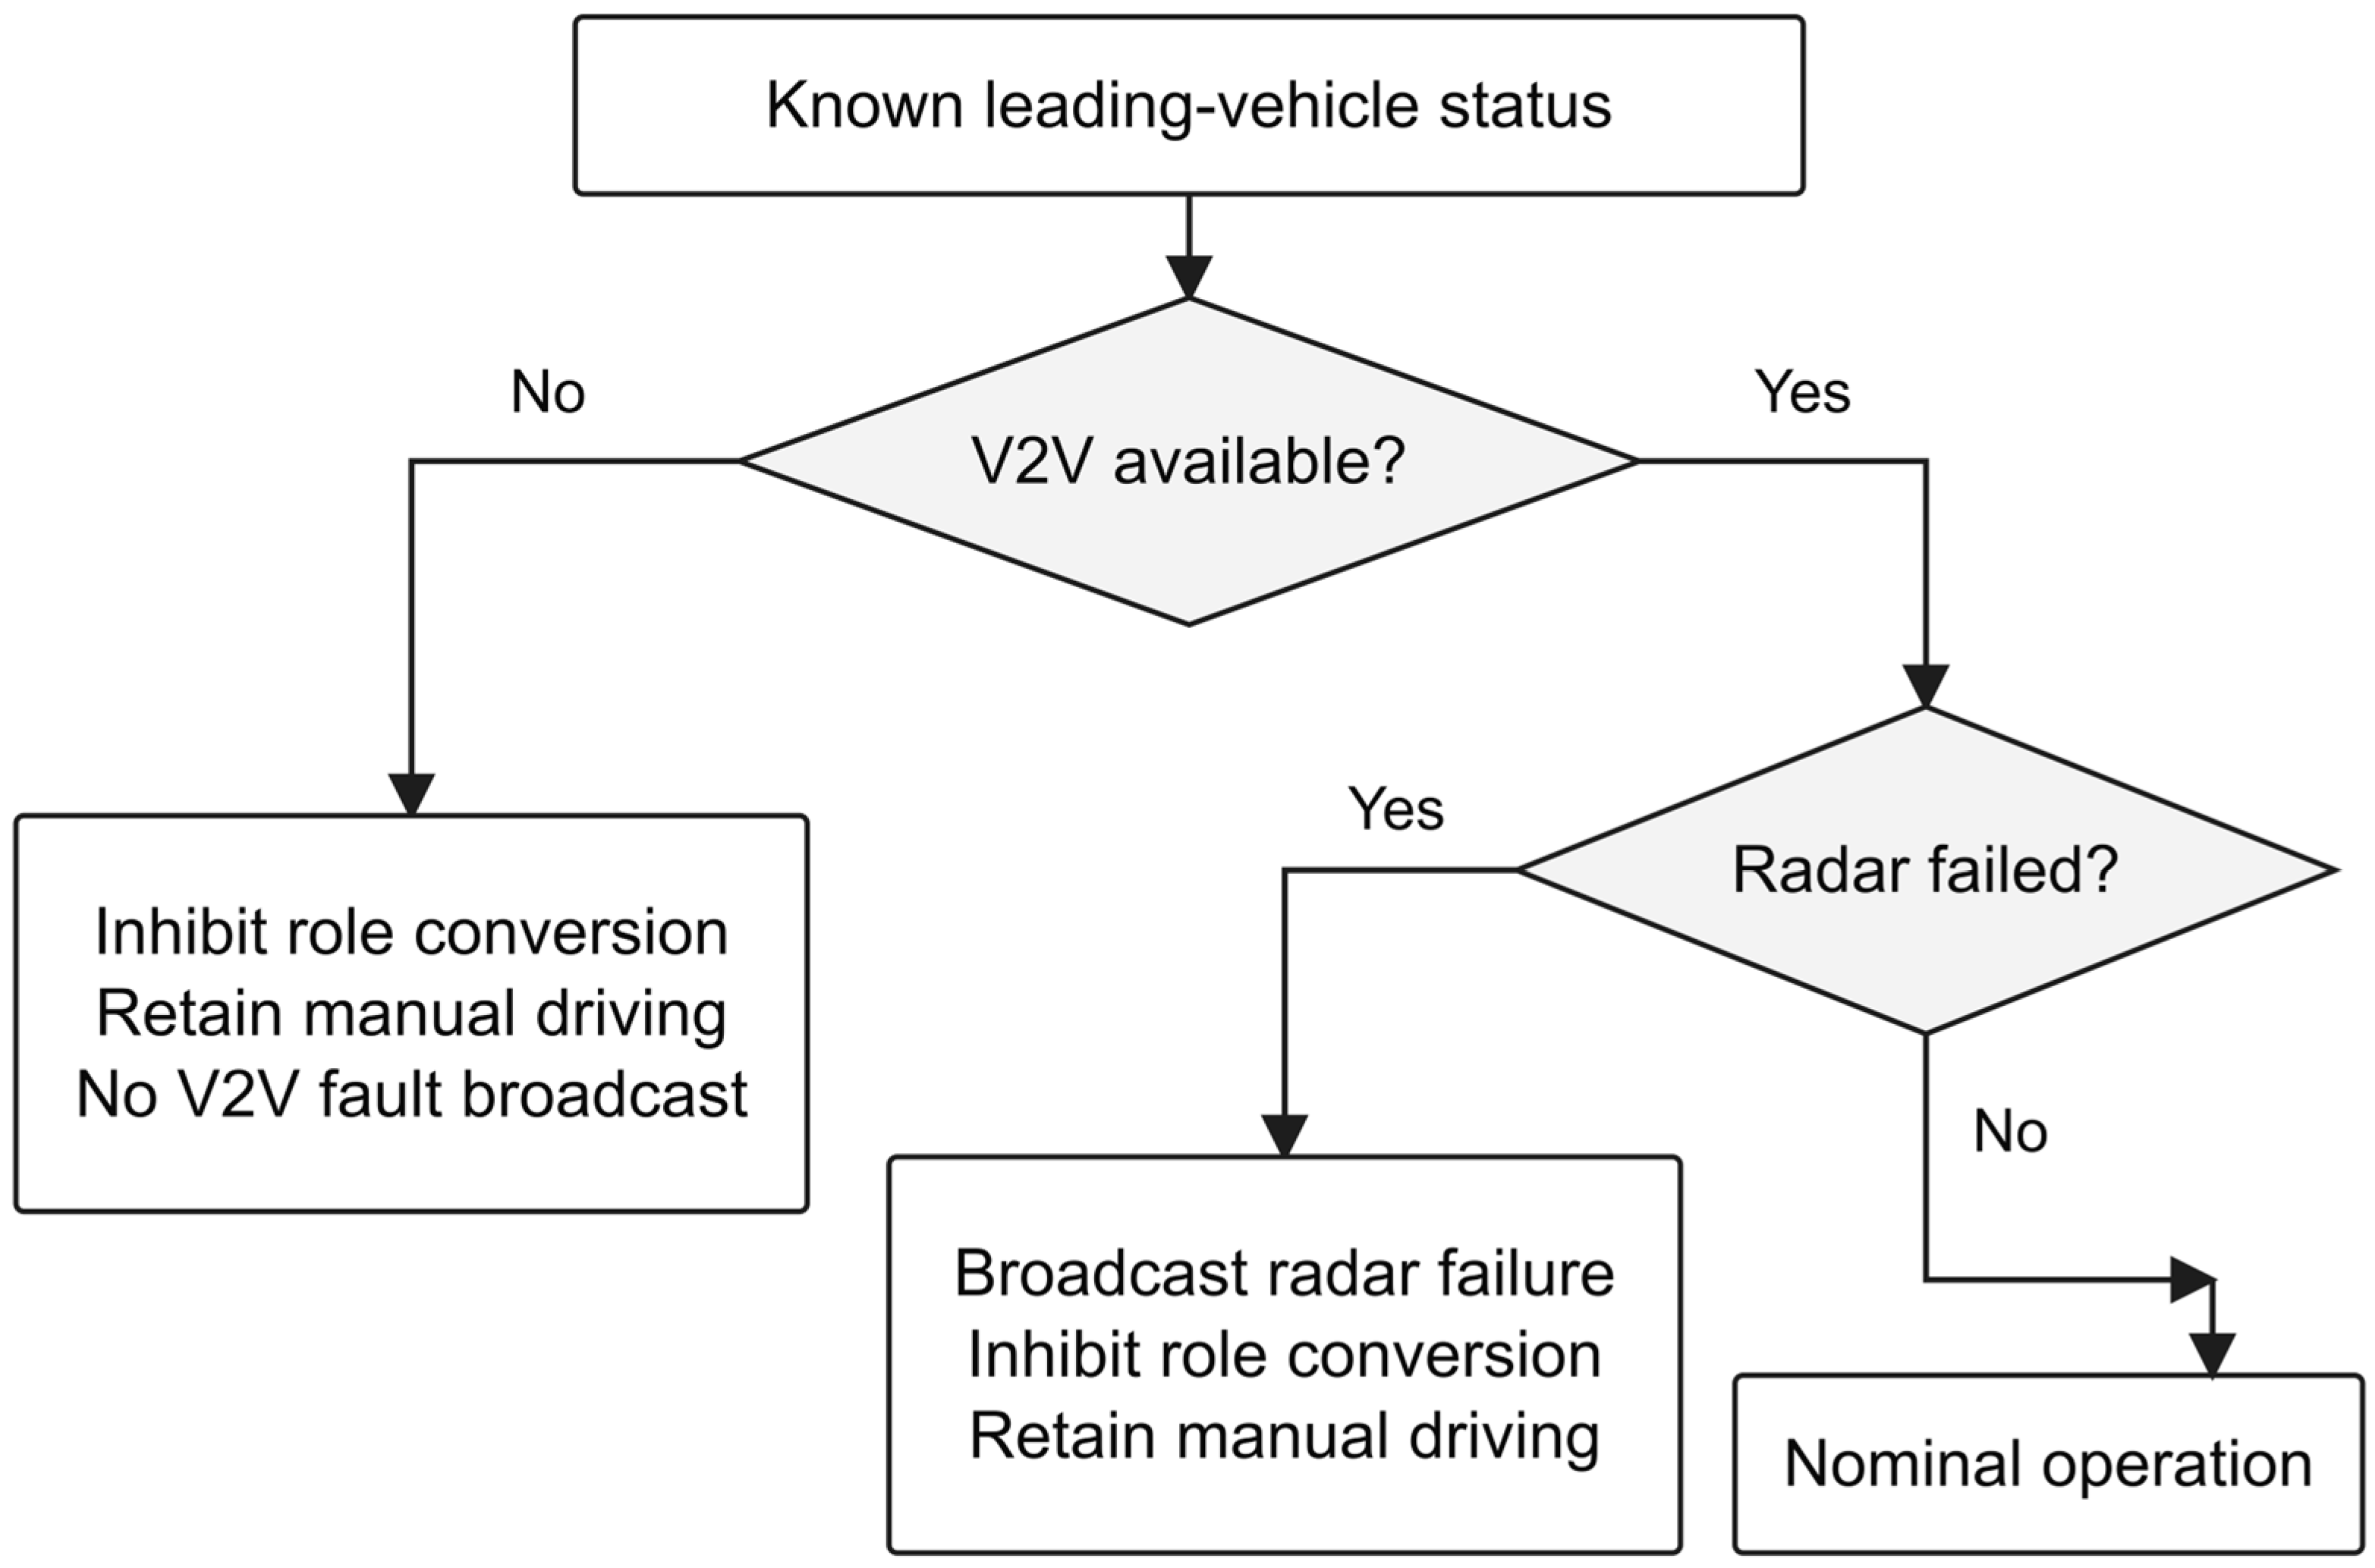
The leading vehicle remains manually driven. When its V2V communication is unavailable, role conversion is inhibited, and no V2V fault broadcast is assumed. When radar fails but V2V remains available, the fault can be broadcast to the platoon and roadside equipment while role conversion is inhibited. Figure 3 shows the actions selected from the supplied status inputs.
Figure 3.
Leading-vehicle decision logic for known status inputs; diagnostic acquisition and latency are not represented.
2.5. Following-Vehicle Fail-Degraded Strategy
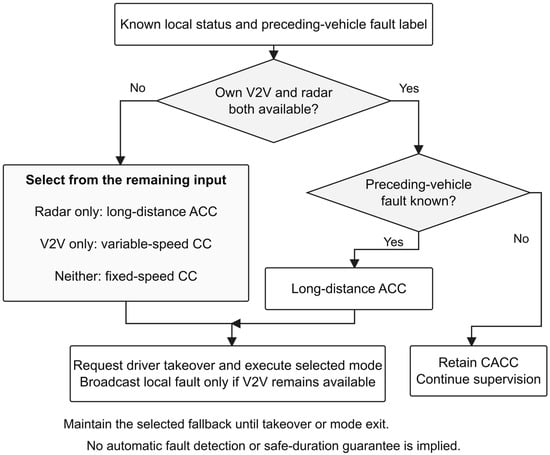
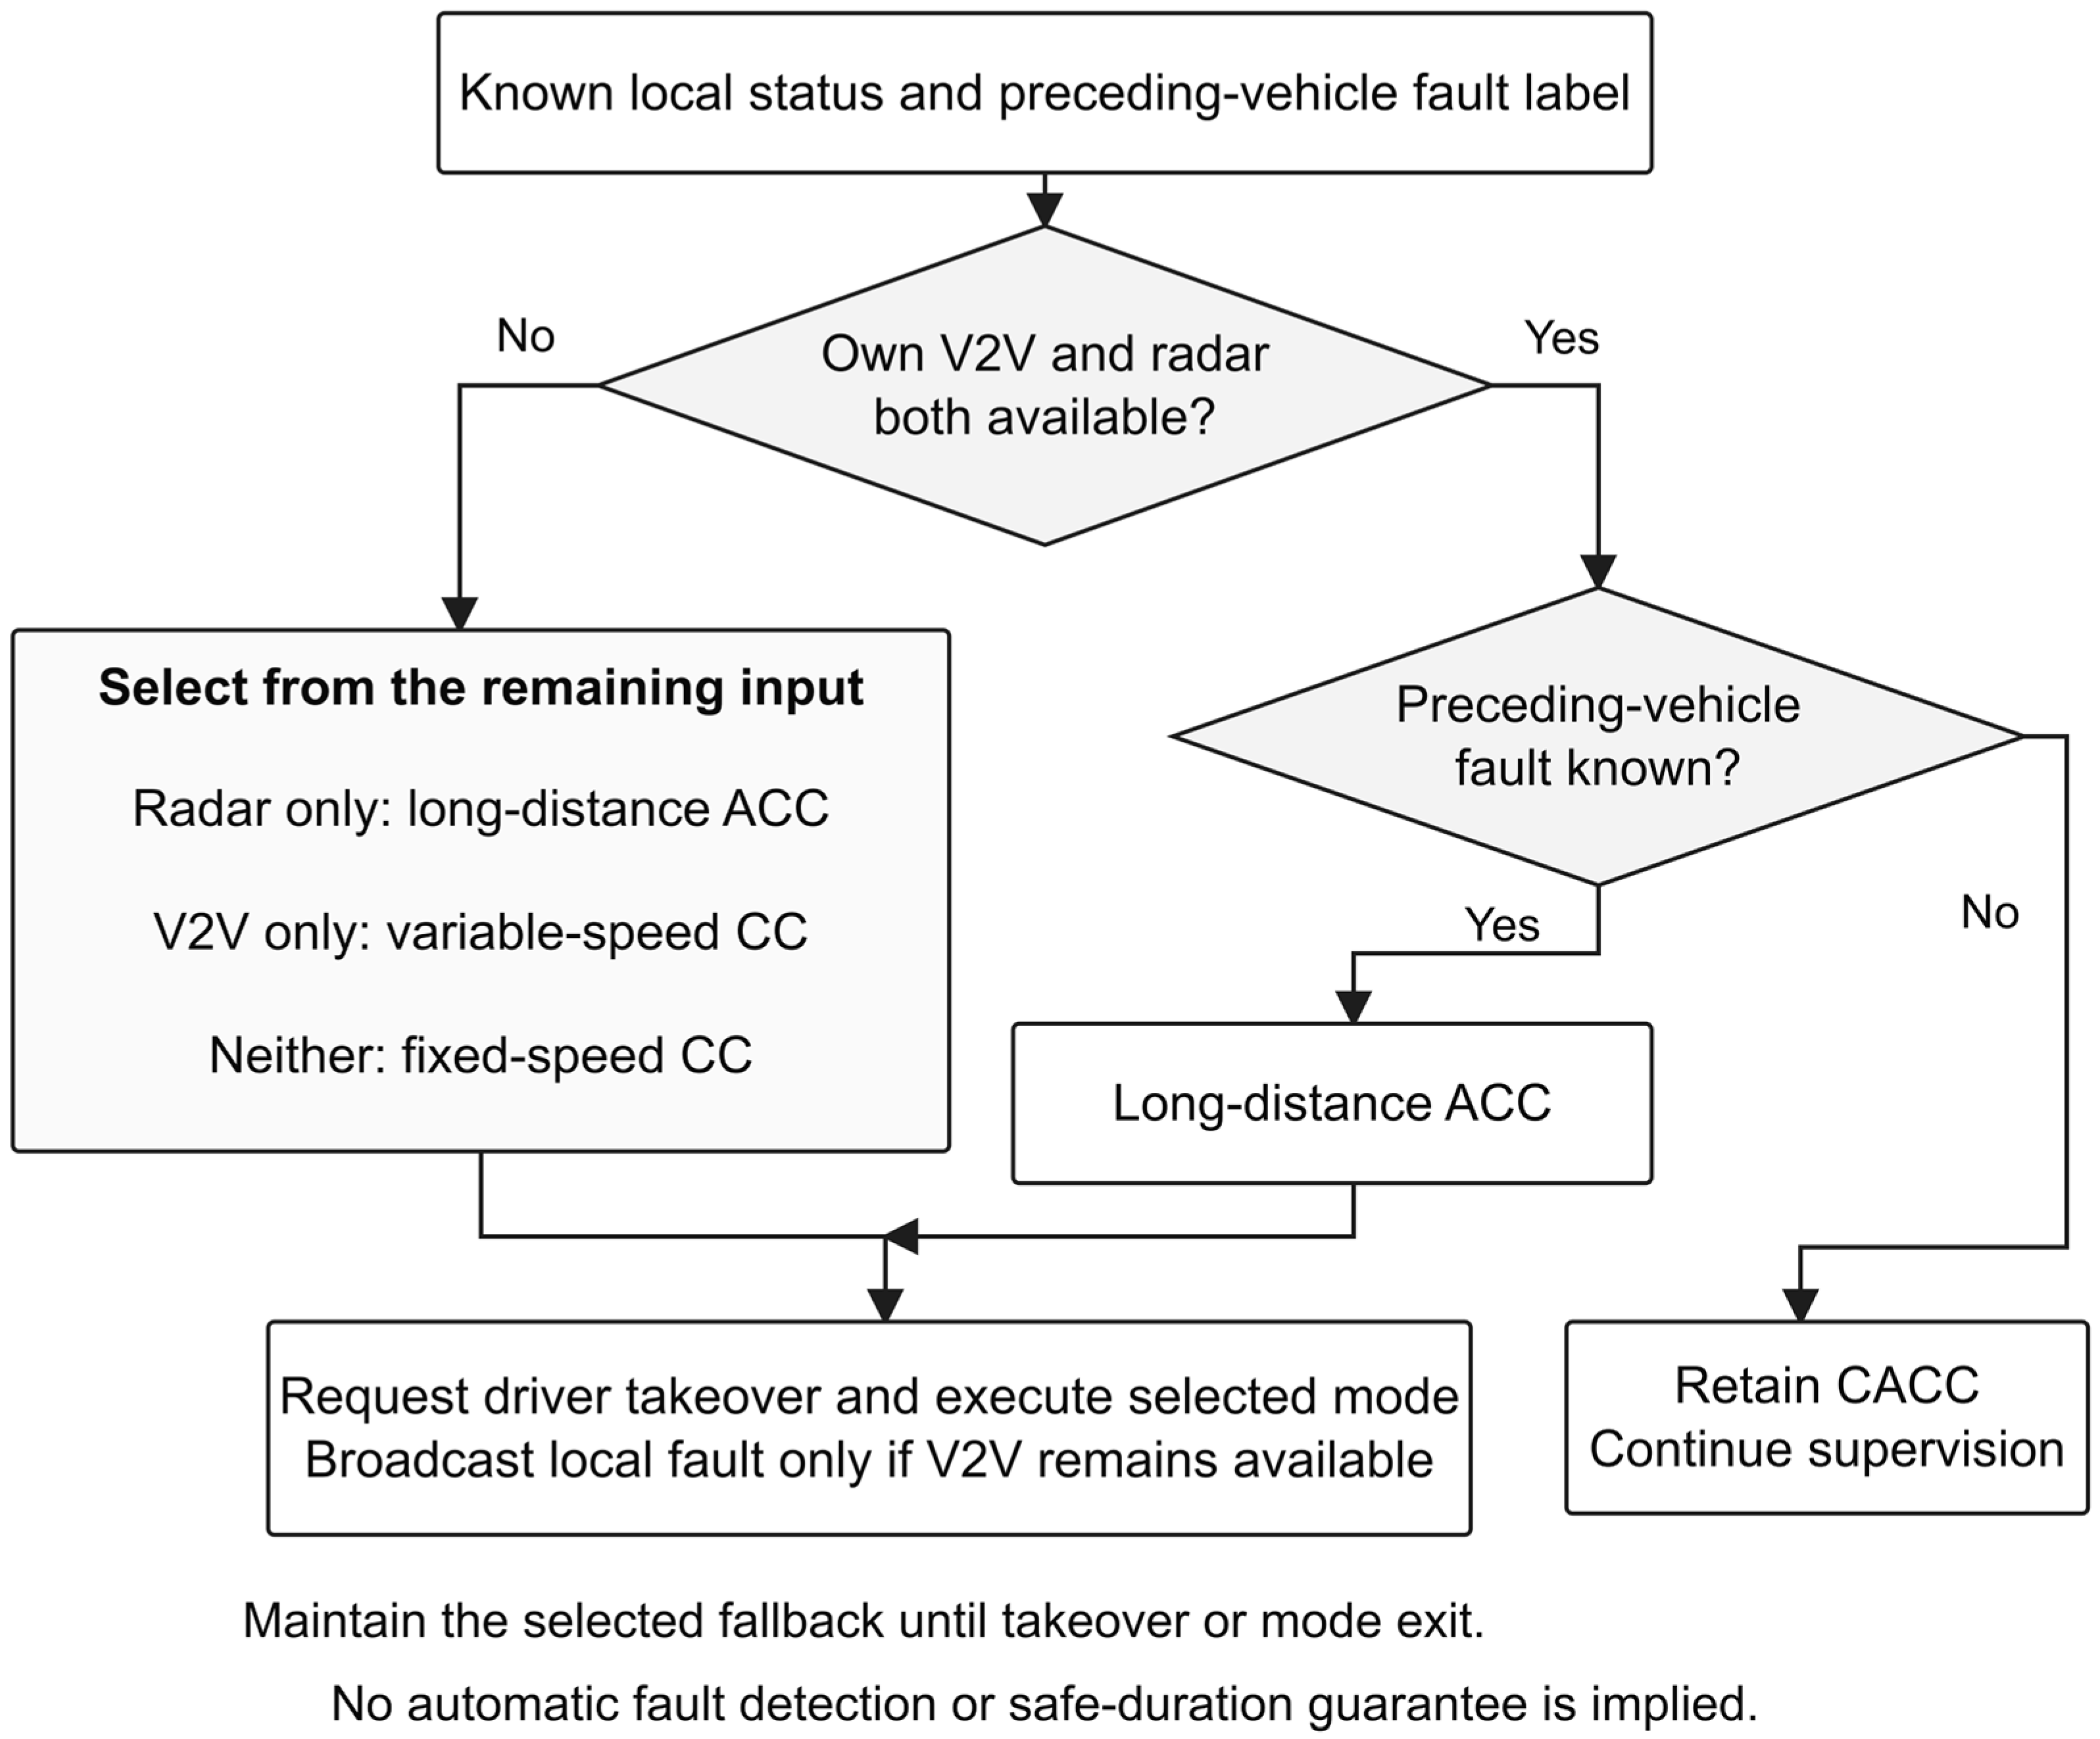
Table 3 and Figure 4 select a following-vehicle controller from the remaining local information and the known preceding-vehicle fault label. Self-information loss determines which controller is feasible; when both local sources remain healthy, a known preceding-vehicle fault selects long-distance ACC. A takeover request accompanies each degraded mode. The status-label path is described in Section 2.7.2, and conditional duration bounds are considered in Section 2.5.1.
Table 3.
Fail-degraded decision logic for following vehicles.
Figure 4.
Following-vehicle mode selection for known fault labels. The available inputs determine the feasible policy and the associated takeover request.
For follower i, let vi denote its speed (m/s), al the leading-vehicle acceleration (m/s2), and ldes the desired gap (m). In nominal CACC, h1 (s2) weights leader acceleration, h2 (s) weights ego speed, and l0 (m) is the standstill-spacing offset. The predecessor-leader-follower reference is
where l0 is the standstill-spacing offset. The reference is processed by a proportional-integral-derivative (PID) controller; Kp, Ki and Kd denote its proportional, integral and derivative gains. Section 2.6 and Table S1 describe the documentation limits for these gains and their implementation.
For long-distance ACC, h is the radar-based time headway (s). The desired gap is
Let h0 (s) be the base headway, kv (s2/m) the relative-speed coefficient, and hmin and hmax (s) the lower and upper bounds. The preceding-vehicle speed is vp (m/s), and vr = vp − vi (m/s), so negative vr denotes closing. The saturation function, sat, clips the headway to these bounds:
where positive kv increases headway during closing. The distance-feedback error is the measured gap minus ldes; the PID output is desired acceleration, which is integrated to form desired speed. The archived design specifies enlarged headway/spacing relative to nominal CACC, with the calibration limits specified in Table S1.
For variable-speed CC, vdes is the desired speed (m/s). When radar is unavailable but fresh V2V speed remains available, the reference follows the preceding vehicle:
Let ei (m/s) be the speed-controller input error, Δv (m/s) a positive speed offset, and t0 (s) its duration. The switch occurs at tf (s), and τ = t − tf is elapsed time after that switch. The initial offset then gives
where the offset applies only during the initial interval. Its value and duration are speed-band calibration settings, subject to the documentation limits in Table S1. The reference does not directly regulate spacing when radar is unavailable.
For simultaneous loss, vp,last denotes the last valid received preceding-vehicle speed (m/s). Fixed-speed CC holds this stored reference:
The corresponding PID input error is
In Equation (7), Δv remains active throughout the fixed-speed mode until takeover or mode exit; ei remains a speed error. No external gap or speed update is available for control. This policy was exercised under steady cruising only and cannot guarantee clearance when the preceding vehicle brakes, cuts in, or otherwise changes its motion. Section 2.5.1 states the additional assumptions required even for a conditional forward-gap bound.
Long-distance ACC is selected when radar remains available because it can directly regulate spacing. Variable-speed CC is selected when radar is lost but V2V messages remain available. Fixed-speed CC provides a temporary held-speed reference during simultaneous information loss. Across all modes, PID output is the desired longitudinal acceleration, and integration provides desired speed.
A following vehicle with available radar switches away from tight CACC following when a preceding-vehicle fault label is supplied. Enlarging the commanded gap sacrifices compactness, but whether sufficient clearance remains depends on actual motion, controller response and detection delay. These factors determine the validation needed for a safe operating envelope.
The nominal |a| ≤ 1 m/s2 value is a calibration objective, not a demonstrated bound. Reanalysis retains every sample in the 20–90 s post-injection window. Each 20 m/s straight-road simulation file contains a Vehicle 3 absolute peak near 8.94 m/s2 at 20.01 s, exceeding this objective. These samples remain in the complete-window statistics. Supplementary Sections S2–S4 report the unfiltered samples and additional consistency checks; the physical cause remains unresolved.
The 70 m target at 20 m/s and 90 m target at 30 m/s are inherited calibration/evaluation settings, equivalent to gap-to-speed ratios of 3.5 s and 3.0 s. Their rationale is to allow additional space for takeover, although a quantitative takeover-time or stopping-distance derivation for these exact values is unavailable. They are evaluation targets rather than minimum safe distances. The initial simulation gaps were approximately 28 m and 35 m, respectively: the enlarged targets cannot be counted as clearance already available at fault onset. Long-distance ACC regulates gap, variable-speed CC regulates speed with a temporary offset, and fixed-speed CC does not regulate an external gap.
2.5.1. Conditional Gap and Delay Bounds
Consider a straight-road follower and its immediate predecessor. Let d0 (m) be the bumper gap at fault onset, dclr (m) a specified positive clearance reserve, and c0 = max(vi − vp, 0) (m/s) the initial closing speed. Assume their longitudinal relative acceleration satisfies ai − ap ≤ R, with R ≥ 0 in m/s2 throughout a chosen duration T (s). Integrating this upper bound gives a sufficient forward-gap condition:
Because the assumed closing bound is nonnegative, Equation (8) protects the reserve throughout the interval, not just its endpoint. It also gives the admissible initial closing speed: c0 ≤ (d0 − dclr − RT2/2)/T for T > 0 and a nonnegative right-hand side. With d0 > dclr, the corresponding conditional duration is
The third case describes ideal constant-relative-speed motion. A conservative bound on predecessor braking and ego acceleration must be known before Equation (9) can define an allowable duration. The nominal 1 m/s2 objective cannot supply that bound because three retained records violate it. Neither actual human takeover time nor a validated maximum fallback duration can therefore be assigned from these data. The condition concerns forward clearance under the stated one-dimensional assumptions.
Let δ (s) denote fault-onset-to-effective-switch delay, including detection, notification and switching. Let Rd and Rf (m/s2) be nonnegative upper bounds on relative acceleration before and after switching, and let T now denote the duration after switching. Applying the same integration in two stages gives
Equation (10) shows how an unmeasured diagnosis delay consumes the initial gap. For illustration only, with dclr = 5 m, c0 = 2 m/s, Rd = 2 m/s2, Rf = 0 and T = 3 s, delays of 0, 0.2, 0.5 and 1 s require initial gaps of 11, 12.64, 15.25 and 20 m, respectively. The values illustrate the dependence on the assumed motion bounds. Table S6 supplies additional conditional duration examples and the reproducible calculation.
2.5.2. Communication Loss and Status Availability
Complete V2V exclusion with a supplied fault label is the tested communication fault model. If radar remains available, long-distance ACC can regulate local gap without cooperative messages; if radar is also unavailable, the held-speed fallback loses that feedback. A failed vehicle cannot be assumed to notify followers over the failed V2V channel. The physical tests use a separate external experiment-control/fault-indication channel.
Deployment requires a local timeout or health monitor with a validated delay bound and either stale-message detection in each follower or an independently available notification path. Equation (10) makes the associated clearance cost explicit. Extension to intermittent, asymmetric, delayed and recovering communication requires validation beyond the complete-loss cases tested here, including the availability of the notification path.
2.6. Simulation Scenarios and Parameter Settings
The strategy was evaluated using PreScan 8.5.0 and MATLAB/Simulink R2022b. Four nominal failure cases were crossed with straight/bend roads and 20/30 m/s speeds, giving a 16-condition test matrix. The archived result set contains 12 distinct state-trajectory files: the leading- and following-vehicle communication cases use the same degraded controller assignments for the two followers, so their vehicle-state trajectories are shared rather than duplicated. Failures were injected at 20 s after stable cruising.
Supplementary Table S1 distinguishes documented scenario and vehicle parameters from implementation details that cannot be verified for the reported runs. The available documentation does not include an executable PreScan/Simulink project or a complete, run-specific record of PID gains, reference calibration, initialization, saturation, anti-windup, state transfer and solver settings. The matrices contain time, the accelerations of Vehicles 2 and 3, and their inter-vehicle distances at observed 0.01 s output intervals; this does not establish the solver step or controller update period. Equations (1)–(7) specify the reference-generation and error logic. The supplied data and methods permit independent reanalysis of the recorded outputs; regeneration of the original closed-loop trajectories remains unsupported by the available implementation documentation.
The evaluation assesses implementation feasibility under the specified fault conditions. It examines controller selection, spacing change, and longitudinal response under the archived test conditions. The 30 m/s bend scenario is shown in the main text because it combines high speed with curved-road path following.
The 20 s injection time follows stable platoon formation. Achieved spacing and acceleration are evaluated over the remaining recorded window, including any target shortfalls at its end.
The reported simulation settings and test matrix are summarized in Table 4.
Table 4.
Simulation setup and test conditions.
The two road geometries and speed levels define the simulation coverage. The 70 m and 90 m values serve as evaluation targets, subject to the assumptions discussed in Section 2.5.1.
Table 5 lists the vehicle-dynamics parameters used by the corresponding PreScan models.
Table 5.
Vehicle dynamics parameters used in the PreScan models.
2.7. On-Road Micro-Vehicle Platoon Experiment
2.7.1. Micro-Vehicle Platoon Platform Design
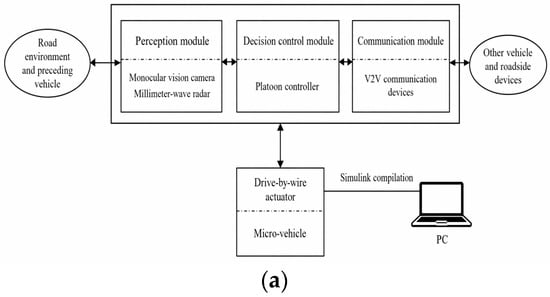
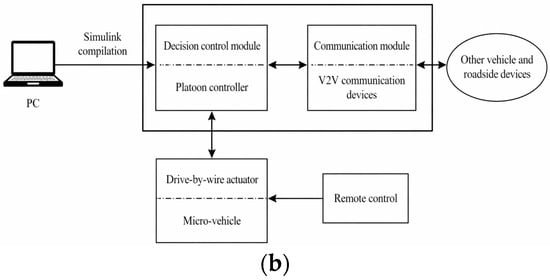
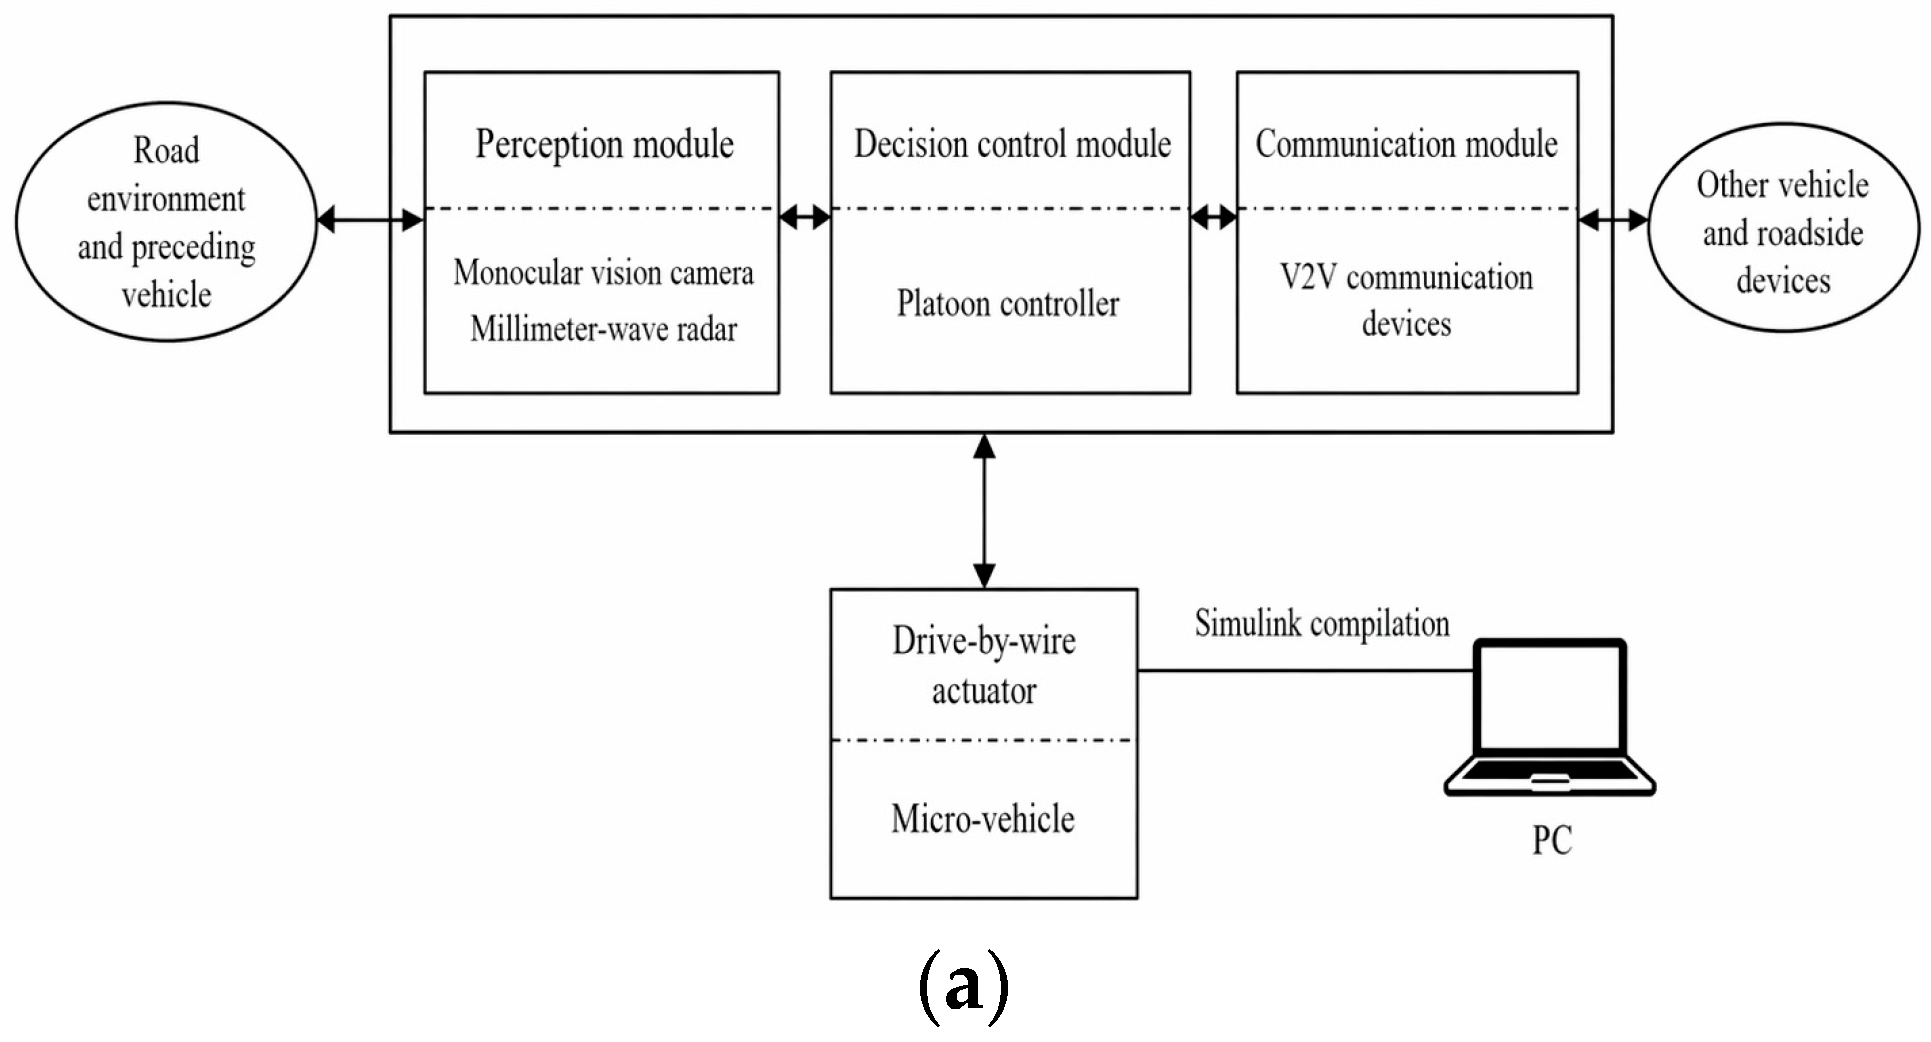
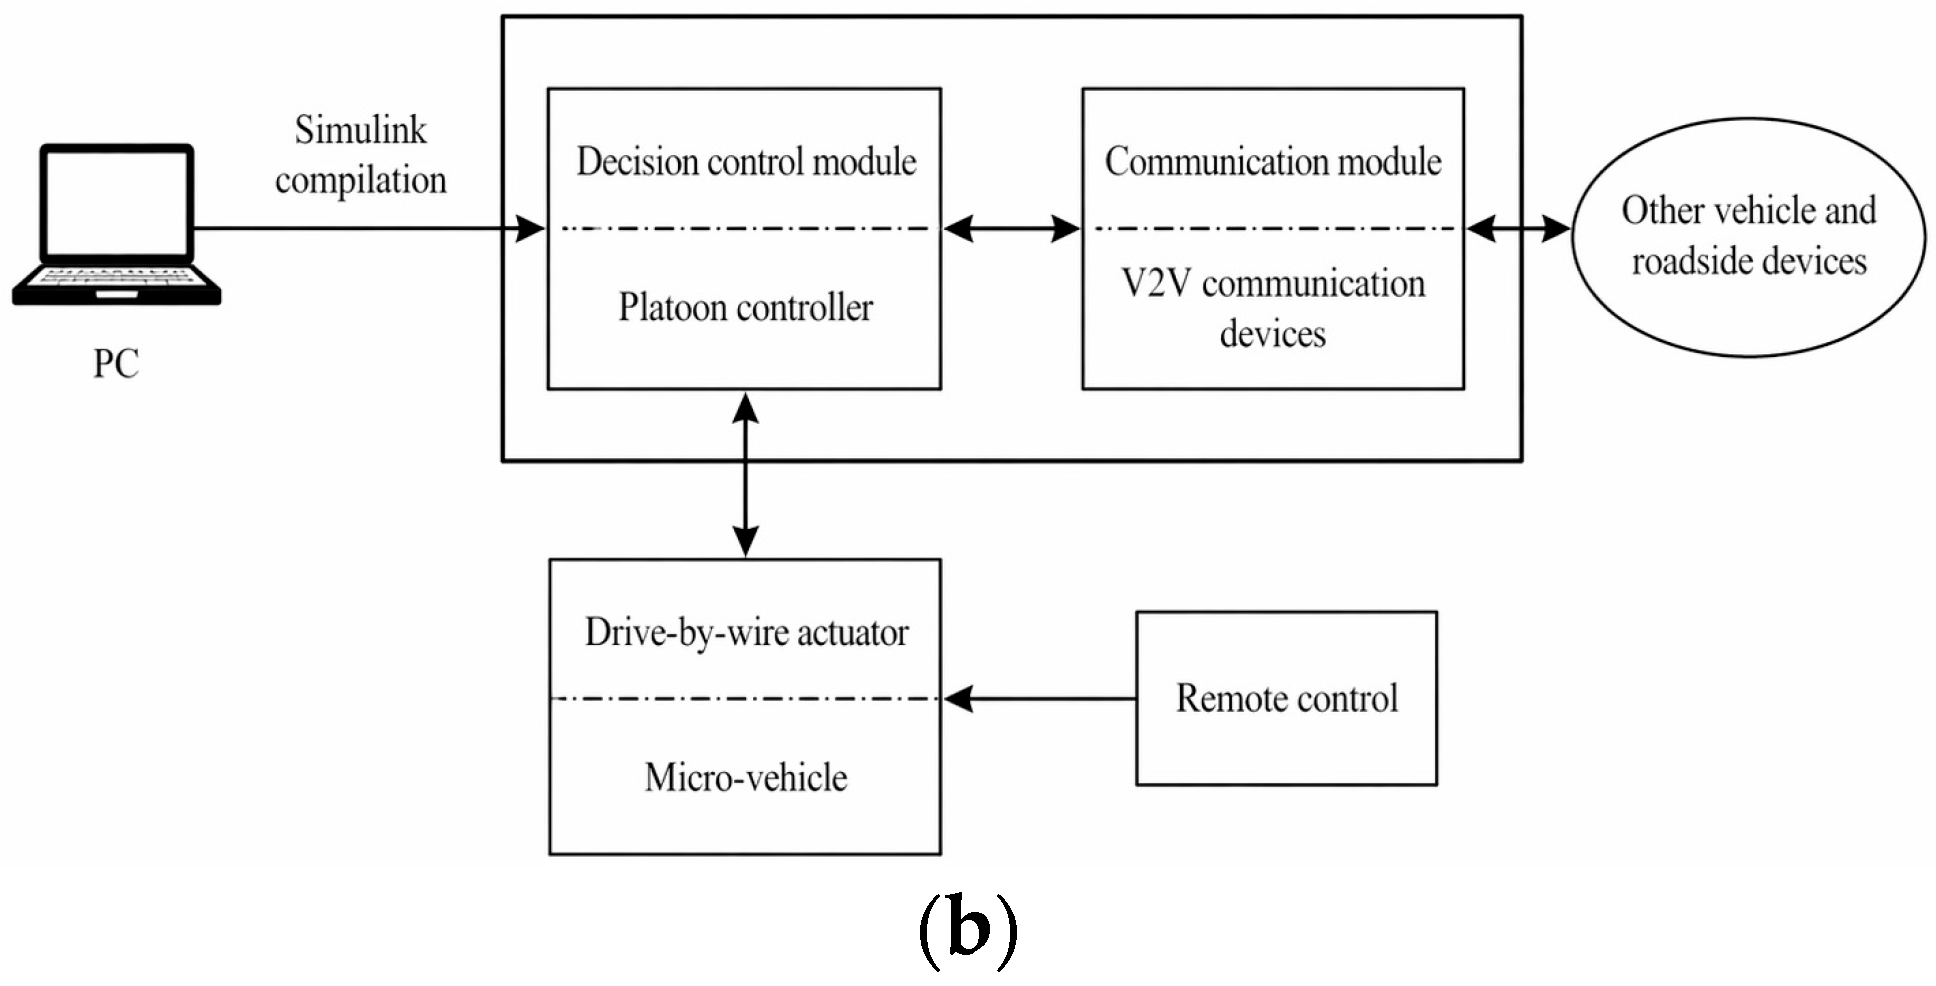
To verify real-time implementation, the strategy was tested on a drive-by-wire electric micro-vehicle platoon platform. The leading vehicle used a four-wheel chassis, and the two following vehicles used tracked chassis; all used brushless direct-current (DC) propulsion. The following vehicles contained perception, communication, and decision-control modules, whereas the leading vehicle was manually controlled. Controllers were compiled in MATLAB/Simulink R2022b and deployed through the platoon controller. Figure 5 presents the hardware architectures of the following and leading vehicles.
Figure 5.
Hardware system architecture of the micro-vehicle platoon platform: (a) following-vehicle hardware architecture; (b) leading-vehicle hardware architecture. Arrows indicate information, command or software-deployment flow, as labeled; dashed horizontal dividers separate module headings from their components.
The electric micro-vehicle platform exercises sensing, V2V communication, mode selection, longitudinal-reference generation and electric actuation. The evaluation concerns supervisory switching and scaled vehicle response. Battery state of charge, energy use, regenerative braking and motor thermal behavior are outside the present control and evaluation scope. Extension to full-size electric vehicles requires integration with vehicle-specific torque and braking constraints.
The physical platform includes manually varying leader-speed input and the effects of real sensors, actuators and communication hardware. The demonstrations assess the resulting implementation response under these recorded conditions.
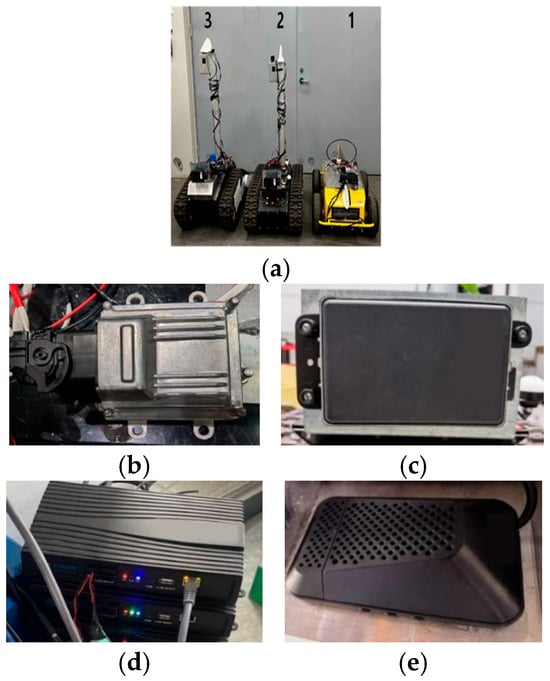
The platform used a Delphi ESR millimeter-wave radar (Delphi Electronics and Safety, Kokomo, IN, USA), a NEBULA-LINK V2V communication device (Beijing Nebula Link Technology Co., Ltd., Beijing, China), a Mobileye 630 monocular camera (Mobileye Vision Technologies Ltd., Jerusalem, Israel), and a vehicle control unit, as shown in Figure 6.
Figure 6.
Hardware of the micro-vehicle platform: (a) micro-vehicle modification (1: leading vehicle; 2 and 3: following vehicles); (b) vehicle control unit; (c) millimeter-wave radar; (d) V2V device; (e) monocular camera. Hardware images adapted from [26].
2.7.2. Experimental Scenarios and Settings
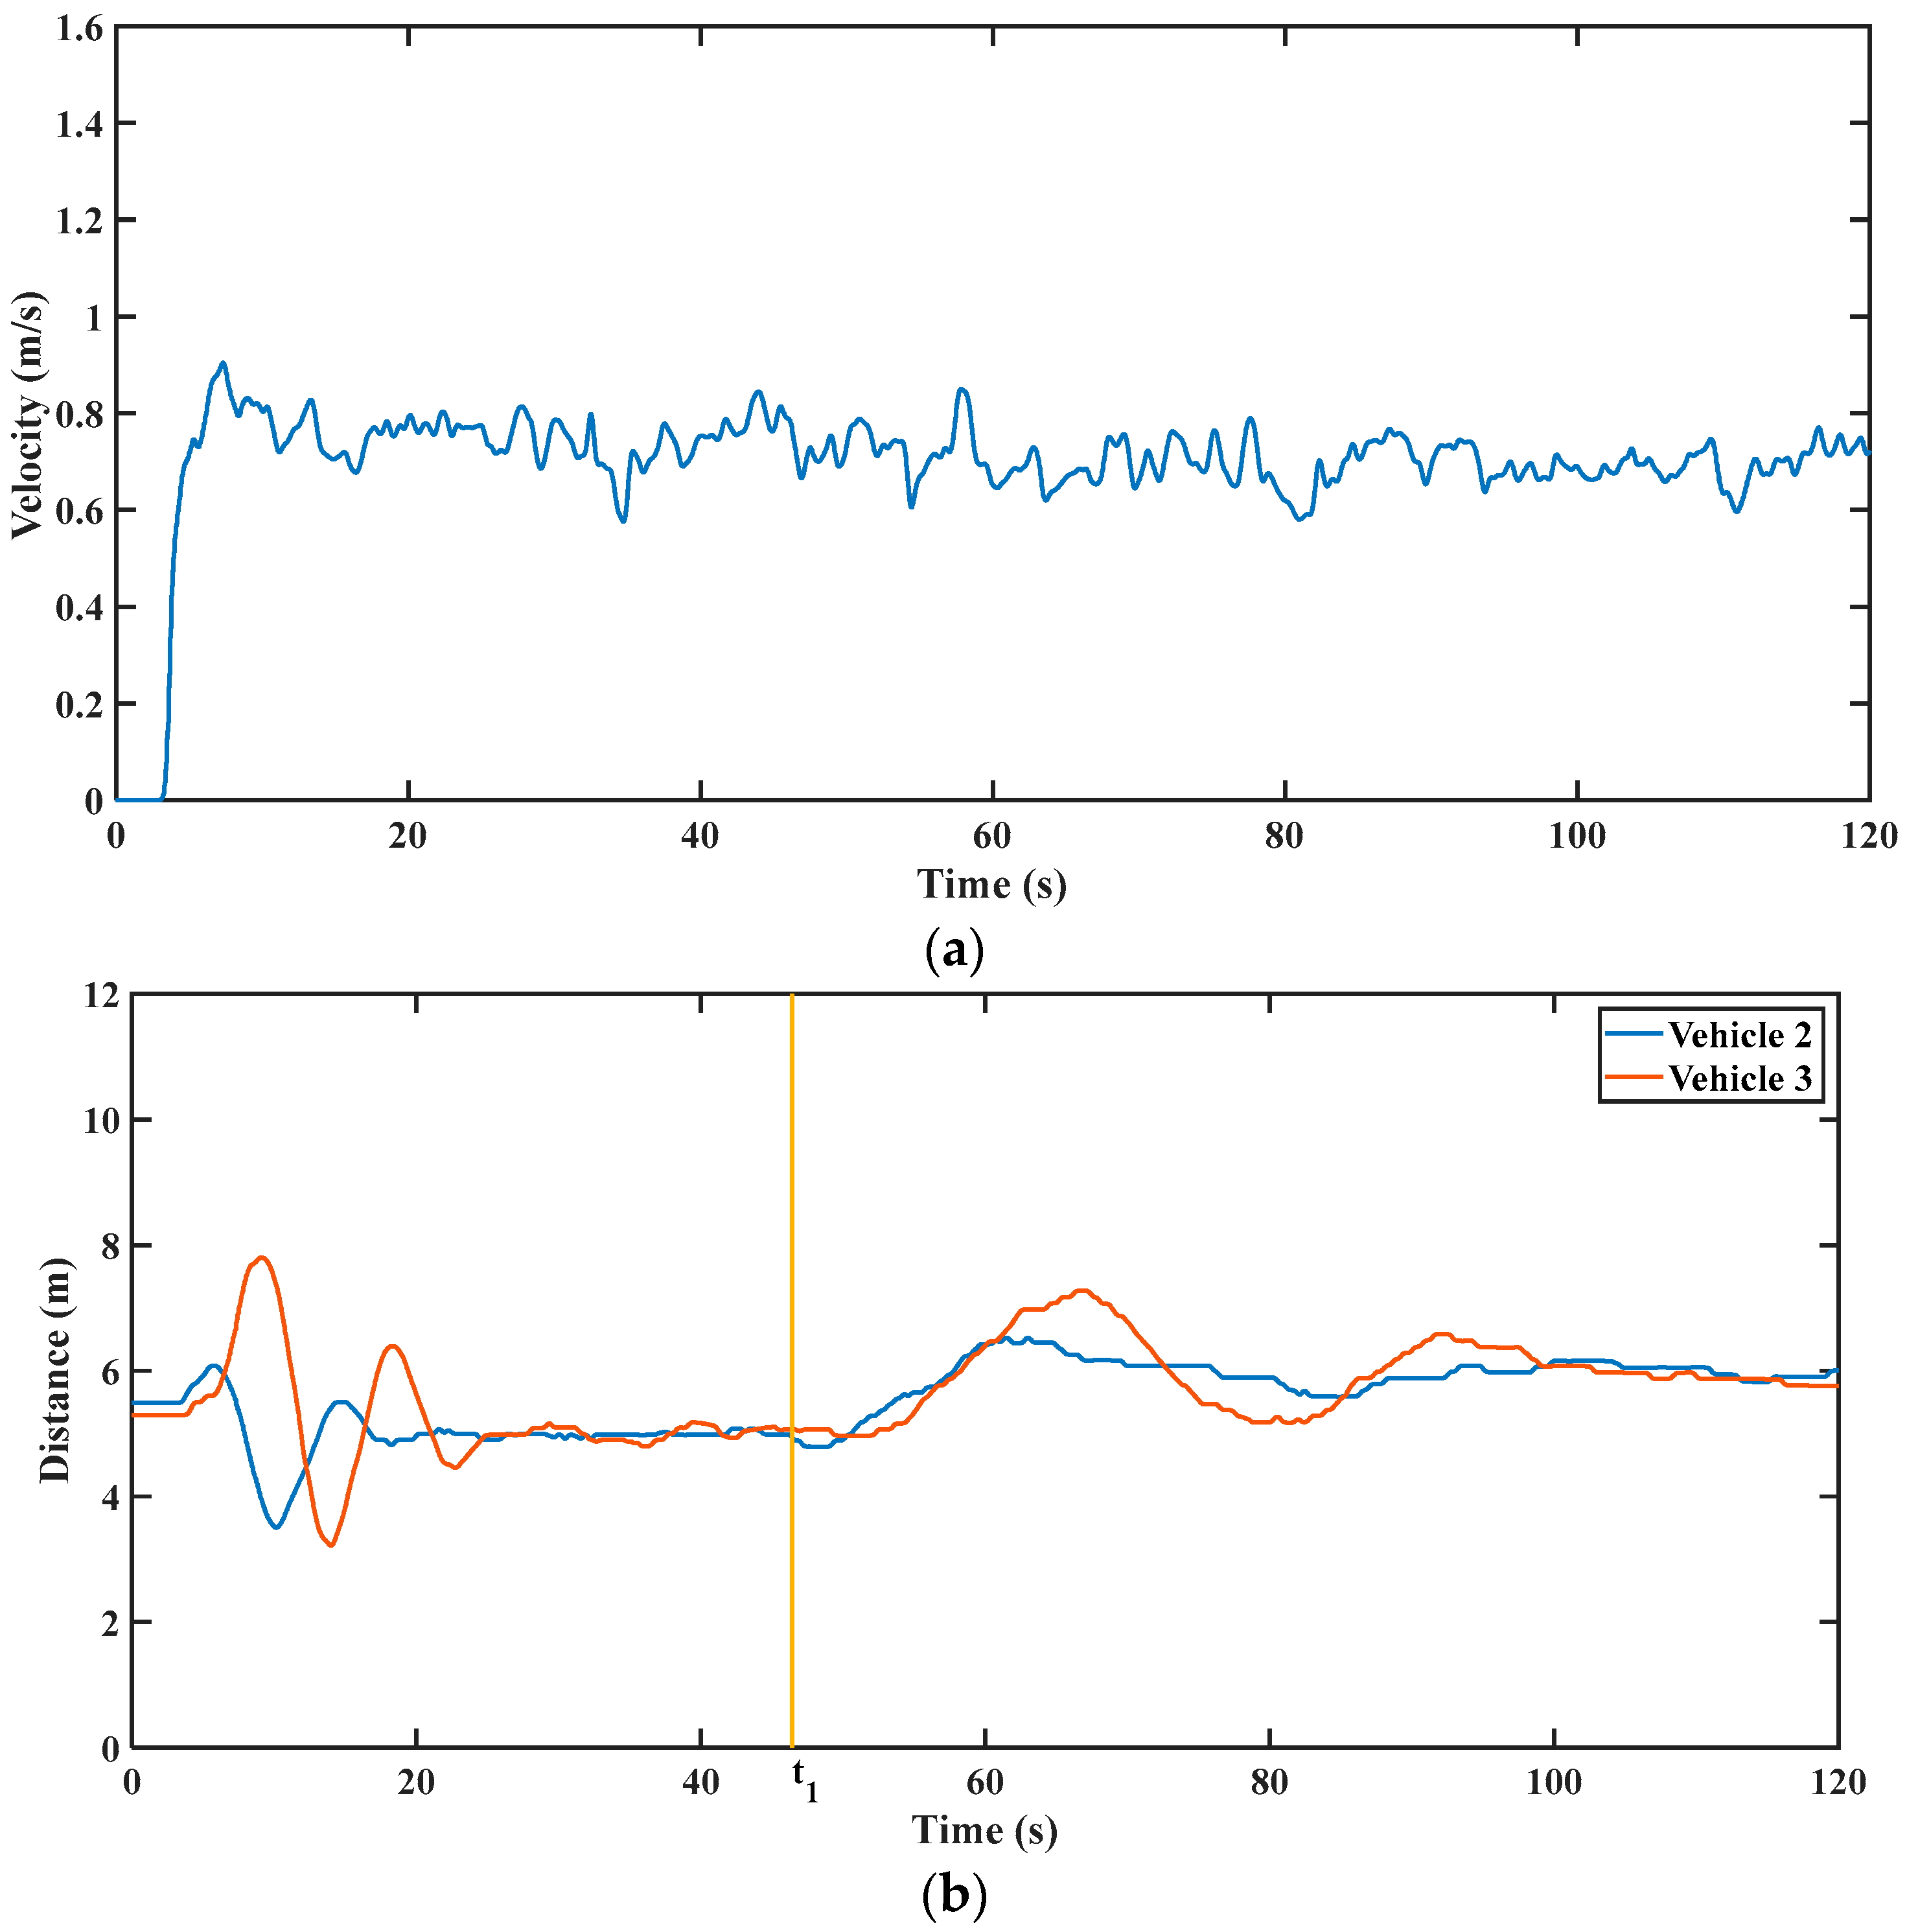
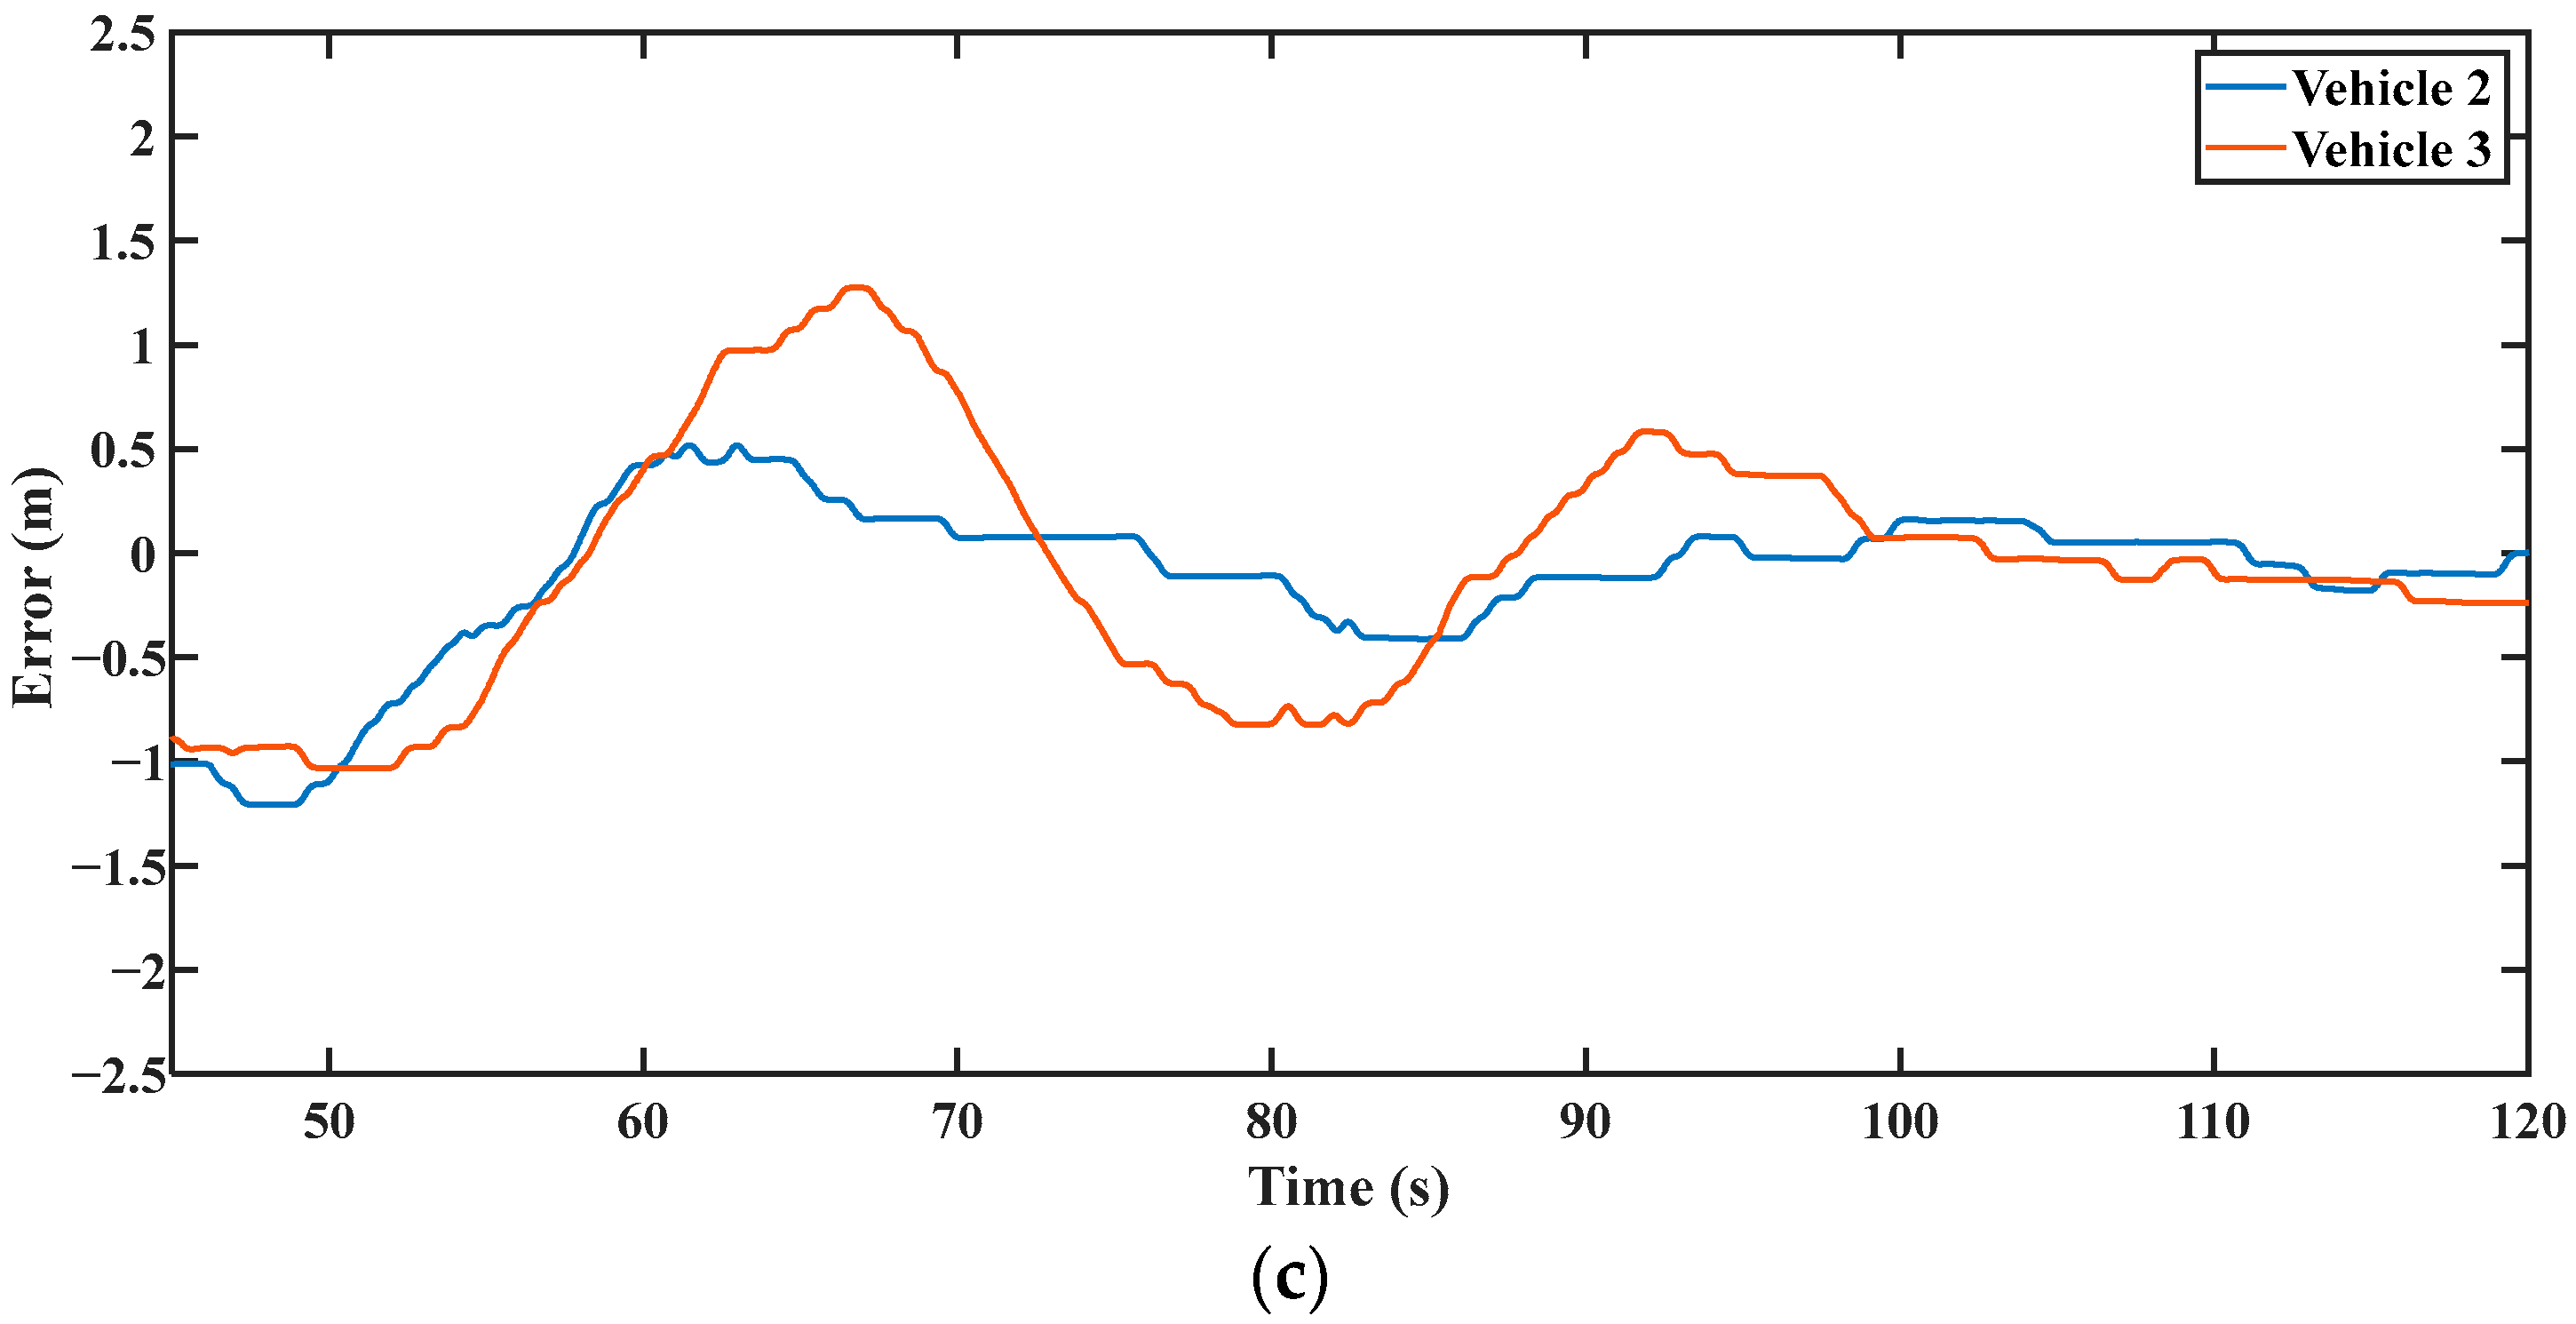
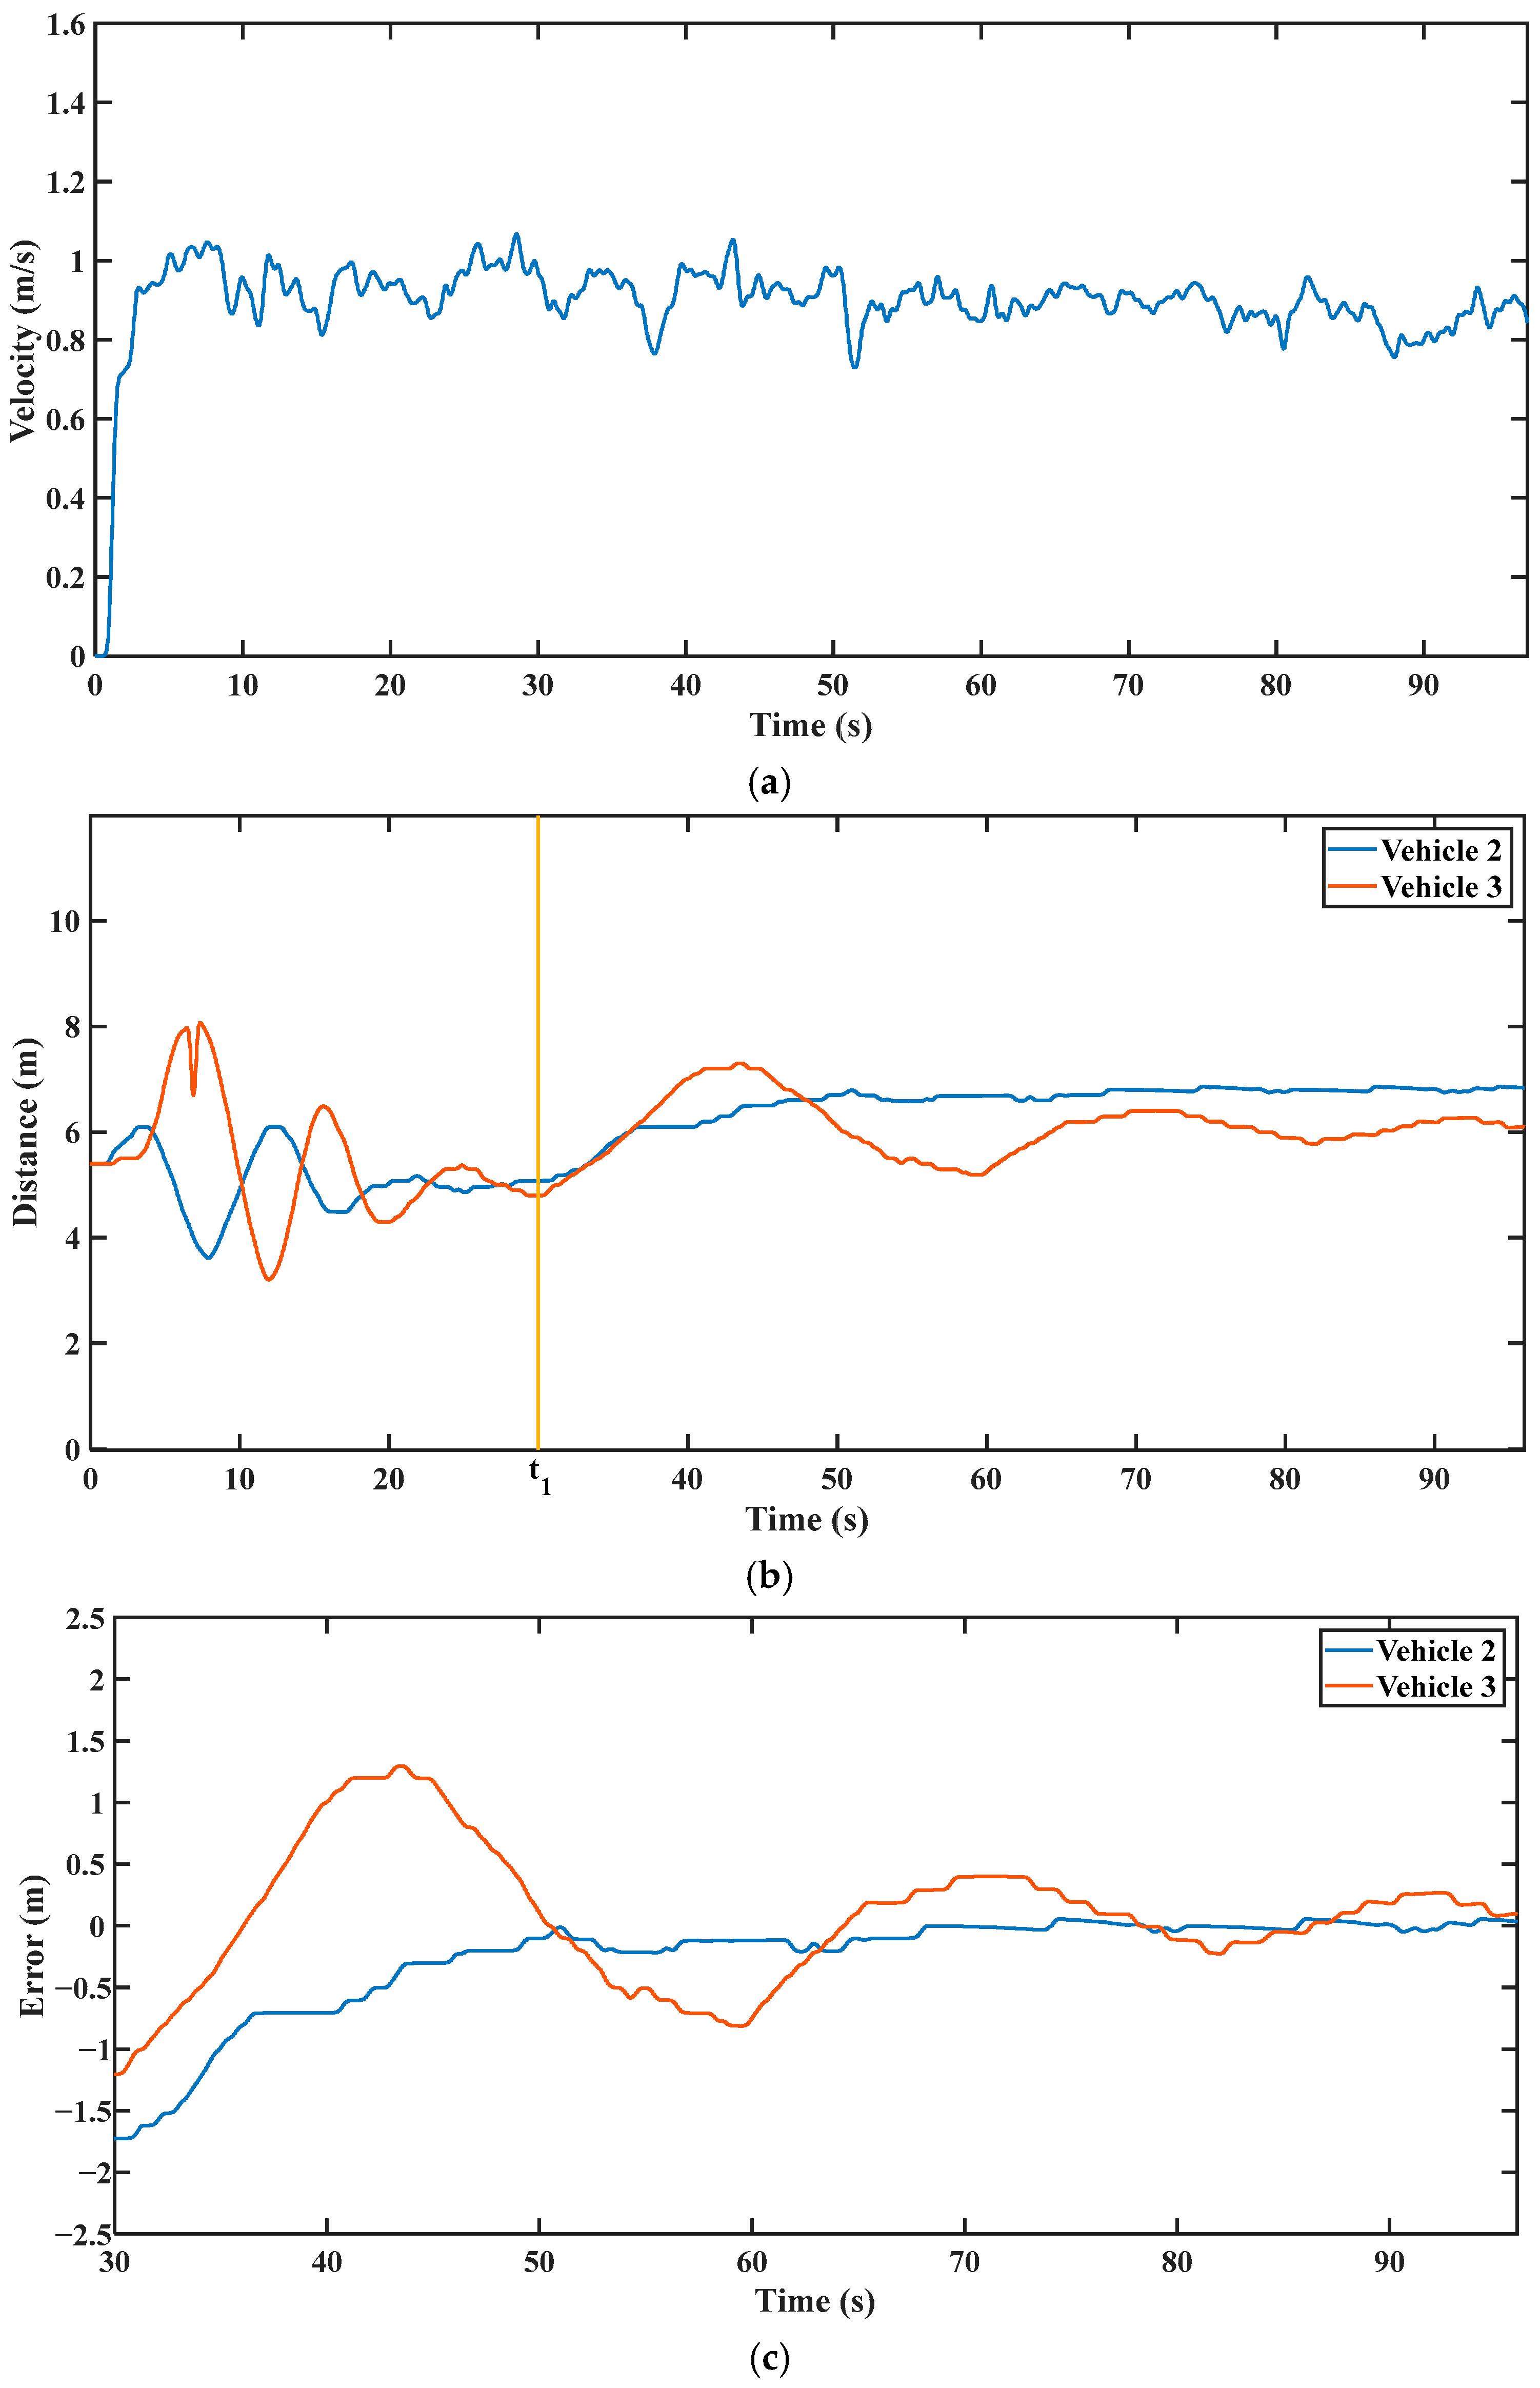
Four physical fault-label cases correspond to the nominal simulation cases. Table 6 summarizes their controller assignments and the descriptive statistics of identifiable representative records. The basis for these statistics and the limits on independent-trial identification are detailed below.
Table 6.
Controller assignments and unfiltered representative-record spacing deviations.
Statistics use the final 10 s of each original displayed record, with no smoothing. Parentheses contain within-record temporal sample standard deviation, not between-trial variability or a confidence interval. Table S8 specifies files, signals, raw-time windows, sample counts, RMSE and maximum absolute deviations. The Vehicle 2 radar-loss reference is not a controlled gap setpoint.
The roadside unit provided an external experiment-control/fault-indication channel, separate from the V2V data stream under test. At the commanded failure time, it sent a scenario code identifying the affected vehicle and failed hardware: the affected vehicle received a self-failure code, and the rear vehicle received a preceding-vehicle-failure code. The corresponding V2V and/or radar data stream was then excluded from the onboard decision logic, while the remaining devices continued to support logging and analysis. Thus, the tests evaluate controller switching under externally supplied fault labels; fault detection, isolation, and diagnostic latency are outside the present validation scope.
The experiment description reports three executions per case. Duplicate exports and mixed time origins, however, prevent a reliable mapping to independent, equivalently evaluated trials for every case. Trial-level confidence intervals therefore remain unavailable. Table S8 reports temporal descriptive statistics for three identifiable representative records.
The experiment exercises onboard mode selection and physical actuation after an externally supplied scenario label. A radar stream excluded from the controller may still be logged for analysis; its availability to the logger does not imply use by the degraded controller. Section 2.5.1 considers the effect of an assumed delay separately from the physical measurements.
For the plots and new statistics, spacing deviation is measured gap minus the stated reference, positive when the gap is larger. The reference is 6 m for long-distance ACC. In the radar-loss Vehicle 2 record, 6.8 m is the legacy plotting reference, not an actively regulated gap target. The experimental result figures retain the original processed visualization, whose scripts repeatedly smooth the spacing signals. Table S8 instead uses unchanged raw samples over the final 10 s of the original displayed windows. The fixed windows are descriptive and are not a convergence or settling-time criterion.
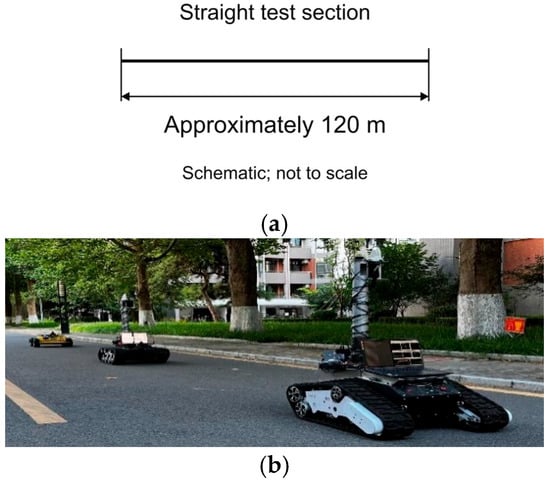
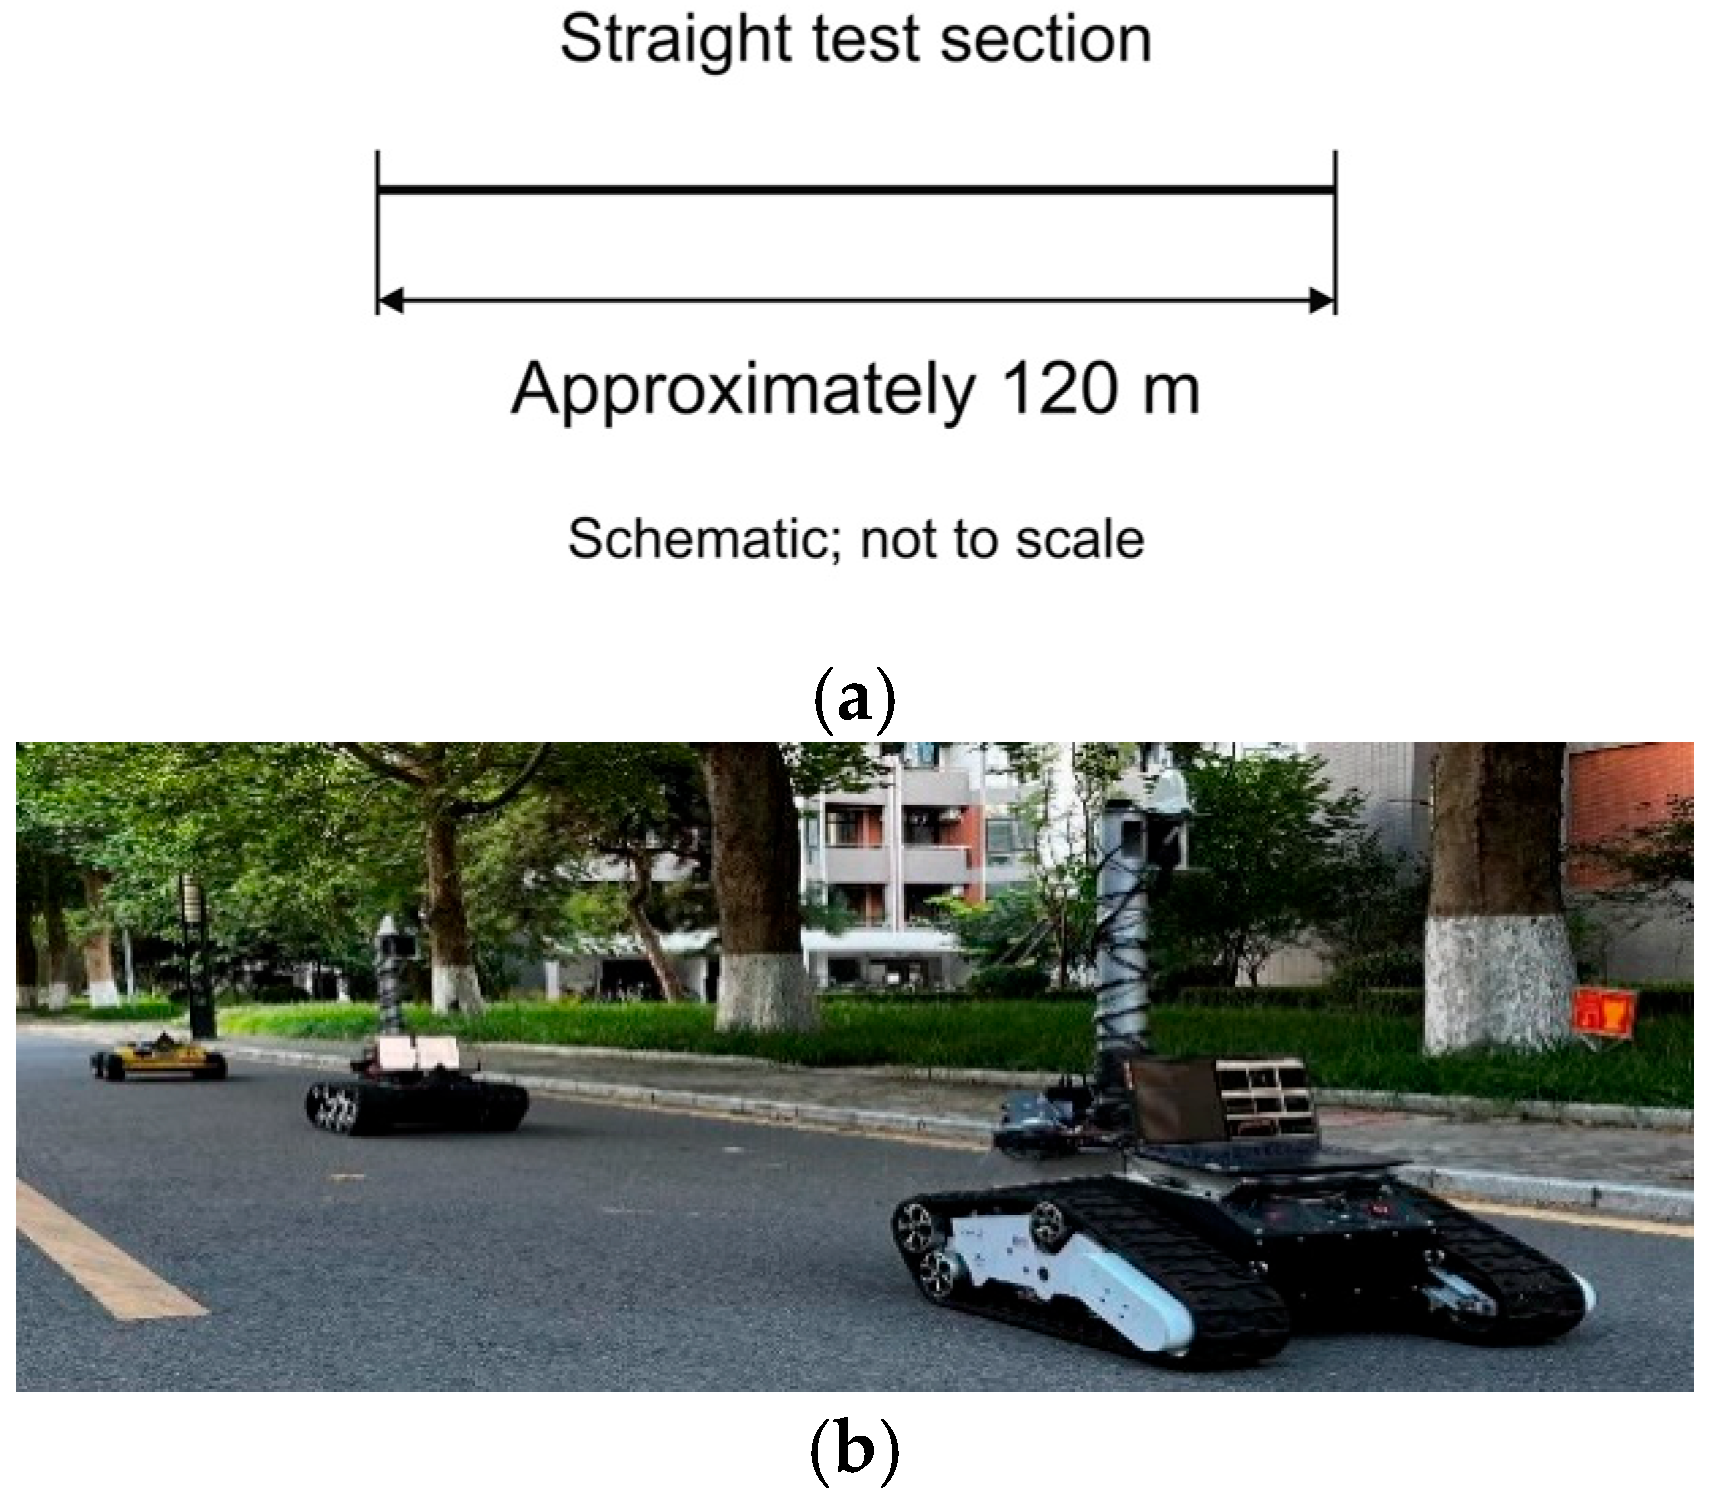
The test road was approximately 120 m long with clear lane markings, as shown in Figure 7. Leading-vehicle speed was manually controlled rather than prescribed by a repeatable scenario. The recorded variation defines the leader input for these demonstrations. Controlled robustness tests with prescribed speed profiles and varied road conditions are proposed in Section 4. The stable micro-vehicle spacing was set to 5 m under CACC and 6 m under long-distance ACC. Controller-transition signals are provided in Supplementary Figures S5–S8; Section 3.2 presents representative vehicle-state records.
Figure 7.
Micro-vehicle platoon testing scenarios: (a) schematic of the approximately 120 m straight test section (not to scale); (b) micro-vehicle platoon.
The experimental spacing values are scaled for the micro-vehicle platform rather than directly using the 70 m and 90 m full-scale takeover distances from the simulation. A 5 m spacing is used for normal CACC operation, and a 6 m spacing is used as the long-distance ACC target. For the variable-speed CC case, the final spacing can differ slightly because the controller adjusts speed through a deceleration–acceleration process rather than direct distance feedback. These scaled distances allow evaluation of the strategy logic and degraded response on the micro-vehicle platform.
Transfer to full-scale operation requires validation of braking capability, highway disturbances and driver takeover behavior, including the motion bounds used in Section 2.5.1.
3. Results and Discussion
3.1. Simulation Results and Discussion
Controller-transition signal plots are provided in Supplementary Figures S1–S4. They document the injected failure-state signals and the corresponding archived mode-code transitions. The main text therefore focuses on representative spacing and acceleration trajectories under the 30 m/s bend scenario.
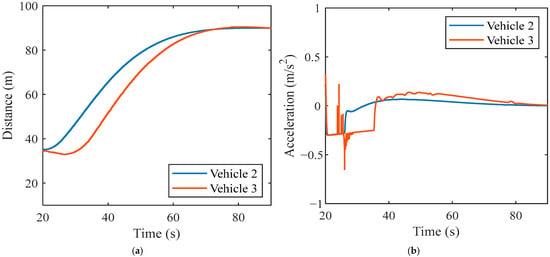
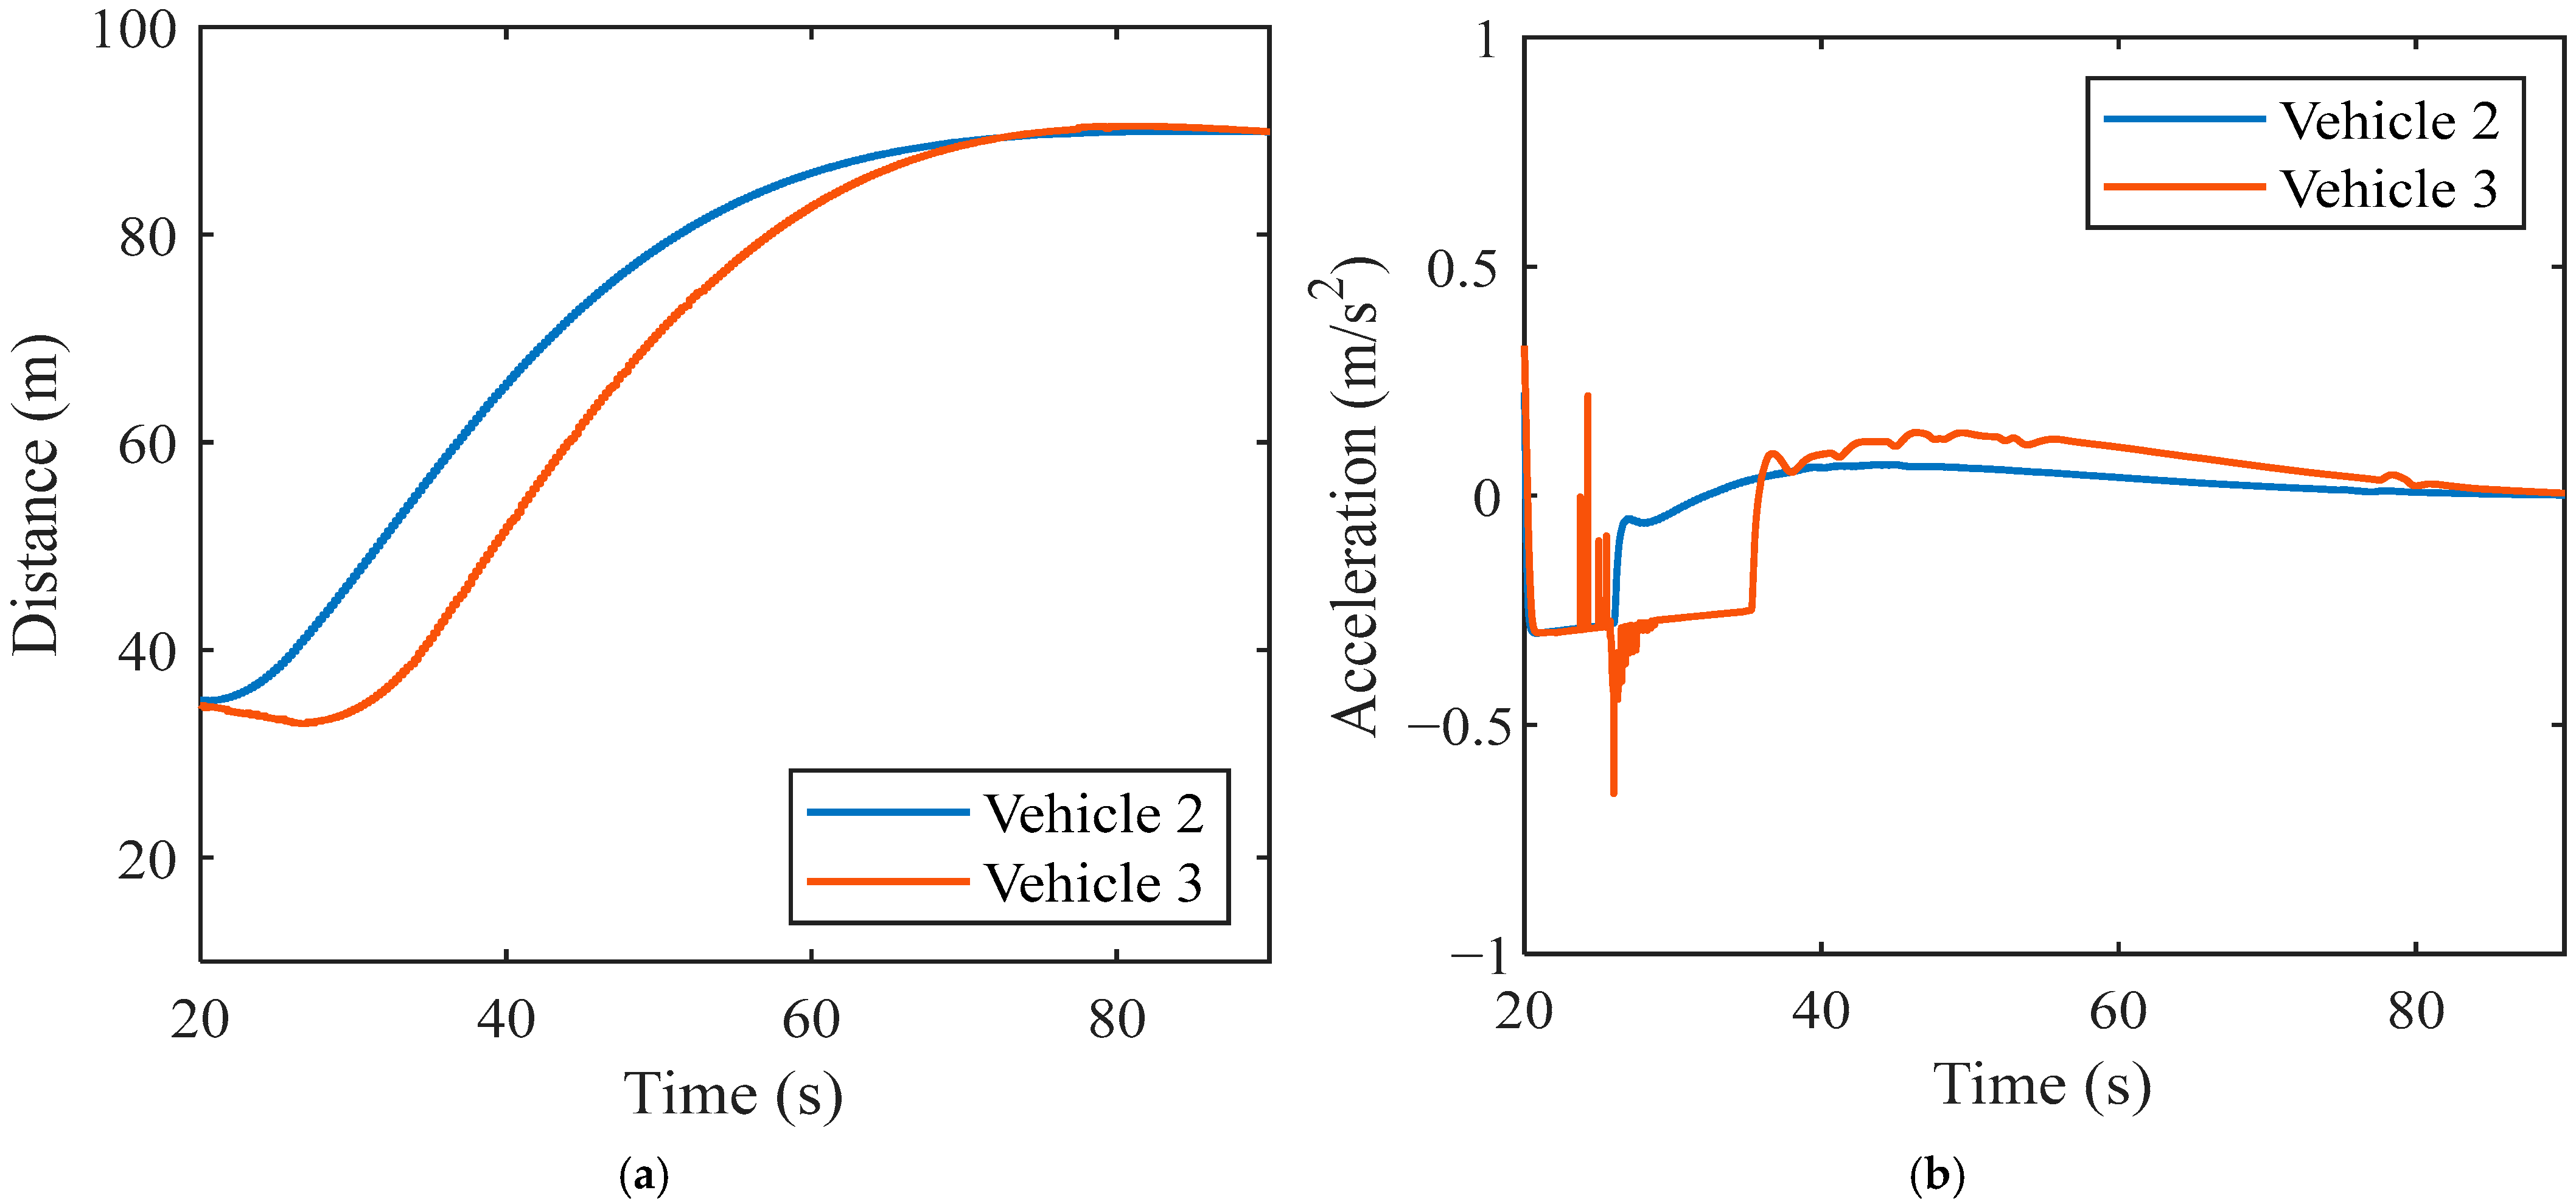
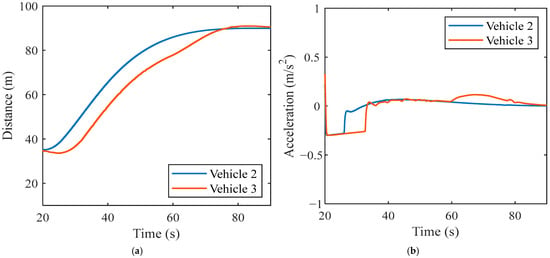
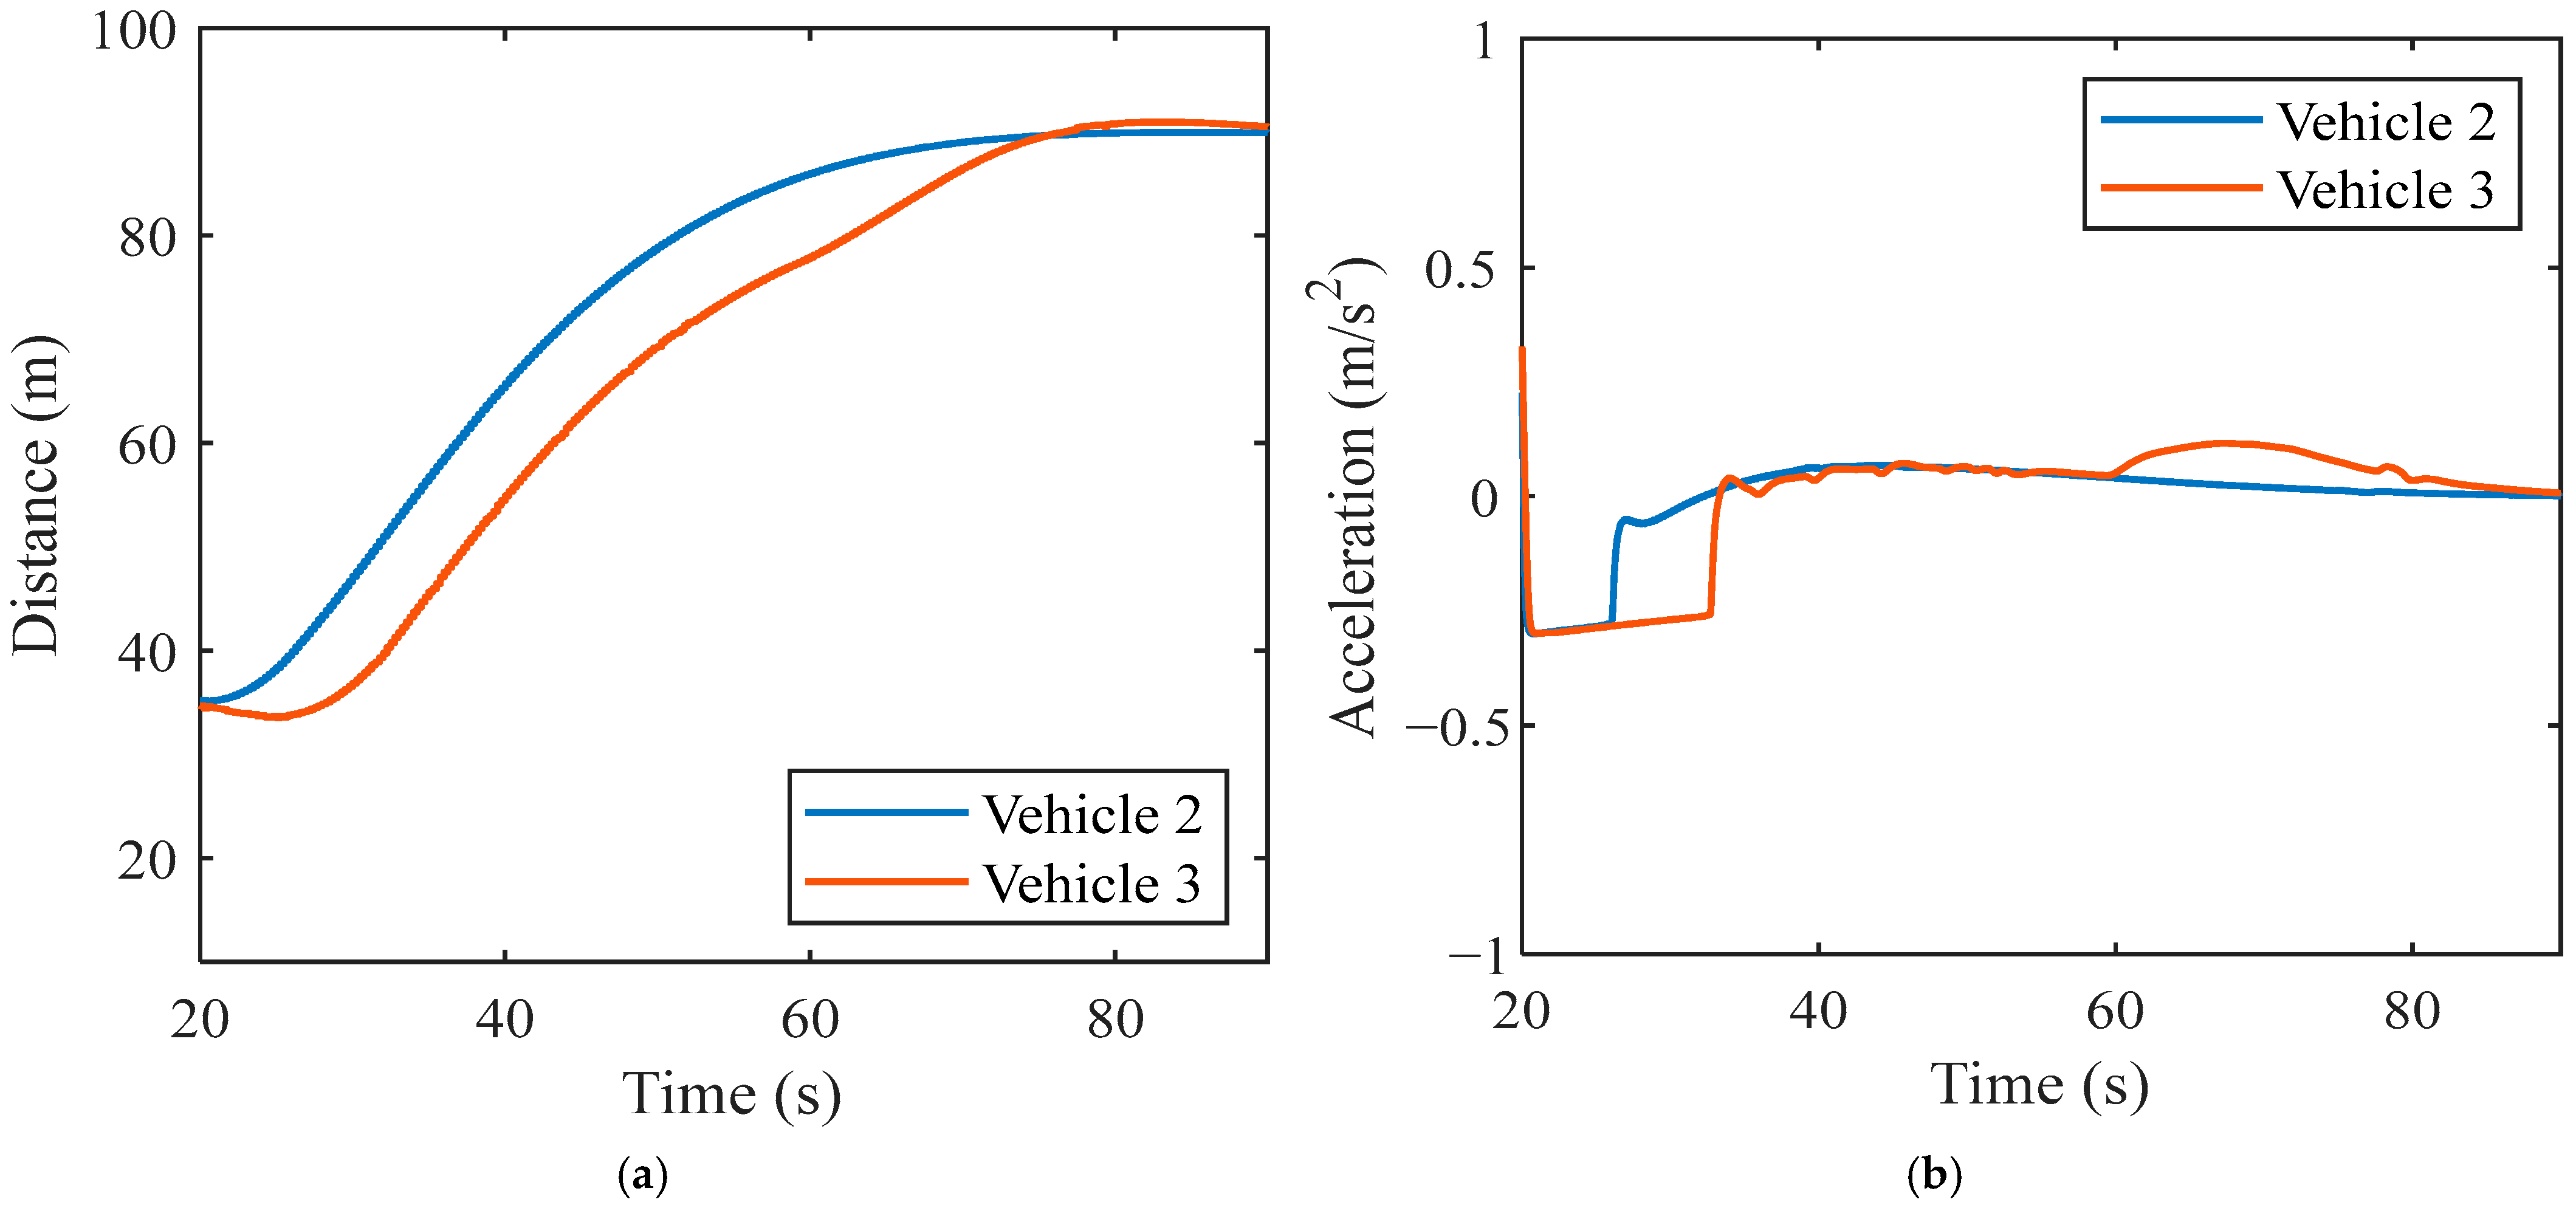
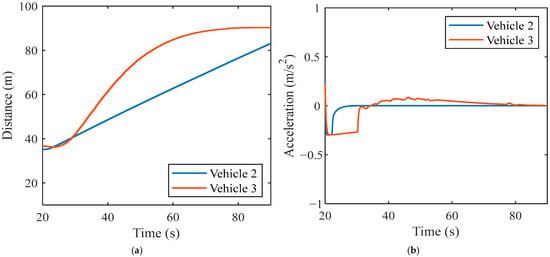
Representative simulation results are shown in Figure 8, Figure 9 and Figure 10. The simultaneous V2V and radar-loss bend cases have the largest spacing shortfalls: Vehicle 2 ends at 66.93 m in the 20 m/s case and 83.18 m in the 30 m/s case, below the respective 70 m and 90 m targets. The following analysis reports both the achieved responses and these shortfalls.
Figure 8.
Representative simulation results under leading-vehicle communication failure: (a) following distance at 30 m/s; (b) acceleration at 30 m/s.
Figure 9.
Representative simulation results under following-vehicle radar failure: (a) following distance at 30 m/s; (b) acceleration at 30 m/s.
Figure 10.
Representative simulation results under simultaneous V2V and radar failure in following vehicle 2: (a) following distance at 30 m/s; (b) acceleration at 30 m/s.
In Figure 8, after the leading-vehicle communication failure at 20 s, both following vehicles use long-distance ACC. Spacing increases from approximately 35 m to 89.91 m for vehicle 2 and 89.93 m for vehicle 3 at 90 s; the mean values over 85–90 s are 89.95 m and 90.15 m, respectively. Maximum absolute acceleration in the plotted trajectories is 0.30 m/s2 for vehicle 2 and 0.65 m/s2 for vehicle 3.
Figure 9 is associated with the following-vehicle radar-loss case, whose intended assignments are variable-speed CC for Vehicle 2 and long-distance ACC for Vehicle 3. The archived 90 s gaps are 89.92 and 90.49 m; 85–90 s means are 89.95 and 90.74 m. Comparison of the source arrays for Figure 8 and Figure 9 over 20–90 s finds Vehicle 2 spacing MAE 0.000344 m, maximum difference 0.001266 m and acceleration MAE 0.0000192 m/s2. Vehicle 3 differs substantially, with spacing MAE 2.046276 m (Table S7). Thus, the Vehicle 2 similarity already exists in the stored outputs, although the complete files differ. Without corresponding run configurations and controller states, these figures are qualified case records rather than independent evidence of differences between the two policies.
Figure 10 is associated with simultaneous V2V/radar loss, assigning fixed-speed CC to Vehicle 2 and long-distance ACC to Vehicle 3. At 90 s, the recorded gaps are 83.18 and 90.23 m; Vehicle 2 does not attain the nominal 90 m target. Both displayed acceleration magnitudes peak near 0.30 m/s2. Safe-duration assessment additionally requires validation of the gap and motion assumptions in Section 2.5.1. Table 7 summarizes the retained trajectories.
Table 7.
Trajectory-data summary for the 12 distinct archived simulation trajectories.
Across the 12 distinct archived trajectories, most terminal spacings are close to the 70 m or 90 m nominal settings, but exact target attainment is not universal. The largest shortfalls occur for vehicle 2 under simultaneous V2V and radar loss on the bend. Because fixed-speed CC lacks external feedback, this limitation is consistent with its intended use only as a temporary fallback pending takeover.
Table S7 localizes the near-duplicate response to Vehicle 2 but does not establish its cause or independent execution of the intended policies. A controlled comparison of long-distance ACC and variable-speed CC requires separately documented runs with complete configurations.
The six bend-road records have maximum absolute accelerations no greater than 0.650 m/s2 over 20–90 s. Each of the three 20 m/s straight-road simulation records contains one Vehicle 3 sample above the 1 m/s2 objective, at 20.01 s; adjacent samples are approximately −0.025 and −0.021 m/s2 (Table S2). The archived descriptions and plotting scripts identify these as simulation outputs, not measurements from the low-speed micro-vehicle experiments. In separate older seven-column records, a similar transient coincides with a velocity decrement consistent with the recorded acceleration (Table S3); those records are not matched reruns of the current files. A local straight-road kinematic check of the current records also agrees more closely with the recorded spacing when the full acceleration trace is retained (Table S4). These internal consistency checks do not establish physical realizability or distinguish controller-state transfer, solver behavior, and logging. The records do not include the matched independent velocity, actuator-command and controller-state traces needed to distinguish these explanations. The full-window statistics retain these samples and therefore preclude a general smooth-switching conclusion.
Supplementary Figures S1–S4 show the injected-fault and mode-code transitions. Their relationship to the trajectory-file evidence is discussed alongside the source comparison in Supplementary Section S7.
3.2. Experimental Results and Discussion
3.2.1. Leading-Vehicle Communication Failure
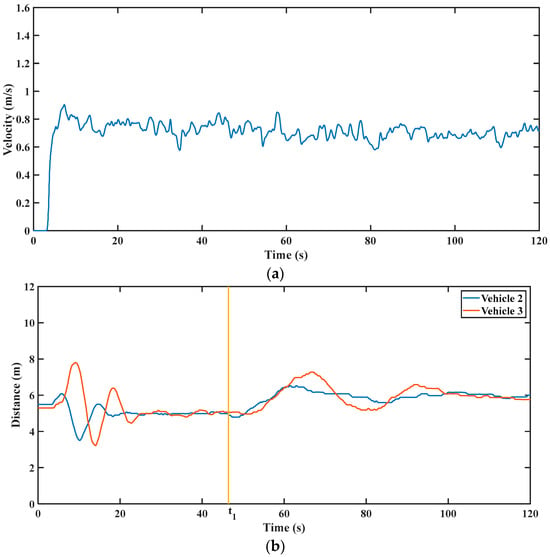
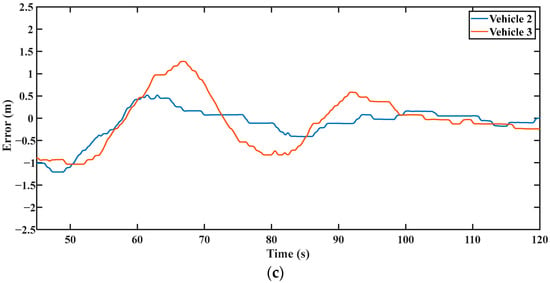
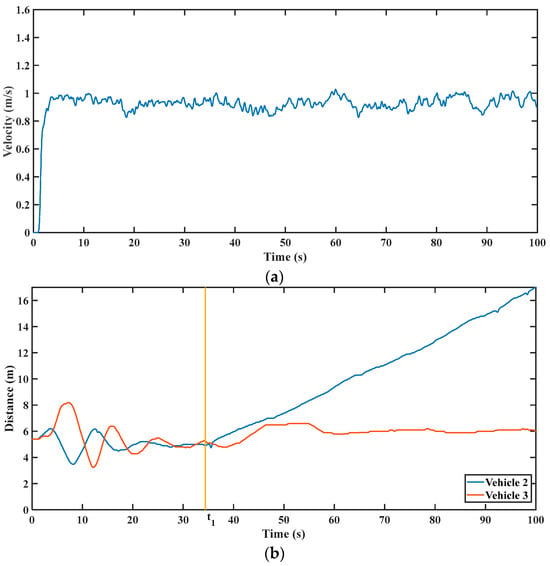
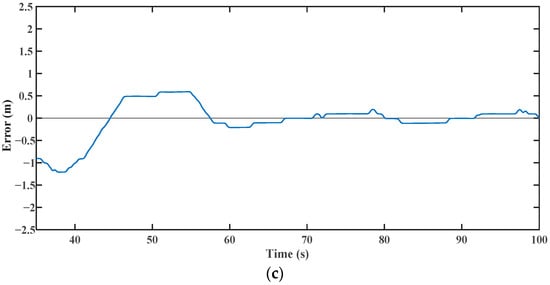
For leading-vehicle communication failure, the external roadside channel supplied a preceding-vehicle-failure label to both following vehicles, selecting long-distance ACC. Figure 11 shows the legacy processed representative trace approaching the 6 m reference. In the unfiltered final 10 s of that displayed record, mean gap deviations are −0.085 and −0.172 m, temporal SDs are 0.068 and 0.052 m, and maximum absolute deviations are 0.183 and 0.240 m for Vehicles 2 and 3, respectively (Table S8). Table S8 defines the single-record statistical window.
Figure 11.
Experimental results under leading-vehicle communication failure: (a) leading-vehicle speed; (b) following distance; (c) spacing error of the following vehicles.
The record shows the two followers responding to the externally supplied leader-failure label and approaching the long-distance ACC reference under the measured leader-speed input.
3.2.2. Following-Vehicle Communication Failure
When the communication data stream of Vehicle 2 was disabled, the external roadside fault-indication channel sent a self-communication-failure code to Vehicle 2 and a preceding-vehicle-failure code to Vehicle 3. Both vehicles therefore adopted long-distance ACC. Because the degraded controllers and target spacing are the same as those in the leading-vehicle communication-failure case, the vehicle-state curves are not repeated in the main text; the controller-transition signals are provided in Supplementary Figure S6.
This case confirms that the strategy distinguishes the failed vehicle from the rear following vehicle. Vehicle 2 retains radar and can follow its predecessor despite loss of its V2V data stream. Vehicle 3 receives the preceding-vehicle-failure code through the external roadside fault-indication channel and increases its safety buffer. The separate roadside channel supplies the status information used for this response.
3.2.3. Following-Vehicle Radar Failure
For the following-vehicle radar-loss case, the intended assignments are variable-speed CC for Vehicle 2 and long-distance ACC for Vehicle 3. Figure 12 shows the legacy processed representative record. Unfiltered final-window deviations have means of 0.016 and 0.156 m and temporal SDs of 0.036 and 0.087 m for Vehicles 2 and 3, relative to 6.8 and 6.0 m, respectively (Table S8). The 6.8 m reference describes the observed gap plateau, not a distance-feedback objective of variable-speed CC.
Figure 12.
Experimental results under following-vehicle radar failure: (a) leading-vehicle speed; (b) following distance; (c) spacing error of the following vehicles.
Radar exclusion prevents Vehicle 2 from using local distance feedback in the control loop, while retained V2V speed supports variable-speed CC. Vehicle 3 retains radar and uses long-distance ACC. This assignment follows the information-availability rules in Table 3.
The corresponding unfiltered maximum absolute deviations are 0.123 and 0.267 m. In particular, the raw Vehicle 2 peak exceeds the earlier 0.06 m summary and the approximately ±0.05 m smoothed-plot description. Table 6 now uses the reproducible raw-data statistics; the original processed curves have different filtering and evaluation conventions.
3.2.4. Following-Vehicle Simultaneous V2V and Radar Failure
For simultaneous V2V/radar loss in Vehicle 2, the roadside channel supplied local-failure and preceding-vehicle-failure labels to Vehicles 2 and 3. The selected modes were fixed-speed CC and long-distance ACC, respectively. Figure 13 retains the processed representative visualization. For Vehicle 3, the unfiltered final-window gap deviation from 6 m has mean 0.082 m, temporal SD 0.054 m and maximum absolute value 0.195 m (Table S8). Vehicle 2 is excluded from regulated-gap error statistics because its fixed-speed policy has no external gap feedback.
Figure 13.
Experimental results under simultaneous V2V and radar failure in following Vehicle 2: (a) leading-vehicle speed; (b) following distance; (c) spacing error of Vehicle 3.
The simultaneous-loss record illustrates the temporary held-speed response under the recorded steady-cruising input. The fallback-duration condition in Equation (9) additionally requires justified initial-state and acceleration bounds for changes in surrounding traffic.
The physical records show mode selection and degraded responses on the electric micro-vehicle platform under externally supplied fault labels. The representative-record statistics in Table S8 characterize these responses within the recorded windows.
The platform tests exercise actual sensors, V2V hardware, controllers and actuators. Conditional clearance and delay analysis (Section 2.5.1; Table S6) and signal-consistency checks (Tables S2–S4, S7 and S8) supplement these observations. Further validation should combine formal checks that each selected mode uses available inputs, hardware-in-the-loop tests of delayed, asymmetric and recovering communication, and controlled closed-course trials. Synchronized fault, controller and actuator logs are needed to evaluate the complete switching chain.
4. Conclusions
This study links a preliminary ISO 26262-oriented hazard assessment to three information-dependent degraded reference policies. It extends the architecture and role-dependent fallback in [26] through hazard-to-action traceability, explicit reference/error definitions and dedicated failure-case evaluation.
The 16-condition simulation matrix is represented by 12 distinct state files, with shared communication-case trajectories. The electric micro-vehicle tests demonstrate mode switching under externally supplied labels, and the physical-record statistics characterize the recorded spacing responses. Reanalysis is supported by the supplied data and methods; complete controller reproduction and independent-trial uncertainty remain limited, as detailed in Section 2.6 and Section 2.7.2.
The results include terminal spacings of 66.93 and 83.18 m, below the respective 70 and 90 m targets for Vehicle 2 in simultaneous-loss bend cases, an unresolved acceleration sample near −8.94 m/s2 in each 20 m/s straight-road file, and near-identical Vehicle 2 traces in Figure 8 and Figure 9. These observations limit conclusions about target attainment, smooth switching and cross-controller performance. The gap and delay inequalities describe conditional clearance requirements whose motion bounds still require validation.
Further work should resolve the switching and trajectory-provenance anomalies, validate a fully calibrated model, and obtain matched repeated trials with bounded end-to-end diagnostic latency. Longer closed-course tests should use predefined acceleration/deceleration and cut-in scenarios, vary curvature, grade and surface conditions separately, and record the realized leader-speed profile. Full-scale electric-vehicle evaluation should integrate torque and braking limits, delayed takeover and electric-actuation constraints. The present evidence supports implementation feasibility under the tested conditions and defines the additional work needed to establish a safe operating envelope.
Supplementary Materials
The following are available online at https://www.mdpi.com/article/10.3390/wevj17100499/s1, Figure S1: Signals during a leading-vehicle communication failure in simulation; Figure S2: Signals during a following-vehicle communication failure in simulation; Figure S3: Signals during a following-vehicle radar failure in simulation; Figure S4: Signals during simultaneous V2V and radar failures in following vehicle 2 in simulation; Figure S5: Controller transition and failure signal under leading-vehicle communication failure in the on-road experiment; Figure S6: Controller transition and failure signal under following-vehicle communication failure in the on-road experiment; Figure S7: Controller transition and failure signal under following-vehicle radar failure in the on-road experiment; Figure S8: Controller transition and failure signal under simultaneous V2V and radar failures in following vehicle 2 in the on-road experiment. Table S1: Availability of scenario settings and implementation parameters; Table S2: Vehicle 3 acceleration samples and peak statistics in the three 20 m/s straight-road records. Acceleration values are in m/s2. Table S3: Vehicle 3 velocity and acceleration at 20.01 s in the separate archival comparison records; Table S4: Spacing prediction RMSE over four post-switch updates with a 19–20 s pre-event fit and trapezoidal integration. The supplementary methods describe the reanalysis and its limitations. Table S5: Preliminary hazard classification status, safety objectives and mapped test coverage; Table S6: Conditional durations with assumed clearance 5 m and initial closing speed 2 m/s. All acceleration bounds are illustrative assumptions; Table S7: Differences between the unfiltered source arrays underlying Figure 8 and Figure 9; Table S8: Unfiltered final-window spacing deviations in three representative records. Units are metres except N; Table S9: Method overlap and distinctions.
Author Contributions
Conceptualization, Y.Z. and W.K.; methodology, Y.Z., W.K. and C.X.; software, Y.Z. and C.X.; validation, Y.Z., C.X. and W.Z.; formal analysis, Y.Z.; investigation, Y.Z., C.X. and W.Z.; resources, W.K., Y.L. and F.J.; data curation, Y.Z. and W.Z.; writing—original draft preparation, Y.Z.; writing—review and editing, W.K., C.X., Y.L. and F.J.; visualization, Y.Z. and W.Z.; supervision, W.K., Y.L. and F.J.; project administration, W.K.; funding acquisition, W.K. All authors have read and agreed to the published version of the manuscript.
Funding
This study was sponsored by the Open Fund Project of State Key Laboratory of Intelligent Green Vehicle and Mobility (No. KFZ260402). This study was also supported by the Beijing Nova Program (Interdisciplinary Cooperation Project, grant number 202504841005) and the 2115 Talent Development Program of China Agricultural University. The funders had no role in the design of the study; in the collection, analyses, or interpretation of data; in the writing of the manuscript; or in the decision to publish the results.
Institutional Review Board Statement
Not applicable.
Informed Consent Statement
Not applicable.
Data Availability Statement
The simulation trajectories, plotting scripts and experimental data supporting this study are available from the corresponding author upon reasonable request. The reanalysis package includes 12 simulation files, three separately identified earlier comparison files, three representative physical records, source checksums, and Python 3.12.14 methods for the statistical and consistency checks. File, signal and time-window mappings accompany the trajectory comparisons, raw physical statistics and conditional-bound calculations. The reproducibility scope and implementation-documentation limits are specified in Section 2.6 and Table S1.
Conflicts of Interest
Chunhui Xing is an employee of DIAS Automotive Electronic Systems Co., Ltd. The remaining authors declare that the research was conducted in the absence of any commercial or financial relationships that could be construed as a potential conflict of interest.
Abbreviations
The following abbreviations are used in this manuscript:
| V2V | Vehicle-to-vehicle |
| V2X | Vehicle-to-everything |
| CAV | Connected and automated vehicle |
| CACC | Cooperative adaptive cruise control |
| ACC | Adaptive cruise control |
| CC | Cruise control |
| PID | Proportional-integral-derivative |
| AEB | Automatic emergency braking |
| LCC | Lane center control |
| LC | Lane change |
| PC | Personal computer |
| DC | Direct current |
| CG | Center of gravity |
| MAE | Mean absolute error |
| ASIL | Automotive safety integrity level |
| HAZOP | Hazard and Operability Study |
| DDT | Dynamic driving task |
| ISO | International Organization for Standardization |
| IEC | International Electrotechnical Commission |
References
- Li, H.; Meng, W.; Han, Z.; Zhang, Z.; Yang, Y. Vehicle platoon in road traffic: A survey of modeling, communication, controlling and perspectives. Physica A 2025, 674, 130757. [Google Scholar] [CrossRef] [Scilit]
- McAuliffe, B.R.; McTavish, S.; Raeesi, A.; Harrison, S. Energy and environmental benefits of truck platooning for a busy freight corridor. Transp. Res. Part D Transp. Environ. 2025, 149, 105001. [Google Scholar] [CrossRef] [Scilit]
- Zheng, S.-T.; Jiang, R.; Chen, X.M.; Tian, J.; Han, X.; Yan, R.; Jia, B.; Qu, X.; Li, Z.-H.; Gao, L.-D.; et al. Communicating with two vehicles immediately ahead boosts traffic capacity sixfold in connected autonomous vehicle platoons. Commun. Eng. 2025, 4, 160. [Google Scholar] [CrossRef] [Scilit] [PubMed]
- Zheng, Y.; Pu, Z.; Li, S.; Han, Y.; Xi, H.; Ran, B. Measuring platooning performances of connected and automated vehicles in energy consumption, emission, and efficiency. Energy 2025, 326, 136172. [Google Scholar] [CrossRef] [Scilit]
- Balador, A.; Bazzi, A.; Hernandez-Jayo, U.; de la Iglesia, I.; Ahmadvand, H. A survey on vehicular communication for cooperative truck platooning application. Veh. Commun. 2022, 35, 100460. [Google Scholar] [CrossRef] [Scilit]
- Chen, J.; Liu, J.; Ding, H.; Cheng, Z.; Zhang, W. Enhanced cooperative driving strategy for CAV platoons via quantized feedback control under limited channel bandwidth. Automot. Innov. 2026, 9, 88–101. [Google Scholar] [CrossRef] [Scilit]
- Zheng, Y.; Zhang, Y.; Qu, X.; Li, S.; Ran, B. Developing platooning systems of connected and automated vehicles with guaranteed stability and robustness against degradation due to communication disruption. Transp. Res. Part C Emerg. Technol. 2024, 168, 104768. [Google Scholar] [CrossRef] [Scilit]
- Li, Z.; Zhou, Y.; Zhang, Y.; Li, X. Enhancing vehicular platoon stability in the presence of communication cyberattacks: A reliable longitudinal cooperative control strategy. Transp. Res. Part C Emerg. Technol. 2024, 163, 104660. [Google Scholar] [CrossRef] [Scilit]
- Liu, R.; Ren, Y.; Yu, H.; Li, Z.; Jiang, H. Connected and automated vehicle platoon maintenance under communication failures. Veh. Commun. 2022, 35, 100467. [Google Scholar] [CrossRef] [Scilit]
- ISO 26262-3:2018; Road Vehicles—Functional Safety—Part 3: Concept Phase. International Organization for Standardization: Geneva, Switzerland, 2018. Available online: https://www.iso.org/standard/68385.html (accessed on 17 September 2026).
- Stolte, T.; Ackermann, S.; Graubohm, R.; Jatzkowski, I.; Klamann, B.; Winner, H.; Maurer, M. A taxonomy to unify fault tolerance regimes for automotive systems: Defining fail-operational, fail-degraded, and fail-safe. IEEE Trans. Intell. Veh. 2022, 7, 251–262. [Google Scholar] [CrossRef] [Scilit]
- Wang, L.; Hu, M.; Bian, Y.; Guo, G.; Li, S.E.; Chen, B.; Zhong, Z. Periodic event-triggered fault detection for safe platooning control of intelligent and connected vehicles. IEEE Trans. Veh. Technol. 2024, 73, 5064–5077. [Google Scholar] [CrossRef] [Scilit]
- Lopes, A.; Araujo, R.E. Active fault diagnosis method for vehicles in platoon formation. IEEE Trans. Veh. Technol. 2020, 69, 3590–3603. [Google Scholar] [CrossRef] [Scilit]
- Viadero-Monasterio, F.; Melendez-Useros, M.; Jimenez-Salas, M.; Lopez Boada, M.J. Fault-tolerant robust output-feedback control of a vehicle platoon considering measurement noise and road disturbances. IET Intell. Transp. Syst. 2025, 19, e70007. [Google Scholar] [CrossRef] [Scilit]
- Gratzer, A.L.; Thormann, S.; Schirrer, A.; Jakubek, S. String stable and collision-safe model predictive platoon control. IEEE Trans. Intell. Transp. Syst. 2022, 23, 19358–19373. [Google Scholar] [CrossRef] [Scilit]
- Wang, J.; Zhou, A.; Liu, Z.; Peeta, S. Robust cooperative control strategy for a platoon of connected and autonomous vehicles against sensor errors and control errors simultaneously in a real-world driving environment. Transp. Res. Part B Methodol. 2024, 184, 102946. [Google Scholar] [CrossRef] [Scilit]
- Zhao, G.; Dai, G.; Peng, B.; Cui, H. Adaptive fault-tolerant control of platoons with prescribed tracking performance. Int. J. Control Autom. Syst. 2024, 22, 2158–2170. [Google Scholar] [CrossRef] [Scilit]
- Shen, Z.; Liu, Y.; Li, Z.; Wu, Y. Distributed vehicular platoon control considering communication delays and packet dropouts. J. Frankl. Inst. 2024, 361, 106703. [Google Scholar] [CrossRef] [Scilit]
- Yang, L.; Sun, Z.; Liu, Y.; Chen, L. Robust control for connected automated vehicle platoon with multiple-predecessor following topology considering communication loss. Transp. Res. Part B Methodol. 2025, 196, 103212. [Google Scholar] [CrossRef] [Scilit]
- Shen, Z.; Guo, H.; Liu, Y.; Li, Z.; Wu, Y. Cooperative spacing control of vehicle platoon via relative output feedback considering analog fading networks. Int. J. Robust Nonlinear Control 2025, 35, 909–923. [Google Scholar] [CrossRef] [Scilit]
- Thormann, S.; Schirrer, A.; Jakubek, S. Safe and efficient cooperative platooning. IEEE Trans. Intell. Transp. Syst. 2022, 23, 1368–1380. [Google Scholar] [CrossRef] [Scilit]
- Sun, C.; Ning, M.; Deng, Z.; Khajepour, A. REAL-SAP: Real-time evidence-aware liable safety assessment for perception in autonomous driving. IEEE Trans. Veh. Technol. 2024, 73, 10870–10883. [Google Scholar] [CrossRef] [Scilit]
- Ma, G.; Pagilla, P.R.; Darbha, S. Selection of time headway in connected and autonomous vehicle platoons under noisy V2V communication. IEEE Trans. Intell. Transp. Syst. 2025, 26, 1029–1038. [Google Scholar] [CrossRef] [Scilit]
- Wang, J.; Tong, T.; Cao, J.; Li, S. Distributed sliding mode control approach with adaptive spacing policy for vehicle platoons in communication interruption scenario. Sci. Rep. 2025, 15, 20409. [Google Scholar] [CrossRef] [Scilit] [PubMed]
- IEC 61882:2016; Hazard and Operability Studies (HAZOP Studies)—Application Guide. International Electrotechnical Commission: Geneva, Switzerland, 2016.
- Liu, C.; Luo, Y.; Li, P.; Xing, C.; Kong, W. An extendable maneuver management framework with fault-tolerant mechanism for vehicle platoon control system in highway scenario. IET Intell. Transp. Syst. 2023, 17, 2075–2088. [Google Scholar] [CrossRef] [Scilit]

Disclaimer/Publisher’s Note: The statements, opinions and data contained in all publications are solely those of the individual author(s) and contributor(s) and not of MDPI and/or the editor(s). MDPI and/or the editor(s) disclaim responsibility for any injury to people or property resulting from any ideas, methods, instructions or products referred to in the content. |
© 2026 by the authors. Published by MDPI on behalf of the World Electric Vehicle Association. Licensee MDPI, Basel, Switzerland. This article is an open access article distributed under the terms and conditions of the Creative Commons Attribution (CC BY) license.