


Abstract
Introduction: Medicine prices change over the product life cycle, especially around loss of exclusivity (LoE), yet economic evaluations often assume constant prices, which may bias cost-effectiveness and budget impact estimates. Methods: We developed and internally validated a forecasting approach for Dutch medicine price trajectories for use in cost-effectiveness analyses. Using monthly Farminform sales data (from 2000 onwards) for 384 Anatomical Therapeutic Chemical (ATC) codes meeting the inclusion criteria (>5 years of data, <6 months missing, data after 2017), we derived inflation-adjusted mean prices per defined daily dose. A stacked machine learning ensemble, combining XGBoost, Random Forest, Bayesian additive regression trees, a regularised generalised linear model, and LightGBM gradient boosting, was tuned by ATC-grouped cross-validation to minimise root mean squared error (RMSE), with weights estimated by non-negative penalised regression. Results: Predictors included therapeutic class and subgroup, market entry period, initial price, revenue group, time on market, LoE status and time since LoE, inflation, and competitor availability. On 103 held-out time series, the six-model ensemble achieved an RMSE of 0.199. Predicted trajectories were highly accurate for 26% of products (within ±5% of observed prices) and of medium accuracy for 47% (overall trend captured; most observations within ±12.5%). Poor accuracy (27%) mainly reflected abrupt price shifts linked to policy changes, reimbursement decisions, or pricing negotiations. Conclusions: Forecasting life-cycle medicine price trajectories is feasible for most products and can support more realistic economic evaluations and reimbursement deliberations in the Netherlands. Remaining challenges include anticipating policy-driven discontinuities and improving interpretability of machine-learning-based forecasts.
1. Introduction
Healthcare systems worldwide face unprecedented challenges as healthcare costs continue to rise, and governments strive to balance healthcare affordability, accessibility, and sustainability, especially regarding new, innovative and potentially life-saving interventions [1,2,3]. A significant share of cost-containment policy has focused on medicine prices, resulting in increased delays in reimbursement and more limited access to medicines [2,4,5,6,7]. In many countries, this has increased the gap between regulatory approval and national reimbursement decisions, potentially at the expense of health benefits since patients benefit from timely access to effective treatments [7,8].
The price of innovative medicines has become a focal point in reimbursement debates and a frequent justification for limited reimbursement [9,10,11]. In the Netherlands, multiple policy instruments have been introduced to inform reimbursement decisions or to directly restrict medicine prices [4]. These include budget impact and cost-effectiveness evaluations, conditional reimbursement, reference pricing, preference policies, and direct (confidential) price negotiations [4,12]. These mechanisms shape the pricing of medicines both before and after loss of exclusivity (LoE). Price dynamics are driven by a range of factors, including competition, patent protection, entry of generics, reference pricing, reimbursement regulation, and value-based or differential pricing strategies [13]. However, traditional health economic evaluations such as cost-effectiveness analysis (CEA) and budget impact analysis (BIA) generally adopt static prices, thereby failing to reflect real-world medicine price dynamics.
Previous research has shown that following the LoE, list prices of medicines in the Netherlands decreased substantially, on average by 41% in the first 48 months after LoE [14]. These reductions were more pronounced for medicines with higher pre-LoE revenues, underscoring the need to integrate price trajectories into economic evaluations to obtain more accurate cost-effectiveness estimates [14].
Further evidence from research illustrates the impact of including dynamic prices in CEA: in four CEA case studies, incorporating dynamic prices reduced the incremental cost-effectiveness ratio (ICER) by up to 43% in a single-cohort approach and by up to 113% in a multicohort approach [15]. In one example, the ICER shifted from €9241 per quality-adjusted life year (QALY) to cost-saving compared with the conventional static-price approach [15]. This highlights the relevance of accounting for price dynamics, especially for evaluations with time horizons extending beyond exclusivity periods. For newer medicines competing with those nearing or past LoE, price dynamics may follow different patterns.
Modelling price dynamics provides a more realistic framework for decision-making and may enhance the efficiency and equity of patient access to effective treatments. In this paper, we aim to describe the approach for predicting price dynamics of medicines, assess the validity of such predictions in the Dutch context, and discuss their implications for health economic evaluation and reimbursement policy.
2. Methods
2.1. Data Collection and Preparation
The price prediction model was developed using monthly sales data from the Farminform database, consisting of medicine prices in the Netherlands by Anatomical Therapeutic Chemical (ATC) code and manufacturer [16]. The dataset was filtered to include medicines introduced from 1 January 2000 onwards. To ensure robustness of the price prediction model, we included only ATC codes with more than five years of data and fewer than six months of missing observations. Products were excluded if no data were available after 2017 or if monthly revenues fell below €100. After applying these criteria, 384 unique ATC codes were included.
Monthly medicine prices were calculated as illustrated in Figure 1. Specifically, revenue, sales volume, and defined daily dose (DDD) per package were used to derive the average price per DDD for each ATC code. The calculated prices are pharmacy purchase prices (list prices) and exclude any fees, discounts, or value-added tax. In the calculation, all pharmaceutical forms, dosage forms, and strengths were included. Inflation adjustments were applied using data from Statistics Netherlands (CBS) [17]. To capture long-term trends rather than short-term fluctuations, prices were smoothed using moving annual averages. The initial year’s average price per DDD was used as the reference point, expressed as a relative value of 100. To approximate a normal distribution and facilitate modelling, relative prices were further transformed using a Box–Cox transformation.
Figure 1.
Method for calculating the relative price per DDD of medicine. DDD: defined daily dose, ATC: Anatomical Therapeutic Chemical, inf: inflation.
2.2. Model Development
The forecasting model framework was based on an ensemble approach, integrating multiple machine learning algorithms to improve predictive accuracy. Historical price and volume data were supplemented with external sources and used to train the model. Five algorithms were included: XGBoost, a Random Forest model implemented with the ranger package, a generalised linear model (GLM), a gradient boosting machine (GBM) using LightGBM, and Bayesian additive regression trees (BART) [18,19,20,21]. These algorithms represent different modelling approaches. XGBoost and LightGBM are gradient-boosting methods that build regression trees in sequence, each correcting the errors of the previous trees. The Random Forest (ranger) instead builds many trees in parallel and averages them to reduce variance. BART is a Bayesian tree-based model that also provides a measure of prediction uncertainty. The regularised GLM (elastic net) contributed a simple, interpretable linear component to the ensemble.
The dataset was divided into training and testing sets. Hyperparameters were tuned to minimise the root mean squared error (RMSE) within the training set, which was further split using five-fold cross-validation repeated three times, with folds grouped by ATC code so that all observations for a product remained in the same fold. The hyperparameters tuned differed by algorithm: for the gradient-boosting learners (XGBoost, LightGBM), these included the number of boosting iterations, the learning rate, the maximum tree depth, the minimum loss reduction required for a split, the minimum node size, and the number of candidate variables sampled at each split [18,20]. For the Random Forest, these were the number of trees, the number of candidate variables sampled at each split and the minimum node size; for BART, they were the number of trees and the priors governing tree depth (base and power) and shrinkage (k) [19,21]. For the four tree-based algorithms, the Bayesian optimiser iteratively proposed hyperparameter combinations expected to lower the RMSE. The regularised GLM was instead tuned by grid search over 11 penalty and 11 mixture values (121 combinations). The best-performing candidate configurations of each algorithm (the top ten for XGBoost, Random Forest and LightGBM, the top three for BART and all 121 GLM configurations; 154 candidates in total) were combined into a stacked ensemble, with weights estimated by non-negative least absolute shrinkage and selection operator (LASSO) regression to minimise predictive error; the penalty, selected by bootstrap resampling, set most candidate weights to zero and thereby determined which candidates were retained. This ensemble approach was designed to enhance model robustness; the weights were fitted to held-out (assessment) predictions from cross-validation resamples of the training set rather than in-sample predictions.
The training and testing sets were split by ATC code, stratified by ATC therapeutic subgroup (with small subgroups combined), with between 25% and 30% of codes in each stratum assigned to the testing set. The cross-validation was derived from the training set. The testing set was only used to check the ensemble model performance, not to fit the models. Of the 384 distinct ATC codes meeting the inclusion criteria (first listed from 2000 onwards, listed after 2017, more than five years of records and fewer than six months of missing data; data span 2000–2024), 73.2% (minimum–maximum across strata: 63.8–100%) had more than 10 years of data available, and 26.3% (minimum–maximum across strata: 11.1–75.0%) had more than 20 years of data. This was deemed sufficient data for both short- and long-term predictions.
2.3. Predictor Variables
Predictor variables were derived from both the primary dataset and complementary external sources, including the European Medicines Agency (EMA) database and the Dutch GIP-databank [22,23]. Candidate regressors were tested for inclusion in the machine learning models. Based on predictive performance, ten primary regressors were selected as key determinants of pharmaceutical price dynamics in the Netherlands (Table 1). The LoE, Consumer Price Index (CPI), and availability of generics were assumed based on the historic data available from the training set.
Table 1.
Overview of time-independent and time-dependent regressors. ATC: Anatomical Therapeutic Chemical; CPI: Consumer Price Index.
To facilitate long-term forecasting, time-dependent regressors were minimised, and emphasis was placed on factors that could be reasonably estimated in advance, such as product characteristics, revenue levels, and therapeutic class.
The following time-independent and time-dependent regressors were included in the final model:
- Main ATC group: Therapeutic class of the medicine, based on the first level of the ATC classification system.
- ATC subgroup: More specific therapeutic categories, included for large subgroups within the ATC system to capture differences in price dynamics between related medicines.
- Date of market entry: Indicator variable distinguishing medicines introduced before versus after 2010, to account for regulatory, policy, and market changes over time.
- Initial price: The average price per DDD in the first year after market entry, used as a baseline reference for subsequent price changes.
- Revenue group: Categorisation of medicines by annual revenue, with thresholds set at €1 million and €10 million to distinguish low-, medium-, and high-revenue products.
- Time on the market: Number of days since the medicine’s initial market entry, reflecting the product life cycle stage.
- Loss of exclusivity: Indicator variable denoting whether a product has lost patent or data exclusivity protection.
- Time since loss of exclusivity: Number of days elapsed since loss of exclusivity, used to capture post-LoE price dynamics.
- CPI: Consumer Price Index adjustment to account for inflation effects over time.
- Availability of generics: Indicator of whether competitors are present in the market, as a key driver of price reductions.
2.4. Outcome Assessment
The ensemble model, built using the training set, was tested across 103 time series from the testing set, comparing each prediction to the actual observed price trajectory. Based on visual assessment, transformed predictions were categorised into four categories (Q1–Q4) using the visual ranges surrounding the observed data of 10% (5% above and 5% below) and 25% (12.5% above and 12.5% below). Q1 predictions fall primarily within the 10% range of the observed data; Q2 primarily between the 10% and 25% ranges with the overall price trend accurately captured; Q3 largely within the 25% range but with the overall trend only partially captured; and Q4 predictions primarily fall outside the 25% range of the observed data. Predictions were compared to the annual moving average of relative prices.
3. Results
3.1. Ensemble Composition
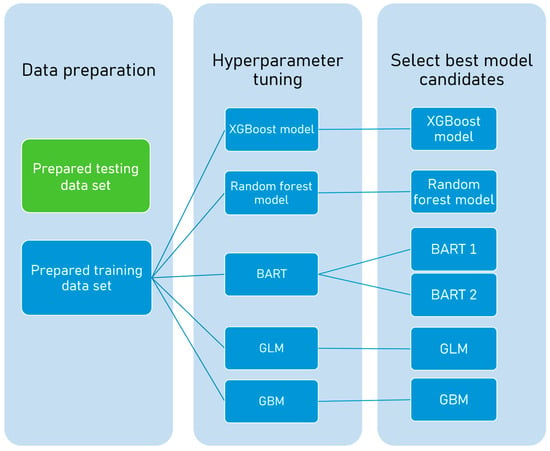
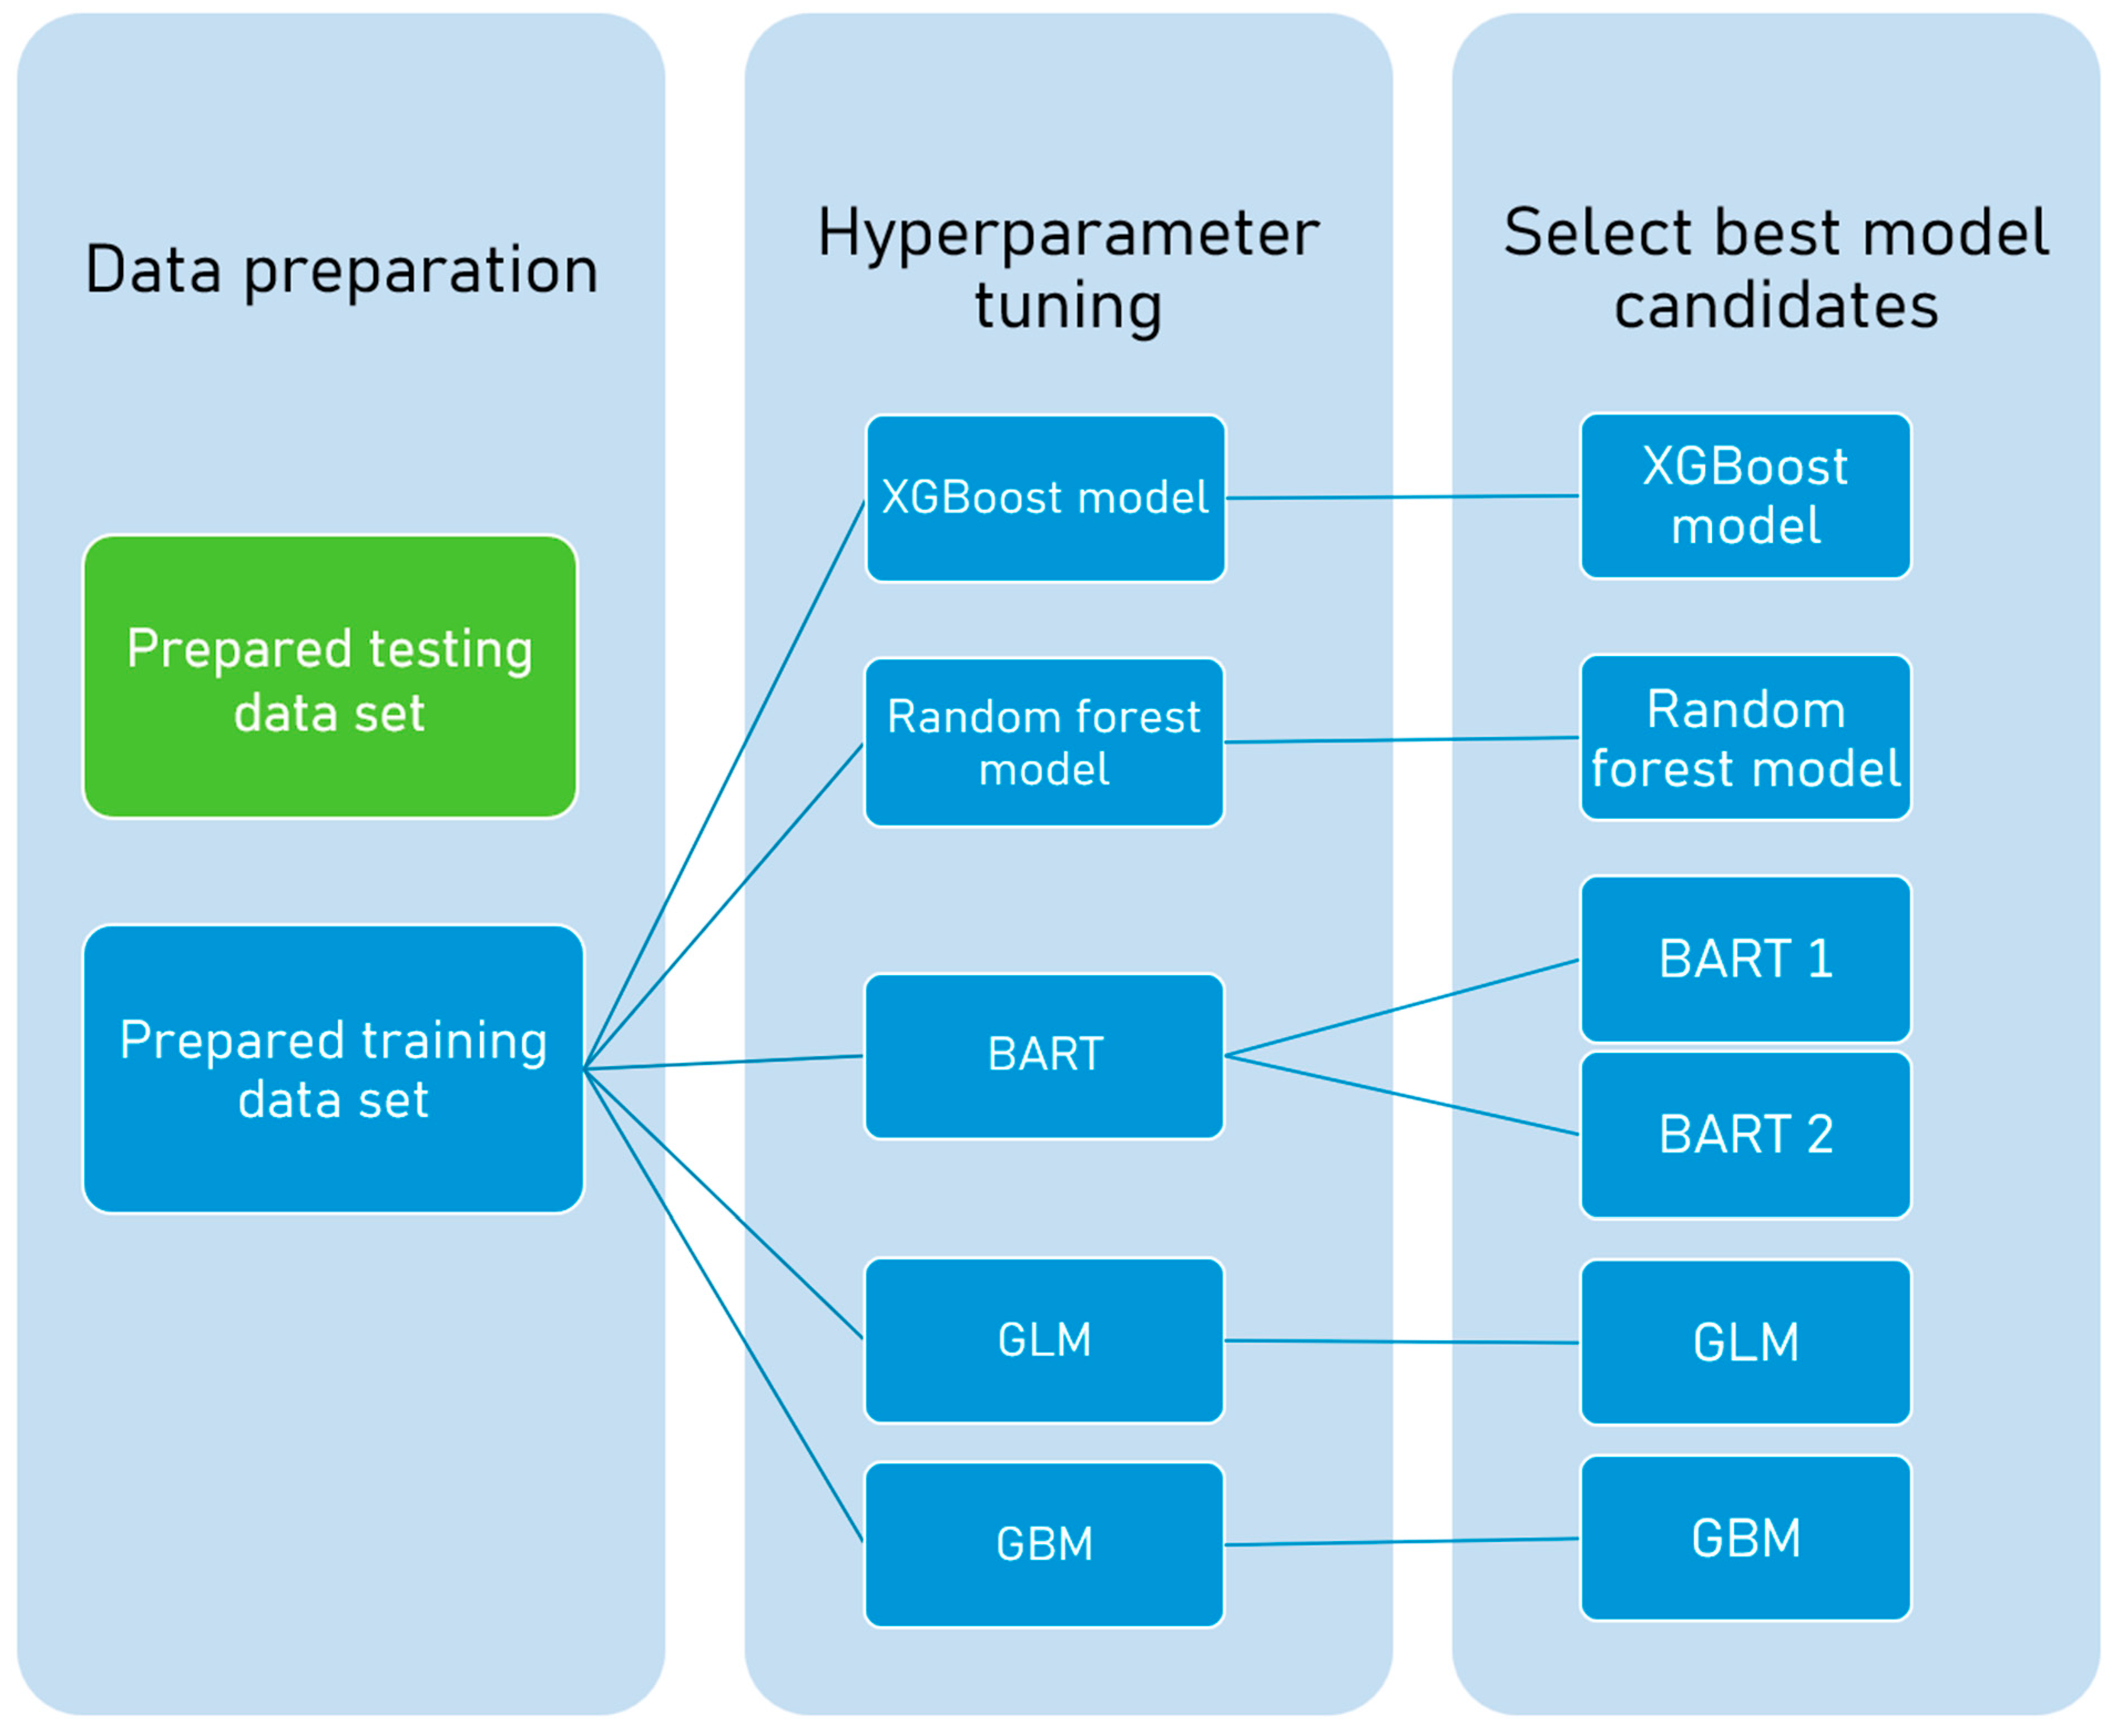
The ensemble model approach, minimising the RMSE for the ensemble model, resulted in the inclusion of the XGBoost model, Random Forest model, BART 1 and BART 2, GLM and GBM (LightGBM) (Figure 2). These models were used to predict the price dynamics of the testing dataset and were selected on the basis of their performance.
Figure 2.
Schematic overview of the development of the ensemble model. BART: Bayesian additive regression trees, GLM: generalised linear model, GBM: gradient boosting machine.
The ensemble model’s deterministic predictions were generated by combining multiple machine learning models, each separately forecasting product prices. Based on each model’s performance, they were either included in the ensemble or assigned a specific weight. The ensemble incorporates six models (the five algorithms, with BART represented by two specifications), with an RMSE of 0.199.
3.2. Model Validation
Internal validation against the excluded testing dataset demonstrated strong predictive accuracy over the whole lifetime of the products, with observed prices often closely matching predicted trajectories. The predictions were made over different time horizons, from a minimum of 5 years of data up to the full product life cycle. However, not all predictions are representative and accurate. The variability of medicine prices within the dataset introduces uncertainty, leading to less accurate predictions.
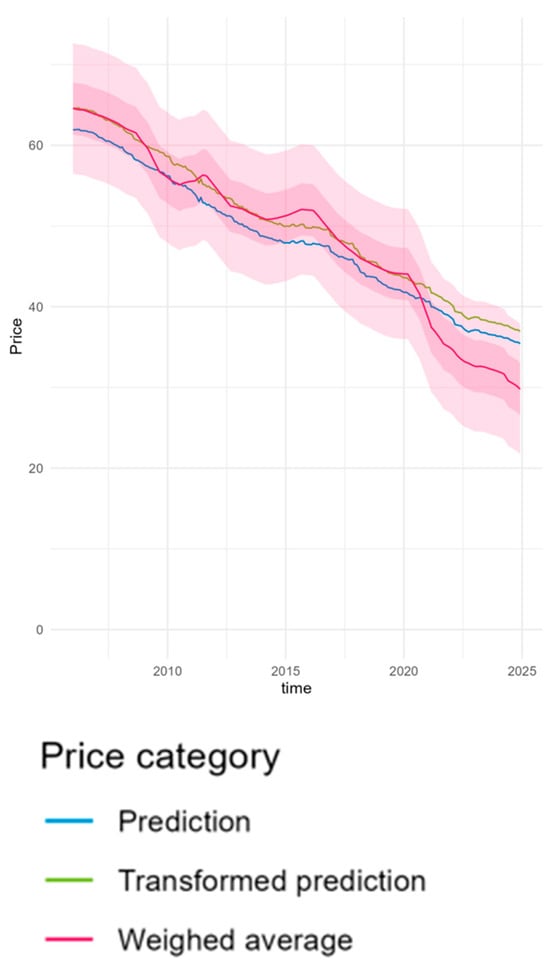
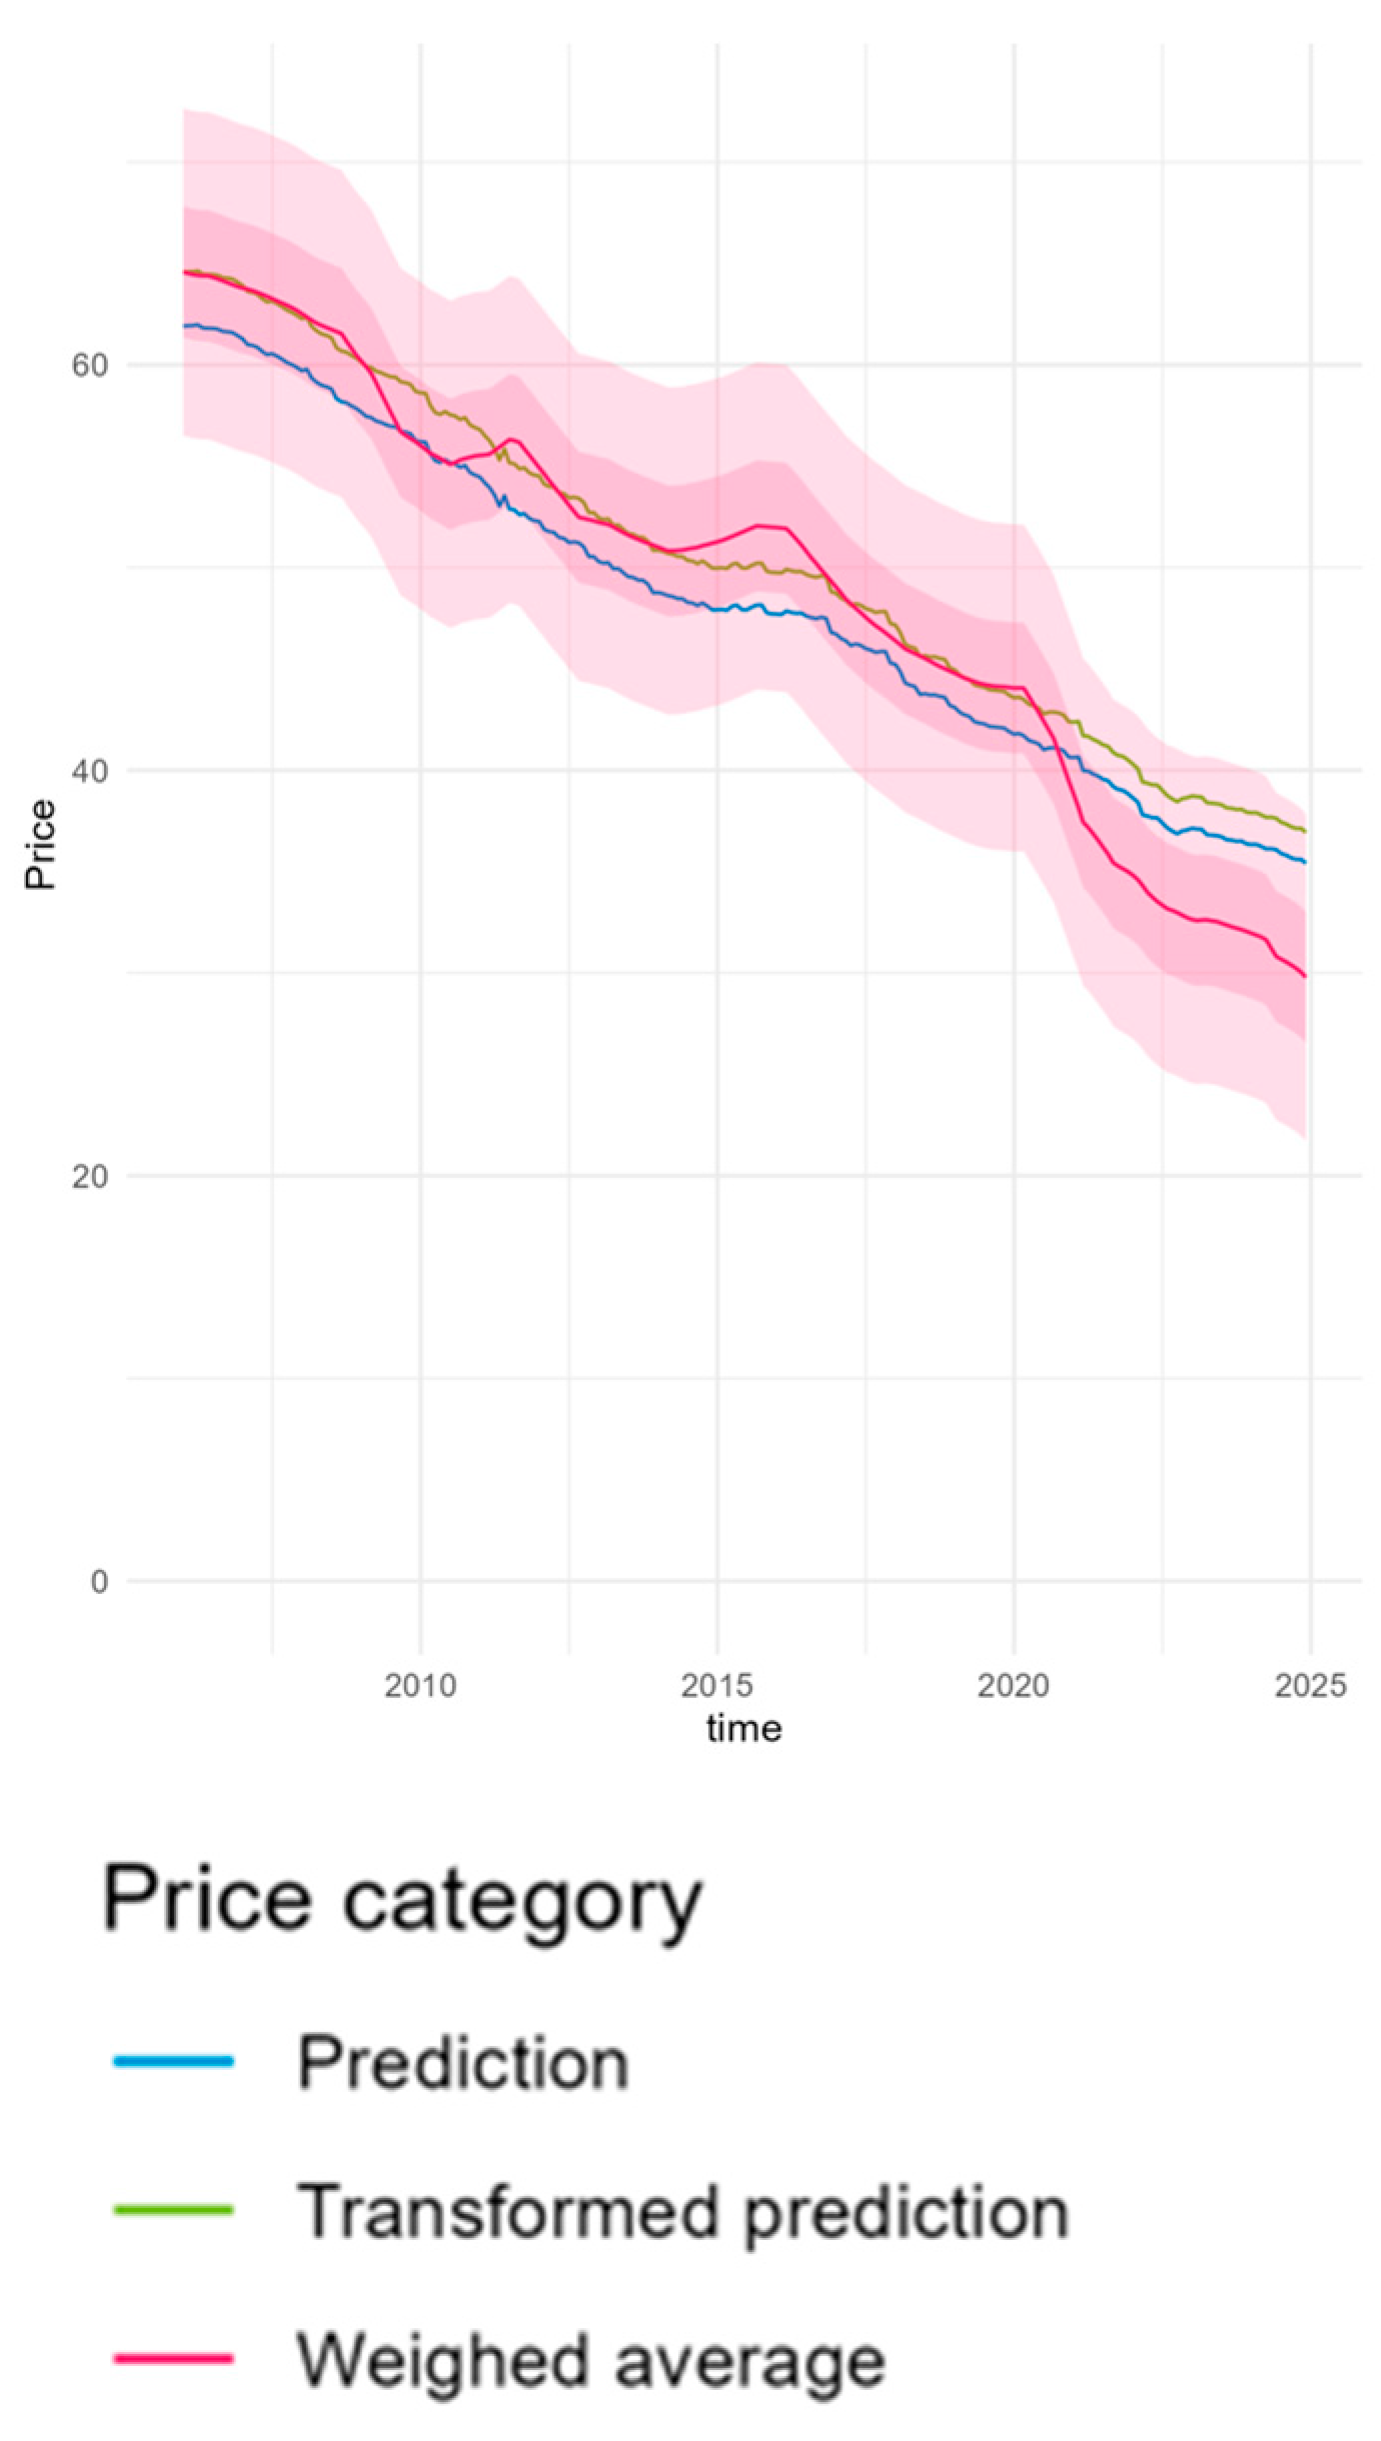
Out of the 103 predictions, 27 (26%) were categorised in the Q1 category. These predictions closely matched the observed price trends and fell within the 10% range around the observed data, as illustrated by examples in Figure 3 and Figure 4. The predictions are accurate both before and after LoE.
Figure 3.
Price prediction and price dynamics, an example of a high-accuracy prediction (Q1). ATC code not shown.
Figure 4.
Price prediction and price dynamics: an example of a high-accuracy prediction (Q1). ATC code not shown. The dashed line represents loss of exclusivity.
Out of the 103 predictions, 36 (35%) were categorised in the Q2 category. For these predictions, the overall trend was accurately predicted, and most of the predictions fall within the 10–25% uncertainty range. The Q2 examples are shown in Figure 5 and Figure 6. In line with the Q1 predictions, these predictions show comparable accuracy before and after LoE.
Figure 5.
Price prediction and price dynamics, an example of a medium-accuracy prediction (Q2). ATC code not shown.
Figure 6.
Price prediction and price dynamics, an example of a medium-accuracy prediction (Q2). ATC code not shown. Dashed line represents loss of exclusivity.
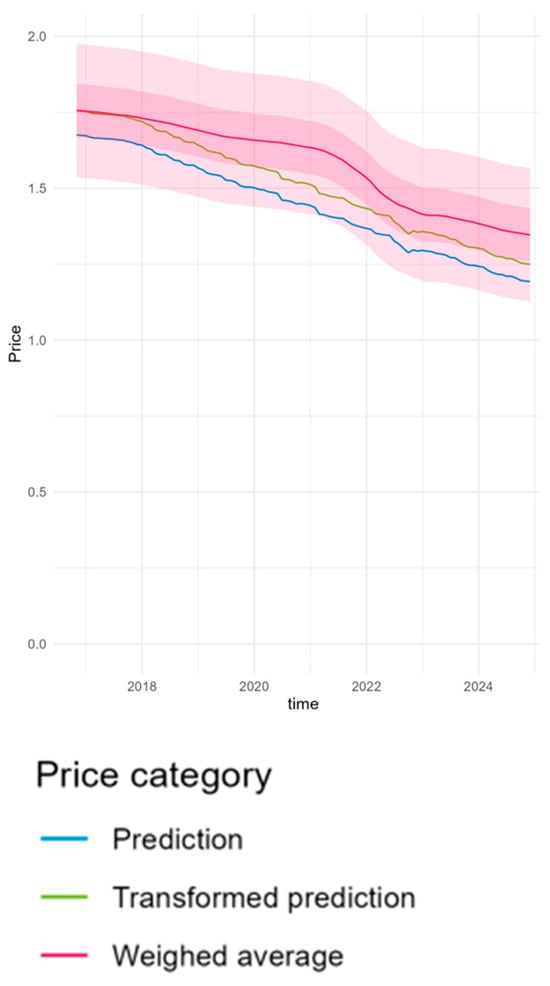
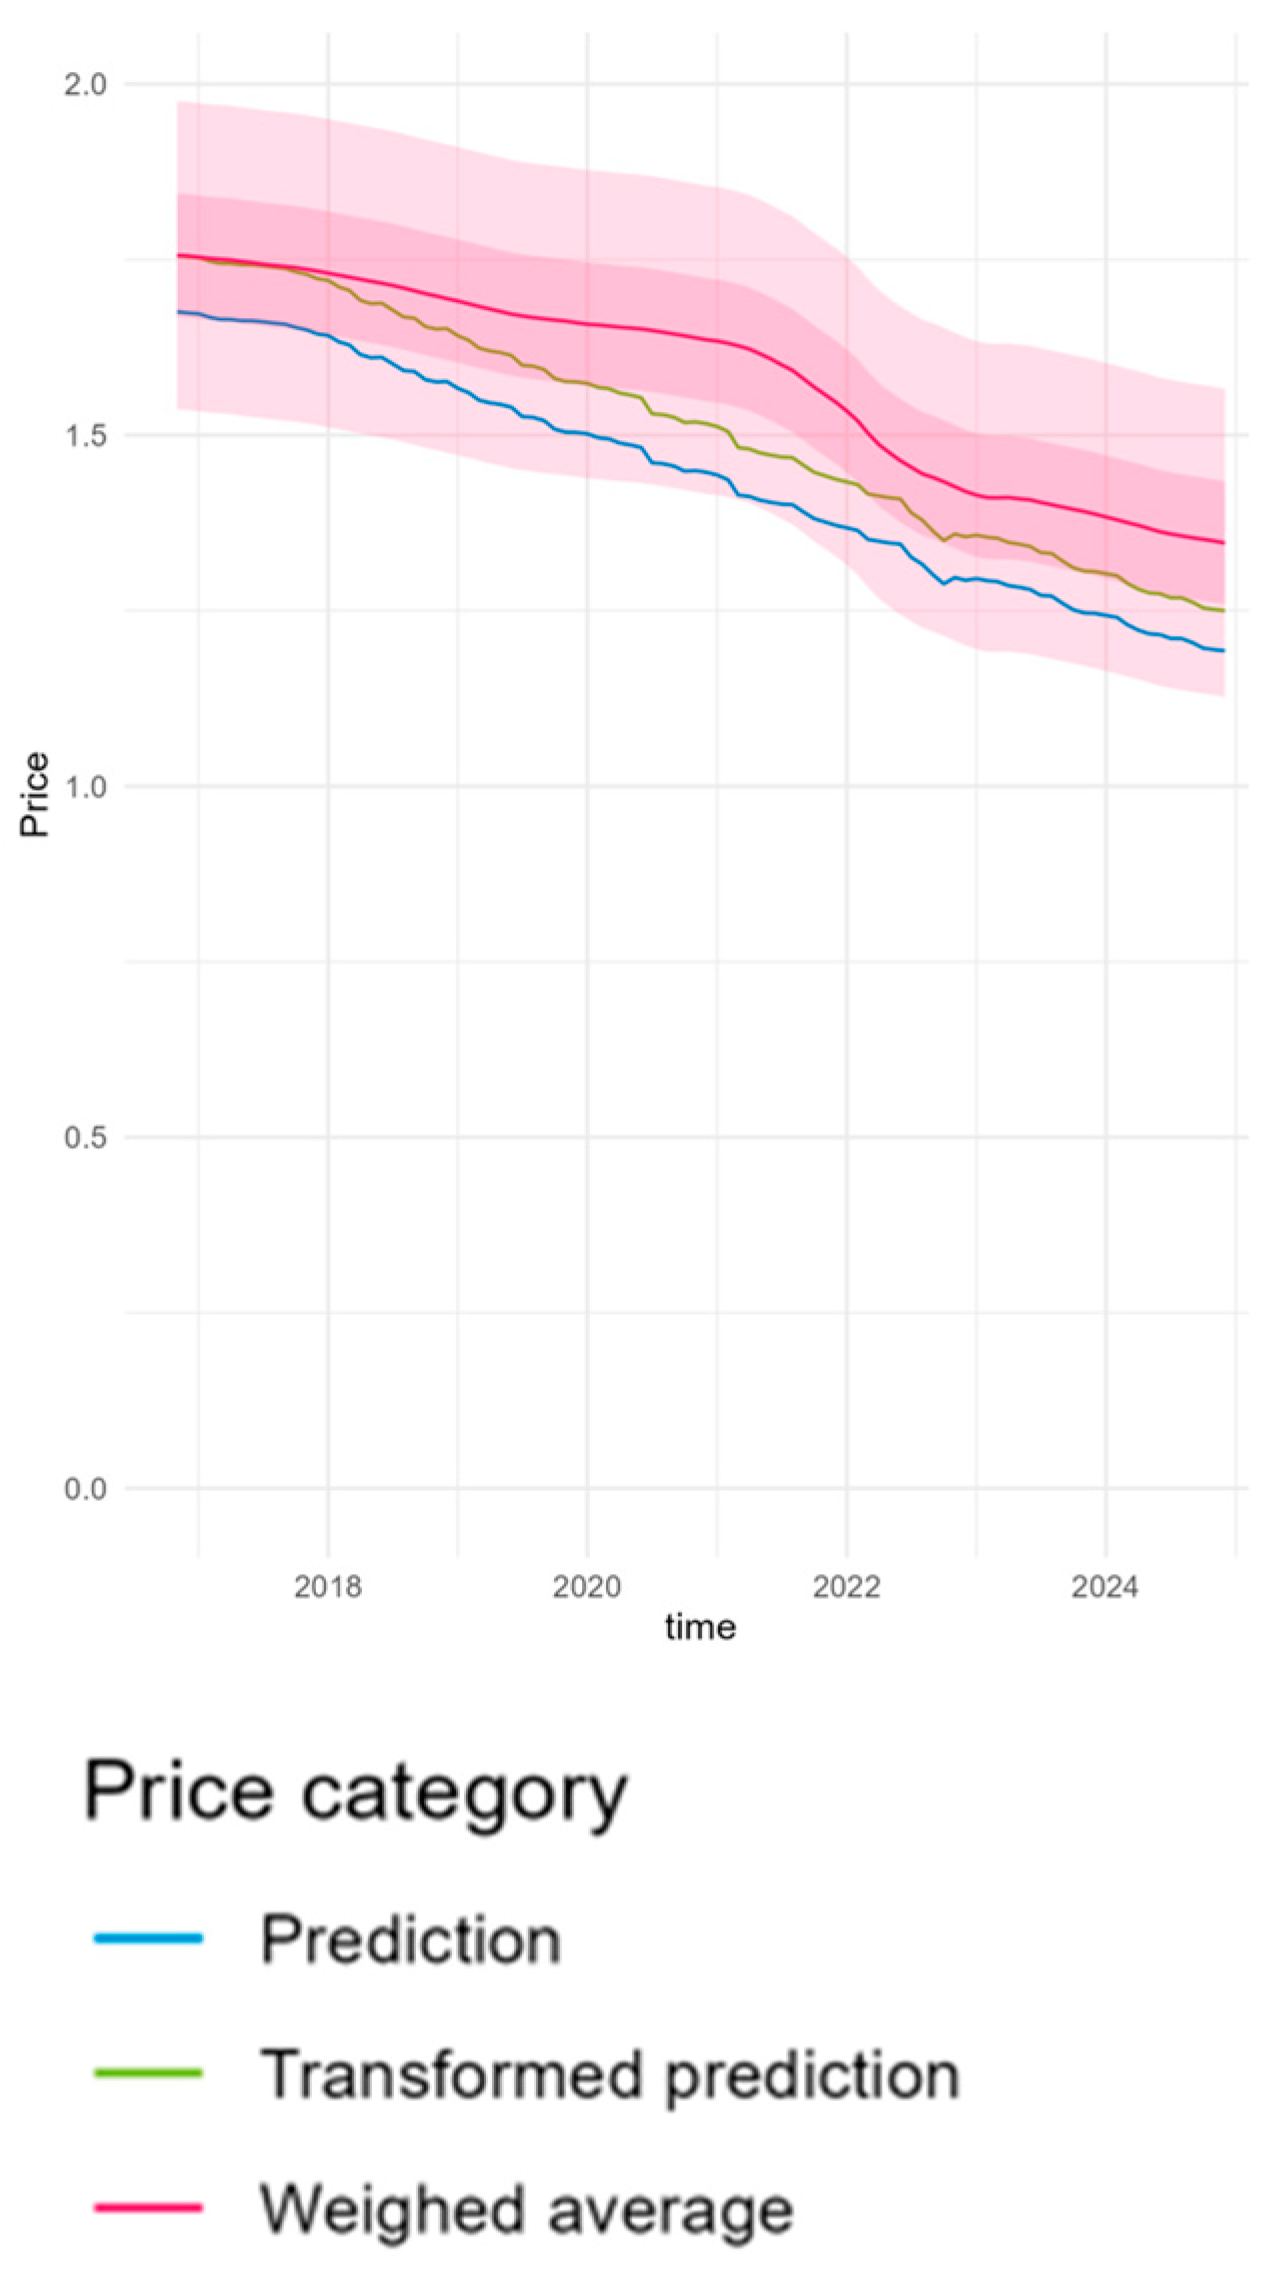
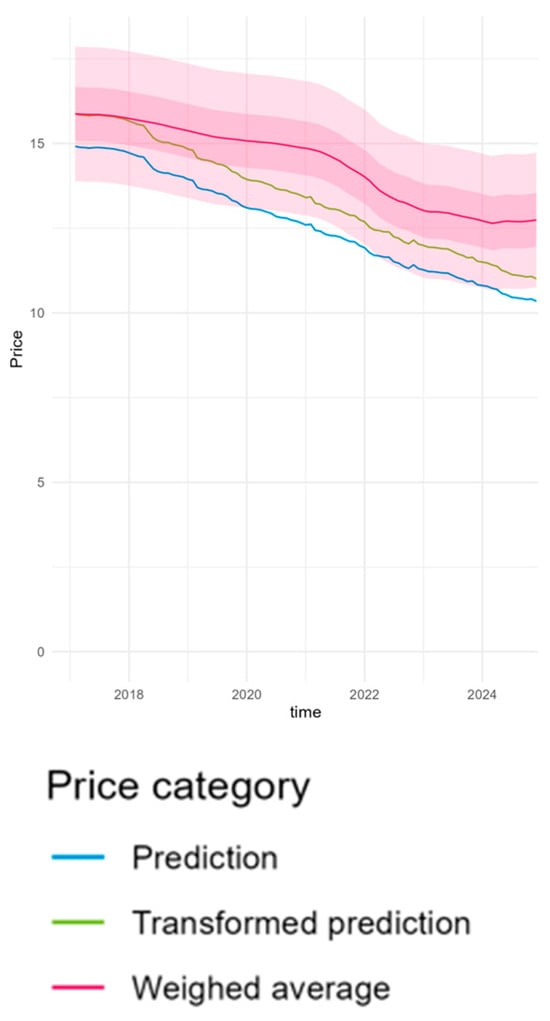
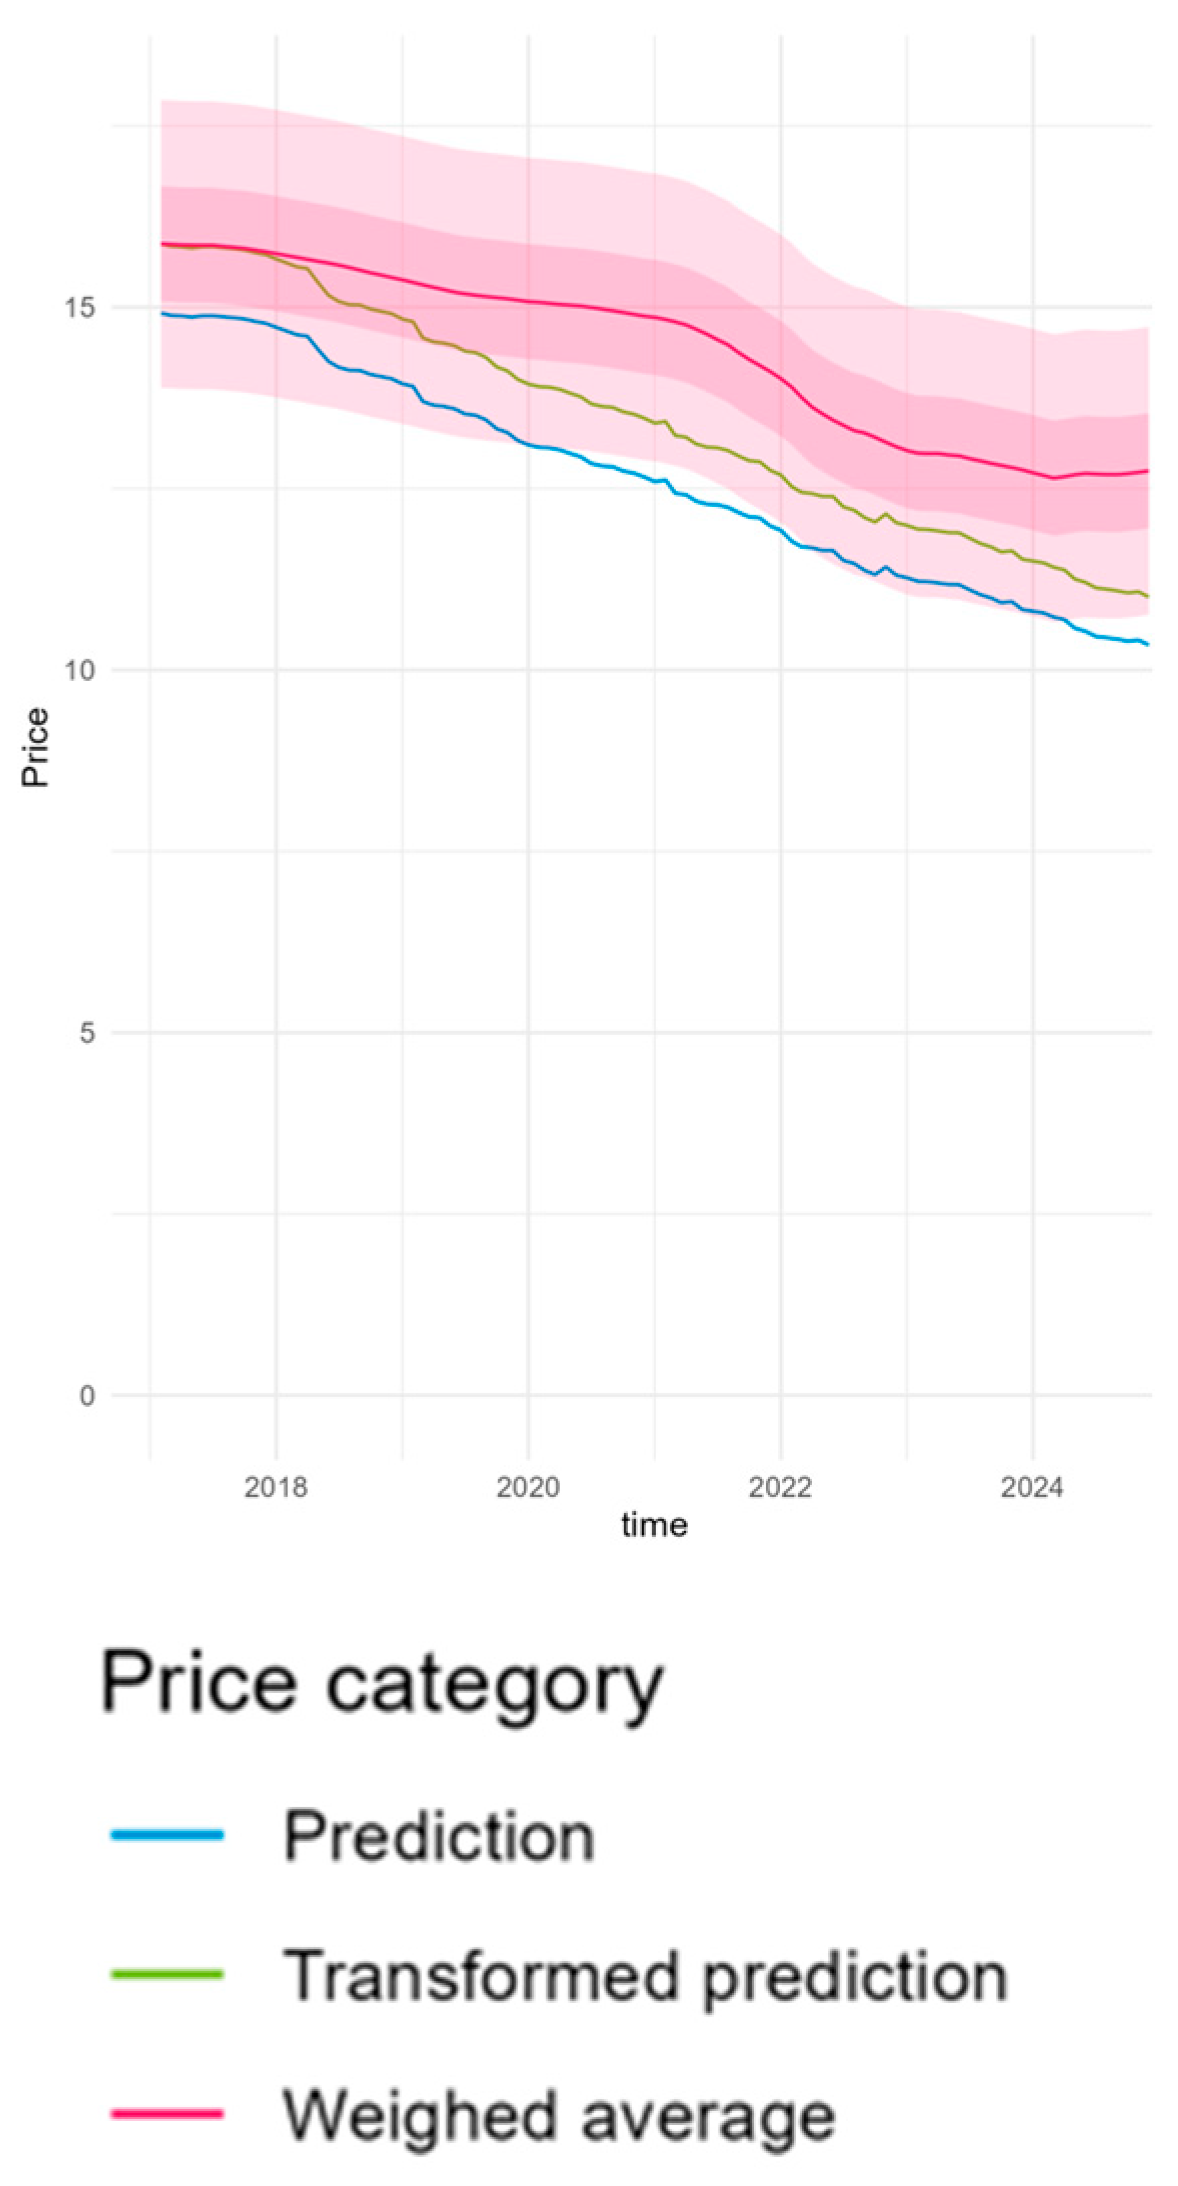
Out of the 103 predictions, 12 (12%) were categorised in the Q3 category. For these predictions, the overall trend was partially captured, and the majority of the predictions fall within the 25% uncertainty range. The correct prediction of the overall trend of price dynamics, while not being fully accurate, would be a better estimate than the use of a static price in these cases. The Q3 examples are shown in Figure 7 and Figure 8.
Figure 7.
Price prediction and price dynamics, an example of a medium-accuracy prediction (Q3). ATC code not shown.
Figure 8.
Price prediction and price dynamics, an example of a medium-accuracy prediction (Q3). ATC code not shown. Dashed line represents loss of exclusivity.
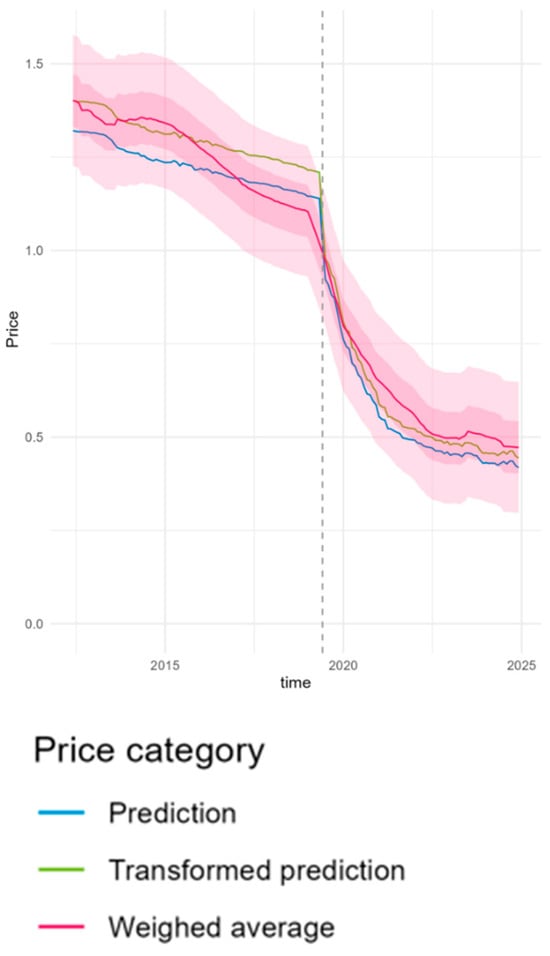
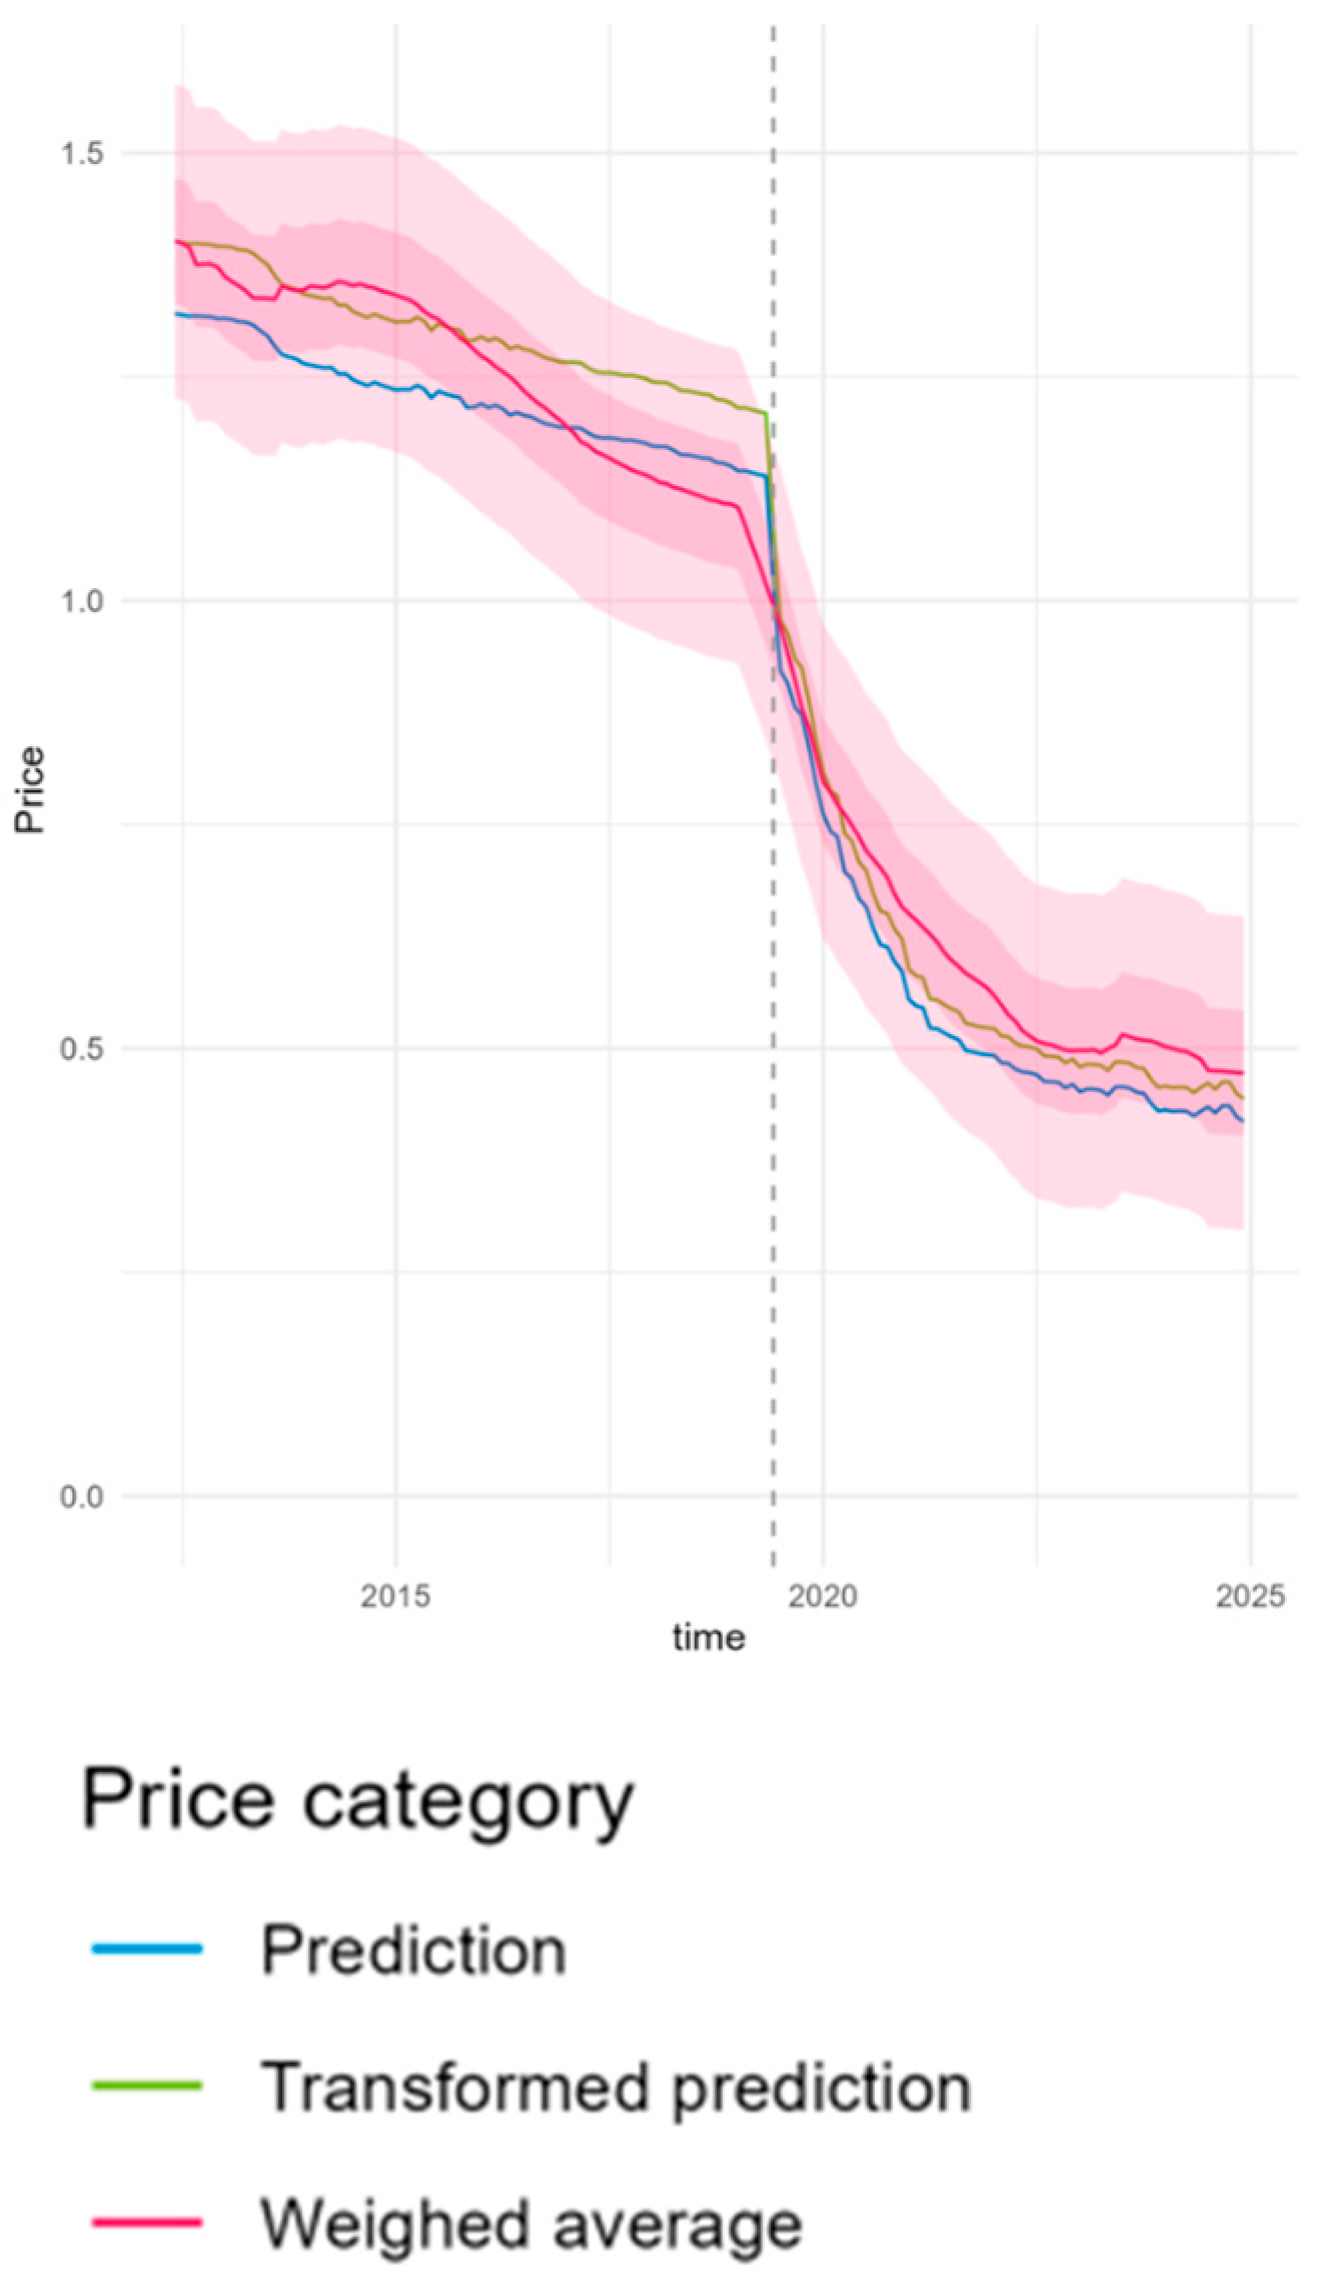
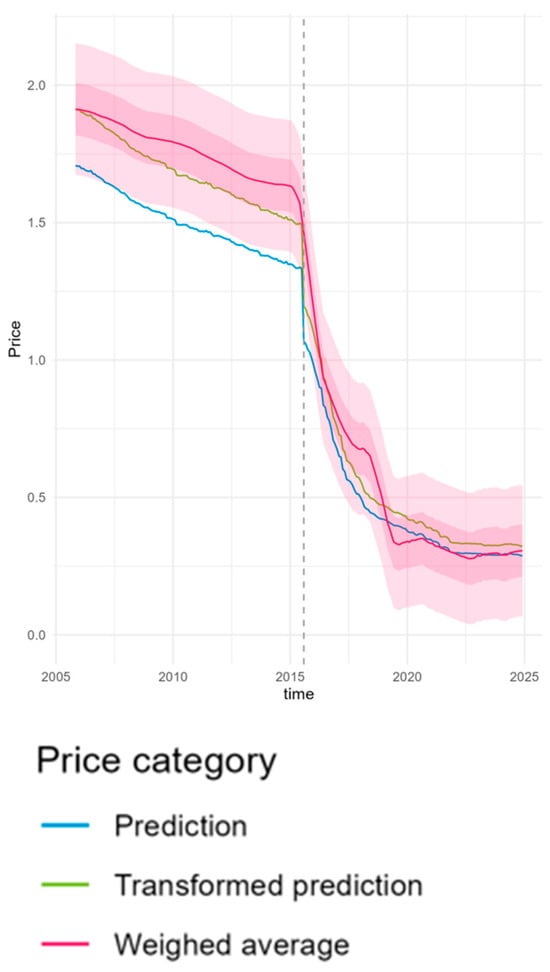
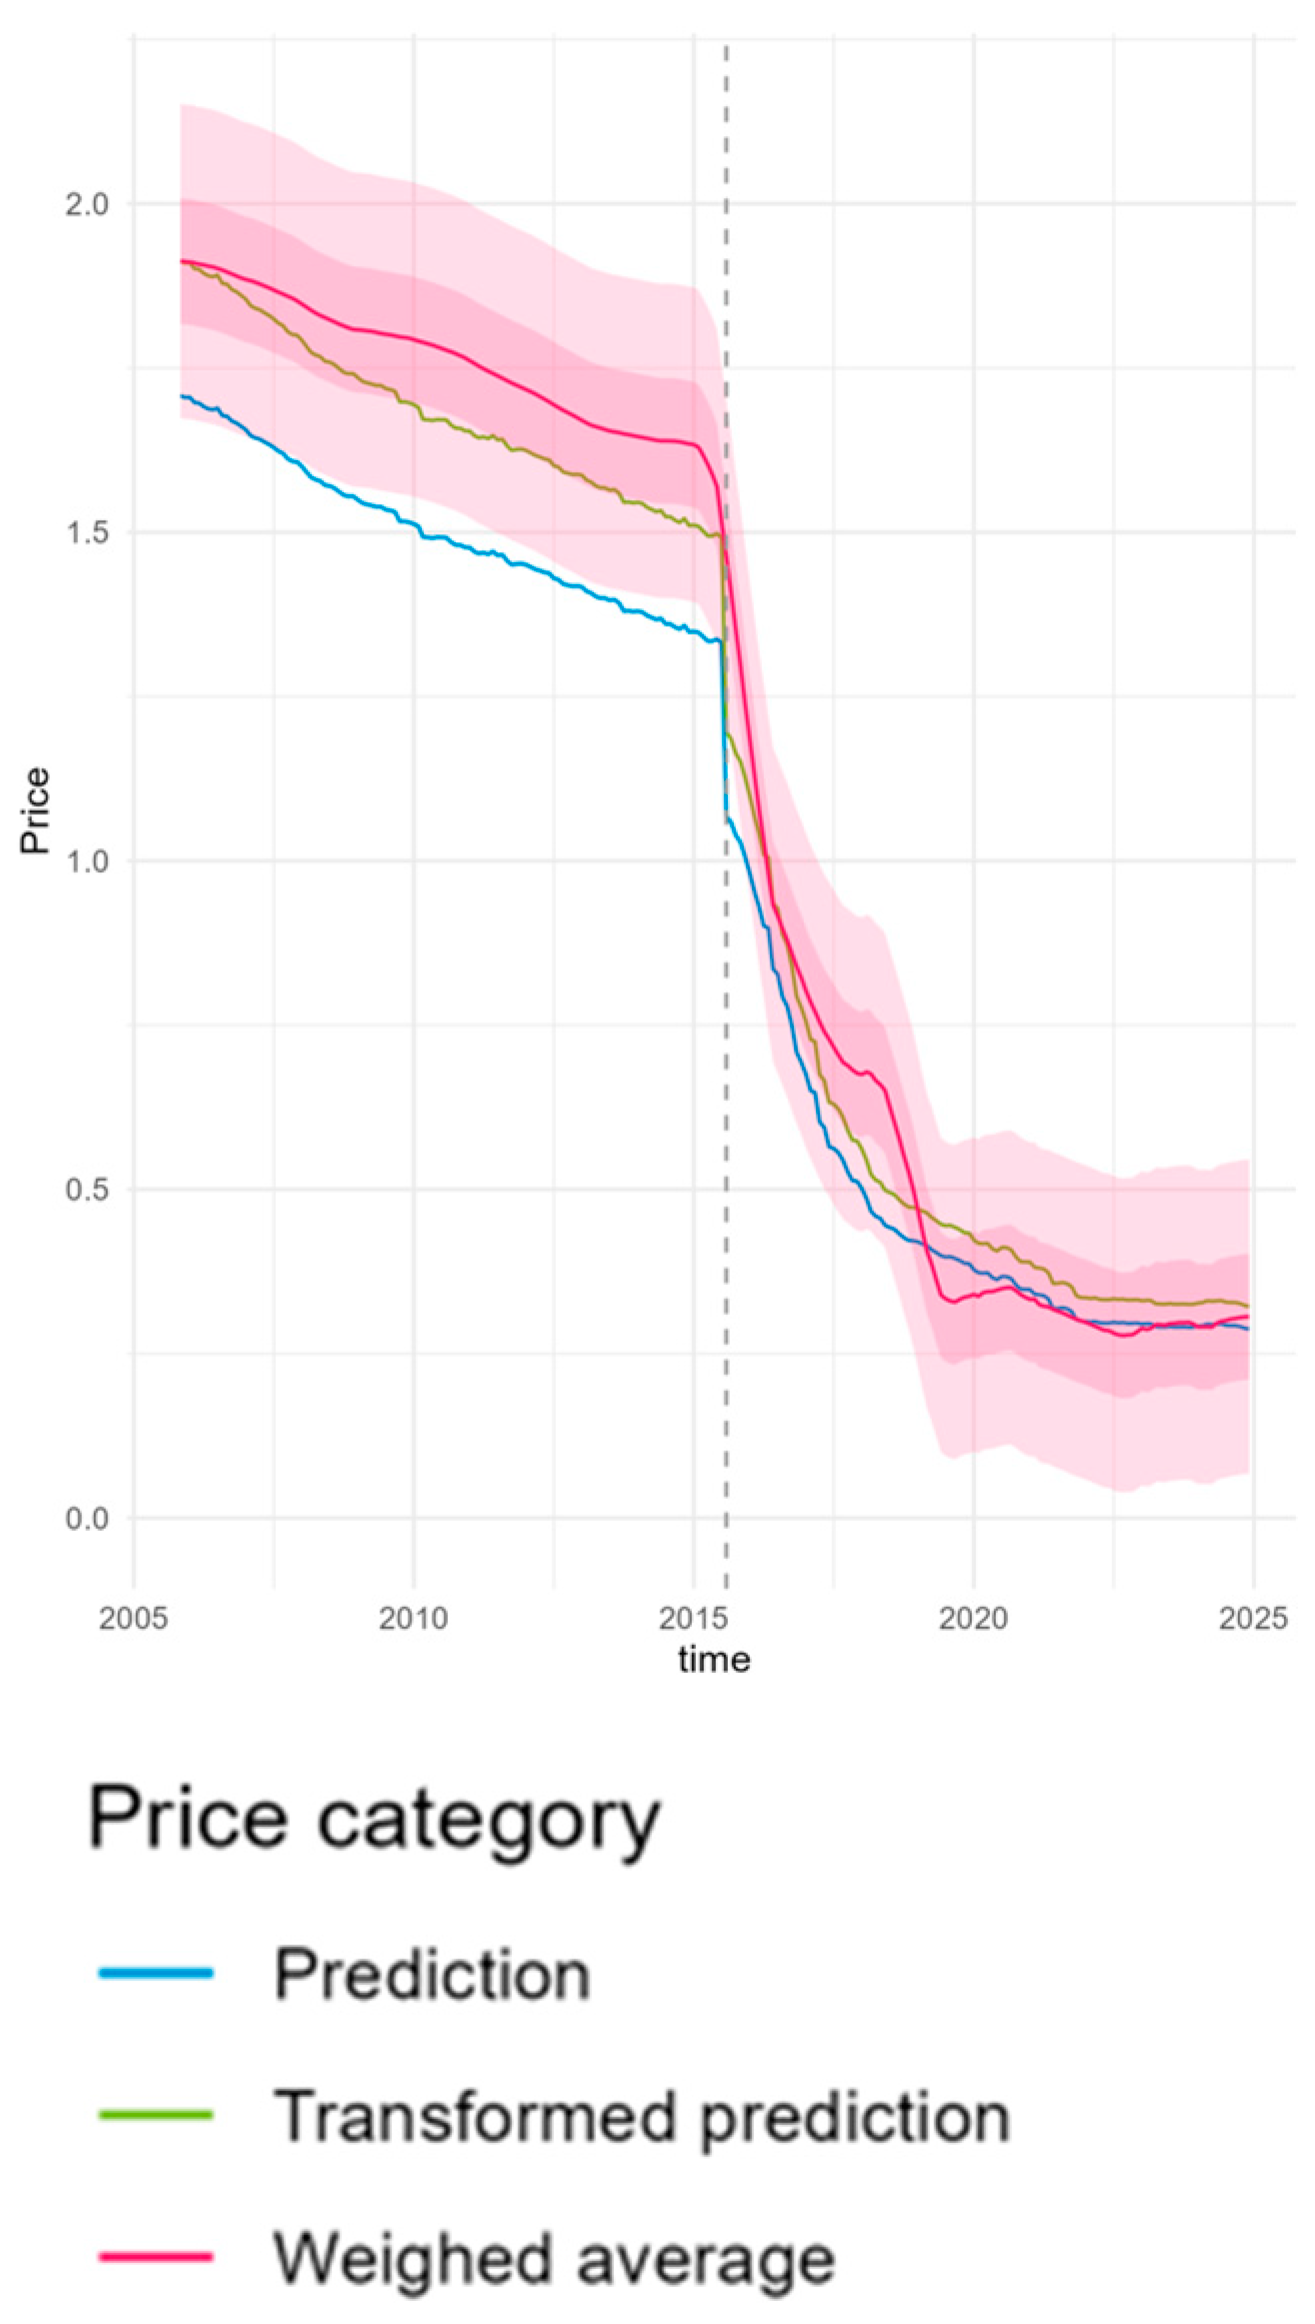
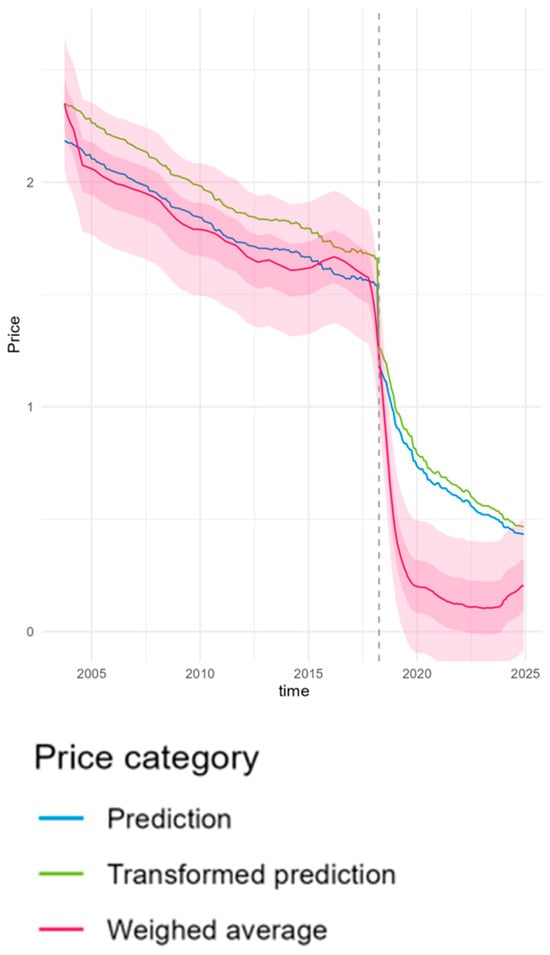
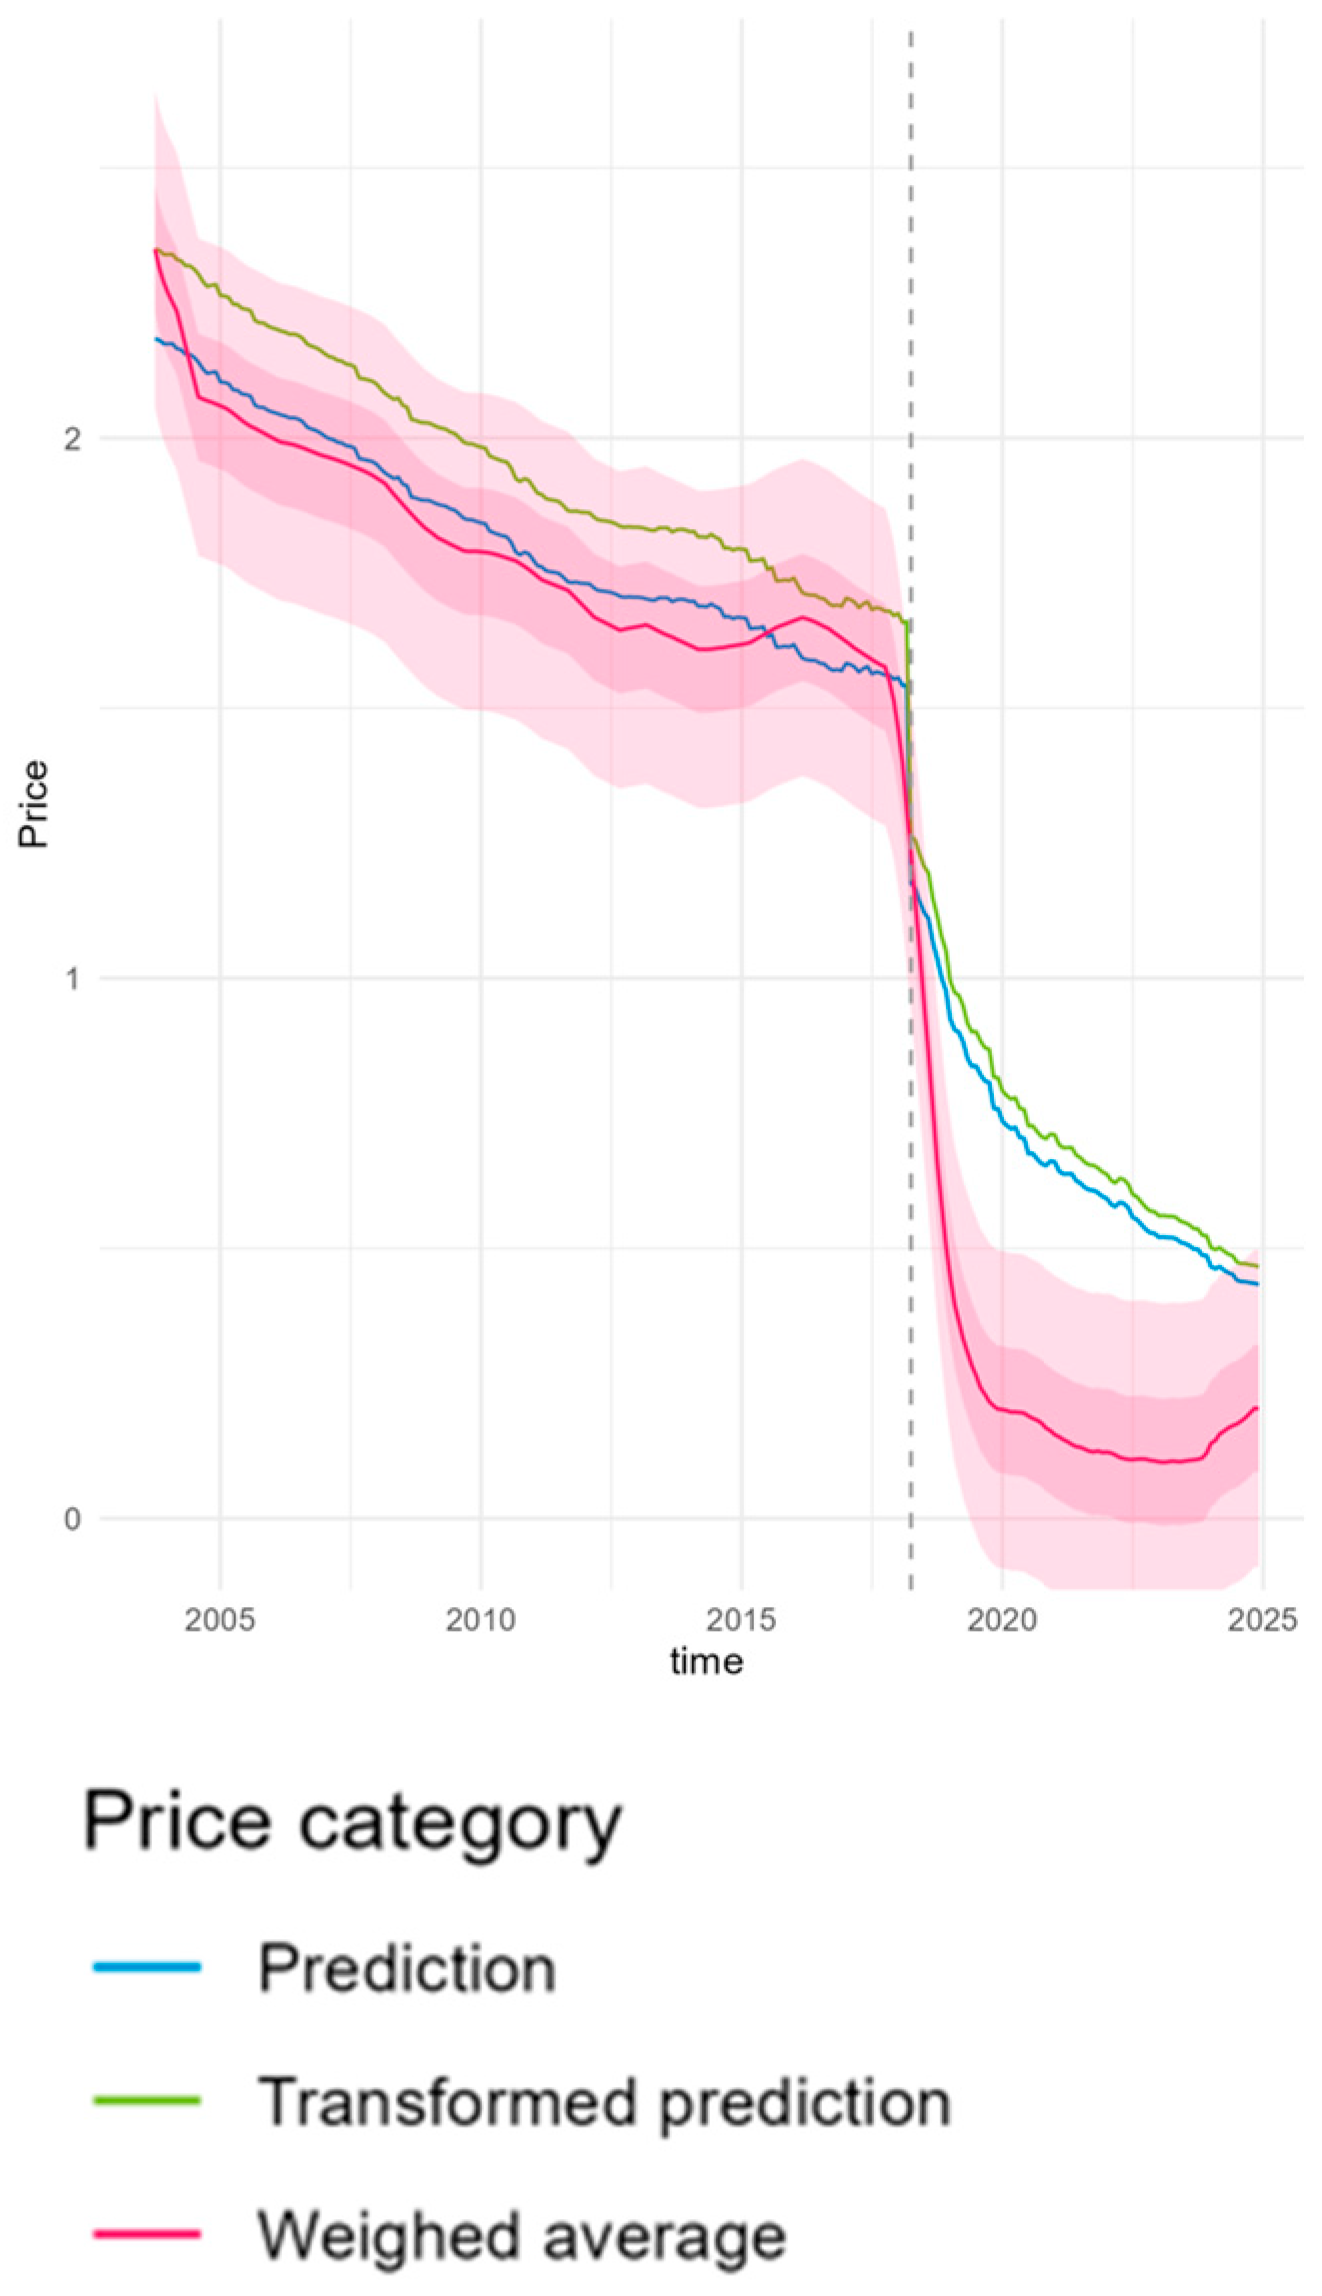
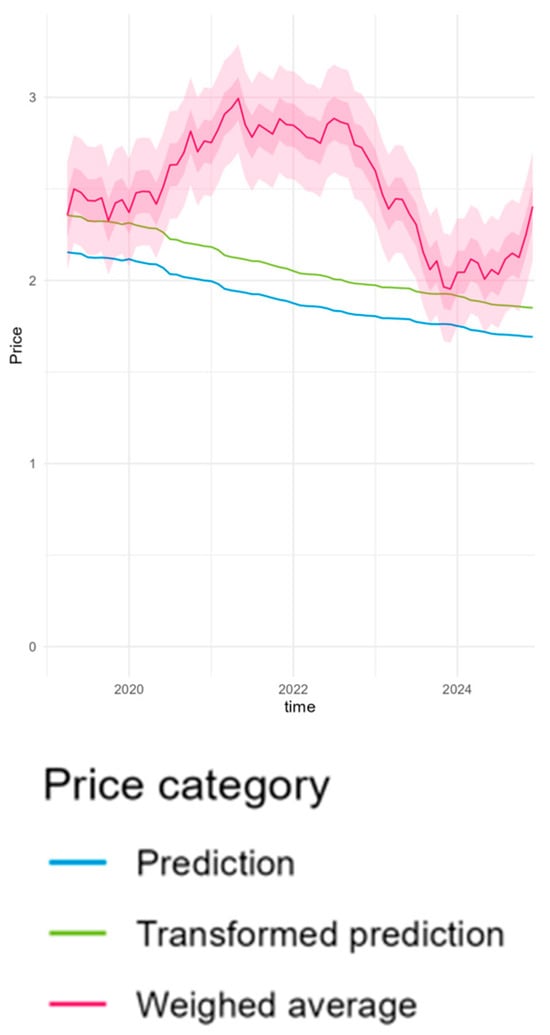
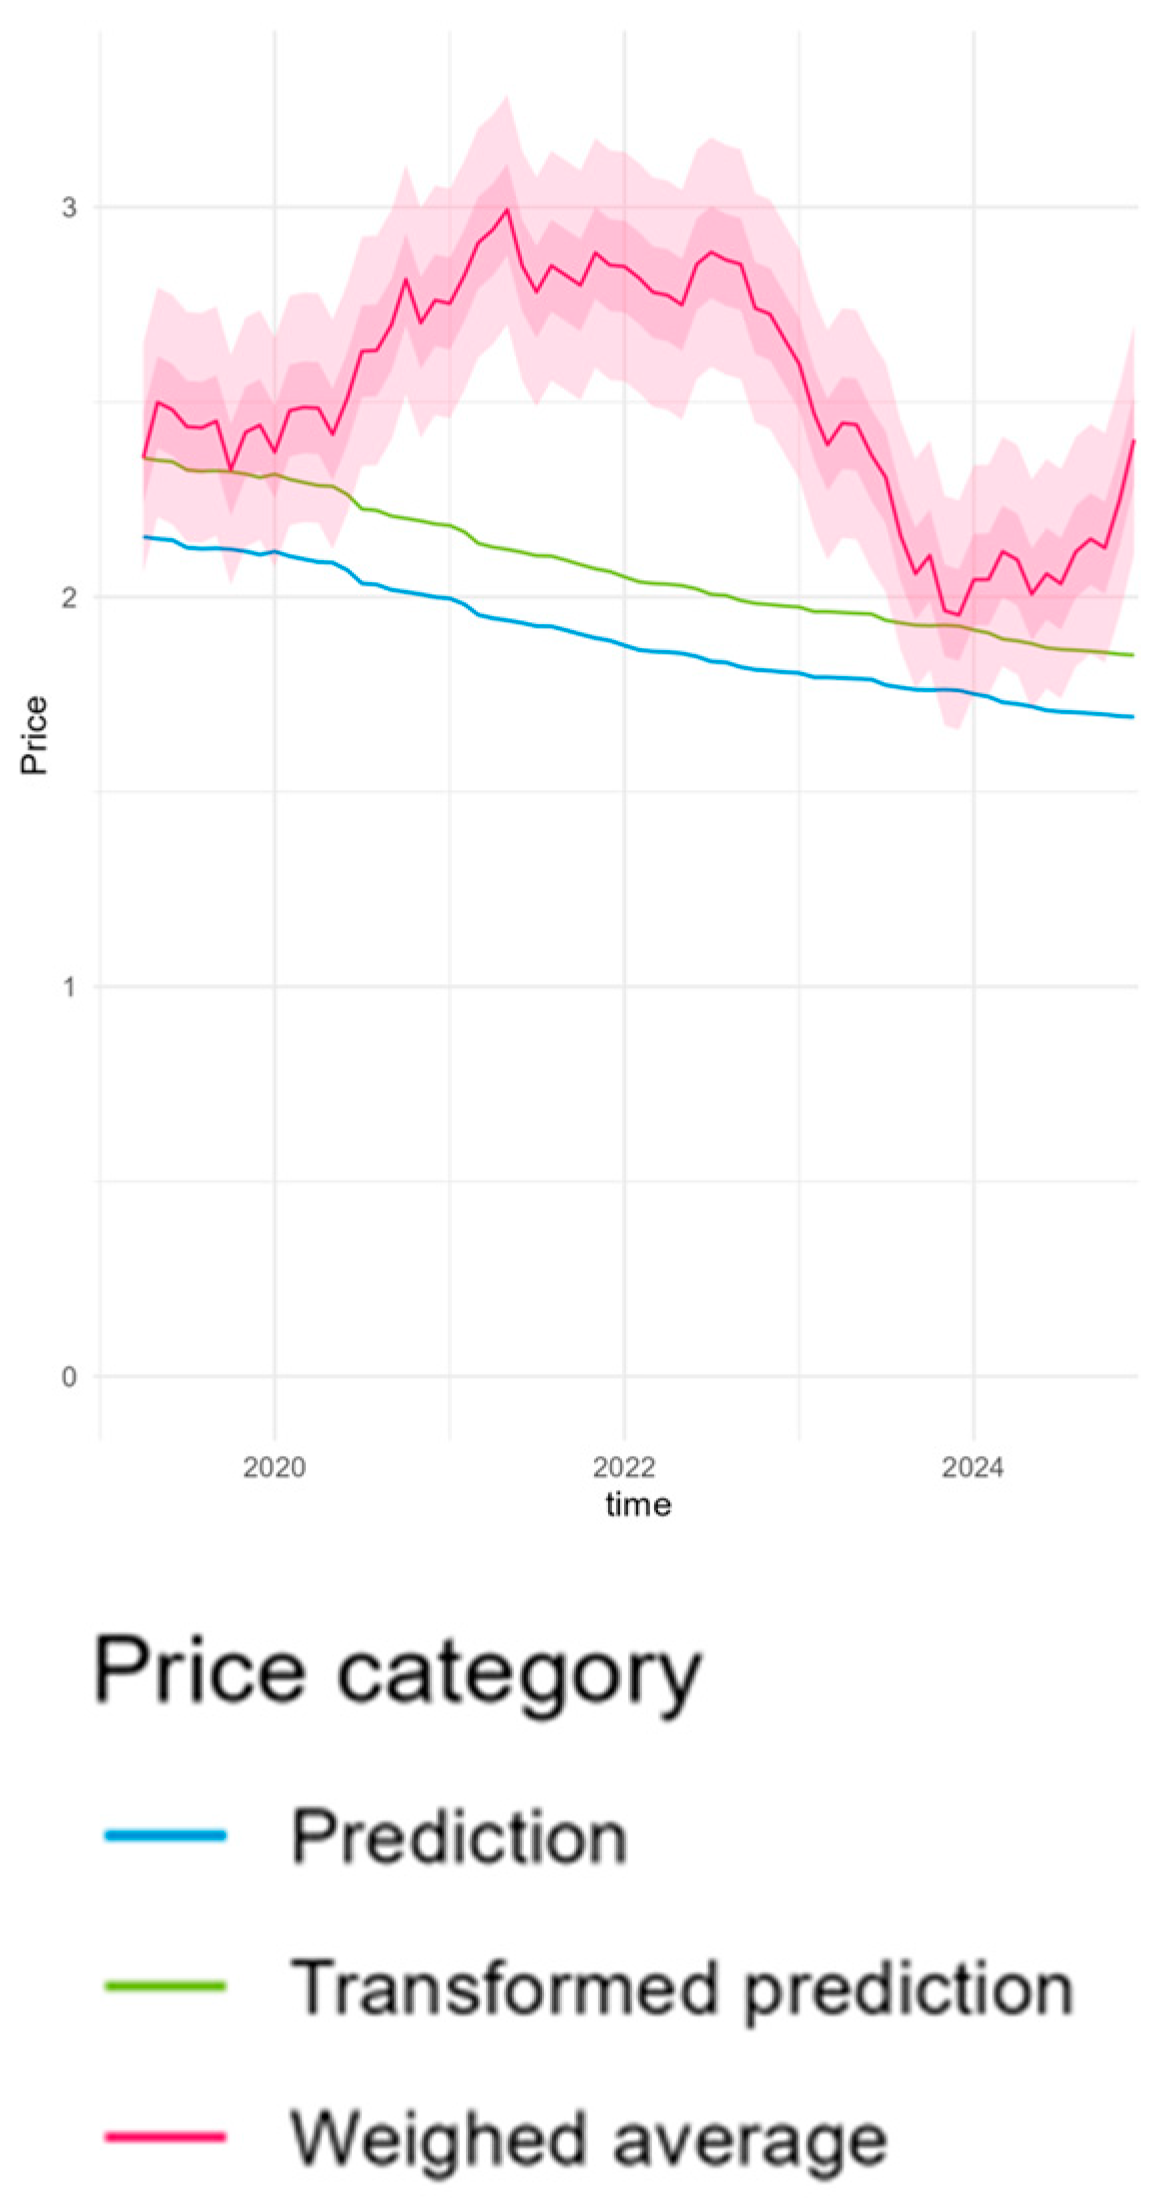
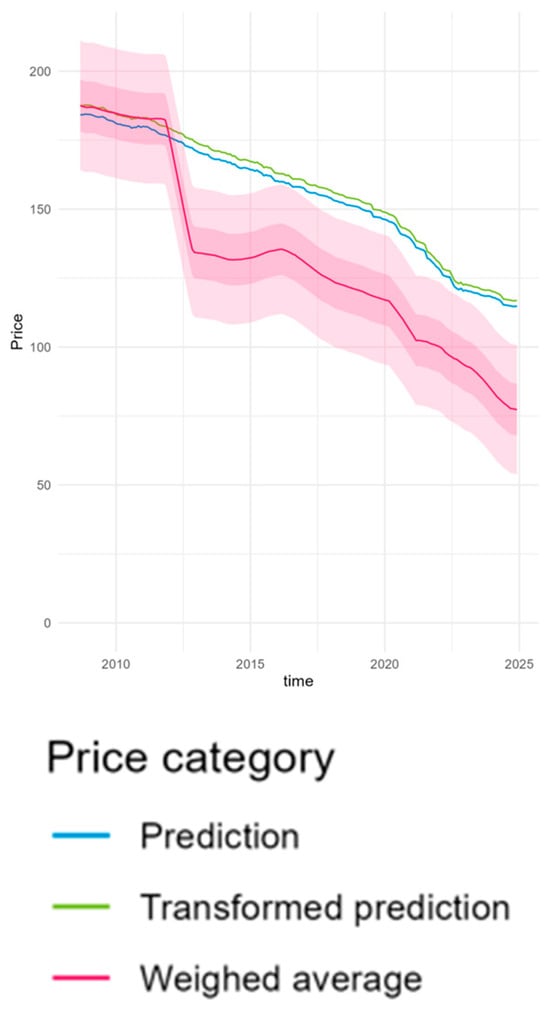
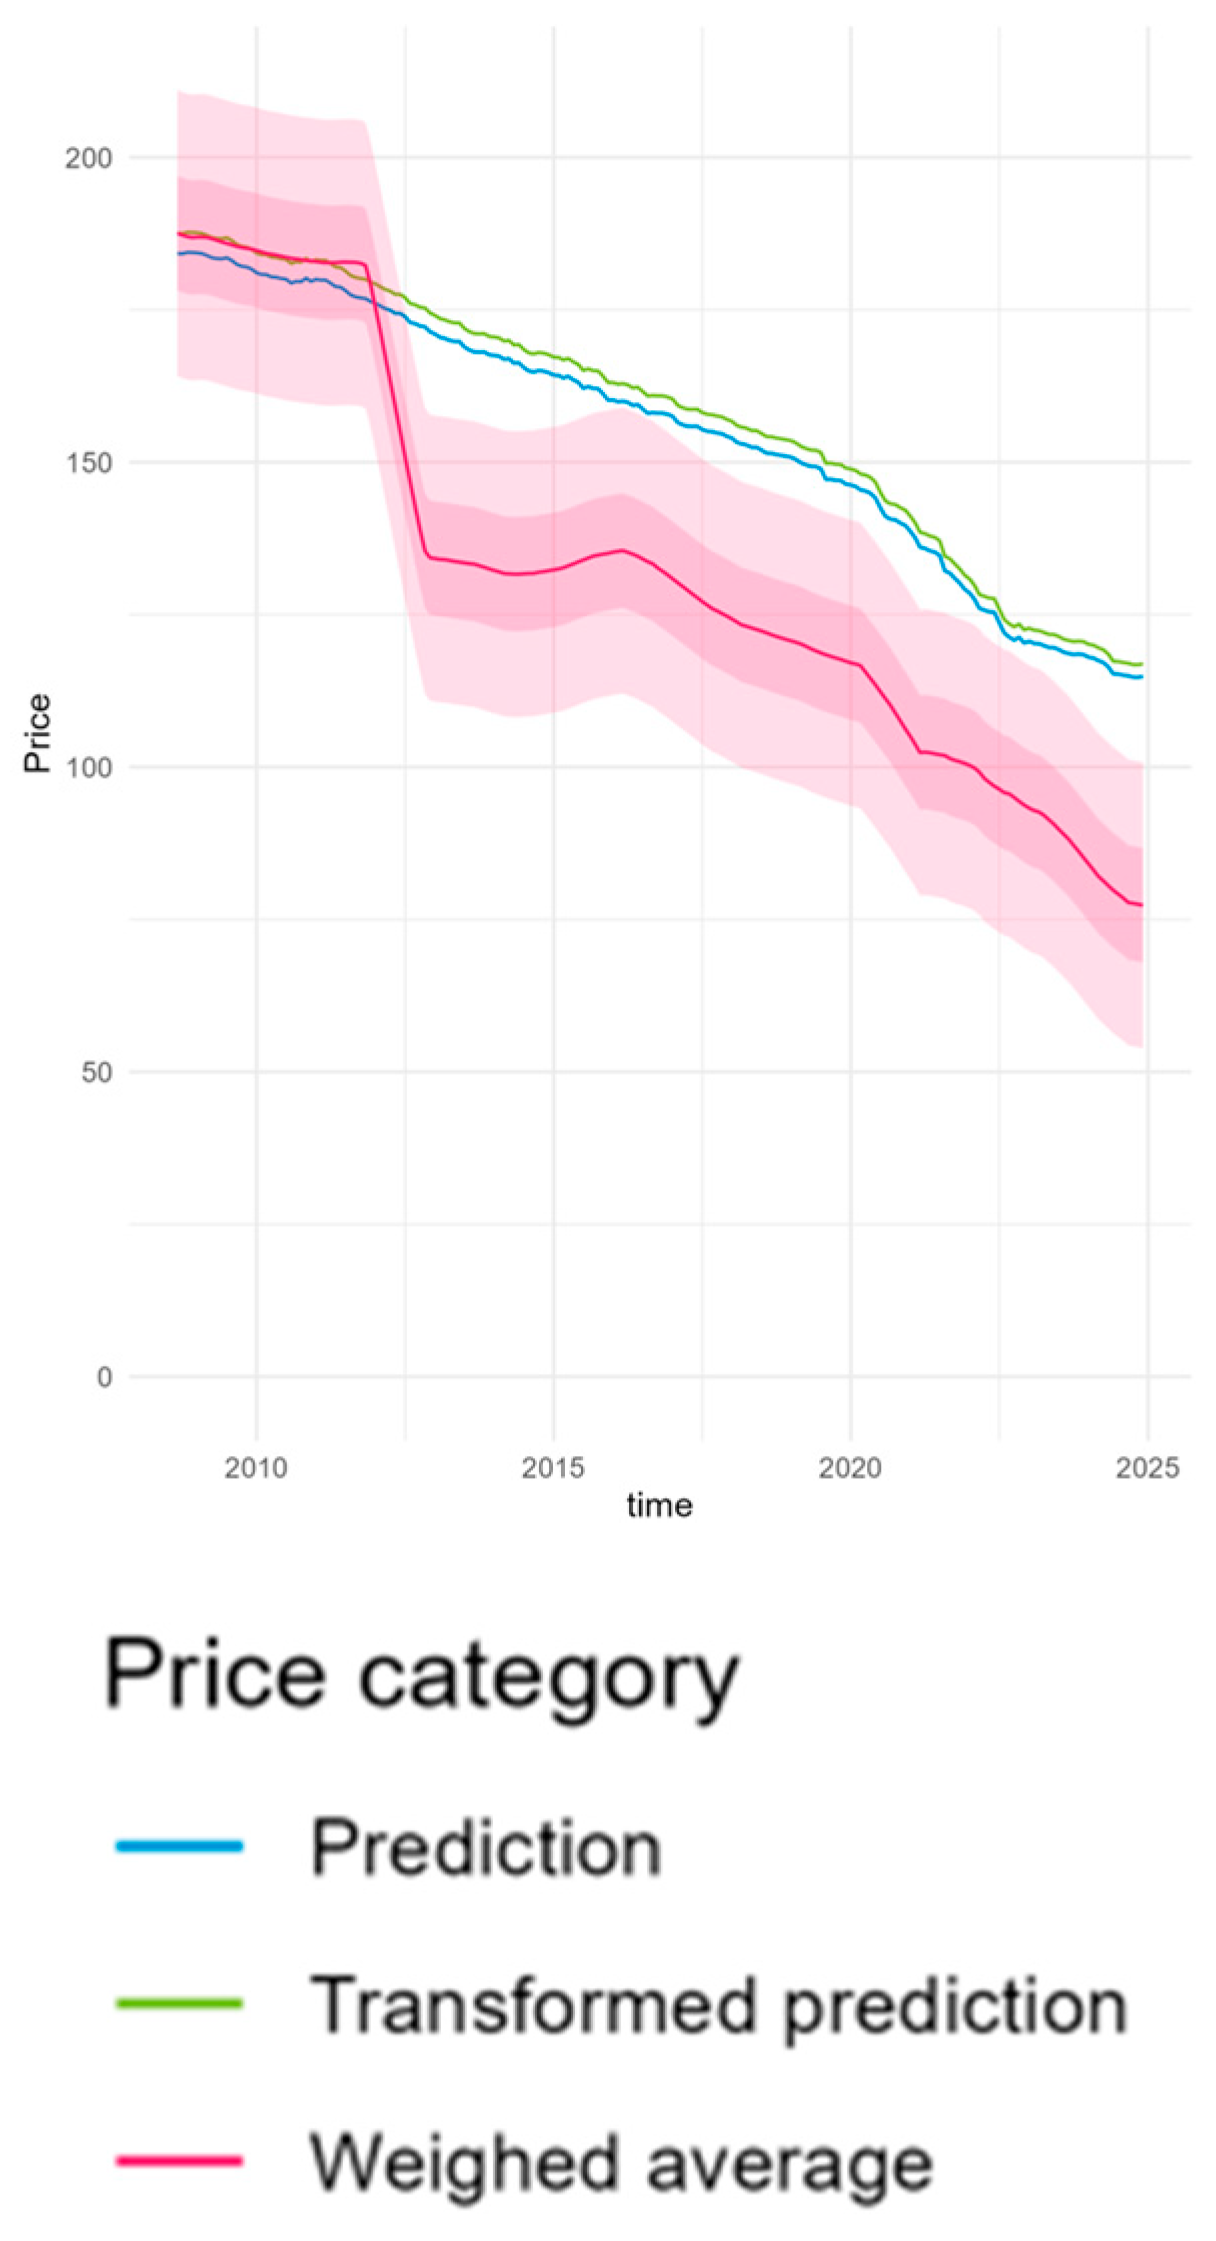
The remaining 28 predictions (27%) were categorised in the Q4 category. In these cases, the prediction model struggled to accurately predict price changes and trends, typically due to price increases or substantial decreases pre-LoE that are often unexpected. Such changes are expected to be linked to external factors, such as reimbursement decisions, policy changes, or adjustments tied to regulatory mechanisms. The Q4 examples are shown in Figure 9 and Figure 10.
Figure 9.
Price prediction and price dynamics, an example of a poor-accuracy prediction (Q4). ATC code not shown.
Figure 10.
Price prediction and price dynamics, an example of a poor-accuracy prediction (Q4). ATC code not shown.
The ensemble model demonstrated strong alignment between predicted and observed price trajectories in many cases. Just over one quarter of predictions (26%) showed the highest accuracy within a 10% range of observed data, while nearly half (47%) fell into medium-accuracy categories (Q2 and Q3), capturing overall trends but with greater variability. The remaining 27% of predictions showed relatively poor accuracy, largely driven by abrupt price changes linked to external factors that remain difficult to anticipate. These findings highlight both the feasibility and the limitations of forecasting dynamic medicine prices.
4. Discussion
This study demonstrates the feasibility and accuracy of predicting medicine price dynamics in the Dutch healthcare market using an ensemble model of machine learning algorithms. The ensemble approach, which integrates multiple predictive models weighted based on performance, effectively captures the complexities of price trends over time. Visual assessments indicated that 26% of predictions achieved the highest accuracy (Q1), with an additional 47% classified as medium accuracy (Q2/Q3). These findings represent a significant advancement in forecasting pharmaceutical pricing, underscoring the utility of machine learning in capturing intricate price dynamics.
While the model exhibits strong performance, certain limitations must be acknowledged. The predictive ability was constrained in instances of abrupt price changes, likely the result of external factors such as policy shifts, pricing negotiations, reference pricing, and regulatory adjustments. Sudden price fluctuations, and in some cases even price increases, remain challenging to predict, introducing a degree of uncertainty into the forecasts. To enhance the model’s robustness, future iterations could incorporate a broader range of predictors, including more product-specific characteristics and participation in regulatory procedures. Integrating more predictors could also come with additional uncertainty, which might have to be assumed for forecasts, comparable to LoE, CPI and generic availability. When forecasting, these variables must be assumed based on the best available data. Therefore, adding more predictors must be done with caution. Integrating detailed policy variables, such as specific pricing mechanisms and reference pricing, could improve the model’s sensitivity to regulatory changes. Using this in a prospective manner does require historical insight into the impact of policy changes. The comparability between policy interventions might be limited, but a predictive model can aid in better understanding the potential magnitude of the impact. Additionally, developing separate submodels for common ATC codes could enhance accuracy, particularly for products with scale discrepancies.
The black-box nature of machine-learning models used within ensemble modelling poses a major limitation due to their inherent lack of transparency. This represents a significant risk for implementation and acceptance by policymakers, particularly in contexts such as health-economic or reimbursement decision-making, where traceability and justification of outcomes are essential. Although inputs and outputs of these models are typically well defined, the internal computational processes remain largely inaccessible, making the calculations difficult to interpret for non-technical stakeholders.
Given this limitation, it becomes critical to assess and verify model accuracy through systematic training-testing evaluation, ensuring that model outputs can be trusted despite limited interpretability. The black-box nature of these models is a universal limitation of predictive modelling. To address this limitation, Ekanayake et al. propose the use of Shapley Additive Explanations (SHAP), a novel black-box interpretation approach, to provide a ‘unified measure of feature importance and the impact of a variable for a prediction’ [24]. SHAP offers a better understanding of how model outputs are generated, through insight into the features affecting predictions, visualisation of relationships, and model validation. SHAP reveals how a model weighs different factors, making it easier to detect errors, biases, or inconsistencies.
The Dutch approach to medicine pricing is based on external reference pricing: list prices are capped under the Medicine Prices Act based on prices in a group of reference countries [4]. In addition, insurer preference policies steer prescribing towards the lowest-priced product for each active substance [4]. These policies are reflected in expenditure: the Netherlands consistently has among the lowest pharmaceutical spending compared to other Organisation for Economic Co-operation and Development (OECD) countries, both per capita and as a share of health spending, because of lower medicine consumption and lower prices [25,26]. For expensive hospital medicines, access is constrained further, with reimbursement deferred through closed budgets and the “sluis” procedure until a confidential price agreement has been reached [6]. These differences in pricing systems also influence price behaviour around LoE. Where prices are driven by reference pricing and generic competition, list prices tend to fall more steeply after LoE, whereas in negotiation-based systems a large part of the reduction is captured in confidential discounts and is therefore less apparent in list prices. The prediction framework presented here is calibrated to the Dutch context and would require a critical assessment before transfer to other countries.
Despite these limitations, this study establishes a foundational framework for incorporating dynamic price predictions into health economic analysis. The results highlight the potential of using dynamic pricing models over static assumptions, offering a more accurate representation of cost trajectories. The impact of dynamic medicine prices in health economic analysis is assessed in a publication by Schöttler et al. [15]. In the study, a comparison is made between static prices and dynamic prices, using a single cohort (year 1) and a multicohort approach (new annual cohort using the dynamic price from the current year). The price dynamics of the four case studies included a more linear price reduction over time (e.g., no LoE) and substantial price reductions (due to LoE). The impact on the ICER ranged from −43% to ~0% for single cohort and −113% to −1.5% for multicohort. The broad range was not just the result of the different price trajectories, but also the specific treatment characteristics, primarily because of the short drug utilisation period. Future developments in this area could significantly impact the standardisation of cost predictions and improve the accuracy of economic evaluations across healthcare markets.
Future research should focus on refining the model’s predictive capabilities by incorporating a wider array of data sources, enhancing its responsiveness to policy changes, and validating its applicability across different healthcare settings. Such advancements will be instrumental in shaping evidence-based health policies and optimising healthcare expenditures. The future development of the pricing model is inherently part of the process, where new data and insights can be used to improve the price predictions.
5. Policy-Relevant Findings
The model shows that medicine prices can be predicted in most cases and captures price dynamics over time better than static prices, although uncertainty remains. Incorporating dynamic price reductions into health economic evaluations could meaningfully alter cost-effectiveness outcomes but should also include the standard assessment within health economic uncertainty and sensitivity analysis. Predicted average price reductions result in lower ICERs when dynamic prices are applied compared to static price assumptions. These findings underscore the importance of accounting for real-world price dynamics in reimbursement decisions and pricing discussions.
Insight into medicine price dynamics can enhance the alignment of cost-effectiveness analyses with real-world outcomes and improve healthcare budgeting, purchasing, and decision-making by more accurately reflecting actual prices. Compared with the current use of static prices, dynamic prices would generally lower the ICER and budget impact, providing payers and health technology assessment (HTA) bodies with a more realistic estimate of lifetime costs to inform reimbursement decisions and price negotiations. However, the implementation of dynamic pricing introduces critical considerations. Specifically, the distributional implications of dynamic medicine prices under current cost-effectiveness thresholds, as described by Woods et al., and the black-box transparency issue, must be addressed [24,27]. The net health benefit of a new medicine is accrued over the pre- and post-LoE period [27]. During the pre-LoE period, health benefits can be calculated as the incremental health gains minus the health opportunity costs associated with acquiring the medicine. Following LoE, with the introduction of generics or biosimilars, health benefits reflect net health effects with minimal opportunity costs due to substantially lower prices resulting from market competition [27].
The use of static medicine prices means that when prices fall after LoE, the resulting gains accrue to payers and society, as reimbursement decisions assume a constant price. If anticipated price reductions are instead accounted for at the time of market access, part of this post-LoE value is recognised earlier in the product life cycle. While this could improve decision-making and purchasing by better reflecting real-life prices, it also raises a policy question: how the value generated over the full life cycle should be shared between manufacturers, payers, and society, and whether cost-effectiveness thresholds or decision frameworks would need to be adapted accordingly. These questions, together with how potential incentives for higher launch prices are addressed, warrant further research and policy debate before dynamic prices are adopted in reimbursement practice.
6. Conclusions
The development of the price prediction model marks a significant step towards integrating dynamic pricing into health economic evaluations. By forecasting medicine price trajectories, this model provides valuable insights for cost-effectiveness and budget impact analyses, informing decision-makers with more precise data. The incorporation of dynamic prices into economic evaluations can lead to more accurate assessments of treatment value and resource allocation.
This study underscores the importance of predictive models to account for the complexities of the pharmaceutical market, including policy-induced price shifts and regulatory interventions. As healthcare systems continue to evolve, the ability to predict and understand price dynamics will be crucial for ensuring sustainable and equitable access to medicines.
Author Contributions
Conceptualization, S.v.d.S., S.v.d.P., M.H.R. and C.B.; methodology, S.v.d.S. and S.v.d.P.; software, S.v.d.P.; validation, S.v.d.S. and S.v.d.P.; formal analysis, S.v.d.S. and S.v.d.P.; investigation, S.v.d.S. and S.v.d.P.; resources, S.v.d.S. and S.v.d.P.; data curation, S.v.d.S., S.v.d.P. and M.H.R.; writing—original draft preparation, S.v.d.S., S.v.d.P., M.H.R. and C.B.; writing—review and editing, S.v.d.S., S.v.d.P., L.B., M.H.R. and C.B.; visualisation, S.v.d.S. and S.v.d.P.; supervision, C.B.; project administration, S.v.d.S.; funding acquisition, C.B. All authors have read and agreed to the published version of the manuscript.
Funding
This research was funded by Pfizer Nederland.
Institutional Review Board Statement
Not applicable.
Informed Consent Statement
Not applicable.
Data Availability Statement
The datasets presented in this article are not readily available because they were obtained under a licence agreement with Farminform B.V. (Tielweg 10, 2803 PK Gouda, The Netherlands), a commercial third-party data provider, and are subject to restrictions on public sharing. Requests to access the datasets should be directed to Farminform B.V. (https://www.farminform.nl) or the corresponding author.
Acknowledgments
The authors gratefully acknowledge Pfizer Nederland for funding this study and Farminform B.V. for making the medicine sales data available for this research. During the preparation of this manuscript, the authors used Claude Opus 4.5 (Anthropic) for the purposes of summarising and checking grammar and spelling of the manuscript. The authors have reviewed and edited the output and take full responsibility for the content of this publication.
Conflicts of Interest
S.v.d.S., S.v.d.P. and C.B. were employed by Health-Ecore. L.B. and M.H.R. are employed by Pfizer and hold Pfizer stock and/or stock options. C.B. received grants and honoraria from various pharmaceutical companies. Employees of the funder (L.B. and M.H.R.) contributed to the study as authors, as described in the author contributions. Beyond these individual author roles, the funder had no role in the design of the study; in the collection, analyses, or interpretation of data; or in the decision to publish the results.
Abbreviations
The following abbreviations are used in this manuscript:
| ATC | Anatomical Therapeutic Chemical |
| BART | Bayesian Additive Regression Trees |
| BIA | Budget Impact Analysis |
| CBS | Statistics Netherlands |
| CEA | Cost-Effectiveness Analysis |
| CPI | Consumer Price Index |
| DDD | Defined Daily Dose |
| EMA | European Medicines Agency |
| GBM | Gradient Boosting Machine |
| GIP | Genees-en hulpmiddelen Informatie Project (Medicines and Resources Information Project) |
| GLM | Generalised Linear Model |
| HTA | Health Technology Assessment |
| ICER | Incremental Cost-Effectiveness Ratio |
| LASSO | Least Absolute Shrinkage and Selection Operator |
| LightGBM | Light Gradient Boosting Machine |
| LoE | Loss of Exclusivity |
| OECD | Organisation for Economic Co-operation and Development |
| QALY | Quality-Adjusted Life Year |
| RMSE | Root Mean Squared Error |
| SHAP | Shapley Additive Explanations |
| XGBoost | Extreme Gradient Boosting |
References
- OECD. Health Spending. Available online: https://www.oecd.org/en/data/indicators/health-spending.html (accessed on 19 November 2024).
- Medicines Reimbursement Policies in Europe; World Health Organization: Geneva, Switzerland, 2018; Available online: https://iris.who.int/bitstream/handle/10665/342220/9789289053365-eng.pdf?sequence=1 (accessed on 5 October 2026).
- Ministerie van Volksgezondheid, Welzijn en Sport. Zorginstituut: Uitgaven aan Intramurale Geneesmiddelen Stijgen 10% in een jaar—Nieuwsbericht—Zorginstituut Nederland. 29 April 2019. Available online: https://www.zorginstituutnederland.nl/actueel/nieuws/2019/04/29/zorginstituut-uitgaven-aan-intramurale-geneesmiddelen-stijgen-10-in-een-jaar (accessed on 19 November 2024).
- Ministerie van Algemene Zaken. Keeping Medicines Affordable—Medicines—Government.nl. 23 September 2015. Available online: https://www.government.nl/topics/medicines/keeping-medicines-affordable (accessed on 9 October 2024).
- Merritt, C. Principles for Application of International Reference Pricing Systems; European Federation of Pharmaceutical Industries and Associations: Bruxelles, Belgium, 2014. [Google Scholar]
- Zorginstituut Nederland. Sluis voor Dure Geneesmiddelen. Available online: https://www.horizonscangeneesmiddelen.nl/over-horizonscan-geneesmiddelen/geneesmiddelsluis (accessed on 19 November 2024).
- European Federation of Pharmaceutical Industries Associations. The Root Cause of Unavailability and Delay to Innovative Medicines: Reducing the Time Before Patients Have Access to Innovative Medicines. 2022. Available online: https://www.efpia.eu/media/636822/root-cause-unavailability-delays-cra-report-april-2022-final.pdf (accessed on 5 October 2026).
- Jørgensen, J.; Kefalas, P. The use of innovative payment mechanisms for gene therapies in Europe and the USA. Regen. Med. 2021, 16, 405–422. [Google Scholar] [CrossRef] [Scilit] [PubMed]
- Ministerie van Volksgezondheid, Welzijn en Sport. Geneesmiddel Trodelvy Niet in Basispakket—Nieuwsbericht—Rijksoverheid.nl. 28 March 2023. Available online: https://www.apothekersnieuws.nl/geneesmiddel-trodelvy-niet-in-basispakket/ (accessed on 19 November 2024).
- Ministerie van Volksgezondheid, Welzijn en Sport. Geneesmiddel Libmeldy Niet in Verzekerd Pakket—Nieuwsbericht—Rijksoverheid.nl. 12 April 2023. Available online: https://www.apothekersnieuws.nl/geneesmiddel-libmeldy-niet-in-verzekerd-pakket/ (accessed on 19 November 2024).
- Ministerie van Volksgezondheid, Welzijn en Sport. Zorginstituut: Nusinersen (Spinraza®) Tegen Huidige Prijs Niet in Basispakket—Nieuwsbericht—Zorginstituut Nederland. 7 February 2018. Available online: https://www.zorginstituutnederland.nl/actueel/nieuws/2018/02/07/zorginstituut-nusinersen-spinraza-tegen-huidige-prijs-niet-in-basispakket (accessed on 19 November 2024).
- Zorginstituut Nederland. Richtlijn Voor Het Uitvoeren van Economische Evaluaties in de Gezondheidszorg (versie 2024)—Publicatie—Zorginstituut Nederland. Ministerie van Volksgezondheid, Welzijn en Sport. 2024. Available online: https://www.zorginstituutnederland.nl/publicaties/publicatie/2024/01/16/richtlijn-voor-het-uitvoeren-van-economische-evaluaties-in-de-gezondheidszorg (accessed on 24 May 2024).
- Borges dos Santos, M.A.; dos Santos Dias, L.L.; Santos Pinto, C.D.B.; da Silva, R.M.; Osorio-de-Castro, C.G.S. Factors influencing pharmaceutical pricing—A scoping review of academic literature in health science. J. Pharm. Policy Pract. 2019, 12, 24. [Google Scholar] [CrossRef] [Scilit] [PubMed]
- van der Schans, S.; Vondeling, G.T.; Cao, Q.; van der Pol, S.; Visser, S.; Postma, M.J.; Rozenbaum, M.H. The impact of patent expiry on drug prices: Insights from the Dutch market. J. Mark. Access Health Policy 2020, 9, 1849984. [Google Scholar] [CrossRef] [Scilit] [PubMed]
- Schöttler, M.H.; Coerts, F.B.; Postma, M.J.; Boersma, C.; Rozenbaum, M.H. The Effect of the Drug Life Cycle Price on Cost-Effectiveness: Case Studies Using Real-World Pricing Data. Value Health 2023, 26, 91–98. [Google Scholar] [CrossRef] [Scilit] [PubMed]
- Farminform B.V. De Centrale Datatrust Voor Geneesmiddelen en Farmaceutische Zorg. 18 September 2024. Available online: https://www.farminform.nl/ (accessed on 7 October 2024).
- Statistics Netherlands (CBS). Inflation. 18 June 2024. Available online: https://www.cbs.nl/en-gb/visualisations/economy-dashboard/inflation (accessed on 19 November 2024).
- Chen, T.; Guestrin, C. XGBoost: A Scalable Tree Boosting System. In Proceedings of the 22nd ACM SIGKDD International Conference on Knowledge Discovery and Data Mining, San Francisco, CA, USA, 13–17 August 2016; pp. 785–794. [Google Scholar] [CrossRef] [Scilit]
- Wright, M.N.; Ziegler, A. Ranger: A Fast Implementation of Random Forests for High Dimensional Data in C++ and R. J. Stat. Softw. 2017, 77, 1–17. [Google Scholar] [CrossRef] [Scilit]
- Ke, G.; Meng, Q.; Finley, T.; Wang, T.; Chen, W.; Ma, W.; Ye, Q.; Liu, T.-Y. LightGBM: A Highly Efficient Gradient Boosting Decision Tree. In Advances in Neural Information Processing Systems 30 (NIPS 2017); Curran Associates, Inc.: Red Hook, NY, USA, 2017; pp. 3146–3154. Available online: https://www.microsoft.com/en-us/research/publication/lightgbm-a-highly-efficient-gradient-boosting-decision-tree/ (accessed on 5 October 2026).
- Chipman, H.A.; George, E.I.; McCulloch, R.E. BART: Bayesian additive regression trees. Ann. Appl. Stat. 2010, 4, 266–298. [Google Scholar] [CrossRef] [Scilit]
- European Medicines Agency (EMA). 4 October 2024. Available online: https://www.ema.europa.eu/en/homepage (accessed on 7 October 2024).
- Zorginstituut Nederland. GIPdatabank.nl. Available online: https://www.gipdatabank.nl/ (accessed on 20 June 2023).
- Ekanayake, I.U.; Meddage, D.P.P.; Rathnayake, U. A novel approach to explain the black-box nature of machine learning in compressive strength predictions of concrete using Shapley additive explanations (SHAP). Case Stud. Constr. Mater. 2022, 16, e01059. [Google Scholar] [CrossRef] [Scilit]
- OECD. Pharmaceutical Spending. Available online: https://www.oecd.org/en/data/indicators/pharmaceutical-spending.html (accessed on 5 October 2026).
- OECD. State of Health in the EU: The Netherlands. Country Health Profile 2025. Available online: https://www.oecd.org/content/dam/oecd/en/publications/reports/2025/12/country-health-profile-2025-country-notes_7e72146d/netherlands_a535bf5a/95a85df5-en.pdf (accessed on 5 October 2026).
- Woods, B.; Fox, A.; Sculpher, M.; Claxton, K. Estimating the shares of the value of branded pharmaceuticals accruing to manufacturers and to patients served by health systems. Health Econ. 2021, 30, 2649–2666. [Google Scholar] [CrossRef] [Scilit] [PubMed]



Disclaimer/Publisher’s Note: The statements, opinions and data contained in all publications are solely those of the individual author(s) and contributor(s) and not of MDPI and/or the editor(s). MDPI and/or the editor(s) disclaim responsibility for any injury to people or property resulting from any ideas, methods, instructions or products referred to in the content. |
© 2026 by the authors. Published by MDPI on behalf of the Market Access Society. Licensee MDPI, Basel, Switzerland. This article is an open access article distributed under the terms and conditions of the Creative Commons Attribution (CC BY) license.