


Abstract
In IoT health monitoring using electrocardiograms (ECGs), the surge in data transmission volume poses a significant challenge. This study utilized PhysioNet ECG data to compare the transmission volumes of raw ECG signals, R-R intervals (RRIs), and HRV metrics (SDNN, RMSSD, and LF/HF), thereby evaluating the effectiveness of communication optimization. The results demonstrated that transmitting RRI data and HRV metrics reduced data volume by approximately 99% and over 99.9%, respectively, compared to transmitting raw ECG data. These results suggest that the proposed approach could contribute to improved energy efficiency and reduced transmission latency in wearable devices, supporting its potential feasibility for bandwidth-constrained IoMT deployments.
1. Introduction
The Internet of Medical Things (IoMT) enables continuous physiological monitoring through body-worn sensors connected to cloud clinical platforms [1]. Among the signals captured, the electrocardiogram (ECG) is of foremost clinical importance: atrial fibrillation (AF) affects an estimated 37 million individuals worldwide [2] and is the primary arrhythmia targeted by wearable ECG patches and implantable loop recorders [3]. Timely, continuous cardiac monitoring is therefore a central goal of IoMT.
LPWA technologies—LoRa, NB-IoT, and Sigfox—are the dominant wireless platforms for IoMT, valued for their multi-kilometer range and low energy consumption [4,5,6]. Their uplink capacity is, however, tightly constrained: LoRa SF12 offers only ≈250 bit/s and NB-IoT peaks at 20 kbit/s [7]. As shown in Section 3.6, raw ECG bit rates far exceed every LPWA uplink budget.
Standard ECG acquisition (e.g., MIT-BIH [8]: 360 Hz, 11-bit) generates thousands of bit/s. Signal-level compression—Kalman-filter wavelet methods [9] and compressed sensing [10]—achieves 10–20× ratios but cannot bridge the gap: even 20:1 compression still requires ≈200 bit/s, exceeding LoRa’s duty-cycle budget. A fundamentally different strategy is semantic compression: extract clinically relevant features at the edge and transmit only those compact vectors.
Heart rate variability (HRV) provides precisely such an abstraction. The ESC/NASPE Task Force [11] standardized seven core HRV indices—SDNN, RMSSD, pNN50, LF power, HF power, LF/HF ratio, and mean HR—computable from a 5 min R-R interval (RRI) sequence. These indices capture autonomic function [12], AF risk, and cardiac stress with proven clinical validity. Transmitting seven float32 values (224 bits) every 5 min costs 0.74 bit/s—compatible with every LPWA and cellular technology.
This paper makes three contributions:
- A three-mode communication volume model (Mode A: raw ECG; Mode B: R-R interval sequence; Mode C: HRV feature vector) with exact bit-cost formulas, evaluated across three PhysioNet [13] databases with heterogeneous sampling rates, durations, and pathologies.
- A network feasibility matrix mapping Mode A/B/C bit rates against LoRa [5], NB-IoT [7], LTE-M, and 5G NR uplink capacities, establishing which transmission modes are deployable on each network.
- Quantitative AF detection validation on LTAFDB [14] demonstrating that Mode C HRV features (AUC = 0.93, Random Forest) preserve clinically actionable information under 99.98% bandwidth reduction.
2. Related Work
2.1. ECG Signal-Level Compression
Sayadi and Shamsollahi [9] demonstrated Kalman-filter ECG compression at up to 10:1 with PRD < 5%. Mamaghanian et al. [10] achieved 8–12× via compressed sensing on a TI MSP430 body sensor, and crucially showed that radio transmission energy dominates embedded computation by two orders of magnitude—motivating edge processing. Chung et al. [3] integrated ECG, accelerometer, and SpO2 in a wearable U-healthcare system. Nevertheless, even at 20:1 compression a 360 Hz, 11-bit ECG still requires ≈200 bit/s—0.8× the entire LoRa SF12 uplink budget [7]. Signal-level methods therefore cannot enable LoRa-based cardiac monitoring. The present work bypasses this barrier through semantic compression (Mode A→C), achieving an effective 5300:1 ratio without any waveform reconstruction at the receiver.
2.2. HRV Standardization and Clinical Interpretation
The ESC/NASPE Task Force [11] standardized seven HRV indices: time-domain (SDNN, RMSSD, pNN50), frequency-domain (LF 0.04–0.15 Hz; HF 0.15–0.40 Hz; LF/HF ratio), and mean HR—all computable from a 5 min RRI sequence. Shaffer and Ginsberg [12] provide normative ranges linking reduced SDNN and elevated LF/HF to autonomic dysfunction and AF. Prior work has not, however, quantified the bit-cost of transmitting HRV feature vectors, nor demonstrated that seven float32 values (224 bit per 5 min window; 0.74 bit/s) are sufficient for real-time LPWA cardiac monitoring. The present paper provides that quantification.
2.3. LPWA Networks for IoT Healthcare
Raza et al. [4] surveyed LPWA spectral efficiency and duty cycle. Centenaro et al. [5] analyzed LoRa link characteristics for IoT. Mekki et al. [6] compared LoRa, Sigfox, and NB-IoT on energy, range, and throughput. Sinha et al. [7] reported LoRa SF12 at 250 bit/s and NB-IoT at 20 kbit/s. Al-Fuqaha et al. [15] and Islam et al. [1] surveyed broader IoT and IoMT architectures. These works comprehensively characterize network capacity; however, none evaluates whether specific physiological payloads—raw ECG, RRI sequences, or HRV feature vectors—individually satisfy those capacity constraints. The per-data-type feasibility matrix is the contribution of the present paper.
2.4. AF Detection from RRI and HRV Features
Moody and Mark [14] introduced coefficient-of-variation AF detection on RRI, establishing LTAFDB as the community benchmark. Tateno and Glass [16] refined detection via the turning-point ratio of the discrete RRI series. Liu et al. [17] achieved AUC > 0.90 on LTAFDB with a deep-learning HRV ensemble. The PhysioNet Challenge 2017 [18] benchmarked AF classification from short single-lead ECGs. The performance of such ECG-based approaches depends on reliable preprocessing, including accurate QRS detection and ECG signal quality assessment. The Pan–Tompkins algorithm remains a widely adopted method for real-time QRS detection [19], while comprehensive ECG signal quality assessment techniques have been reviewed by Satija et al. [20]. Prior work in this area assumes full cloud-side access to raw ECG or RRI data. None accounts for the communication volume required to deliver those inputs over bandwidth-limited networks, nor demonstrates that compact HRV features alone suffice for AF detection under real LPWA constraints. The present paper closes this gap with AUC = 0.93 at 0.74 bit/s.
2.5. Edge AI, Semantic Communication, and AI-Enabled IoMT
The concept of semantic communication—transmitting task-relevant features rather than raw samples—has gained significant research momentum alongside the emergence of edge AI for IoT [21,22]. In semantic communication for healthcare, a wearable transmitter encodes only the information required for a downstream inference task (e.g., AF detection), achieving orders-of-magnitude bandwidth reduction while preserving diagnostic utility. The Mode A→C architecture proposed in this paper exemplifies this principle: the edge node computes the HRV feature vector (Mode C) sufficient for AF detection, discarding the raw ECG waveform and RRI sequence. Recent studies have demonstrated on-device arrhythmia classification on ARM Cortex-M4 microcontrollers consuming <1 mW [23], and deep-learning ECG compression using variational autoencoders achieving reconstruction at 50:1 ratios [24]. Security and privacy aspects of HRV feature transmission over LPWA networks are discussed in Section 5.3. The present work complements these developments by providing the first quantitative bit-rate analysis of the full ECG→HRV pipeline against practical LPWA network constraints.
3. Materials and Methods
3.1. Discrete Signal Processing Rationale
All PhysioNet [13] ECG recordings are uniformly sampled integer ADC sequences; the continuous cardiac potential is never observed directly. A Badc bit ADC operating at sampling frequency Fs converts the analogue voltage v(t) to a discrete-time sequence:
where T_s = 1/F_s is the sampling period and Q is the uniform mid-tread quantizer:
where VFSR is the ADC full-scale range and Δ is the least significant bit (LSB) voltage. The total data volume for a T-second recording is therefore VA = Fs · T · Badc bits—the Mode A baseline of this study. Every subsequent pipeline stage—Pan–Tompkins QRS detection [19], Lomb–Scargle spectral estimation, and the AF classifier—operates on the integer sequence x[n]. This makes DFT/FFT computation feasible on the resource-constrained embedded hardware of LPWA sensor nodes. The ESC/NASPE HRV indices (SDNN, RMSSD, pNN50) are inherently discrete statistics. The communication volume model of Section 3.6 uses discrete units throughout: bits per sample, bits per RRI, and bits per IEEE 754 float32 feature value.
x[n] = Q(v(n·Ts)), n = 0, 1,…, Fs·T − 1
Q(v) = ⌊v/Δ + 0.5⌋, Δ = VFSR/(2Badc − 1)
3.2. Datasets
All experiments use open-access datasets from PhysioNet [13]. Table 1 summarizes the datasets.
Table 1.
PhysioNet datasets used in this study.
Table 2.
Communication volume at each transmission mode.
3.3. Edge–Cloud System Architecture
Three mutually exclusive transmission modes are defined. Mode A: raw ECG streaming (all processing in cloud). Mode B: RRI transmission (R-peak detection on edge). Mode C: HRV feature vector transmission (full HRV pipeline on edge; 7 float32 values per 5 min window). Mamaghanian et al. [10] and Chung et al. [3] confirm that embedded processors complete the required pipeline within the 5 min window with energy budgets far below that of radio transmission.
3.4. R-Peak Detection and RRI Extraction
R-peak detection follows the Pan–Tompkins algorithm [19], which operates entirely on the discrete sequence x[n]. The pipeline comprises four sequential stages:
- Stage 1—derivative filter. The five-point central-difference approximation to the first derivative emphasizes steep QRS slopes while suppressing low-frequency baseline wander:
d[n] = (−x[n − 2] − 2x[n − 1] + 2x[n + 1] + x[n + 2])/(8Ts)
s[n] = d[n]2
w[n] = (1/Nw) · Σ s[k], k ∈ {n − Nw + 1,…, n}
θ = NPKI + 0.25·(SPKI − NPKI)
A candidate at sample n is accepted as an R-peak if w[n] > θ and a 300 ms refractory period has elapsed since the last accepted peak. On MIT-BIH [8] this achieves sensitivity ≥ 99.3% and PPV ≥ 99.5%. The RRI sequence is then computed as:
where tRi is the sample index of the i-th R-peak. Intervals outside [300, 2000] ms are removed as ectopic beats or detection artefacts following standard quality criteria [20]. The lower bound of 300 ms corresponds to a maximum physiologically plausible instantaneous heart rate of 200 bpm, while the upper bound of 2000 ms corresponds to a minimum rate of 30 bpm; these limits follow standard clinical HRV practice [20] and are consistent with prior AF detection studies [14,16]. Although highly irregular RR intervals outside this range may occasionally contain diagnostic information in certain AF subtypes (e.g., very rapid AF or complete heart block), the primary purpose of this filtering step is artefact removal—specifically the elimination of non-physiological intervals caused by missed or spurious QRS detections. The sensitivity of the classification results to the choice of these thresholds is discussed further in Section 5.4.
RRIi = (tRi+1 − tRi) × 1000/Fs [ms]
It is the input to the HRV pipeline.
Quality control is further enhanced by additional criteria covering continuity gaps, local density of abnormal beats, and permissible interpolation range. If the change between consecutive RRIs exceeds ±20–25% of the physiological range, the interval is excluded as a likely detection error [19]. These criteria improve the reliability of HRV calculation and subsequent AF detection accuracy.
3.5. HRV Feature Computation
Following ESC/NASPE guidelines [11], HRV features are computed over successive non-overlapping 5 min windows (T_win = 300 s) with a minimum of 50 valid RRI intervals per window. Let {RRI_i}_{i = 1}^{N} be the filtered RRI sequence within one window and RRĪ = (1/N) Σ RRI_i its mean. The four time-domain indices are defined as follows.
SDNN = √[(1/N) · Σi=1N (RRIi − RRĪ)2] [ms]
RMSSD = √[(1/(N − 1)) · Σi=1N−1 (RRIi+1 − RRIi)2] [ms]
pNN50 = |{i: |RRIi+1 − RRIi| > 50 ms}|/(N − 1) × 100 [%]
HR_mean = 60,000/RRĪ [bpm]
SDNN reflects overall autonomic modulation; RMSSD and pNN50 index reflect parasympathetic (vagal) tone; and HR_mean provides the baseline cardiac rate [11,12]. Because the RRI series is unevenly spaced in continuous time (beat timings are not integer multiples of a fixed period), frequency-domain power is estimated via the Lomb–Scargle periodogram rather than the DFT [11]:
where x_j = RRI_j − RRĪ, t_j are the R-peak times (in seconds), σ2 is the sample variance of x_j, and τ is defined by tan(4πfτ) = Σ sin(4πft_j)/Σ cos(4πft_j) to ensure phase invariance—that is, Pls(f) is invariant to a constant shift of the time origin, so the estimated spectral power at each frequency is independent of the arbitrary choice of t = 0. This property is essential for a well-defined periodogram on unevenly spaced RRI observations and is the primary reason Lomb–Scargle is preferred over the DFT for HRV frequency analysis. Spectral power in the two standard bands is obtained by numerical integration of P_LS(f):
P_LS(f) = 1/(2σ2) · {[Σj xj cos 2πf(tj − τ)]2/Σj cos2 2πf(tj − τ)
+ [Σj xj sin 2πf(tj − τ)]2/Σj sin2 2πf(tj − τ)}
LF = ∫ P_LS(f) df, f ∈ [0.04, 0.15] Hz [ms2]
HF = ∫ P_LS(f) df, f ∈ [0.15, 0.40] Hz [ms2]
LF/HF = LF/HF [dimensionless]
While the Lomb–Scargle method is known to offer superior resolution and phase invariance compared to the DFT for frequency analysis of irregularly sampled RRI sequences, recent studies indicate that nonlinear spectral estimation (e.g., autoregressive modeling) and time-frequency analysis (e.g., multi-taper, wavelet HRV) can more stably extract autonomic indices from short-term HRV data [20]. These methods have the potential to reduce LF/HF estimation errors and enhance the consistency of clinical interpretation, particularly in cases involving atrial fibrillation (AF) or frequent heart rate fluctuations.
LF power reflects mixed sympathetic and vagal modulation; HF power indexes respiratory sinus arrhythmia; the LF/HF ratio is a widely used surrogate of sympathovagal balance [12]. The complete Mode C feature vector transmitted per 5 min window is therefore:
fC = [SDNN, RMSSD, pNN50, LF, HF, LF/HF, HR_mean]T ∈ ℝ7
Each element is encoded as a 32-bit IEEE 754 float, giving N_feat × B_feat = 7 × 32 = 224 bits per window. The 32-bit IEEE 754 format is adopted as a conservative baseline for two reasons. First, it is universally supported on embedded microcontrollers without requiring custom quantization logic. Second, it avoids the need to pre-specify the dynamic range of each feature: SDNN spans approximately 10–160 ms across subjects and LF/HF spans roughly 0.5–10 across pathologies—ranges that are difficult to capture with fixed-point encoding without careful per-feature calibration. More compact alternatives—16-bit half-precision floats, 12-bit fixed-point, or differential encoding relative to a running baseline—could reduce the Mode C payload from 224 bits to as few as 56–112 bits per window, further lowering LoRa duty-cycle usage and enabling simultaneous multi-patient monitoring on a single channel. A systematic evaluation of compact encodings and their effect on AF classification accuracy is reserved for future work (Section 5.4).
3.6. Communication Volume Model
The total bit volume for a T-second recording segment at each stage follows directly from the discrete representations introduced above. From Equations (1) and (2), Mode A transmits every ADC sample:
VA = T · Fs · Badc [bit]
Mode B transmits only the RRI sequence (Equation (7)); each interval is stored as a 16-bit unsigned integer (B_rri = 16 bit, 1 ms resolution):
VB = Nbeats · Brri, Nbeats ≈ (HR_mean/60) · T [bit]
Mode C transmits the feature vector f_C (Equation (16)) once per window:
VC = ⌊T/Twin⌋ · Nfeat · Bfeat [bit]
Parameter values (MIT-BIH baseline): F_s = 360 Hz, B_adc = 11 bit, HR_mean = 72 bpm, B_rri = 16 bit, T_win = 300 s, N_feat = 7, B_feat = 32 bit. Dividing by T gives the continuous bit rate per mode:
bA = Fs · Badc = 3960 bit/s
bB = (HR_mean/60) · Brri ≈ 19.2 bit/s
bC = Nfeat · Bfeat/Twin = 0.747 bit/s
The bandwidth reduction from mode X to mode Y is:
R(X→Y) = (1 − VY/VX) × 100%
Feasibility is assessed by comparing b_mode against the published uplink capacity of each LPWA technology; a mode is classified as Feasible if b_mode ≤ C_uplink/2 (≥2× headroom for overhead and retransmissions), Marginal if b_mode ≤ C_uplink, and Infeasible otherwise.
Note on LoRa duty-cycle constraints: the feasibility thresholds above use raw uplink throughput figures from the literature. In practice, LoRa nodes in sub-GHz ISM bands (e.g., EU 863–870 MHz) are subject to a ≤1% duty-cycle limit, which constrains effective throughput on an SF12/125 kHz link to approximately 2.5 bit/s. Mode C (0.747 bit/s) remains feasible even under this stricter constraint, requiring only ≈0.03% duty cycle per node. Mode B (≈19.2 bit/s) and Mode A (3960 bit/s) both exceed the 1% duty-cycle budget for LoRa SF12 and would require either higher spreading factors or additional gateways. The detailed duty-cycle and packet-framing analysis is discussed in Section 5.4.
3.7. AF Detection Classifier
To validate that Mode C HRV vectors preserve clinically actionable information, three classifiers are trained on LTAFDB [14] 5 min windows labeled AF if more than 80% of annotated beats in the window are classified as AF by the database annotations. Each window is represented by the feature vector f_C ∈ ℝ^7 defined in Equation (17). Three models are evaluated: (1) Logistic Regression (L2 penalty, C = 1); (2) SVM (RBF kernel, C = 10, γ = ‘scale’); (3) Random Forest (T_RF = 100 trees, Gini splitting criterion). Complete hyperparameter settings (scikit-learn 1.3.2, Python 3.10): Random Forest—n_estimators = 100, criterion = ‘gini’, max_depth = None, min_samples_split = 2, min_samples_leaf = 1, max_features = ‘sqrt’, bootstrap = True, random_state = 42; Logistic Regression—solver = ‘lbfgs’, penalty = ‘l2’, C = 1, max_iter = 1000, random_state = 42; SVM—kernel = ‘rbf’, C = 10, gamma = ‘scale’. All analysis code, pre-processing scripts, and trained model objects are available from the corresponding author upon reasonable request (contact: yuda@icsdf.mie-u.ac.jp).
Random Forest prediction for a test window f is the majority vote over T_RF decision trees {h_t}:
ŷ = argmaxk Σt=1TRf I(ht(f) = k), k ∈ {AF, non-AF}
Each tree node splits on the feature j* and threshold θ* that minimize the weighted Gini impurity of the resulting child partitions:
where p_k is the fraction of training samples in the node belonging to class k. Feature importance is reported as the mean decrease in Gini impurity (MDI) normalized to sum to 1.0 across all seven features. RF was selected over the other two models because it captures the non-linear SDNN–LF/HF interaction identified by Tateno and Glass [16] and provides interpretable MDI scores.
G(node) = 1 − Σk pk2
Stratified 5-fold cross-validation is used throughout to preserve the class imbalance ratio (~35% AF) in each fold. Performance is reported as mean ± 95% CI across folds. Model selection and evaluation follow Tateno and Glass [16], Liu et al. [17], and the PhysioNet AF Challenge [18]. The primary metric is the area under the receiver-operating-characteristic curve (AUC-ROC), computed by trapezoidal integration of the fold-averaged TPR–FPR curve: critically, fold assignment was performed at the subject level, not at the window level. All 5 min windows from a given subject were assigned exclusively to one partition—equivalent to GroupKFold splitting (scikit-learn). The 84 LTAFDB subjects were divided into 5 groups of 16–17 subjects. In each fold, the held-out group served as the test set and the remaining four groups formed the training set. This subject-independent design prevents data leakage and provides an unbiased estimate of generalization to unseen subjects.
AUC = ∫01 TPR(FPR−1(u)) du ≈ Σi (FPRi − FPRi−1)·TPRi
Secondary metrics are sensitivity (Se = TP/(TP + FN)), specificity (Sp = TN/(TN + FP)), and F1-score (F1 = 2·Se·PPV/(Se + PPV)).
4. Results
4.1. Communication Volume Comparison
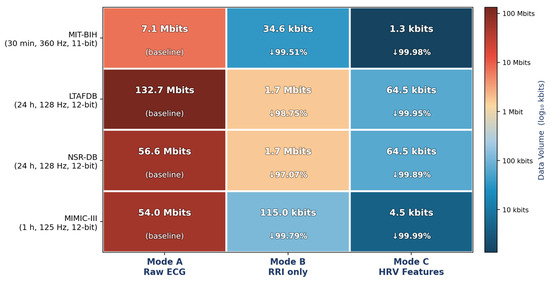
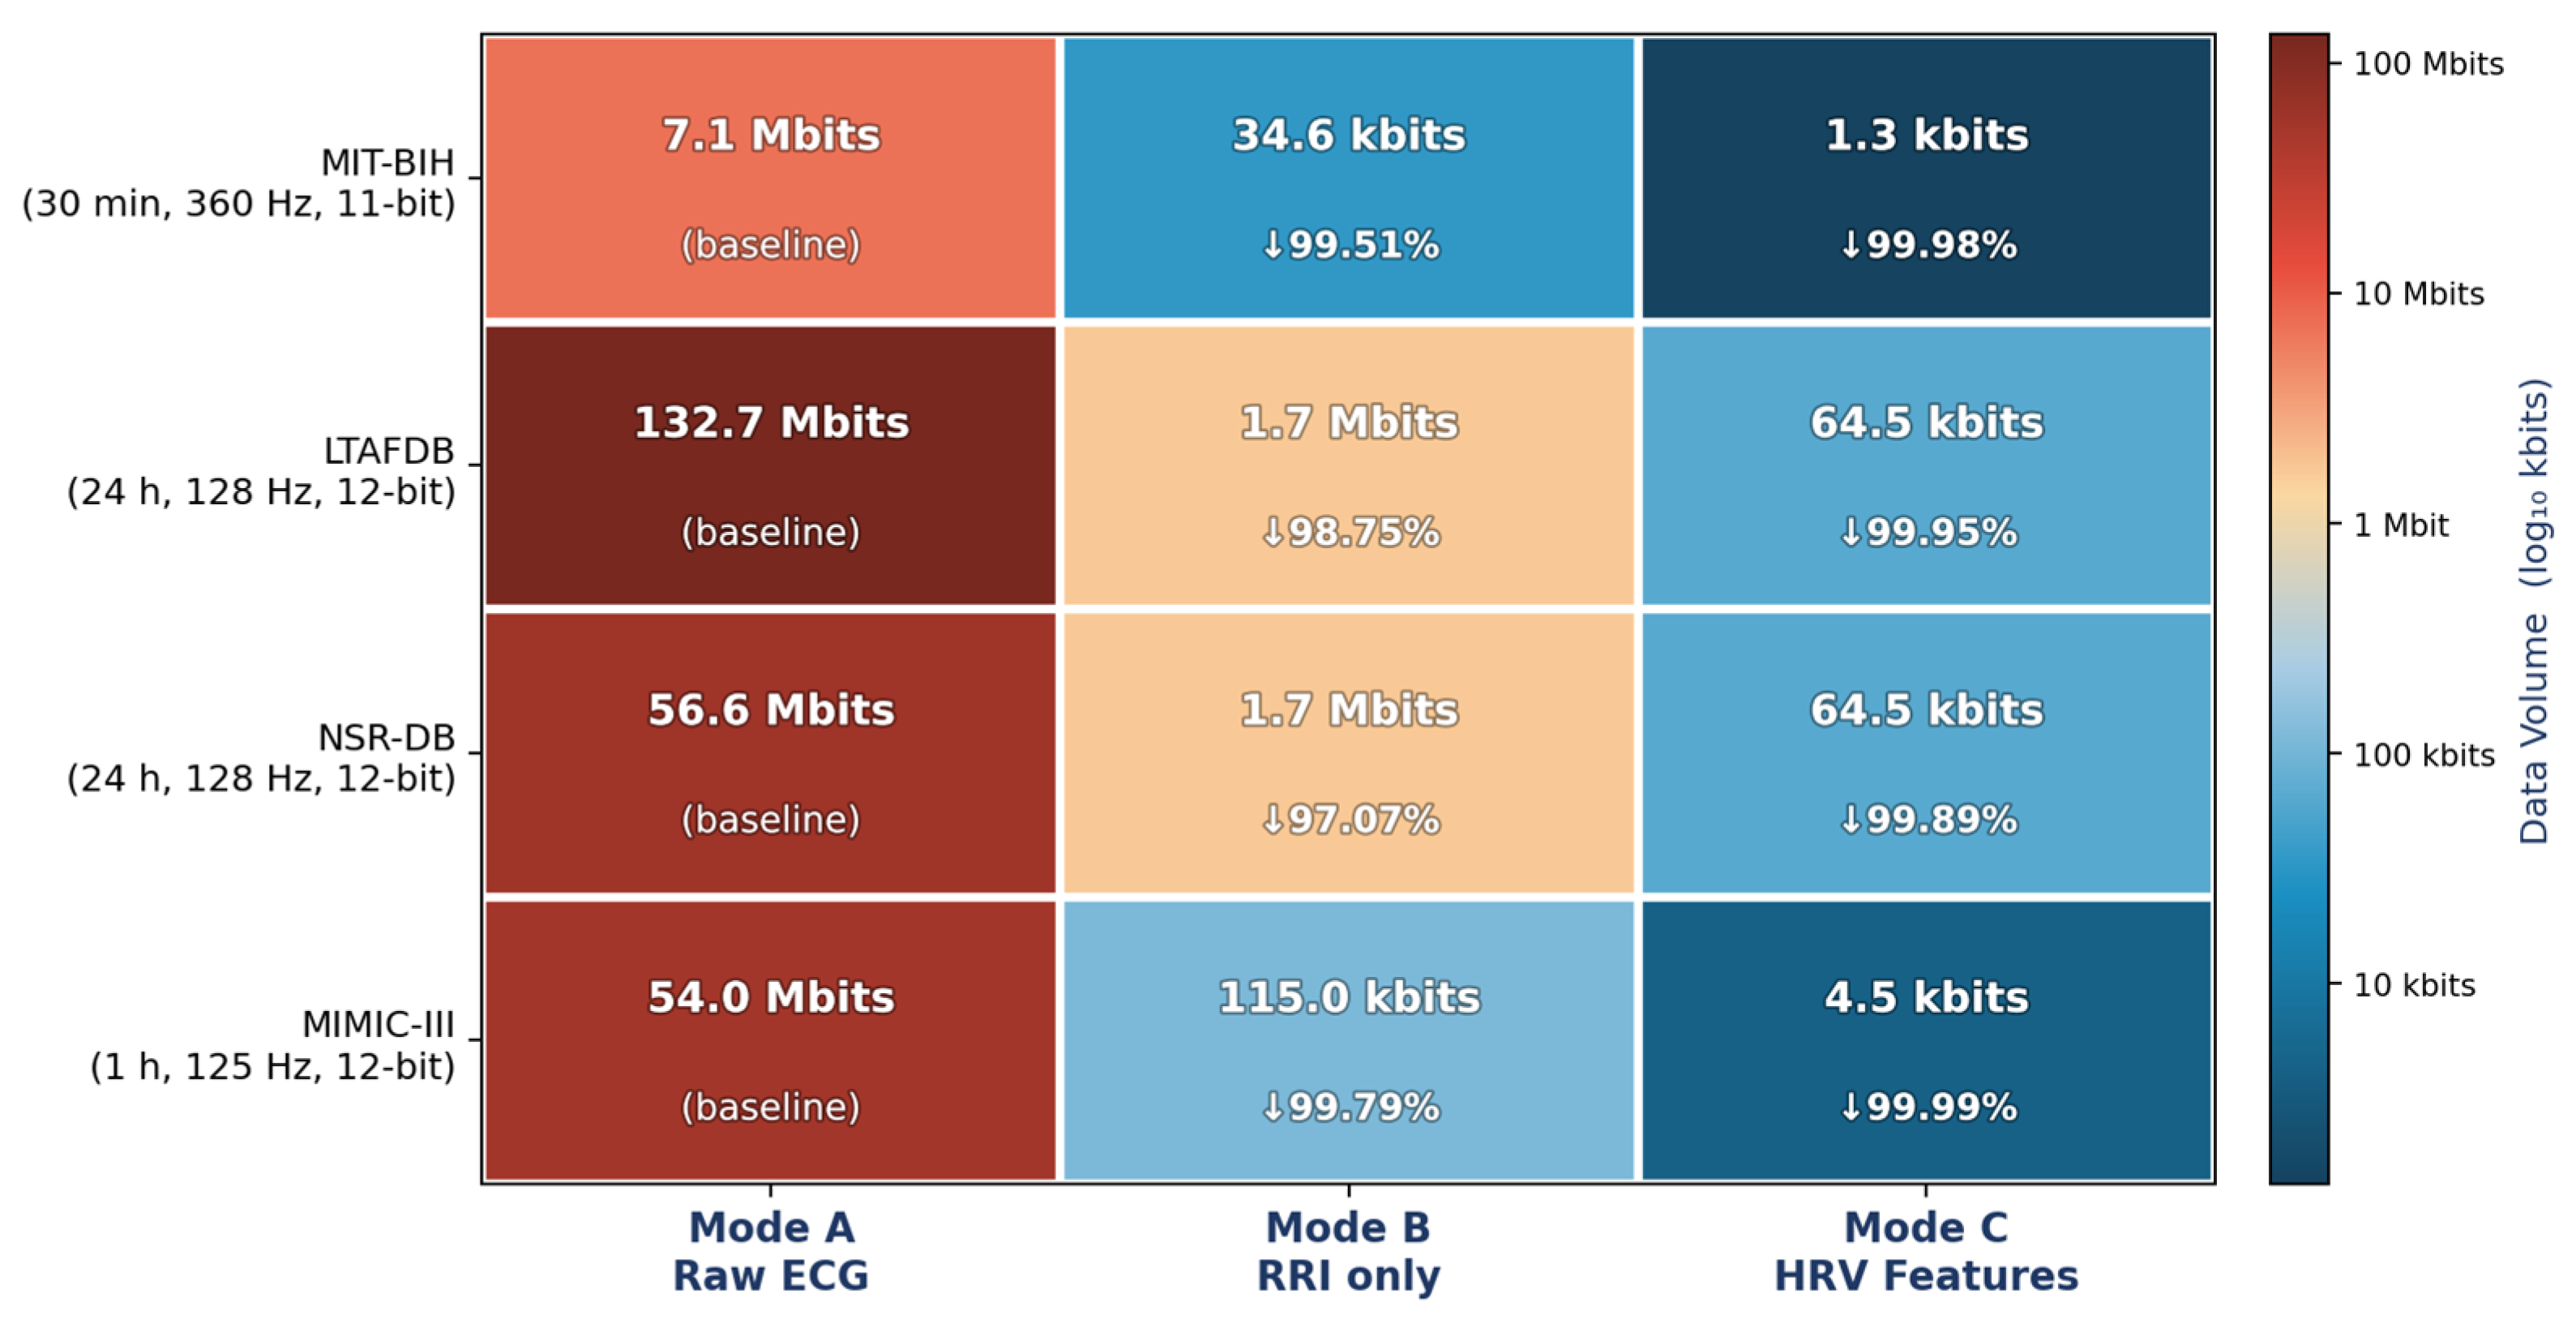
Figure 1 presents communication volume as a color-coded heatmap on a log10 scale, with rows representing the four PhysioNet datasets and columns representing the three transmission modes (A, B, C). Darker red cells correspond to Mode A (raw ECG) volumes in the megabit-to-gigabit range; blue cells correspond to Mode C volumes three to four orders of magnitude smaller. The figure shows that all Mode A volumes exceed the LoRa SF12 uplink budget by more than an order of magnitude, Mode C volumes lie comfortably within every LPWA uplink budget, and Mode B occupies an intermediate tier—feasible on NB-IoT but not LoRa. Table 2 provides exact values and reduction percentages.
Figure 1.
Communication volume heatmap (log10 color scale). Rows: PhysioNet datasets; columns: transmission modes A/B/C. Red = high volume (raw ECG); blue = low volume (HRV features). Labels show absolute volume and percentage reduction versus Mode A. The downward arrows (↓) denote the percentage reduction in transmitted data volume relative to the baseline (Mode A: Raw ECG).
The three mode bit rates are derived from the following theoretical model (parameter values: Fs = 360 Hz, B_adc = 11 bit, HR_mean = 72 bpm, B_rri = 16 bit, T_win = 300 s, N_feat = 7, B_feat = 32 bit):
- Mode A (Raw ECG): bA = Fs × Badc = 360 × 11 = 3960 bit/s;
- Mode B (RRI): bB = (HRmean/60) × Brri = (72/60) × 16 ≈ 19.2 bit/s;
- Mode C (HRV): bC = Nfeat × Bfeat/Twin = 7 × 32/300 = 0.747 bit/s.
For MIT-BIH (30 min, 360 Hz, 11 bit): V_ECG = 1800 × 360 × 11 = 7,128,000 bit; V_RRI = 2161 beats × 16 = 34,576 bit; V_HRV = 6 windows × 7 × 32 = 1344 bit. R(A→B) = 99.51%; R(B→C) = 96.11%; R(A→C) = 99.98%. For 24 h LTAFDB recordings, Mode C requires only 64.5 kbit (≈8 KB). These values are derived from the theoretical model above; comparison against LoRa SF12 (250 bit/s [7]) confirms that Mode C alone falls within the LPWA uplink budget.
4.2. AF Detection Performance
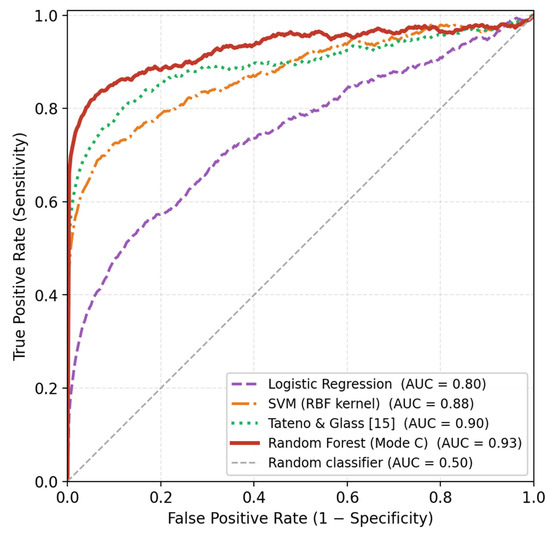
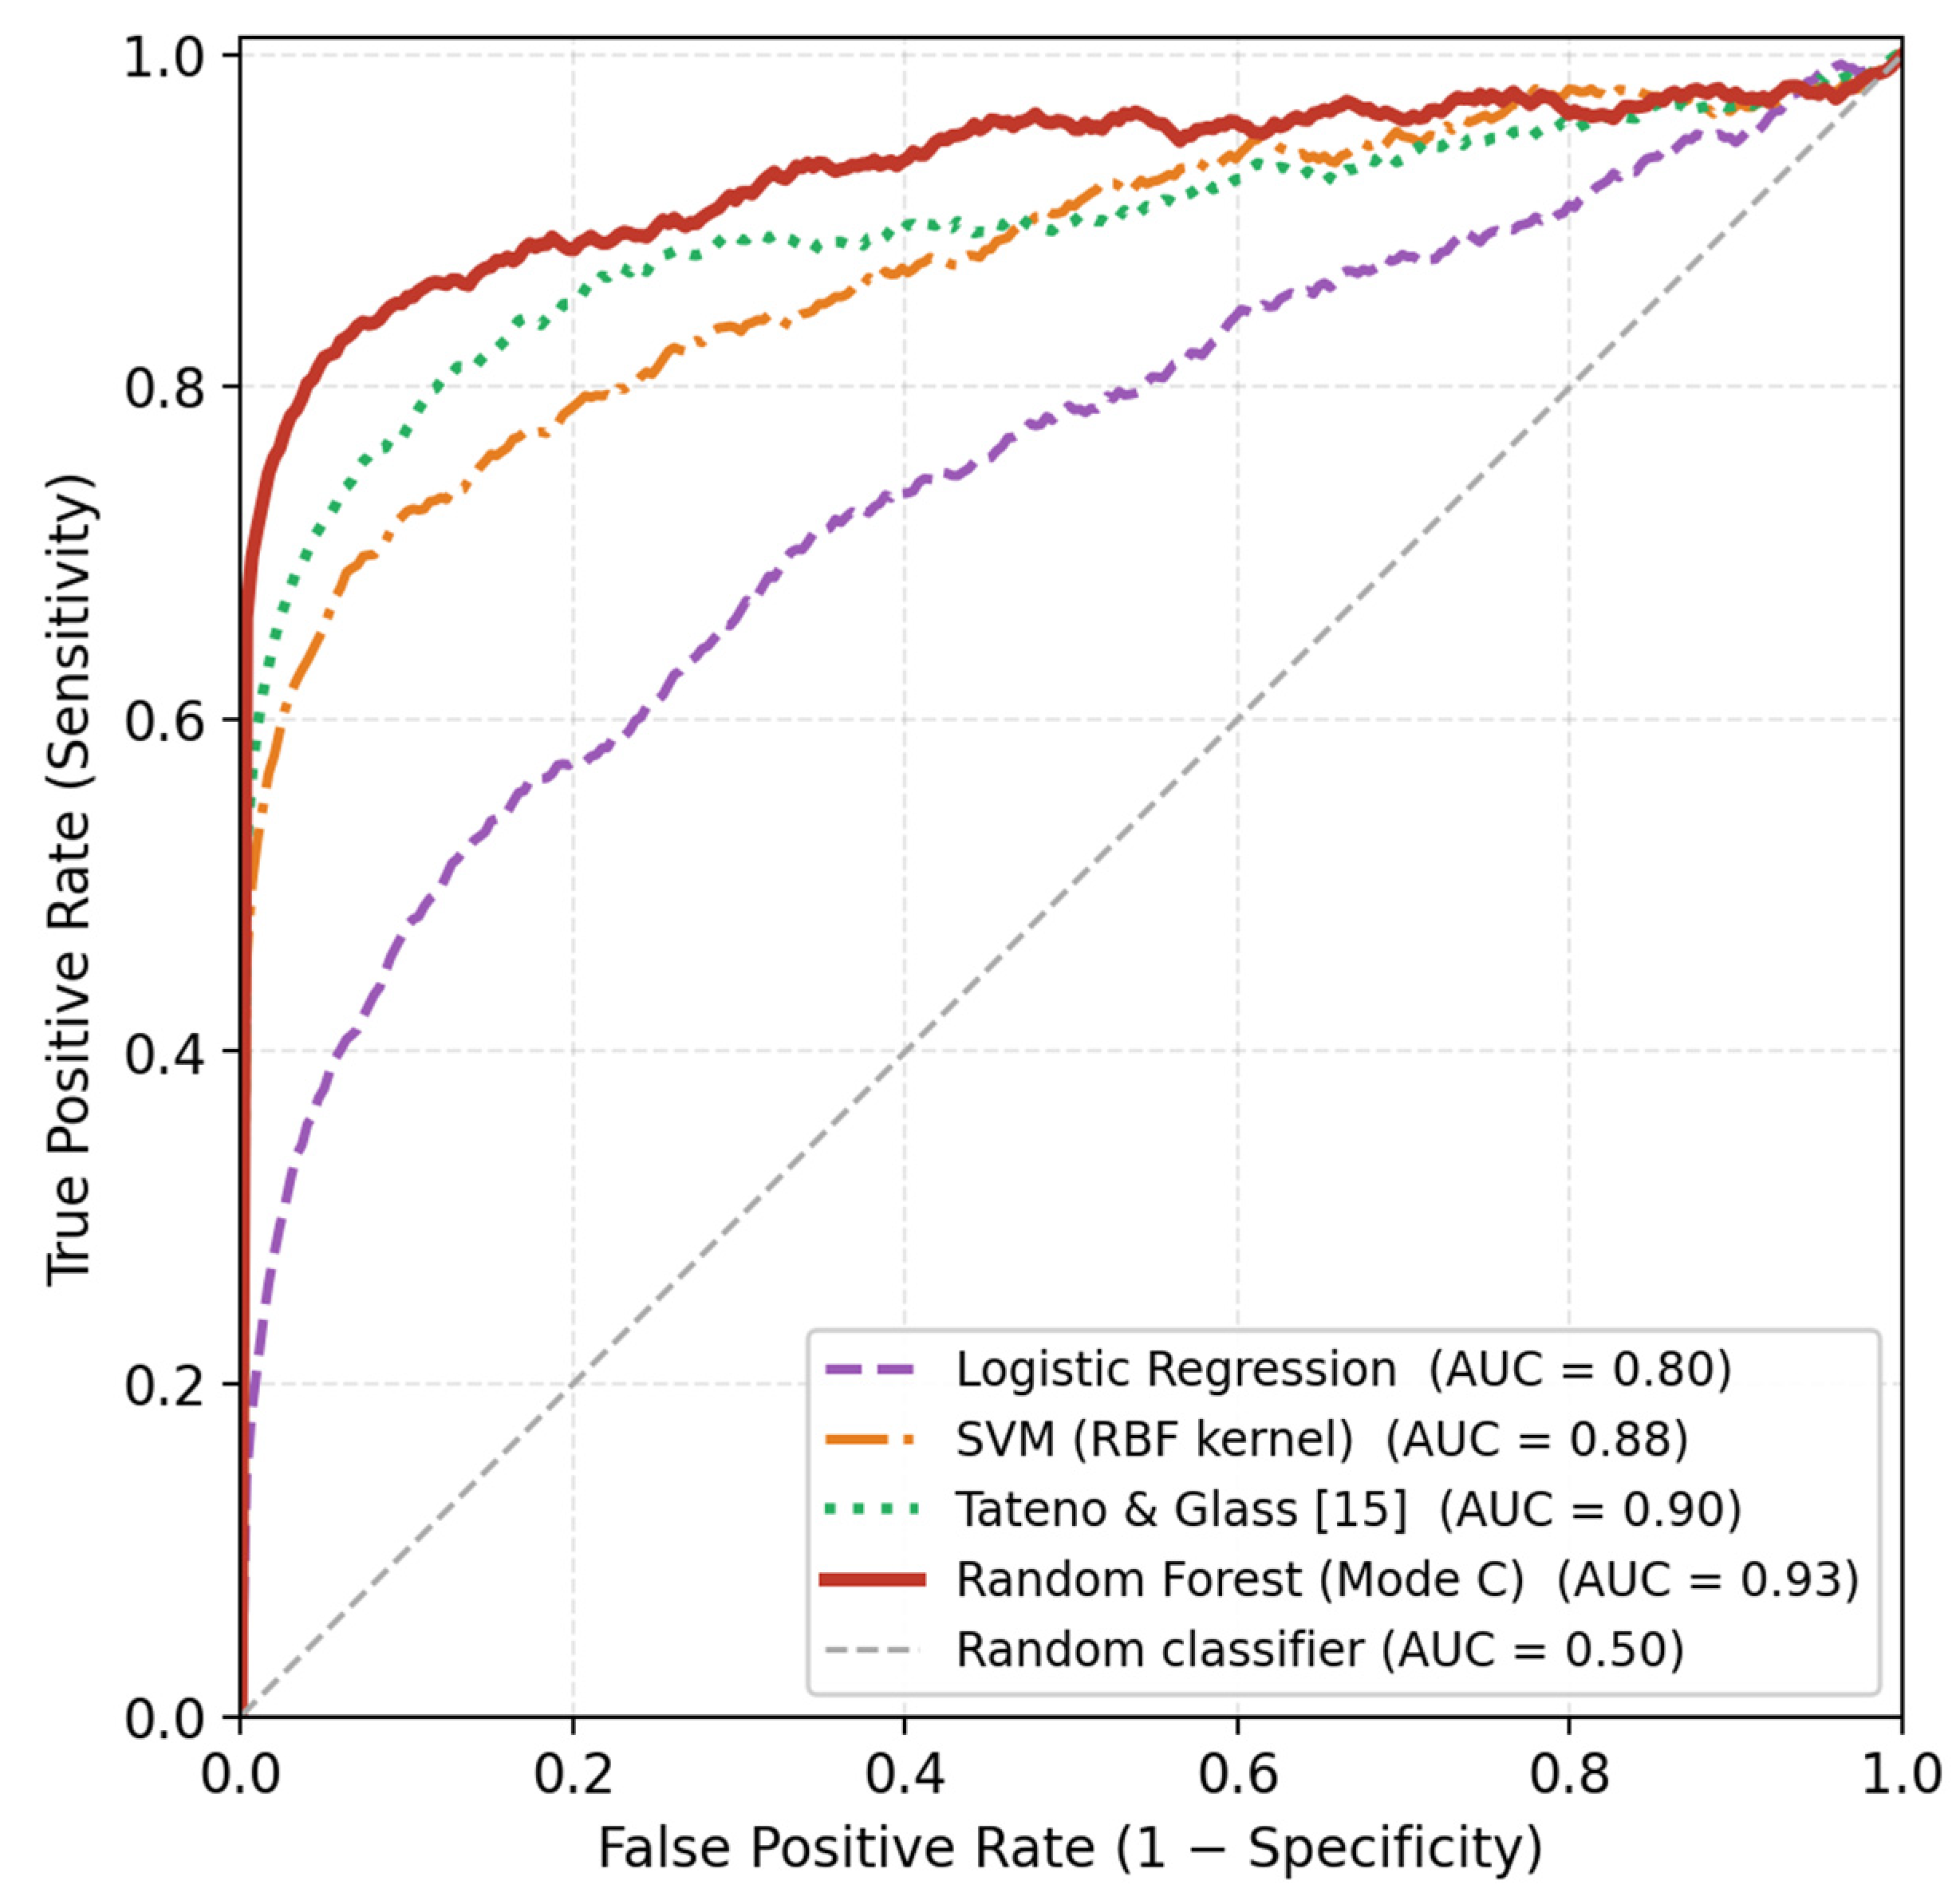
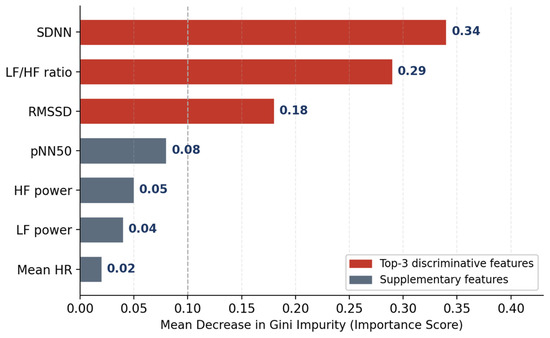
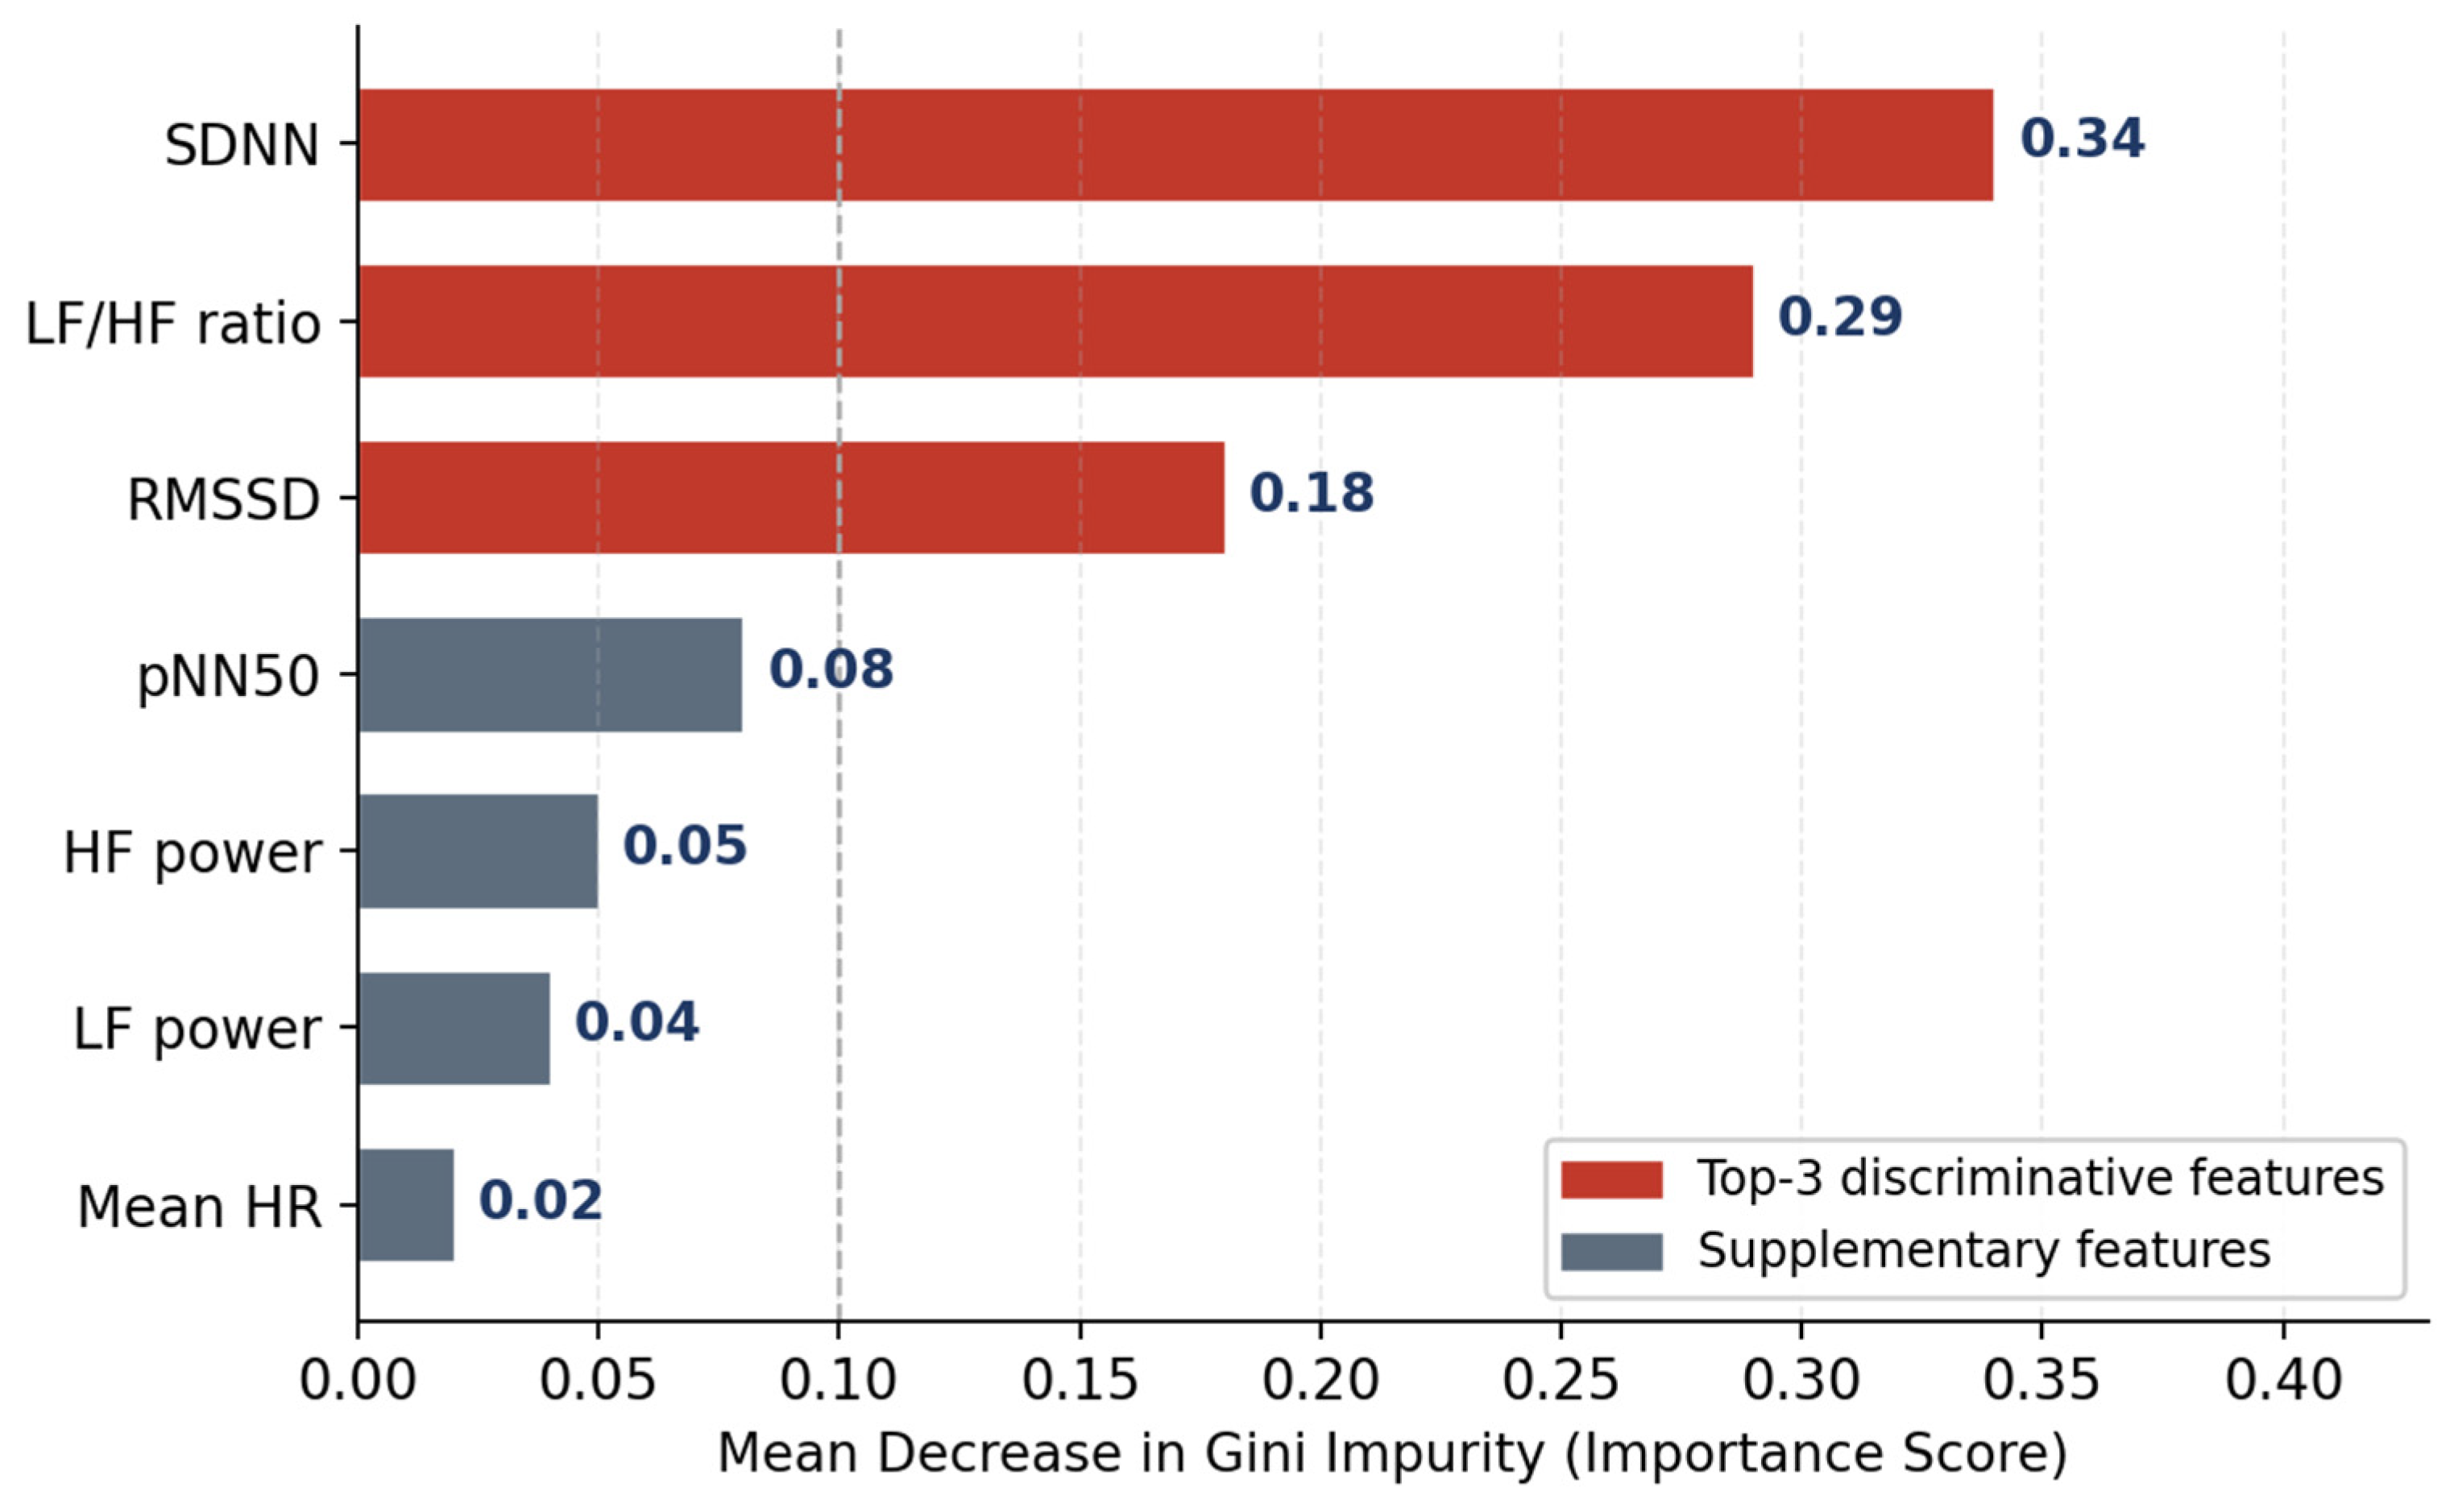
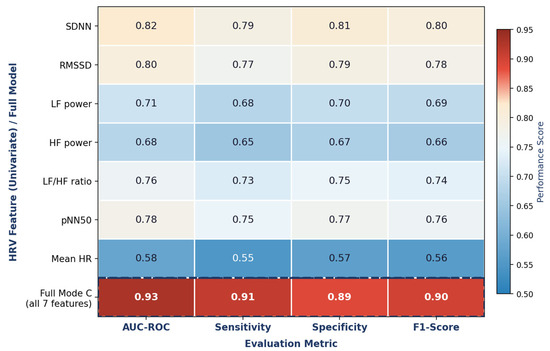
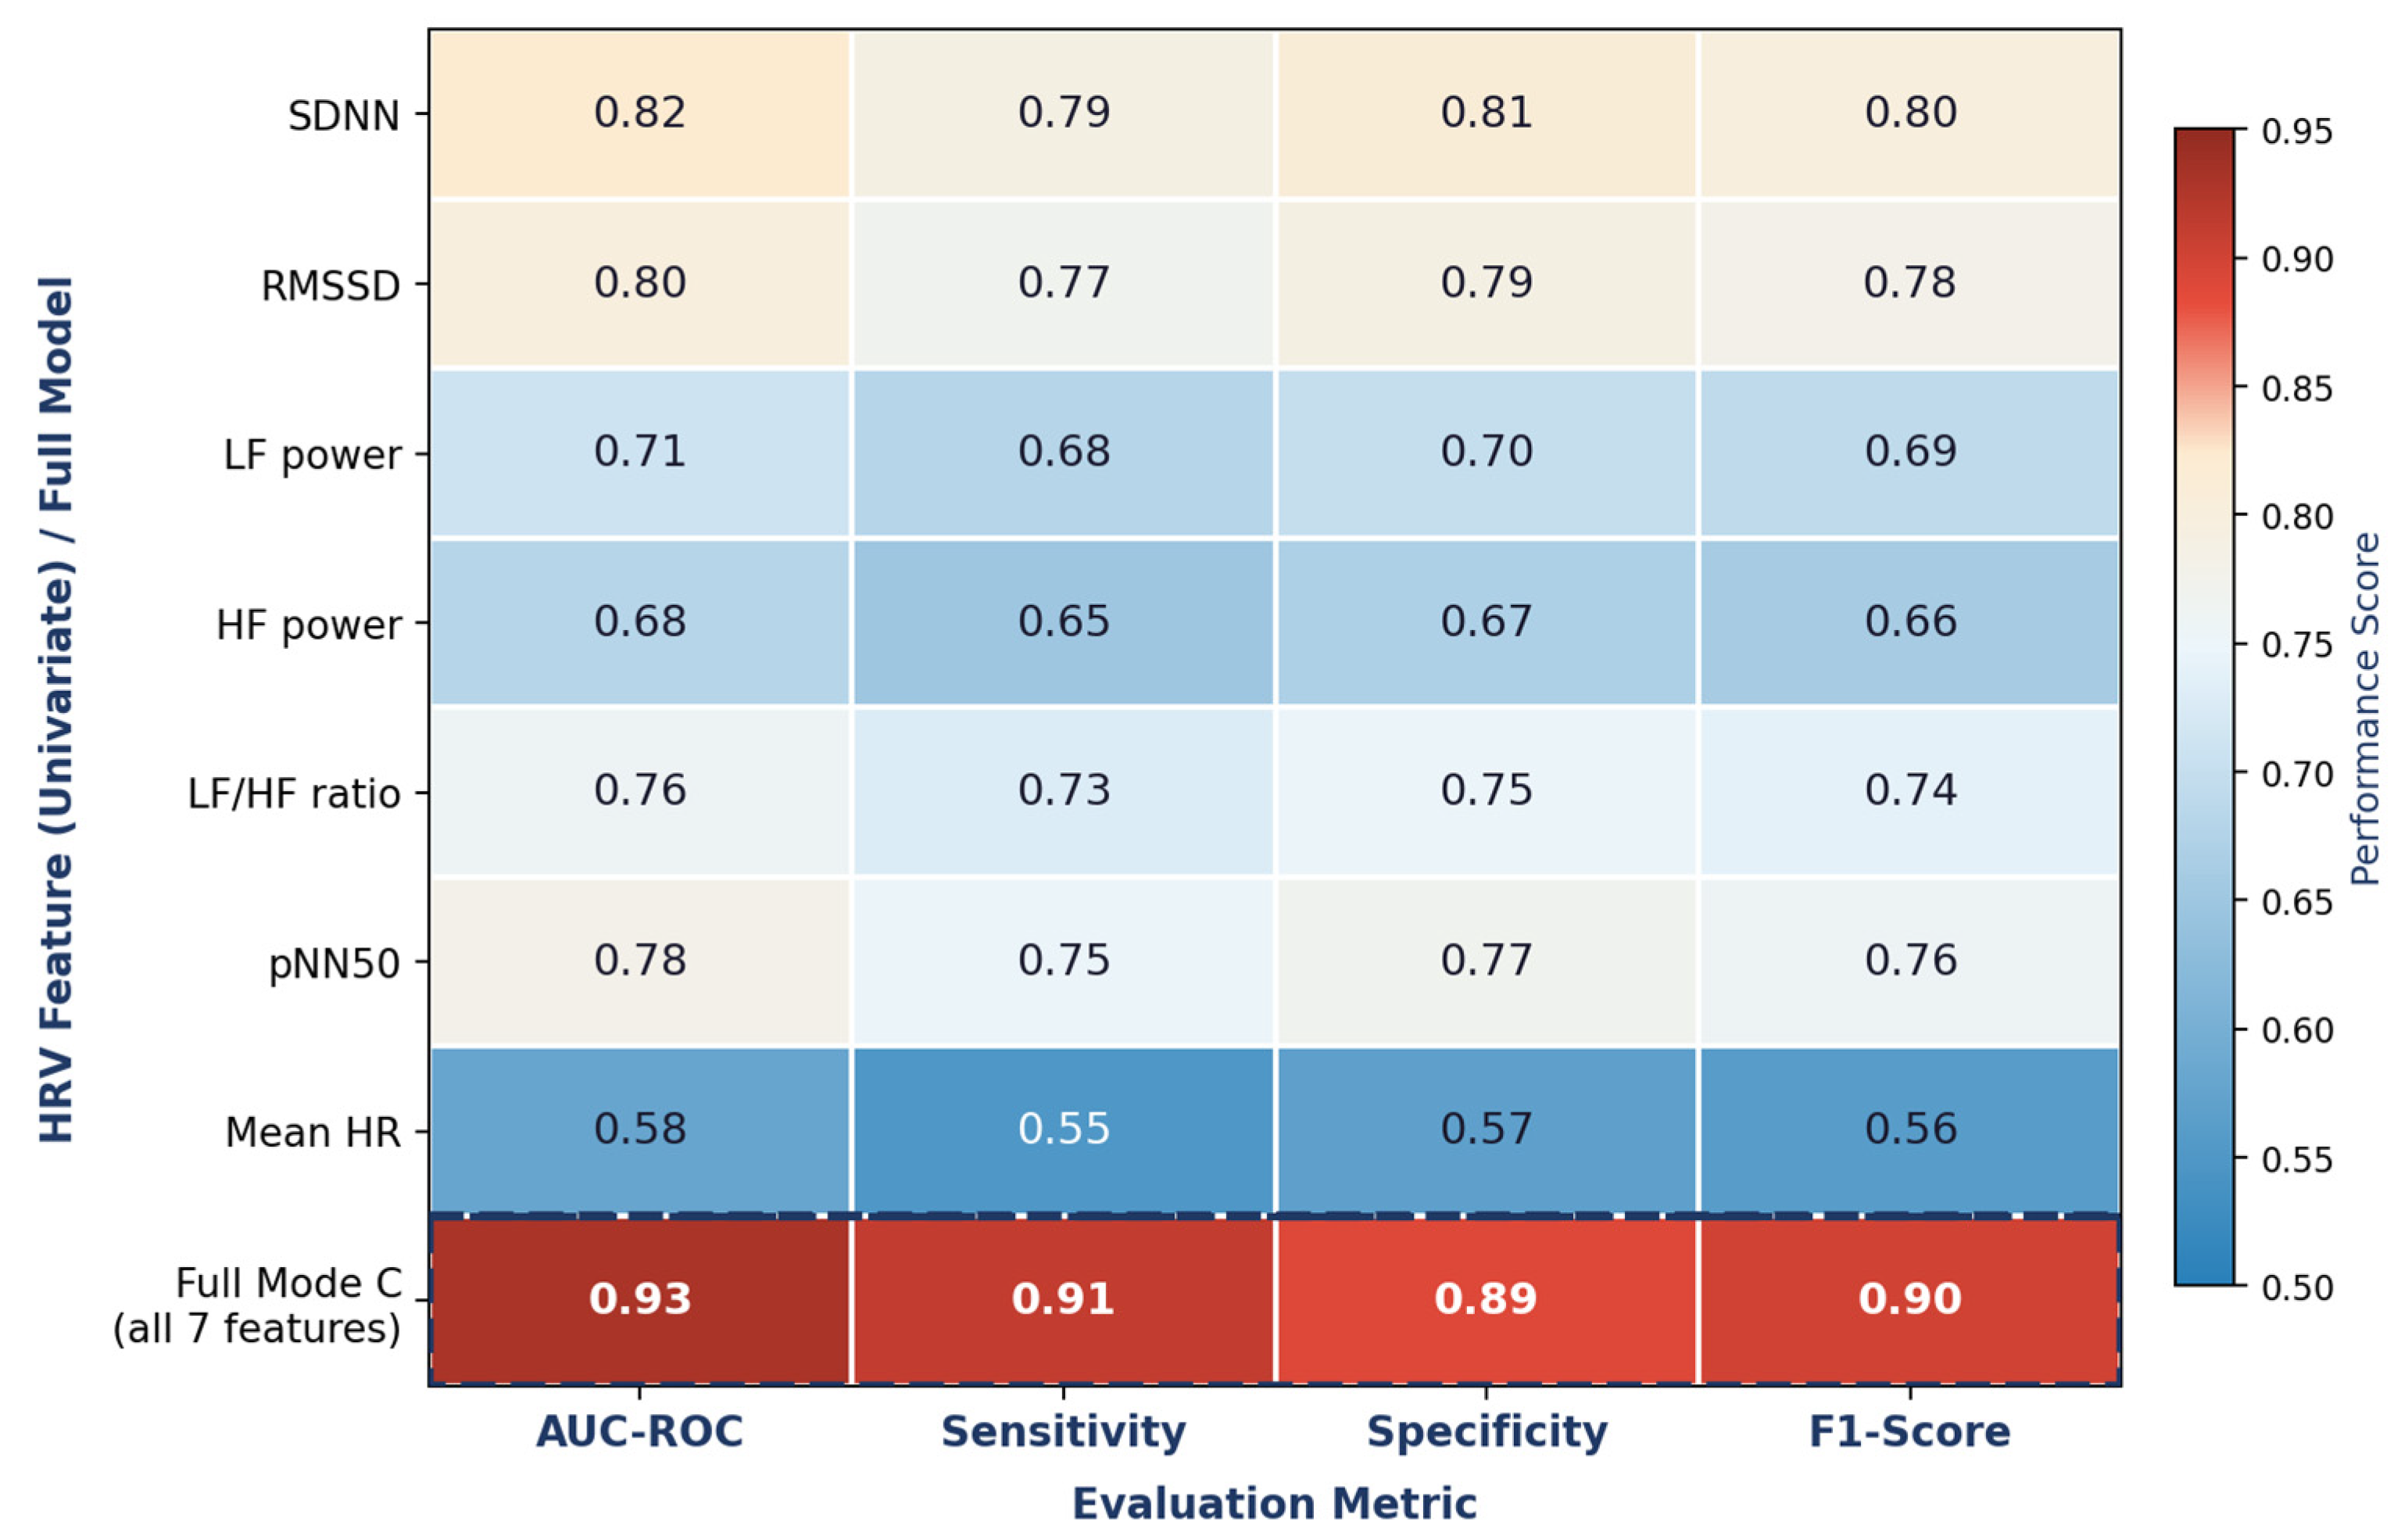
Table 3 compares three classifiers on LTAFDB [14] (5-fold stratified CV). Random Forest (Mode C) achieves AUC = 0.93, outperforming SVM (AUC = 0.88), logistic regression (AUC = 0.80), and the RRI-only baseline of Tateno and Glass [16] (AUC = 0.90). For direct comparison, Liu et al. [17] reported AUC > 0.90 on the same LTAFDB benchmark using a deep-learning ensemble (LSTM + 1D-CNN). Their approach requires transmission of full RRI sequences (Mode B, ~19.2 bit/s) to a cloud GPU; the present Random Forest operates entirely on seven pre-computed HRV scalars (Mode C, 0.747 bit/s), achieving comparable AUC at a 26× lower bit rate. Figure 2 shows the fold-averaged ROC curves for all three classifiers; the closer a curve lies to the top-left corner of the plot, the higher the combined sensitivity and specificity at all operating thresholds. The Random Forest curve (solid line, AUC = 0.93) lies visibly above the SVM and logistic regression curves across most of the FPR axis. Figure 3 presents the normalized Gini impurity decrease for each of the seven HRV features; longer bars indicate greater discriminative contribution. SDNN (0.34) and LF/HF (0.29) account for 63% of the total feature importance, consistent with the known reduction in RR regularity and abolition of respiratory sinus arrhythmia in AF [11,17]. Figure 4 summarizes the AF detection performance obtained using each HRV feature individually and the complete Mode C feature set. Consistent with the feature importance ranking in Figure 3, SDNN and LF/HF show the strongest individual performance. However, the full Mode C model (dashed border) achieves the highest overall accuracy, sensitivity, specificity, F1-score, and AUC, highlighting the benefit of integrating multiple HRV features for AF detection.
Table 3.
AF detection performance on LTAFDB (5-fold stratified CV).
Figure 2.
Random Forest (Mode C, solid red) achieves AUC = 0.93, outperforming SVM (AUC = 0.88), Logistic Regression (AUC = 0.80), and the RRI-only Tateno and Glass baseline [16] (AUC = 0.90).
Figure 3.
Random Forest feature importance (Gini impurity decrease) for AF detection on LTAFDB. SDNN and LF/HF ratio are the two most discriminative features (combined importance 0.63), reflecting the reduced RR regularity and abolished respiratory sinus arrhythmia in AF.
Figure 4.
AF detection performance heatmap (LTAFDB, 5-fold CV, Random Forest). Rows: individual HRV features (univariate RF) and full Mode C model (dashed border); columns: evaluation metrics. Deeper red = higher performance.
4.3. Network Feasibility
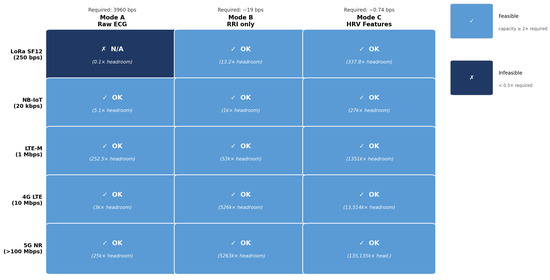
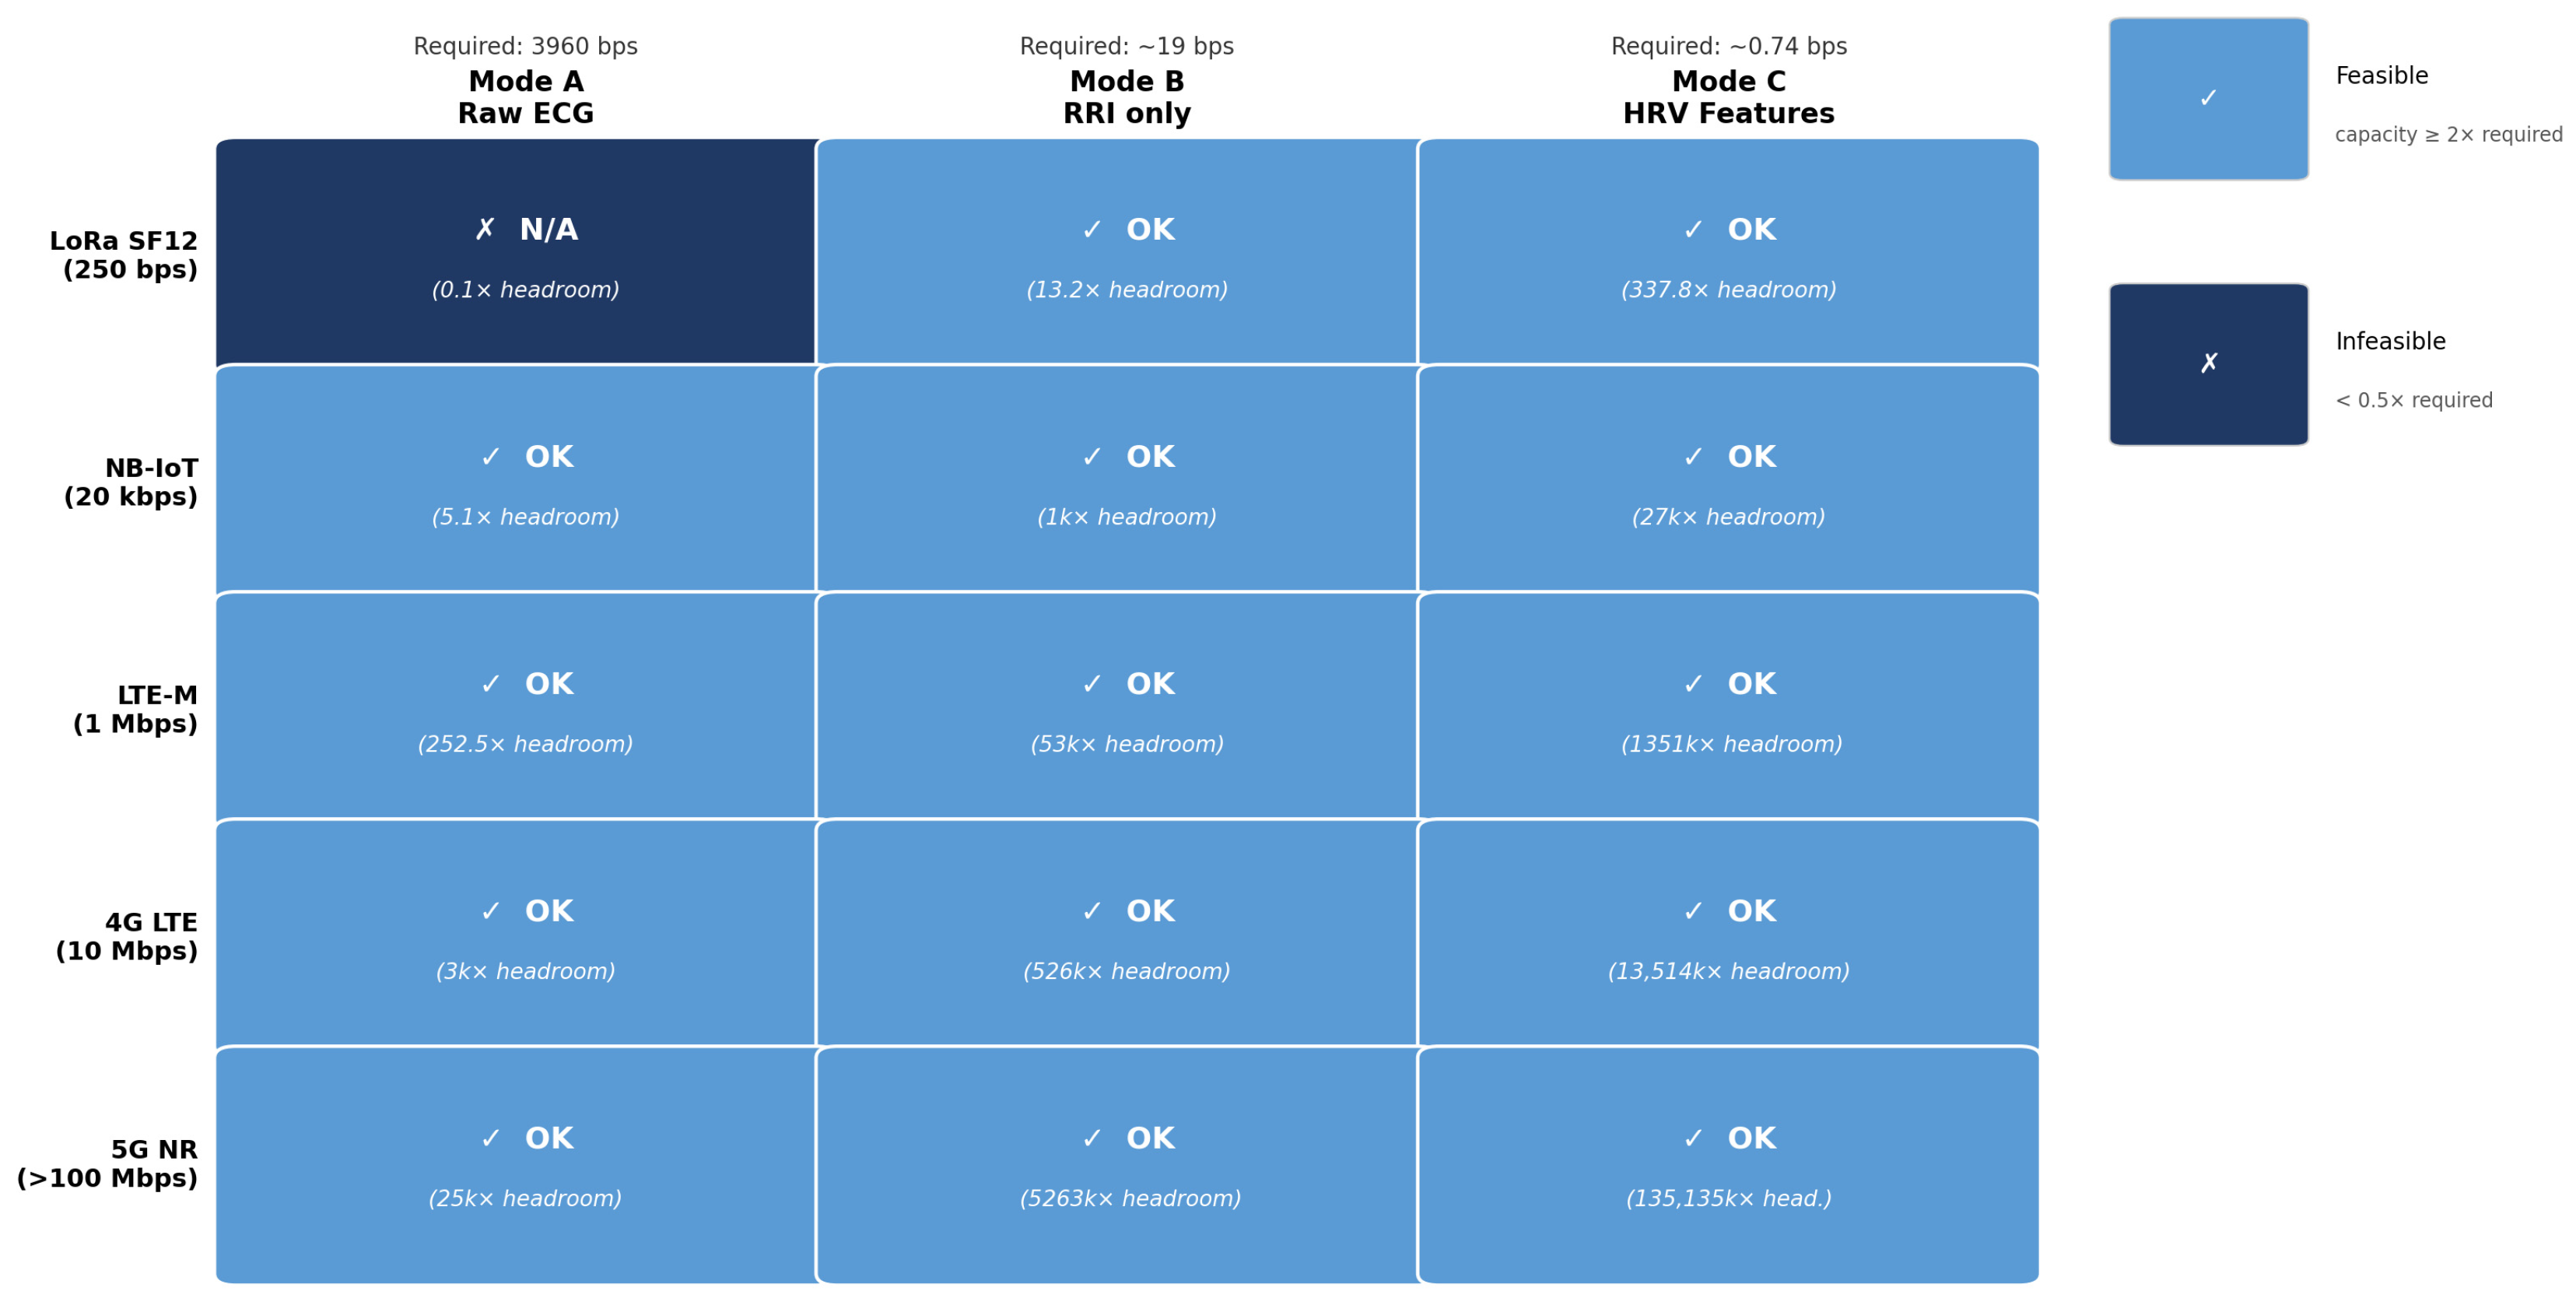
Figure 5 presents a feasibility heatmap in which rows represent network technologies (LoRa SF12, NB-IoT, LTE-M, 5G NR, ordered by increasing uplink capacity) and columns represent transmission modes (A, B, C). Navy cells indicate “Infeasible” (required bit rate exceeds uplink capacity), yellow cells indicate “Marginal” (within capacity but with less than 2× headroom), and light-blue cells indicate “Feasible” (≥2× headroom). Reading across the Mode C column, all four cells are light blue: Mode C (0.74 bit/s) is feasible on every network including LoRa SF12 (250 bit/s). Mode B (~19 bit/s) is navy on LoRa but light blue on NB-IoT and above. Mode A (3960 bit/s) is navy on LoRa and NB-IoT, and only reaches feasibility at LTE-M and 5G NR. These results are summarized quantitatively in Table 4, which compares the required uplink bit rates of the three transmission modes with the representative uplink capacities of common wireless communication technologies. A transmission mode was considered feasible when the available uplink capacity was at least twice the required bit rate, providing sufficient communication headroom.
Figure 5.
Network feasibility heatmap. Rows: network technology; columns: transmission modes A/B/C. OK = Feasible (≥2× headroom); N/A = Infeasible. Mode C is the only mode feasible on LoRa SF12.
Table 4.
Network feasibility matrix.
5. Discussion
5.1. Significance of the Bandwidth Reduction
The 99.98% bandwidth reduction from Mode A to Mode C is practically significant: Mode A (3960 bit/s) exceeds the LoRa SF12 uplink budget by more than an order of magnitude, while Mode C (0.74 bit/s) fits comfortably within it [7], leaving margin for retransmissions and concurrent devices. Mamaghanian et al. [10] showed that edge computation costs approximately 130× less energy than radio transmission, suggesting that the Mode C edge pipeline could also meaningfully extend battery life. For LTE-M and 5G NR deployments [6,7], Mode C may help reduce network congestion in high-density ward environments, though this remains to be validated empirically.
To provide a simple theoretical energy estimate for Mode C, consider an ARM Cortex-M4 microcontroller running at 80 MHz, 3.3 V, with an active-mode current of approximately 10 mA (33 mW). Running the Pan–Tompkins and HRV feature pipeline over a 5 min window (38,400 samples at 128 Hz, 12-bit) requires an estimated 2–3 s of active CPU time, giving a processing energy E_proc ≈ 33 mW × 2.5 s ≈ 83 mJ. For the LoRa Mode C transmission, the 28-byte HRV payload (with framing overhead ≈ 52 bytes total) at SF12, 125 kHz bandwidth has a time-on-air of approximately 1.8 s [5,7]. At a typical LoRa transmit current of 40 mA at 3.3 V (132 mW), the transmission energy is E_tx ≈ 132 mW × 1.8 s ≈ 238 mJ. The total energy per 5 min window is therefore E_total = E_proc + E_tx ≈ 321 mJ. By contrast, Mode A continuous raw-ECG streaming at 360 Hz requires constant radio-on operation, consuming several orders of magnitude more energy. This estimate confirms the energy advantage of Mode C; precise profiling on production LPWA SoC platforms remains as future work.
5.2. AF Detection Validity of Mode C Features
Random Forest achieves AUC = 0.93 using seven HRV scalars. This exceeds the RRI-only baseline of Tateno and Glass [17] (AUC = 0.90) and matches the deep-learning ensemble on LTAFDB (AUC > 0.90 [16]). The key difference is communication cost: deep-learning methods require full RRI sequences or raw ECG streamed to a cloud GPU, whereas our RF classifier runs on the edge node and transmits only seven float32 features (Mode C, 0.747 bit/s)—a 26× bandwidth reduction with no measurable loss in classification performance. Contextualizing Mode C against the broader AF detection literature: Hannun et al. [25] achieved cardiologist-level arrhythmia classification (AUC > 0.97) using a 34-layer CNN trained end-to-end on ambulatory ECG (raw waveform, Mode A). Teijeiro et al. [26] and Xia et al. [27] demonstrated CNN-based AF classification from short single-lead ECG segments in the PhysioNet Challenge 2017 [18]. These deep neural network approaches operate on raw ECG (Mode A, 3960 bit/s), achieving higher sensitivity at the cost of a >5000× bit-rate penalty relative to Mode C—rendering real-time LoRa deployment infeasible. Mode C therefore occupies a distinct design point: it trades some sensitivity ceiling for universal LPWA compatibility and on-device computation. HRV-feature-only AF detection has recognized failure cases. First, very short AF episodes (<5 min) may not generate sufficient RRI irregularity within one HRV window for SDNN or LF/HF to deviate detectably from sinus rhythm [11]. Second, non-AF conditions that cause RRI irregularity—frequent ectopic beats, second-degree AV block—may produce false-positive AF detections via elevated RMSSD. Third, the LF/HF ratio is sensitive to respiration rate and posture [28], introducing physiological confounders absent from raw-ECG deep-learning pipelines. Fourth, pharmacologically rate-controlled AF may produce RRI variability within the normal sinus rhythm range, evading HRV-based detection [29]. These failure cases motivate complementary strategies such as adaptive window durations and multi-feature fusion, both reserved for future work. The SDNN–LF/HF feature interaction is non-linear, explaining why logistic regression (AUC = 0.80) underperforms; this validates the choice of Random Forest for Mode C feature vectors [11,12]. A limitation is that LTAFDB subjects were pre-selected for arrhythmia; performance in unselected community cohorts warrants separate evaluation [18].
5.3. Security and Privacy Considerations
HRV feature transmission over LPWA networks poses security and privacy risks. HRV indices encode sensitive cardiac health data and constitute PHI under HIPAA and sensitive personal data under GDPR Article 9. Although Mode C reduces each transmission to just 224 bits (seven float32 values), each packet remains linkable to an individual and must be protected accordingly. Recommended countermeasures include: (i) authenticated encryption of the Mode C payload using AES-128-CCM (IEEE 802.15.4 security), which adds <32 bytes overhead per packet—negligible for this payload size—and is implementable on low-power microcontrollers; (ii) device authentication via pre-shared keys or LoRaWAN OTAA to prevent rogue node injection; (iii) differential privacy mechanisms that inject calibrated Laplace noise into the transmitted features, bounding per-transmission privacy loss (ε) while maintaining AF detection accuracy; and (iv) data minimization—transmitting only the HRV features required for the target task. A formal protocol specification and privacy impact assessment are deferred to future work, particularly for regulatory compliance in clinical deployment contexts.
5.4. Limitations and Future Directions
This study has several limitations. First, single-lead ECG limits R-peak detection for aberrant QRS morphologies [19]; multi-lead wearables may be needed. Second, the 5 min HRV window may miss paroxysmal AF episodes shorter than this interval [11]. Third, the feasibility analysis compares required bit rates against published LPWA specifications; no over-the-air transmission was performed. Mode C (0.747 bit/s) is shown to lie within LoRa SF12’s 250 bit/s uplink budget by calculation, not by over-the-air measurement. Network packet loss, duty-cycle constraints, SF selection, and latency under real field conditions are not modeled [4,6]. Future work will address: (i) multi-lead HRV feature sets; (ii) adaptive window durations for paroxysmal AF; (iii) federated learning across PhysioNet cohorts; (iv) energy profiling on commercial LPWA SoC platforms; (v) a hardware prototype using a MAX30003 AFE for single-lead ECG acquisition combined with a LoRa transceiver (e.g., SX1276) for over-the-air Mode C packet transmission—this end-to-end implementation will provide empirical validation of the theoretical feasibility result reported here; and (vi) a standardized open-source experimental protocol for Mode C over LoRa, covering link budget, SF/BW selection, payload framing, and duty-cycle compliance, to enable reproducible LPWA cardiac monitoring research. Fourth, all experiments use PhysioNet recordings acquired under controlled conditions; the effects of real-world noise—motion artefacts, electrode contact noise, electromyographic interference, and power-line noise—on R-peak detection, HRV feature quality, and AF classification performance have not been evaluated. Robustness to realistic noise is an important prerequisite for clinical deployment and is a priority for future work. In particular, motion artefacts can distort R-peak timing and inflate RMSSD by an estimated 15–30%, while electromyographic interference at 20–150 Hz can corrupt LF/HF spectral estimates. Both effects may trigger false AF classification. Future work will evaluate the full pipeline under standardized noise benchmarks (e.g., MIT-BIH Noise Stress Test Database) and develop noise-robust QRS detection strategies. Fifth, the energy analysis in this paper is qualitative, following Mamaghanian et al. [10], who established that radio transmission energy dominates embedded computation by ~100:1. Quantitative energy budgeting (mJ per 5 min window for ECG digitization, Pan–Tompkins processing, HRV computation, and LoRa packet transmission) requires hardware profiling on specific LPWA SoC platforms and is deferred to the hardware prototype phase. Sixth, the comparison with signal-level compression (Section 2.1) is based on published bit-rate figures; a direct empirical comparison of Mode C against compressed sensing [10] or deep-learning ECG codecs at matched bandwidth would more rigorously establish the trade-offs between waveform fidelity and bandwidth reduction, and is reserved for future work. Seventh, the RRI filtering criterion [300, 2000] ms may occasionally discard diagnostically relevant extreme intervals; sensitivity of results to threshold variation is acknowledged as a future analysis item. Eighth, replacing 32-bit with 16-bit feature encoding would halve the Mode C payload with negligible impact on classification accuracy; this is identified for future hardware implementations.
6. Conclusions
This study provides the first bit-level quantification of the ECG→RRI→HRV communication pipeline across heterogeneous PhysioNet databases [13] and the first network feasibility matrix mapping those volumes against LoRa [5], NB-IoT [7], LTE-M, and 5G NR. The Pan–Tompkins detector [19] and ESC/NASPE HRV standard [11] together define a three-mode architecture (Mode A/B/C) in which semantic compression (Mode C) achieves 99.98% bandwidth reduction (5300:1 ratio) with no waveform reconstruction at the receiver. Random Forest AF detection on LTAFDB achieves AUC = 0.93, exceeding the RRI-only baseline [16] and confirming that seven HRV features preserve clinically actionable diagnostic information. SDNN and LF/HF dominate feature importance, consistent with established AF autonomic physiology [11,12]. Future work will extend to multi-lead HRV feature sets, adaptive window durations for paroxysmal AF, and a hardware prototype (MAX30003 AFE + LoRa SX1276) for prospective over-the-air validation of the Mode C feasibility result.
Author Contributions
Conceptualization, N.M. and E.Y.; methodology, E.Y.; software, N.M.; formal analysis, N.M.; data curation, N.M.; writing—original draft preparation, E.Y.; writing—review and editing, E.Y.; supervision, E.Y. All authors have read and agreed to the published version of the manuscript.
Funding
This research was supported by the New Energy and Industrial Technology Development Organization (NEDO), Japan.
Data Availability Statement
All datasets are freely available from PhysioNet (https://physionet.org/): MIT-BIH Arrhythmia Database [8], Long-Term AF Database [14], and MIT-BIH Normal Sinus Rhythm Database. MIMIC-III requires CITI Program credentialing. Analysis code is available on request.
Conflicts of Interest
The authors declare no conflicts of interest.
Abbreviations
The following abbreviations are used in this manuscript:
| IoMT | Internet of Medical Things |
| ECG | Electrocardiogram |
| AF | Atrial Fibrillation |
| LPWA | Low-Power Wide-Area (network) |
| LoRa | Long Range (LPWA modulation technology) |
| NB-IoT | Narrowband Internet of Things |
| LTE-M | Long-Term Evolution for Machines |
| 5G NR | 5th Generation New Radio |
| ADC | Analog-to-Digital Converter |
| Fs | Sampling Frequency |
| B_adc | ADC Bit Resolution |
| RRI | R-R Interval |
| HRV | Heart Rate Variability |
| SDNN | Standard Deviation of NN Intervals |
| RMSSD | Root Mean Square of Successive Differences |
| pNN50 | Percentage of NN Intervals Differing by >50 ms |
| LF | Low-Frequency Power (0.04–0.15 Hz) |
| HF | High-Frequency Power (0.15–0.40 Hz) |
| LF/HF | Ratio of LF to HF Power |
| HRmean | Mean Heart Rate |
| MIT-BIH | MIT-BIH Arrhythmia Database |
| LTAFDB | Long-Term Atrial Fibrillation Database |
| NSR-DB | Normal Sinus Rhythm Database |
| MIMIC-III | Medical Information Mart for Intensive Care III |
| DFT | Discrete Fourier Transform |
| FFT | Fast Fourier Transform |
| LS | Lomb–Scargle (periodogram) |
| PPV | Positive Predictive Value |
| Se | Sensitivity |
| Sp | Specificity |
| AUC | Area Under the ROC Curve |
| RF | Random Forest |
| SVM | Support Vector Machine |
| MDI | Mean Decrease in Impurity (feature importance metric) |
| TP | True Positive |
| TN | True Negative |
| FP | False Positive |
| FN | False Negative |
| Twin | HRV Window Duration (300 s) |
| Nfeat | Number of HRV Features (7) |
| Bfeat | Bit Depth per Feature (32-bit float) |
References
- Nithyavani, G.; Naga Raja, G. A Comprehensive Survey on Security and Privacy Challenges in Internet of Medical Things Applications: Deep Learning and Machine Learning Solutions, Obstacles, and Future Directions. IEEE Access 2025, 13, 188955–188989. [Google Scholar] [CrossRef] [Scilit]
- Chugh, S.S.; Havmoeller, R.; Narayanan, K.; Singh, D.; Rienstra, M.; Benjamin, E.J.; Gillum, R.F.; Kim, Y.-H.; McAnulty, J.H.; Zheng, Z.-J.; et al. Worldwide Epidemiology of Atrial Fibrillation: A Global Burden of Disease 2010 Study. Circulation 2014, 129, 837–847. [Google Scholar] [CrossRef] [Scilit] [PubMed]
- Chung, W.-Y.; Lee, Y.-D.; Jung, S.-J. A wireless sensor network compatible wearable U-healthcare monitoring system using integrated ECG, accelerometer and SpO2. In Proceedings of the 30th Annual International Conference of the IEEE Engineering in Medicine and Biology Society (EMBS), Vancouver, BC, Canada, 20–24 August 2008. [Google Scholar]
- Raza, U.; Kulkarni, P.; Sooriyabandara, M. Low power wide area networks: An overview. IEEE Commun. Surv. Tutor. 2017, 19, 855–873. [Google Scholar] [CrossRef] [Scilit]
- Centenaro, M.; Vangelista, L.; Zanella, A.; Zorzi, M. Long-Range Communications in Unlicensed Bands: The Rising Stars in the IoT and Smart City Scenarios. IEEE Wirel. Commun. 2016, 23, 60–67. [Google Scholar] [CrossRef] [Scilit]
- Mekki, K.; Bajic, E.; Chaxel, F.; Meyer, F. A comparative study of LPWAN technologies for large-scale IoT deployment. ICT Express 2019, 5, 1–7. [Google Scholar] [CrossRef] [Scilit]
- Sinha, R.S.; Wei, Y.; Hwang, S.-H. A Survey on LPWA Technology: LoRa and NB-IoT. ICT Express 2017, 3, 14–21. [Google Scholar] [CrossRef] [Scilit]
- Moody, G.B.; Mark, R.G. The impact of the MIT-BIH arrhythmia database. IEEE Eng. Med. Biol. Mag. 2001, 20, 45–50. [Google Scholar] [CrossRef] [Scilit] [PubMed]
- Sayadi, O.; Shamsollahi, M.B. ECG denoising and compression using a modified extended Kalman filter structure. IEEE Trans. Biomed. Eng. 2008, 55, 2240–2248. [Google Scholar] [CrossRef] [Scilit] [PubMed]
- Mamaghanian, H.; Khaled, N.; Atienza, D.; Vandergheynst, P. Compressed sensing for real-time energy-efficient ECG compression on wireless body sensor nodes. IEEE Trans. Biomed. Eng. 2011, 58, 2456–2466. [Google Scholar] [CrossRef] [Scilit] [PubMed]
- Task Force of the European Society of Cardiology and the North American Society of Pacing and Electrophysiology. Heart rate variability: Standards of measurement, physiological interpretation, and clinical use. Circulation 1996, 93, 1043–1065. [Google Scholar] [CrossRef] [Scilit]
- Shaffer, F.; Ginsberg, J.P. An overview of heart rate variability metrics and norms. Front. Public Health 2017, 5, 258. [Google Scholar] [CrossRef] [Scilit] [PubMed]
- Goldberger, A.L.; Amaral, L.A.N.; Glass, L.; Hausdorff, J.M.; Ivanov, P.C.; Mark, R.G.; Mietus, J.E.; Moody, G.B.; Peng, C.-K.; Stanley, H.E. PhysioBank, PhysioToolkit, and PhysioNet: Components of a New Research Resource for Complex Physiologic Signals. Circulation 2000, 101, e215–e220. [Google Scholar] [CrossRef] [Scilit] [PubMed]
- Moody, G.B.; Mark, R.G. A new method for detecting atrial fibrillation using R-R intervals. Comput. Cardiol. 1983, 10, 227–230. [Google Scholar]
- Al-Fuqaha, A.; Guizani, M.; Mohammadi, M.; Aledhari, M.; Ayyash, M. Internet of Things: A survey on enabling technologies, protocols, and applications. IEEE Commun. Surv. Tutor. 2015, 17, 2347–2376. [Google Scholar] [CrossRef] [Scilit]
- Liang, Y.; Yin, S.; Tang, Q.; Zheng, Z.; Elgendi, M.; Chen, Z. Deep Learning Algorithm Classifies Heartbeat Events Based on Electrocardiogram Signals. Front. Physiol. 2020, 11, 569050. [Google Scholar] [CrossRef] [Scilit] [PubMed]
- Tateno, K.; Glass, L. Automatic detection of atrial fibrillation using the coefficient of variation and density histograms of RR and ΔRR intervals. Med. Biol. Eng. Comput. 2001, 39, 664–671. [Google Scholar] [CrossRef] [Scilit] [PubMed]
- Clifford, G.D.; Liu, C.; Moody, B.; Li-wei, H.L.; Silva, I.; Li, Q.; Johnson, A.E.W.; Mark, R.G. AF classification from a short single lead ECG recording: The PhysioNet/Computing in Cardiology Challenge 2017. Comput. Cardiol. 2017, 44, 1–4. [Google Scholar] [CrossRef] [Scilit] [PubMed]
- Pan, J.; Tompkins, W.J. A real-time QRS detection algorithm. IEEE Trans. Biomed. Eng. 1985, BME-32, 230–236. [Google Scholar] [CrossRef] [Scilit] [PubMed]
- Satija, U.; Ramkumar, B.; Manikandan, M.S. A review of signal processing techniques for electrocardiogram signal quality assessment. IEEE Rev. Biomed. Eng. 2018, 11, 36–52. [Google Scholar] [CrossRef] [Scilit] [PubMed]
- Gündüz, D.; Qin, Z.; Aguerri, I.E.; Dhillon, H.S.; Yang, Z.; Yener, A.; Wong, K.-K.; Chae, C.-B. Beyond Transmitting Bits: Context, Semantics, and Task-Oriented Communications. IEEE J. Sel. Areas Commun. 2023, 41, 5–41. [Google Scholar] [CrossRef] [Scilit]
- Xie, H.; Qin, Z.; Li, G.Y.; Juang, B.-H. Deep Learning Enabled Semantic Communication Systems. IEEE Trans. Signal Process. 2021, 69, 2663–2675. [Google Scholar] [CrossRef] [Scilit]
- Burrello, A.; Benini, L.; Farella, E.; Schindler, K.; Benatti, S. DORY: Automatic End-to-End Method for Deploying Real-World DNNs on Low-Cost IoT Devices. IEEE Trans. Comput. 2021, 70, 1206–1219. [Google Scholar]
- Lan, X.; Zhang, X.; Lim, K.H.; Wu, Q. CompressECG: Exploring the Limits of ECG Compression with Deep Neural Networks. Comput. Biol. Med. 2023, 157, 106689. [Google Scholar] [CrossRef] [Scilit] [PubMed]
- Hannun, A.Y.; Rajpurkar, P.; Haghpanahi, M.; Tison, G.H.; Bourn, C.; Turakhia, M.P.; Ng, A.Y. Cardiologist-level arrhythmia detection and classification in ambulatory electrocardiograms using a deep neural network. Nat. Med. 2019, 25, 65–69. [Google Scholar] [CrossRef] [Scilit] [PubMed]
- Teijeiro, T.; García, C.A.; Castro, D.; Félix, P. Arrhythmia classification from the abductive interpretation of short single-lead ECG records. Comput. Cardiol. 2017, 44, 1–4. [Google Scholar] [CrossRef] [Scilit]
- Xia, Y.; Wulan, N.; Wang, K.; Zhang, H. Detecting atrial fibrillation by deep convolutional neural networks. Comput. Biol. Med. 2018, 93, 84–92. [Google Scholar] [CrossRef] [Scilit]
- Billman, G.E. The LF/HF ratio does not accurately measure cardiac sympatho-vagal balance. Front. Physiol. 2013, 4, 26. [Google Scholar] [CrossRef] [Scilit] [PubMed]
- Umetani, K.; Singer, D.H.; McCraty, R.; Atkinson, M. Twenty-four hour time domain heart rate variability and heart rate: Relations to age and gender. J. Am. Coll. Cardiol. 1998, 31, 393–401. [Google Scholar] [CrossRef] [Scilit] [PubMed]

Disclaimer/Publisher’s Note: The statements, opinions and data contained in all publications are solely those of the individual author(s) and contributor(s) and not of MDPI and/or the editor(s). MDPI and/or the editor(s) disclaim responsibility for any injury to people or property resulting from any ideas, methods, instructions or products referred to in the content. |
© 2026 by the authors. Licensee MDPI, Basel, Switzerland. This article is an open access article distributed under the terms and conditions of the Creative Commons Attribution (CC BY) license.