


Abstract
Driver emotion recognition is a crucial method for reducing traffic accidents. Most existing research focuses on experienced drivers as the primary research subjects, overlooking novice drivers, who are inexperienced in driving. However, novice drivers can easily lose control of their emotions due to the high mental load during driving, which can lead to serious traffic accidents. Therefore, to recognize the emotions of novice drivers for timely warnings, we propose an emotion recognition model based on multimodal information. The model consists of a facial feature extraction module, an eye movement feature extraction module and a classifier. The facial feature extraction module uses the ViT-B/16 to extract the facial features of novice drivers. The eye movement feature extraction module is a hybrid network containing Bi-LSTM and Transformer. It extracts eye movement features of novice drivers. Facial features and eye movement features are fused and fed to the classifier. The classifier can output the five major emotion categories of surprise, anger, calm, happy, and other for novice drivers. The experimental results demonstrate that our model accurately recognizes the emotions of novice drivers with an accuracy of 98.72%, surpassing that of other models.
1. Introduction
Emotions play an indispensable role in humans’ daily lives, and consequently, research on emotion recognition has been widely applied in many fields. In the field of clinical medicine, it helps doctors to diagnose and treat emotional disorders such as mania [1], depression, and autism [2]. In education, it helps teachers better understand students’ emotional states and learning processes [3], thereby improving teaching effectiveness. In business, it helps companies and brands attract consumers’ attention [4] and promote economic development. In transportation, it helps monitor drivers’ attention and emotional state [5] and reduces traffic accidents. Wang et al. [6] illustrated how emotions affect driving behavior. They explored the effects of emotional states and cognitive load on driving behavior by combining driving tasks with eye-tracking experiments. They found that depressive emotions negatively affect driving, while high cognitive load impairs the ability to handle multiple tasks. Therefore, emotion recognition technology is of great significance in driving safety.
With ongoing research on emotion recognition technology in the field of automated driving, researchers have focused on the impact of anger, anxiety [7], and fatigue on experienced drivers. For example, Akshay et al. [8] explored driver fatigue using eye-tracking technology. Among numerous studies on emotion recognition in driving, driving age is a critical factor affecting driving behavior. Wang et al. [6] focused on novice drivers, who are about to obtain their driver’s licenses or have just gotten them. These drivers have limited risk perception and are emotionally vulnerable, and setbacks in their personal growth are more likely to trigger emotional issues. Hafetz et al. [9] found, based on statistics, that young drivers account for a high proportion of serious motor vehicle accidents worldwide, confirming that novice drivers are highly prone to traffic accidents. According to the U.S. FMCSA’s 2023 statistics [10], novice drivers aged 18 to 25 accounted for 31% of new licenses issued, yet their accident fatality rate was 2.7 times that of mature drivers aged 26 to 65. Therefore, shifting the focus of research from the average driver to the novice driver has significant implications for preventing traffic safety crashes.
Current signals used for emotion recognition include physiological signals such as Electroencephalogram (EEG) monitoring, Electromyography (EMG) recordings, Heart Rate Variability (HRV) analysis, Electrodermal Activity (EDA) measurements, and eye tracking (Electrooculogram, EOG), as well as non-physiological signals such as text, speech, and facial expressions [11]. Researchers have found through a review that EEG, ECG (Electrocardiography), EDA, and eye tracking are the most commonly used signals for emotion detection [12]. EEG signals are widely used in emotion recognition due to their advantages in terms of resolution, cost, and reliability. However, in autonomous driving scenarios, they have limitations, including difficulties in data collection and the risk that sensing devices may interfere with driving operations. For drivers, wearing such sensors may affect their driving and daily activities. Eye tracking records the characteristics of a person’s eye movements as they process visual information. As a non-invasive device, the on-screen eye tracker does not interfere with drivers’ regular operations, making it suitable for exploring emotional changes during driving. With the continuous development of eye-tracking technology, various eye movement features—including pupil diameter, eye-beat trajectory, and gaze duration—have been shown to correlate with emotions [13].
In recent years, multimodal emotion recognition has emerged as a research hotspot, with many studies combining facial expressions and physiological signals to improve recognition performance. However, most existing multimodal frameworks either concatenate features from different modalities at the feature or decision level, or stack popular deep learning models such as Vision Transformer (ViT), Bi-Directional Long Short-Term Memory (Bi-LSTM), and Transformer encoders without targeted optimization, lacking sufficient methodological innovation. Gated weighted fusion is an adaptive fusion strategy for multimodal features. It has also been widely used in autonomous driving and emotion recognition recently [14]. Moreover, few existing studies focus on the specific scenario of novice driver emotion recognition. They rarely tailor their models to the unique emotional characteristics of novice drivers (e.g., emotional vulnerability and sudden emotional fluctuations triggered by unexpected driving events) or their specific modal data (eye-tracking data and facial expression images, rather than general physiological signals).
To address these limitations, this paper proposes an emotion recognition method for novice drivers that combines eye movement signals and facial features, with three distinct methodological innovations beyond the simple combination of ViT, Bi-LSTM, and Transformer models. First, we design a novel gated weighted fusion (GWF) module as the core of multimodal integration, which is not a standard component in existing model combinations. This module dynamically assigns adaptive weights to the extracted facial and eye movement features based on their real-time contributions to emotion recognition, effectively addressing the information redundancy or loss caused by fixed-weight fusion in existing methods and enhancing the coordination between the two modalities. Second, we optimize the structure and application scenario of each base model rather than simply combining them. For facial feature extraction, we adopt ViT-B/16 and fine-tune its input layer and attention mechanism to adapt to 224 × 224-sized facial expression images of novice drivers, focusing on key facial regions (e.g., eyes, mouth) closely related to emotional changes in driving scenarios. For eye movement feature extraction, we integrate a Bi-LSTM with a Transformer encoder, where the Bi-LSTM captures the temporal sequence characteristics of 500 × 17-dimensional eye-tracking data (e.g., gaze points and pupil diameter), and the Transformer encoder reduces the number of attention heads from 12 to 8, which is used to capture long-range dependencies in continuous eye-movement signals. Third, our entire multimodal framework is specifically tailored for novice driver emotion recognition, with its four-module structure (facial feature extraction, eye movement feature extraction, GWF module, and multi-layer perceptron (MLP) classifier) designed to address scenario-specific needs: the eye movement feature extraction module focuses on the temporal dynamics of eye signals critical for reflecting real-time emotional changes in driving, the GWF module adapts to the complementary nature of facial and eye movement features, and the MLP classifier is optimized to output specific emotional states of novice drivers closely related to driving safety.
To implement this method, we first investigated novice drivers’ emotional responses to driving scenarios and life audio using a questionnaire, selecting the most arousing “scene-audio” combination as the emotional stimulus material. In the simulated driving eye-movement experiment, we simultaneously collected eye-movement trajectories and facial expressions to construct a multimodal emotion dataset for novice drivers. Based on this dataset, a hybrid deep neural network is constructed by organically fusing ViT-B/16, Bi-LSTM, Transformer encoder, and the GWF module, enabling the simultaneous processing of image and temporal features as well as global dependencies. Finally, the model achieves accurate classification of five emotion categories: surprise, anger, calmness, happiness, and other emotions.
2. Related Work
2.1. Eye Tracking Emotion Recognition
The application of eye-tracking technology in emotion recognition is gaining increasing attention. Emotional states are inferred from subjects’ eye movement data (e.g., gaze point, pupil diameter, eye movement velocity). As a non-invasive means of detecting emotion, it has received attention for its ability to reflect visual attention and cognitive load. Romeo et al. [15] compared the effectiveness of static pictures and moving videos in eliciting emotional responses, noting that moving videos are more effective at eliciting genuine emotions than static pictures. Tarnowski et al. [16] used twenty-one movie clips to evoke emotions from subjects and calculated 18 features related to eye movements and pupil diameters. Finally, they used a support vector machine (SVM) classifier and leave-one-out validation to classify three emotions, achieving a maximum accuracy of 80%. Lee et al. [17] used an eye-tracking device to collect the pupil data when subjects watched a video with a specific emotion. They extracted 16 pupil features using four classification methods to verify the relationship between pupil dilation and emotion. Partala et al. [18] investigated changes in pupil size in response to auditory stimuli and found that pupil diameter was correlated with emotional pleasantness and arousal. Chen et al. [19] used FECNN to extract features and long short-term memory (LSTM) as a classifier to classify eye movements and photoelectric volumetric pulse (PPG) for four emotions, with an average recognition accuracy of 84.68%.
Compared to traditional physiological signals (e.g., EEG, heart rate), eye tracking offers the advantages of low cost and simplicity of operation, but still faces challenges in emotion recognition applications. For instance, eye tracking is susceptible to interference from factors such as individual differences and lighting conditions. The distinguishing characteristics of eye movements associated with different emotions are relatively weak, increasing the likelihood of misjudgments.
2.2. Facial Expression Emotion Recognition
Facial expression is the most intuitive external manifestation of emotion and can truly reflect an individual’s internal emotional state. In recent years, deep learning algorithms have made significant breakthroughs in various fields. Many researchers have applied deep learning to facial expression recognition. Said et al. [20] proposed a face-sensitive convolutional neural network (FS-CNN) for human emotion recognition, achieving an average accuracy of about 95% on the UMD Faces dataset. Savchenko et al. [21] used a single-branch convolutional neural network (CNN) to extract frame-level features, followed by an LSTM network, to classify three emotions—sleepy, focused, and confused—in an online classroom scenario. Zhang et al. [22] proposed a multi-visual emotion recognition method by capturing facial expressions, PPG signals, and eye movement states from videos. Yang et al. [23] utilized a deep belief network (DBN) to categorize three types of emotions in deaf individuals based on facial expressions and electroencephalography. Tsalamlal et al. [24] combined facial expression and touch to assess emotional valence. Wu et al. [25] combined facial expressions and speech to recognize dynamic emotions, proposing a convolutional neural network based on a two-stage fuzzy fusion to integrate facial expressions and speech modalities.
Facial expressions are among the most intuitive and accessible external cues of human emotions. However, they are characterized by subjectivity and camouflage. Driving is a highly dynamic, multi-task, parallel, and complex behavior, and a single modality is often difficult to completely portray the driver’s emotional state. Facial expressions may contain false expressions that are difficult to distinguish. Therefore, we propose a hybrid, structured driver emotion recognition model that combines two modalities: eye tracking and facial expressions. The model effectively compensates for the limitations of single-modality recognition, thereby improving emotion recognition accuracy in complex driving scenarios.
3. Methods
3.1. Model Architecture
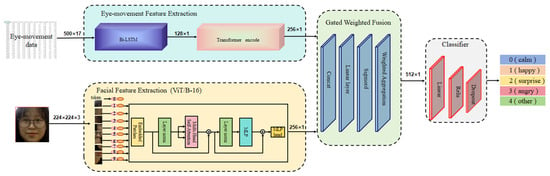
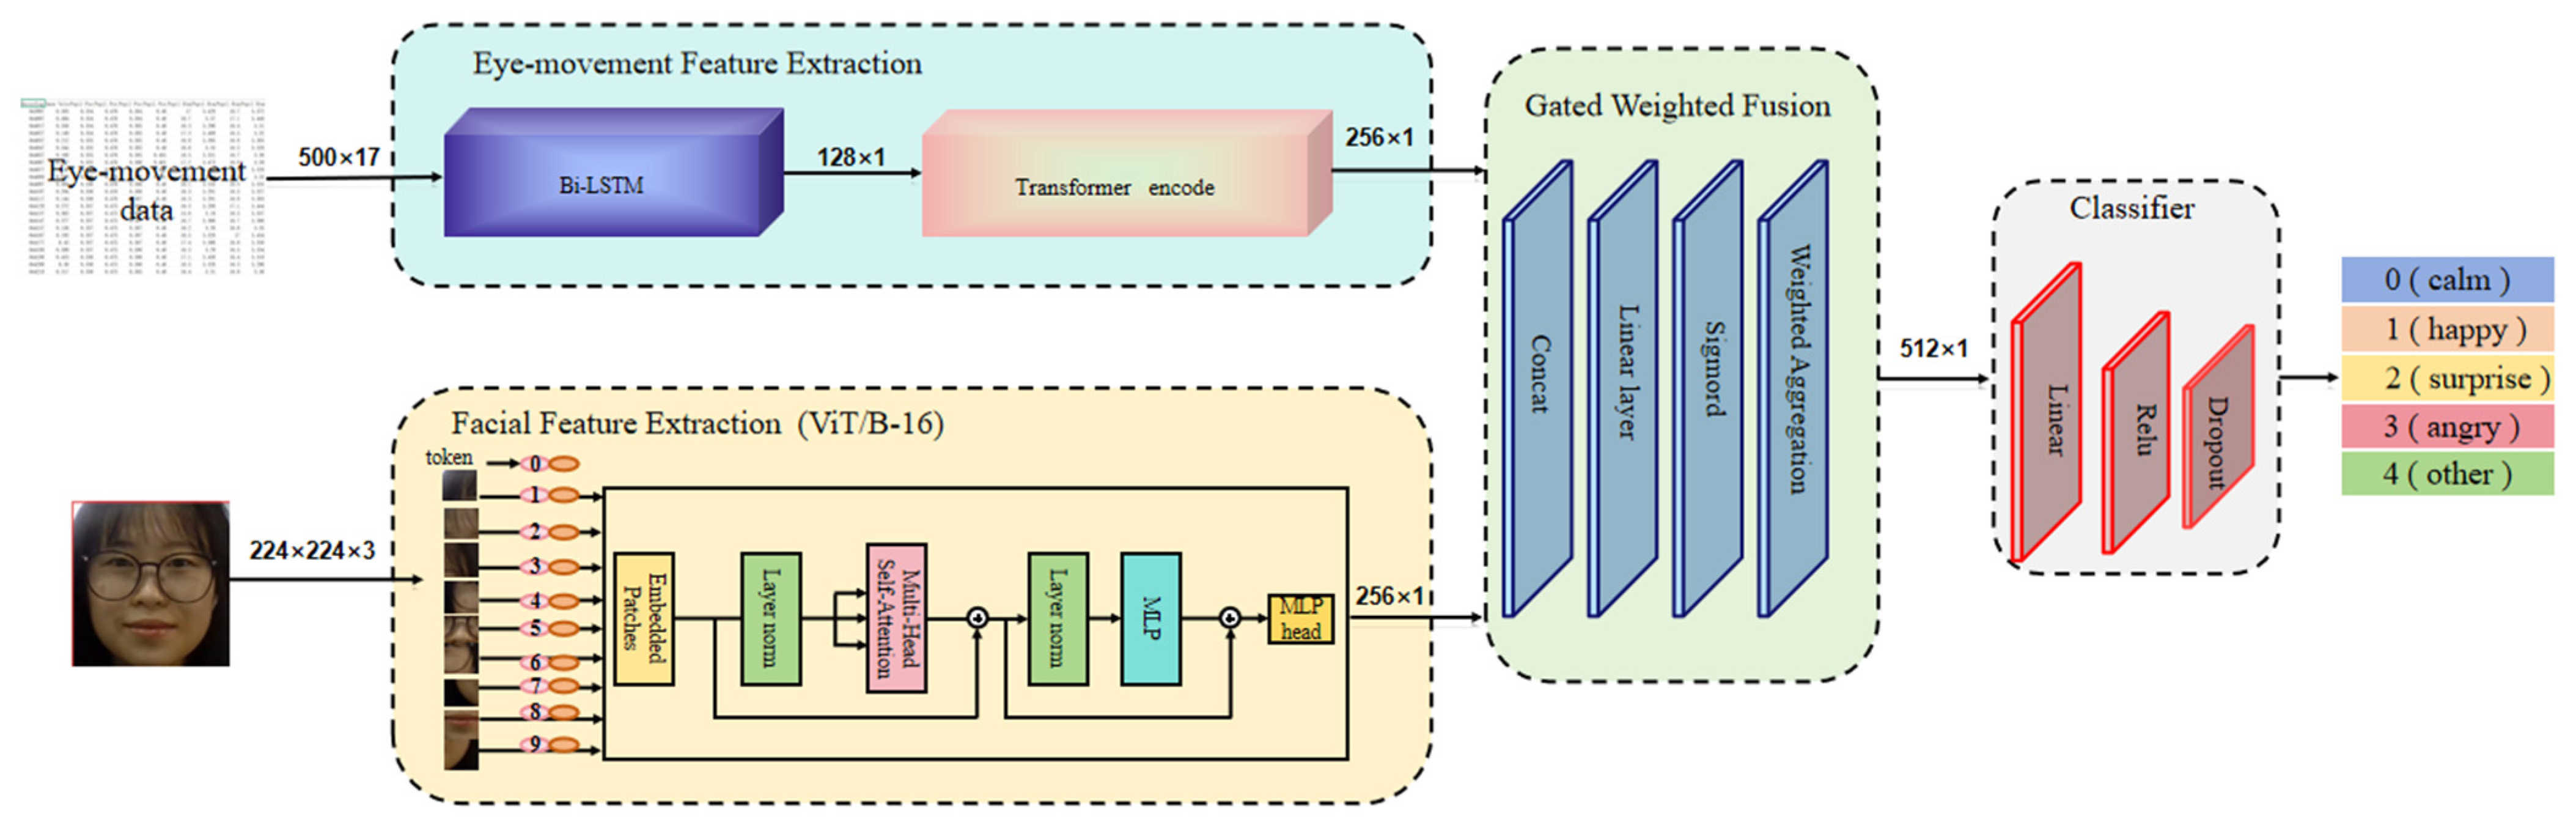
The multimodal emotion recognition model for novice drivers constructed in this paper is shown in Figure 1. This model comprises four modules: facial feature extraction, eye movement feature extraction, gated weighted fusion (GWF), and a classifier. Specifically, the facial feature extraction module takes 224 × 224-sized facial expression images of novice drivers as input, and its network employs a ViT-B/16. The eye movement feature extraction module receives eye-tracking data (e.g., gaze points, pupil diameter) with a 500 × 17 dimension and employs a Bi-LSTM network combined with a Transformer encoder. The extracted facial and eye movement features are integrated into a set of multimodal emotional features via the GWF module. The classifier uses a multi-layer perceptron (MLP) architecture. Multimodal emotional features are fed into it, which outputs the current emotional state of novice drivers.
Figure 1.
Multimodal emotion recognition model. The numbers (e.g., 500 × 17, 224 × 224 × 3, 256 × 1, 512 × 1) denote the dimensions of the input/output feature vectors, and 0–4 denote the class labels corresponding to the five emotion categories (calm, happy, surprise, angry, and other, respectively).
3.2. Facial Feature Extraction Network
Facial features of novice drivers are extracted using ViT-B/16. Specifically, ViT-B/16 effectively captures image-level dependencies via its self-attention mechanism, overcoming the limitations of traditional CNNs’ local receptive fields and providing stronger global modeling and feature extraction. Additionally, ViT-B/16 exhibits excellent generalization performance after pre-training on large-scale datasets.
The core mechanism of ViT-B/16 involves segmenting the image into fixed-size blocks (patches) and inputting these blocks as a sequence into the Transformer encoder. The specific process is as follows: first, the input image is partitioned into patches of size 16 × 16. Assuming that the size of the input image is H × W × C, the number of patches is
where = 16 is the size of the patch.
Then, each patch is flattened to a one-dimensional vector and mapped to a 768-dimensional feature space by a linear layer. Assuming that the flattened vector of the -th patch is , the feature representation after linear mapping is
where Wpatch∈ R768×(P2×C) is the weight matrix of the linear layer and bpatch ∈ R768 is the bias term.
To preserve the spatial information of the image, each patch is assigned a position embedding, a trainable parameter of shape [N, 768]. The formula for position embedding is
where Epos ∈ RN,768 is the position embedding matrix and Epos,i is the position embedding of the ith patch.
In addition, a special classification token with the shape of [1, 768] is added at the beginning of the patch sequence, which is dedicated to the classification task. The initial value of the classification token is
where Ecls ∈ R1,768 is the embedding of the classification token.
The classification token and the patch sequence are spliced together to form the final input sequence:
Subsequently, the spliced sequence is fed into a multi-layer Transformer encoder to extract global features and contextual information. The core of the Transformer encoder is the self-attention mechanism, which is formulated as follows:
where Q, K and V are the query, key and value matrices respectively and is the dimension of the key vector.
The multi-head attention mechanism divides the input features into multiple heads, and each head computes the attention independently and then stitches the results together with the following formula:
where headi = Attention(QWi(Q), KWi(K), VWi(V)), h is the number of attention heads and W is the output projection matrix.
After multi-layer Transformer encoding, the output features are
Finally, the classification Token is extracted from the output of the encoder to obtain a 768-dimensional feature vector, where Zoutput,0 is the output feature of the classification token.
3.3. Eye Movement Information Extraction Network
The eye movement features of novice drivers are extracted using a Bi-LSTM+Transformer encoder. Bi-LSTM can simultaneously encode sequences in both forward and reverse directions, which helps address the gradient vanishing problem in traditional RNNs. Through a gating mechanism, it retains long-term information, making it well-suited for modeling time-series data such as eye-movement signals.
The temporal dependencies are captured using a Bi-LSTM network with 128 hidden units and a bi-directional post-output dimension of 256. The update formula for the LSTM is as follows:
where Xt is the input feature at time step t, ht is the hidden state at time step t, ct is the cell state at time step t, σ is the Sigmoid activation function, and ⊙ denotes the element-by-element multiplication.
For the Bi-LSTM, the final output features are
where hforward and hbackward are the hidden states of the forward and backward LSTM, respectively, both of dimension 128.
The Transformer encoder can directly model dependencies at any position in the sequence, with strong global information capture capabilities. Multi-head attention can learn features across multiple subspaces, enhancing the model’s representational power. The Transformer encoding layer is configured with 8 attention heads per layer, a model dimension of 256, a feed-forward network dimension of 512, and a dropout rate of 0.1. The core of the Transformer encoder remains the self-attention mechanism.
After two layers of Transformer encoding, the output features are
where Xinput is the input feature matrix.
3.4. Gated Weighted Fusion Module
To achieve adaptive aggregation of multimodal features and suppress interference from redundant information, this paper designs a gated weighted fusion module that dynamically assigns weights to the outputs of multiple branches, including eye movement and facial expression features.
Let the inputs be two feature vectors and . First, the two features are concatenated along the channel dimension to obtain the fused feature . The gating weight g is generated through a single fully connected layer and a Sigmoid activation function, calculated as
where is the learnable weight matrix, is the bias term, and is the Sigmoid function, with the output weight range .
The final fused feature is obtained by weighted summation:
where ⊙ denotes element-wise multiplication. The gated module can be trained end-to-end, automatically learning the importance of different modal features, enhancing effective information, weakening noise interference, and improving the robustness of multimodal feature representation.
3.5. Classifier
The classifier is constructed from an MLP. An MLP extracts higher-order features layer by layer via a linear transformation followed by a nonlinear activation function. It uses a softmax function at the output layer to compute the probability of each category, and selects the category with the highest probability as the classification result. The MLP computation process is as follows.
The first step is linear transformation, and the formula is as follows:
where is the weight matrix of the l-th layer, is the activation output of the (−1)-th layer, and is the bias vector of the l-th layer.
The second step is the nonlinear activation of the l-th layer, and the formula is
where is the activated output of the l-th layer and denotes the nonlinear activation function.
The third step is the Softmax normalization of the output layer, which is used for multi-class probability output. The formula is as follows:
Here, is the predicted probability of the k-th class, is the linear output of the k-th neuron in the L-th output layer, L is the total number of network layers, and C is the number of categories.
4. Experiment and Data Preprocessing
4.1. Questionnaire Survey
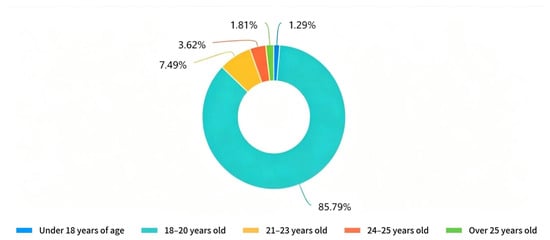
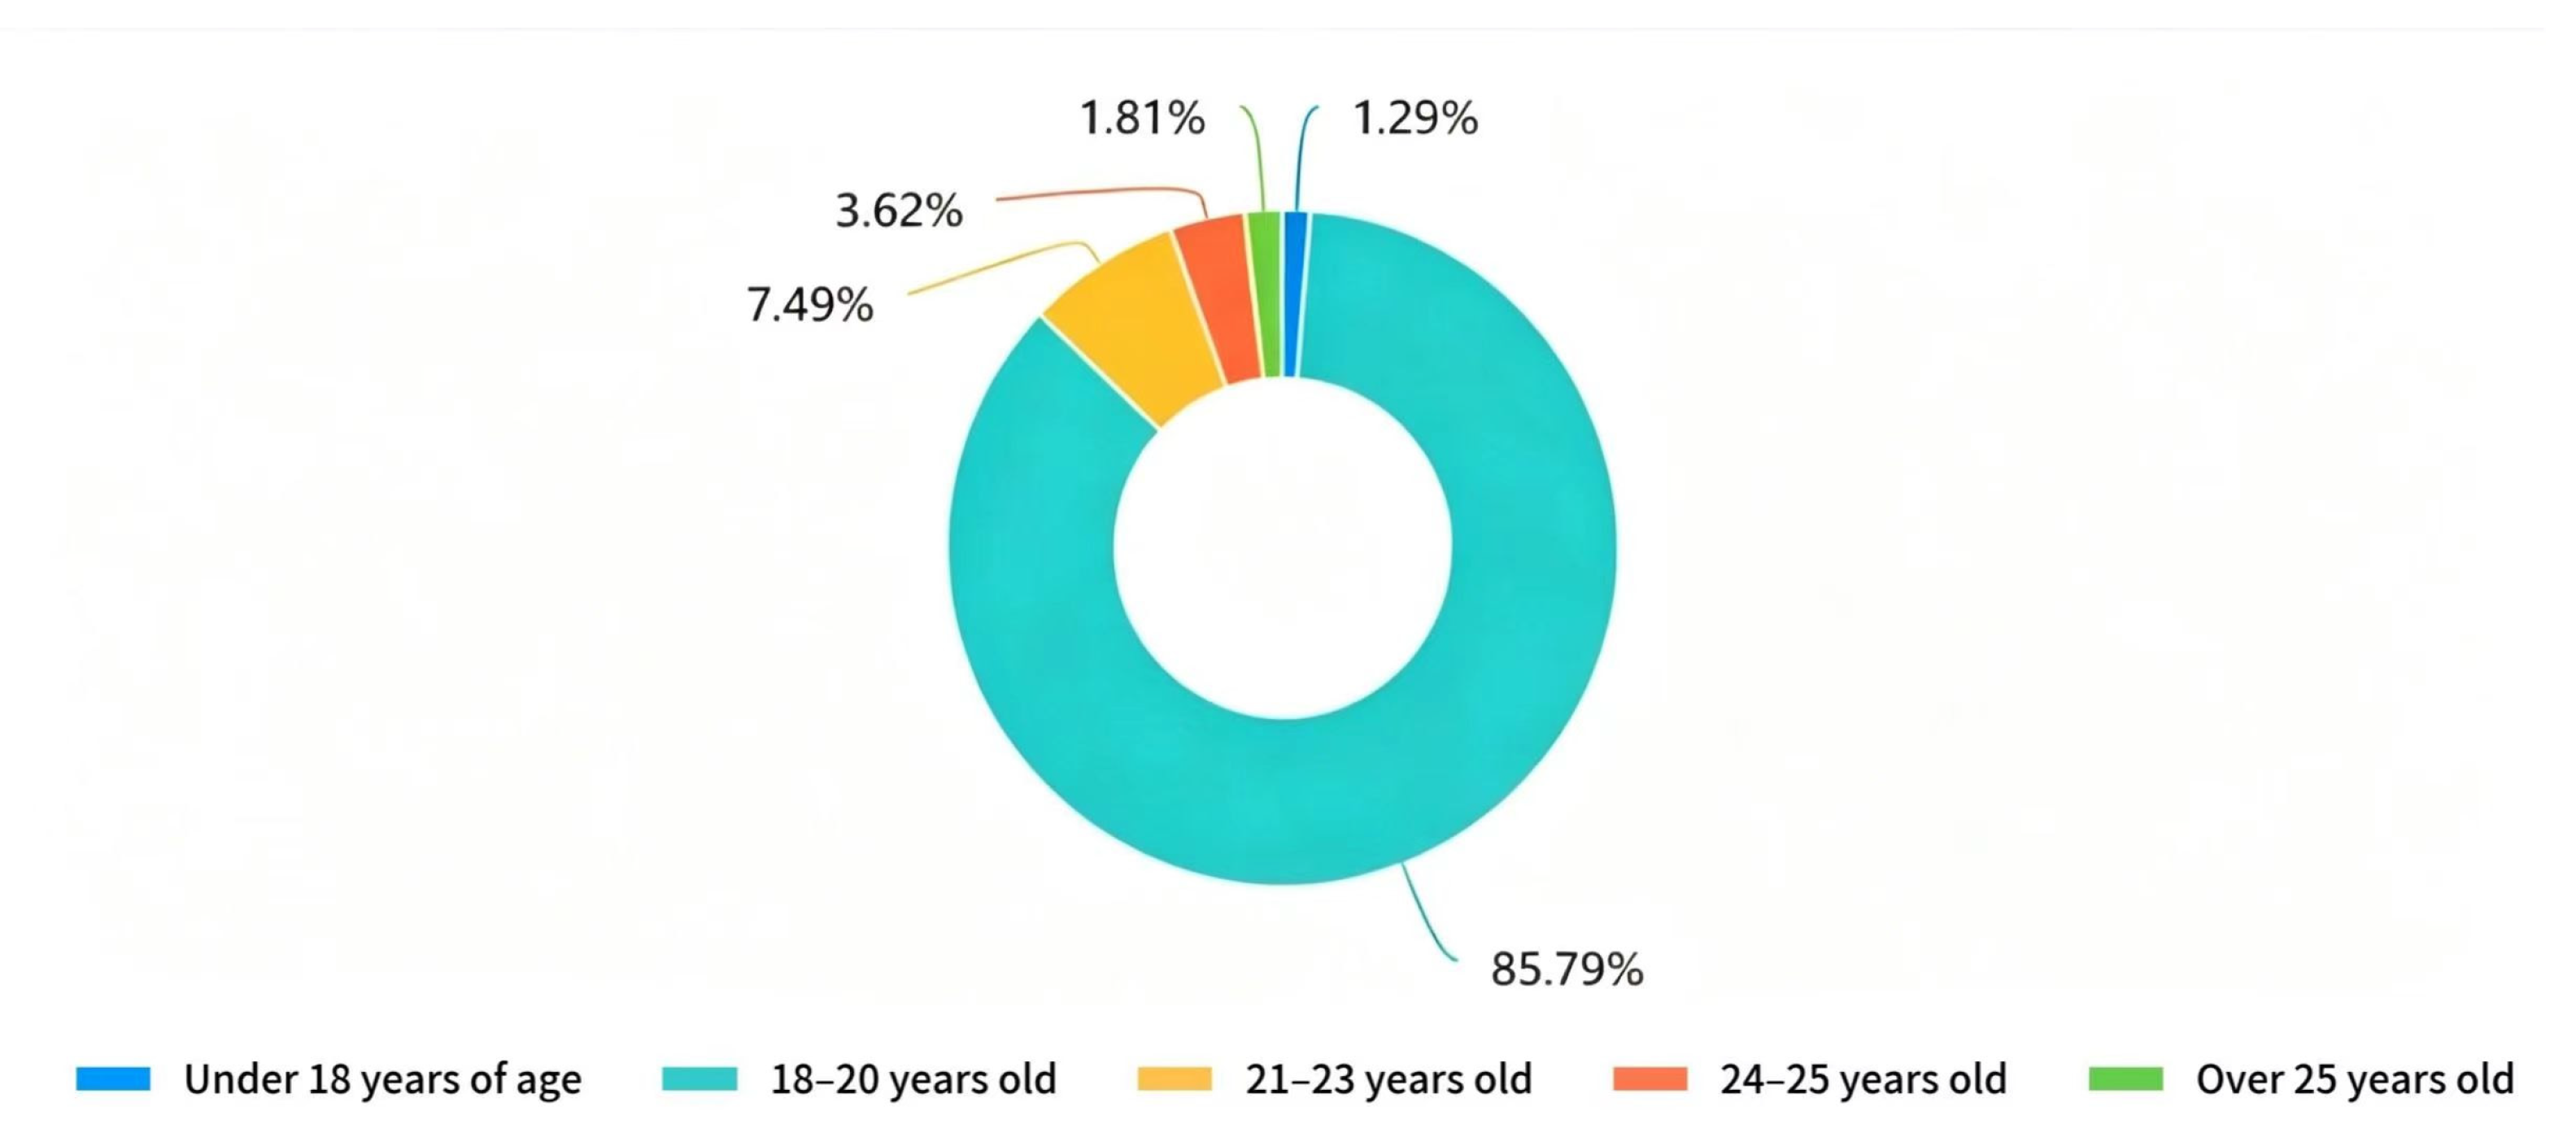
To identify typical driving scenarios that elicit emotional responses in novice drivers, this paper develops a questionnaire examining the emotional influences on novice drivers across various traffic scenarios. The questionnaire results can reflect participants’ emotional experiences in specific driving situations. Emotional experiences include surprise, anger, calmness, happiness, and others. In this experiment, we collected a total of 387 questionnaire results. We had 197 male participants and 190 female participants. We show the age distribution of the participants in Figure 2.
Figure 2.
Age distribution of questionnaires.
To present the results more clearly, we represented the 17 driving sound effects in the questionnaire survey using codenames S1 to S17. The table of sound effects and their codenames is shown in Table 1.
Table 1.
Sound effect-code correspondence table.
The chi-square test is a statistical method used to test independence or goodness-of-fit between categorical variables. The frequency of each category in the actual data is called the observed frequency. The collected questionnaire data were organized into a contingency table to display the cross-tabulations of the two categorical variables (sound effects and emotions). To implement the chi-square test, we first calculated the expected frequency of each cell. The formula for calculating the expected frequency is
We obtained the complete table of expected frequency. To obtain the p-value, we also needed to calculate the chi-square statistic, which measures the difference between the observed and the expected frequencies. The calculation formula is
We calculated the chi-square value for each cell using the observed frequency Oij and the expected frequency Eij. Then, we summed the chi-square values of all cells to obtain the chi-square statistic.
Finally, we obtained the p-value, which is the probability of the chi-square statistic under the chi-square distribution. The smaller the p-value, the more significant the difference between the observed and expected frequencies.
The chi-square test results of the questionnaire survey are shown in Table 2. The questionnaire’s chi-square test results (χ2 = 1310.791, p < 0.001) indicate highly significant differences in the distribution of the 17 sound effects among the five emotional categories. The observed frequencies are presented in the cross-cells between sound effects and emotions. Additionally, the chi-square test results indicate that sudden impacts and conflict-related sounds are most likely to trigger negative, highly arousing emotions. In contrast, upbeat music and daily background sounds can effectively maintain or restore calmness.
Table 2.
Results of the chi-square test of the questionnaire.
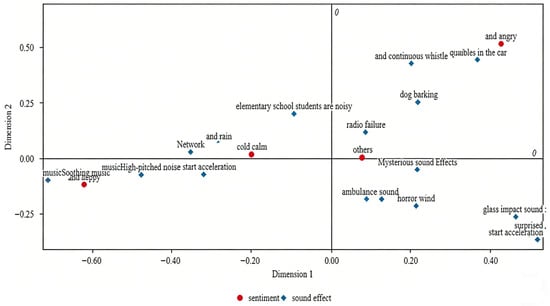
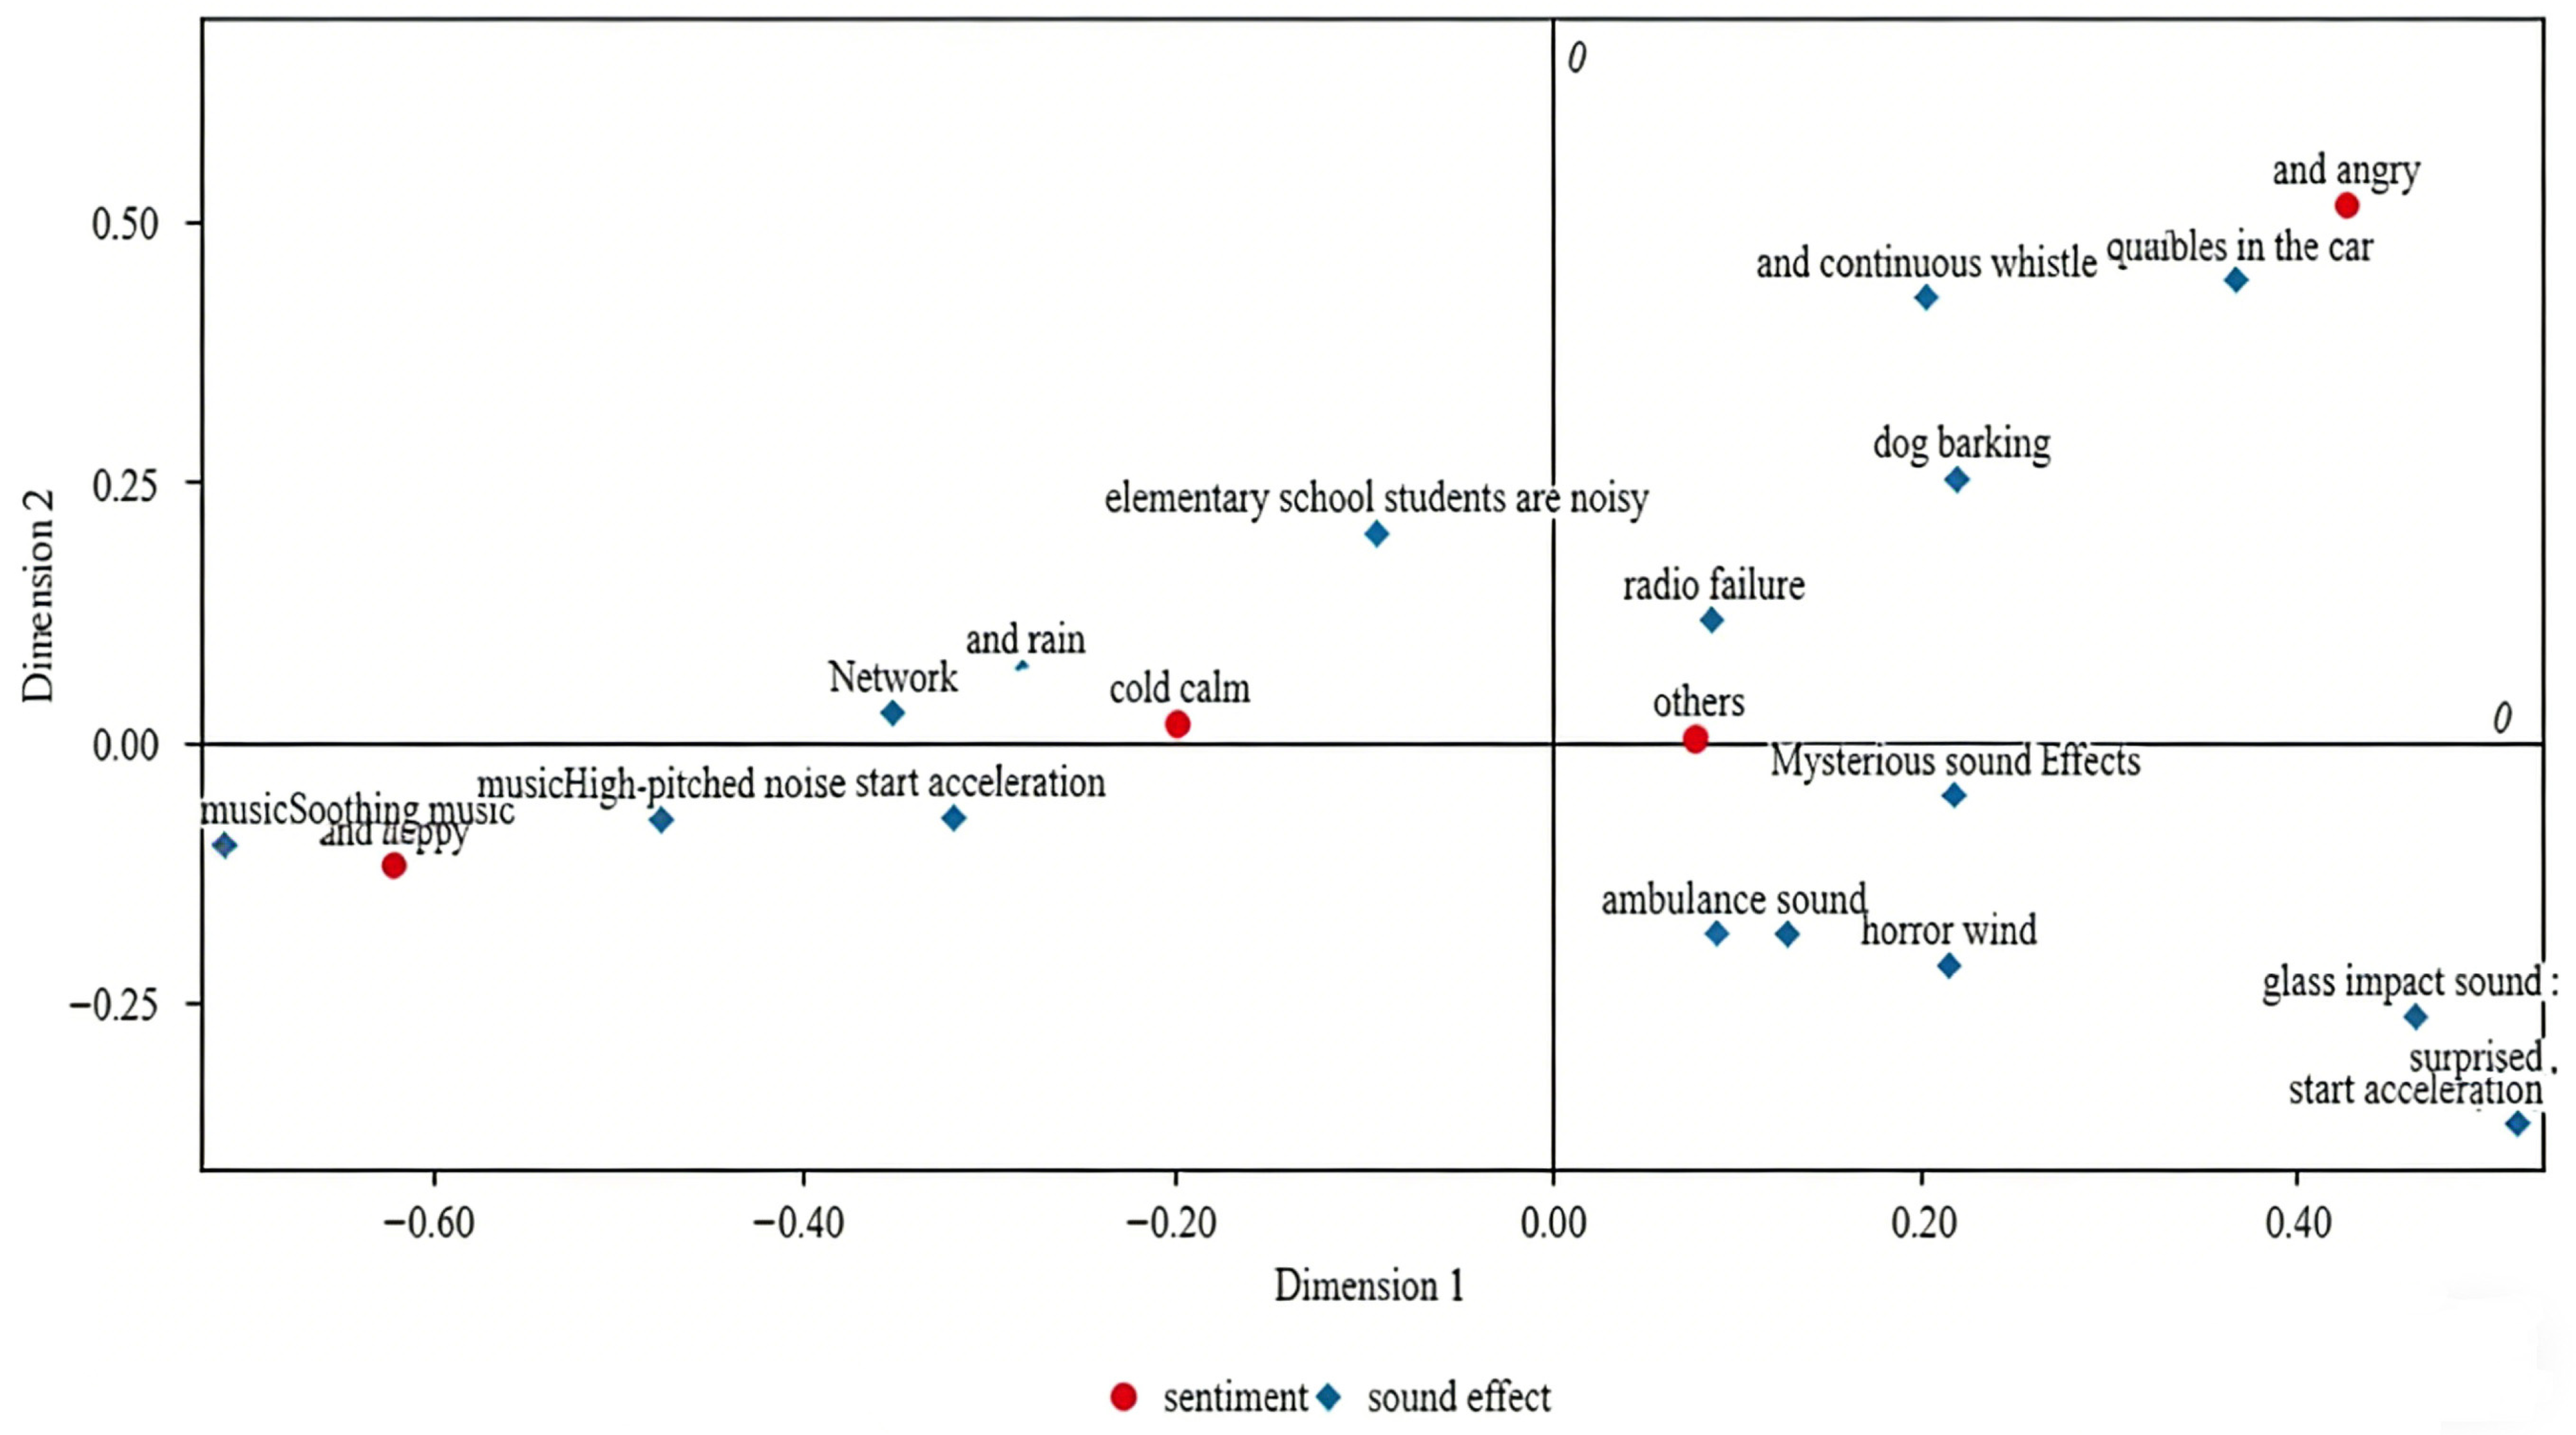
The p-value < 0.05 from the chi-square test indicates a significant association between mood and sound effects, which can be further analyzed using correspondence analysis (CA). Conducting CA can provide a more precise measurement of the association between sound effects and emotions. Through correspondence analysis, we obtained two dimensions with a cumulative interpretation rate exceeding 80%, which were used to generate the correspondence analysis plot of sound effects and emotions, as shown in Figure 3.
Figure 3.
Emotion–sound effect correspondence diagram.
In Figure 3, it can be observed that continuous honking, quarrels, and dog barking are clustered in the upper-right corner, near the emotion of anger. Sudden high-risk sound effects, such as glass impact and vehicle pounding, trigger surprise in the lower-right region. This visualization confirms the significant effect of sound effect types on novice drivers’ emotional arousal. It provides an intuitive basis for stimulus selection in subsequent multimodal emotion recognition experiments.
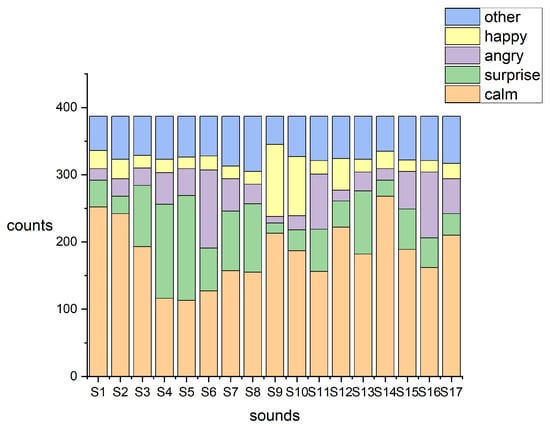
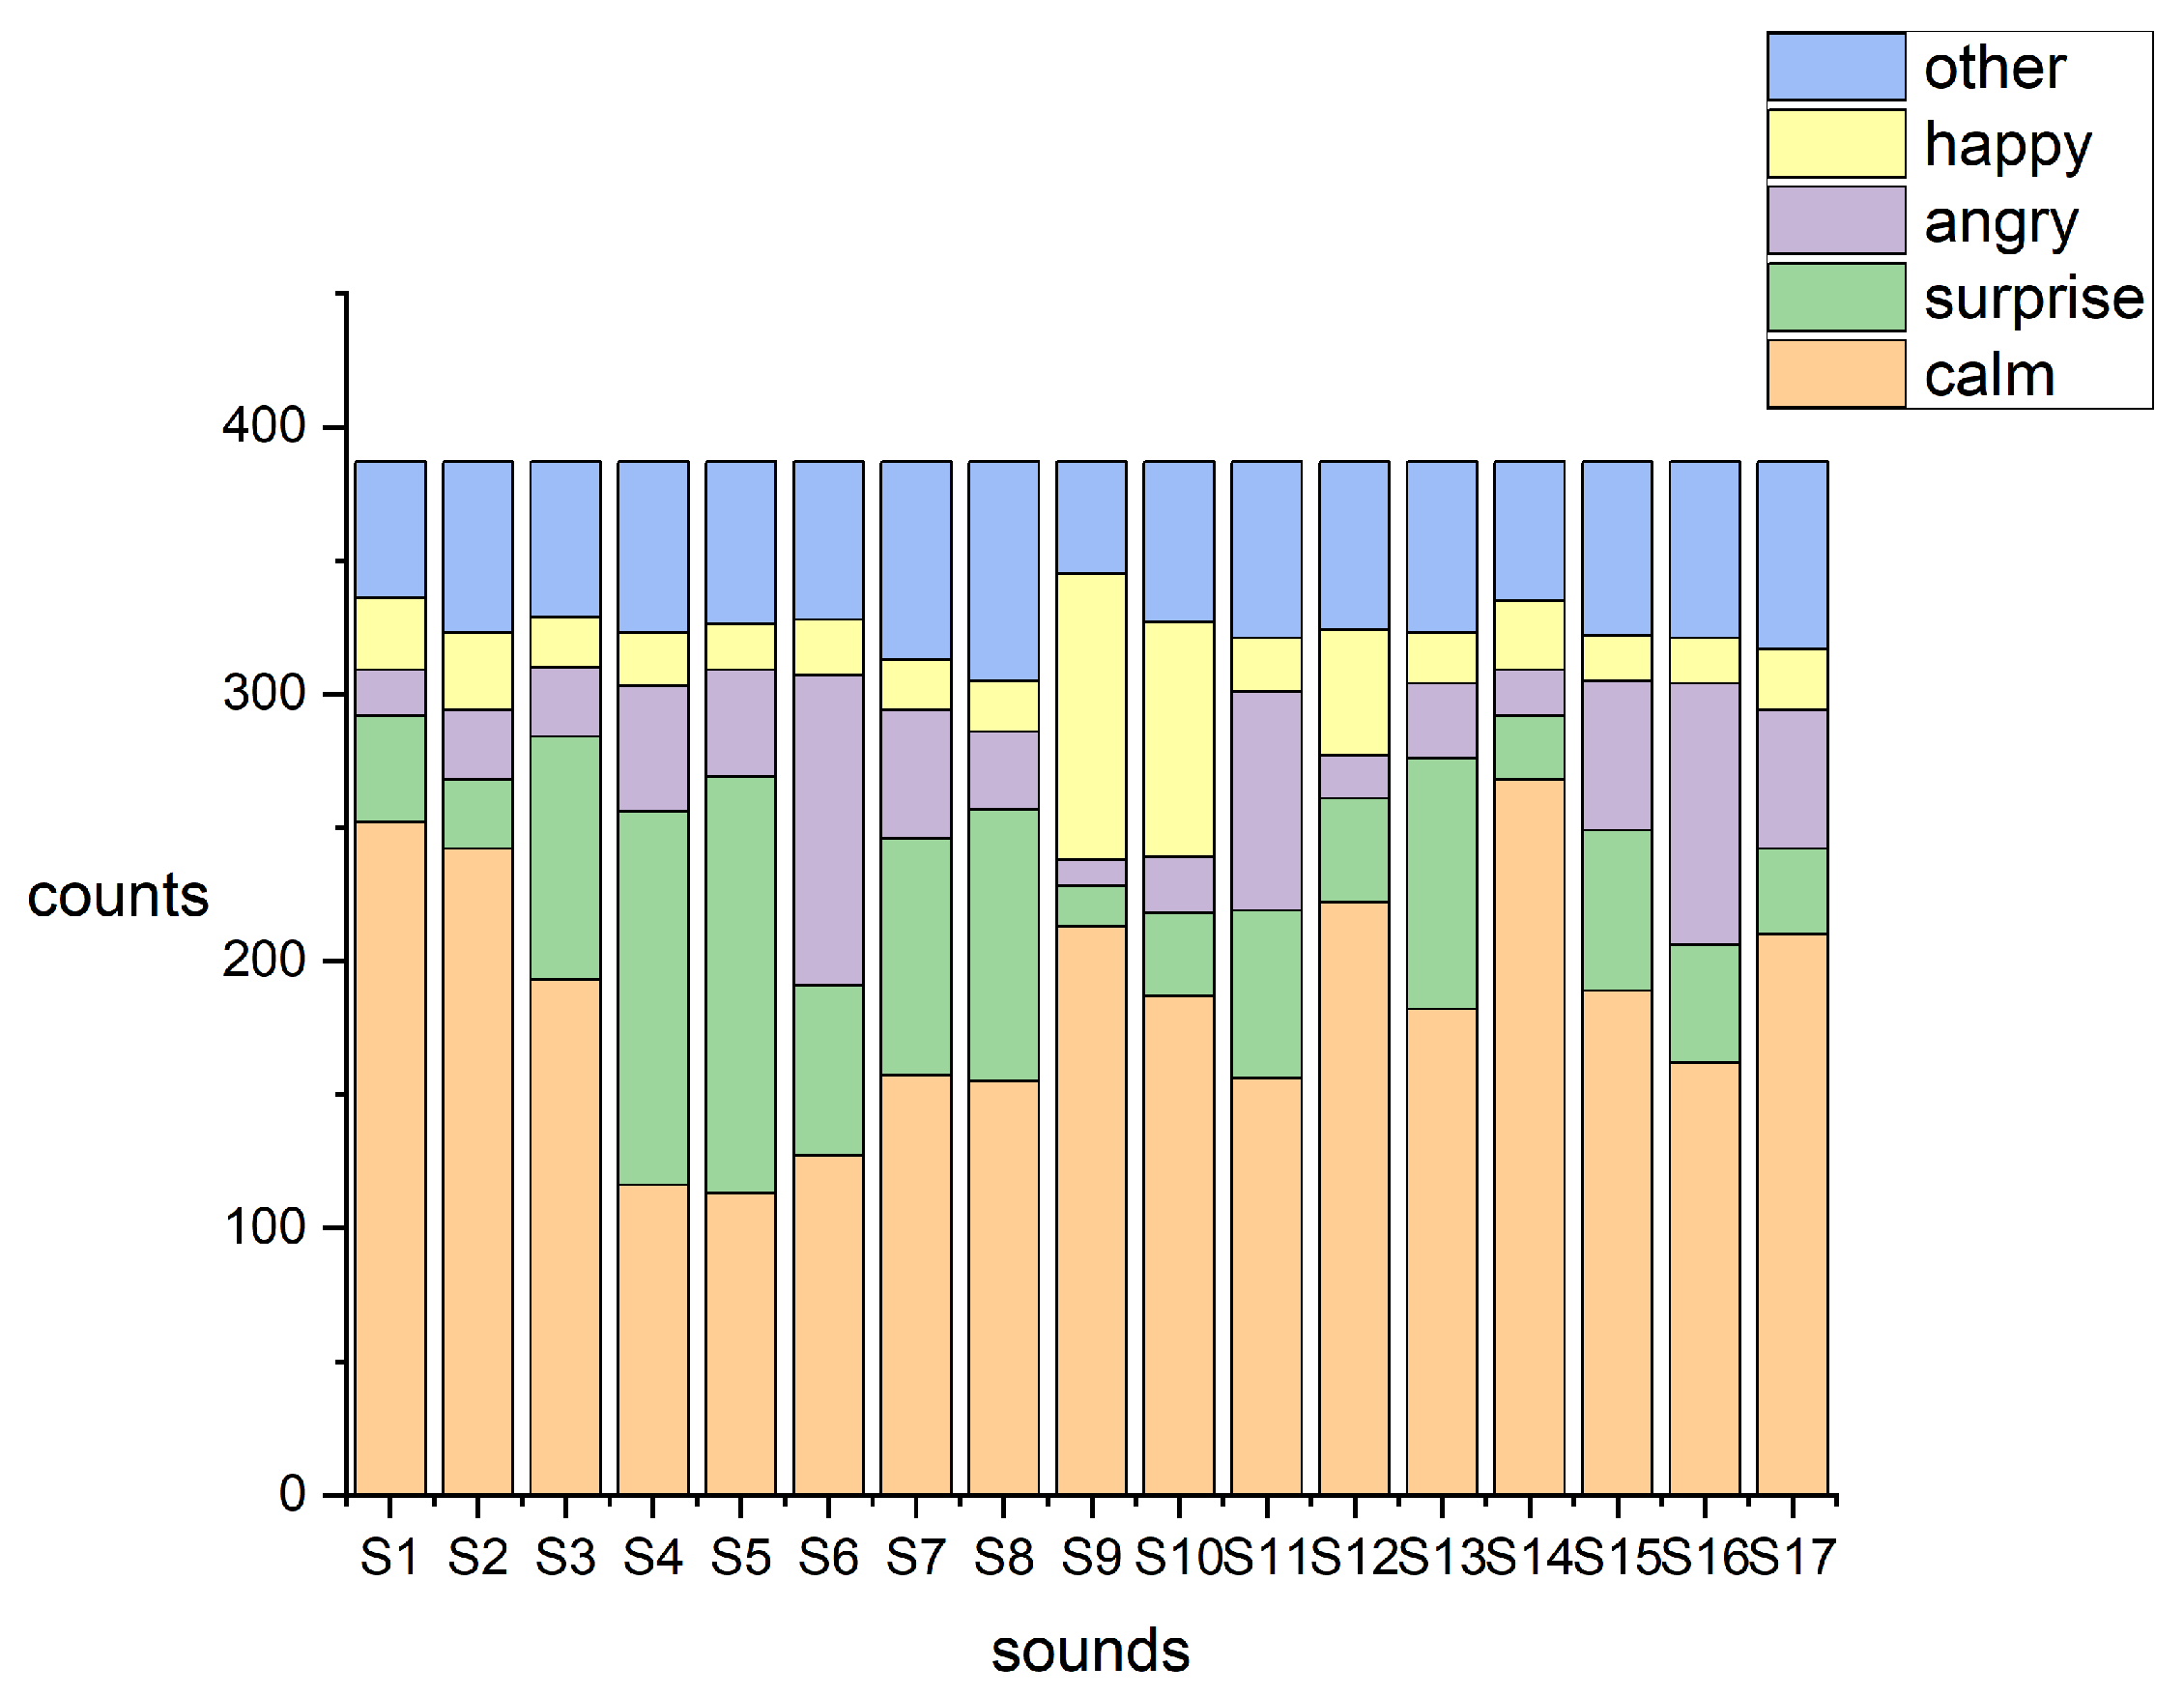
By counting the frequency of each sound effect for each emotion, we obtained a graph of the distribution of emotional intensity. Figure 4 visualizes the emotional strength of each emotion under various sound effects and provides support for further screening of emotional stimulus materials.
Figure 4.
Emotional strength distribution graph.
4.2. Experimental Program
Based on the questionnaire survey results, we identified the most potent combination of emotional arousal in typical driving scene audio. We used it as the experimental stimulus audio. We added this stimulus audio to the static driving simulation scenarios and most of the dynamic driving simulation scenarios.
In the static driving image experiment, we collected 60 urban driving scene photographs and added driving scene prompt words to each image. The prompt words were displayed for 3 s, followed by the images for 10 s. The driving behaviors included turning, lane changing, pedestrian avoidance, traffic blocking, and accelerating to overtake other vehicles. Specific audio stimuli were added to elicit drivers’ emotions consistent with the corresponding driving behaviors. Each experimental group consisted of 12 photos, with a total of five groups. Each group lasted 2 min and 35 s, and the total duration of the static driving image experiment was approximately 30 min.
In the dynamic driving video experiment, we collected 60 urban driving videos. These videos were excerpted from online beginner driving tutorial videos. The driving behaviors included straight-line driving, roundabout turns, and waiting at intersections. Each video lasted two minutes. No prompts were added in the videos. Specific audio stimuli and original driving sounds were used to elicit the target emotions from drivers while performing corresponding driving tasks. Ten videos formed one group, with a total of six groups. A five-minute break was taken between each group. A nine-point calibration was performed before each group. Each group lasted 20 min. The total duration of the dynamic driving experiment was approximately 2 h and 30 min.
4.3. Experimental Equipment
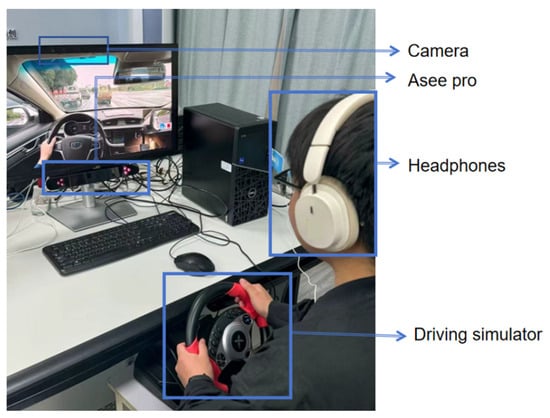
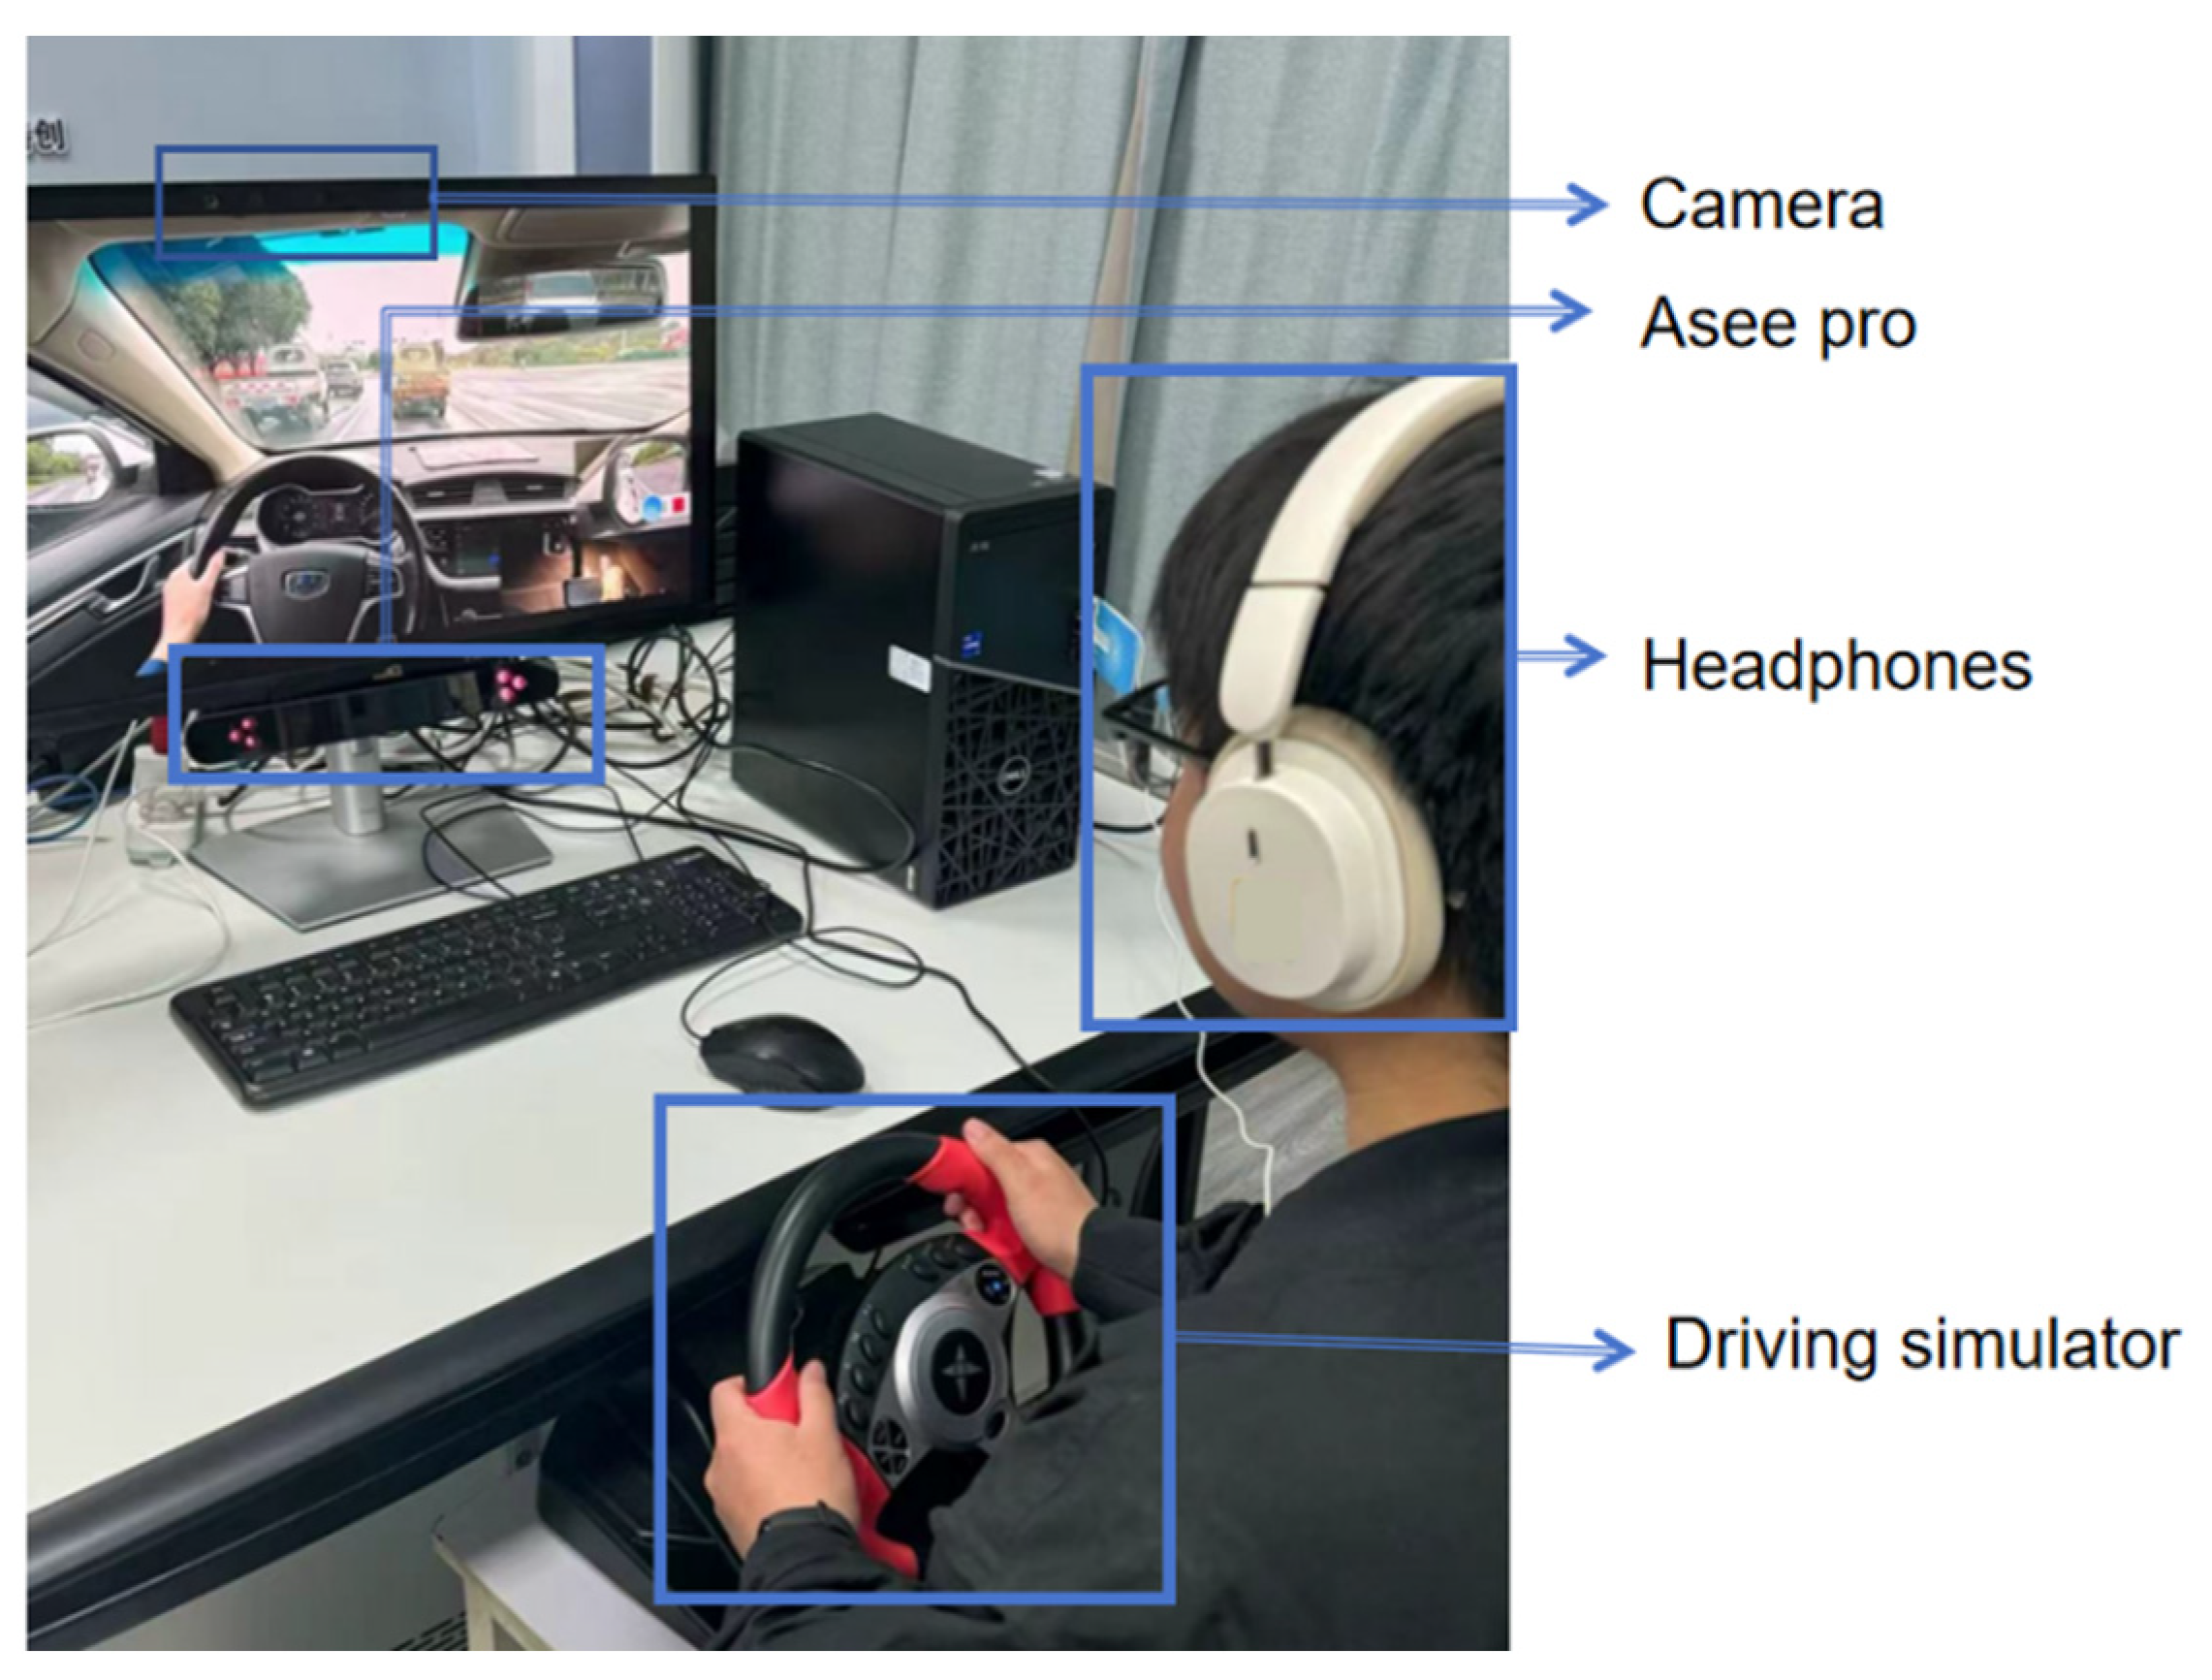
The equipment used in the simulated driving experiment included a simulated steering wheel, a clutch, a brake, a turn signal, an eye tracker, human factor equipment, a laptop, and a camera. This study utilized the aSee Pro F100 eye tracker (Beijing 7Invensun Technology Co., Ltd., Beijing, China). The device operates at a sampling rate of 100 Hz. The experiment was conducted, and data were collected using the accompanying aSee Studio eye-tracking analysis software, version 0.4.50.5, Beijing 7Invensun Technology Co., Ltd., Beijing, China. The collected parameters included basic participant information, pupil information, gaze point information, saccade information, and blink information, among others.
The experimental environment is shown in Figure 5. The simulated driving experiment was conducted in a laboratory environment with standard lighting and temperature that was well-ventilated and maintained a quiet atmosphere without blatant noise interference.
Figure 5.
Experimental environment.
4.4. Experimental Participants
We recruited 34 subjects aged 18–25 years, with an average age of 22 years. Before the experiment, we recorded each subject’s age, gender, and license status. All subjects were either license candidates or drivers with less than one year of driving experience. Subjects with an experimental efficiency lower than 90% were excluded, resulting in an effective sample size of 32 participants. Considering the unique nature of the eye movement experiment, we asked subjects to adhere to specific guidelines to prevent external interference. They were not allowed to wear contact lenses; if they wore glasses, the prescription must not exceed 500 diopters. Subjects were required to have normal eye function and no recent eye surgery. We ensured that subjects were in good health, good sleepers, habitually right-handed, and free of mental illness.
We informed each subject in advance of the experiment’s purpose, procedure, and precautions. Each subject signed an informed consent form authorizing the use of their data for scientific research purposes. This study strictly adhered to the Declaration of Helsinki and relevant scientific research ethics standards, and the research protocol had been reviewed and approved by the Ethics Committee of Baoji University of Arts and Sciences.
4.5. Experimental Data Preprocessing
4.5.1. Pre-Processing of Eye-Movement Data
In this study, we collected eye-movement data and facial expressions from 34 subjects in both static simulated driving images and dynamic driving video scenarios. The initial dataset for each subject contained 79,070 time points. To facilitate analysis, we sliced the static-image and dynamic-video experimental data into 5 s time windows. This process reduced the data volume from 79,070 rows to approximately 500 rows. We then labeled each 5 s sample of each experimental set with a five-category label. After labeling was complete, we cleaned each sample’s data to remove invalid classification features and outliers.
4.5.2. Facial Expression Image Preprocessing
In this study, we systematically processed the subjects’ facial expression images to ensure data consistency and analysis accuracy. First, the recorded facial expression video sequences were input into the ErgoLAB facial expression analysis software (Version 3.16.13, Kingfar Technology Co., Ltd., Beijing, China), which extracted facial feature points and generated corresponding emotion labels. After obtaining the emotion labels, the videos were frame-by-frame intercepted to generate a continuous sequence of facial images.
Next, alignment and normalization were performed on the facial expression images. The standardized processing involved uniformly resizing the images from their original resolution of 1920 × 1080 to a standard size of 224 × 224 pixels to meet the model input requirements. Additionally, the pixel values were normalized to the range [0, 1] to eliminate the effects of illumination and scale variations, thereby enhancing the robustness of subsequent analysis.
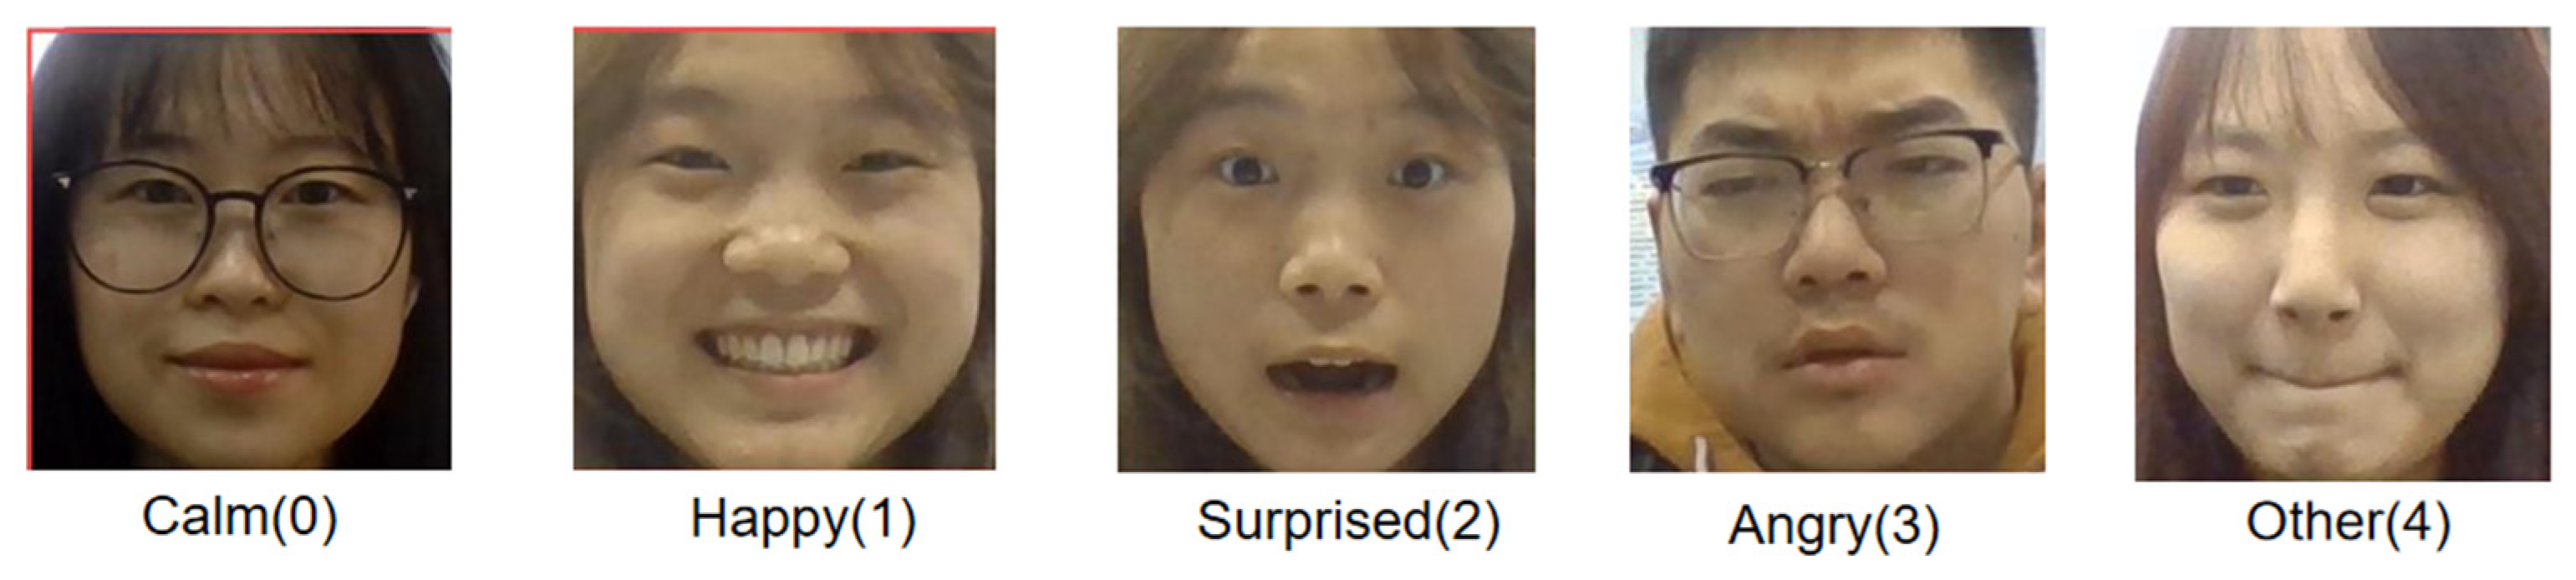
Finally, manual classification was conducted according to the emotion labels provided by the software. Figure 6 shows facial expression images of the subjects in different emotional states.
Figure 6.
Facial expression images.
5. Analysis of Experimental Results
5.1. Training Parameters of the Model
The sample dataset for this experiment included an eye-movement dataset and a facial-image dataset. There were 30,000 eye-movement data samples and 30,000 facial expression samples. The sample size for each emotion category was 6000. All samples were divided into five subsets with the subject as the unit of analysis. In each iteration, four subsets were used as the training set and one subset as the validation set. The process was repeated until all subsets had been used as the validation set exactly once. The network was trained for 30 epochs, with a batch size of 32 per epoch. The initial learning rate was 10−3. The learning rate was automatically adjusted during the training process using the Adam optimizer. The loss function was cross-entropy. Its mathematical expression is as follows.
where yij denotes the true probability of sample X and pij denotes the predicted probability of sample X.
5.2. Evaluation Indexes
The evaluation indices of the experimental results included Accuracy, F1-score, Precision, and Recall. Accuracy was the ratio of correctly predicted samples to the total number of samples and is the most basic performance metric. Its calculation formula is
where TP (True Positives) refers to true positive cases, TN (True Negatives) refers to true negative cases, FP (False Positives) refers to false positive cases, and FN (False Negatives) refers to false negative cases. The formulas for Precision, Recall, and F1-score are as follows:
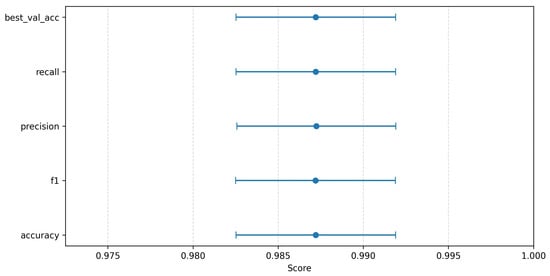
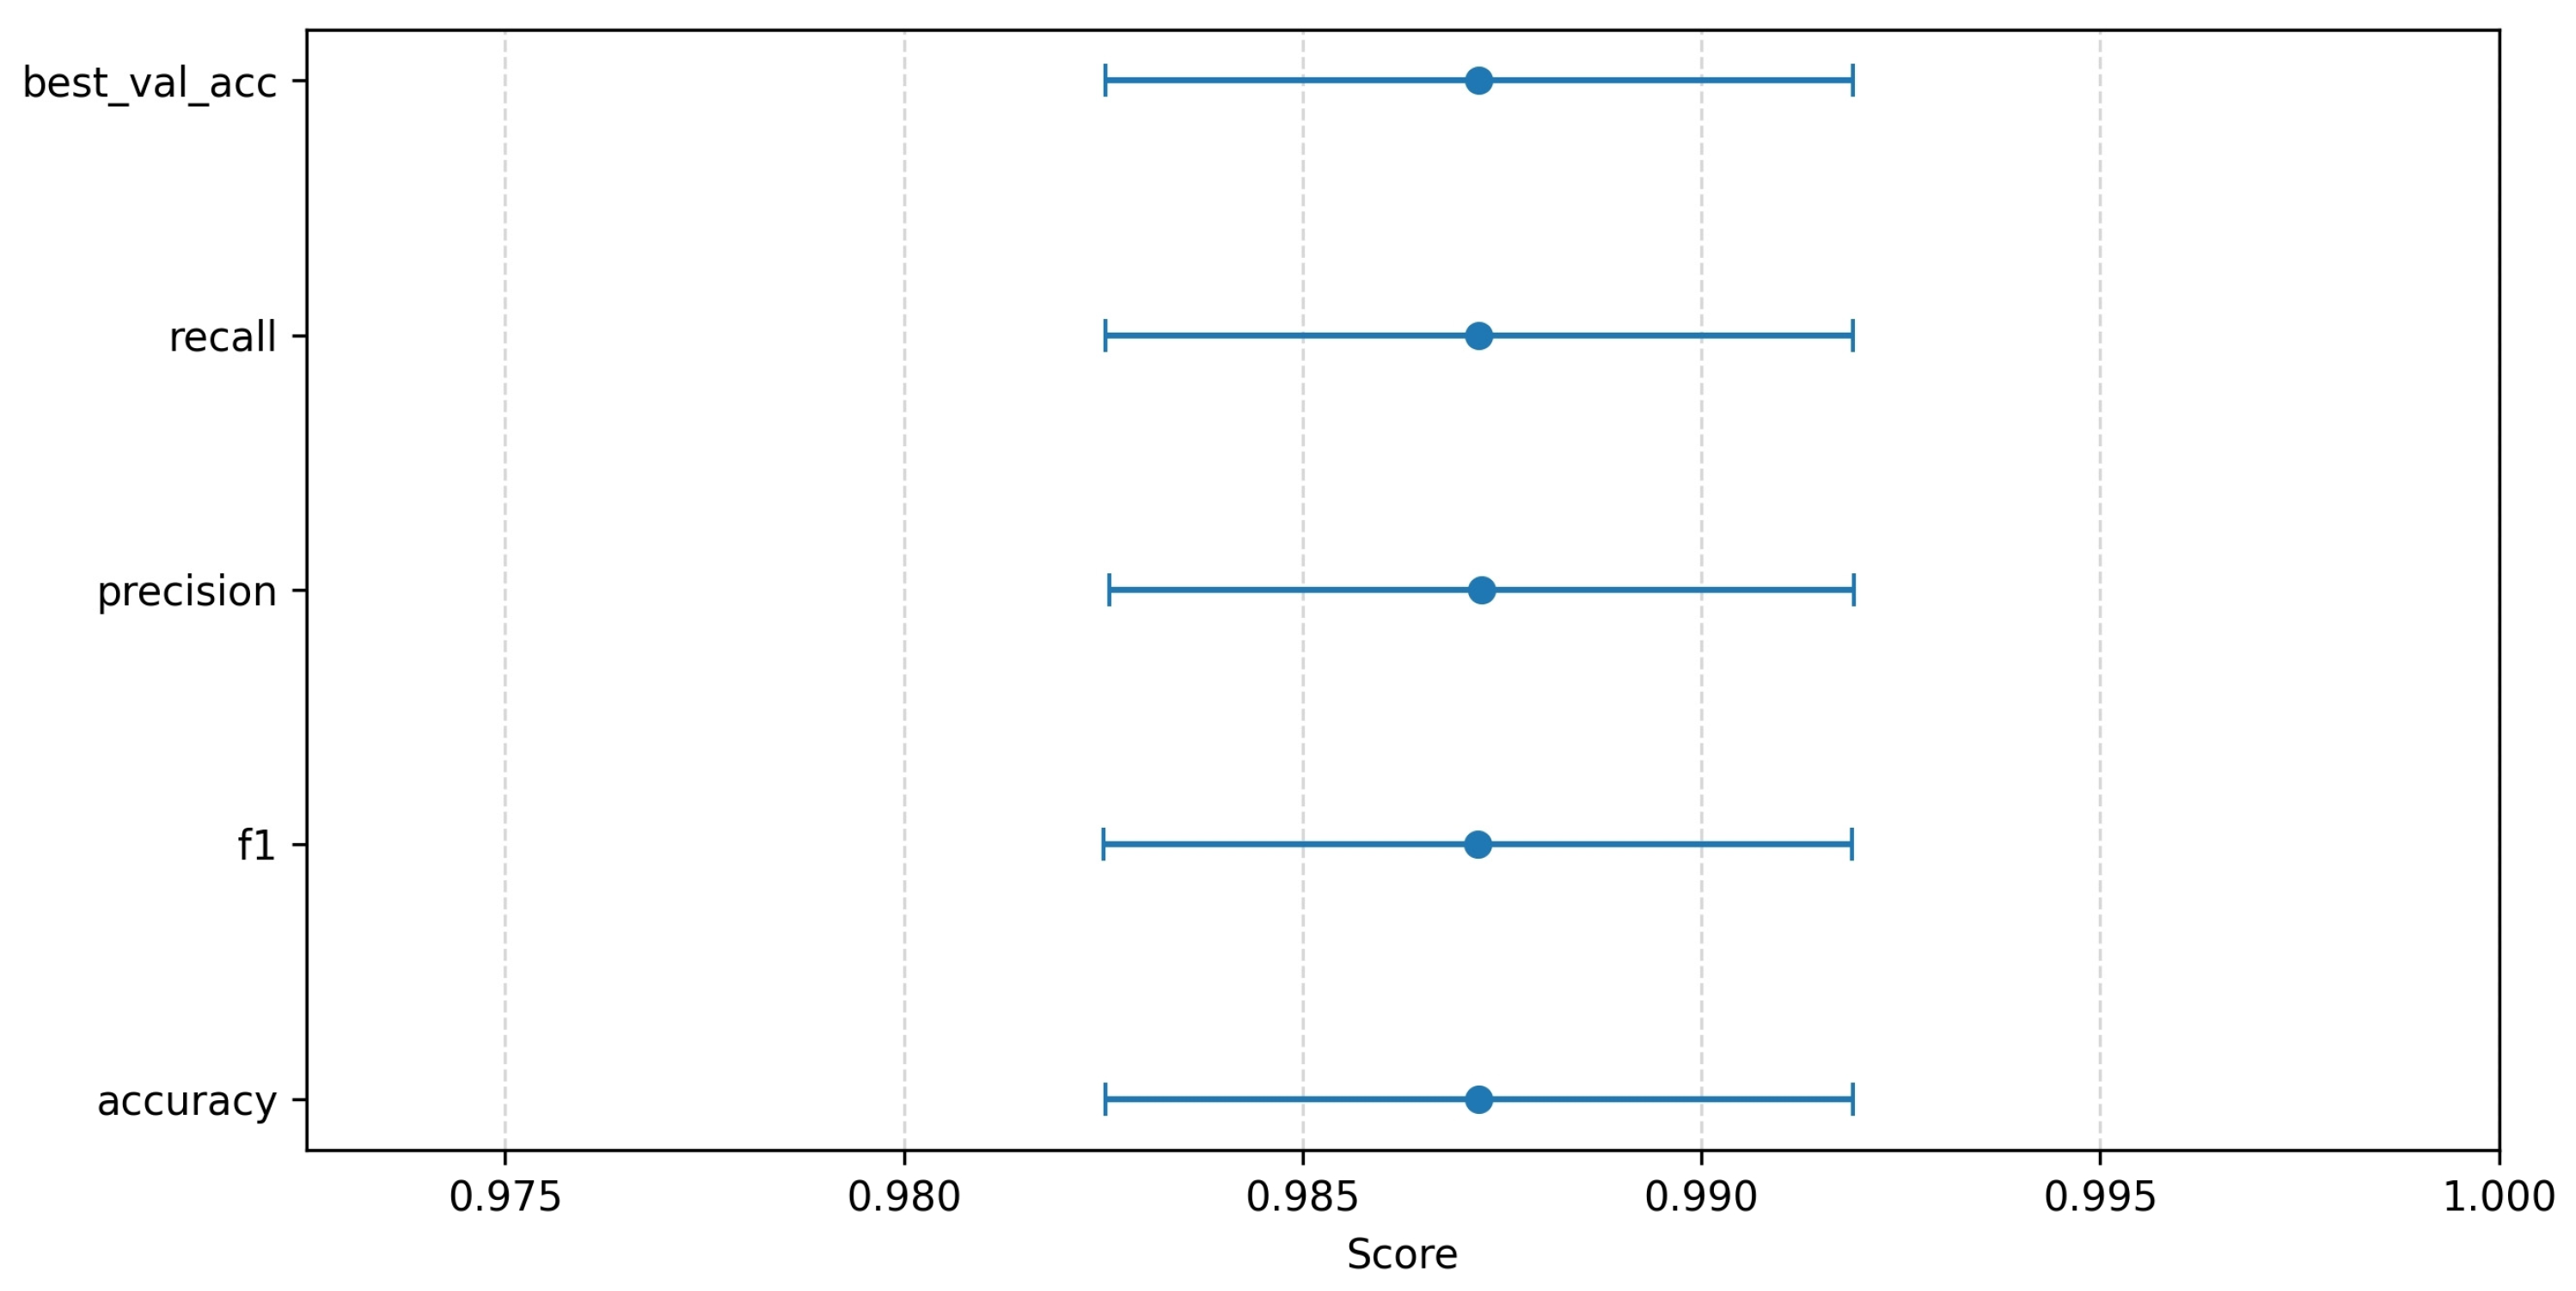
Figure 7 shows the confidence intervals of the evaluation metrics. It demonstrates that the model proposed in this paper performed well and exhibited stable performance in the emotion classification task for novice drivers. The balanced and stable performance metrics confirmed that the model had the potential to be deployed in real-world driving scenarios and could provide reliable technical support for driver emotion monitoring.
Figure 7.
Confidence interval plot. The x-axis shows the scores for the evaluation metrics, and the y-axis shows four evaluation metrics (Accuracy, F1 score, Precision, Recall) as well as the highest validation accuracy.
5.3. Results of the Ablation Experiment
5.3.1. Modality Ablation Results
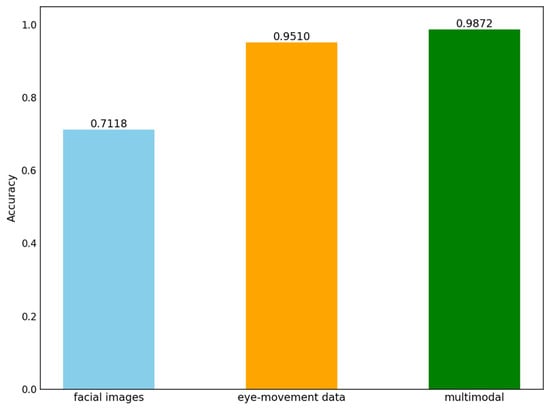
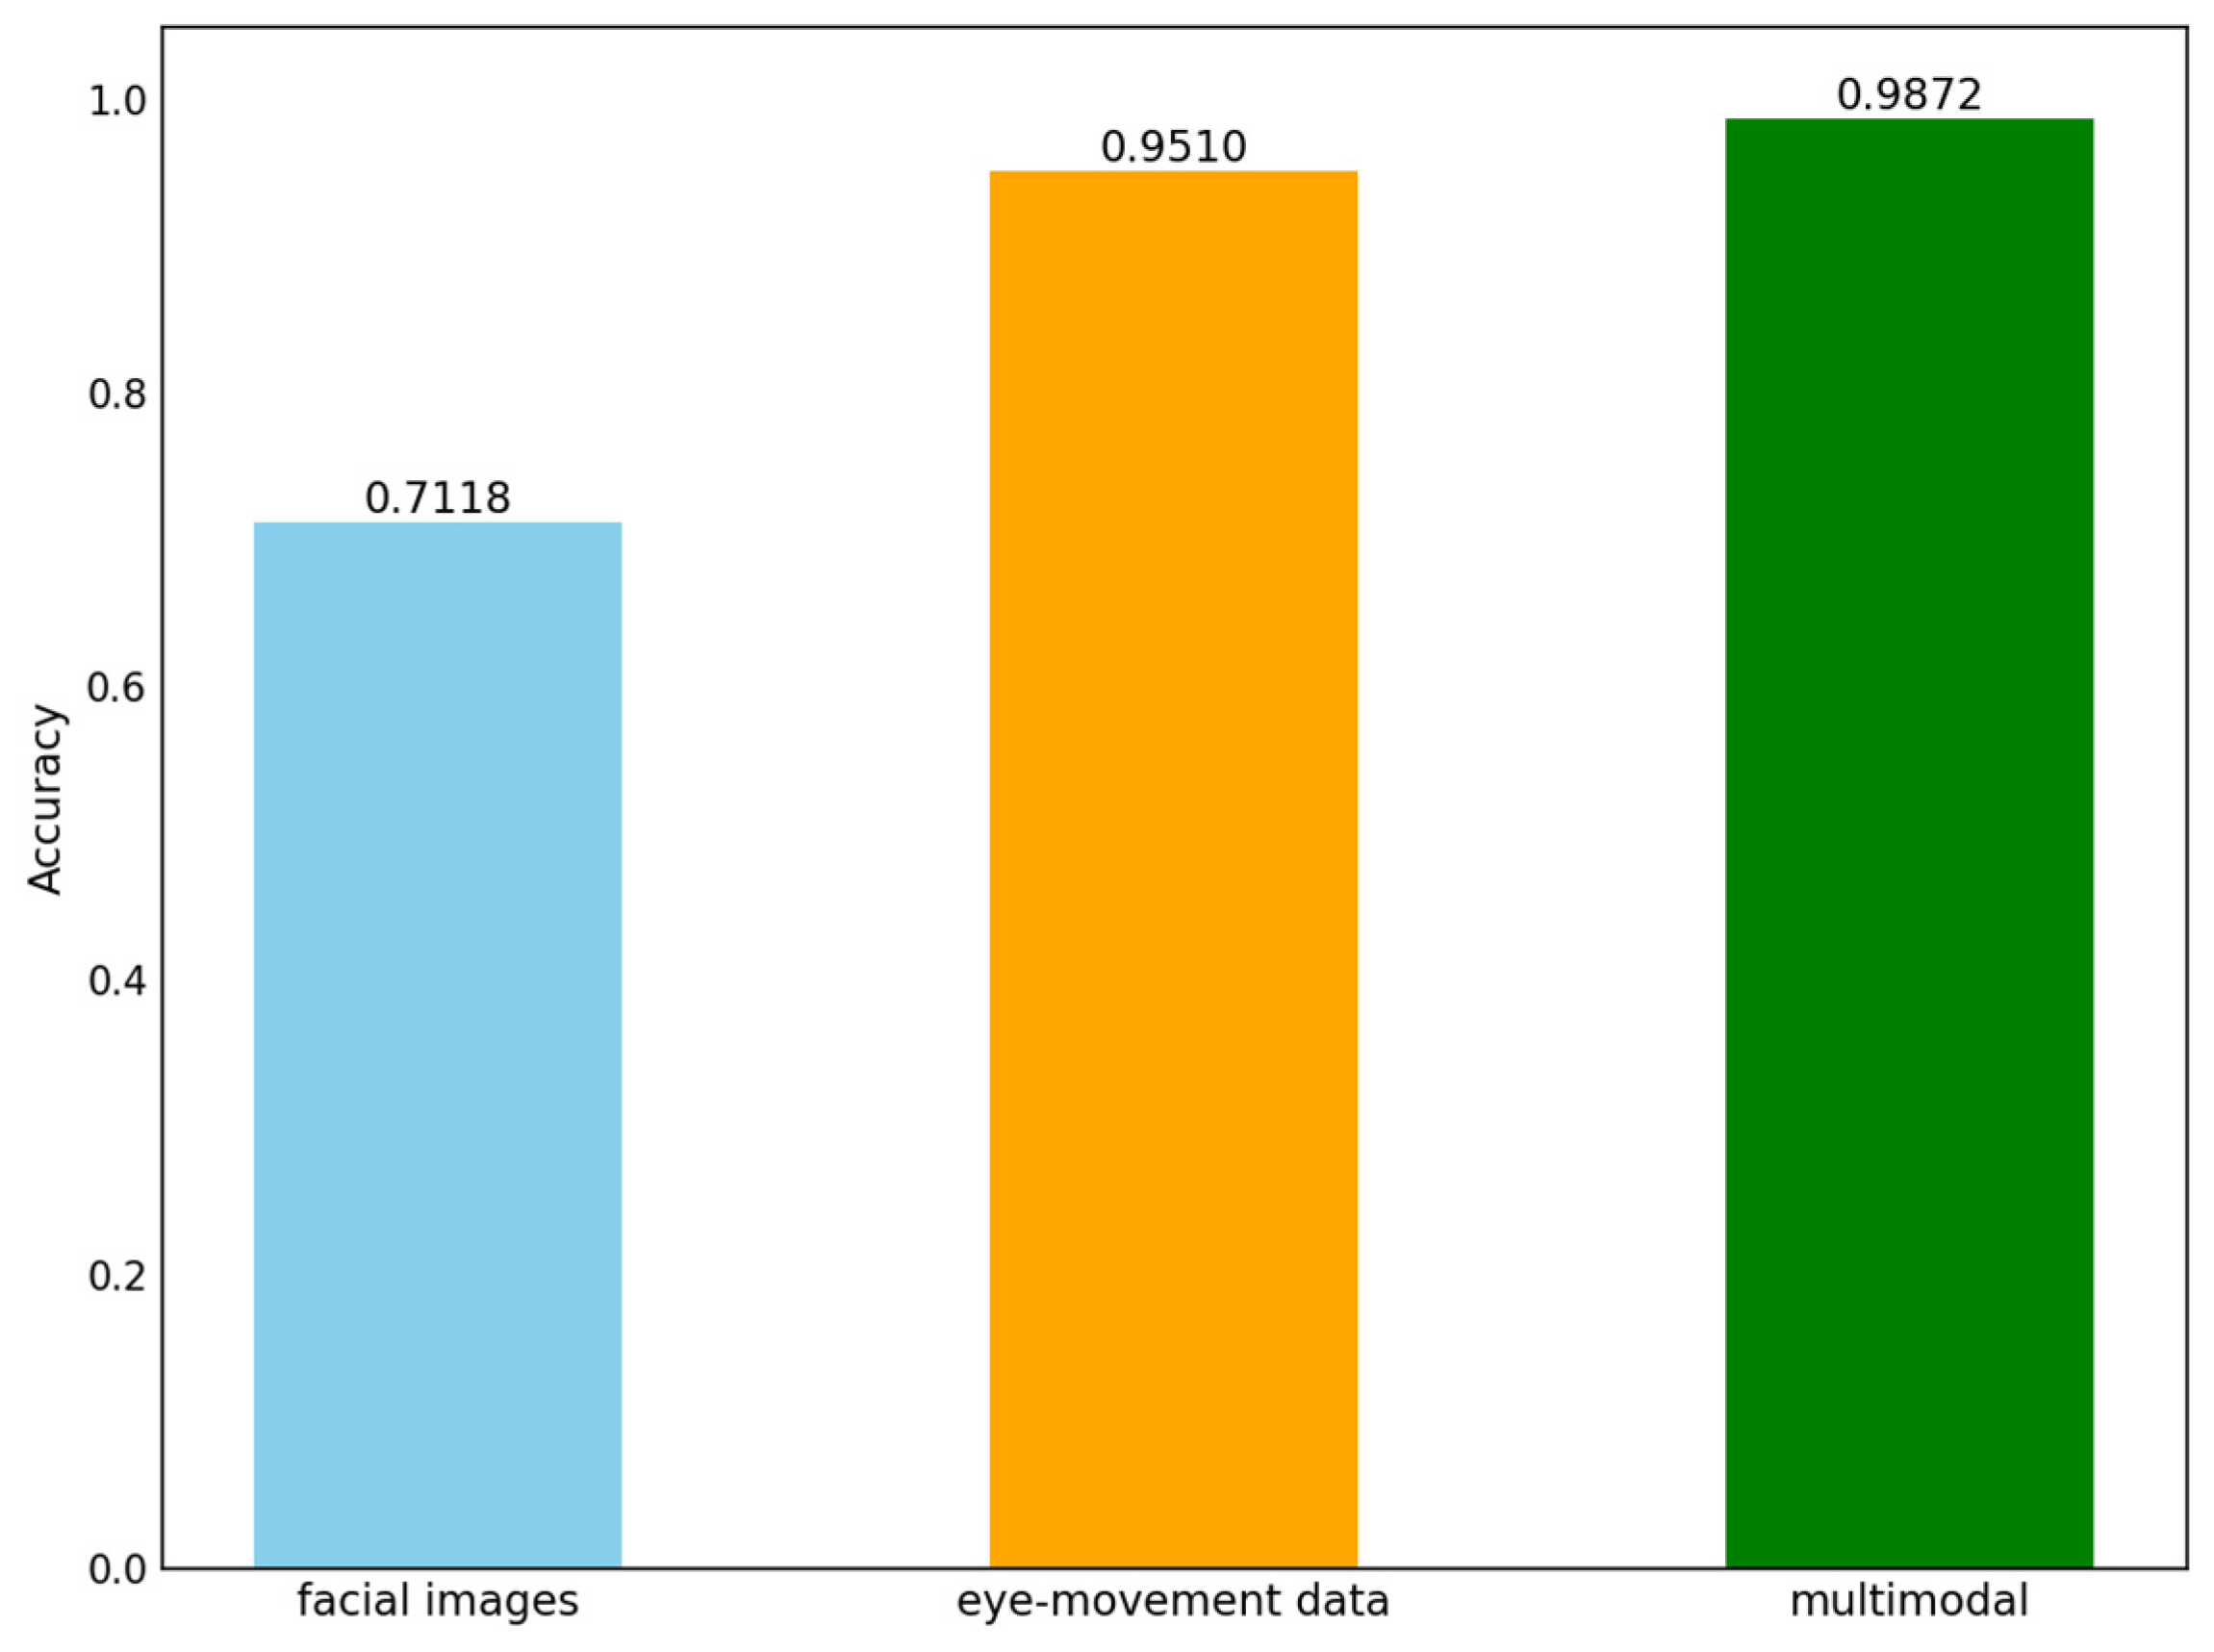
To validate the impact of facial images and eye-movement data on emotion recognition outcomes, this study designed a cross-modal ablation experiment. We examined results from single-modal experiments using either facial images or eye-movement data alone, as well as from multimodal experiments combining both modalities. Figure 8 compares the emotion recognition results across different modalities. As shown in Figure 8, the multimodal experiment achieved the highest accuracy. The ability to recognize emotions through facial images as a single modality was relatively poor.
Figure 8.
Comparison of emotion recognition results across modalities. The x-axis represents three modalities, facial images, eye-movement data, and multimodal, while the y-axis denotes the recognition accuracy of each modality under the hybrid deep neural network.
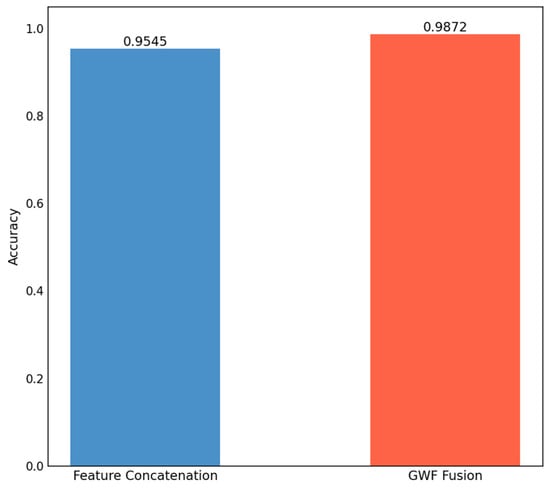
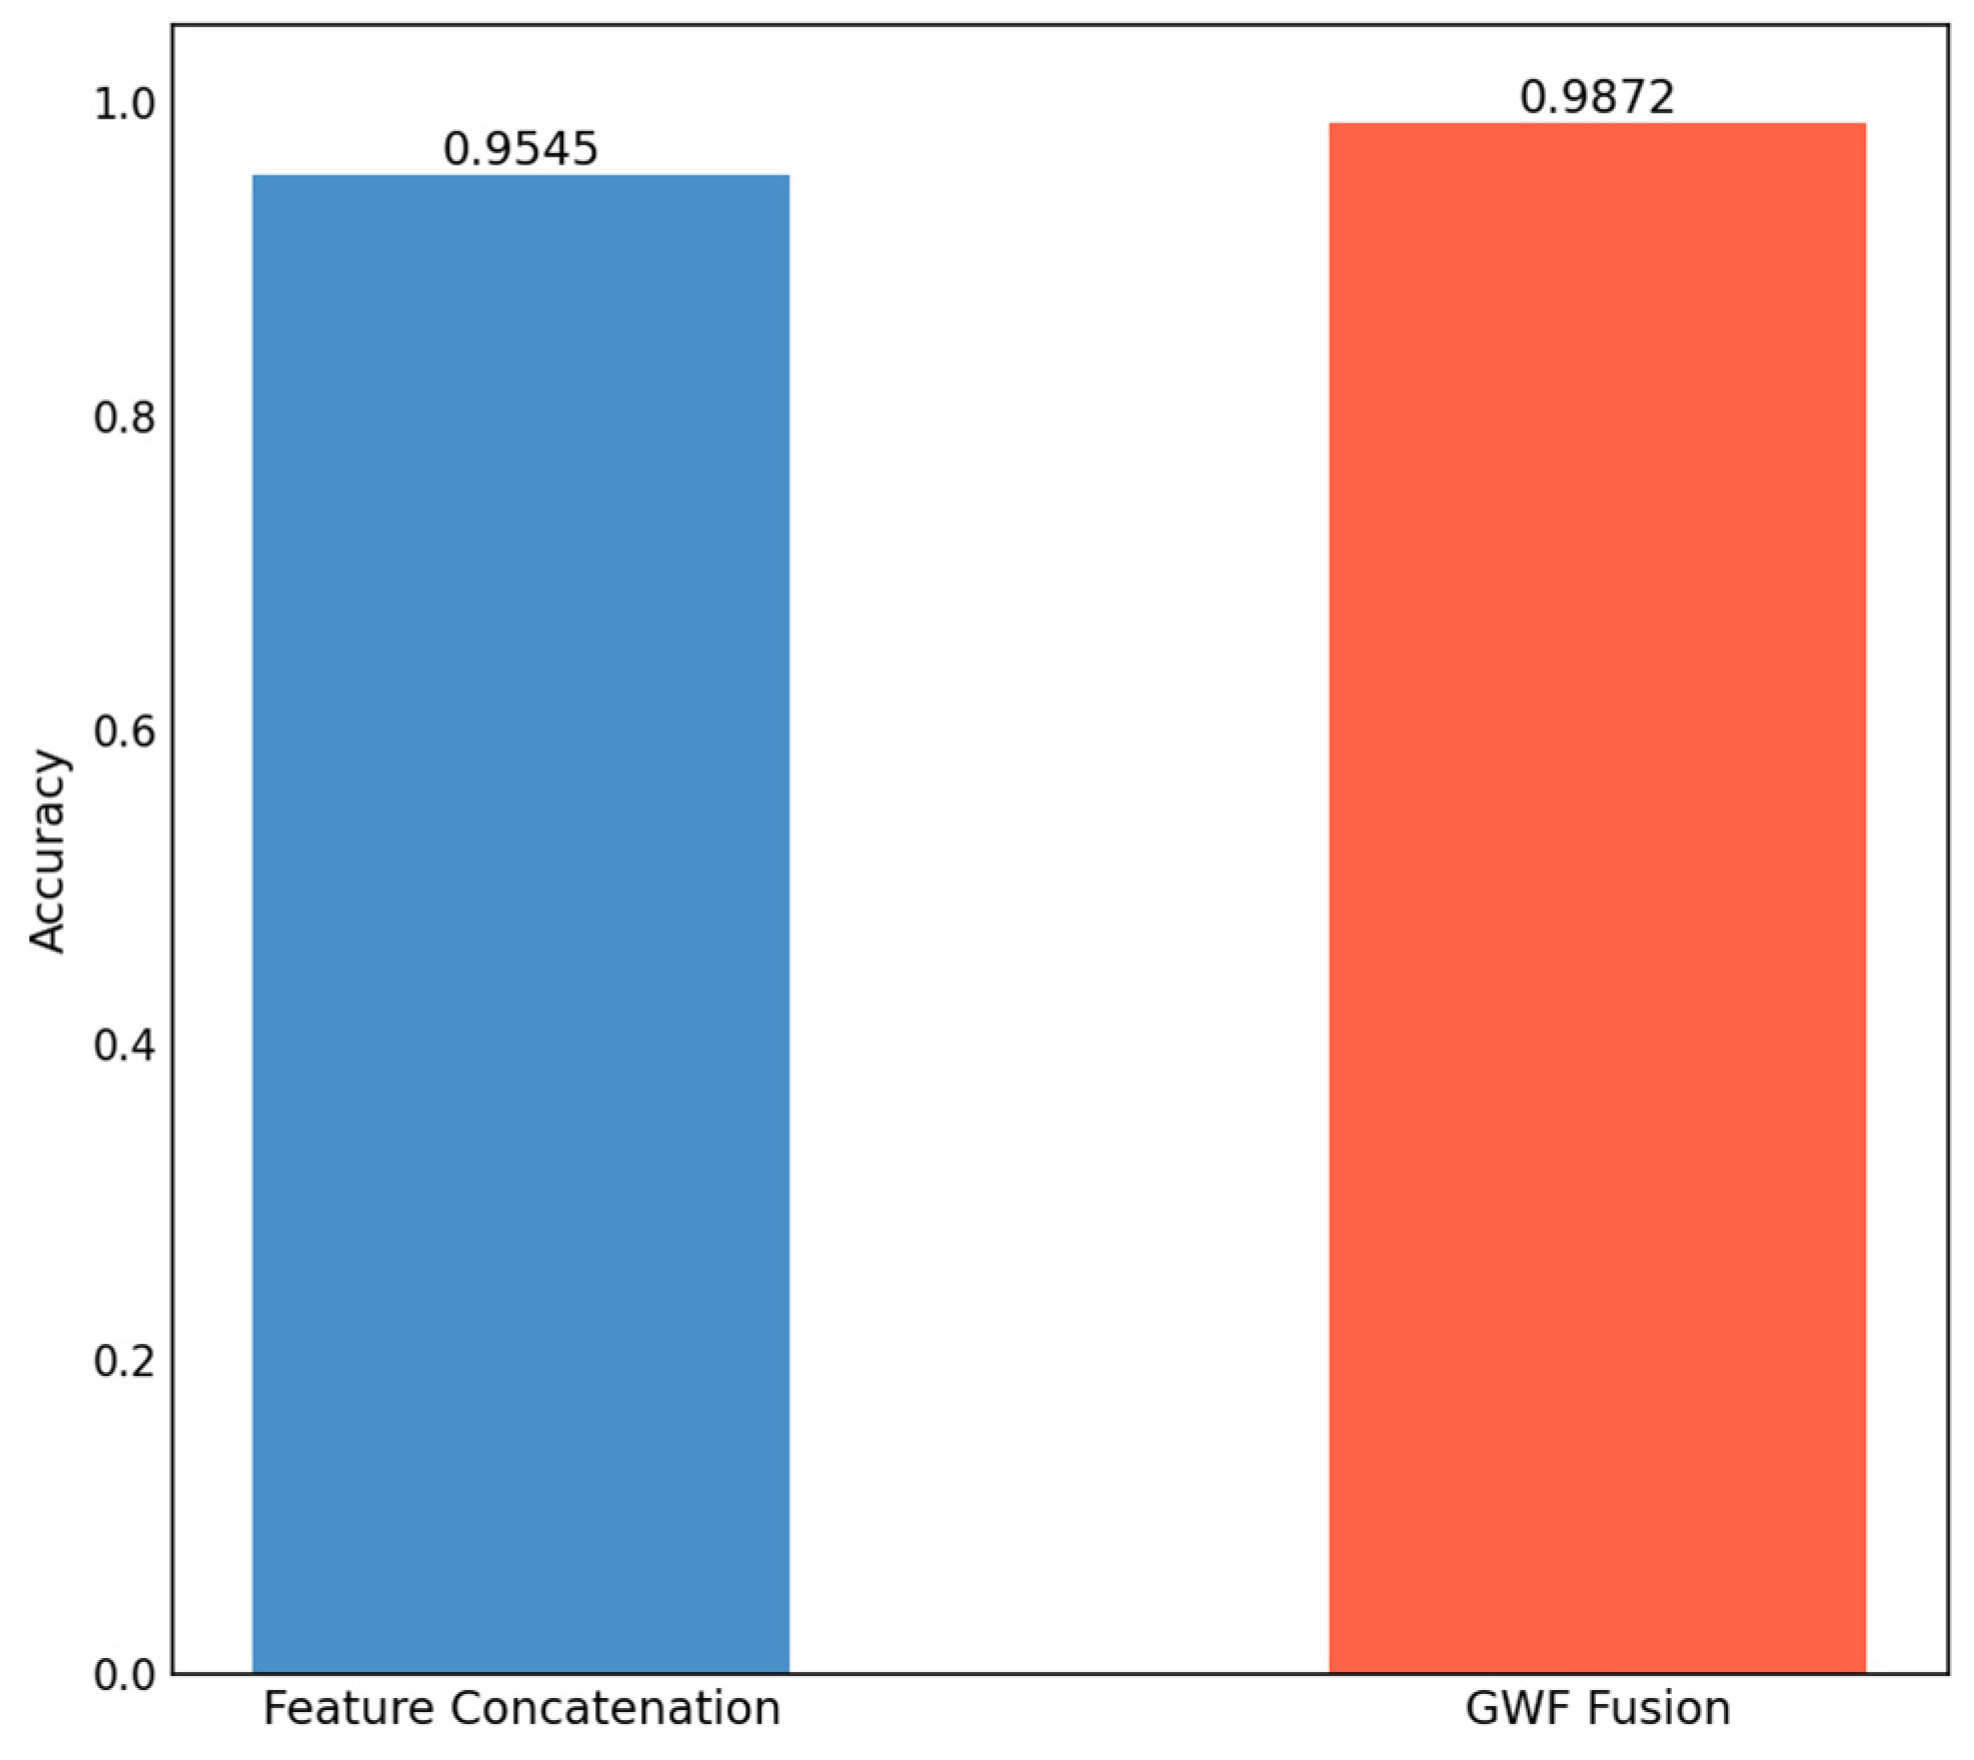
Our model employs the GWF strategy to integrate eye movement features and facial features. To conduct a more comprehensive analysis of multimodal emotion recognition models, we conducted comparative experiments between the feature concatenation and GWF strategies. The comparison results are shown in Figure 9. The concatenation strategy concatenates extracted eye movement and facial features at the feature level to form multimodal features, which are then fed into the classifier for result generation. In contrast, the GWF strategy employs a gating mechanism to automatically learn the weights of different modal features, thereby realizing dynamic weighted fusion. The results in Figure 9 show that the GWF fusion strategy improves the accuracy by 3.27% compared to the simple concatenation method. The GWF can dynamically learn the contribution weights of eye-movement data and facial features, and adaptively integrate the complementary information of the two modalities. It suppresses single-modal noise and interference, thereby improving emotion recognition accuracy while enhancing the model’s robustness. This fusion strategy is well-suited for the emotion recognition task of novice drivers, who exhibit atypical facial expressions and complex eye movement patterns.
Figure 9.
Comparison of fusion strategies. The x-axis denotes the two distinct fusion strategies, while the y-axis indicates the recognition accuracy.
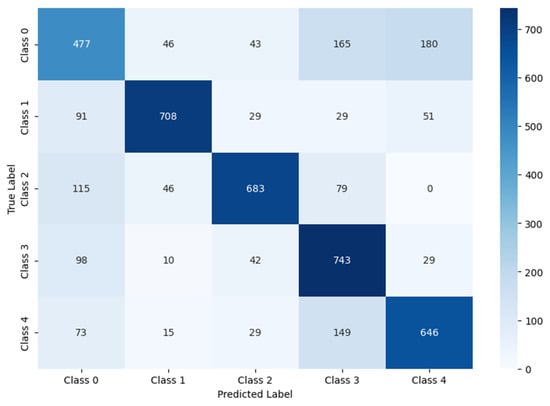
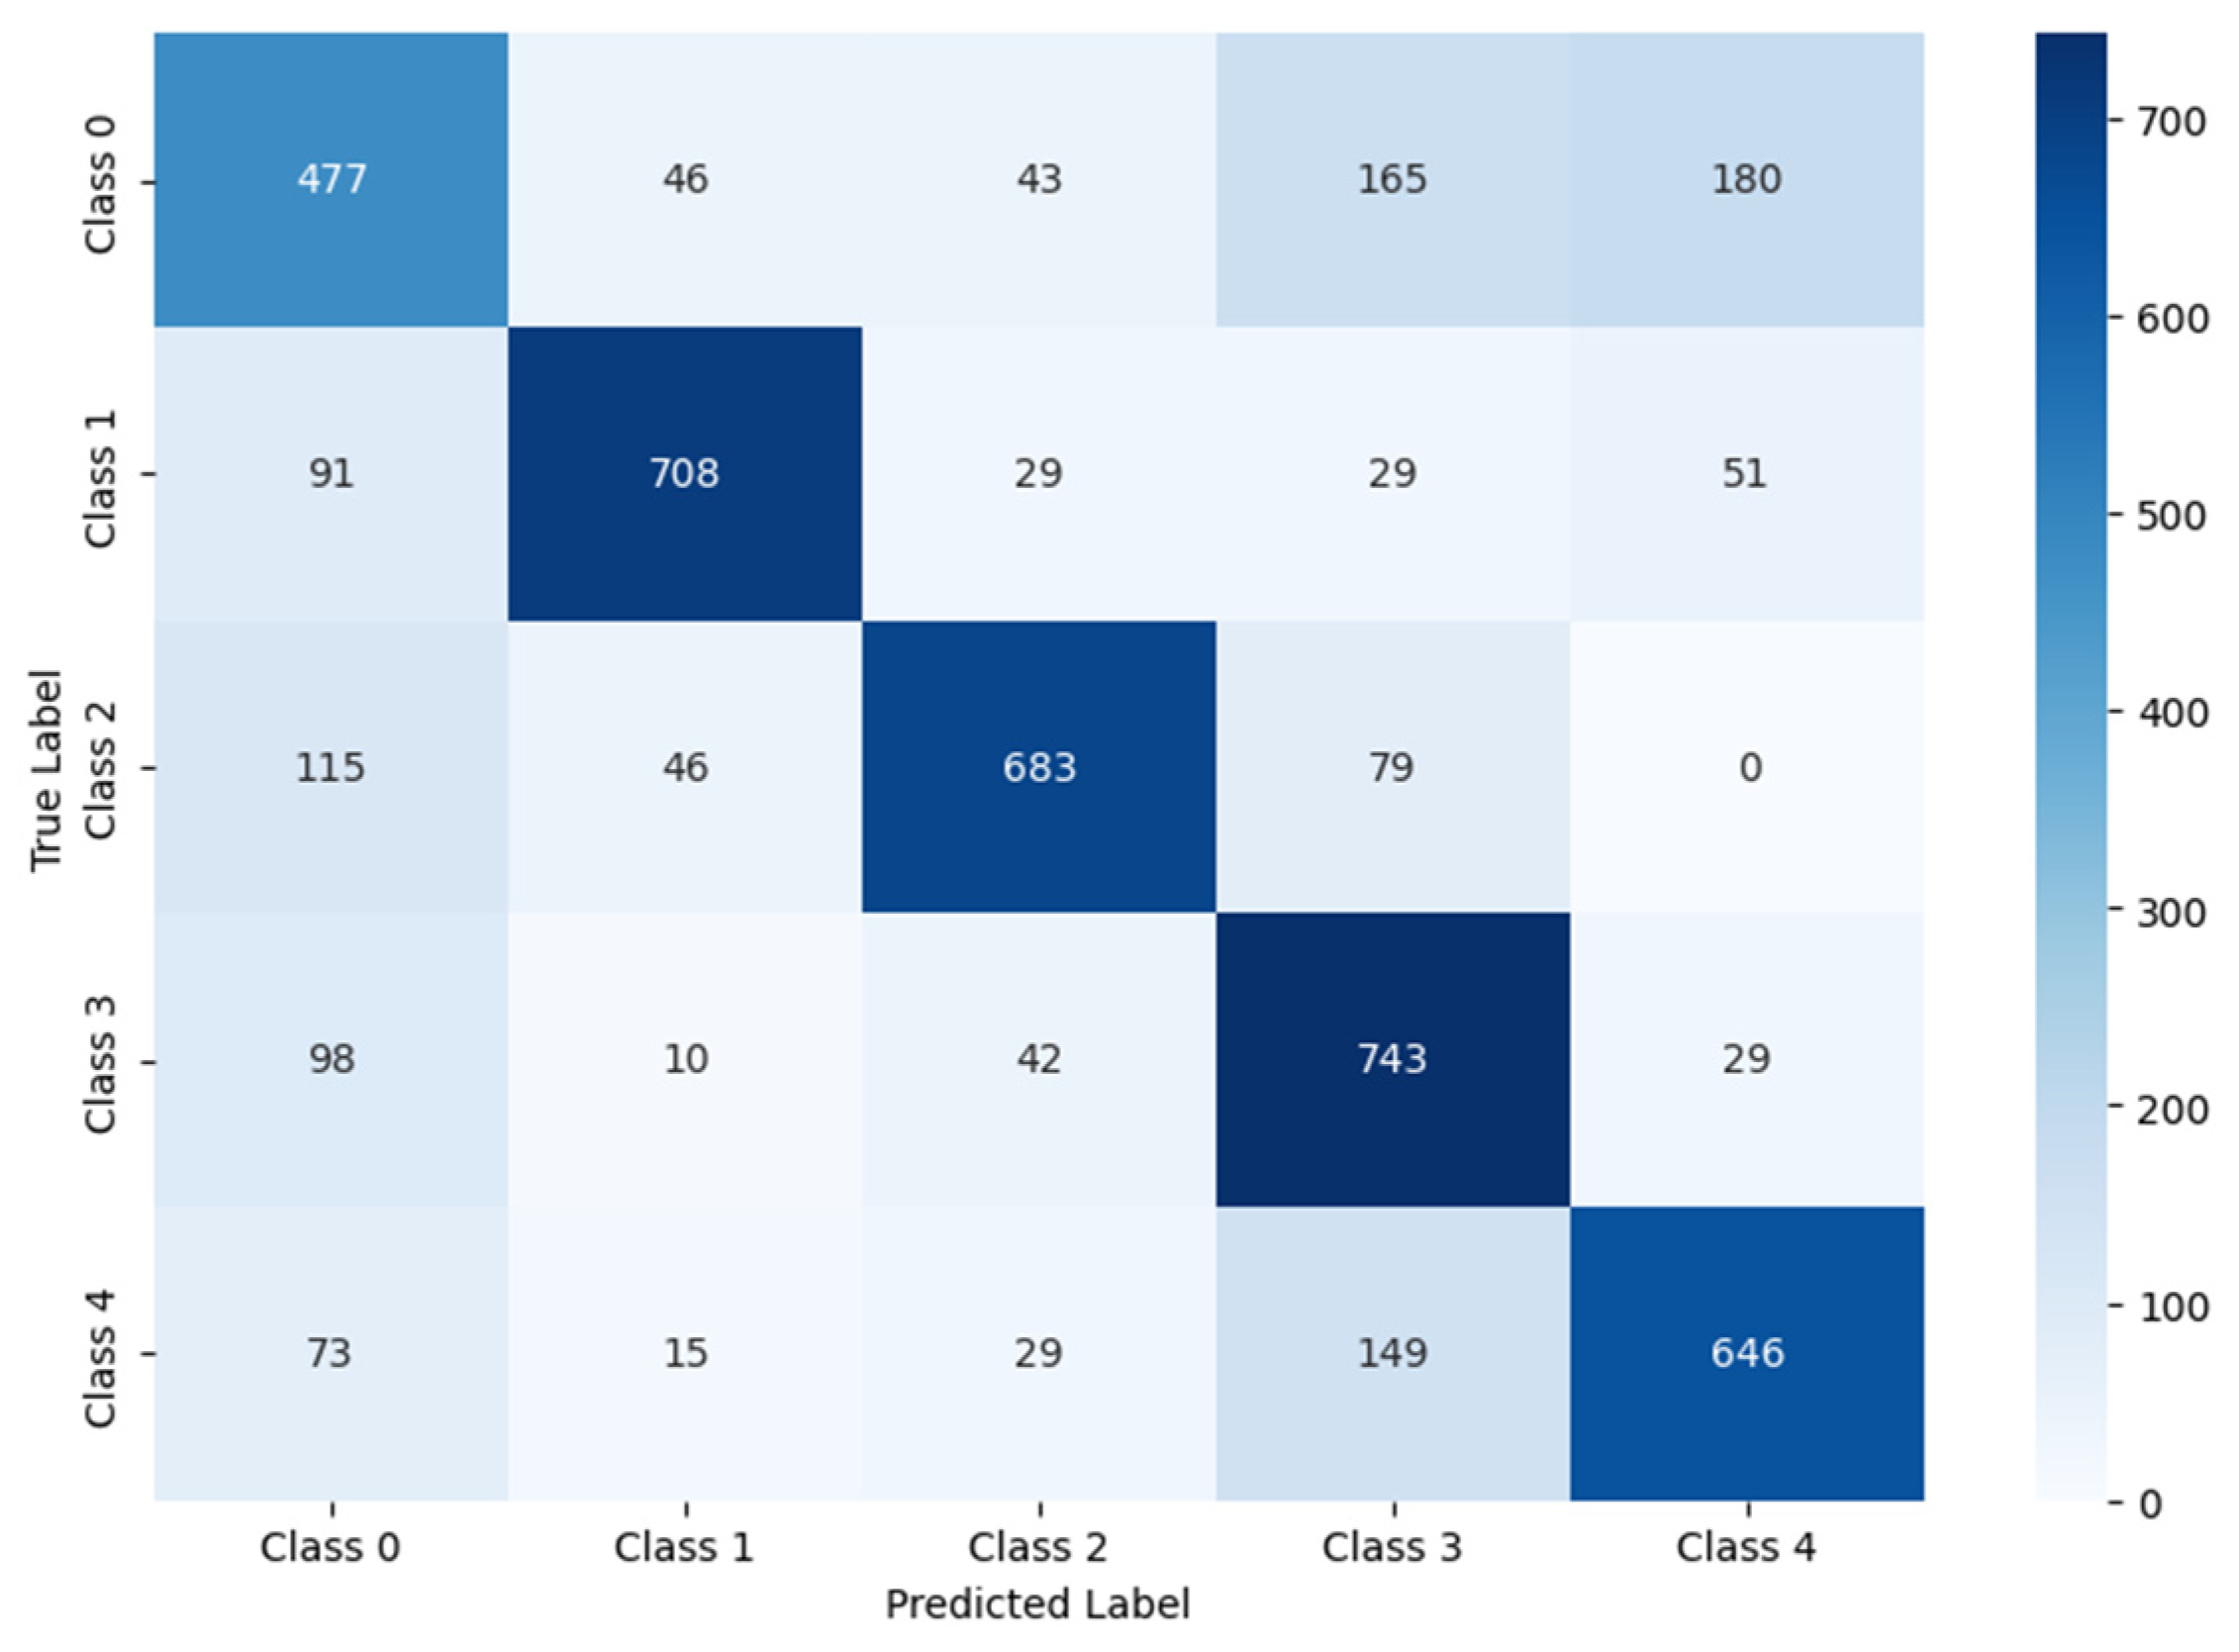
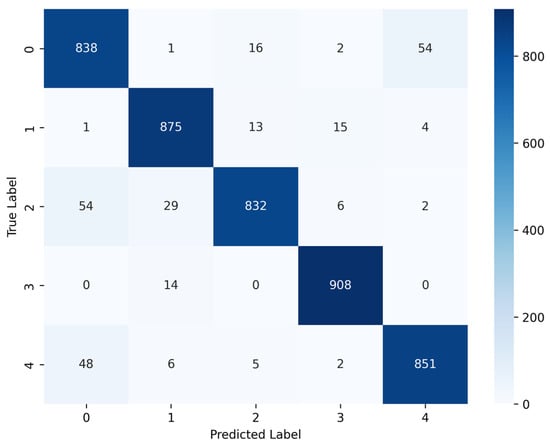
The confusion matrix is a commonly used table for describing the performance of a classification model. The confusion matrix typically has the same number of rows and columns, with each row representing an actual class and each column representing a predicted class. This paper used a confusion matrix to demonstrate the classification performance of the proposed model on facial expression images and under multimodal conditions. Figure 10 illustrates the model’s classification results on facial expression images.
Figure 10.
Confusion matrix for classification using only facial images. The x-axis represents the predicted labels, and the y-axis represents the true labels.
From Figure 10, it can be observed that Class 0 (calm) is most frequently misclassified as Class 4 (other) and Class 3 (anger). It indicates that when emotional fluctuations are subtle and facial expressions are less pronounced, relying solely on facial expressions makes it difficult for the model to capture fine-grained differences, thus leading to confusion with other emotional states. The classification results reflect the limitations of unimodal facial features in distinguishing low-activation emotions. The micro-expression characteristics of calm expressions are weak, making it challenging for the model to effectively extract and differentiate them, thus leading to blurred classification boundaries. To address these challenges, future research will require more sophisticated model architectures to capture micro-expression features. Additionally, more clearly annotated training samples for low-activation emotions will be needed to enhance the model’s ability to learn subtle differences in facial expressions.
Figure 11 shows the confusion matrix results from the multimodal emotion recognition experiment. Overall, most samples are correctly classified. The main misclassifications still occur between Class 0 (calm) and Class 4 (other). The confusion pattern matches that of the unimodal results, but the number of errors drops sharply in the multimodal model. This shows that eye-movement data provides critical complementary information. When facial expressions are subtle, eye movement features effectively distinguish calm from other emotions. However, confusion remains for low-arousal emotions. Future work should refine feature extraction for these emotions and add more relevant training samples.
Figure 11.
Confusion matrix for classification using multimodal data. The number in each cell represents the count of samples predicted to belong to that category. The darker the color of the cell, the greater the number of samples predicted to belong to that category.
5.3.2. Model Ablation Results
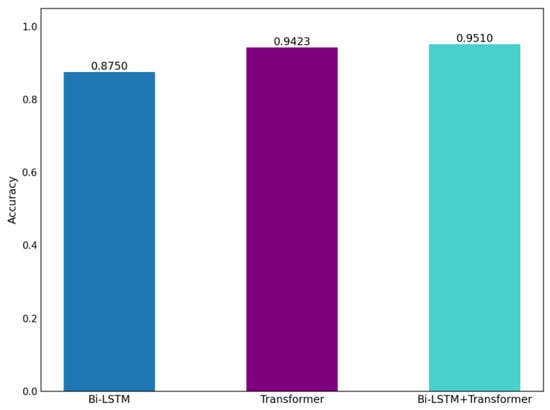
The eye movement feature extraction module consists of several model components. To evaluate the contribution of each component, we designed ablation experiments for the eye movement feature extraction module. First, we assessed the impact of each component of the eye movement feature extraction module on emotion recognition results by using only eye-movement data. The evaluation results are shown in Figure 12. Figure 12 shows that the Bi-LSTM+Transformer encoder yields the best classification results. It indicates that the hybrid-structured eye movement feature extraction network we constructed outperforms individual model components.
Figure 12.
Ablation results of unimodal models. The x-axis represents three methods: ‘Bi-LSTM’, ‘Transformer’, and ‘Bi-LSTM+Transformer’. The y-axis denotes the emotion recognition accuracy of eye-movement signals using these three methods.
In addition, we evaluated the contributions of each component of the eye movement feature extraction module to multimodal emotion recognition by using eye movement and facial expression images. The experimental results are shown in Table 3. The results in Table 3 show that the hybrid-structured eye movement feature extraction network still achieves the best classification results in the multimodal experiments.
Table 3.
Multimodal experimental results.
5.4. Comparative Experiments on Different Datasets
To verify the general validity and superiority of the proposed hybrid deep neural network for emotion recognition, we conducted comprehensive experiments across three public emotion datasets: AFFEC [26], SEED-IV [27], and AffectNet [28]. It should be explicitly clarified that there is currently no multimodal emotion dataset specifically designed for novice drivers, and access to existing driver-specific multimodal emotion datasets has not yet been obtained. Therefore, these three public datasets are used solely to validate the effectiveness and superiority of the proposed model across general emotion recognition tasks, rather than to simulate real driving scenarios or directly represent the emotional patterns of novice drivers.
Specifically, AFFEC is a general multimodal dataset for affective interaction. SEED-IV is a general multimodal emotion recognition dataset. AffectNet is a general naturalistic facial expression dataset. None of them is designed for driving scenarios or analyzing novice driver emotions. Although these datasets differ from our target task in terms of application scenarios, sensing conditions, and emotion categorization, they can still be used to verify that the proposed model possesses strong feature extraction and fusion capabilities in general emotion recognition tasks.
5.4.1. Datasets and Experimental Setup
We strictly adhered to the original emotional labels and official configurations of each public dataset, without performing manual label merging or mapping, so as to preserve the authenticity and integrity of each benchmark dataset.
For the AFFEC dataset, we selected both eye tracking and facial expression modalities. The dataset was partitioned into training and testing subsets at an 8:2 ratio, and a 5-fold cross-validation strategy was adopted. To adapt to the dataset’s 6-class emotion classification setting, the classifier of the proposed model was modified accordingly.
For the SEED-IV dataset, only the eye-tracking branch of the proposed hybrid model was used, with EEG signals excluded. We modified the classifier’s architecture and performed 4-class sentiment classification strictly in accordance with the dataset’s original annotations. The same 8:2 train–test split and 5-fold cross-validation protocol were employed for consistency.
For the AffectNet dataset, we used only the facial image branch of the proposed model. We modified the proposed model’s classifier and performed eight-class emotion classification using the original annotations of the AffectNet dataset.
To ensure fair comparison, all basic experimental hyperparameters and preprocessing pipelines were kept consistent: learning rate = 0.001, batch size = 32, epochs = 50, optimizer = Adam, and loss function = cross-entropy. Eye-tracking data were temporally aligned and normalized to [0, 1]. Facial images were resized to 224 × 224 and normalized.
5.4.2. Baseline Comparison Setup
For each dataset, all the comparison methods and the proposed model were evaluated under identical experimental settings. For the AFFEC dataset, the baseline models were SVM and LightGBM, using both eye tracking and facial image modalities. For the SEED-IV dataset, the baseline models were SVM and AAFST, using only eye-tracking data. For the AffectNet dataset, the baseline models were SVM and VGG16, using only facial images. Furthermore, only the specific parameters of the models were optimized, while all shared experimental parameters were kept unchanged.
To improve the rigor of the evaluation, we adopt accuracy, macro-F1 score, per-class accuracy, standard deviation (Std) over 5-fold cross-validation, and paired t-test for statistical significance as comprehensive metrics. The overall comparative results are shown in Table 4, and the detailed per-class performance for each emotional category is presented in Table 5.
Table 4.
Comparative experiments results.
Table 5.
Per-class recognition performance on different datasets.
The results in Table 4 show that the proposed model achieved the highest accuracy and macro-F1 scores across all three public datasets, with low standard deviations; the performance improvement was statistically significant (p < 0.05). As shown in Table 5, the proposed model also achieves stable, superior performance across individual emotion categories without obvious bias, further confirming its robustness and balance. These results confirm that the proposed model performs consistently and effectively across general emotion recognition tasks, providing reasonable support for its potential extension to emotion recognition in novice drivers.
5.5. Comparative Experimental Results
In recent years, most researchers have employed CNN, Bi-LSTM, and other continuously evolving deep learning algorithms. These algorithms are used in emotion recognition studies involving various physiological signals. However, there is a lack of methodological updates. It is especially true for eye-movement signals and other modalities. To objectively evaluate the model’s performance, we compared it with several deep learning methods. The results are shown in Table 6. The results demonstrate that our method outperforms existing methods in multimodal signal emotion recognition studies.
Table 6.
Comparison of emotion recognition methods.
6. Discussion
Eye-movement data and facial expression images are two essential modalities in emotion recognition. Eye-movement data reflect the individual’s attention allocation and visual information processing in emotional states, whereas facial expression images are intuitive outward expressions of emotion. By combining the two, emotions can be analyzed and judged from multiple perspectives, leading to more accurate recognition of emotional states. The multimodal approach can fully leverage the complementarity among modalities, thereby overcoming the limitations of a single modality and enhancing the accuracy and reliability of emotion recognition.
The experimental results demonstrate that combining multiple methods significantly improves emotion recognition performance. In the multimodal experiments, the combination of a Bi-LSTM and a Transformer encoder performs best. Its accuracy reached 0.9872. This indicates that combining these models can leverage their respective advantages. Moreover, this combination synergistically enhances emotion recognition. After removing the Bi-LSTM module, the accuracy and F1-score further decreased. This reveals the strong connection between the temporal nature of emotion recognition and the evolution of eye-movement data. The Bi-LSTM module captures historical dependencies and future context through its forward and backward pathways, respectively, enabling the model to trace antecedents and predict consequences via its bidirectional gating mechanism. The ability of Bi-LSTM to capture dynamic temporal features is crucial for unlocking emotional cues from eye-movement data. In summary, the combination of Bi-LSTM and Transformer encoder performs well in both multimodal and unimodal emotion recognition. The experimental results offer a novel and effective solution for emotion recognition.
This study still has certain limitations, including a limited research sample. The novice drivers selected in this experiment are all young people aged 18–25. The narrow age range and limited cultural diversity of the samples limit the generalizability of the research conclusions. Second is the limitation of emotional stimulus materials. This experiment presented common stimulus types in driving scenarios, without considering unpredictable and stressful scenes that occur in real driving. Third is the limitation of the model application. The emotion recognition model designed in this paper was only verified in a laboratory simulation environment and has not been tested in real driving scenarios. The model’s adaptability and stability in complex, dynamic driving scenes still need further verification.
This study focuses on novice drivers aged 18–25. This group is energetic and quick to learn new things, but tends to experience greater emotional fluctuations, weaker risk perception, and stronger emotional responses to sudden stimuli. For young and middle-aged novice drivers aged 26–35 with relatively rich social experience, their emotional responses to audio stimuli may be milder. For middle-aged and elderly novice drivers over 36, cognitive ability and response speed decline, and they may exhibit delayed emotional responses to high-frequency, high-intensity audio stimuli. Therefore, the emotion recognition model proposed in this paper may exhibit lower recognition accuracy in these groups.
The average processing time of the multimodal model per batch of samples is 29.42 ms, with a fluctuation range of ±0.08 ms. Under the hybrid inference mode, the average processing time per sample is 0.9230 ms, with a fluctuation range of ±0.0014 ms. From the perspective of real-time processing requirements, in real driving scenarios, the driver emotion recognition system must respond to changes in the driver’s emotions within milliseconds to ensure timely early warning and intervention. The model proposed in this paper has low inference latency and high stability, and its processing time is lower than the 100–200 ms delay threshold generally required for human–computer interaction in driving scenarios, meeting the real-time requirements in real driving environments.
However, deploying the model in real driving environments still poses several challenges: First is the impact of perceptual noise. Perceptual noise, such as illumination changes, drivers’ head movements, and facial occlusions present in natural driving environments, may interfere with the extraction accuracy of eye movement and facial expression features, thereby affecting the stability of the model’s emotion recognition. Second is deployment constraints. The computing resources of in-vehicle embedded platforms are limited, imposing strict constraints on the model’s size, power consumption, and parallel computing capabilities. In addition, the real driving environment is highly dynamic and complex. Interference factors, such as sudden traffic incidents and changing road conditions, may increase uncertainty in assessing the driver’s emotional state, placing greater demands on the model’s robustness.
Despite the above deployment constraints, the model’s extremely low inference latency and stable performance still endow it with high practical application potential. By appropriately compressing and lightweight-optimizing the model and adding preprocessing steps to remove perceptual noise, the model’s adaptability to in-vehicle embedded platforms can be further improved. In summary, after targeted optimization, the multimodal emotion recognition model proposed in this paper is feasible for deployment in real driving environments, enabling real-time driver emotion recognition.
7. Conclusions
In this paper, we analyze the emotional states of novice drivers by combining eye-tracking technology and facial expression image analysis to reduce accident risks. Novice drivers are emotionally vulnerable in unexpected situations due to their limited driving experience, underscoring the need to understand their emotional states for road safety. We collected both subjective questionnaire data and objective eye-tracking data and proposed a hybrid deep neural network that fuses ViT, Bi-LSTM, and Transformer. This model achieves 98.72% accuracy in five-category emotion classification for novice drivers and outperforms baseline methods.
To further validate the universal superiority of the proposed architecture, we conducted extensive experiments on three public affective datasets (AFFEC, SEED-IV, and AffectNet). It should be emphasized that these are general non-driving datasets, as no dedicated novice driver emotion dataset is publicly available to date. We strictly adhered to the original labels and settings for each dataset (six-class for AFFEC, four-class for SEED-IV, and eight-class for AffectNet) without any label modifications. The proposed model achieves superior, statistically significant performance across all three datasets, verifying its universal effectiveness in general affective recognition. However, these results only support the model’s potential extensibility to driving tasks, rather than its direct scenario-specific validity.
Based on the limitations and achievements of the present study, further research will be conducted in the following areas. First, the sample size will be expanded and the sample structure optimized. Novice drivers across age groups (18–60 years old) will be included, covering young, middle-aged, and elderly drivers. Meanwhile, samples from diverse cultural backgrounds will be introduced to improve the universality of the research conclusions. Second, the emotional stimulus materials will be enriched. Based on auditory and visual stimuli, spontaneous emotional induction will be incorporated to fully simulate emotional triggers in real driving scenarios, thereby enhancing the authenticity and practicality of the experimental results. Third, the emotion recognition model will be optimized to improve its performance. After embedding the model into the vehicle-mounted system for real-environment testing, preprocessing steps will be added to suppress perceptual noise and enhance the model’s anti-noise capability. The model will be further improved based on real driving test results, and it will be re-embedded into the vehicle-mounted system for real-environment testing again.
Author Contributions
Conceptualization, Y.Y.; Methodology, Y.Y., Z.D. and P.D.; Software, Y.Y. and P.D.; Validation, Y.Y.; Formal Analysis, Y.Y.; Investigation, Y.Y., Z.D. and P.D.; Data Curation, Y.Y.; Writing—Original Draft Preparation, Y.Y.; Writing—Review and Editing, J.L.; Visualization, Y.Y.; Supervision, J.L.; Project Administration, J.L. All authors have read and agreed to the published version of the manuscript.
Funding
This research received no external funding.
Institutional Review Board Statement
This study was conducted in accordance with the Declaration of Helsinki and approved by the Institutional Review Board of Baoji University of Arts and Sciences (Approval No.: [BJWL-2025-ETH-048]; Approval Date: 7 January 2025).
Data Availability Statement
The datasets used and/or analysed during the current study are available from the corresponding author on reasonable request.
Acknowledgments
During the research and writing of this paper, we would like to express our sincere gratitude to all those who have offered their kind assistance. We are grateful for the excellent experimental environment and favorable conditions provided by our university. We deeply appreciate the meticulous guidance from our teachers. We also extend our gratitude to our group members for their support and collaboration. Finally, we would like to thank the reviewers for their valuable comments and constructive suggestions.
Conflicts of Interest
The authors declare no conflicts of interest.
References
- Field, T. Emotion Recognition Deficits: A Narrative Review. J. Psychiatry Res. Rep. 2025, 2, 1–6. [Google Scholar]
- Standiford, B.J.; Hsu, K.J. Autistic traits, alexithymia, and emotion recognition of human and anime faces. Dev. Psychopathol. 2025, 38, 33–46. [Google Scholar] [CrossRef] [Scilit]
- Salloum, S.A.; Alomari, K.M.; Alfaisal, A.M.; Aljanada, R.A.; Basiousni, A. Emotion recognition for enhanced learning: Using AI to detect students’ emotions and adjust teaching methods. Smart Learn. Environ. 2025, 12, 21. [Google Scholar] [CrossRef] [Scilit]
- Hegde, P.; Mukkamala, S.B.; Jyothi, A.P. Intelligent Techniques for Emotion Recognition in Social Media and Business Applications. In Intelligent Techniques for Emotion Recognition in Social Media and Business Applications; IGI Global: Palmdale, PA, USA, 2025; pp. 219–236. [Google Scholar]
- Xiang, G.; Yao, S.; Wu, X.; Deng, H.; Wang, G.; Liu, Y.; Li, F.; Peng, Y. Driver multi-task emotion recognition network based on multi-modal facial video analysis. Pattern Recognit. 2025, 161, 111241. [Google Scholar] [CrossRef] [Scilit]
- Wang, Q.; Zhu, F.; Dang, R.; Wei, X.; Han, G.; Huang, J.; Hu, B. An eye tracking investigation of attention mechanism in driving behavior under emotional issues and cognitive load. Sci. Rep. 2023, 13, 16963. [Google Scholar] [CrossRef] [Scilit]
- Li, S.; Wang, J.; Tian, L.; Wang, J.; Huang, Y. A fine-grained human facial key feature extraction and fusion method for emotion recognition. Sci. Rep. 2025, 15, 6153. [Google Scholar] [CrossRef] [Scilit]
- Akshay, S.; Abhishek, M.B.; Sudhanshu, D.; Anuvaishnav, C.D. Drowsy driver detection using eye-tracking through machine learning. In Proceedings of the 2021 Second International Conference on Electronics and Sustainable Communication Systems (ICESC), Coimbatore, India, 4–6 August 2021; Curran Associates, Inc.: Red Hook, NY, USA, 2021; pp. 1916–1923. [Google Scholar]
- Hafetz, J.; Felkins, J.; Allston, A.; Mann, H.; Long, D.L.; Ford, C.A.; McDonald, C.C. The effectiveness of behavioural interventions on young, novice drivers’ motor vehicle crash risk: A systematic review. J. Transp. Health 2025, 43, 102045. [Google Scholar] [CrossRef] [Scilit]
- Federal Motor Carrier Safety Administration. 2023 Pocket Guide to Large Truck and Bus Statistics; U.S. Department of Transportation: Washington, DC, USA, 2024. [Google Scholar]
- Akula, A.; Budha, G.; Bingi, G.; Chanda, U.; Borra, A.R.; Yadav, D.B.; Saravanan, M. Emotion Recognition from Facial Expressions Using CNNs. Int. J. Eng. Ext. Technol. Res. IJEETR 2026, 8, 120–125. [Google Scholar]
- Khare, S.K.; Blanes-Vidal, V.; Nadimi, E.S.; Acharya, U.R. Emotion recognition and artificial intelligence: A systematic review (2014–2023) and research recommendations. Inf. Fusion 2024, 102, 102019. [Google Scholar] [CrossRef] [Scilit]
- Gu, Q.; Chi, J.; Zhang, C.; Cao, B.; Liu, J.; Wang, Y. Temporal Capsule Feature Network for Eye-Tracking Emotion Recognition. Brain Sci. 2025, 15, 1343. [Google Scholar] [CrossRef] [Scilit] [PubMed]
- Guo, X.; Jia, H.; Huang, Q.; Luo, Q.; Wang, N.; Mao, Z. A vehicle driving intention prediction method based on gated dual tower transformer model for autonomous driving. Expert Syst. Appl. 2025, 285, 128000. [Google Scholar] [CrossRef] [Scilit]
- Romeo, Z.; Fusina, F.; Semenzato, L.; Bonato, M.; Angrilli, A.; Spironelli, C. Comparison of slides and video clips as different methods for inducing emotions: An electroencephalographic alpha modulation study. Front. Hum. Neurosci. 2022, 16, 901422. [Google Scholar] [CrossRef] [Scilit]
- Tarnowski, P.; Kołodziej, M.; Majkowski, A.; Rak, R.J. Eye-tracking analysis for emotion recognition. Comput. Intell. Neurosci. 2020, 2020, 2909267. [Google Scholar] [CrossRef] [Scilit]
- Lee, C.L.; Pei, W.; Lin, Y.C.; Granmo, A.; Liu, K.H. Emotion detection based on pupil variation. Healthcare 2023, 11, 322. [Google Scholar] [CrossRef] [Scilit]
- Partala, T.; Surakka, V. Pupil size variation as an indication of affective processing. Int. J. Hum.-Comput. Stud. 2003, 59, 185–198. [Google Scholar] [CrossRef] [Scilit]
- Chen, X.; Tao, X. An emotion recognition method based on multimodal physiological signal feature fusion. Comput. Simul. 2023, 40, 175–181+186. [Google Scholar]
- Said, Y.; Barr, M. Human emotion recognition based on facial expressions via deep learning on high-resolution images. Multimed. Tools Appl. 2021, 80, 25241–25253. [Google Scholar] [CrossRef] [Scilit]
- Savchenko, A.V.; Savchenko, L.V.; Makarov, I. Classifying emotions and engagement in online learning based on a single facial expression recognition neural network. IEEE Trans. Affect. Comput. 2022, 13, 2132–2143. [Google Scholar] [CrossRef] [Scilit]
- Zhang, J.; Zheng, K.; Mazhar, S.; Fu, X.; Kong, J. Trusted emotion recognition based on multiple signals captured from video. Expert Syst. Appl. 2023, 233, 120948. [Google Scholar] [CrossRef] [Scilit]
- Yang, Y.; Gao, Q.; Song, Y.; Song, X.; Mao, Z.; Liu, J. Investigating of deaf emotion cognition pattern by EEG and facial expression combination. IEEE J. Biomed. Health Inform. 2021, 26, 589–599. [Google Scholar] [CrossRef] [Scilit]
- Tsalamlal, Y.; Amorim, M.A.; Martin, J.C.; Ammi, M. Modeling emotional valence integration from voice and touch. Front. Psychol. 2018, 9, 1966. [Google Scholar] [CrossRef] [Scilit] [PubMed]
- Wu, M.; Su, W.; Chen, L.; Pedrycz, W.; Hirota, K. Two-stage fuzzy fusion based-convolution neural network for dynamic emotion recognition. IEEE Trans. Affect. Comput. 2020, 13, 805–817. [Google Scholar] [CrossRef] [Scilit]
- Sekiavandi, M.J.; Dixen, L.; Fimland, J.; Desu, S.K.; Zserai, A.B.; Lee, Y.S.; Barrett, M.; Burelli, P. AFFEC: Advancing Face-to-Face Emotion Communication Dataset; Zenodo: Geneva, Switzerland, 2025. [Google Scholar]
- Wei-Long, Z.; Wei, L.; Yifei, L.; Bao-Liang, L.; Cichocki, A. EmotionMeter: A multimodal framework for recognizing human emotions. IEEE Trans. Cybern. 2019, 49, 1110–1122. [Google Scholar]
- Mollahosseini, A.; Hasani, B.; Mahoor, M.H. Affectnet: A database for facial expression, valence, and arousal computing in the wild. IEEE Trans. Affect. Comput. 2017, 10, 18–31. [Google Scholar] [CrossRef] [Scilit]
- Ghous, G.; Najam, S.; Jalal, A. Human emotion recognition from EEG-brain signals using enhanced machine learning method. In Proceedings of the 2025 6th International Conference on Advancements in Computational Sciences (ICACS), Lahore, Pakistan, 18–19 February 2025; pp. 1–7. [Google Scholar]
- Wagh, A.; Dongare, M.; Nadhe, V.; Kulkarni, O.; Patil, R.; Kaur, G. Robust Facial Expression Recognition with VGG16: Large-Scale Training and Cross-Dataset Validation on AffectNet and FER2013. In Proceedings of the 2025 2nd Asia Pacific Conference on Innovation in Technology (APCIT), Mysore, India, 19–20 September 2025; pp. 1–7. [Google Scholar]
- Bao, J.; Tao, X.; Zhou, Y. An emotion recognition method based on eye movement and audiovisual features in MOOC learning environment. IEEE Trans. Comput. Soc. Syst. 2022, 11, 171–183. [Google Scholar] [CrossRef] [Scilit]
- Fu, B.; Gu, C.; Fu, M.; Xia, Y.; Liu, Y. A novel feature fusion network for multimodal emotion recognition from EEG and eye movement signals. Front. Neurosci. 2023, 17, 1234162. [Google Scholar] [PubMed]
- Algarni, M.; Saeed, F.; Al-Hadhrami, T.; Ghabban, F.; Al-Sarem, M. Deep learning-based approach for emotion recognition using electroencephalography (EEG) signals using bi-directional long short-term memory (Bi-LSTM). Sensors 2022, 22, 2976. [Google Scholar] [CrossRef] [Scilit]
- Chen, T.; Cai, C.; Yuan, X.; Luo, B. A multimodal emotion recognition method based on multiscale convolution and self-attentive feature fusion. Comput. Appl. 2024, 44, 369–376. [Google Scholar]
- Hosseini, M.S.K.; Firoozabadi, S.M.; Badie, K.; Azadfallah, P. Personality-based emotion recognition using EEG signals with a CNN-LSTM network. Brain Sci. 2023, 13, 947. [Google Scholar] [CrossRef] [Scilit]
- Devarajan, K.; Ponnan, S.; Perumal, S. Enhancing Emotion Recognition Through Multi-Modal Data Fusion and Graph Neural Networks. Intell.-Based Med. 2025, 2025, 100291. [Google Scholar] [CrossRef] [Scilit]

Disclaimer/Publisher’s Note: The statements, opinions and data contained in all publications are solely those of the individual author(s) and contributor(s) and not of MDPI and/or the editor(s). MDPI and/or the editor(s) disclaim responsibility for any injury to people or property resulting from any ideas, methods, instructions or products referred to in the content. |
© 2026 by the authors. Licensee MDPI, Basel, Switzerland. This article is an open access article distributed under the terms and conditions of the Creative Commons Attribution (CC BY) license.