


Abstract
Indoor coverage infrastructure plays an important role in maintaining reliable LTE/5G services in shielded and structurally complex environments where outdoor macro-cell signals are strongly affected by penetration loss and internal attenuation. However, indoor coverage solutions are commonly evaluated using spatial measurements or short-duration before/after comparisons, while considerably less attention is given to their temporal interaction with the surrounding operational mobile network. This study presents a longitudinal operator-side assessment of LTE/5G network performance and stability during the successive activation of indoor coverage infrastructure. The experimental campaign was organized into three consecutive operational stages: a baseline state with both coverage-enhancement components inactive, a first intervention state following activation of the distributed indoor coverage component, and a final combined state after activation of the second localized coverage component. Temporally resolved operator OSS records were retained in chronological order and evaluated using a common staged framework. The analysis combined stage-wise descriptive statistics with segmented interrupted time-series regression, accounting for temporal trends, network-load variations, and serial dependence. The analysis focused on complementary network-side indicators representing the uplink radio environment, user-plane traffic dynamics, and 5G connectivity, including LTE and NR uplink interference, downlink and uplink PDCP volume, and the SgNB Add Success Rate. Across Stages 1–3, mean LTE uplink-interference levels were −108.20, −109.22, and −108.85 dBm, respectively, while the corresponding NR values were −110.35, −111.59, and −111.05 dBm. Although intervention-associated changes were identified in the statistical models, the baseline-derived persistence assessment detected no continuous adverse threshold exceedances lasting 24 h or longer during the post-baseline stages. PDCP traffic showed pronounced short-term fluctuations and progressively different stage-wise averages, demonstrating that network utilization changed during the observation period and providing essential temporal context for interpretation of the other KPIs. The mean SgNB Add Success Rate remained above 99.8% in all three stages and reached 99.92% in the final combined state, where its variability was also the lowest. Although transient KPI deviations occurred during the monitoring period, they did not develop into a consistent pattern of persistent deterioration across the monitored radio and connectivity indicators. The findings demonstrate the value of combining longitudinal operator-side KPI monitoring with segmented time-series analysis and explicit stability criteria. The study provides a structured assessment of staged indoor infrastructure deployment while recognizing the limitations of causal inference from single-site observational data.
1. Introduction
The continued development of fourth- and fifth-generation mobile networks has increased expectations for ubiquitous connectivity, high data rates, and reliable service continuity. Nevertheless, indoor environments remain challenging for cellular network operation because radio signals transmitted from outdoor base stations are affected by building penetration loss, structural attenuation, multipath propagation, and the geometry of enclosed spaces. Measurement-based investigations of operational 5G networks have demonstrated that outdoor-to-indoor propagation can substantially affect received signal characteristics and service performance [1]. At 3.5 GHz, building penetration loss has also been shown to depend on façade characteristics, polarization, and incidence angle, further complicating reliable indoor coverage prediction [2]. These effects become particularly important in shielded and structurally complex environments such as underground facilities, stairwells, tunnels, and elevator shafts [3,4,5,6].
Dedicated indoor radio infrastructure is therefore increasingly used to complement outdoor macro-cell coverage. Distributed antenna systems (DAS), radio-over-fiber (RoF) architectures, repeaters, small cells, and related solutions can redistribute cellular signals within buildings and other environments where direct macro-cell penetration is insufficient. Fibre-wireless DAS architectures are particularly relevant because radio services can be transported over optical infrastructure and distributed to remote radio points while maintaining centralized signal delivery. Previous studies have demonstrated fibre-wireless DAS concepts for 5G and beyond [7], coordinated architectures involving cellular-over-fiber and distributed indoor systems [8], RoF-based indoor 5G coverage extension [9], and integration of 5G radio transmission with gigabit passive optical networks (GPON) [10]. Advanced RoF-based DAS architectures have additionally been investigated for higher-frequency 5G and beyond-5G services [11].
However, the effectiveness of indoor coverage infrastructure should not be evaluated exclusively in terms of local signal enhancement. Conventional assessments often emphasize user-side radio and service indicators, including reference signal received power (RSRP), signal quality, signal-to-interference-plus-noise ratio (SINR), and uplink or downlink throughput. These metrics are essential for determining whether previously underserved indoor areas obtain usable cellular service, but they represent only one perspective on the consequences of network intervention. Recent field studies have therefore broadened the evaluation of indoor solutions by comparing commercial repeaters with emerging technologies [12] and by examining the performance of outdoor macro coverage, DAS, Wi-Fi, and neutral-host solutions in operational indoor environments [13].
An additional concern is the interaction between indoor enhancement equipment and the surrounding operational radio access network. Repeaters and distributed radio infrastructure retransmit or redistribute signals within an already active cellular environment, making interference, coordination, mobility, and network stability important considerations. The development of network-controlled repeaters has consequently emphasized tighter interaction between the repeater and the serving network, including mechanisms intended to improve controllability and mitigate undesirable radio effects [14,15]. Thus, a successful indoor deployment should ideally satisfy two requirements simultaneously: it should improve service availability in the target indoor area while avoiding persistent degradation of the surrounding operator network.
This issue cannot always be adequately evaluated using isolated measurements obtained immediately before and after equipment activation. Operational LTE/5G networks are inherently time varying, and measured performance can change with mobility, traffic conditions, radio environment, user distribution, network configuration, and other operational factors. Measurement campaigns in commercial 5G networks have demonstrated substantial variability in coverage and service performance under real operating conditions [16,17,18]. Long-duration investigations further show that network performance may evolve over extended periods, making temporal context important when interpreting observed differences between network states [19].
The temporal perspective becomes particularly important when indoor infrastructure is introduced in successive deployment stages. A conventional two-state comparison can reveal differences between an initial and final configuration, but it provides limited information about when changes emerge, whether they persist, and whether the observed fluctuations exceed the ordinary variability of the operational network. Studies based on extended 4G/5G traces have demonstrated the value of temporal analysis for characterizing bandwidth dynamics and handoff behavior [20], while measurement-based approaches to network KPI extraction provide additional means of evaluating operational network behavior beyond isolated user-side measurements [21]. KPI-oriented assessment frameworks also provide a basis for interpreting 5G performance across multiple dimensions rather than through a single radio metric [22,23].
Existing research therefore provides substantial knowledge about indoor propagation, DAS and RoF architectures, repeaters, and commercial 5G performance. However, these research directions are often considered separately. Indoor DAS and RoF studies predominantly focus on coverage extension, system architecture, optical-radio integration, or user-side performance [7,8,9,10,11]. Repeater-oriented research increasingly addresses coordination and interference-related issues [12,14,15], whereas commercial-network studies demonstrate that LTE/5G performance can exhibit considerable temporal and operational variability [16,17,18,19,20,21]. Comparatively less attention has been devoted to the longitudinal operator-side assessment of LTE/5G network behavior across successive stages of indoor coverage infrastructure deployment, particularly when the objective is to determine whether infrastructure activation is accompanied by persistent changes in network performance and stability.
Accordingly, the aim of this study is to evaluate the temporal behavior and stability of operational LTE/5G network performance indicators during a staged deployment of indoor coverage infrastructure. Rather than treating deployment as a single before/after event, the analysis considers successive infrastructure states and examines how network indicators evolve across these stages. Particular attention is given to indicators associated with accessibility, retainability, mobility, throughput, and radio-interference behavior. The analysis is intended to determine whether changes observed during and after infrastructure activation are distinguishable from the temporal variability already present in the operational network.
The main contributions of this study are fourfold. First, indoor coverage infrastructure deployment is examined as a multi-stage intervention, allowing network behavior to be evaluated across successive operational states rather than through a single endpoint comparison. Second, the assessment emphasizes longitudinal operator-side LTE/5G indicators, complementing conventional user-equipment-based coverage measurements. Third, multiple dimensions of network operation—including accessibility, retainability, mobility, throughput, and interference-related behavior—are considered within a common temporal framework. Finally, the study evaluates whether indoor coverage enhancement can be introduced without evidence of persistent adverse changes in the monitored operational network, while distinguishing temporal associations from causal effects that cannot be established solely from observational network data.
2. Literature Review
2.1. Indoor Propagation Challenges in LTE and 5G Networks
Reliable indoor cellular coverage remains a persistent challenge despite the continued densification and technological evolution of LTE and 5G networks. Outdoor-to-indoor propagation introduces additional attenuation mechanisms that are not fully represented by conventional outdoor coverage indicators. Measurements conducted in operational mid-band 5G networks have shown that building entry loss and indoor propagation conditions can substantially alter the received signal level and consequently affect service availability inside buildings [1]. At 3.5 GHz, experimental investigations have further demonstrated that penetration loss is influenced not only by the construction material but also by the polarization and incidence angle of the incoming radio wave [2]. These dependencies make indoor coverage difficult to infer solely from outdoor radio conditions.
The problem becomes more pronounced in structurally complex and electromagnetically confined environments. Underground facilities introduce multiple propagation mechanisms associated with reinforced concrete, limited openings, irregular geometry, and strong multipath components [3]. Similar challenges have been reported for stairwells and other enclosed building structures, where propagation characteristics vary considerably with frequency and spatial configuration [4]. Tunnel environments represent another important class of confined propagation scenarios, in which waveguiding effects and geometry can substantially modify conventional terrestrial propagation behavior [5]. Elevator shafts constitute an especially challenging vertical propagation environment because the combination of metallic structures, shaft geometry, and elevator-car movement creates propagation conditions that differ from those of conventional rooms and corridors [6].
These findings indicate that poor indoor service cannot generally be attributed to a single propagation mechanism. Instead, indoor coverage is determined by a combination of building penetration loss, internal attenuation, multipath propagation, spatial geometry, and the frequency bands used by the mobile network. This becomes increasingly relevant for 5G systems operating at mid-band and higher frequencies, where the available outdoor signal may not guarantee sufficient indoor coverage. Consequently, dedicated indoor infrastructure is often required when reliable service must be maintained in shielded or deeply indoor locations.
2.2. Distributed Antenna Systems and Radio-over-Fiber Architectures
Distributed antenna systems represent one of the established approaches for extending cellular coverage into areas where macro-cell signals are insufficient. Instead of relying on a single high-power indoor transmitter, a DAS distributes radio signals among multiple spatially separated antenna points, allowing the radio service to be delivered closer to users. Fibre-wireless architectures further extend this concept by transporting radio signals over optical links between centralized and remote elements. Such architectures have been investigated as a means of supporting heterogeneous 5G and prospective 6G services while maintaining flexible radio distribution [7].
The evolution of indoor systems also reflects a broader trend toward coordinated and distributed radio architectures. Coordinated approaches can improve the interaction among multiple radio points and potentially reduce limitations associated with isolated indoor coverage nodes [8]. For indoor 5G specifically, RoF-based DAS has been experimentally investigated as a mechanism for extending coverage while maintaining centralized radio-signal transport [9]. The integration of radio-over-fiber with passive optical access infrastructure is particularly relevant because existing or newly deployed fiber networks can potentially support both conventional data services and radio-signal distribution.
GPON-based radio transport is one example of such convergence. Experimental research has demonstrated the integration of a 5G transceiver with GPON using RoF technology, showing the technical feasibility of transporting advanced radio waveforms over passive optical infrastructure [10]. Other RoF-based investigations have extended the concept toward higher-frequency 5G and beyond-5G services [11]. Collectively, these studies demonstrate the technological feasibility of optical-radio convergence; however, feasibility at the transmission-system level does not by itself establish how an installed indoor system interacts with an operational cellular network over time.
2.3. Repeaters and Alternative Indoor Coverage Solutions
Repeaters provide another practical mechanism for extending mobile coverage into poorly served indoor areas. Unlike architectures requiring extensive radio distribution infrastructure, repeaters can receive an existing cellular signal and retransmit it within a target area. This can make them particularly attractive for localized coverage problems where deployment simplicity is important. At the same time, repeater operation requires careful consideration because amplification and retransmission occur within an already active radio environment.
Recent experimental work has compared commercial repeaters with emerging alternatives such as reconfigurable intelligent surfaces, demonstrating the continuing relevance of repeater-based solutions in practical indoor deployments [12]. Broader field comparisons have also considered DAS alongside outdoor macro coverage, Wi-Fi, and neutral-host solutions, illustrating that no single architecture is universally optimal for all indoor environments [13]. The appropriate solution therefore depends on building characteristics, existing infrastructure, service requirements, deployment complexity, and the desired degree of operator control.
The emergence of network-controlled repeaters reflects the need for tighter integration between coverage-extension equipment and the cellular network. Standardization-oriented studies have described mechanisms through which repeaters can obtain network assistance and operate with greater awareness of radio-access conditions [14]. Related work has emphasized the role of controllability and coordination in reducing undesirable effects and improving repeater integration into modern mobile systems [15]. These developments reinforce the view that indoor coverage equipment should be evaluated not only according to the signal gain experienced by individual users but also according to its behavior within the surrounding network.
2.4. Measurement-Based Evaluation of Operational 4G/5G Networks
Field measurements are essential for evaluating cellular systems because operational networks are affected by factors that are difficult to reproduce completely in simulations or analytical propagation models. Commercial 5G studies have revealed considerable differences in network performance depending on deployment configuration, radio conditions, mobility, device characteristics, and operator implementation [16,17,18]. Consequently, conclusions derived from short measurement campaigns or individual test locations may not fully characterize the behavior of an operational network.
Longer-term measurements provide an additional perspective. A year-long cross-sectional investigation of 5G uplink performance demonstrated that commercial-network behavior can evolve over time and can vary substantially across operators and deployment environments [19]. Similarly, extended 4G/5G traces have been used to investigate bandwidth evolution and handoff behavior, showing that temporal information can provide insight that is not available from isolated measurements [20].
This distinction is particularly important for indoor infrastructure evaluation. If measurements are collected only once before activation and once after activation, ordinary temporal network variability may be interpreted as an infrastructure-related effect. Conversely, a short-term measurement may fail to identify a change that develops or persists over a longer period. Longitudinal observations can therefore provide a more robust basis for distinguishing transient fluctuations from sustained changes associated with different network states.
2.5. Network-Side KPIs and Temporal Stability Assessment
Network performance cannot be represented by a single radio parameter. While RSRP, RSRQ, SINR, and user throughput are useful for characterizing the experience of individual devices, operator-side monitoring provides access to broader indicators describing network operation. Real-time KPI extraction studies have highlighted the importance of measurement granularity and data acquisition methods when evaluating 5G and beyond networks [21]. Standardized performance evaluations similarly demonstrate that 5G assessment involves multiple KPI dimensions rather than a single coverage or throughput metric [22,23].
For indoor infrastructure deployment, several groups of operational indicators are particularly relevant. Accessibility reflects the ability of users to establish services or connections, whereas retainability characterizes the ability to maintain established sessions. Mobility indicators provide information about handover behavior, and throughput-related indicators characterize the capacity delivered by the network. Interference-related measurements provide an additional perspective because indoor signal redistribution or amplification should not result in unacceptable deterioration of the surrounding radio environment.
A longitudinal interpretation of these indicators can be especially useful when infrastructure is deployed in successive stages. Rather than asking only whether the average KPI value changed between two selected periods, the analysis can examine temporal trajectories, variability within each deployment stage, transitions between stages, and the persistence of any observed deviations. Such an approach provides a more complete description of operational stability and reduces reliance on individual measurement snapshots.
2.6. Research Gap and Positioning of the Present Study
The reviewed literature demonstrates substantial progress in understanding indoor propagation [1,2,3,4,5,6], fibre-wireless DAS and RoF architectures [7,8,9,10,11], repeater-based coverage enhancement [12,14,15], and the behavior of commercial LTE/5G networks under real operating conditions [16,17,18,19,20]. In parallel, KPI-oriented studies provide methodologies for evaluating cellular performance across multiple network dimensions [21,22,23].
Nevertheless, these research directions are still only partially integrated. Indoor coverage studies commonly emphasize propagation characteristics, received signal improvement, or user-side throughput, whereas long-term commercial-network studies typically investigate broader network evolution without focusing on a controlled sequence of indoor infrastructure activation stages. Comparatively limited attention has therefore been paid to the longitudinal operator-side behavior of LTE/5G networks during staged indoor coverage enhancement, where different infrastructure components are activated sequentially and the corresponding KPI trajectories are observed over time.
Beyond indoor radio coverage, network architecture and traffic management are important considerations in the assessment of communication-system performance. Kanellopoulos et al. [24] reviewed networking architectures and communication protocols for IoT applications in smart cities, highlighting the heterogeneous communication requirements of smart buildings, transportation systems, and other connected services. Their review provides a broader architectural perspective on network reliability and service requirements, although it does not specifically investigate longitudinal operator-side LTE/5G KPIs during indoor infrastructure deployment.
Kanellopoulos and Sharma [25] examined dynamic load-balancing techniques in IoT environments, including cloud and edge/fog networking paradigms. Their review emphasizes the importance of workload distribution, resource utilization, congestion management, and QoS. These considerations are relevant to the present study because changes in network traffic may influence operational performance indicators independently of infrastructure activation.
However, architectural reviews and load-balancing surveys address different research questions from those examined here. The present study focuses on hourly operational LTE/5G measurements collected across three successive indoor infrastructure states and evaluates temporal KPI behavior while considering observed traffic-load variations. Thus, the proposed assessment complements existing architecture- and resource-management-oriented research rather than introducing a new IoT networking architecture or load-balancing algorithm. A comparative summary of the relevant research directions, their main contributions, and their limitations in relation to the present study is provided in Table 1.
Table 1.
Comparison of related research directions and their relevance to longitudinal LTE/5G network assessment.
The present study addresses this gap by treating indoor infrastructure deployment as a sequence of operational states rather than a single before/after intervention. Operator-side LTE/5G indicators are evaluated across these stages to characterize temporal variation and determine whether infrastructure activation coincides with persistent changes in accessibility, retainability, mobility, throughput, or interference-related behavior. This positioning complements conventional user-side coverage measurements and provides a network-level perspective on the operational stability of staged indoor coverage enhancement.
3. Materials and Methods
3.1. Study Design and Experimental Framework
The present study was designed as a longitudinal operator-side assessment of an indoor cellular coverage deployment implemented through successive infrastructure states. In contrast to a conventional two-state before/after experiment, the analysis was structured around three operational stages representing different configurations of the indoor coverage infrastructure. This design enabled the temporal behavior of the monitored LTE/5G network indicators to be examined before and during successive infrastructure activation stages.
The investigated deployment comprised two indoor coverage-enhancement components that were introduced sequentially during the monitoring period. The first component provided distributed cellular coverage within the target indoor environment, whereas the second addressed a localized coverage limitation associated with the elevator environment. The present analysis focuses on the temporal behavior and stability of the operational LTE/5G network across these successive infrastructure states rather than repeating the user-side OFF/ON coverage assessment reported in the related experimental work.
The methodological contribution of this study is a structured, stage-aware longitudinal multi-KPI evaluation procedure for assessing the network-level behavior associated with successive indoor coverage infrastructure activations. Unlike conventional before-and-after KPI comparisons, the procedure integrates documented intervention dates, temporally resolved operator-side measurements, and the joint interpretation of traffic, uplink interference, and 5G connectivity indicators. The contribution is not the development of a new statistical estimator, but the organization of complementary network indicators and established analytical techniques into a consistent evaluation workflow. Quantitative assessment of temporal stability and persistent KPI changes is treated as an essential component of this procedure.
The deployed GPON-RoF-DAS supported LTE FDD and 5G NR TDD in the 3600–3800 MHz range, with a remote-unit output power of 250 mW. The elevator repeater supported uplink bands of 885–915, 1710–1785, and 1920–1980 MHz and corresponding downlink bands of 930–960, 1805–1880, and 2110–2170 MHz. Its rated output power was 17 ± 2 dBm, with maximum gains of 70 dB and 60 dB for the master and remote units, respectively.
Operator-side monitoring was based on an extended set of LTE/NR key performance indicators (KPIs), including indicators associated with accessibility, retainability, mobility, traffic, throughput, and uplink interference. The available operator records also contained temporally resolved KPI observations, including hourly observations for selected indicators such as the SgNB Add Success Rate.
The evaluation workflow consists of five interconnected steps. First, hourly operator-side OSS measurements are collected and checked for temporal consistency. Second, each observation is assigned to one of the three operational stages using the documented infrastructure activation dates. Third, the temporal evolution of LTE and NR uplink interference, DL and UL PDCP traffic volumes, and the SgNB Add Success Rate is examined across the successive stages. Fourth, intervention-associated changes are evaluated using time-series methods that distinguish underlying trends from changes in KPI level and slope, while accounting for temporal dependence and variations in network traffic. Finally, the resulting estimates are interpreted jointly using quantitative stability and persistence criteria to assess whether the monitored network indicators exhibit sustained adverse changes.
As illustrated in Figure 1, the experimental framework integrates successive indoor infrastructure activation stages with operator-side LTE/5G performance monitoring. The deployment was divided into three consecutive operational states comprising a baseline condition, a first intervention state, and a combined infrastructure state. Throughout these stages, operator-side KPIs associated with accessibility, retainability, mobility, traffic, throughput, and uplink interference were monitored. The resulting time-series data provide the basis for evaluating KPI variability and network stability across the successive operational states.
Figure 1.
Conceptual framework of the staged indoor coverage deployment and longitudinal operator-side LTE/5G network assessment.
The present analysis focuses on the temporal behavior and stability of the operational LTE/5G network across these successive infrastructure states rather than repeating the user-side OFF/ON coverage assessment reported in the related experimental work [26].
3.2. Staged Infrastructure Deployment
The experimental campaign was organized into three consecutive operational stages, each representing a distinct configuration of the indoor coverage infrastructure. The stage boundaries were established according to the documented activation dates of the two coverage-enhancement components. This staged configuration provided a structured framework for examining the temporal response of the operational LTE/5G network under a baseline condition and after each successive infrastructure intervention. Rather than treating the deployment as a single before/after event, the three-stage design enabled the network indicators to be evaluated separately for each operational state.
During Stage 1 (24 April–3 May 2026), both coverage-enhancement components remained inactive. This interval was defined as the formal baseline period and was used to characterize the temporal behavior of the monitored LTE/5G network before the introduction of the investigated indoor coverage infrastructure. The KPI observations collected during this stage therefore provided the reference condition for subsequent stage-wise comparisons.
During Stage 2 (4–17 May 2026), the first coverage-enhancement component was activated, while the second component remained inactive. This configuration represented the first intervention state and enabled the monitored network indicators to be examined following the initial infrastructure activation. Maintaining the second component in the inactive state during this interval allowed Stage 2 to be distinguished from the subsequent combined configuration.
During Stage 3 (from 18 May 2026), the second coverage-enhancement component was activated while the first component remained operational. This established the combined infrastructure configuration and provided the third operational state for the longitudinal assessment. Comparison of the KPI behavior across Stages 1–3 therefore enabled the analysis to distinguish the baseline condition, the first intervention state, and the final combined state using the same operator-side monitoring framework.
The resulting stage definitions and infrastructure states are summarized in Table 2. These stage boundaries were subsequently applied consistently to the temporal visualization, descriptive statistical analysis, and comparison of the monitored network KPIs.
Table 2.
Operational stages of the indoor coverage infrastructure deployment.
3.3. Operator-Side Monitoring Dataset and KPI Selection
The network-side assessment was based on operator OSS monitoring data collected throughout the staged infrastructure deployment period. Unlike localized user-equipment measurements, operator-side monitoring provides a network-level perspective and enables the temporal behavior of multiple LTE/5G performance indicators to be evaluated over an extended observation period [21,22,23]. The monitoring records were therefore used to characterize network behavior before and after the successive activation of the indoor coverage infrastructure.
The study was conducted at a single indoor deployment site involving two sequentially activated coverage-enhancement components: a GPON-RoF-DAS system serving the investigated indoor area and a localized elevator repeater. The operator-side analysis was based on temporally resolved LTE/NR OSS KPI records associated with the investigated deployment environment. The available documentation does not establish the exact number and identifiers of the monitored LTE and NR cells; therefore, the dataset should not be interpreted as a multi-cell or multi-site sample.
The sample sizes reported for the three operational stages represent hourly temporal observations rather than independent base stations, cells, or deployment sites. Specifically, Stage 1 comprised 240 hourly observations, Stage 2 comprised 336 observations, and Stage 3 comprised 336 observations, yielding a total of 912 hourly observations. These measurements form a chronological time series and may exhibit temporal dependence. Accordingly, the number of hourly observations should not be interpreted as the number of statistically independent network elements.
The operator-side indicators retained for the present longitudinal analysis were organized into three functional KPI groups: traffic, uplink interference, and 5G connectivity. This functional grouping allows complementary aspects of operational LTE/5G network behavior to be examined within a common temporal framework rather than relying on a single performance metric [21,22,23]. Traffic indicators characterize changes in network utilization and load, while uplink-interference indicators were included to examine whether activation of the indoor coverage infrastructure was accompanied by persistent changes in the uplink radio environment. The 5G connectivity indicator was used to assess the stability of LTE/NR interaction across the successive deployment stages. These indicators were selected because temporally resolved observations were available consistently across the three deployment stages, enabling direct longitudinal and stage-wise comparison.
To preserve the temporal information contained in the monitoring dataset, the available KPI observations were retained in chronological order rather than being reduced directly to stage-level averages. Each observation was subsequently assigned to Stage 1, Stage 2, or Stage 3 according to its timestamp and the corresponding infrastructure configuration. This approach enables both within-stage variability and changes around the two infrastructure transition points to be examined in the subsequent longitudinal analysis.
The KPI groups listed in Table 3 provide complementary perspectives on operational LTE/5G network behavior. Operator-side KPI monitoring enables network performance to be assessed across multiple dimensions rather than relying exclusively on individual user-side radio measurements [21,22,23]. Accordingly, the subsequent analysis considers both the temporal evolution of individual KPIs and their variation across the three infrastructure deployment stages.
Table 3.
Operator-side LTE/5G KPIs included in the longitudinal analysis.
3.4. Data Processing and Statistical Analysis
The operator-side monitoring records were processed as time-ordered observations to preserve the temporal structure of the dataset. Each KPI record was assigned to one of the three deployment stages according to its timestamp and the corresponding operational state of the indoor coverage infrastructure. This stage labeling provided a common basis for comparing network behavior before and after the two infrastructure transitions.
For each KPI, descriptive statistics were calculated separately for the three deployment stages. The arithmetic mean was used to characterize the average KPI level within each stage and was calculated as
where the following abbreviations are used:
—the mean value of the KPI in stage;
—the -th observation within that stage;
—the number of observations assigned to the corresponding stage.
The standard deviation was calculated to characterize within-stage variability as
where appropriate, the median and interquartile range (IQR) were additionally considered to provide robust summaries for KPI distributions affected by skewness or short-term fluctuations. For suitable positive-valued indicators, the coefficient of variation (CV) was used as a normalized measure of temporal variability:
The longitudinal analysis was conducted at two complementary levels. First, KPI time series were examined to identify temporal trends, short-term fluctuations, and possible persistent changes around the two infrastructure transition points. Second, stage-wise KPI distributions were compared to determine whether the observed differences represented systematic shifts in network behavior or remained within the range of normal temporal variability.
To evaluate intervention-associated changes beyond descriptive stage-wise comparisons, a segmented interrupted time-series (ITS) regression model was specified for each primary stability indicator. The model included a continuous time trend, separate level-change indicators for the infrastructure activations on 4 May and 18 May 2026, and corresponding post-intervention slope-change terms. Hour-of-day and day-of-week effects were included to account for recurring temporal patterns. Downlink and uplink PDCP traffic volumes were incorporated as covariates to account for variations in network utilization. Regression coefficients were estimated with heteroskedasticity- and autocorrelation-consistent standard errors, and effect estimates were accompanied by 95% confidence intervals. Residual autocorrelation was assessed to identify limitations of the fitted model and guide additional robustness analyses.
To quantify temporal dependence, residual autocorrelation was evaluated using the lag-1 autocorrelation coefficient and the Ljung–Box test at lag 24. The segmented ITS models were estimated using heteroskedasticity- and autocorrelation-consistent (HAC) standard errors with a maximum lag of 24 h. As an additional robustness assessment, generalized least squares with first-order autoregressive errors (GLSAR-AR1) was applied to account explicitly for serial correlation. Intervention-associated level-change estimates obtained from the HAC and GLSAR-AR1 specifications were compared to evaluate the sensitivity of the findings to the treatment of temporal autocorrelation. Statistical significance was assessed at the 0.05 level, and the results were interpreted in conjunction with effect sizes, confidence intervals, and their engineering relevance.
Because consecutive OSS observations may exhibit temporal dependence, hourly measurements were not automatically treated as statistically independent samples. Temporal autocorrelation was therefore considered when interpreting stage-wise comparisons and statistical significance. Where substantial serial dependence was identified, the analysis was interpreted using time-dependent characteristics rather than relying solely on conventional independent-sample significance testing. This approach reduces the risk of overstating statistical evidence when a large number of temporally correlated observations are available.
Statistical results were interpreted together with the magnitude, persistence, and engineering relevance of the observed KPI changes. Consequently, a statistically detectable difference was not automatically interpreted as operationally significant. Conversely, the absence of a pronounced stage-wise shift was interpreted conservatively as no observable persistent degradation within the monitored indicators and observation period, rather than as evidence of zero network impact.
For the quantitative assessment of network stability, three complementary characteristics were considered: the magnitude of KPI changes relative to the baseline stage, within-stage variability, and the duration of adverse deviations. The direction of deterioration was defined separately for each KPI according to its operational meaning: increasing uplink interference and decreasing SgNB Add Success Rate were treated as potentially adverse changes. DL and UL PDCP volumes were interpreted as indicators of network utilization rather than direct measures of network degradation. Persistent degradation was distinguished from isolated fluctuations by examining whether adverse deviations remained sustained over consecutive observations and exceeded the variability expected under baseline operating conditions. The corresponding thresholds and persistence durations were to be specified and evaluated using the observed KPI distributions and temporal-dependence characteristics.
In this study, an adverse KPI excursion was defined as an hourly observation exceeding the corresponding baseline-derived threshold in the direction of performance deterioration. Temporal persistence was quantified as the maximum number of consecutive hourly adverse observations within each deployment stage. The assessment distinguished isolated and short-duration excursions from sustained adverse behavior by reporting their uninterrupted duration and comparing it with a 24 h observation window. The 24 h window was used as an analytical reference covering a complete daily operating cycle, rather than as an operator-defined service-quality limit. Consequently, the absence of excursions extending over a full daily cycle was interpreted as no evidence of day-long continuous threshold exceedance, not as proof that shorter periods of degradation were operationally insignificant.
All numerical processing, statistical calculations, and graphical visualization of the longitudinal KPI data were performed in MATLAB R2024b (MathWorks, Natick, MA, USA).
The same stage boundaries were applied consistently throughout the analysis to ensure comparability between the time-series visualization, descriptive statistics, variability assessment, and subsequent stage-wise evaluation.
Uplink interference was evaluated using hourly OSS statistics provided by the mobile network operator for the serving cells. The monitored parameter represents the operator-side uplink interference level for LTE and NR and was analyzed across the successive infrastructure stages. For each stage, the hourly observations were aggregated to characterize the mean interference level and its temporal variation.
In addition, spectrum monitoring was performed using an Anritsu MS2721B spectrum analyzer (Anritsu Corporation, Atsugi, Japan; 9 kHz–7.1 GHz) to check the uplink and downlink bands for unwanted emissions and signs of repeater self-oscillation.
4. Results
4.1. Longitudinal Behavior of Uplink Interference
Uplink interference was examined as one of the principal network-side indicators for evaluating the operational impact of the staged indoor coverage deployment. This indicator is particularly relevant because the introduction of indoor signal-distribution or amplification equipment may affect the uplink radio environment in the presence of undesirable coupling, excessive amplification, or unstable operation. Accordingly, the LTE and NR uplink-interference time series were evaluated across the three operational states defined in Table 2.
The longitudinal OSS records were analyzed using the formal stage boundaries of 24 April–3 May 2026 (Stage 1), 4–17 May 2026 (Stage 2), and from 18 May 2026 onward (Stage 3). Although the retained operator dataset contained observations preceding 24 April, these earlier records were excluded from the Stage 1 statistical comparison because the formally documented baseline period began on 24 April. The infrastructure transitions on 4 May and 18 May were explicitly marked in the temporal analysis to enable comparison of network behavior before and after each successive deployment stage.
Figure 2 presents the temporal evolution of the available LTE and NR uplink-interference indicators across the staged deployment period. No persistent increase in uplink interference was observed following either infrastructure transition. For LTE, the mean uplink-interference level changed from −108.20 dBm in Stage 1 to −109.22 dBm in Stage 2 and −108.85 dBm in Stage 3. Since lower (more negative) dBm values correspond to lower received interference power, these results do not indicate an increase in the average LTE uplink-interference level following the successive infrastructure activation stages.
Figure 2.
Temporal evolution of LTE and NR uplink interference across the three stages of indoor coverage infrastructure deployment. The vertical dashed lines indicate the two successive infrastructure activation dates (4 May and 18 May 2026).
A similar temporal pattern was observed for NR. The mean NR uplink-interference level was −110.35 dBm during Stage 1, decreased to −111.59 dBm during Stage 2, and remained at −111.05 dBm during Stage 3. Thus, neither deployment transition was associated with a sustained upward shift in the monitored NR uplink-interference level. Short-term fluctuations remained visible throughout the observation period; however, they were not accompanied by a persistent change toward higher interference after the infrastructure activation dates.
The stage-wise descriptive statistics are summarized in Table 4. In addition to the mean values, the standard deviation, median, and interquartile range (IQR) were calculated to characterize both the central tendency and temporal variability of the interference measurements.
Table 4.
Stage-wise descriptive statistics of LTE and NR uplink interference.
The variability statistics further support the absence of observable interference instability following deployment. The standard deviation of LTE uplink interference decreased progressively from 2.68 dB in Stage 1 to 2.37 dB in Stage 2 and 2.20 dB in Stage 3. For NR, the corresponding standard deviations were 1.38, 1.44, and 0.98 dB, respectively. In particular, Stage 3 exhibited the lowest NR variability despite the simultaneous operation of both indoor coverage systems. The median and IQR values showed a similarly limited stage-to-stage variation, indicating that the observed behavior was not driven solely by changes in the arithmetic mean.
Taken together, the longitudinal and stage-wise results provide no evidence of a persistent deterioration of the monitored uplink radio environment following the staged activation of the indoor coverage infrastructure. Importantly, this finding should not be interpreted as proof of zero network impact or as evidence of strict causality. Rather, within the monitored indicators and observation period, the activation events were not associated with a sustained increase in LTE or NR uplink interference. This distinction is important because the analysis is based on operational time-series observations, in which successive measurements may exhibit temporal dependence and may also be influenced by normal variations in network load and radio conditions.
Recent data-driven analyses of operational mobile networks have similarly emphasized the importance of temporally resolved measurements for evaluating network stability and identifying changes in network behavior that may not be apparent from isolated measurements [27]. In this context, the present results extend the analysis from conventional before/after assessment toward a staged longitudinal evaluation, allowing the network response to be examined across successive infrastructure states.
4.2. Temporal Evolution of PDCP Traffic Volume
To complement the uplink-interference analysis, the temporal evolution of user-plane traffic was examined using the available downlink (DL) and uplink (UL) PDCP volume indicators. Traffic-related KPIs provide an additional perspective on operational network behavior by characterizing variations in carried traffic and network utilization across the deployment stages [16,28]. Accordingly, the DL and UL PDCP volume records were analyzed using the same three deployment stages and transition dates applied in Section 4.1.
Figure 3 presents the temporal evolution of DL and UL PDCP volume across the three deployment stages. Both indicators exhibit pronounced temporal fluctuations, with recurring increases and decreases throughout the observation period. This behavior indicates substantial short-term variability in the carried traffic and highlights the importance of considering traffic dynamics when interpreting changes in other network-side KPIs.
Figure 3.
Temporal evolution of (a) DL and (b) UL PDCP volume across the three deployment stages. The vertical dashed lines indicate the infrastructure transitions on 4 May and 18 May 2026.
At the stage level, the mean DL PDCP volume was 121,671.31 in Stage 1, 106,506.96 in Stage 2, and 97,171.38 in Stage 3. The corresponding mean UL PDCP volume was 19,926.33, 16,710.92, and 15,961.35, respectively. Thus, the stage-wise averages decreased progressively over the observation period for both traffic directions. However, the longitudinal traces also show substantial within-stage variation, indicating that the differences between the stage averages should be interpreted in the context of the underlying temporal traffic dynamics rather than being attributed directly to the infrastructure transitions.
The stage-wise descriptive statistics of the DL and UL PDCP volume are summarized in Table 5.
Table 5.
Stage-wise descriptive statistics of DL and UL PDCP volume.
The descriptive statistics in Table 5 further characterize the variation in PDCP traffic across the three deployment stages. For DL traffic, the standard deviation decreased from 71,844.39 in Stage 1 to 52,798.51 in Stage 2 and 47,042.47 in Stage 3. A similar pattern was observed for UL traffic, with the standard deviation decreasing from 13,462.37 to 9900.69 and 9305.18 across Stages 1–3, respectively. The median values followed the same general stage-wise tendency as the corresponding means, while the IQR values also decreased across the observation period.
Despite these differences in stage-level descriptive statistics, Figure 3 demonstrates that substantial short-term traffic fluctuations persisted within all three operational states. Therefore, the observed reduction in average PDCP volume should not be interpreted as a direct consequence of the infrastructure transitions. Rather, the results indicate that the monitored period was characterized by changing network utilization, reflecting factors such as user activity, the number of active users, temporal usage patterns, and overall network load. Accordingly, the PDCP traffic volumes should be interpreted as contextual indicators of network utilization rather than as direct measures of the effectiveness of the GPON-RoF-DAS or elevator repeater.
The observed traffic dynamics are consistent with the broader understanding that operational LTE/5G networks exhibit time-varying utilization and that network-side KPIs should therefore be interpreted in their temporal context [16,28]. In the present dataset, the progressive differences in stage-wise PDCP volume occurred together with pronounced short-term fluctuations throughout all three stages. Consequently, the PDCP results are used primarily as an indicator of changing network utilization rather than as direct evidence of an infrastructure-induced performance change. This traffic context is particularly important for the subsequent interpretation of connectivity and other operational KPIs across the staged deployment period.
The time-series profiles also exhibit recurring temporal patterns. The DL and UL PDCP volumes show pronounced diurnal variations and a broader weekly pattern, which are consistent with variations in user activity and network load over the observation period. Similar recurring fluctuations are visible in the uplink-interference series, indicating that part of the short-term interference variability is associated with temporal changes in network utilization. Importantly, these periodic patterns are observed across the deployment stages rather than emerging specifically after either infrastructure activation. Therefore, they are interpreted as normal temporal variations in the operational network rather than as a direct effect of the GPON-RoF-DAS or elevator repeater.
4.3. Temporal Behavior of 5G Connectivity
To extend the assessment beyond interference and traffic behavior, 5G connectivity was evaluated using the available SgNB Add Success Rate indicator. This KPI characterizes the successful establishment of secondary-node connectivity and therefore provides a network-side measure of LTE/NR interaction in the monitored non-standalone 5G environment. Its temporal evolution was examined across the same three deployment stages to determine whether the successive infrastructure transitions coincided with persistent changes in 5G connectivity behavior.
Figure 4 presents the temporal evolution of the SgNB Add Success Rate across the three deployment stages. The indicator remained close to 100% throughout most of the observation period, although several short-duration downward deviations were observed. The mean success rate was 99.84% in Stage 1, 99.82% in Stage 2, and 99.92% in Stage 3. These values indicate that the overall level of 5G secondary-node addition remained consistently high across the three operational states, without a persistent reduction following either infrastructure transition.
Figure 4.
Temporal evolution of SgNB Add Success Rate across the three deployment stages. The vertical dashed lines indicate the infrastructure transitions on 4 May and 18 May 2026.
The stage-wise descriptive statistics in Table 6 provide additional insight into the stability of the SgNB Add Success Rate. Although Stage 2 exhibited the highest standard deviation (0.87), its median remained 99.95%, indicating that the increased variability was associated primarily with short-duration downward deviations rather than a sustained reduction in connectivity performance. In Stage 3, the standard deviation decreased to 0.33, while the median increased slightly to 99.96%. The IQR also decreased from 0.10 in Stage 1 to 0.08 in Stage 2 and 0.06 in Stage 3, indicating that the central portion of the observations remained tightly concentrated near the upper end of the success-rate range.
Table 6.
Stage-wise descriptive statistics of SgNB Add Success Rate.
Taken together, the time-series behavior and stage-wise statistics indicate that 5G secondary-node addition remained operationally stable throughout the monitored deployment period. The transient reductions observed at individual time points did not develop into a persistent stage-level decline, and Stage 3 showed both the highest mean success rate and the lowest variability. Within the monitored period, therefore, the successive infrastructure transitions were not associated with observable persistent degradation of this 5G connectivity indicator.
Measurement-based studies of operational 4G/5G networks have demonstrated the importance of KPI-based assessment under real deployment conditions, particularly in environments where 5G connectivity operates in conjunction with the existing LTE infrastructure [29]. In the present analysis, the distinction between transient deviations and persistent stage-level changes is particularly important: although individual reductions in the SgNB Add Success Rate occurred during the monitoring period, they did not produce a sustained deterioration in the overall connectivity indicator. These findings therefore complement the interference and traffic results by showing that the monitored 5G connectivity process remained stable across the successive deployment stages.
4.4. Integrated Assessment of Network Stability Across Deployment Stages
The preceding analyses examined three complementary aspects of operational network behavior: uplink radio conditions, user-plane traffic dynamics, and 5G connectivity. To provide an integrated assessment of network stability, the results were subsequently considered together across the three deployment stages. This combined interpretation is important because changes in a single KPI may reflect normal temporal variability rather than a persistent network-level response to an infrastructure transition. Accordingly, the assessment focused on whether the successive activation events were accompanied by consistent and sustained deterioration across multiple network-side indicators.
The uplink-interference results showed no persistent increase following either infrastructure transition, while the PDCP traffic records demonstrated substantial short-term variation in network utilization throughout all three stages. At the same time, the SgNB Add Success Rate remained consistently high, with stage-wise mean values exceeding 99.8%. Although transient deviations were present in the individual time series, these events did not coincide with a sustained deterioration across the monitored KPI groups.
In particular, the final combined infrastructure state did not exhibit poorer behavior than the baseline state across the principal stability indicators considered in this study. LTE uplink-interference variability decreased from 2.68 dB in Stage 1 to 2.20 dB in Stage 3, while NR variability decreased from 1.38 to 0.98 dB. Similarly, the SgNB Add Success Rate reached its highest stage-wise mean (99.92%) and lowest standard deviation (0.33) during Stage 3. These observations do not establish a causal improvement attributable to the infrastructure deployment; however, they provide no evidence of persistent network degradation within the monitored indicators and observation period.
It is important to distinguish between the local coverage benefit of the deployed infrastructure and its impact on the surrounding operator network. The absence of pronounced changes in the operator-side KPIs does not indicate that the indoor coverage systems were ineffective. In the corresponding user-side field measurements, activation of the GPON-RoF-DAS increased the mean LTE RSRP in the shielded indoor area by 30.1 dB, while DL and UL throughput increased from 2.3 to 11.2 Mbit/s and from 2.0 to 4.7 Mbit/s, respectively. The elevator repeater provided an approximately 17 dB improvement in LTE RSRP and restored usable data service in the elevator environment. Thus, the local measurements demonstrate the practical coverage benefit of the deployed systems, whereas the operator-side longitudinal analysis presented in this study addresses a complementary question: whether these local improvements were achieved without persistent adverse changes in the surrounding LTE/5G network.
Therefore, the limited stage-wise changes observed in the operator-side KPIs are consistent with the intended behavior of the deployed systems: substantial local coverage enhancement without a corresponding deterioration of the surrounding network.
In addition to the operator-side KPIs analyzed longitudinally in this study, complementary user-side measurements were available for several of the radio-performance indicators suggested by the reviewer. These included LTE RSRP, RSRQ, SINR, and DL/UL throughput. For the GPON-RoF-DAS deployment, mean LTE RSRP improved from −114.00 to −83.97 dBm, RSRQ from −14.20 to −12.00 dB, and SINR from 4.03 to 4.90 dB. Mean DL and UL throughput increased from 2.30 to 11.17 Mbps and from 2.00 to 4.70 Mbps, respectively. For the elevator repeater deployment, mean LTE RSRP improved by approximately 16.94 dB, while DL and UL throughput increased from 0.10 to 35.20 Mbps and from 0.10 to 21.20 Mbps, respectively. These complementary measurements confirm that the indoor coverage enhancement was evident at the user side even though the surrounding operator-side KPIs remained comparatively stable. MCS/CQI, MIMO rank, and RTT were not available in the retained measurement dataset and were therefore not included in the present analysis.
The substantial improvement in elevator downlink throughput, despite limited or unfavorable changes in some radio-quality indicators, should be interpreted cautiously. Throughput depends on multiple factors, including serving-cell selection, radio-resource allocation, scheduling conditions, and network load. Serving-cell reselection may have contributed to the observed differences between throughput, SINR, RSRQ, and NR RSRP. However, the available measurements do not contain sufficient cell-identity and mobility-related information to verify this explanation. Therefore, the observed throughput improvement cannot be attributed to a specific radio-level mechanism. The principal network-side KPI results across the three deployment stages are consolidated in Table 7, providing an integrated overview of uplink interference, PDCP traffic volume, and 5G connectivity performance.
Table 7.
Integrated summary of the principal network-side KPIs across the three deployment stages.
Overall, the integrated results indicate that the successive infrastructure transitions were not accompanied by a persistent deterioration across the monitored network-side indicators. Although individual KPIs exhibited short-term fluctuations and stage-dependent variability, these changes did not form a consistent pattern of degradation across the radio, traffic, and connectivity domains. The staged longitudinal assessment therefore provides evidence that the operational LTE/5G network remained stable within the monitored KPI set and observation period.
4.5. Quantitative Stability and Persistence Assessment
To complement the descriptive and integrated analyses presented in Section 4.1, Section 4.2, Section 4.3 and Section 4.4, network stability was further considered in terms of the magnitude, variability, and temporal persistence of changes in the principal network-side indicators. LTE and NR uplink interference and the SgNB Add Success Rate were selected as the primary stability indicators, whereas DL and UL PDCP volumes were treated as contextual measures of network utilization. This distinction is important because changes in traffic volume do not necessarily indicate degradation in radio conditions or connectivity performance.
The stage-wise results provide an initial quantitative characterization of stability. Mean LTE uplink interference changed from −108.20 dBm in Stage 1 to −109.22 dBm in Stage 2 and −108.85 dBm in Stage 3, while its standard deviation decreased from 2.68 to 2.20 dB between the baseline and final stages. For NR uplink interference, the corresponding mean values were −110.35, −111.59, and −111.05 dBm, with the standard deviation decreasing from 1.38 dB in Stage 1 to 0.98 dB in Stage 3. The SgNB Add Success Rate remained high across all three stages, with mean values of 99.84%, 99.82%, and 99.92%, respectively. These observations indicate that the final combined infrastructure state did not exhibit a deterioration in the stage-wise mean values of the monitored stability indicators relative to the baseline.
However, stage-wise averages and dispersion statistics alone are insufficient to establish whether an adverse change is persistent. A quantitative persistence assessment requires the identification of KPI-specific adverse deviations, the duration of consecutive exceedances, and their relationship to baseline variability. For uplink interference, deviations toward higher (less negative) dBm values represent potentially adverse behavior, whereas reductions in the SgNB Add Success Rate represent potentially adverse connectivity changes. The distinction between isolated fluctuations and sustained deterioration must therefore be based on explicitly defined thresholds and observation durations rather than visual inspection alone.
Accordingly, the descriptive findings reported in Section 4.1, Section 4.2, Section 4.3 and Section 4.4 were complemented by a quantitative assessment of adverse KPI excursions. This assessment applied baseline-derived thresholds to the hourly observations and measured the duration of consecutive threshold exceedances. The resulting persistence measures were interpreted together with the stage-wise statistics to distinguish short-term fluctuations from potentially sustained adverse changes.
To operationalize the persistence assessment, KPI-specific adverse thresholds were derived from the Stage 1 baseline distribution. The 95th percentile was used for LTE and NR uplink interference, for which higher values indicate potentially adverse conditions, whereas the 5th percentile was used for the SgNB Add Success Rate, for which lower values indicate potentially adverse connectivity behavior. The resulting thresholds were −103.79 dBm, −107.74 dBm, and 99.53%, respectively. For each subsequent deployment stage, the maximum number of consecutive hourly observations exceeding the adverse threshold was calculated.
As shown in Table 8, no LTE uplink-interference observations exceeded the baseline-derived threshold during Stages 2 and 3. For NR uplink interference, the maximum consecutive exceedance duration was one hour in Stage 2, with no exceedances in Stage 3. For the SgNB Add Success Rate, the longest consecutive adverse excursions lasted five hours in Stage 2 and two hours in Stage 3. These results indicate that the observed threshold excursions were relatively short in duration under the selected baseline-derived criteria.
Table 8.
Baseline-derived adverse thresholds and maximum consecutive excursion durations across deployment stages.
A sensitivity assessment using the less restrictive 90th percentile for interference and 10th percentile for the SgNB Add Success Rate produced maximum consecutive adverse excursion durations of no more than five hours in either post-baseline stage. The sensitivity analysis indicated that the maximum consecutive adverse excursion duration did not exceed five hours under either percentile-based threshold definition. These findings characterize the observed excursions as short relative to a full 24 h operating cycle. However, the percentile thresholds represent empirical screening criteria rather than operator-defined engineering limits, and the absence of longer threshold excursions should not be interpreted as proof that all forms of network degradation were excluded.
Under the adopted persistence criterion, none of the monitored stability indicators exhibited an uninterrupted adverse threshold exceedance lasting 24 h or longer during Stages 2 and 3. The maximum observed durations were 0 h for LTE uplink interference, 1 h for NR uplink interference, and 5 h for SgNB Add Success Rate under the primary baseline-derived thresholds. The sensitivity assessment using the alternative percentile thresholds likewise identified no adverse excursions extending over a complete 24 h observation window. Therefore, the results support the absence of day-long continuous adverse excursions under the specified analytical criteria. This finding does not exclude shorter episodes of operational degradation or establish that the deployment had no network impact.
4.6. Autocorrelation Diagnostics and Segmented Time-Series Analysis
To further assess temporal dependence and intervention-associated changes in operator-side network performance, a segmented interrupted time-series (ITS) analysis was performed using 912 hourly OSS observations collected between 24 April and 31 May 2026. The analysis covered three deployment stages: the baseline period (24 April–3 May), activation of the GPON-RoF-DAS system (4–17 May), and subsequent activation of the elevator repeater (18–31 May).
The regression models incorporated the two documented intervention dates, underlying temporal trends, intervention-associated level and slope changes, hour-of-day and day-of-week effects, and downlink (DL) and uplink (UL) PDCP traffic volumes as indicators of network utilization. Heteroskedasticity- and autocorrelation-consistent (HAC) standard errors were applied with a maximum lag of 24 h to obtain 95% confidence intervals.
Residual autocorrelation diagnostics indicated substantial serial dependence. The estimated lag-1 residual autocorrelation coefficients were 0.744 for LTE uplink interference, 0.823 for NR uplink interference, and 0.451 for SgNB Add Success Rate. Ljung–Box tests at lag 24 also indicated statistically significant residual autocorrelation, demonstrating that the temporal dependence was not fully eliminated by the segmented regression specification.
To assess the sensitivity of the intervention-associated estimates to the treatment of serial correlation, the HAC-based regression results were compared with generalized least squares models incorporating first-order autoregressive errors (GLSAR-AR1).
For LTE uplink interference, the second intervention was associated with an estimated level increase of 0.892 dB under HAC regression (95% CI: 0.325 to 1.458 dB). The corresponding GLSAR-AR1 estimate was smaller (+0.558 dB; p = 0.036), although the positive association remained statistically significant.
For NR uplink interference, the first intervention was associated with an estimated level decrease of 1.487 dB under HAC regression (95% CI: −2.435 to −0.538 dB). However, this association was not statistically significant under the GLSAR-AR1 specification (p = 0.398), indicating sensitivity to the modeling of temporal autocorrelation.
For SgNB Add Success Rate, the estimated intervention-associated level changes were relatively small, with HAC estimates of +0.083 and +0.246 percentage points for the first and second interventions, respectively. Their 95% confidence intervals included zero, providing insufficient evidence of statistically significant immediate level changes.
Overall, the results demonstrate that temporal autocorrelation is an important characteristic of the monitored OSS KPI series and that its treatment can influence the estimated intervention-associated effects. Although the analysis identified certain statistically significant changes, these findings should not be interpreted as definitive causal effects of infrastructure activation. The observational single-site design, variations in network utilization, and other unmeasured operational factors limit causal attribution. Therefore, the results are interpreted as associations within the monitored deployment rather than as generalizable estimates of infrastructure-induced network performance changes.
A further limitation concerns sensitivity to the exact intervention boundaries. Although the documented activation dates were consistently applied throughout the analysis, additional interrupted time-series models excluding observations immediately surrounding the activation dates were not estimated because the underlying hourly OSS records were not available for reanalysis. Therefore, the robustness assessment was limited to comparing HAC and GLSAR-AR1 specifications, and the sensitivity of the estimated intervention effects to alternative boundary definitions remains unverified.
5. Discussion
The present study evaluated the temporal behavior of an operational LTE/5G network during the successive activation of indoor coverage infrastructure. Unlike a conventional before/after comparison, the staged longitudinal design enabled the network response to be examined across three consecutive operational states. The results show that the infrastructure transitions were not accompanied by persistent deterioration in the principal network-side indicators considered in the analysis. LTE and NR uplink interference remained stable, PDCP traffic exhibited substantial time-dependent variation in network utilization, and the SgNB Add Success Rate remained consistently high throughout the monitoring period.
An important aspect of these findings is that network stability was assessed using multiple complementary indicators rather than inferred from a single KPI. Uplink interference characterized the radio environment, PDCP volume provided temporal context regarding network utilization, and the SgNB Add Success Rate represented the behavior of the monitored 5G connectivity process. Considered jointly, these indicators showed that short-duration fluctuations in individual KPIs were not accompanied by consistent deterioration across the monitored radio, traffic, and connectivity domains. This distinction is particularly important in operational mobile networks, where KPI values may vary over time because of changing traffic demand, radio conditions, and other network dynamics.
The longitudinal perspective also differentiates the present assessment from indoor coverage studies based primarily on spatial measurements or short-duration OFF/ON comparisons. Such approaches are valuable for quantifying local coverage improvement, whereas the present analysis addresses a different question: whether successive infrastructure activation stages are associated with persistent changes in the surrounding operational LTE/5G network. By preserving the temporal structure of the OSS observations and explicitly separating the two infrastructure transitions, the proposed assessment framework provides additional information on network behavior after each deployment stage.
These findings are consistent with measurement-based studies demonstrating that operational 4G/5G performance can vary substantially across measurement conditions and deployment environments [16,29,30,31]. Such variability makes it difficult to infer persistent network-level effects from isolated measurements or short observation intervals. In this context, the staged analysis adopted in the present study provides a more conservative basis for interpretation by examining whether KPI changes persist after each infrastructure transition, rather than attributing individual fluctuations directly to the deployment.
The results also highlight the value of considering several network-side indicators jointly when assessing operational network behavior. The absence of a persistent increase in uplink interference indicates that neither infrastructure transition coincided with a sustained deterioration of the monitored uplink radio environment. At the same time, the variation observed in PDCP traffic demonstrates that network utilization was not constant during the experiment, while the consistently high SgNB Add Success Rate provides complementary evidence regarding the stability of the monitored 5G connectivity process. Taken together, these observations support a multi-KPI interpretation of network stability rather than a conclusion based on a single performance indicator [32].
Several limitations should be considered when interpreting these findings. First, the study was based on an observational staged deployment rather than a randomized experimental design; therefore, the temporal association between infrastructure activation and KPI behavior should not be interpreted as strict causality. Second, consecutive OSS observations may exhibit temporal autocorrelation, meaning that hourly measurements cannot necessarily be treated as statistically independent samples [33]. Third, network utilization changed during the monitoring period, as demonstrated by the PDCP traffic data, and other unobserved operational factors may also have contributed to short-term KPI variability. Finally, the analysis represents a specific deployment environment and observation period; consequently, the results should not be generalized directly to all indoor LTE/5G deployments without additional validation.
An additional limitation concerns the spatial scope and network-element granularity of the monitoring dataset. The analysis was restricted to a single deployment site, and the available documentation did not permit verification of the exact number and identities of the LTE/NR cells contributing to the reported OSS indicators. Consequently, the study does not provide independent cell-level replication or a comparison across multiple deployment sites. Although the hourly monitoring records support the assessment of temporal behavior within the investigated environment, they do not establish spatial generalizability. Further validation using explicitly identified network elements and multiple deployment sites is required before extending the findings to other LTE/5G network configurations.
From a practical perspective, the results demonstrate the value of longitudinal OSS monitoring during the introduction of indoor coverage infrastructure. A staged monitoring strategy allows network operators to distinguish persistent changes from normal short-term KPI fluctuations and to evaluate each infrastructure transition within the context of existing network conditions. In particular, the combined examination of uplink interference, traffic dynamics, and connectivity-related indicators can provide a more comprehensive operational assessment than a single pre-/post-deployment measurement. Such an approach may also support network-performance monitoring by helping identify persistent KPI changes that require additional optimization or investigation [34].
Future work should extend the monitoring period and include additional deployment sites to evaluate whether the observed stability patterns remain consistent across different indoor environments, traffic conditions, and network configurations. The analysis could also be expanded to include additional accessibility, retainability, mobility, and throughput KPIs where sufficiently complete time-series records are available. From a methodological perspective, longer datasets would enable the application of change-point detection and time-series models that explicitly account for temporal dependence and underlying traffic trends [33,35]. These approaches could provide a stronger basis for distinguishing infrastructure-related changes from normal operational variability.
Overall, the findings indicate that staged infrastructure deployment can be evaluated effectively through temporally resolved multi-KPI operator-side monitoring. Within the scope of the present dataset, neither successive infrastructure transition was associated with persistent degradation across the monitored radio and connectivity indicators, while the traffic results emphasized the importance of accounting for changing network utilization. The principal contribution of the study is therefore not a claim of causal performance improvement, but a longitudinal assessment framework that characterizes operational LTE/5G network stability across successive indoor infrastructure states.
6. Conclusions
This study presented a longitudinal assessment of operational LTE/5G network behavior during the staged deployment of indoor coverage infrastructure. The analysis covered three consecutive operational stages using 912 hourly operator-side OSS observations collected between 24 April and 31 May 2026. The monitored indicators included LTE and NR uplink interference, DL and UL PDCP traffic volumes, and the SgNB Add Success Rate. Stage-wise descriptive statistics were complemented by quantitative persistence criteria and segmented interrupted time-series (ITS) analysis to distinguish temporal fluctuations from intervention-associated changes.
Mean LTE uplink interference was −108.20, −109.22, and −108.85 dBm across Stages 1–3, respectively, while the corresponding NR values were −110.35, −111.59, and −111.05 dBm. The variability of both interference indicators was lower in the final stage than at baseline. The SgNB Add Success Rate remained above 99.8% on average in all three stages and reached 99.92% in Stage 3. PDCP traffic volumes exhibited substantial temporal fluctuations, emphasizing the importance of accounting for changing network utilization when interpreting operational KPI differences.
The quantitative persistence assessment identified no uninterrupted adverse threshold exceedances lasting 24 h or longer during the two post-baseline stages. Under the primary baseline-derived criteria, the maximum consecutive adverse excursion durations were 0 h for LTE uplink interference, 1 h for NR uplink interference, and 5 h for the SgNB Add Success Rate. These findings support the absence of day-long continuous adverse excursions under the adopted criteria, rather than the complete absence of network degradation or infrastructure-related effects.
The segmented ITS analysis provided additional evidence that intervention-associated changes should be interpreted in their temporal context. For LTE uplink interference, the second intervention was associated with a positive level change under both HAC regression (+0.892 dB; 95% CI: 0.325–1.458 dB) and GLSAR-AR1 (+0.558 dB; p = 0.036). For NR uplink interference, the negative level change associated with the first intervention was statistically significant under HAC regression but not under GLSAR-AR1. The estimated immediate level changes in the SgNB Add Success Rate were not statistically significant. These results highlight the importance of accounting for serial dependence and assessing model sensitivity when interpreting intervention-associated KPI changes.
The principal contribution of this study is the integration of staged longitudinal operator-side KPI monitoring, explicit persistence criteria, and segmented time-series analysis for post-deployment assessment of indoor LTE/5G infrastructure. This approach provides a more informative characterization of operational network stability than isolated stage averages or conventional before/after comparisons, without claiming the development of a fundamentally new statistical method.
The findings are limited to a single deployment environment, the available OSS indicators, and the investigated observation period. The observational design does not establish causal effects, and sensitivity to alternative intervention-boundary definitions remains unverified. Future research should include additional deployment sites, longer monitoring periods, broader radio and service-quality indicators, and intervention-boundary sensitivity analyses to strengthen the robustness and generalizability of the findings.
Author Contributions
Conceptualization, K.T. and Z.A.; methodology, K.T., Z.K. and Z.A.; software, Y.T.; validation, K.T., Z.K., Y.T. and Z.A.; formal analysis, K.T., Z.K. and Z.A.; investigation, K.T., Y.T. and Z.A.; resources, Z.K. and Z.A.; data curation, Y.T. and K.T.; writing—original draft preparation, K.T. and Z.A.; writing—review and editing, K.T., Z.K. and Z.A.; visualization, Y.T. and K.T.; supervision, Z.K. and Z.A.; project administration, K.T. and Z.K.; funding acquisition, K.T. All authors have read and agreed to the published version of the manuscript.
Funding
This research was funded by the Science Committee of the Ministry of Science and Higher Education of the Republic of Kazakhstan (Grant No. IRN BR24993051—Development of an intelligent city system based on IoT and data analysis).
Data Availability Statement
The data supporting the findings of this study are available from the corresponding author, Zhansaya Ayapbergen, upon reasonable request, subject to authorization from the data owner. The complete raw dataset is not publicly available because it contains operational LTE/5G network performance measurements obtained from a mobile network operator and may be subject to confidentiality and data-sharing restrictions. The KPI definitions, deployment stages, and analytical procedures are described in the manuscript to facilitate methodological transparency and reproducibility.
Acknowledgments
We extend our gratitude to institutional partners for their support with data collection for this study. During the preparation of this manuscript, the authors used generative artificial intelligence tools solely for the purposes of language improvement, editing, and text structuring. All scientific ideas, analyses, interpretation of results, and conclusions are entirely the authors’ own work. Generative models were not used for data generation or to replace scientific analysis.
Conflicts of Interest
The authors declare no conflicts of interest. The funders had no role in the design of the study; in the collection, analyses, or interpretation of data; in the writing of the manuscript; or in the decision to publish the results.
Abbreviations
The following abbreviations are used in this manuscript:
| LTE | Long-Term Evolution |
| 5G | Fifth-Generation Mobile Network |
| NR | New Radio |
| OSS | Operations Support System |
| KPI | Key Performance Indicator |
| PDCP | Packet Data Convergence Protocol |
| SgNB | Secondary gNodeB |
| SgNB Add Success Rate | Secondary gNodeB Addition Success Rate |
| DL | Downlink |
| UL | Uplink |
| dBm | Decibels relative to one milliwatt |
| MB | MB |
References
- Ali, U.; Caso, G.; De Nardis, L.; Kousias, K.; Rajiullah, M.; Alay, Ö.; Neri, M.; Brunström, A.; Di Benedetto, M.-G. Data-Driven Analysis of Outdoor-to-Indoor Propagation for 5G Mid-Band Operational Networks. Future Internet 2022, 14, 239. [Google Scholar] [CrossRef] [Scilit]
- García Sánchez, M.; Iglesias, C.; Cuiñas, I.; Expósito, I. Building Penetration Losses at 3.5 GHz: Dependence on Polarization and Incidence Angle. Electronics 2023, 12, 106. [Google Scholar] [CrossRef] [Scilit]
- Van Brandt, S.; Van Thielen, R.; Verhaevert, J.; Van Hecke, T.; Rogier, H. Characterization of Path Loss and Large-Scale Fading for Rapid Intervention Team Communication in Underground Parking Garages. Sensors 2019, 19, 2431. [Google Scholar] [CrossRef] [Scilit] [PubMed]
- Al-Saman, A.; Mohamed, M.; Cheffena, M. Radio Propagation Measurements in the Indoor Stairwell Environment at 3.5 and 28 GHz for 5G Wireless Networks. Int. J. Antennas Propag. 2020, 2020, 6634050. [Google Scholar] [CrossRef] [Scilit]
- Dudley, D.G.; Lienard, M.; Mahmoud, S.F.; Degauque, P. Wireless Propagation in Tunnels. IEEE Antennas Propag. Mag. 2007, 49, 11–26. [Google Scholar] [CrossRef] [Scilit]
- Sun, R.; Matolak, D.W. Characterization of the 5-GHz Elevator Shaft Channel. IEEE Trans. Wirel. Commun. 2013, 12, 5138–5145. [Google Scholar] [CrossRef] [Scilit]
- Hadi, M.U.; Murtaza, G. Fibre Wireless Distributed Antenna Systems for 5G and 6G Services. Electronics 2023, 12, 64. [Google Scholar] [CrossRef] [Scilit]
- Wu, C.-L.; Lu, T.-T.; Lee, C.-T.; Sun, J.-S.; Lin, H.-P.; Hwang, Y.-S.; Sung, W.-T. Evolution towards Coordinated Multi-Point Architecture in Self-Organizing Networks for Small Cell Enhancement Systems. Electronics 2023, 12, 2473. [Google Scholar] [CrossRef] [Scilit]
- Kim, E.-S.; Sung, M.; Lee, J.H.; Lee, J.K.; Cho, S.-H.; Kim, J. Coverage Extension of Indoor 5G Network Using RoF-Based Distributed Antenna System. IEEE Access 2020, 8, 194992–194999. [Google Scholar] [CrossRef] [Scilit]
- Borges, R.M.; Marins, T.R.R.; Cunha, M.S.B.; Filgueiras, H.R.D.; da Costa, I.F.; Spadoti, D.H.; Mendes, L.L.; Sodré, A.C., Jr. Integration of a GFDM-Based 5G Transceiver in a GPON Using Radio Over Fiber Technology. J. Light. Technol. 2018, 36, 4468–4477. [Google Scholar] [CrossRef] [Scilit]
- Moon, S.-R.; Sung, M.; Kim, E.-S.; Lee, J.K.; Cho, S.-H.; Kim, J. RoF-Based Indoor Distributed Antenna System That Can Simultaneously Support 5G mmWave and 6G Terahertz Services. Opt. Express 2022, 30, 1521–1533. [Google Scholar] [CrossRef] [Scilit] [PubMed]
- Sun, Y.; Su, X.; Ye, F.; Fang, D.; Yuan, Y.; Jin, J.; Wang, Q. Indoor Field Trial Comparison Between RIS and Commercial Repeater. In Proceedings of the 2025 IEEE Global Communications Conference (GLOBECOM), Taipei, Taiwan, 8–12 December 2025. [Google Scholar] [CrossRef] [Scilit]
- Sathya, V.; Zhang, L.; Yavuz, M. Indoor Performance Comparison between Outdoor Macro, DAS, Wi-Fi and Neutral Host. In Proceedings of the 2026 IEEE 23rd Consumer Communications & Networking Conference (CCNC), Las Vegas, NV, USA, 9–12 January 2026. [Google Scholar] [CrossRef] [Scilit]
- Kapuruhamy, M.; Wanuga, K.; Lappalainen, A.; Korhonen, J.; Goyal, S.; Visotsky, E.; Golebiowski, B.; Talukdar, A. Understanding the 3GPP Standardization Aspects of Network-Controlled Repeaters. IEEE Commun. Stand. Mag. 2025, 9, 36–43. [Google Scholar] [CrossRef] [Scilit]
- Carvalho, F.I.G.; Paiva, R.V.O.; Maciel, T.F.; Monteiro, V.F.; Lima, F.R.M.; Moreira, D.C.; Sousa, D.A.; Makki, B.; Åström, M.; Bao, L. Network-Controlled Repeater—An Introduction. IEEE Commun. Stand. Mag. 2026, 10, 186–193. [Google Scholar] [CrossRef] [Scilit]
- Kousias, K.; Rajiullah, M.; Caso, G.; Alay, O.; Brunström, A.; Ali, U.; De Nardis, L.; Neri, M.; Di Benedetto, M.-G. Empirical Performance Analysis and ML-Based Modeling of 5G Non-Standalone Networks. Comput. Netw. 2024, 241, 110207. [Google Scholar] [CrossRef] [Scilit]
- Narayanan, A.; Zhang, X.; Zhu, R.; Hassan, A.; Jin, S.; Zhu, X.; Zhang, X.; Rybkin, D.; Yang, Z.; Mao, Z.M.; et al. A Variegated Look at 5G in the Wild: Performance, Power, and QoE Implications. In Proceedings of the ACM SIGCOMM 2021 Conference, Virtual, 23–28 August 2021; pp. 610–625. [Google Scholar] [CrossRef] [Scilit]
- Narayanan, A.; Ramadan, E.; Carpenter, J.; Liu, Q.; Liu, Y.; Qian, F.; Zhang, Z.-L. A First Look at Commercial 5G Performance on Smartphones. In Proceedings of the Web Conference 2020 (WWW ’20), Taipei, Taiwan, 20–24 April 2020; pp. 894–905. [Google Scholar] [CrossRef] [Scilit]
- Khan, I.; Ghoshal, M.; Angjo, J.; Dimce, S.; Hussain, M.; Parastar, P.; Yu, Y.; Deng, X.; Hawal, S.; Huang, S.; et al. How Mature Is 5G Deployment? A Cross-Sectional, Year-Long Study of 5G Uplink Performance. Comput. Commun. 2025, 237, 108153. [Google Scholar] [CrossRef] [Scilit]
- Mei, L.; Gou, J.; Cai, Y.; Cao, H.; Liu, Y. Realtime Mobile Bandwidth and Handoff Predictions in 4G/5G Networks. Comput. Netw. 2022, 204, 108736. [Google Scholar] [CrossRef] [Scilit]
- A Comparative and Measurement-Based Study on Real-Time Network KPI Extraction Methods for 5G and Beyond Applications. In Proceedings of the 2025 International Conference on Software, Telecommunications and Computer Networks (SoftCOM), Split, Croatia, 18–20 September 2025. [CrossRef] [Scilit]
- Fuentes, M.; Carcel, J.L.; Dietrich, C.; Yu, L.; Garro, E.; Pauli, V.; Lazarakis, F.I.; Grøndalen, O.; Bulakci, Ö.; Yu, J.; et al. 5G New Radio Evaluation Against IMT-2020 Key Performance Indicators. IEEE Access 2020, 8, 110880–110896. [Google Scholar] [CrossRef] [Scilit]
- Reddy, A.P.K.; Kumari, M.S.; Dhanwani, V.; Bachkaniwala, A.K.; Kumar, N.; Vasudevan, K.; Selvaganapathy, S.; Devar, S.K.; Rathod, P.; James, V.B. 5G New Radio Key Performance Indicators Evaluation for IMT-2020 Radio Interface Technology. IEEE Access 2021, 9, 112290–112311. [Google Scholar] [CrossRef] [Scilit]
- Kanellopoulos, D.; Sharma, V.K.; Panagiotakopoulos, T.; Kameas, A. Networking Architectures and Protocols for IoT Applications in Smart Cities: Recent Developments and Perspectives. Electronics 2023, 12, 2490. [Google Scholar] [CrossRef] [Scilit]
- Kanellopoulos, D.; Sharma, V.K. Dynamic Load Balancing Techniques in the IoT: A Review. Symmetry 2022, 14, 2554. [Google Scholar] [CrossRef] [Scilit]
- Taissariyeva, K.; Kalpeyeva, Z.; Tashtay, Y.; Bekenov, Y.; Ayapbergen, Z. Evaluation of the Effectiveness of Distributed Antenna Systems for Improving Indoor Wireless Network Coverage. J. Sens. Actuator Netw. 2026, 15, 39. [Google Scholar] [CrossRef] [Scilit]
- Amirova, A.; Abdiraman, A.; Aldasheva, L.; Shayea, I.; Yedilkhan, D.; Tussupov, A. Data-Driven and Machine Learning-Based Analysis of Handover Behavior and Network Stability in Mobile Networks. Future Internet 2026, 18, 290. [Google Scholar] [CrossRef] [Scilit]
- Hu, J.; Wang, L.; Wu, J.; Pei, Q.; Liu, F.; Li, B. A Comparative Measurement Study of Cross-Layer 5G Performance under Different Mobility Scenarios. Comput. Netw. 2024, 257, 110952. [Google Scholar] [CrossRef] [Scilit]
- Polak, L.; Kufa, J.; Sotner, R.; Fryza, T. Measurement and analysis of 4G/5G mobile signal coverage in a heavy industry environment. Sensors 2024, 24, 2538. [Google Scholar] [CrossRef] [Scilit] [PubMed]
- Kousias, K.; Rajiullah, M.; Caso, G.; Alay, O.; Brunstorm, A.; De Nardis, L.; Neri, M.; Ali, U.; Di Benedetto, M.-G. Coverage and Performance Analysis of 5G Non-Standalone Deployments. In Proceedings of the 16th ACM Workshop on Wireless Network Testbeds, Experimental Evaluation & Characterization (WiNTECH ’22), Sydney, NSW, Australia, 17 October 2022; pp. 61–68. [Google Scholar] [CrossRef] [Scilit]
- Narayanan, A.; Ramadan, E.; Mehta, R.; Hu, X.; Liu, Q.; Fezeu, R.A.K.; Dayalan, U.K.; Verma, S.; Ji, P.; Li, T.; et al. Lumos5G: Mapping and Predicting Commercial mmWave 5G Throughput. In Proceedings of the ACM Internet Measurement Conference (IMC ’20), Virtual, 27–29 October 2020; pp. 176–193. [Google Scholar] [CrossRef] [Scilit]
- Huang, P.-Q.; Zeng, S.; Wu, X.; Liu, H.-L.; Zhang, Q. A Multiobjective Evolutionary Algorithm for Network Planning in In-Building Distributed Antenna Systems. IEEE Trans. Netw. Sci. Eng. 2024, 11, 3002–3014. [Google Scholar] [CrossRef] [Scilit]
- Aminikhanghahi, S.; Cook, D.J. A Survey of Methods for Time Series Change Point Detection. Knowl. Inf. Syst. 2017, 51, 339–367. [Google Scholar] [CrossRef] [Scilit] [PubMed]
- Panek, M.; Pomykała, A.; Jabłoński, I.; Woźniak, M. 5G/5G+ Network Management Employing AI-Based Continuous Deployment. Appl. Soft Comput. 2023, 134, 109984. [Google Scholar] [CrossRef] [Scilit]
- Xu, H.; Dubey, P.; Yu, Y. Online Network Change Point Detection with Missing Values and Temporal Dependence. J. Time Ser. Anal. 2026, 47, 687–700. [Google Scholar] [CrossRef] [Scilit]
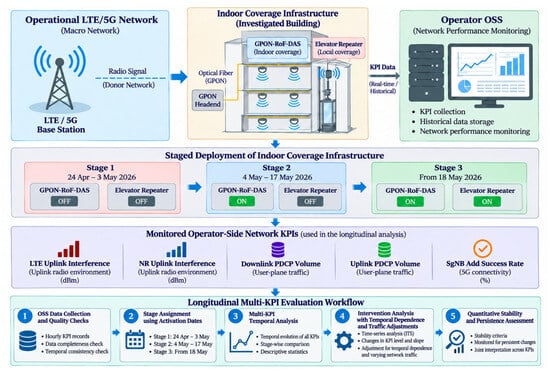
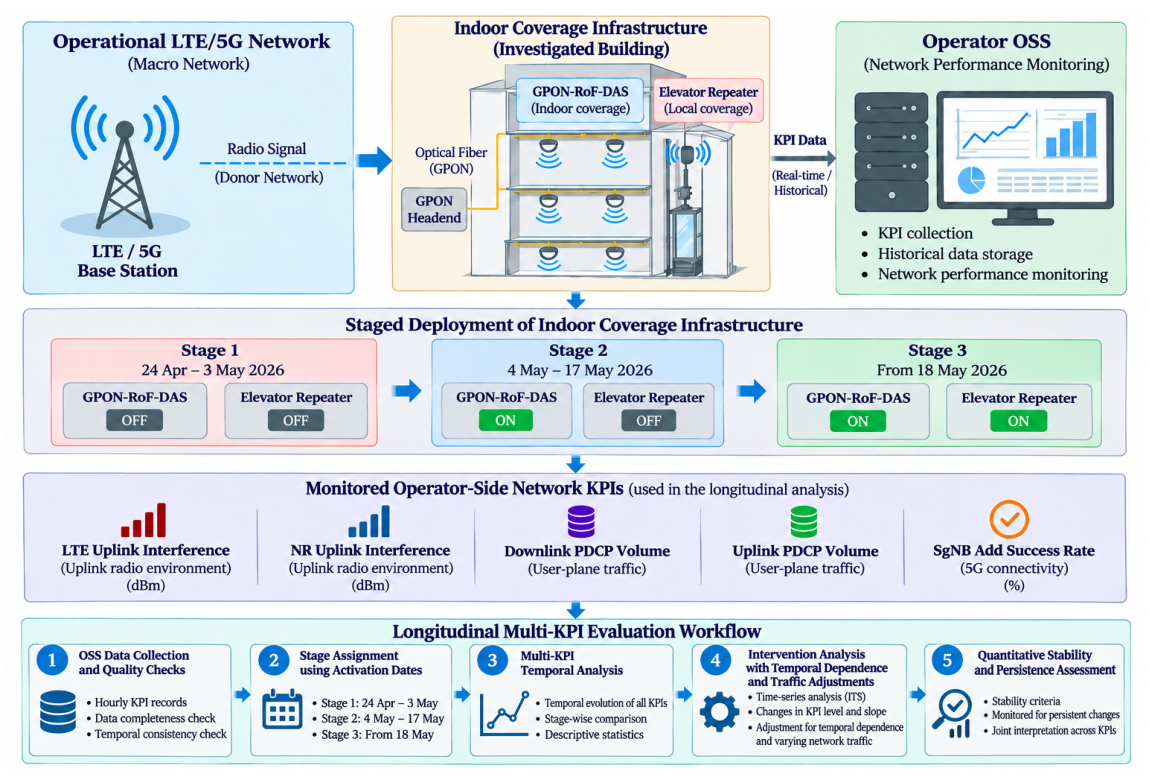
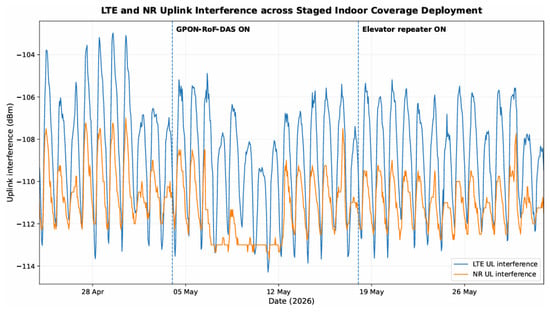
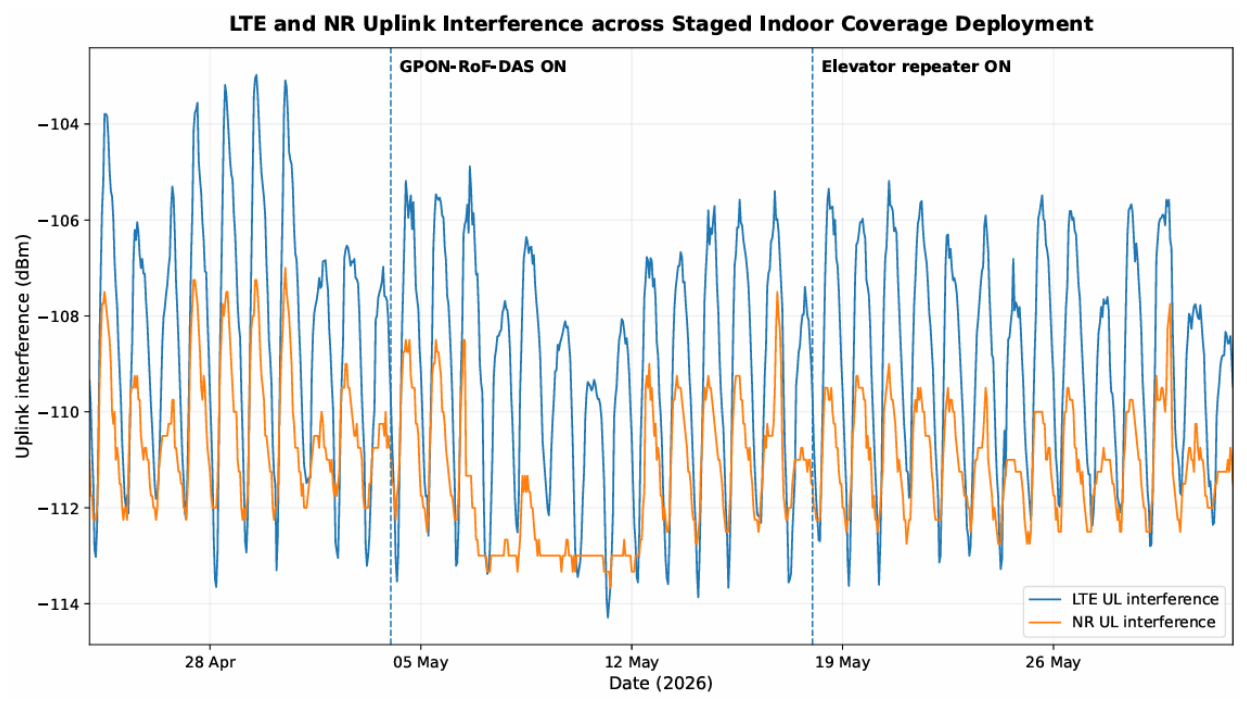
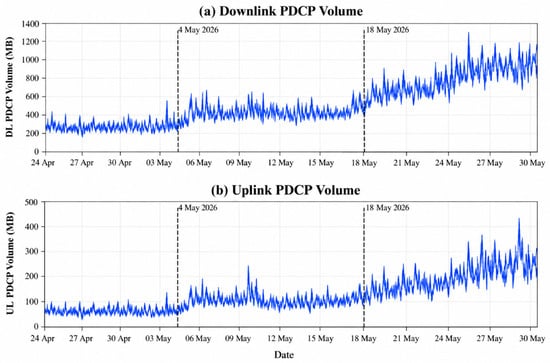
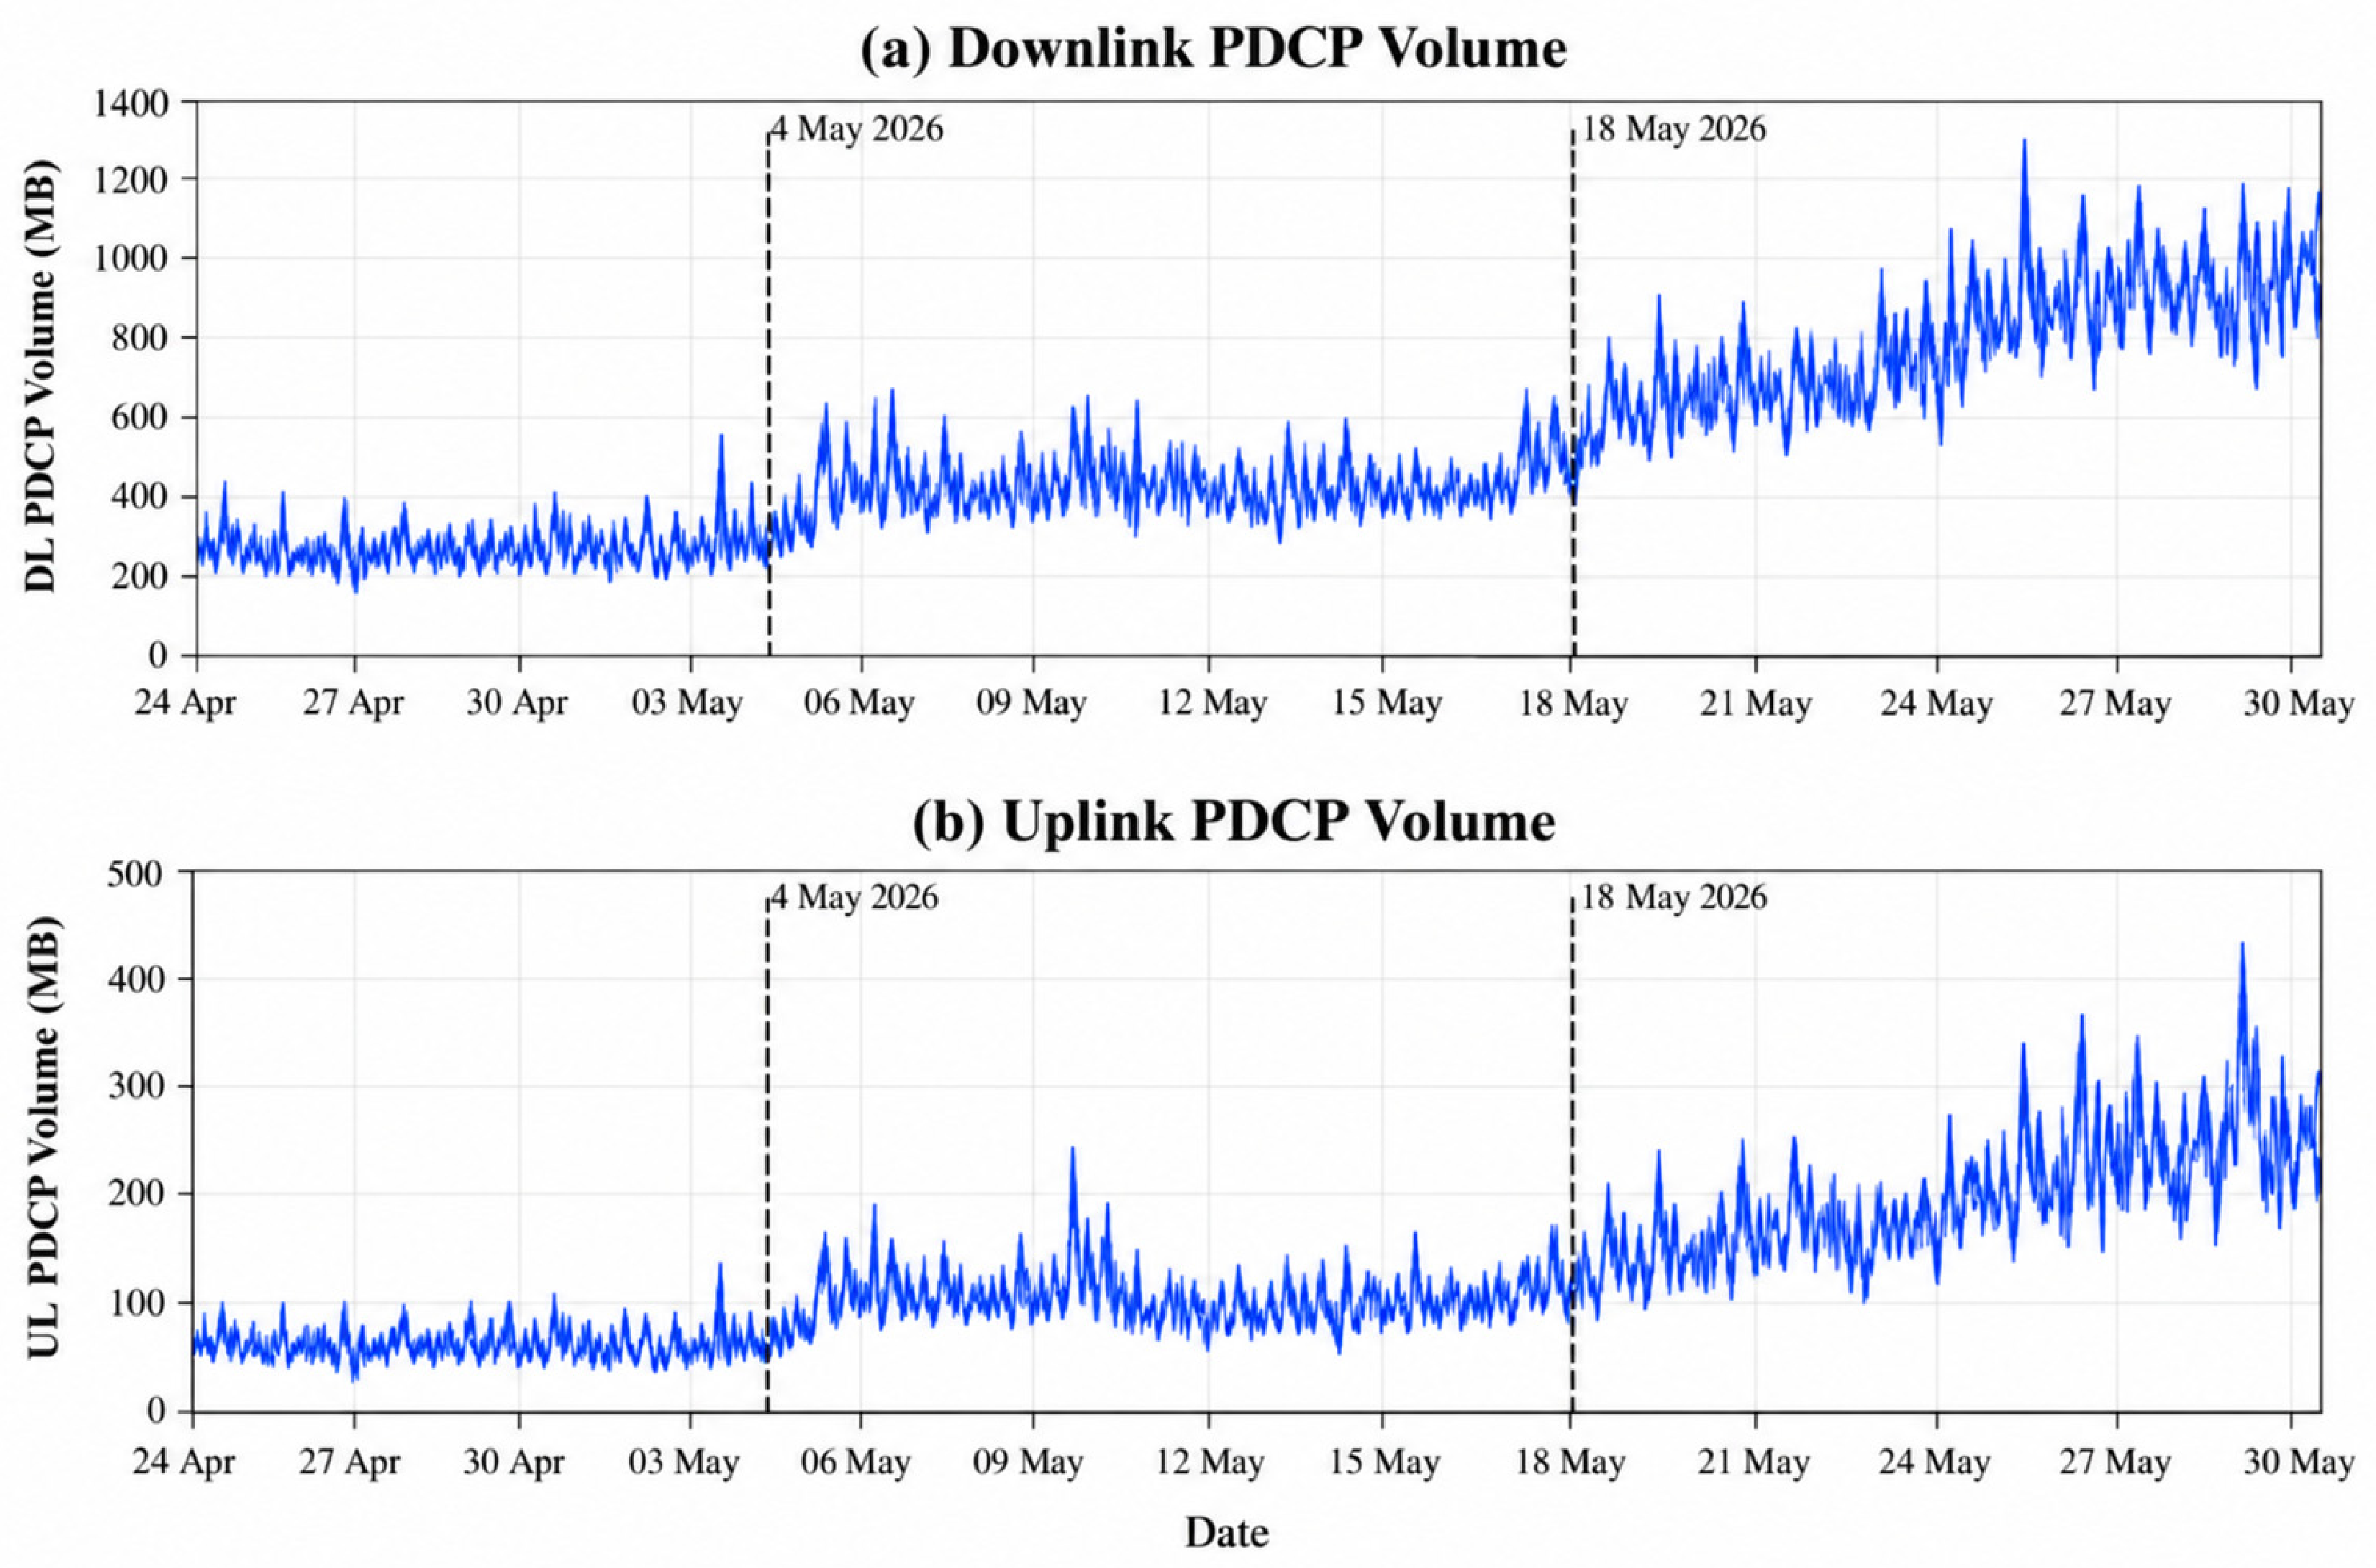
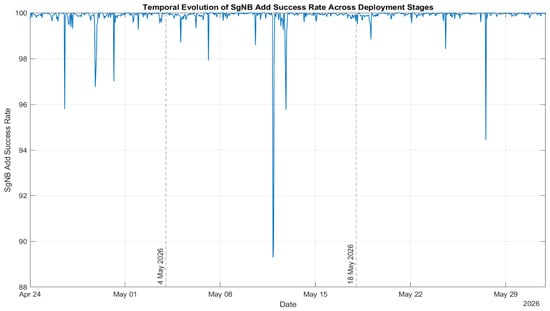
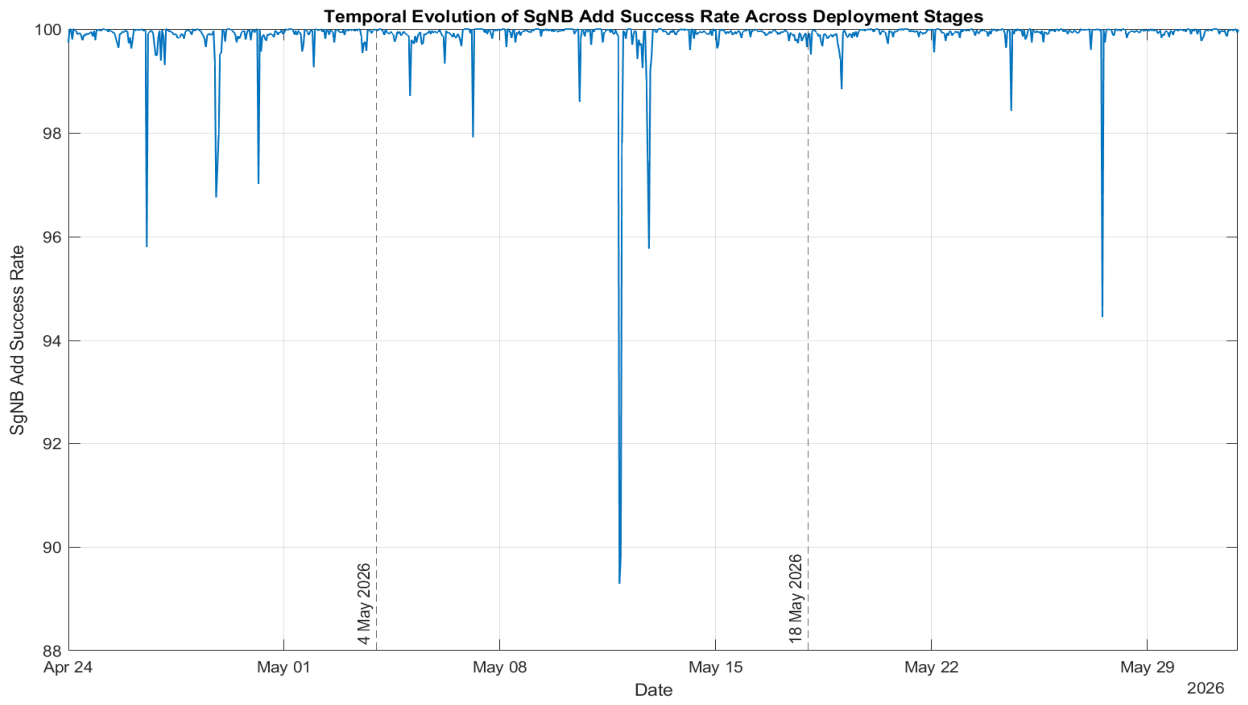

Disclaimer/Publisher’s Note: The statements, opinions and data contained in all publications are solely those of the individual author(s) and contributor(s) and not of MDPI and/or the editor(s). MDPI and/or the editor(s) disclaim responsibility for any injury to people or property resulting from any ideas, methods, instructions or products referred to in the content. |
© 2026 by the authors. Licensee MDPI, Basel, Switzerland. This article is an open access article distributed under the terms and conditions of the Creative Commons Attribution (CC BY) license.