


Abstract
Green buildings not only operate as energy-efficient structures but are also enriched with various sensors and network-supported environments. These are capable of sustaining high indoor environmental quality. This paper presents a simplified deterministic simulation framework and an extended simulation scenario for assessing how IoT-monitored green buildings may reduce indoor environmental risk for occupants with chronic health vulnerabilities. The model is motivated by previous work on green residences, housing conditions, and their relationship to physical and psychological health, where indoor air quality, ventilation, thermal comfort, humidity, noise, lighting, dust, chemical exposure, and smoke are treated as relevant housing-related factors. A baseline simulation with a virtual duration of 100 days was conducted using 100 code-generated participants distributed across two building categories: a bad climate house (BCH) and a green monitored house (GMH). Three chronic-condition profiles were taken into consideration: asthma, chronic obstructive pulmonary disease, and anxiety/stress. This prototype version of the developed Octave-compatible code allows the baseline behavior of the proposed risk model to be examined directly. The simulation protocol included nine indoor environmental indicators and a normalized risk score ranging from 0 to 100, with values classified as low, moderate, or high risk. An extended simulation was then introduced to examine a broader scenario. This extension added a normal house (NH) as an intermediate building category and expanded the health-condition set from three to five assigned profiles by including allergies and depression/low well-being. Controlled building-profile and health-profile deviations were also included, while allergies and depression/low well-being were parameterized with building-specific coefficients. This allowed the model to examine not only the separation between the two extreme cases but also the intermediate role of a partially controlled building scenario. The results showed a clear difference in risk response between the building categories. In the basic scenario, the BCH produced high final risk scores, whereas the GMH achieved low final risk scores. At the building level, the final mean risk was approximately 100.00 for the BCH and 9.37 for the GMH. In the extended simulation, the aggregated final mean risk was 99.08 for the BCH, 44.95 for the NH, and 9.02 for the GMH. These results show a clear building-level risk stratification, i.e., high risk for the adverse building case, moderate risk for the intermediate building case, and low risk for the green monitored building case. These findings should be interpreted as deterministic and extended simulation results under predefined normalized environmental profiles, not as direct clinical or field validation. The proposed code strategy is not intended as a clinical diagnostic tool, but as an oriented modeling approach for future IoT-based green building assessment, digital twin integration, and risk-aware environment management.
1. Introduction
Buildings, as structures, no longer have a passive physical character while providing only shelter, thermal protection, and professional spaces. In the context of sustainable urban development, they have evolved into intelligent, energy-aware, and health-supportive environments. This transition is important for residential and semi-residential buildings. Their occupants spend a substantial part of their day there, while indoor environmental conditions exert an important impact on physical comfort, respiratory burden, mental well-being, and overall quality of life. Recent studies on indoor environmental quality (IEQ) show that air quality, thermal comfort, humidity, lighting, acoustics, and occupant perception are not isolated variables of building performance. Instead, they are interconnected factors that affect health, comfort, productivity, and sustainability [1].
The relationship between housing conditions and health has become increasingly relevant after the COVID-19 period, during which the importance of sustaining healthy indoor environments, ventilation, and real-time environmental awareness became imperative. Poor housing conditions and the corresponding indoor air quality have been correlated with respiratory vulnerability, while recent literature also highlights a probable correlation between indoor air pollution, dampness, mould, and mental health outcomes [2]. Based on the aforementioned facts, vulnerable occupants, such as individuals with asthma, chronic obstructive pulmonary disease (COPD), allergies, anxiety, stress, or other chronic conditions, may be more sensitive to indoor environmental stressors than the general population. This observation is consistent with the conceptual basis of the green-residence protocol explained in [3], which identifies indoor air quality, building and furnishing materials, noise, humidity, temperature, lighting, dust, tobacco, and chemical cleaners as housing-related factors that influence residents’ physical and psychological health.
Green buildings are commonly examined in terms of energy efficiency, reduced emissions, and sustainable construction. Nevertheless, a health-oriented strategy in green buildings needs a broader interpretation. A green building should not only consume less energy but also provide controllable, measurable, and adaptive indoor conditions. So, environmental quality must be continuously monitored through sensing systems (e.g., Internet of Things—IoT) capable of monitoring air quality, CO2 concentration, particulate matter, temperature, relative humidity, luminance, noise, and other comfort-related parameters. Recent IoT-based IEQ monitoring studies exhibit that wireless sensing networks can detect spatial and temporal environmental variations that are not easily found through periodic surveys, while also supporting facility management and mitigation strategies [1].
The integration of Internet of Things technologies inside building areas has therefore become an important component of smart and green building research. IoT architectures enable distributed sensing, data acquisition, communication, and processing, while decision support allows buildings to extend their image from static energy-efficient structures to adaptive and smart living and working areas. Recent reviews underline that IoT applications in smart buildings can support real-time monitoring, energy management, operational efficiency, occupant comfort, and data-informed decision-making. At the same time, the successful implementation of IoT systems depends greatly on the quality of the existing communication infrastructure. Smart buildings need sustainable network services, flawless connectivity, sufficient capacity, and low-latency data transmission, especially when environmental monitoring is used for real-time control, health-related alerts, energy optimization, or digital-twin integration [4].
This network-aware perspective is indeed important because a building with sensors is not necessarily an intelligent structure. Sensor measurements are useful only when they can be acquired, transmitted, stored, interpreted, and converted into useful information. Thus, a properly structured building must combine three complementary stages: a physical green building, an IoT sensing stage, and a reliable network/data-service stage. Without the needed network quality, sensing is degraded. For example, delays, data loss, and bottlenecks may degrade the building system’s ability to act against unwanted indoor environmental changes. Recent work on IoT-based IEQ systems and smart buildings emphasizes exactly the need for real-time, occupant-centric, and data-driven building operation [1].
This study builds on this research direction by treating green buildings as an integrated environmental and digital monitoring system. The conceptual starting point is the protocol introduced in [3]. That protocol proposed a correlation between IEQ and residents’ health and quality of life, with particular attention to chronic illnesses and health-related conditions such as asthma, COPD, allergies, mental health problems, and sick building syndrome symptoms. The simulated scenario used in this paper follows the same health-oriented logic but converts it into a computational risk model.
The baseline simulation involves two building categories, namely a bad climate house (BCH) and a green monitored house (GMH), three assigned health conditions, and nine indoor environmental indicators. The protocol uses 100 code-generated participants, a 100-day virtual time simulation, and a normalized risk score from 0 to 100, classified as low, moderate, or high risk. In addition to this baseline setting, an extended simulation is introduced to examine a broader scenario. The extended configuration adds a normal house (NH) as an intermediate building category and expands the assigned health conditions from three to five by including allergies and depression/low well-being. Controlled building-profile and health-profile deviations are also included, while the added allergies and depression/low well-being profiles are described with building-specific coefficients.
The objective of the current study is therefore not to provide independent clinical proof of a specific real building reducing health risk, but to define and examine a clear computational risk-score strategy under controlled simulation assumptions. The BCH, NH, and GMH are treated as scenario classes representing adverse, intermediate, and green monitored indoor environmental conditions. Within the aforementioned scope, the value of the simulation lies in testing whether the proposed normalized formulation yields consistent and interpretable risk-score behavior across different building categories and assigned occupant profiles associated with health conditions. In this context, the objective is not to establish external clinical validity at the present stage, but to examine whether the same normalized risk-score structure behaves consistently across adverse, intermediate, and green monitored indoor environmental scenarios. Therefore, the baseline and extended simulations should be interpreted as structured scenario analyses designed to test the internal coherence, interpretability, and reproducibility of the proposed modeling framework.
The methodological contribution of this work lies in integrating various factors. These include green building logic, IoT-based environmental sensing, occupant vulnerability, and network service quality within a simulation-based risk-assessment framework. Existing studies often examine green buildings mainly through energy performance, comfort, or indoor environmental quality. In contrast, the present work organizes these factors into a reproducible computational structure that links normalized indoor environmental indicators, monitoring/control capability, assigned health-condition profiles, and time-dependent risk-score evolution. Therefore, the paper interprets IoT sensors not as isolated devices, but as parts of a broader networked building infrastructure. The latter is mainly capable of supporting continuous environmental supervision and risk-aware decision support. Furthermore, the resulting model is not intended as a clinical diagnostic application, but as a research-oriented tool for future studies on IoT green buildings, indoor environmental health, network-supported services, and smart resilience design.
The structure of the paper includes, apart from the introduction, Section 2, which is relevant to the proposed system architecture and simulation. It comprises the general architecture of the proposed simulation framework, a short description of the simulation code workflow, the mathematical formulation of the risk score, the simulation setup, and the results. Section 3 includes restrictions, while the Section 4 includes conclusions and future scopes.
2. Proposed System Architecture and Simulation
2.1. General Architecture of the Proposed Simulation Framework
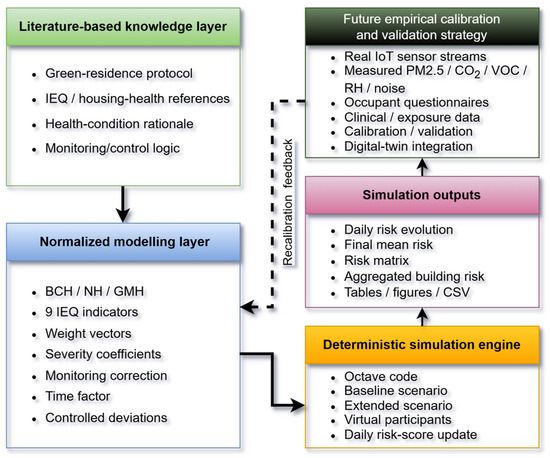
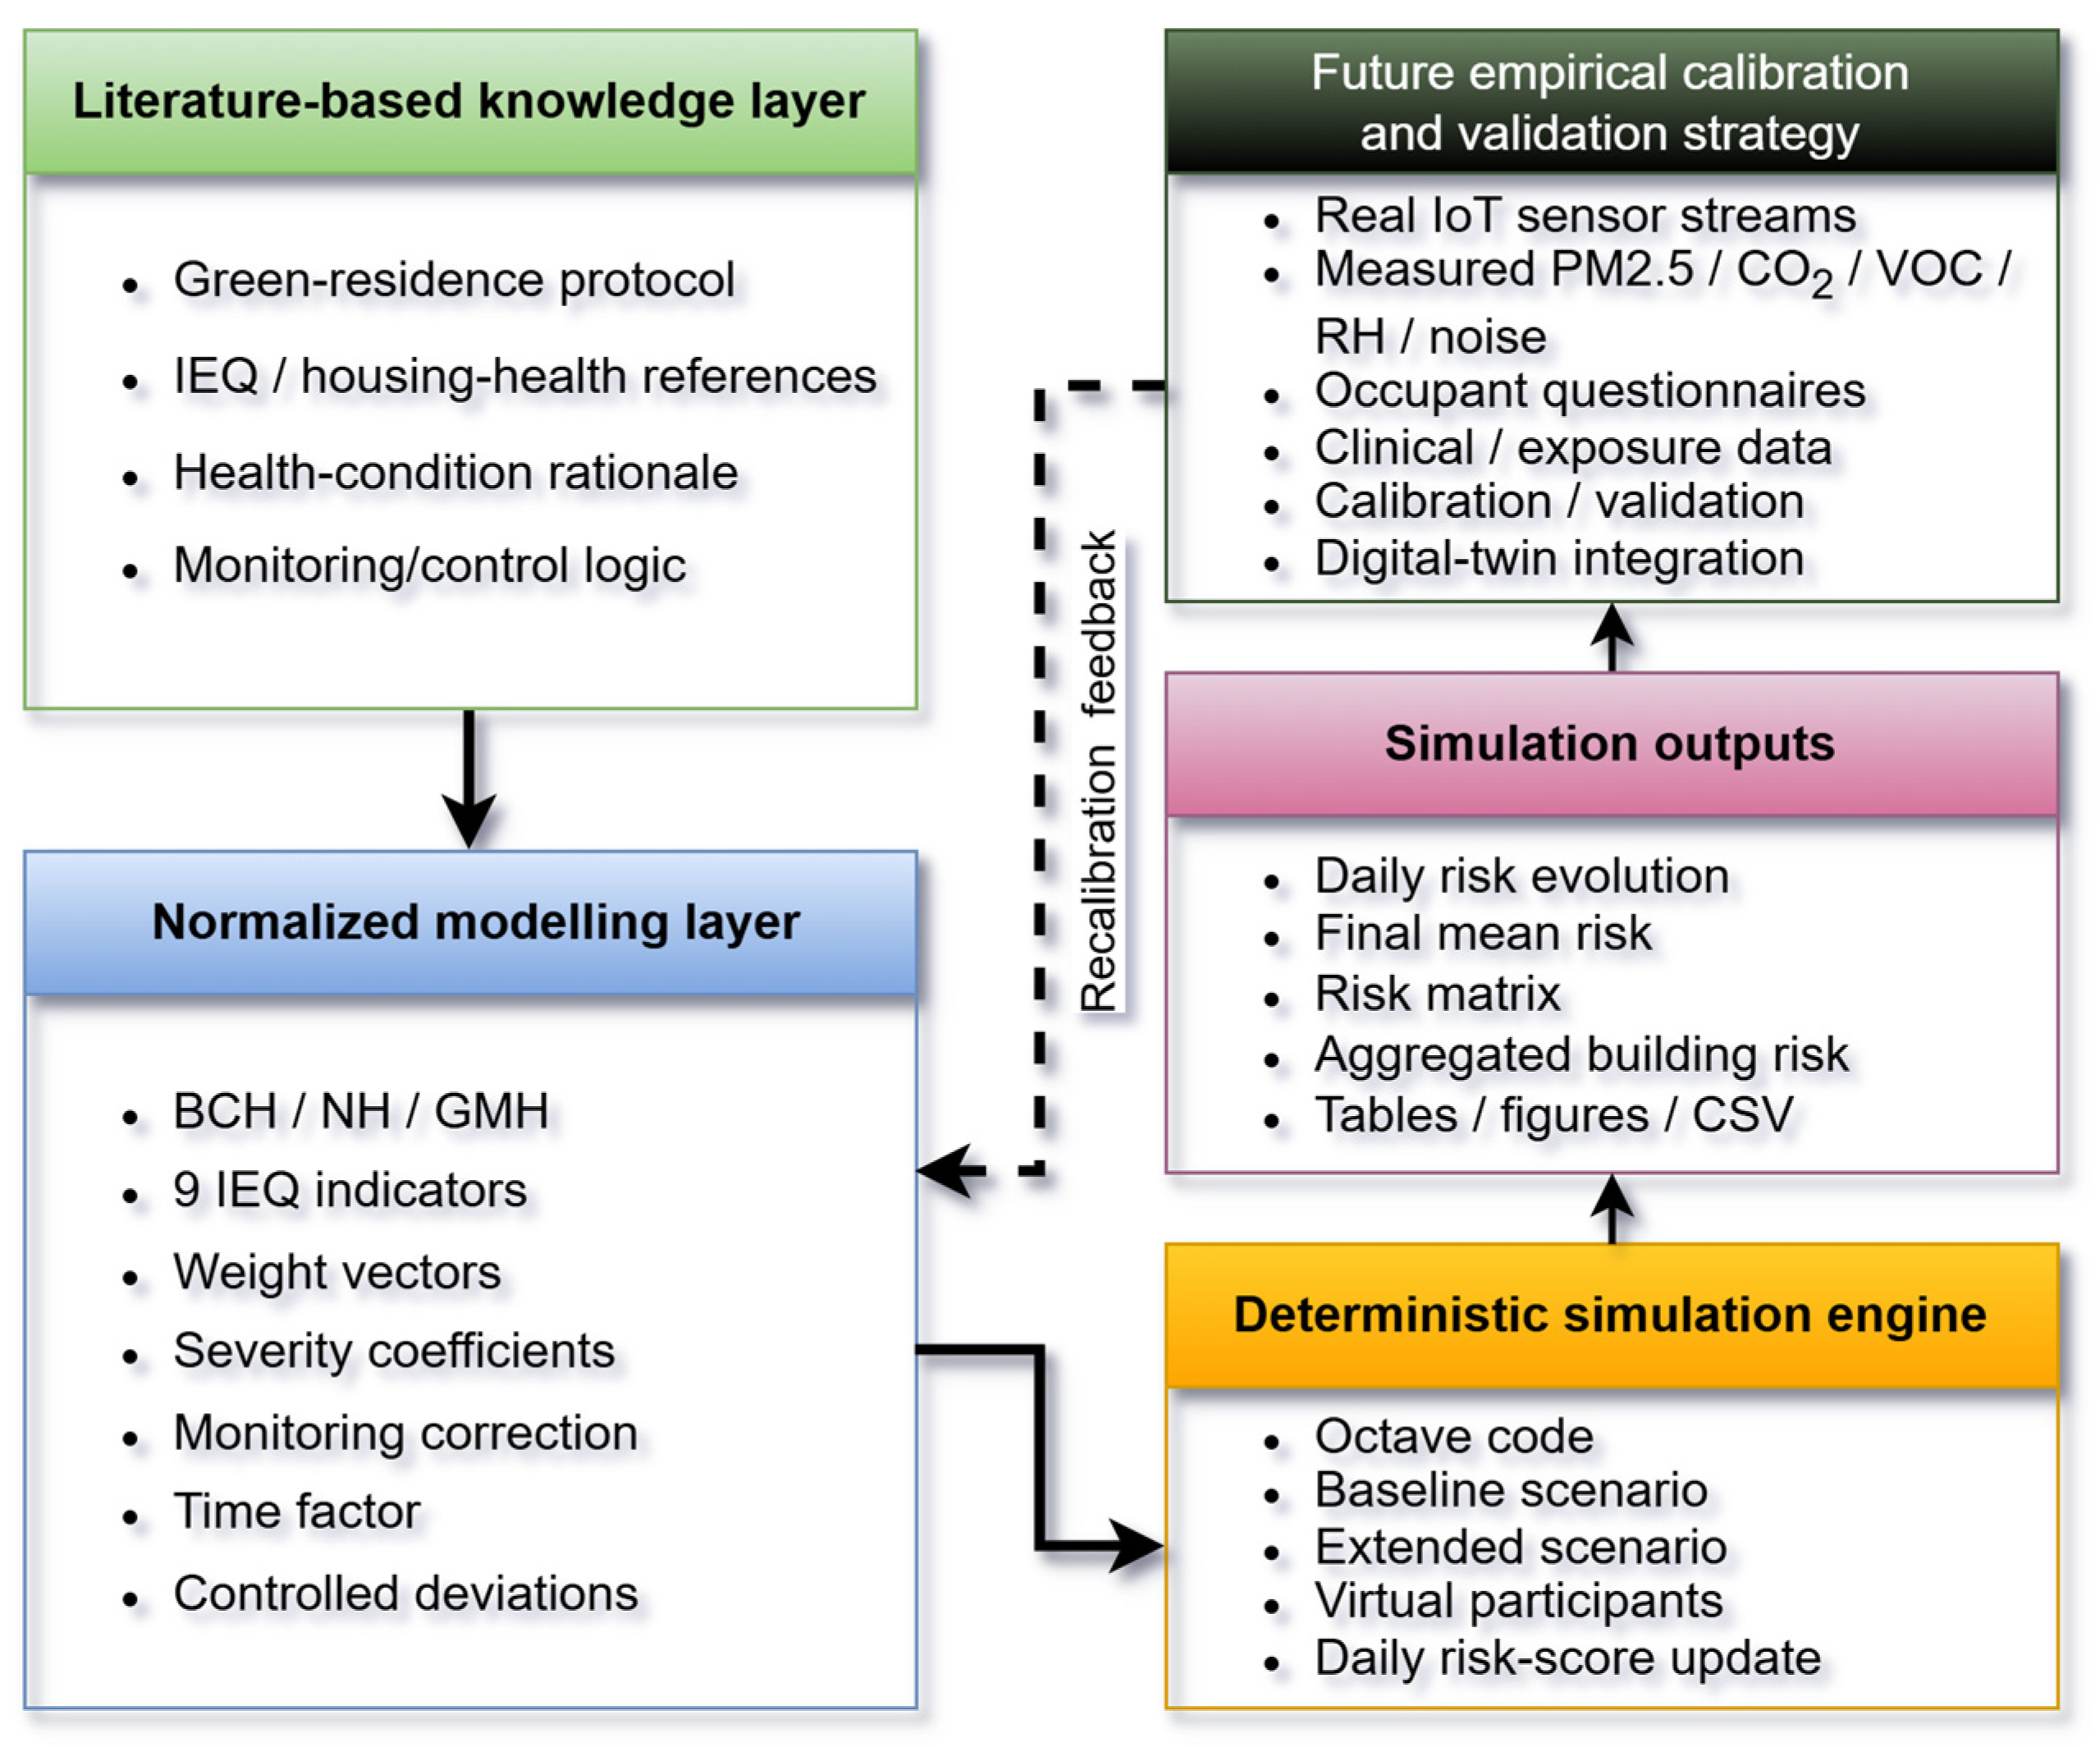
Before presenting the detailed architecture workflow and mathematical formulation, Figure 1 provides a conceptual overview of the proposed framework. It shows how literature-based assumptions are converted into normalized building and health-condition profiles, how these are processed through the deterministic Octave simulation engine, what outputs are generated, and how the framework can be extended in future work toward empirical calibration and validation with real sensor and occupant data. Specifically, the diagram separates the literature-based knowledge layer, the normalized modeling layer, the deterministic simulation engine (Octave-compatible code), the simulation-output layer, and the future empirical calibration and validation strategy. This structure clarifies that the present contribution focuses on computational modeling and reproducible simulation, while real IoT sensor deployment, measured environmental streams, occupant data, clinical or exposure datasets, and full empirical calibration are identified as future extensions.
Figure 1.
Conceptual structure and validation strategy of the proposed risk-score framework.
In the present study, a green building refers to a building with improved environmental and sustainability-oriented characteristics. A smart building refers to a building equipped with sensing, communication, and data-processing infrastructure. A monitored building is one where indoor environmental indicators are measured and transmitted. A controlled building is one with monitoring connected to decision support and corrective actions. The GMH scenario combines these concepts at a simulation level by assuming improved indoor environmental conditions together with monitoring/control capability.
The proposed system is a simplified digital model for assessing how different building conditions may affect vulnerable occupants over time. The proposed strategy combines three main conceptual stages: the building-condition stage, the IoT sensing and monitoring stage, and the health-risk simulation stage. The purpose of this simulated model is to represent a building not only as a physical structure, but also as a monitored smart environment in which the indoor quality indicators can be measured, transmitted, interpreted, and converted into risk scores.
Specifically, the first stage corresponds to the physical building environment. In the baseline simulation, two building categories are considered: a BCH and a GMH. The BCH corresponds to an indoor environment with poor environmental quality, limited monitoring capability, and increased deterioration in the main building-related indicators. The green monitored house (GMH) represents a structured green building with low indoor environmental risk pressure, full monitoring, and control capability. In the implemented baseline protocol, the BCH is assigned a monitoring/control value of 0.05, while the green monitored house (GMH) is assigned a value of 1.00. The baseline simulation was performed using 100 code-generated participants, a 100-day simulation period, a fixed seed of 12345, and no stochastic deviations, keeping the logic simple and easier to debug.
In addition to the baseline configuration, the extended simulation expands the first stage by introducing a third building category, namely the normal house (NH). This category represents an intermediate building case between the adverse BCH and the fully monitored GMH. The extended setting also introduces controlled building-profile deviations of 20% for the BCH, 10% for the NH, and 5% for the GMH. Therefore, the building condition stage can be interpreted at two levels: a simplified BCH–GMH comparison used to verify the baseline model logic and an extended BCH–NH–GMH comparison used to examine a broader and more realistic risk stratification.
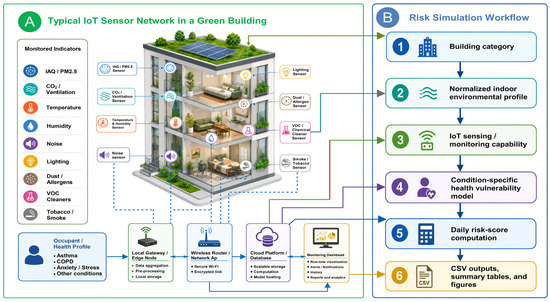
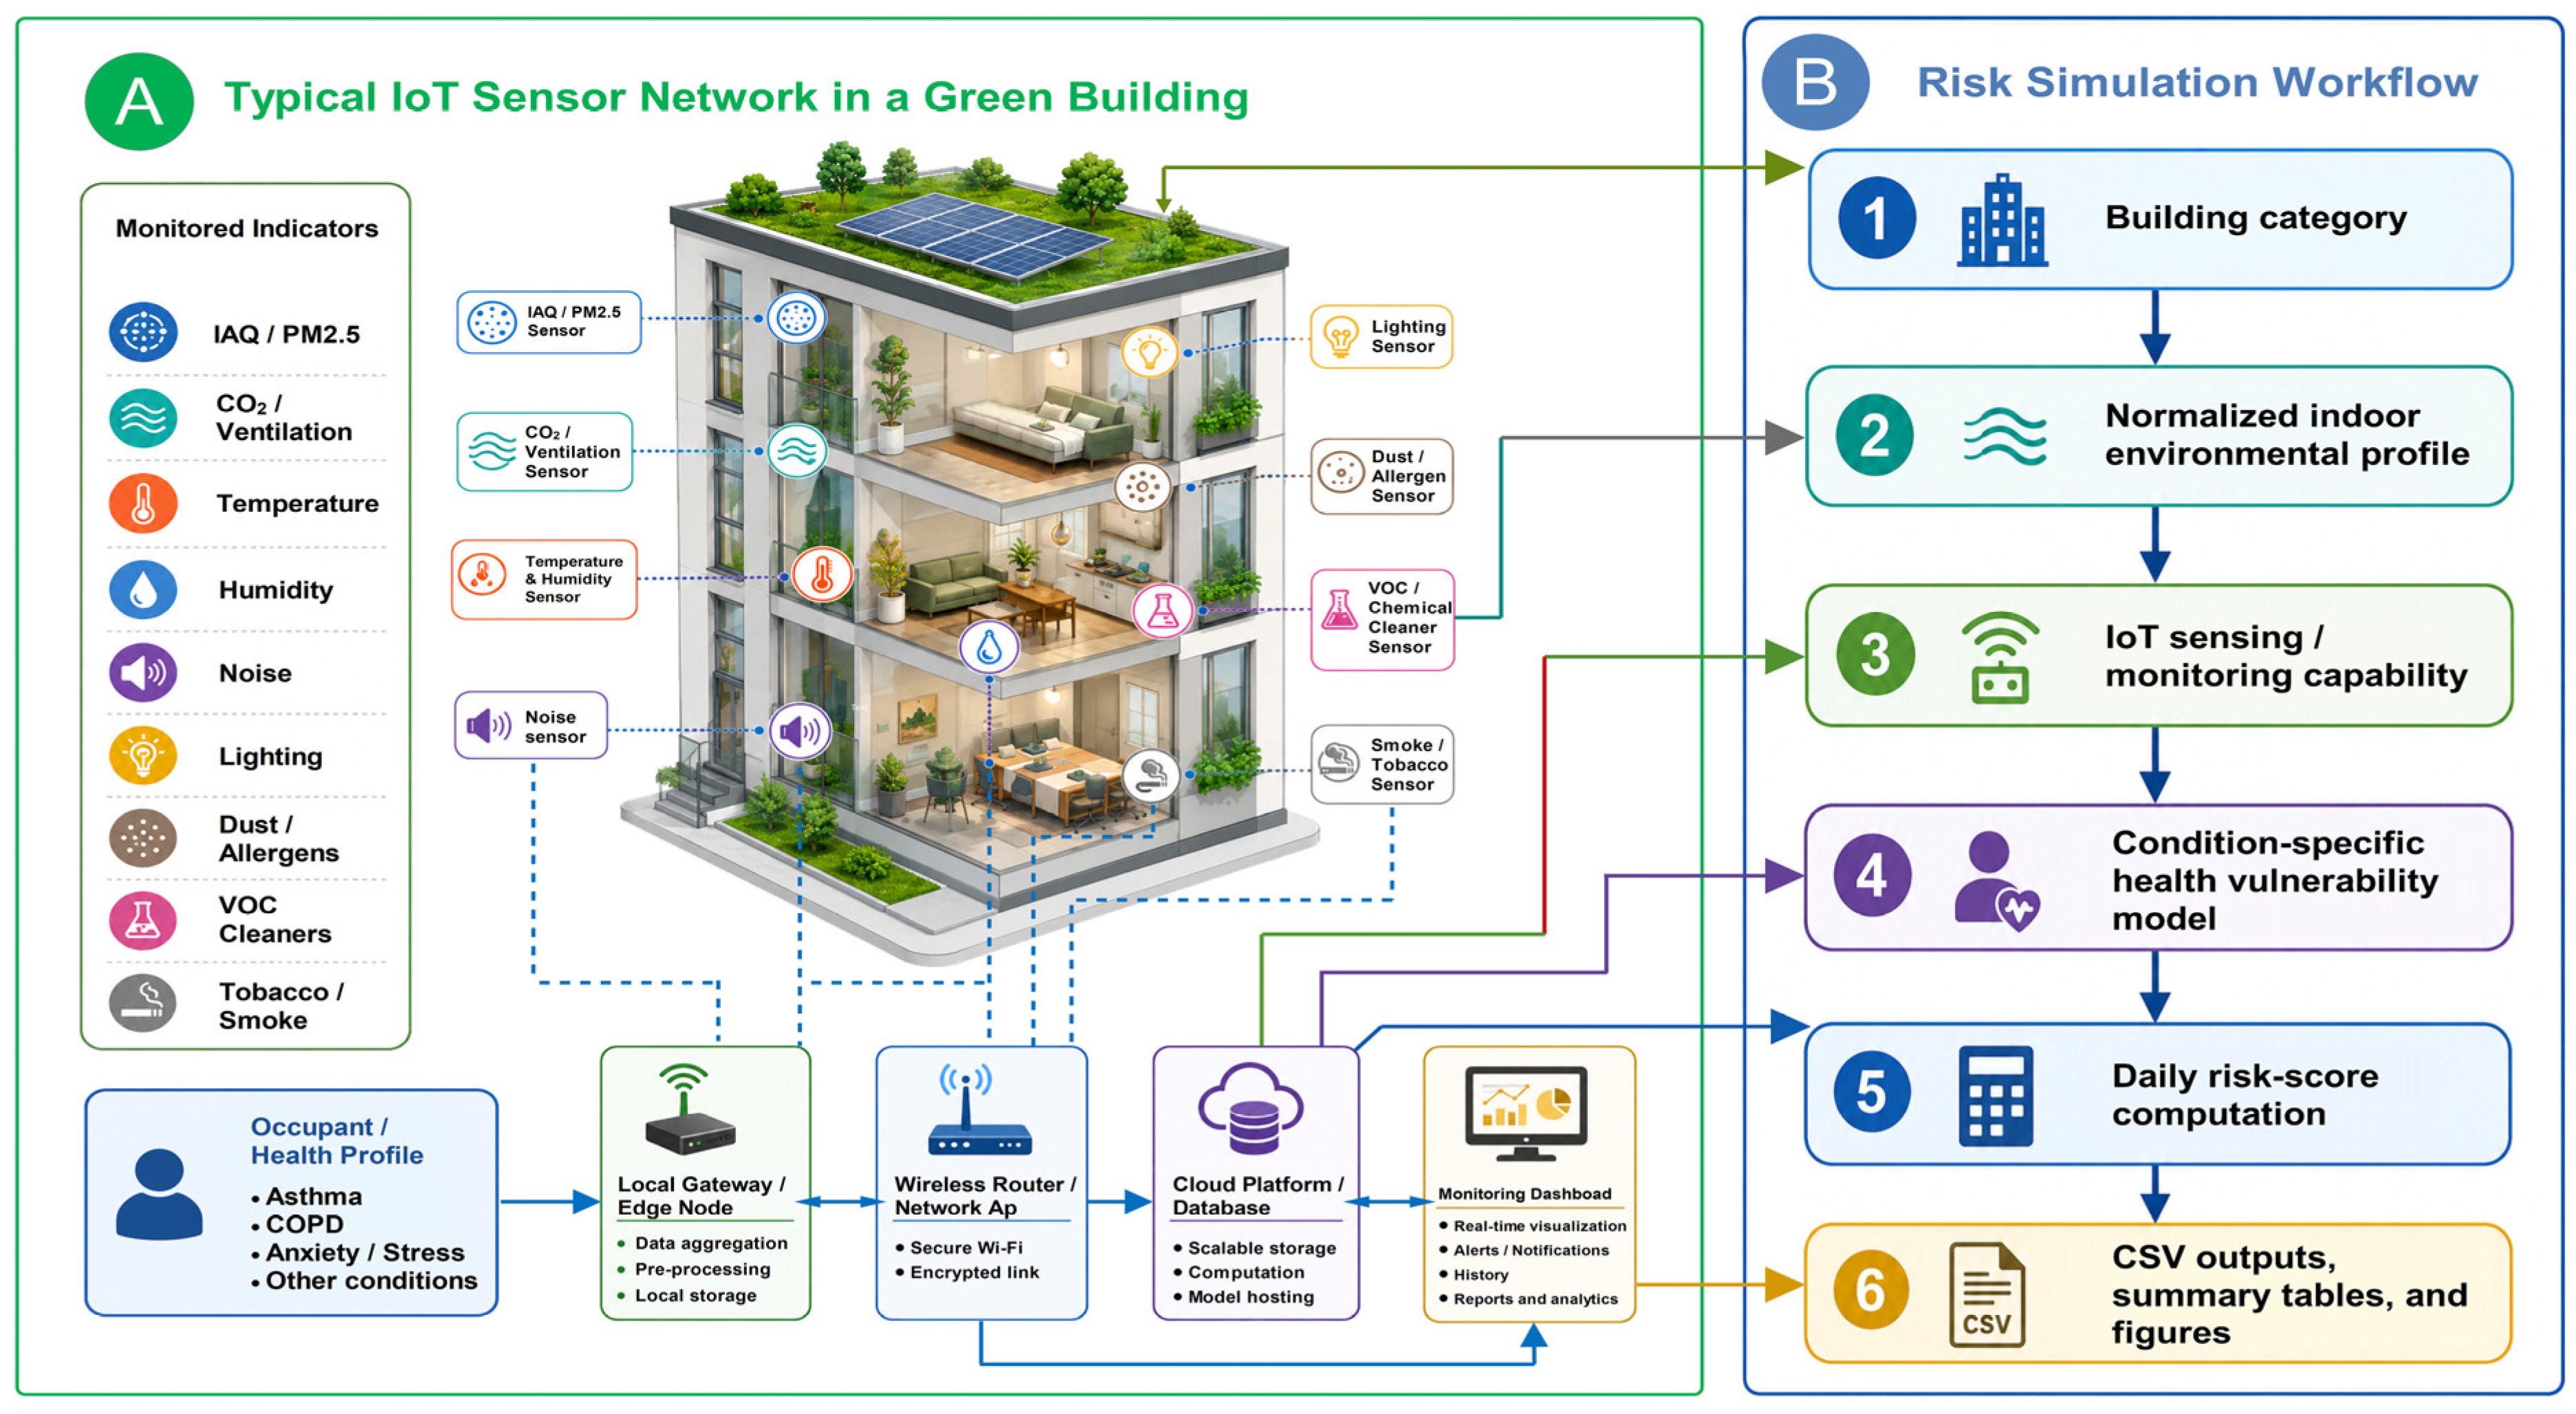
The second layer corresponds to the IoT sensing and network infrastructure (Figure 2). In the proposed scenario, each indoor environmental indicator can be associated with one or more sensing modules. These are connected through a reliable building network. The indicators include indoor air quality and particulate matter, CO2 in relation to ventilation adequacy, thermal conditions, humidity and mould risk, noise, lighting quality, dust/allergens, volatile organic compounds or chemical cleaners, and tobacco/smoke exposure. These nine indicators are explicitly included in both the baseline and extended simulation protocols and correspond to the measurable environmental conditions of each building type. Specifically, monitoring, control, and actuation are treated as related but distinct functions. Monitoring refers to the measurement and transmission of indoor environmental indicators. Control refers to the decision-support logic that interprets these indicators while it evaluates the need for a response. Actuation refers to the physical or behavioral correction that may follow, such as mechanical ventilation, filtration, humidity control, window opening, lighting adjustment, alarms, or occupancy-management actions. Therefore, the monitoring/control parameter used in the simulation should be interpreted as an aggregated system capability, not as the effect of a sensor alone.
Figure 2.
Conceptual system architecture of the proposed IoT risk-score simulation framework. The diagram illustrates the intended sensing, networking, decision-support, and output layers and does not represent a real-world implementation.
The third stage is the computation layer of the proposed risk score. The layer receives the normalized environmental profile of each building, combines it with condition-specific vulnerability weights, applies a monitoring/control correction factor, and updates the simulated risk over the duration of the virtual experiment. In the baseline simulation, three assigned health-condition profiles are considered: asthma, COPD, and anxiety/stress. In the extended simulation, the health-condition set is expanded to five assigned profiles by adding allergies and depression/low well-being. The extended version also includes controlled health-profile deviations and building-specific coefficients for allergies and depression/low well-being.
The output is a normalized risk score between 0 and 100, classified as low for values below 33, moderate for values between 33 and 66, and high for values above 66. This interpretation is also reported in the protocol file generated by the simulator. From a system architecture perspective, the proposed IoT sensing and risk-score workflow can therefore be summarized as shown in Figure 2. This kind of structure makes the simulation compatible with future extensions toward real IoT deployments, where actual sensor measurements could replace predefined environmental profiles. In the present version, network-quality indicators such as latency, packet loss, service availability, throughput, and data variability are not explicitly included in the numerical risk equation. They are reported as future implementation parameters that can be incorporated when real IoT data streams and digital-twin integration are introduced. Similarly, sensor noise, sensor drift, calibration error, sampling frequency, missing values, packet loss, and transmission delay are not modeled in the present simulation stage. They are considered parameters at the implementation level for future real IoT deployments, where normalized indicators could be replaced by measured sensor streams.
Therefore, the term IoT sensing is used in the present work to describe the intended sensing strategy, communication, and data-integration architecture that motivates the normalized environmental indicators and the future deployment pathway. The current version does not claim that physical sensors were deployed or that live sensor streams were collected. Instead, it defines a simulation-ready computational layer that can later receive real IoT measurements, such as PM2.5, CO2, VOC, humidity, temperature, light, and noise measurements, as direct inputs.
2.2. Short Description of the Simulation Code Workflow
The proposed simulation system follows a structured workflow with two simulations. The first level is the simplified baseline simulation, which is deterministic and excludes user-defined deviations and Monte Carlo variability. This allows the model’s basic behavior to be examined without stochastic uncertainty. The second level is the extended simulation, which preserves the same computational logic but introduces an additional building category, two additional assigned health-condition profiles, and controlled health-profile and building-profile deviations. In detail, the user defines the pseudo-sample size, sets the random seed, chooses the duration of the experiment, and selects the simulation version. For the present virtual experiment, the sample size was set to 100 code-generated participants, and the duration was set to 100 days. The model then automatically assigns participants to the available building categories and health-condition profiles. The basic code workflow is shown below:
- Protocol initialization: The simulator initializes the selected version, the number of participants, the experiment’s duration, the random seed, the building categories, the health-condition categories, and the indoor environmental indicators.
- Configuration of building profiles: Each category acquires a normalized exposure profile across the nine indoor environmental indicators. In the baseline simulation, two building categories are considered: BCH and GMH. The BCH receives high exposure values, whereas the GMH receives low exposure values and full monitoring capability. In the extended simulation, the NH is added as an intermediate building category between the BCH and the GMH. Controlled building-profile deviations are also introduced, with 20% for the BCH, 10% for the NH, and 5% for the GMH.
- Configuration of health-condition profiles: In the baseline simulation, three assigned health-condition profiles are used: asthma, COPD, and anxiety/stress. Each profile has a severity coefficient and a vector of weights expressing its sensitivity to the indoor environmental indicators. In the extended simulation, the health-condition set is expanded to five assigned profiles by adding allergies and depression/low well-being. The two added profiles use building coefficients, while controlled health-profile deviations are also included.
- Participant assignment: The 100 code-generated participants are distributed across the available building categories and assigned health-condition profiles. In the baseline simulation, the participants are distributed across the two building categories and the three assigned profiles. In the extended simulation, the same assignment logic is applied across three building categories and five assigned health-condition profiles.
- Daily risk-score calculation: For each participant and simulated day, the model computes a risk score as a function of building exposure, health-condition vulnerability, monitoring capability, and time-dependent risk adjustment. This adjustment can either increase the score in poorly conditioned environments or reduce it in monitored green environments. In the extended simulation, the calculation also includes the controlled deviations and the building-specific coefficients used for allergies and depression/low well-being (W-B).
- Output generation: The simulator produces participant-level data, daily group-mean risk values, final summary statistics, a protocol file, and graphical outputs. In the extended simulation, aggregated building results are also produced to summarize the final risk across all assigned health conditions (factors) for each building category.
- Result visualization: Three main figures are produced: mean risk over time by building category, final risk by building category, and a final risk matrix by building category and assigned health-condition profile. In the extended simulation, these figures show the three-category comparison among BCH, NH, and GMH.
2.3. Mathematical Formulation of the Risk Score
The mathematical formulation below describes the core risk-score mechanism used in the baseline simulation. The same formulation is also used in the extended simulation. Therefore, the extended scenario does not change the structure of the risk score. Ιt only expands the set of building categories and assigned health-condition profiles and modifies selected parameter values. Therefore, the baseline simulation uses BCH and GMH with three assigned health-condition profiles, while the extended simulation adds NH and expands the assigned profiles to five. In the extended case, controlled building-profile and health-profile deviations are also introduced, and the allergies and depression/low well-being coefficients are defined as building-specific. Thus, the equations below should be understood as the common computational core of both the baseline and extended simulations.
It should be emphasized that the predefined environmental profiles are scenario inputs based on proper scientific assumptions, but not empirical measurements. Consequently, the results are not presented as independent evidence of real-world clinical risk reduction. They are used to verify the internal behavior of the proposed normalized risk-score model and to examine how the same computational structure performs under adverse, intermediate, and monitored green building scenarios.
Let b denote the building category, c the chronic-condition profile (factor), k the indoor environmental indicator, and d the simulation day. Factor c refers to the three assigned profiles such as asthma, COPD, and anxiety/stress. In the extended simulation, the same notation is retained, but c also includes allergies and depression/low well-being. Additionally, in the extended simulation set, b includes NH, apart from BCH and GMH. Each building is represented by a normalized exposure vector (Equation (1)). Each chronic-condition profile is represented by a weight vector (Equation (2)). Also, the environmental exposure score (condition-weighted) for each combination of building type and health-condition profile is shown in Equation (3).
where Eb,k ∈ [0, 1]. A value close to 0 represents an optimal or low-risk indoor condition, while a value close to 1 represents an adverse indoor condition. In the present simulation, K = 9, corresponding to the nine indoor indicators used in the protocol. The monitoring parameter is excluded from this equation. The latter is a control/moderator factor that reduces or modifies the final risk.
where wc,k expresses the relative sensitivity of condition c to environmental indicator k. For transparency, the numerical sensitivity weight vectors used in the simulation are reported in Table 1. These values are dimensionless weights and express the relative contribution of each indoor environmental indicator to each assigned health-condition profile. They are not clinical regression coefficients, diagnostic coefficients, or epidemiological effect values. The weights are used only to define the relative sensitivity of each simulated profile to the nine normalized indoor environmental indicators.
Eb = [Eb,1, Eb,2,…, Eb,k]
Wc = [wc,1, wc,2,…, wc,k]
Table 1.
Dimensionless sensitivity weight vectors used for the assigned health-condition profiles.
The baseline vulnerability of each health condition is represented by a severity coefficient Sc. So the utilized severity coefficients have the values of 1.10 for asthma, 1.20 for COPD, and 1.10 for anxiety/stress. COPD was assigned the highest multiplier, supported by recent evidence indicating a strong association between particulate air-pollution exposure and COPD incidence, including reports of approximately 18% increased COPD incidence per 10 μg/m3 increase in PM2.5 [5].
Before presenting the following conversion, it should be clarified that the procedure is not intended to transform qualitative certainty levels into a clinical effect estimate, diagnostic coefficient, odds ratio, or biostatistical parameter. It is used only as a clear scenario calibration rule within the normalized simulation scale of 0–100. The purpose is to assign a conservative non-zero vulnerability multiplier in a reproducible way, while avoiding the interpretation of this coefficient as a clinically validated asthma-risk constant. So, for asthma, the severity coefficient was not directly extracted as an epidemiological effect size, but was derived indirectly. Since the adopted risk scale classifies values of 1–32 as low, 33–66 as moderate, and 67–100 as high, the qualitative certainty levels reported in the literature were mapped to the lower bounds of the corresponding risk intervals. So, two very-low-certainty associations were conservatively mapped to the minimum value of the very-low range, one low-certainty association was mapped to the lower bound of the low range, and one moderate-certainty association was mapped to the lower bound of the moderate range. Using very low = 1, low = 16, and moderate = 33, the average evidence score becomes: (1 + 1 + 16 + 33)/4 = 12.75 on a 0–100 scale. This corresponds to approximately 13%, which was rounded down to a conservative 10% amplification. Therefore, the asthma severity coefficient was set to Sc = 1.10. This value should be interpreted as a normalized simulation assumption reflecting elevated vulnerability to indoor environmental stressors, rather than as a clinically calibrated asthma-risk constant [6].
Consequently, Sc = 1.10 should be read as a bounded modeling value obtained through a clear normalization rule, not as an evidence-based medical coefficient. Future versions of the model should recalibrate this coefficient using measured exposure data, real occupant information, questionnaire outcomes, or clinical validation datasets.
Furthermore, for the anxiety/stress profile, the severity coefficient was found using a reverse interpretation of reported IEQ stress associations. Thach et al. showed that a one-unit increase in perceived air quality, thermal comfort, noise, and light-quality scores was associated with lower odds of stress at work, with odds ratios of 0.88, 0.89, 0.93, and 0.88, respectively. These values correspond to approximate stress-odds reductions of 12%, 11%, 7%, and 12%, with a mean protective association of 10.5%. Since the proposed simulator represents vulnerability under non-ideal indoor environmental conditions, this protective association was inverted and used as a positive stress-vulnerability multiplier. Accordingly, the anxiety/stress coefficient was set to Sc = 1.10. This conversion should not be interpreted as a causal inversion, clinical effect-size estimate, or epidemiological risk coefficient. It is used only as a conservative normalized modeling scalar indicating that poorer perceived indoor environmental quality may increase stress-related vulnerability within the simulated scenario. Therefore, Sc = 1.10 for anxiety/stress should be understood as a literature-based simulation parameter and not a clinically calibrated risk constant [7].
Also, the monitoring capability of each building is represented by mb, where values closer to 1 represent higher monitoring and control capability. The monitoring capability is computed based on Equation (4). This term reduces the risk score in buildings, where stronger monitoring and control capabilities are applied. Therefore, a green monitored building benefits from a lower effective risk contribution, while a poorly monitored building retains a higher risk score. Specifically, the coefficient aM was set to 0.35 as a conservative approximation. This value was guided by reported IAQ intervention effects rather than treated as a universal clinical constant. In particular, an international office-building study reported approximately 30.9–39.4% lower indoor PM2.5 in buildings with higher-efficiency filtration, corresponding to a central value of about 35.15% [8]. In addition, a systematic review reported PM2.5 reductions in the range of 31–53%, corresponding to a central value of about 42% [9]. Averaging these two central estimates gives approximately 38.6%. Based on the previous calculation, aM was set to 0.35. This term represents the assumed corrective effect of real-time sensing, environmental supervision, filtration/ventilation support, and adaptive control, and should be recalibrated in future work by using building-specific sensor data.
Mb = 1 − aMmb, where aM = 0.35 and mb ∈ [0, 1]
The constructed risk score is first defined through an initial risk value, which combines the indoor environmental score, the baseline vulnerability of the selected health-condition profile, and the monitoring/control capability of the building. Thus, the initial risk score for building type b and health-condition profile c is calculated by Equation (5).
where Pb,c is the weighted indoor environmental score, Sc is the severity coefficient of health-condition profile c, and Mb corresponds to the monitoring correction factor of building type b. Multiplying by 100 converts the normalized score into a 0–100 risk scale. Furthermore, for asthma, COPD, and anxiety/stress, the severity coefficient remains condition-based. In the extended simulation, allergies and depression/low well-being use building-specific coefficients because their values were derived from building-related exposure assumptions.
R0,b,c = 100 ⋅ Pb,c ⋅ Sc ⋅ Mb
To account for the temporal evolution, a time-dependent factor is introduced. Let D denote the total number of simulation days and ac,b the time-slope coefficient associated with health-condition profile c in building type b. The temporal factor is calculated by Equation (6). At d = 1, the temporal factor is equal to unity, meaning that the risk score starts from its initial value. At d = D, the full effect of the time-slope coefficient is reached. Therefore, positive values of ac,b represent progressive degradation, whereas negative values represent gradual improvement.
The final daily risk score is then obtained by applying a bounded saturation operator, as shown in Equation (7). The operator B [0,100] (·) constrains the resulting score within the normalized 0–100 range. All participants within the same building-condition group have identical risk trajectories. This bounded formulation is intended for categorical low-, moderate-, and high-risk stratification and not for fine-grained ranking among extreme high-risk cases. Therefore, when several adverse BCH scenarios reach the upper boundary, this should be interpreted as a ceiling effect of the normalized 0–100 scale and not as evidence that all extreme cases are physically or clinically identical. Future versions may introduce an additional non-saturating auxiliary index to differentiate very high and extreme simulated cases.
R(b,c)(d) = B[0,100](R0,b,cT(c,b)(d)) where B[0,100](x) = min{100, max{0,x}}
2.4. Baseline Simulation Setup
The simplified simulation experiment was configured as follows in Table 2. Also, the two types of building categories (BCH and GMH) are described through normalized environmental profiles, which are shown in Table 3.
Table 2.
Simulation configuration.
Table 3.
Simulated environmental variables.
As for the values in Table 3, these are normalized simulation inputs rather than direct physical measurements. They are expressed on a dimensionless 0–1 risk scale, where values close to 0 represent well-controlled indoor conditions and values close to 1 represent adverse indoor environmental conditions. Therefore, they are interpreted as dimensionless exposure factors suitable for simulation and comparative assessment. For example, the IAQ/PM2.5, CO2/ventilation, humidity/mould, VOC/cleaners, noise, lighting, dust/allergens, and tobacco/smoke indicators should be interpreted as normalized environmental risk-pressure indicators. They do not replace physical units, regulatory thresholds, or sensor-specific values. Instead, they provide a first reproducible modeling layer that can later be calibrated with measured PM2.5, CO2, VOC, humidity, noise, lighting, and other sensor data. The selected indicators were based on established housing-health and indoor environmental quality literature. WHO housing and indoor air-quality guidance highlights the importance of housing conditions, thermal conditions, dampness and mould, and indoor air pollutants for occupant health, while recent IEQ literature treats air quality, thermal comfort, acoustic comfort, and visual comfort as core dimensions of healthy buildings.
Accordingly, the bad climate house (BCH) was assigned high normalized values, typically between 0.60 and 0.90, presenting obvious adverse indoor environmental conditions such as poor air quality, inadequate ventilation, humidity/mould risk, dust/allergen presence, chemical exposure, and smoke-related burden. In contrast, the green monitored house (GMH) was assigned low normalized values, typically between 0.00 and 0.20, representing a controlled green building environment. The monitoring column is not an environmental exposure indicator, and it will be analyzed later in this paper [10,11,12,13,14].
2.5. Baseline Simulation Results
The baseline simulation produced three main output stages: daily risk evolution, final building-level comparison, and final risk matrix by building and health-condition profile. The final summary table (Table 4) shows strong uncorrelated conditions between the BCH and the GMH. At the building level, the weighted final mean risk was approximately 100.00 for the BCH and 9.37, i.e., [(17 × 8.59) + (17 × 10.02) + (16 × 9.50)]/50, for the GMH. Thus, the final risk in the GMH was approximately 90% lower than in the BCH across the three simulated health-condition profiles. For each building type b and health-condition profile c, the participant subset is denoted as Ωb,c, with cardinality Nb,c. The initial mean risk, final mean risk, and mean risk variation reported in Table 4 are calculated as follows in Equations (8)–(10). Also, the levels low, moderate, and high are found by the classification of .
Table 4.
Final risk by building and health condition.
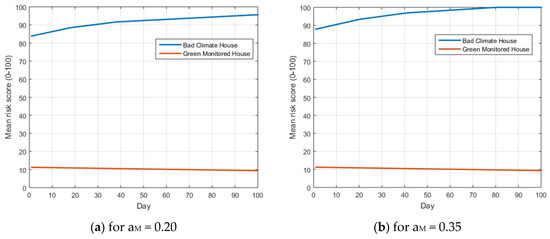
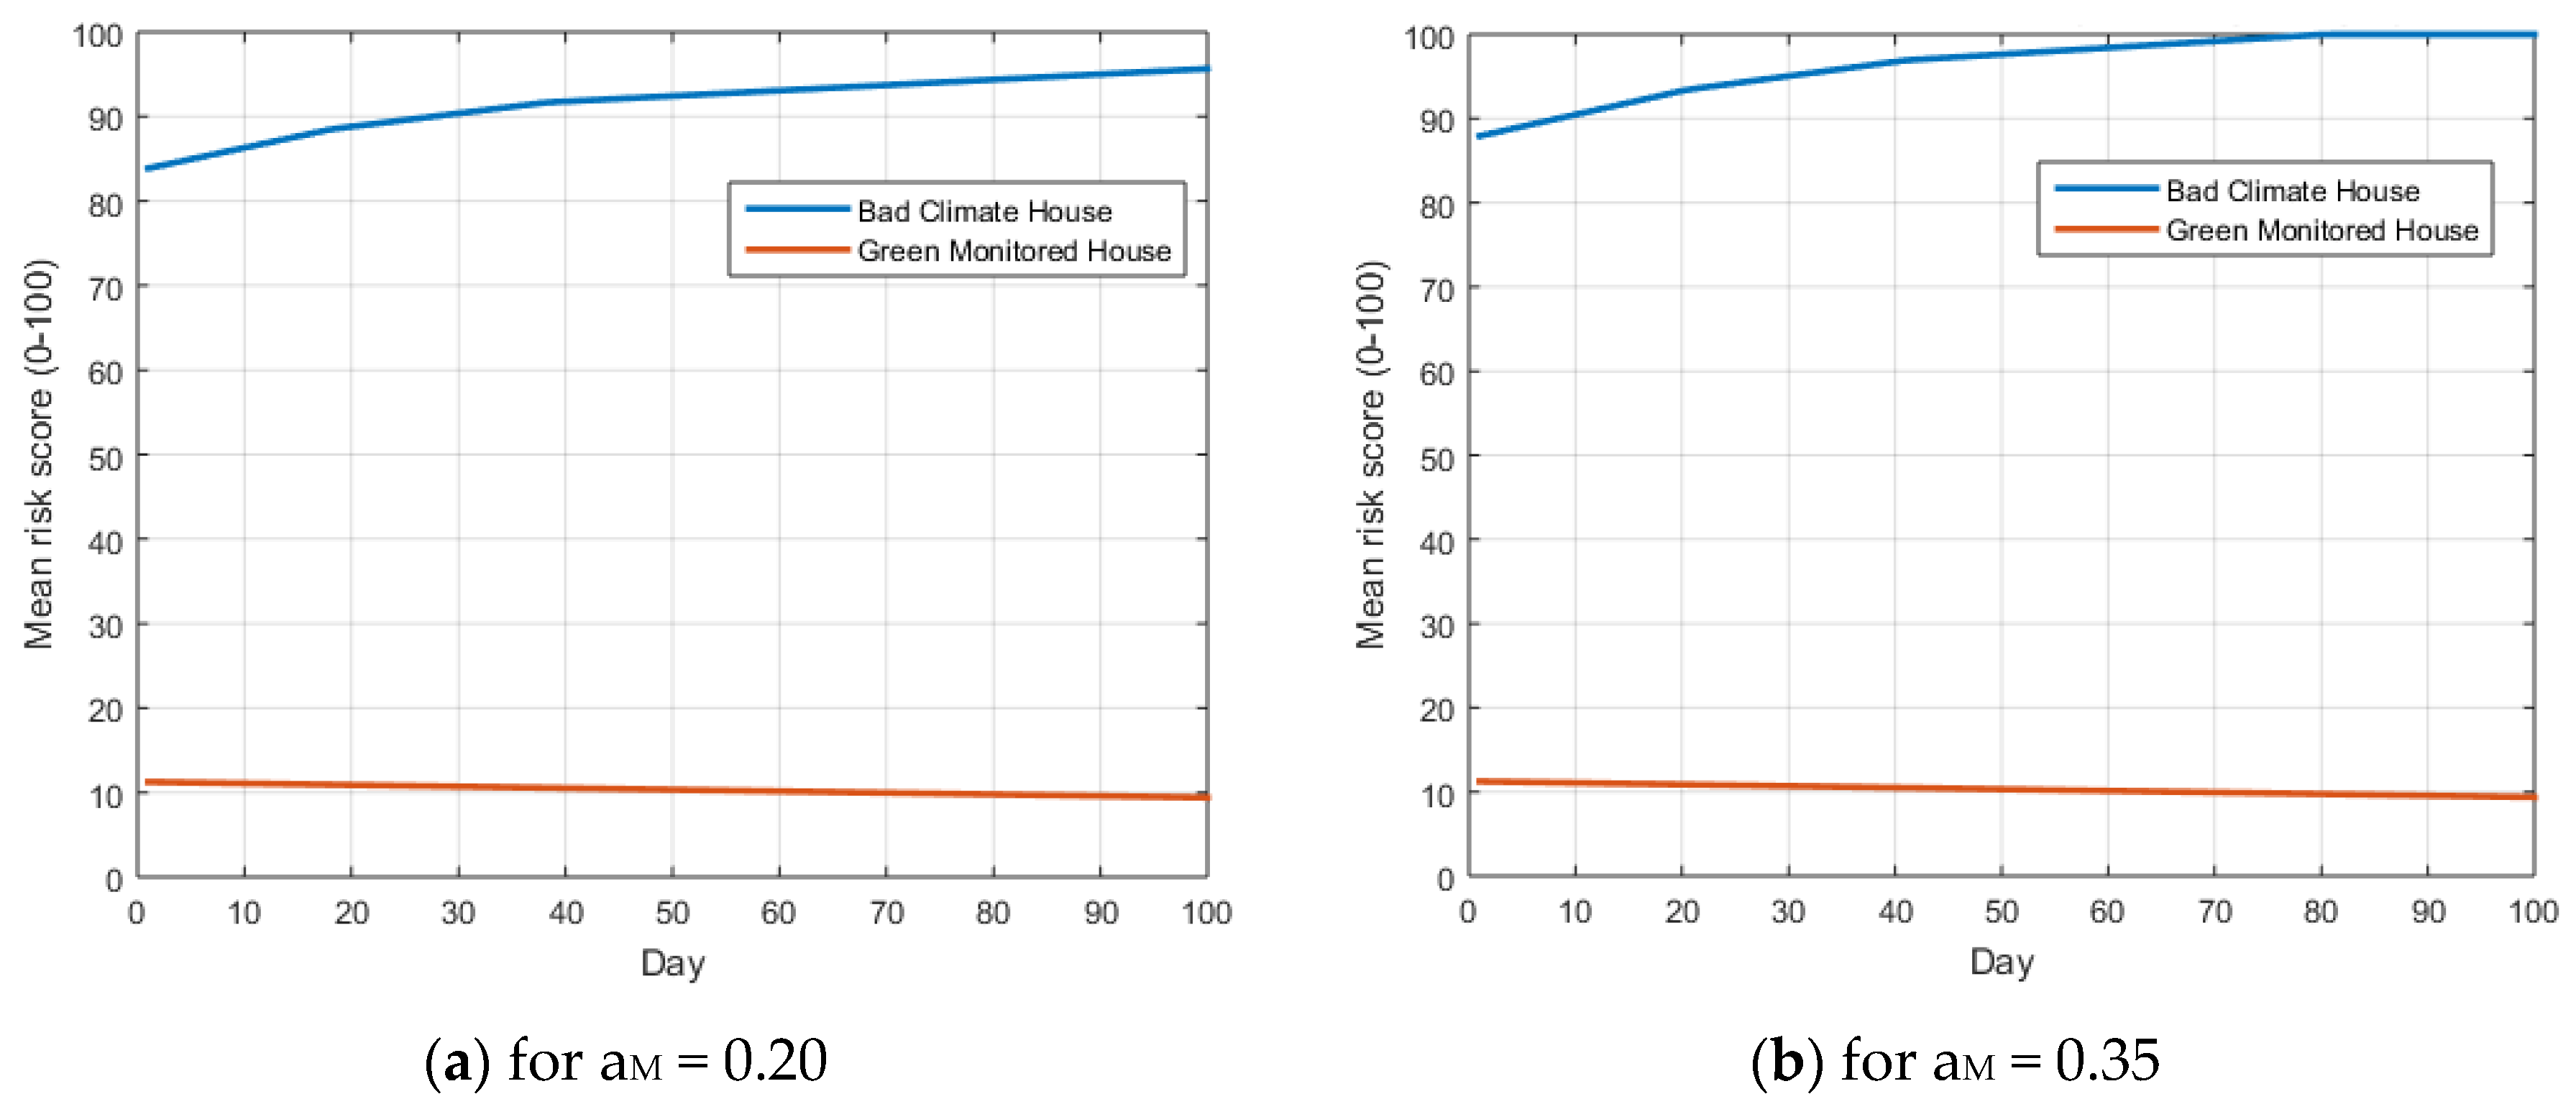
The produced Figure 3a,b depicts the mean risk evolution over the 100-day period. The comparison between the two monitoring-correction settings shows that the GMH remains consistently within the low-risk region for both αM = 0.20 and αM = 0.35. This indicates that the green monitored environment is risk-stable, since its advanced IoT-based sensing and control capability, combined with improved indoor environmental conditions, allows the system to sustain low-risk operation even under different monitoring-correction assumptions. In contrast, the BCH does not benefit substantially from the monitoring condition because its corresponding value is very low. As a result, the adverse indoor environmental profile dominates the simulation, and the risk trajectories progressively increase, reaching the maximum risk boundary of 100. Therefore, the comparison highlights that monitoring capability becomes meaningful only when it is embedded in a properly structured green building environment. In poorly monitored and poorly conditioned buildings, it is obvious that the lack of effective sensing and control allows risk deterioration to reach saturation levels.
Figure 3.
Mean risk score by housing category.
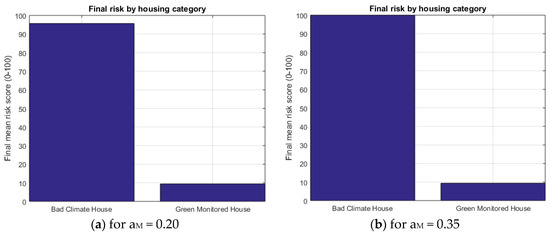
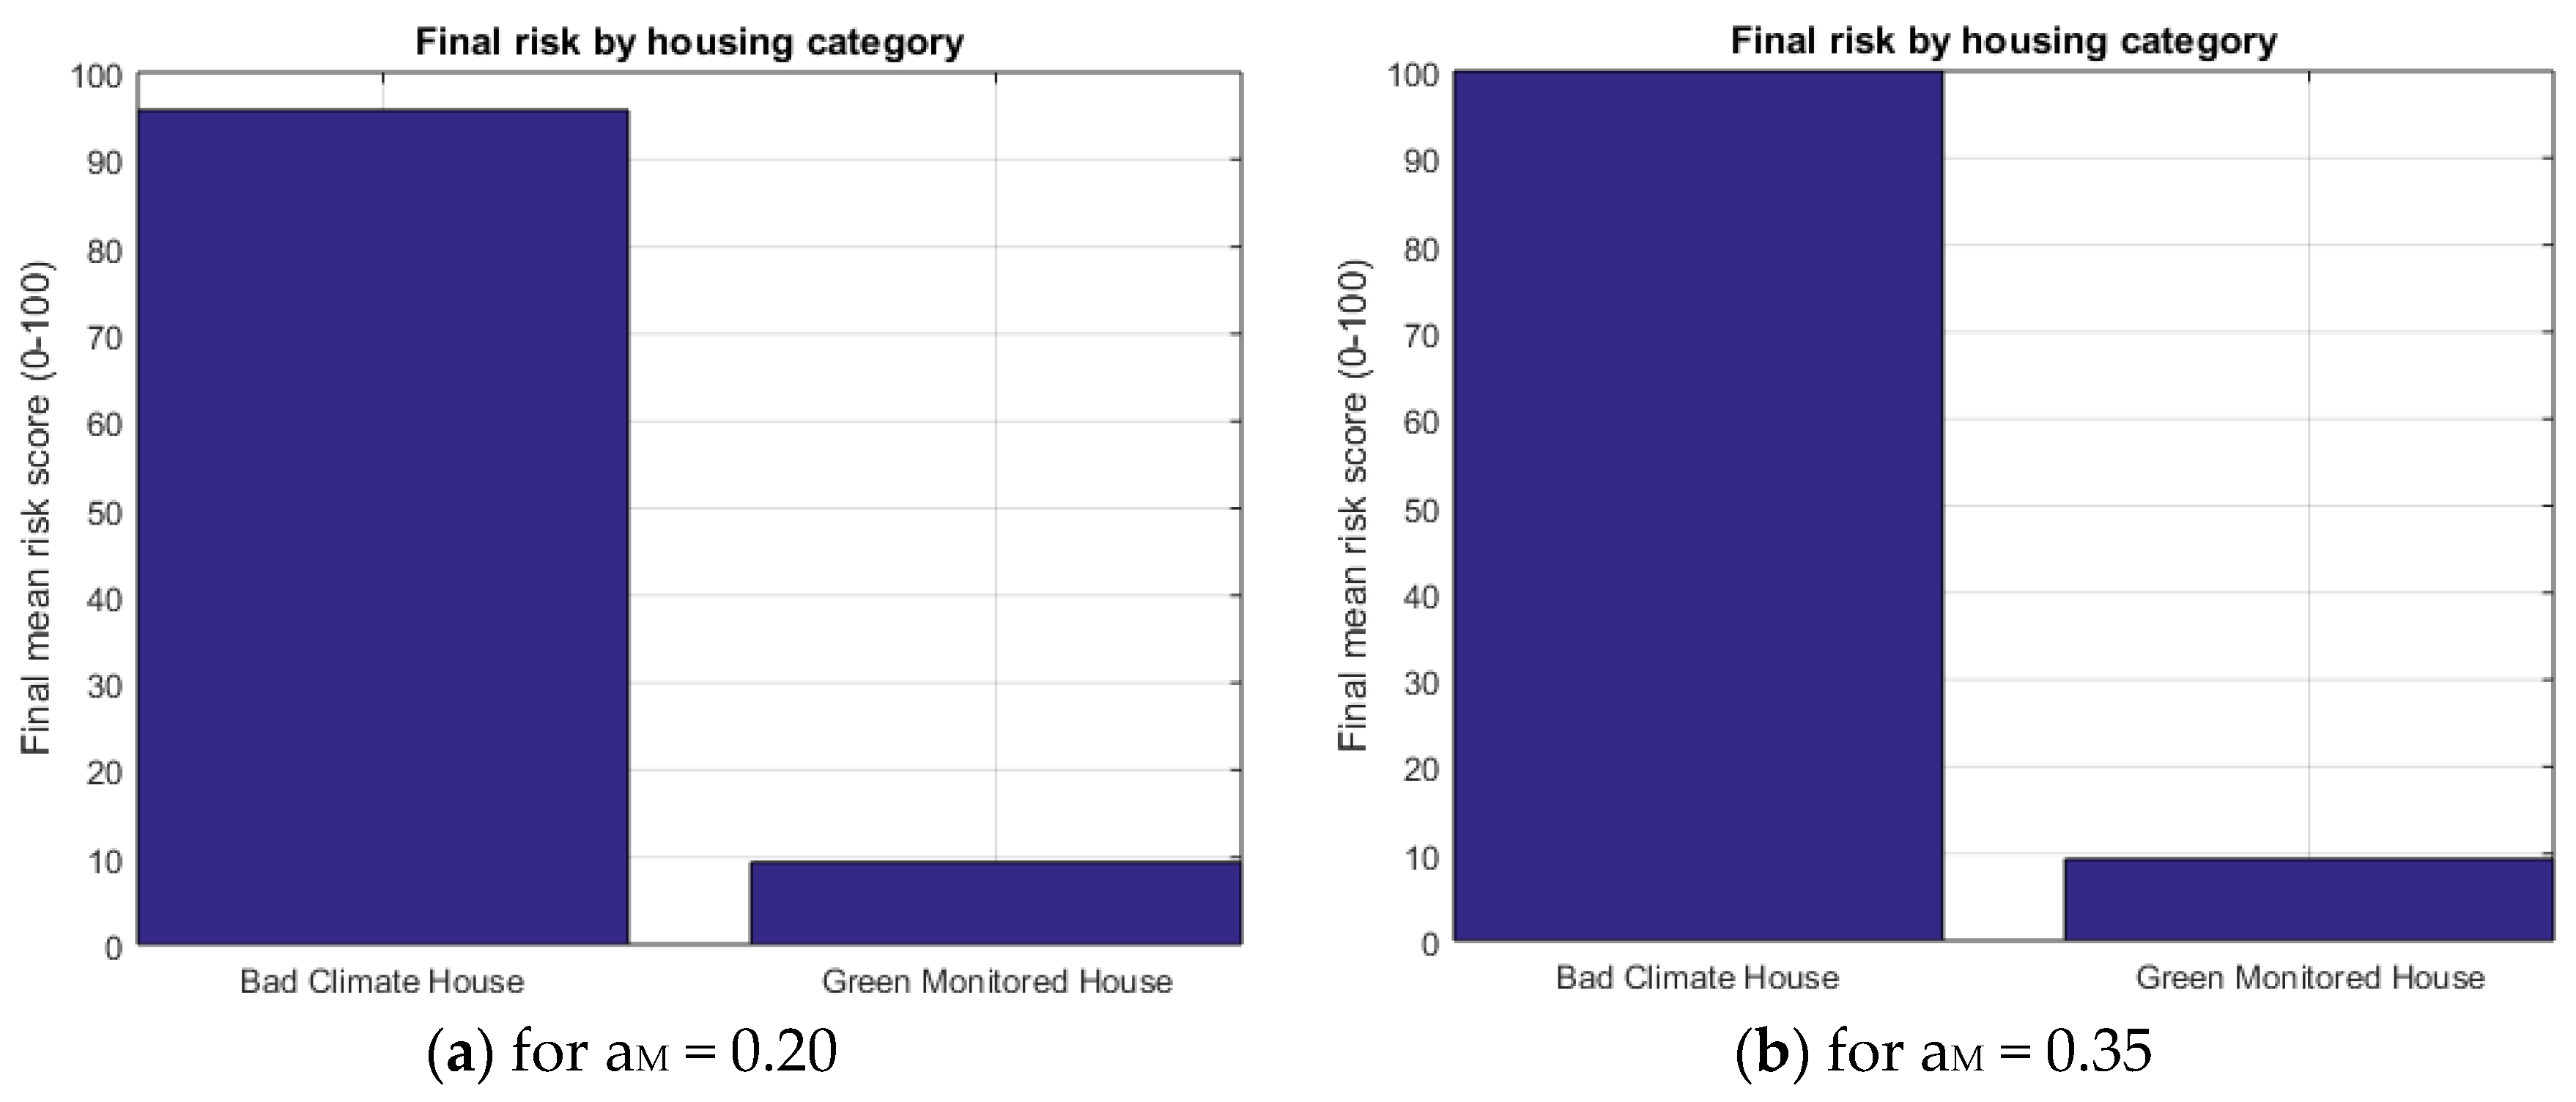
Figure 4a,b depict the final mean risk by building category for the two monitoring-correction settings, αM = 0.20 and αM = 0.35, respectively. In both cases, the BCH reaches a very high final mean risk, while the GMH remains within the low-risk range. The comparison indicates that the BCH is practically unable to benefit from the monitoring correction, since its monitoring/control value is very low. Furthermore, a deterioration of about 10% for αM = 0.35 is evident. Therefore, the adverse indoor environmental profile dominates the final outcome. Conversely, the GMH remains consistently low-risk under both settings, showing that the improved indoor environmental profile, together with advanced IoT-supported monitoring and control capability, sustains stable low-risk operation.
Figure 4.
Final mean risk.
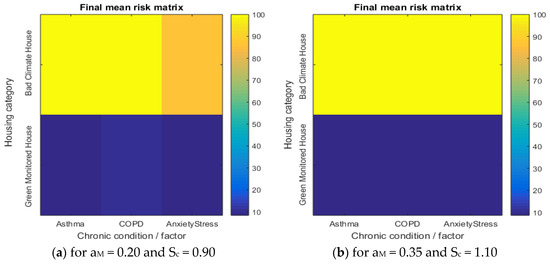
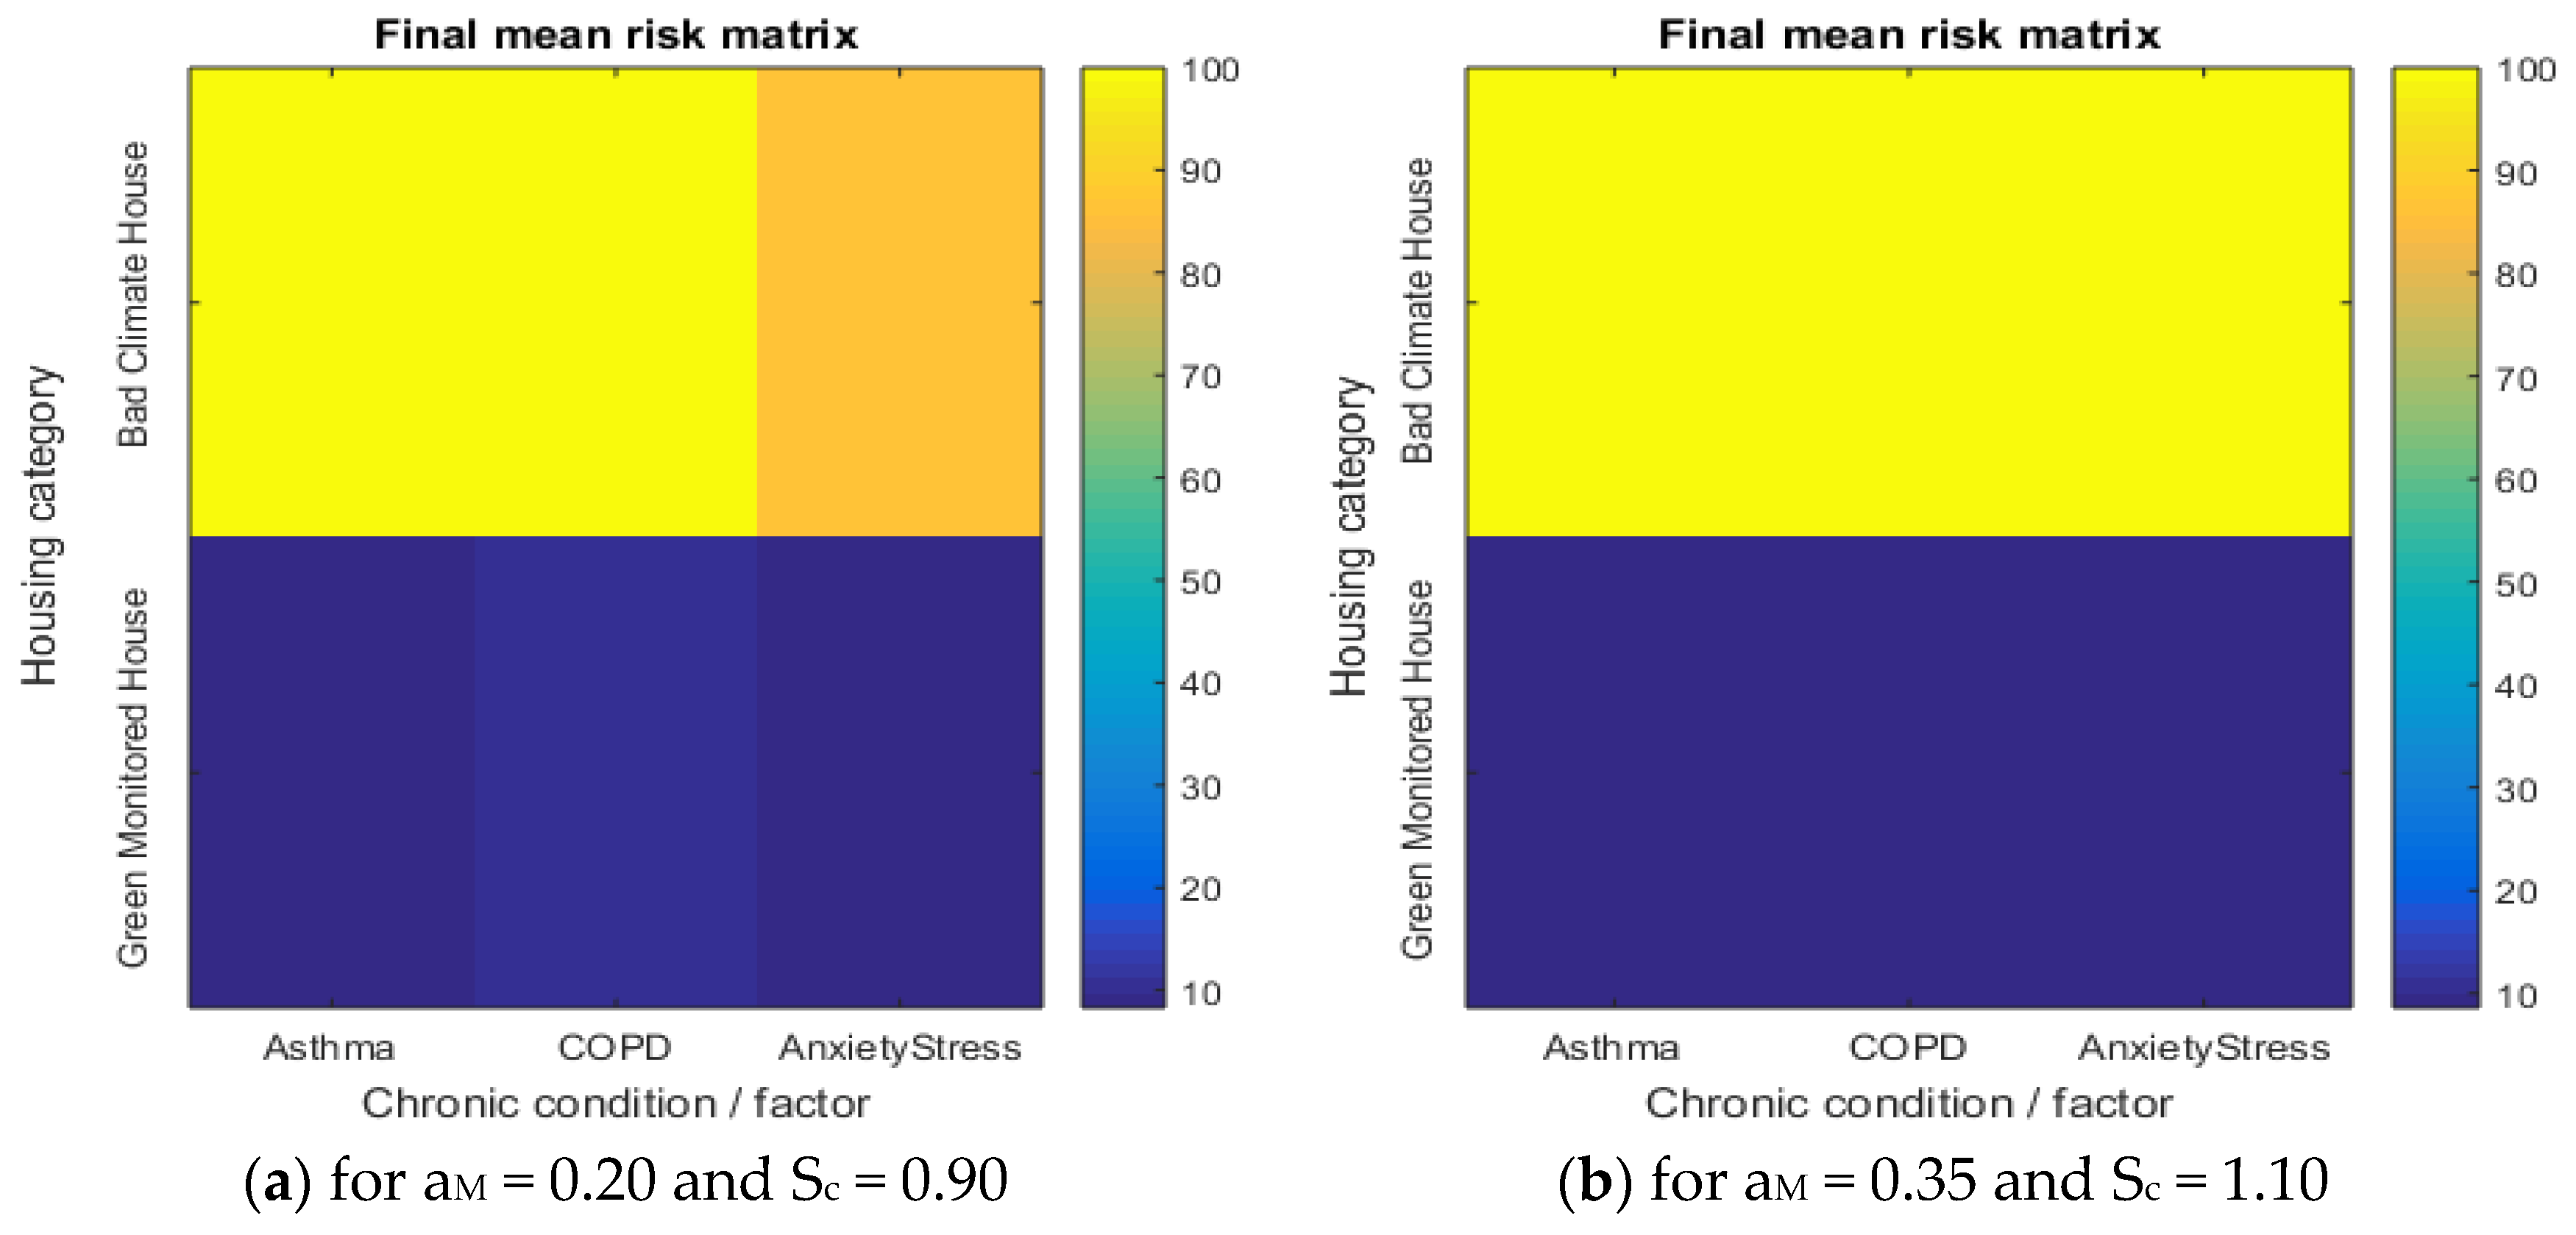
Figure 5a represents a more robust scenario relevant to BCH, where the monitoring-correction coefficient is set to αM = 0.20 and the anxiety/stress severity coefficient is assigned to Sc = 0.90. This setting intentionally assumes a favorable anxiety/stress condition, corresponding to a 10% reduction relative to the neutral reference level of Sc = 1.00. In simple words, anxiety/stress is not treated as an aggravating vulnerability factor in the case of Figure 5a. The purpose of this configuration is to examine whether the separation between the bad climate house (BCH) and the green monitored house (GMH) remains evident even under a stress-reduced occupant assumption in favor of the BCH. Figure 5b represents the revised literature-based calibration (correct one), where αM = 0.35 and the anxiety/stress coefficient is set to Sc = 1.10, based on logical literature-based assumptions (examined earlier in this paper). In both cases, the BCH remains in the high-risk region, whereas the GMH remains in the low-risk region, indicating that the observed separation is mainly driven by the indoor environmental profile and monitoring capability rather than by a single health-condition coefficient.
Figure 5.
Final mean risk matrix.
Overall, the comparison between αM = 0.20 and αM = 0.35 shows that a better value for monitoring (αM = 0.20, about 40% better than αM = 0.35) does not even artificially improve a poorly monitored building such as the BCH. Instead, the BCH remains dominated by its adverse indoor environmental conditions and progressively reaches the highest risk range. The GMH, on the other hand, remains robustly within the low-risk region, indicating that monitoring and control capability becomes meaningful when embedded in a properly structured green building environment with improved indoor environmental characteristics.
2.6. Additional Simulations and Results
In addition to the simplified scenario, an extended simulation was conducted to examine the behavior of the proposed framework under more complex conditions. The purpose of this additional analysis was not to redefine the risk-score model, which has already been described in the previous subsections. Instead, the goal was to evaluate whether the observed separation between poor and green monitored housing conditions remains at the same non-comparable levels when an intermediate building category and controlled deviations are introduced to better reflect real-world conditions.
To explain the necessity of the extended scenario, a brief explanation is given. The study was divided into two complementary simulation levels. The first level provides a clear and deterministic baseline by comparing a bad climate house (BCH) and a green monitored house (GMH) across three selected health-condition profiles. This configuration is useful for isolating the model’s basic behavior and for showing the direct differences between adverse and improved monitored indoor environments.
The second level, represented, introduces a more detailed scenario. In this case, three building categories are considered: bad climate house (BCH), normal house (NH), and green monitored house (GMH). The NH was included as an intermediate category, allowing the model to examine not only the contrast between the worst and best housing conditions, but also the behavior of a moderate indoor environment. This is important because real buildings are rarely limited to two extreme cases. Instead, they often occupy an intermediate region between poorly conditioned and fully monitored green buildings. Moreover, inside a building, these three aforementioned living conditions referring to BCH, NH, and GMH can co-exist, as different apartments could meet the standards of three categories.
The extended simulation also includes two additional health-condition profiles, for a total of five. These are asthma, COPD, anxiety/stress, allergies, and depression/low well-being. These two additional profiles were configured using literature-derived ranges from studies on indoor dampness, mould, allergic rhinitis, depression, and psychological distress, rather than by assigning arbitrary coefficients.
As for the allergy profile, the coefficient was found by combining two sources. First, Jaakkola et al. [15] reported increased allergic rhinitis risk associated with indoor dampness and mould indicators, with reported estimates including a low review-based value of 1.12, a visible mould-related estimate of 1.82, and a maximum reported value of 2.18 [15]. Second, dampness and mould in homes have been summarized as being associated with approximately 30% to 50% increases in several respiratory and asthma-related health outcomes [16]. These values were used to construct three building-specific allergy coefficients. For the bad climate house, the high exposure coefficient was calculated as the average of the maximum reported estimate and the upper dampness/mould increase, i.e., (2.18 + 1.50)/2 = 1.84 ≃ 1.80. For the normal house, the intermediate coefficient was calculated using the visible mould estimate and the lower dampness/mould increase, i.e., (1.82 + 1.30)/2 = 1.56 ≃ 1.55. For the green monitored house, the coefficient for the controlled condition was calculated using the lowest-based estimate from review [15] and the reference condition from [16], i.e., (1.12 + 1.00)/2 = 1.06. Therefore, the allergy coefficients used in the extended version of the simulation were set to 1.80 for the BCH, 1.55 for the NH, and 1.06 for the GMH. This building-specific parameterization reflects a way of weighting allergy across adverse, intermediate, and controlled housing conditions.
For the depression/low well-being profile, the coefficient was guided by two studies linking dampness, mould, and housing quality with mental health outcomes. Shenassa et al. [17] reported that dampness or mould in the home was associated with depression, with odds ratios of 1.39, 1.44, and 1.34 for minimal, moderate, and extensive exposure, respectively, compared with no exposure [17]. Gatto et al. reported that damp housing exposure was associated with psychological distress with an odds ratio of 1.09, while the strongest combination of dampness indicators, condensation and rot in windows or floors, reached an odds ratio of 1.25 [18]. These values contributed toward the construction of the coefficients for the three building types. For the BCH, the high exposure coefficient was calculated as (1.44 + 1.25)/2 = 1.345 ≃ 1.35. For the NH, the intermediate coefficient was calculated by combining the minimal dampness/mould depression estimate with the midpoint of the psychological distress range to be described by [1.39 + ((1.09 + 1.25)/2)]/2 = 1.28. For the GMH, a controlled but non-zero background vulnerability coefficient was included. This value was calculated by combining a reduced estimate of 1.30 with the lowest psychological distress estimate. This is shown through (1.30 + 1.09)/2 = 1.195 ≃ 1.20. Consequently, the depression/low well-being coefficients used in the extended simulation were set to 1.35 for the BCH, 1.28 for the NH, and 1.20 for the GMH. These coefficients should not be interpreted as direct clinical risk constants. Instead, they are normalized simulation coefficients derived from literature research and used to represent a graded vulnerability response across the three housing categories.
Furthermore, controlled deviations were introduced in both the health-profile and the building-profile parameters. These deviations were used to emulate the variability between individuals and non-uniform building conditions while keeping the simulation reproducible and interpretable. In this way, the extended scenario provides additional drawbacks in the proposed framework without converting the study into a full Monte Carlo. The latter should include extended validations to provide the exact profiles of each resident while accomplishing uncertainty analysis. Consequently, this is a future goal based on the conclusions of the current study.
For the extended simulation, the number of code-generated participants was set again to 100 individuals, the simulation duration was set to 100 days, and the random seed was kept equal to 12345. The monitoring-correction coefficient was set to αM = 0.35, corresponding to the revised calibration (literature-based) adopted in the final model. The health-profile deviations were set to 15% for asthma, COPD, and allergies, and to 20% for anxiety/stress and depression/low well-being (W-B). The building-profile deviations used in the extended simulation were defined as uncertainty ranges derived from scenarios in the literature. They were not treated as direct empirical constants, but as controlled deviation levels extracted from reported uncertainty ranges in building performance simulation and construction reliability literature. These deviation values should therefore be read as ordered scenario stress-test bands rather than as measured building variance estimates. Their purpose is not to validate the model empirically, but to test whether the proposed formulation preserves an interpretable stratification under adverse, intermediate, and green conditions when controlled variability is introduced. The ordering of BCH, NH, and GMH is intentionally preserved because the extended simulation is designed as a structured scenario analysis, not as a randomized field experiment.
A first reference point is that Macdonald [19] examined the effect of uncertain input data in building performance simulation and considered uncertainty contributions from material properties, occupancy, lighting, equipment, ventilation, and climate. In that study, the thermophysical properties of construction materials were assigned a standard deviation of 10% of the database values. Occupancy and lighting were described as uncertain over a 50% to 100% range, while equipment gains and ventilation rate were assigned 25% uncertainty. Climate uncertainty also included a 15% solar radiation uncertainty. To produce a conservative indicator of building deviation, the lower uncertainty bound was used for occupancy and lighting. Therefore, the first building-deviation estimate was calculated as BD1 = (10% + 50% + 50% + 25% + 25% + 15%)/6 = 29.2%. This value was therefore interpreted as a high-uncertainty simulation reference, appropriate for representing buildings in which several environmental and operational parameters may vary substantially or may only be approximately characterized.
As a second reference point, Nowak and Rakoczy [20] presented statistical uncertainty parameters for building and structural load components using bias factors and coefficients of variation. For dead load, they reported a coefficient of variation of 0.10 for cast-in-place concrete and 0.08 for plant-cast components. Therefore, a second building-deviation estimate was calculated as BD2 = (10% + 8%)/2 = 9%. This value was used as a lower and more controlled construction-related uncertainty reference because dead-load components are more stable and better defined than operational or environmental building parameters.
Based on the two aforementioned literature-based estimates, the NH deviation was set close to the more controlled construction estimate, i.e., BDNH = BD2 = 9% ≃ 10%. Finally, for rounding purposes, BDNH has taken the value of 10%. For the bad climate house, which represents a poorly conditioned and less controlled indoor environment, the deviation was derived by averaging the high-uncertainty simulation estimate and the controlled construction estimate: BDBCH = (29.2% + 9%)/2 = 19.1% ≃ 20%. For the GMH, the deviation value was based on a conservative uncertainty level. Since the GMH represents the most controlled case, supported by continuous IoT-based monitoring, its deviation should remain lower than that of the NH. Therefore, the GMH deviation was set to half of the NH deviation, i.e., BDGMH = 5%.
The final building-profile deviations used in the extended simulation were therefore set to 20% for the bad climate house (BCH), 10% for the normal house (NH), and 5% for the green monitored house (GMH). This strategy of value assignment preserves the intended ordering of building uncertainty, i.e., higher variability for the poorly conditioned building, intermediate variability for the normal building, and lower variability for the green monitored building. These values should therefore be interpreted as literature-extracted deviation parameters, rather than as directly measured building constants.
Overall, the additional simulations were designed to answer a complementary question. This is relevant to whether the proposed risk-score framework still produces a meaningful separation between building categories when the model is expanded from a simplified two-building deterministic comparison to a three-building variability scenario. The results of this extended analysis are presented below and should be interpreted as a controlled deviation analysis rather than as a clinical prediction.
Specifically, in the extended scenario, the risk-score formulation remains based on the same normalized modeling logic that has been described previously. However, the simulation domain is expanded in two ways. First, the building set is extended from two categories to three categories. Second, the health-condition set is expanded from three selected profiles to five profiles by adding allergies and depression/low well-being. Therefore, the additional simulation does not redefine the risk-score equation itself, but generalizes its application to a larger building-condition space. This extension is important because the final building-level risk is no longer determined only by asthma, COPD, and anxiety/stress. Instead, the extended score also includes allergies and depression/low well-being, allowing the model to examine a broader range of physical and psychological vulnerability profiles. The normal house category also provides an intermediate reference condition between the adverse bad climate house and the improved green monitored house. As a result, the extended simulation evaluates whether the proposed framework can advise about a meaningful risk across poor, intermediate, and green monitored housing conditions. Specifically, in the extended simulation, Equations (8)–(10) remain unchanged in form, but their application domain is expanded. Therefore, the additional simulation expands the evaluation range from two buildings with three health-condition profiles each, corresponding to six combinations, to three buildings with five health-condition profiles each, corresponding to fifteen combinations. This extended structure requires the computation of one final mean risk value for each building category. This value is obtained by averaging the final risk scores of all virtual participants assigned to the same building, across the five health-condition profiles included in the extended set, as shown in Equation (11). Specifically, for each building type b, the model first computes the final mean risk for asthma, COPD, allergies, anxiety/stress, and depression/low well-being. These five values are then combined into one building-type final mean risk using a weighted average over the number of virtual participants assigned to each kind of building.
where is the final mean risk of health-condition profile c inside building type b, and Nb is the number of virtual participants assigned to that specific building condition. In this way, the final building value summarizes the five health-condition profiles of the same building into one representative risk score.
Below is Table 5, which is the updated Table 3, including now the indicators for normal building and furthermore the associated deviations. As already mentioned, these indicators are relevant to normalized risk rather than physical units. Consequently, each indoor environmental indicator was mapped to a dimensionless 0–1 scale, where values close to 0 represent well-controlled conditions, whereas values close to 1 represent deteriorated indoor environmental conditions. The selected indicators follow indoor environmental quality parameters commonly reported in housing-health and green building literature. Table 6 extends the health-condition set to five assigned profiles by adding allergies and depression/low well-being to the simplified baseline profiles. Table 7 then summarizes the extended simulation setup.
Table 5.
Extended building profiles and inserted deviations.
Table 6.
Health profiles and controlled deviations.
Table 7.
Extended simulation setup.
Table 5 presents the extended building profiles used in Table 3, while including updates adding the normal house (NH) category and the building-profile deviation assigned to each building type. As in the baseline simulation, the indoor environmental indicators are not expressed in physical units. Instead, each indicator is mapped to a normalized 0–1 risk scale, where values close to 0 represent well-controlled indoor conditions and values close to 1 represent deteriorated indoor environmental conditions. The selected indicators were defined according to the indoor environmental quality parameters used in the baseline model and are consistent with housing-health and indoor environmental quality literature.
Table 6 presents the health-condition profiles included in the extended simulation. The extended configuration expands the simplified baseline from three to five health-condition profiles by adding allergies and depression/low well-being. It should be noted that the health-condition profiles are assigned to the virtual participants and do not describe the building categories themselves. Therefore, asthma, COPD, and anxiety/stress are treated as occupant-related vulnerability profiles that remain constant across the three building categories, following the baseline scenario. In contrast, the two additional profiles (in the extended simulation), allergies and depression/low well-being, are parameterized with building-specific coefficients because their corresponding values were derived from literature-based ranges associated with dampness, mould, allergic outcomes, and psychological distress. Thus, each combination of building conditions represents a group of virtual participants with a specific health-condition profile exposed to a specific building environment during the 100-day simulation period.
Table 7 summarizes the extended simulation setup, including the number of code-generated participants, simulation duration, building categories, health-condition profiles, monitoring coefficient, deviation settings, and risk-score interpretation.
Table 8 reports the results for each building–health profile pair. Each row represents one subgroup of simulated occupants exposed to a specific building category, BCH, NH, or GMH, and assigned one health-condition profile, such as asthma, COPD, allergies, anxiety/stress, or depression/low well-being. For example, the BCH–Asthma row refers to simulated occupants with an asthma profile evaluated under the bad climate house (BCH) environment. The results show a graded risk pattern across the three building categories. The BCH remains in the high-risk region for all health-condition profiles, the NH occupies a low-to-moderate-risk region, and the GMH remains consistently in the low-risk region.
Table 8.
Extended final risk by building and health condition.
To summarize the condition results at the building level, Table 9 presents the aggregated initial mean risk, final mean risk, and mean delta for each building category. This aggregation confirms a clear level of risk stratification, such as high risk for the BCH, moderate risk for the NH, and low risk for the GMH.
Table 9.
Aggregated final risk of buildings in the extended simulation.
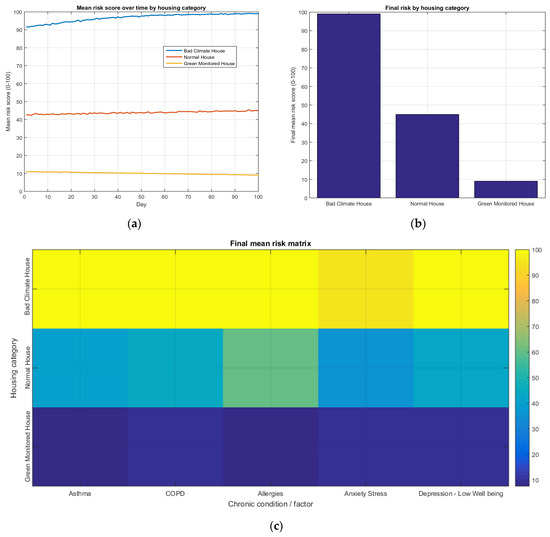
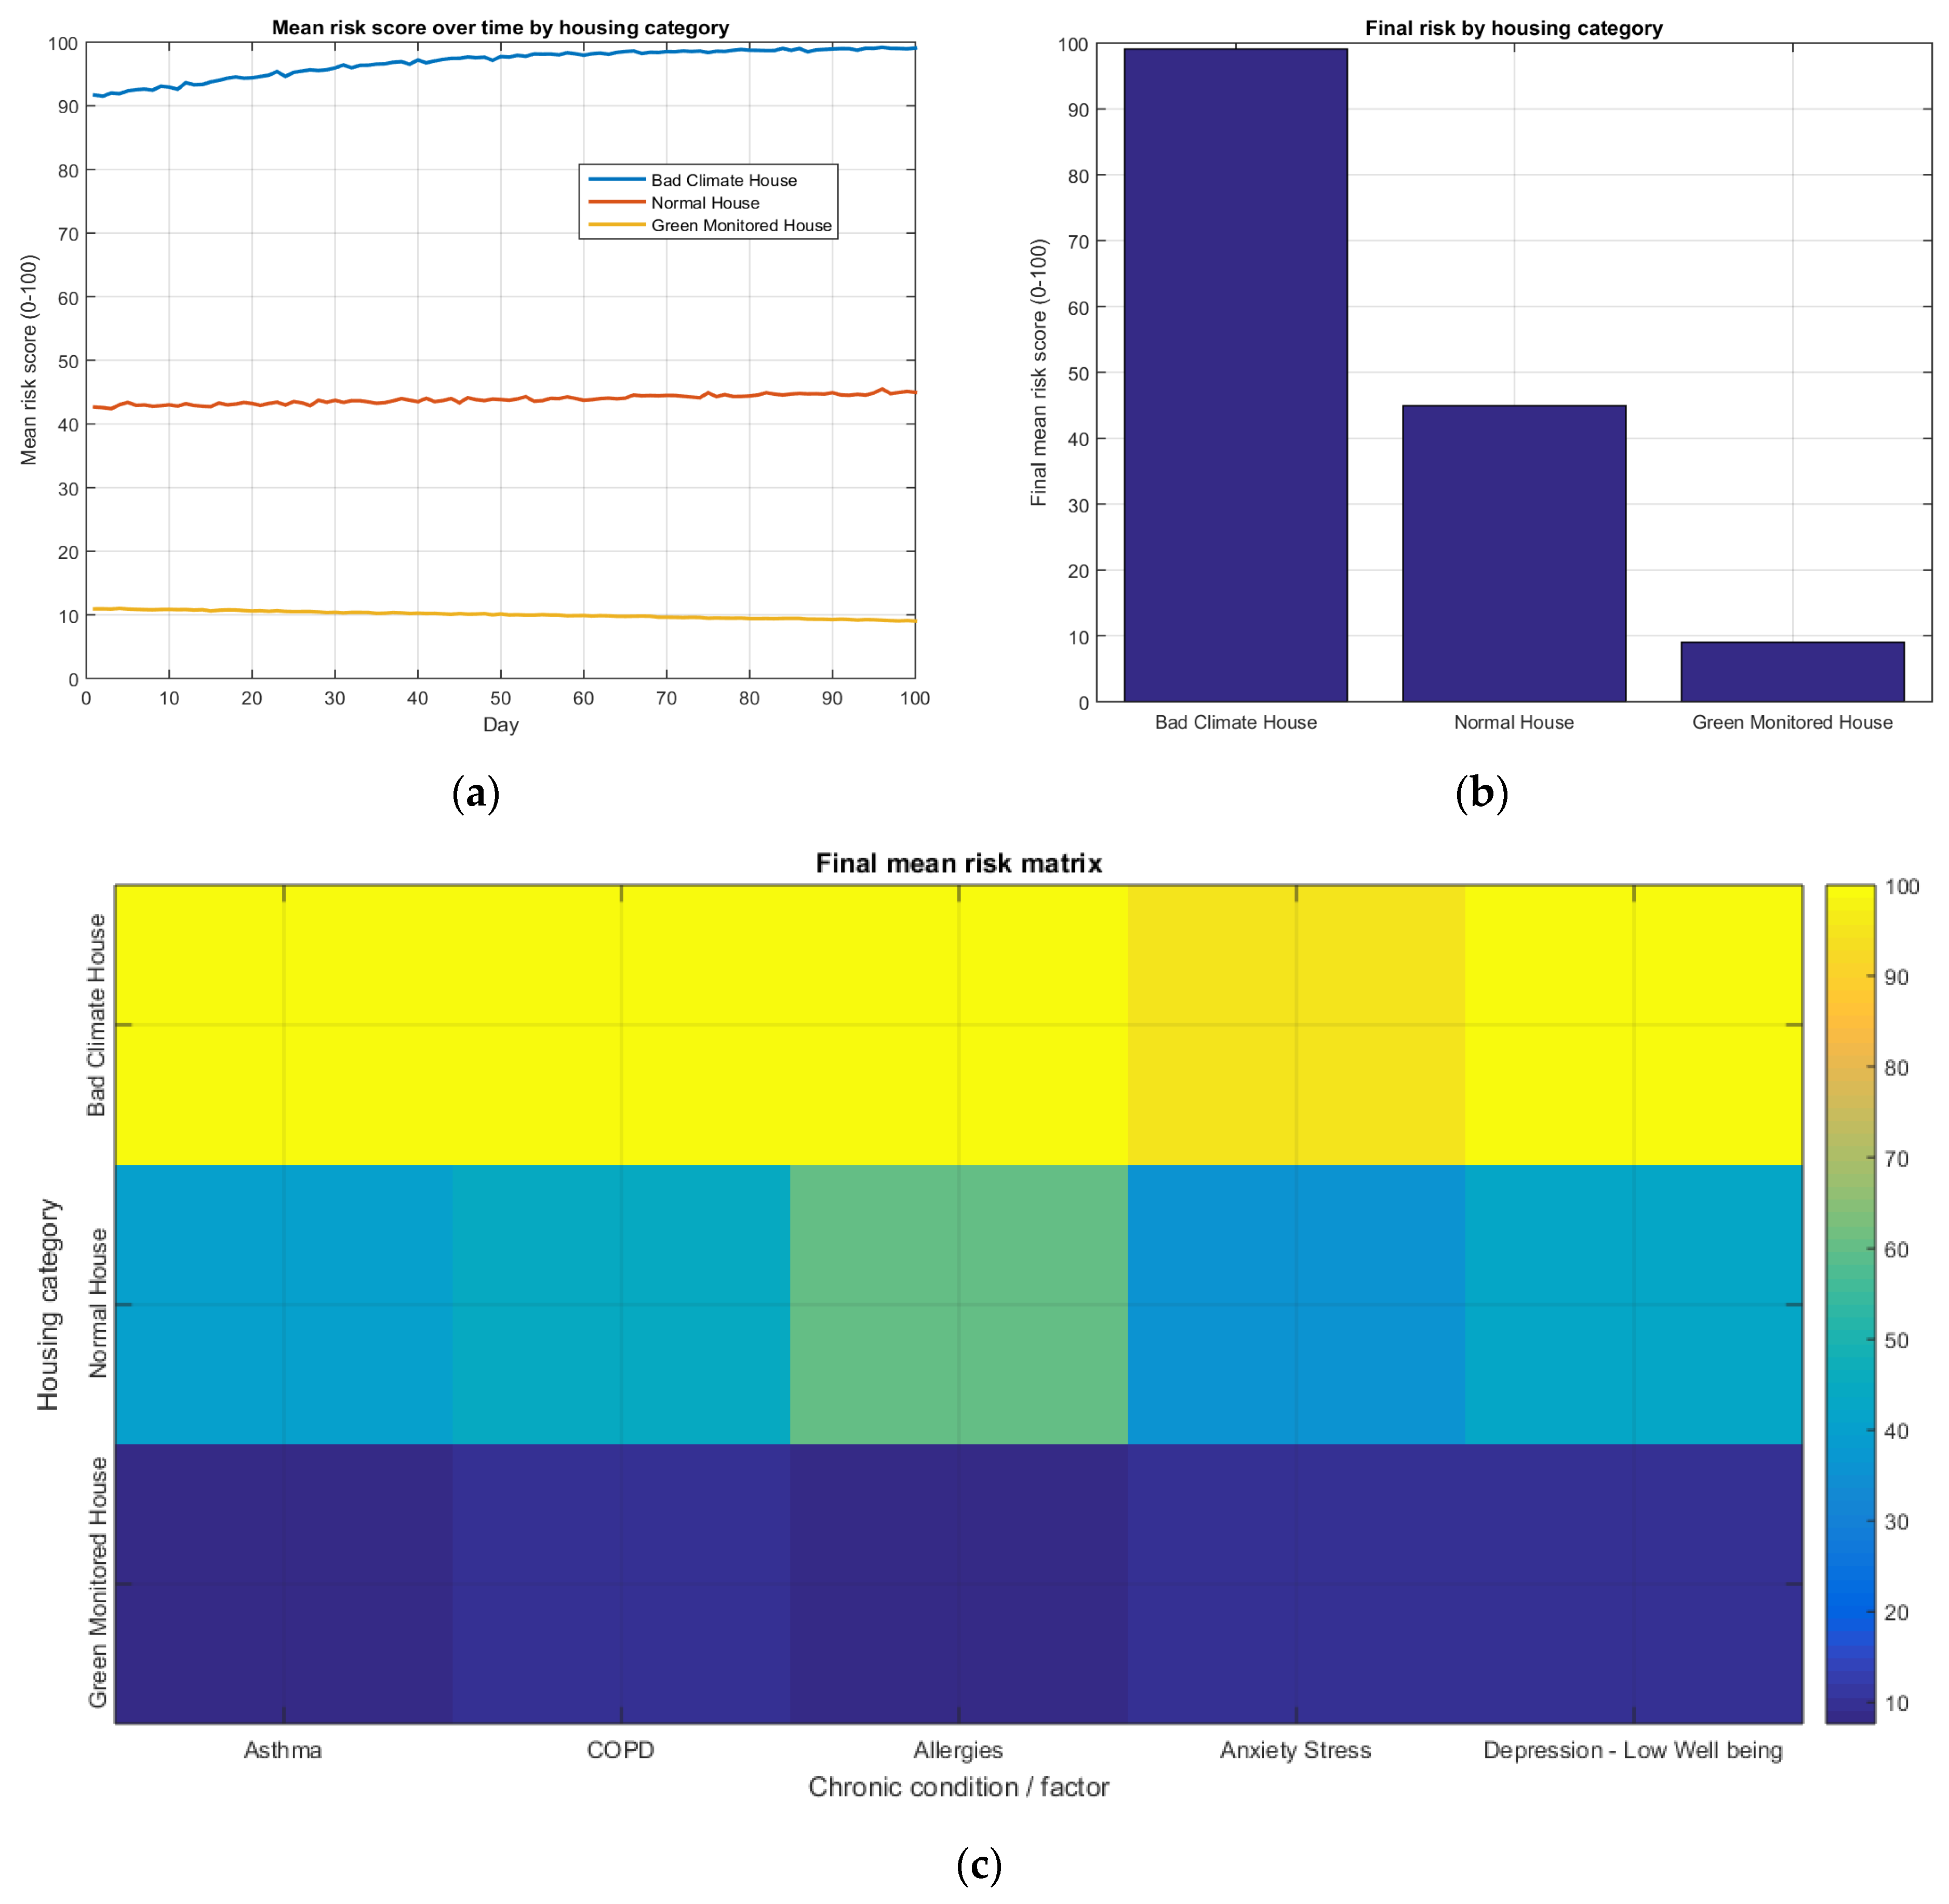
The extended simulation results are also summarized visually in Figure 6. The figure provides three complementary views of the extended simulation set: the temporal evolution of the mean risk score, the final building-level risk comparison, and the final risk matrix across building categories and chronic condition (factor), which refers to assigned health-condition profiles of the simulated occupants, namely asthma, COPD, allergies, anxiety/stress, and depression/low well-being.
Figure 6.
Extended simulation results: (a) Mean risk score over time by housing (building) category. (b) Final mean risk score by housing category. (c) Final mean risk matrix by housing category and chronic condition/factor.
Figure 6a shows the mean risk score over the 100-day simulation for the three building categories. The BCH remains close to the upper risk region throughout the simulation and increases slightly over time. The NH remains in the intermediate range, while the GMH remains in the low-risk region and shows a small decreasing trend. This behavior indicates that the extended simulation preserves the main BCH–GMH separation observed in the simplified baseline simulation, while also introducing the NH as a clearly intermediate building category.
Figure 6b presents the final mean risk score for each building category. The final aggregated mean risk is the highest for the BCH, moderate for the NH, and the lowest for the GMH. This confirms the building-risk stratification shown in Table 9 (obtained by extended simulations), where the final aggregated risks were equal to 99.08 for BCH, 44.95 for NH, and 9.02 for GMH.
Figure 6c presents the final mean risk matrix by building category and assigned health-condition profile. The BCH remains in the high-risk region for all five profiles. The NH occupies an intermediate-risk region, with all assigned profiles (factors) remaining in the moderate-risk range. The GMH remains consistently in the low-risk region across all assigned profiles. This matrix representation is useful because it shows again that the extended simulation not only preserves the separation between the two extreme cases, BCH and GMH, but also identifies the NH as an intermediate building category. This is particularly important after the addition of allergies and depression/low well-being, whose coefficients were defined as building-specific in the extended configuration.
3. Restrictions
This study should be interpreted as a deterministic and extended framework rather than as a clinical prediction model, empirical building validation, or human-subject study. No real occupants, sensor measurements, or observed health outcomes were used in the present research phase. Although the extended scenario includes controlled health profiles and building-profile deviations, a full Monte Carlo analysis was not included in the current research phase. Accordingly, the assigned health-condition profiles and the corresponding scores should not be interpreted as direct surrogates of measured clinical outcomes in a real target population. On the contrary, they operate as literature-based computational profiles used to examine how normalized indoor environmental conditions and monitoring or/and control assumptions act through the proposed risk-score model.
Furthermore, the upper bound of 100 is used to keep the risk score interpretable within a normalized 0–100 scale. However, this bounded saturation also reduces differentiation among very high-risk cases, because several adverse scenarios may converge to the same maximum value. This is logical for the present baseline and extended simulation, where the objective is to identify low-, moderate-, and high-risk stratification. Future versions may introduce additional high-risk subcategories or a non-saturating auxiliary index to more precisely distinguish extreme scenarios.
Additional factors, such as socioeconomic status, medication adherence, genetic predisposition, healthcare access, individual clinical history, behavioral adaptation, outdoor pollution, real sensor noise, sensor drift, sampling frequency, seasonal variation, occupancy schedules, ventilation dynamics, and clinical validation data, were also not incorporated. This restriction was intentional because the main objective was first to establish a clear and reproducible normalized risk-score model, to verify the internal consistency of the formulation, and to examine whether the expected separation among BCH, NH, and GMH can be obtained without introducing excessive model complexity. More advanced stochastic modeling, larger participant sets, additional indoor environmental variables, and real IoT-based measurements can be added in future work, reducing the risk of transferring modeling errors into later and more complex simulations.
In general, the building structure is not modeled as a complete open physical system. Outdoor climate, outdoor pollution, seasonality, real ventilation flows, mechanical versus natural ventilation, user behavior, indoor pollutant sources, thermal inertia, system delays, and interactions among variables are not simulated. These factors are important in real building operation and will be incorporated in future work. The present simulation should therefore be interpreted as a normalized risk-score-based model that can later be connected to real sensor streams, building performance simulations, or digital-twin models. The proposed framework is not intended to replace mature building performance simulation tools. Instead, it operates as an interpretable normalized risk-score system that can later receive inputs from sensor streams, building simulation software, or digital-twin platforms.
4. Conclusions and Future Scopes
Within the predefined simulation assumptions, the results show that the proposed normalized risk-score strategy can consistently distinguish between adverse, intermediate, and green monitored indoor environmental scenarios. In the BCH, the combination of poor air quality, insufficient ventilation, thermal burden, humidity/mould, and all other previously mentioned indicators produces high risk levels for the assigned health-condition profiles. In the simplified baseline scenario, asthma and COPD receive higher simulated risk values because their profile weights emphasize air-quality and ventilation-related indicators. Since these indicators are also high in the BCH profile, the resulting risk scores move close to the upper boundary of the normalized risk scale. Anxiety/stress also increases substantially, reflecting the contribution of thermal discomfort, noise, lighting burden, and general environmental drawbacks. In the extended simulation, this behavior is further confirmed after the inclusion of the NH as an intermediate building category and after the addition of allergies and depression/low well-being as two included health-condition profiles.
In the GMH, the simulated environmental pressure is substantially lower across all indicators. The full monitoring/control capability further reduces the effective risk contribution. As a result, the assigned health-condition profiles remain within the low-risk range throughout the experiment. This behavior is observed both in the simplified baseline simulation and in the extended simulation, where all five assigned profiles remain in the low-risk region. This is consistent with the green-residence hypothesis that improved indoor environmental quality, superior micro-environmental systems, and reduced exposure sources may produce better physical and psychological outcomes in vulnerable occupants.
A key observation is that the deterministic simulated scenario acts as a baseline model, while the extended scenario provides a controlled expansion of the basic scenario. The simplified baseline does not include deviations or Monte Carlo uncertainty. The extended simulation introduces controlled health and building-profile deviations, but it still does not constitute a full Monte Carlo analysis or a population-level clinical prediction model. Instead, the two simulation stages demonstrate the expected tendency and magnitude of risk separation under clear modeling assumptions. This makes the scenario useful for explaining the model’s architecture, checking the internal consistency of the mathematical logic and providing a clear comparison among poor, intermediate, and green monitored building conditions.
The extended simulation also supports the role of the NH as an intermediate case. The aggregated final risk remains high in the BCH, moderate in the NH, and low in the GMH. This building-risk stratification is important because it shows that the model not only separates the two extreme scenarios, BCH and GMH, but also represents a middle building category with partial environmental control. The inclusion of allergies and depression/low well-being further expands the evaluation space, while their building coefficients allow the extended model to reflect different exposure conditions across the three building categories.
The innovative aspect of the proposed approach is that it does not treat a green building merely as an energy-efficient structure. Instead, it treats the building as an IoT-enabled, health-aware indoor environment. The simulation connects building quality, sensing capability, network-supported monitoring, and occupant vulnerability into a single risk-score framework. This is important because the quality of a smart green building depends not only on materials and energy performance but also on its ability to sense, communicate, and respond to indoor environmental conditions. From a digital infrastructure perspective, the model also highlights the need for high-quality network services inside green buildings. The proposed framework supports the view that green buildings should be designed as integrated systems combining environmental quality, IoT sensing, and robust communication infrastructure.
From an engineering perspective (future scope), the proposed model can be extended toward a real IoT deployment. In such a scenario, the normalized indicators used in the present simulation could be replaced by real sensor measurements. For example, IAQ/PM2.5 sensors, CO2 sensors, temperature/humidity sensors, acoustic sensors, lighting sensors, and VOC sensors could continuously update the environmental profile of the building. These measurements could be fed through a reliable building network to a local edge processor or cloud-based platform. The risk-score stage could then operate as a decision module, identifying when specific occupant groups may require mitigation actions, improved indoor environmental control, or reduced exposure to adverse indoor conditions.
Overall, within the predefined simulation assumptions, this study supports the conceptual hypothesis that green monitored buildings can substantially reduce simulated indoor environmental risk for vulnerable occupants when these structures are compared with poorly conditioned buildings. The extended simulation further shows that the same framework can represent an intermediate building category and additional health conditions without losing the expected building-level risk stratification. Future work should introduce Monte Carlo variability, larger simulated populations, real sensor data, calibration against measured clinical or questionnaire-based outcomes, and network-quality parameters such as latency, packet loss, availability, and data freshness. These extensions would allow the framework to evolve from a clear baseline simulation into a broader digital twin for health-oriented smart green buildings.
These findings should therefore be interpreted as evidence of internal model coherence and reproducible scenario behavior, not as evidence of real-world clinical effectiveness or completed field validation. Future work should replace normalized scenario inputs with measured IoT sensor streams and should recalibrate the coefficients using occupant questionnaires, exposure measurements, and clinical or health-related datasets.
Author Contributions
Conceptualization, S.K.C. and E.I.K.; methodology, S.K.C. and E.I.K.; software, S.K.C.; validation, S.K.C. and V.C.; formal analysis, S.K.C. and E.I.K.; investigation, S.K.C., E.I.K. and V.C.; resources, V.C. and K.P.P.; data curation, S.K.C.; writing—original draft preparation, S.K.C. and E.I.K.; writing—review and editing, V.C. and K.P.P.; visualization, S.K.C. and K.P.P.; supervision, K.P.P.; project administration, S.K.C. and V.C. All authors have read and agreed to the published version of the manuscript.
Funding
This research received no external funding.
Data Availability Statement
The numerical input parameters, simulation settings, and generated output tables are reported within the article. The simulation code and generated result files can be made available by the corresponding author upon reasonable request.
Conflicts of Interest
The authors declare no conflicts of interest.
References
- Tsang, T.-W.; Mui, K.-W.; Wong, L.-T.; Chan, A.C.-Y.; Chan, R.C.-W. Real-Time Indoor Environmental Quality (IEQ) Monitoring Using an IoT-Based Wireless Sensing Network. Sensors 2024, 24, 6850. [Google Scholar] [CrossRef] [Scilit] [PubMed]
- Holden, K.A.; Lee, A.R.; Hawcutt, D.B.; Sinha, I.P. The Impact of Poor Housing and Indoor Air Quality on Respiratory Health in Children. Breathe 2023, 19, 230058. [Google Scholar] [CrossRef] [Scilit] [PubMed]
- Kosma, E.I.; Chronopoulos, S.K.; Tafiadis, D.; Papadopoulos, P.; Nguyen, N.; Christofilakis, V.; Kostarakis, P. The Impact of Green Systems and Signals on the Health of Green Residences’ Habitants. Ann. Gen. Psychiatry 2018, 17, 6–7. [Google Scholar] [CrossRef]
- Poyyamozhi, M.; Murugesan, B.; Rajamanickam, N.; Shorfuzzaman, M.; Aboelmagd, Y. IoT—A Promising Solution to Energy Management in Smart Buildings: A Systematic Review, Applications, Barriers, and Future Scope. Buildings 2024, 14, 3446. [Google Scholar] [CrossRef] [Scilit]
- Sin, D.D.; Doiron, D.; Agusti, A.; Anzueto, A.; Barnes, P.J.; Celli, B.R.; Criner, G.J.; Halpin, D.; Han, M.K.; Martinez, F.J.; et al. Air Pollution and COPD: GOLD 2023 Committee Report. Eur. Respir. J. 2023, 61, 2202469. [Google Scholar] [CrossRef] [Scilit] [PubMed]
- Agache, I.; Canelo-Aybar, C.; Annesi-Maesano, I.; Cecchi, L.; Biagioni, B.; Chung, F.; D’Amato, G.; Damialis, A.; Del Giacco, S.; De Las Vecillas, L.; et al. The Impact of Indoor Pollution on Asthma-Related Outcomes: A Systematic Review for the EAACI Guidelines on Environmental Science for Allergic Diseases and Asthma. Allergy 2024, 79, 1761–1788. [Google Scholar] [CrossRef] [Scilit] [PubMed]
- Thach, T.-Q.; Mahirah, D.; Sauter, C.; Roberts, A.C.; Dunleavy, G.; Nazeha, N.; Rykov, Y.; Zhang, Y.; Christopoulos, G.I.; Soh, C.-K.; et al. Associations of Perceived Indoor Environmental Quality with Stress in the Workplace. Indoor Air 2020, 30, 1166–1177. [Google Scholar] [CrossRef] [Scilit] [PubMed]
- Jones, E.R.; Laurent, J.G.C.; Young, A.S.; MacNaughton, P.; Coull, B.A.; Spengler, J.D.; Allen, J.G. The Effects of Ventilation and Filtration on Indoor PM2.5 in Office Buildings in Four Countries. Build. Environ. 2021, 200, 107975. [Google Scholar] [CrossRef] [Scilit] [PubMed]
- Salve, H.R.; Nawaz, H.; Dey, S.; Krishnan, A.; Sharma, P.; Madan, K. Effectiveness of Household-Level Interventions for Reducing the Impact of Air Pollution on Health Outcomes–A Systematic Review. Front. Environ. Health 2024, 3, 1410966. [Google Scholar] [CrossRef] [Scilit]
- World Health Organization. WHO Housing and Health Guidelines. Available online: https://heathealth.info/wp-content/uploads/Bookshelf_NBK535293.pdf (accessed on 21 May 2026).
- World Health Organization. WHO Guidelines for Indoor Air Quality: Dampness and Mould. Available online: https://www.who.int/publications/i/item/9789289041683 (accessed on 21 May 2026).
- Dimitroulopoulou, S.; Dudzińska, M.R.; Gunnarsen, L.; Hägerhed, L.; Maula, H.; Singh, R.; Toyinbo, O.; Haverinen-Shaughnessy, U. Indoor Air Quality Guidelines from Across the World: An Appraisal Considering Energy Saving, Health, Productivity, and Comfort. Environ. Int. 2023, 178, 108127. [Google Scholar] [CrossRef] [Scilit] [PubMed]
- Perera, I.; Hewage, K.; Rana, A.; Sadiq, R. Combining Energy Performance and Indoor Environmental Quality (IEQ) in Buildings: A Systematic Review on Common IEQ Guidelines and Energy Codes in North America. Energies 2025, 18, 1740. [Google Scholar] [CrossRef] [Scilit]
- Fissore, V.I.; Arcamone, G.; Astolfi, A.; Barbaro, A.; Carullo, A.; Chiavassa, P.; Clerico, M.; Fantucci, S.; Fiori, F.; Gallione, D.; et al. Multi-Sensor Device for Traceable Monitoring of Indoor Environmental Quality. Sensors 2024, 24, 2893. [Google Scholar] [CrossRef] [Scilit] [PubMed]
- Jaakkola, M.S.; Quansah, R.; Hugg, T.T.; Heikkinen, S.A.M.; Jaakkola, J.J.K. Association of Indoor Dampness and Molds with Rhinitis Risk: A Systematic Review and Meta-Analysis. J. Allergy Clin. Immunol. 2013, 132, 1099–1110.e18. [Google Scholar] [CrossRef] [Scilit] [PubMed]
- Lawrence Berkeley National Laboratory. Health Risks of Dampness and Mold in Houses. Available online: https://iaqscience.lbl.gov/health-risks-dampness-and-mold-houses (accessed on 18 June 2026).
- Shenassa, E.D.; Daskalakis, C.; Liebhaber, A.; Braubach, M.; Brown, M. Dampness and Mold in the Home and Depression: An Examination of Mold-Related Illness and Perceived Control of One’s Home as Possible Depression Pathways. Am. J. Public Health 2007, 97, 1893–1899. [Google Scholar] [CrossRef] [Scilit] [PubMed]
- Gatto, M.R.; Li, A.; Martino, E.; Bentley, R. Damp Housing Conditions as a Determinant of Psychological Distress: A Longitudinal Analysis of the British Household Panel Survey. Am. J. Epidemiol. 2026, 195, 1284–1291. [Google Scholar] [CrossRef] [Scilit] [PubMed]
- Macdonald, I. Assessing the Significance of Design Changes When Simulating Building Performance Including the Effects of Uncertain Input Data. In Proceedings of the ESim 04 Conference, Vancouver, BC, Canada, 9–11 June 2004; Volume 3, pp. 93–100. [Google Scholar]
- Nowak, A.S.; Rakoczy, A.M. Uncertainties in the Building Process. Bull. Pol. Acad. Sci. Tech. Sci. 2013, 61, 129–135. [Google Scholar] [CrossRef] [Scilit]

Disclaimer/Publisher’s Note: The statements, opinions and data contained in all publications are solely those of the individual author(s) and contributor(s) and not of MDPI and/or the editor(s). MDPI and/or the editor(s) disclaim responsibility for any injury to people or property resulting from any ideas, methods, instructions or products referred to in the content. |
© 2026 by the authors. Licensee MDPI, Basel, Switzerland. This article is an open access article distributed under the terms and conditions of the Creative Commons Attribution (CC BY) license.