


Abstract
Background/Objectives: Linezolid has almost complete oral bioavailability, yet systemic exposure varies substantially between individuals. Food delays absorption, and genetic variation in ABCB1 may also contribute. We developed a population pharmacokinetic model to characterize these sources of variability. Methods: Plasma concentration–time data were analyzed after a single 600 mg oral dose of the reference product ZYVOX® in 48 healthy Chinese adults from two independent fasting and fed cohorts (n = 24 each) of a randomized crossover bioequivalence study. Nonlinear mixed-effects modeling (Monolix 2024R1) was used to characterize linezolid absorption and disposition and to evaluate covariates, including food status, sex, and ABCB1 variants. Model adequacy was assessed using standard diagnostics, including prediction-corrected visual predictive checks. Results: A one-compartment model with linear elimination and sequential zero- to first-order absorption with a lag time best described the data. Food status was retained as a covariate on absorption lag time (Tlag; 0.075 h fasting vs. 0.25 h fed), whereas effects on the other absorption parameters were not retained. ABCB1 C1236T genotype was associated with apparent oral clearance (CL/F; 5.00 L/h in T/T, 5.77 L/h in C/T, and 7.36 L/h in C/C carriers). The reference estimates of CL/F and V/F were 5.00 L/h (RSE 3.78%) and 43.78 L (RSE 2.03%). Conclusions: The sequential absorption model identified a food-related difference in Tlag and an association between ABCB1 C1236T genotype and apparent oral clearance. These findings may help interpret food-related changes in bioequivalence data and provide a candidate model for future evaluation in patients.
1. Introduction
Linezolid is a synthetic oxazolidinone antibacterial agent active against important Gram-positive pathogens, including methicillin-resistant Staphylococcus aureus and vancomycin-resistant enterococci [1]. After oral administration, it is rapidly and almost completely absorbed, with an absolute bioavailability close to 100%, allowing oral and intravenous dosing to be interchanged without routine dose adjustment [2,3,4]. Despite this high bioavailability, linezolid exposure varies considerably between individuals in both healthy adults and patients. This variability is clinically relevant because low exposure may reduce treatment success, whereas high exposure may increase the risk of toxicity [5,6]. Identifying the sources of this variability is therefore important for therapeutic drug monitoring and dose individualization in patients, as well as for interpreting absorption and between-participant differences under controlled clinical conditions.
Food is known to affect the rate of linezolid absorption. In healthy adults, administration with food delays the time to maximum concentration (Tmax) and lowers the maximum concentration (Cmax), while overall exposure remains largely unchanged [2,7]. Another bioequivalence (BE) study in healthy Chinese adults also reported a clear food-related delay in absorption [8]. These observations suggest that food alters the timing rather than the extent of linezolid absorption. Standard noncompartmental analysis (NCA), however, summarizes this effect mainly through Tmax and Cmax and does not directly characterize the time course of drug input. Most published linezolid population pharmacokinetic (PopPK) studies have modeled absorption as a first-order process, sometimes with a lag time [5,9,10,11,12,13]. In the present study, the sampling schedule, with 15 time points per participant, allowed early oral input to be characterized under standardized fasting and fed conditions.
Linezolid has traditionally been described as being metabolized mainly by oxidation without involvement of cytochrome P450 (CYP) enzymes, although more recent in vitro reaction phenotyping has demonstrated catalytic activity of CYP2J2, CYP4F2, and CYP1B1 [14,15]. Drug transporters may also contribute to variability in linezolid pharmacokinetics. P-glycoprotein (P-gp), encoded by ABCB1, and breast cancer resistance protein (BCRP), encoded by ABCG2, are important efflux transporters expressed in the intestine and other barrier and excretory tissues [16]. Clinical and modeling evidence has suggested transporter involvement in linezolid disposition, including altered exposure with rifampicin and clarithromycin [12,17] and a recent PBPK analysis suggesting contributions from ABCB1 and ABCG2 [18]. A previous clinical PopPK study further reported an association between ABCB1 C3435T and linezolid clearance [19], although another patient study found no association between ABCB1 variants and steady-state trough concentrations [20]. These findings provide a rationale for evaluating common ABCB1 and ABCG2 variants as potential sources of linezolid pharmacokinetic variability. Common ABCB1 variants can occur in population-dependent haplotypes, which should be considered when interpreting associations at individual loci [21,22].
Most published linezolid PopPK studies have been conducted in patients with infection, critical illness, tuberculosis, or older age [5,12,13,23,24]. These studies are valuable for therapeutic drug monitoring and dose selection, but disease-related changes in organ function, inflammation, concomitant medication use, and gastrointestinal function can complicate interpretation of absorption and genetic variability. BE studies in healthy participants provide a more controlled setting in which dosing, food intake, concomitant medication, and sampling are standardized. Restricting the analysis to a single reference product further reduces formulation-related variability. Such data therefore offer an opportunity to examine absorption kinetics and between-participant pharmacokinetic variability with less clinical confounding.
We therefore developed a PopPK model of linezolid in healthy Chinese adults using single-dose reference-product data from a controlled BE study. The objectives were to describe oral absorption under fasting and fed conditions and to evaluate whether food status, sex, ABCB1 genotype, and other prespecified variables were associated with linezolid pharmacokinetics. Using a single-formulation dataset together with a sequential absorption model allowed us to examine food-related changes in the timing of oral drug input beyond what standard NCA measures show and to evaluate an exploratory C1236T association with apparent oral disposition alongside other covariates.
2. Materials and Methods
2.1. Study Design and Population
This PopPK analysis used anonymized plasma concentration–time data from a previously completed crossover BE study of linezolid 600 mg tablets in healthy Chinese adults. The single-center study used randomized treatment order, open-label administration, and two periods [7]. Two independent cohorts were studied, one under fasting conditions and one under fed conditions (n = 24 each). Within each cohort, participants received the test and reference products in randomized order across two periods separated by a 9-day washout. The present analysis used only data from the reference product (ZYVOX®; Pfizer, New York, NY, USA), thereby limiting the dataset to a single formulation.
The original BE study was approved by the Institutional Ethics Committee of Zhongshan Hospital, Fudan University (Approval No. 2016-47; approval date: 6 June 2016). The same committee approved the present secondary PopPK and pharmacogenetic analyses (Approval No. B2016-096; approval date: 8 August 2016). Written informed consent was obtained from all participants.
2.2. Dosing Conditions and Sample Collection
Participants in the fasting cohort received the dose after an overnight fast of at least 10 h. Those in the fed cohort consumed a standard high-fat, high-calorie meal 30 min before dosing. Each participant then received a single 600 mg oral dose of the reference linezolid product with approximately 240 mL of water.
Blood was collected before dosing and at 0.25, 0.5, 1, 1.5, 2, 3, 4, 6, 8, 10, 12, 24, 36, and 48 h after dosing. Actual sampling times were recorded and used in the modeling analysis. Blood samples were collected into sodium citrate anticoagulant tubes and centrifuged at 1750× g and 4 °C for 10 min within 1 h of collection. The separated plasma was aliquoted and stored at −30 ± 5 °C until analysis.
2.3. Bioanalytical Assay
Plasma linezolid concentrations were quantified using a validated liquid chromatography–tandem mass spectrometry (LC–MS/MS) method described previously [25]. The calibration range was 0.02000–20.00 μg/mL, with a lower limit of quantification (LLOQ) of 0.02000 μg/mL and an upper limit of quantification (ULOQ) of 20.00 μg/mL. Accuracy across the LLOQ and low, medium, and high quality-control levels ranged from 84.95% to 106.2%, and intra- and interday precision (relative standard deviation) was <15%. Selectivity, recovery, matrix effect, carryover, dilution integrity, and stability met the validated acceptance criteria. Long-term stability of linezolid in human plasma was validated for 51 days at −30 ± 5 °C, exceeding the maximum sample storage duration of 39 days. Freeze–thaw stability was validated for three cycles, and all study samples underwent no more than three freeze–thaw cycles.
For the primary PopPK analysis, predose concentrations were treated as missing. Post-dose concentrations below the LLOQ were set to zero if they occurred before the observed Tmax, whereas those occurring after Tmax were treated as missing and excluded from parameter estimation.
2.4. Genotyping and Covariate Collection
Genomic DNA was extracted from blood samples. Single nucleotide polymorphisms (SNPs) in ABCB1 C1236T (rs1128503), ABCB1 G2677T/A (rs2032582), ABCB1 C3435T (rs1045642), and ABCG2 C421A (rs2231142) were genotyped by polymerase chain reaction (PCR) followed by direct sequencing. DNA extraction and PCR/sequencing methods for ABCB1 C3435T and ABCG2 C421A in this cohort have been described previously [26]; the same workflow was used for ABCB1 C1236T and G2677T/A. Before covariate testing, Hardy–Weinberg equilibrium was assessed using exact tests for the biallelic variants [27] and a separate exact test for the multiallelic ABCB1 G2677T/A variant [28].
All three ABCB1 SNPs and ABCG2 C421A were evaluated as candidate covariates. Prespecified continuous covariates were age, body weight, height, body mass index (BMI), serum creatinine, alanine aminotransferase (ALT), aspartate aminotransferase (AST), total bilirubin, direct bilirubin, albumin, total protein, uric acid, glucose, urea, creatine kinase, hematocrit (HCT), hemoglobin, and blood cell counts. Prespecified categorical covariates were sex, food status, ABCB1 C1236T, ABCB1 C3435T, ABCB1 G2677T/A, and ABCG2 C421A.
2.5. Population Pharmacokinetic Modeling
Modeling was performed in Monolix (version 2024R1; Lixoft, Antony, France) using nonlinear mixed-effects methods, with population parameters estimated by the stochastic approximation expectation maximization (SAEM) algorithm [29]. One- and multi-compartment models with linear or nonlinear elimination were evaluated. Because the analysis included only oral data, disposition parameters are reported as apparent volume of distribution (V/F) and apparent oral clearance (CL/F); the corresponding Monolix library parameters are V and Cl. Candidate absorption models included first-order absorption with or without a lag time, zero-order absorption with or without a lag time, and sequential zero- to first-order absorption. The final model was the Monolix library model oral0_oral1_seqAbs_1cpt_Tk01ka2F1Tlag1VCl. For manuscript reporting, F1 is denoted F0 to distinguish this structural fraction from the F in V/F and CL/F. F0 represents the fraction of the dose assigned to the initial zero-order absorption pathway of duration Tk0 after a lag time (Tlag); the remaining fraction (1 − F0) enters the subsequent first-order pathway with rate constant ka. An additional sequential variant allowing a further delay before the first-order phase was also evaluated, with Tlag2 = Tlag + Tk0 + diffTlag2. For direct comparison of the main candidate structures, the standard one-compartment first-order model with Tlag and the sequential one- and two-compartment models were evaluated using the same combined additive and proportional residual error model (combined2 in Monolix).
Interindividual variability was modeled with exponential random effects, assuming a log-normal distribution for each parameter except F0. A logit-normal distribution was used for F0 so that individual values remained between 0 and 1. Residual variability was described by a combined additive and proportional error model (combined2 in Monolix), , where εij ~ N(0,1). F0 is a structural dose-fraction parameter and does not represent absolute oral bioavailability.
Model selection considered the corrected Bayesian information criterion calculated from the linearized likelihood (BICc), the plausibility and precision of parameter estimates, convergence behavior, and standard diagnostic plots, including observed versus population predictions, observed versus individual predictions, and residuals versus time or predictions. Log-likelihood and information criteria for these comparisons were estimated by the linearization method in Monolix. Sycomore, the project-comparison tool in MonolixSuite 2024R1 (Lixoft, Antony, France), was used to organize and compare model runs.
2.6. Covariate Model Building Strategy
Covariates were evaluated from a prespecified set of demographic, physical, clinical, and genetic variables. Continuous covariates were centered on their median values and modeled with power functions, whereas categorical covariates were modeled with indicator variables. ABCB1 genotypes were represented by dummy variables, using the most frequent genotype as the reference category. The four candidate SNPs (ABCB1 C1236T, ABCB1 G2677T/A, ABCB1 C3435T, and ABCG2 C421A) were evaluated without prioritizing a single locus a priori. A stepwise procedure of forward inclusion followed by backward elimination was applied using likelihood ratio tests, with thresholds determined by the number of added parameters. At each forward inclusion step, the candidate relationship producing the largest significant improvement was incorporated before the remaining candidates were reevaluated. For reporting, the objective function value (OFV) difference was defined as ΔOFV = OFV(reduced) − OFV(full); a positive value therefore indicates improved fit when a covariate is added, or deterioration in fit when it is removed. p values were calculated from the chi-square distribution with the corresponding degrees of freedom (df). For 1 df, the thresholds were ΔOFV > 3.84 (p < 0.05) for forward inclusion and ΔOFV > 10.83 (p < 0.001) for backward elimination. For ABCB1 C1236T, which has three genotype categories (2 df), the thresholds were ΔOFV > 5.99 and > 13.82, respectively. BICc, parameter stability, and biological plausibility were considered supportive criteria in the final selection. Potential correlations between random effects were explored from pairwise random-effect relationships and retained only when they improved model fit without worsening BICc. The final three-category ABCB1 C1236T coding was also compared with a binary T/T versus non-T/T sensitivity model. No formal adjustment for multiple testing was applied across the four candidate SNPs.
2.7. Model Evaluation Methods
Final model performance was evaluated using goodness-of-fit plots, normalized prediction distribution errors (NPDEs), and prediction-corrected visual predictive checks (pcVPCs). NPDEs were used to assess whether residuals followed the expected standard normal distribution and whether trends were present over time or predicted concentration [30]. The pcVPC used 1000 simulated datasets generated with the original dosing and sampling design; prediction-corrected concentrations were used to derive simulated percentiles for comparison with the observed percentiles [31]. NPDE, pcVPC, and bootstrap analyses were performed in Monolix 2024R1. Parameter uncertainty was summarized using asymptotic standard errors and relative standard errors (RSEs). Robustness was further assessed with a nonparametric bootstrap. All 1000 planned bootstrap resamples, drawn with replacement at the participant level, were completed; the final model was reestimated for each resample using its initial values, and bootstrap means, medians, and 95% percentile confidence intervals (2.5th–97.5th percentiles) were compared with the original estimates. Eta shrinkage was calculated from empirical Bayes estimates (conditional modes) to assess the information available for individual parameter estimates and aid interpretation of individual-level diagnostics [32].
3. Results
3.1. Study Population and Pharmacokinetic Dataset
A total of 48 healthy Chinese adults (24 men and 24 women) contributed 720 scheduled plasma samples, corresponding to 15 samples per participant. Of the 672 scheduled post-dose observations, 622 were quantifiable, 12 observations occurring before each participant’s observed Tmax were set to zero for modeling, and 38 terminal observations were not detected. Thus, 50 post-dose observations (7.44%) were below the LLOQ; another 48 samples were collected predose. The primary model retained 634 post-dose records, including the 12 recorded zeros. Baseline characteristics and laboratory values were within normal ranges (Table 1). ABCB1 and ABCG2 genotype data were available for all participants, and none of the tested variants deviated from Hardy–Weinberg equilibrium. After the single oral dose, concentrations rose to a peak and then declined approximately monoexponentially. Visual inspection showed substantial variability during absorption, with differing patterns of input across participants and conditions.
Table 1.
Baseline demographic and laboratory characteristics and genotype distributions of the study population.
3.2. Structural Model and Residual Error Model Selection
Several absorption structures were first evaluated within the one-compartment disposition model, including first-order absorption with and without a lag time, zero-order absorption with and without a lag time, and sequential zero- to first-order absorption. Under the same combined2 residual error model, the standard first-order model with Tlag converged with stable estimates but fit the data substantially less well than the sequential one-compartment model (BICc 1820.72 vs. 1487.06). The sequential structure was therefore selected for further evaluation.
A two-compartment disposition model was then evaluated using the same sequential absorption structure. Its BICc was slightly lower than that of the one-compartment model (1483.49 vs. 1487.06), but the additional distribution parameters were not identifiable: apparent intercompartmental clearance (Q/F) was estimated at 0.01 L/h and peripheral volume (V2/F) at 0.0014 L, with infinite RSEs and confidence intervals extending from 0 to infinity. This collapse of the peripheral compartment supported retention of the one-compartment model. An additional sequential variant allowing a further delay before the first-order phase (diffTlag2) was also examined. Although this extension improved BICc during the initial constant-error exploration, diffTlag2 was estimated imprecisely when evaluated with the combined2 residual error model (RSE 112%) and was not retained.
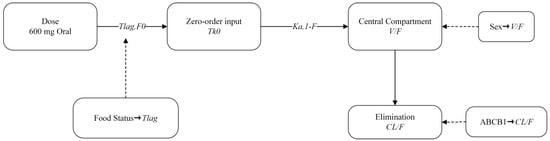
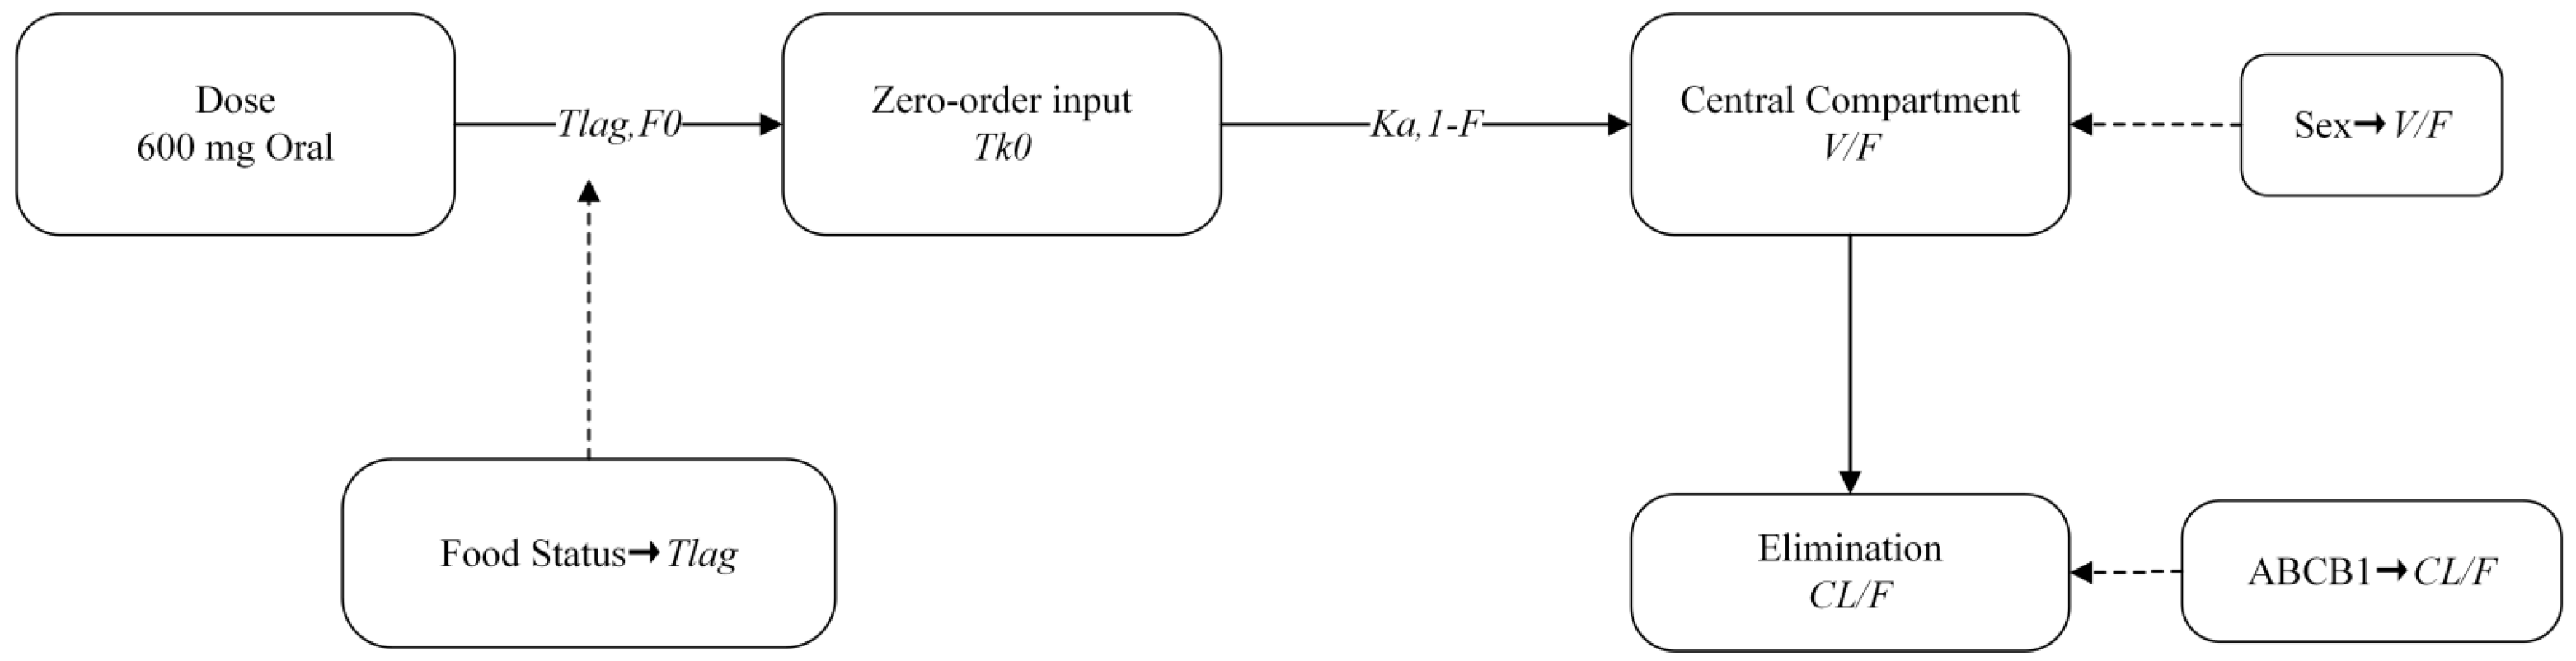
The final base model was therefore a one-compartment model with linear elimination, sequential zero- to first-order absorption, and a combined additive and proportional residual error structure (combined2). The selected absorption structure was the Monolix library model oral0_oral1_seqAbs_1cpt_Tk01ka2F1Tlag1VCl. In manuscript notation, F0 denotes the fraction assigned to the initial zero-order pathway of duration Tk0 after Tlag, whereas the remaining fraction (1 − F0) enters the subsequent first-order pathway with rate constant ka (Table 2 and Scheme 1).
Table 2.
Selected steps in base structural and residual error model development for linezolid.
Scheme 1.
Structural representation of the final population pharmacokinetic model of linezolid, based on a Monolix library sequential absorption model. After a lag time (Tlag), a fraction F0 of the dose is assigned to an initial zero-order input phase of duration Tk0; the remaining fraction (1 − F0) enters the subsequent first-order phase with rate constant ka. Drug enters a central compartment characterized by apparent volume of distribution (V/F) and is eliminated according to apparent oral clearance (CL/F). Dashed arrows indicate covariate relationships: food status on Tlag, sex on V/F, and ABCB1 C1236T genotype on CL/F.
3.3. Covariate Model Development
Table 3 summarizes the results of forward inclusion and backward elimination. For 1-df effects, the ΔOFV thresholds were 3.84 for forward inclusion and 10.83 for backward elimination; for the three-category ABCB1 C1236T effect (2 df), the corresponding thresholds were 5.99 and 13.82. Sex on V/F produced the largest improvement in the first round (ΔOFV = 80.07), reducing OFV from 1412.22 to 1332.14. ABCB1 C1236T on CL/F was selected in the second round (ΔOFV = 38.63; OFV = 1293.51), followed by food status on Tlag in the third round (ΔOFV = 10.73; OFV = 1282.78). All three covariate relationships remained significant during backward elimination. During forward inclusion, food effects on F0, Tk0, ka, and Tlag improved model fit at one or more steps, whereas body weight and HCT were associated with V/F in some steps but were not retained. No other prespecified covariates were included in the final model.
Table 3.
Stepwise covariate inclusion and retention in the final model.
In the final model, typical Tlag increased from 0.075 h under fasting conditions to 0.25 h under fed conditions. Typical V/F was lower in females (32.1 L) than in males (43.8 L), while typical CL/F was 5.00 L/h in T/T participants, 5.77 L/h in C/T participants, and 7.36 L/h in C/C participants (Table 4). A sensitivity analysis comparing the three-category C1236T coding with a binary T/T versus non-T/T coding favored the three-category representation (ΔOFV = 16.33, 1 df, p < 0.001). A correlation between the random effects of Tk0 and ka was also evaluated. Adding this correlation reduced the OFV by 3.37 but slightly increased BICc from 1373.11 to 1373.61; the correlation was therefore not retained.
Table 4.
Parameter estimates of the final population pharmacokinetic (PopPK) model of linezolid.
3.4. Final Model Parameter Estimates
Relative to the base structural model, the final covariate model reduced the OFV from 1412.22 to 1282.78 and the BICc from 1487.06 to 1373.11, decreases of 129.44 and 113.95, respectively. Final parameter estimates are presented in Table 4. Fixed-effect parameters were generally estimated with acceptable precision. Typical Tlag was 0.075 h under fasting conditions and 0.25 h under fed conditions. Typical V/F was 43.78 L in males and 32.09 L in females, whereas typical CL/F was 5.00, 5.77, and 7.36 L/h in T/T, C/T, and C/C participants, respectively.
Interindividual variability was substantially greater for the absorption-related parameters Tk0, ka, F0, and Tlag than for the disposition parameters V/F and CL/F, indicating that the major between-participant heterogeneity in this dataset was concentrated in the absorption phase. Eta shrinkage, based on conditional modes, was 24.4% for Tk0, 13.1% for ka, 35.6% for F0, 16.1% for Tlag, 12.3% for V/F, and 0.5% for CL/F.
3.5. Model Evaluation
Using the final model, all 1000 planned nonparametric bootstrap resamples drawn with replacement at the participant level were completed successfully (1000/1000). For each parameter, the original estimate was compared with the bootstrap mean, median, and 95% percentile confidence interval (2.5th–97.5th percentiles); relative bias was calculated as 100 × (bootstrap mean − original estimate)/original estimate (Table 5). Overall, bootstrap means and medians were generally consistent with the original estimates, supporting the overall stability of the final model. Disposition parameters and the major covariate effects showed good robustness. More noticeable relative bias was observed for fasting Tlag (−10.8%), the food effect on Tlag (21.1%), and interindividual variability in F0 (34.0%), consistent with the greater uncertainty of absorption-related parameters, but there was no systematic shift suggesting overall model instability.
Table 5.
Nonparametric bootstrap results for the final population pharmacokinetic model of linezolid.
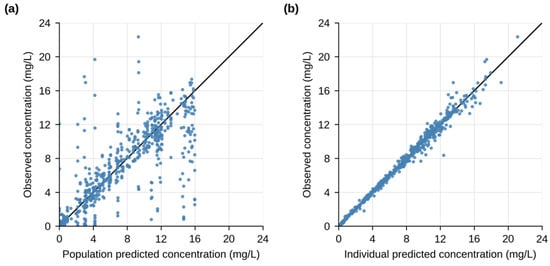
Goodness-of-fit plots supported adequate model performance (Figure 1). Observed concentrations were distributed around the line of identity for both population and individual predictions, with no clear systematic over- or under-prediction across the concentration range. As expected, individual predictions agreed more closely with the observations than population predictions.
Figure 1.
Goodness-of-fit (GOF) plots for the final model: (a) observed concentrations (dependent variable, DV) versus population predictions (DV–PRED); (b) observed concentrations (DV) versus individual predictions (DV–IPRED) based on conditional mode estimates (empirical Bayes estimates, EBEs).
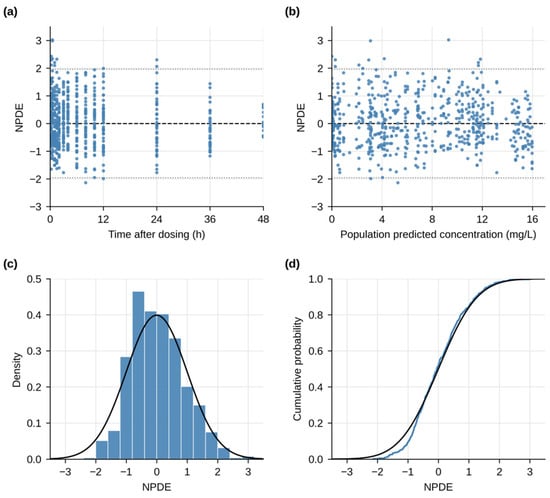
NPDE diagnostics did not indicate major model misspecification (Figure 2). NPDE values were centered around zero across the sampling period and the range of population predictions, without clear trends over time or predicted concentration. The NPDE histogram closely approximated the expected standard normal distribution, and the empirical cumulative distribution generally followed the theoretical curve, with only mild deviations in the tails.
Figure 2.
Normalized prediction distribution error (NPDE) diagnostics for the final model: (a) NPDE versus time after dosing; (b) NPDE versus population predictions; (c) histogram of NPDE with the theoretical standard normal density overlaid; and (d) empirical cumulative distribution function of NPDE (blue curve) versus the theoretical distribution (black curve). In panels (a,b), the black dashed horizontal lines indicate NPDE = 0, and the gray dotted horizontal lines indicate the approximate 95% reference limits (±1.96) of the standard normal distribution.
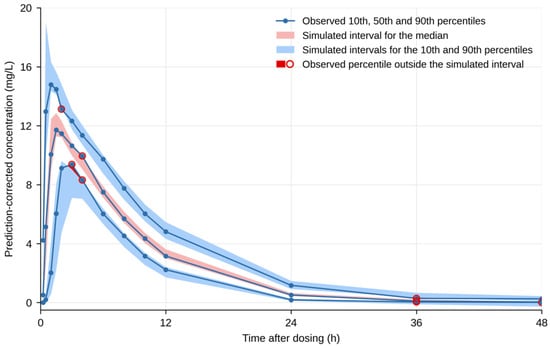
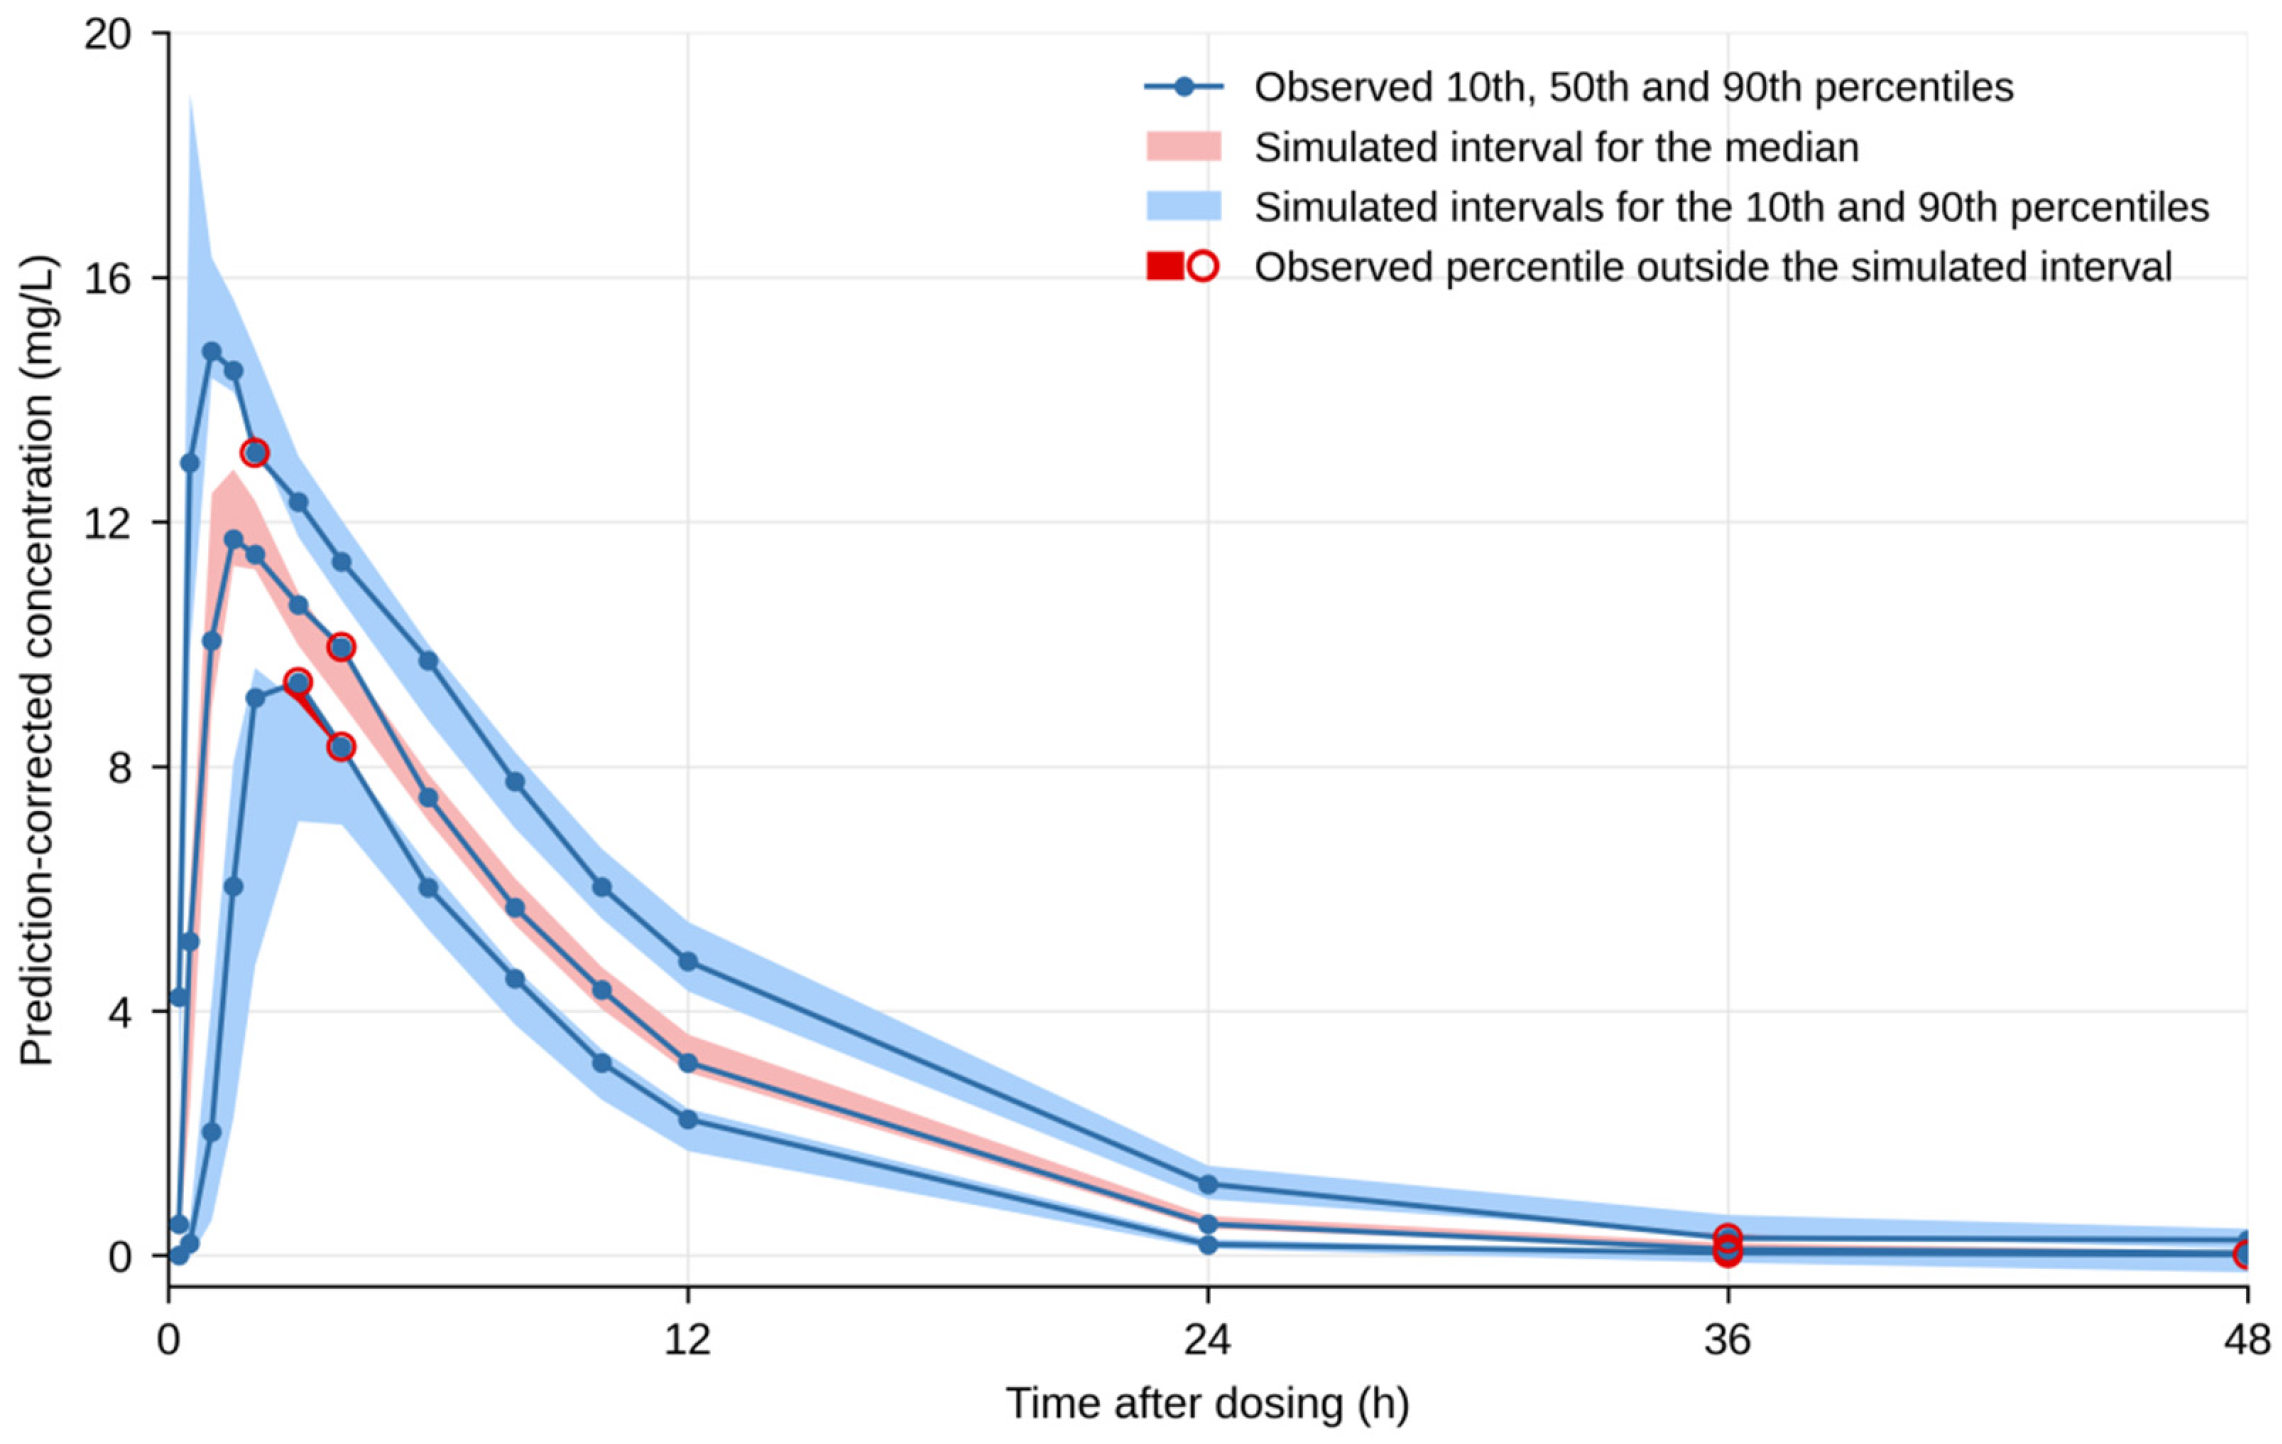
The pcVPC based on 1000 simulations further supported adequate predictive performance across the full concentration–time profile (Figure 3). The simulated median and 10th and 90th percentiles were consistent with the corresponding observed percentiles, indicating that the model adequately described both the central tendency and overall variability of the data.
Figure 3.
Prediction-corrected visual predictive check (pcVPC) of the final population pharmacokinetic model based on 1000 simulated datasets. The solid lines represent the observed 10th, 50th and 90th percentiles. Shaded areas represent the 90% confidence intervals of the corresponding simulated percentiles. Red open circles indicate observed percentiles outside the simulated intervals.
Taken together, the GOF, NPDE, pcVPC, and bootstrap results supported the descriptive and predictive adequacy and overall stability of the final model. The remaining uncertainty was concentrated mainly in the absorption-related parameters, consistent with the greater heterogeneity of the early absorption phase.
4. Discussion
Using single-dose reference-product data from 48 healthy Chinese adults studied under controlled fasting or fed conditions, we developed a PopPK model that described linezolid pharmacokinetics with one-compartment disposition, linear elimination, and sequential zero- to first-order absorption. The final covariate model identified food status on Tlag, sex on V/F, and ABCB1 C1236T on CL/F. GOF, NPDE, pcVPC, and bootstrap evaluation collectively supported good descriptive performance, predictive performance, and parameter stability.
The early absorption phase showed substantial between-participant heterogeneity. Compared with the other candidate structures evaluated, the sequential zero- to first-order absorption model provided a substantially better description of early oral input while maintaining parameter identifiability and model parsimony. The dense early sampling available in the BE study allowed this temporal pattern to be characterized in greater detail than with standard NCA summary measures alone. In this context, Tk0, ka, F0, and Tlag provide a quantitative description of the oral input process, with F0 representing the fraction assigned to the initial zero-order phase rather than absolute oral bioavailability.
Food status was retained as a significant covariate on Tlag, increasing the typical value from 0.075 h under fasting conditions to 0.25 h under fed conditions, consistent with delayed oral drug input following food intake. This finding is consistent with previous NCA results and the established food effect on linezolid: food delays Tmax and modestly lowers Cmax while overall exposure remains largely unchanged [2,7]. Another Chinese BE study reported a similar food-related delay in absorption [8]. Importantly, the estimated fasting Tlag of 0.075 h should be interpreted as a model-dependent apparent absorption delay rather than a directly observed physiological lag time. Because the first post-dose sample was collected at 0.25 h, the exact onset of absorption could not be independently determined, and the short Tlag may partly reflect the parameterization of the sequential absorption model. Nevertheless, the substantially lower early post-dose concentrations under fed conditions support a food-related delay in absorption. The present PopPK analysis further quantifies this effect by translating the observed delay in Tmax into an estimable absorption-process parameter. During forward inclusion, assigning food effects to F0, Tk0, ka, or Tlag improved model fit at different steps, suggesting that food may influence several aspects of the absorption process; after stepwise model selection, Tlag was retained as the most parsimonious and stable parameter describing the food-related absorption delay.
Sex was a significant covariate on V/F and produced the largest model improvement in the first round of forward inclusion. Typical V/F was 43.78 L in males and 32.09 L in females, indicating that sex explained part of the variability in linezolid distribution even within this relatively homogeneous healthy population. A previous healthy-adult study also reported sex-related differences in linezolid disposition [33]. Body weight and hematocrit were associated with V/F during some forward-inclusion steps but were not retained in the final model. The disposition estimates were otherwise consistent with previous reports in healthy adults: typical CL/F was 5.00 L/h and typical V/F in males was 43.78 L, both within previously reported ranges [3,33], further supporting the plausibility of the final model estimates.
Another important finding was the significant association between ABCB1 C1236T genotype and linezolid CL/F. Typical CL/F increased from 5.00 L/h in T/T participants to 5.77 L/h in C/T participants and 7.36 L/h in C/C participants, showing a clear genotype-related gradient. Previous clinical and drug-interaction studies have suggested that transporters may contribute to linezolid disposition, and Allegra et al. reported a significant association between ABCB1 C3435T and linezolid clearance [19]. However, Cheli et al. found no association between ABCB1 variants and steady-state trough concentrations in 191 patients receiving 600 mg twice daily [20]. Differences in populations, dosing conditions, and pharmacokinetic endpoints may contribute to these differing findings. The present study extends this clinical pharmacogenetic evidence to C1236T in healthy Chinese adults by quantifying an exploratory association with apparent oral clearance under controlled dosing conditions. Notably, Allegra et al. derived the C3435T–clearance association from intravenous linezolid data in critically ill patients [19]. This provides indirect support for a possible systemic clearance contribution but neither establishes the mechanism of C1236T nor directly demonstrates P-gp-mediated elimination.
Common ABCB1 variants including C1236T, G2677T/A, and C3435T can occur in linked haplotypes [21,22], and the specific locus identified across studies may therefore depend on population genetic structure and haplotype composition. The association therefore does not establish a direct functional effect of C1236T itself. Only three participants in the present study carried the C/C genotype, so the precise magnitude of the C1236T effect should be confirmed in a larger genotyped cohort. Nevertheless, the three-category genotype model was significantly better than the binary T/T versus non-T/T model (ΔOFV = 16.33, 1 df, p < 0.001), supporting retention of the observed genotype gradient. Screening four SNPs without multiplicity adjustment further supports treating this association as exploratory despite the improved within-dataset fit.
Mechanistically, the observed CL/F association could reflect differences in systemic clearance (CL), absolute oral bioavailability (F), or both. Linezolid generally has nearly complete oral bioavailability [2,3,4]. If CL were identical between genotypes, the observed C/C-to-T/T CL/F ratio would require F in C/C participants to be approximately 32% lower than in T/T participants. This constrains a large isolated bioavailability explanation but does not establish an elimination effect, because genotype-specific absolute F was not measured. Direct transporter evidence is also limited: Litjens et al. demonstrated BCRP-mediated efflux but not P-gp-mediated efflux in their assay, while Liu et al. found no significant ATP-dependent linezolid transport in human MDR1-containing membrane vesicles [34,35]. Thus, neither an intestinal P-gp effect on absorption/first-pass availability nor a P-gp-mediated hepatic or renal elimination mechanism can be assigned to C1236T from these data. The structural fraction F0 is distinct from absolute F and cannot resolve this uncertainty. Genotype-stratified intravenous and oral data would be needed to separate CL from F.
The model evaluation results further support the selected structural and covariate model. GOF plots showed no clear systematic bias, NPDE were generally consistent with the expected distribution, and pcVPC reproduced the central tendency and overall variability of the observed concentration–time profiles. All 1000 bootstrap resamples were completed successfully, and bootstrap means and medians for the major fixed effects and covariate effects were generally close to the original estimates. Greater uncertainty was concentrated in absorption-related parameters and their interindividual variability, consistent with the marked heterogeneity observed during early absorption; importantly, this parameter-level uncertainty did not prevent the model from reproducing the overall concentration–time distribution.
The analysis also illustrates the value of controlled BE data for quantitative pharmacology. Healthy participants, a single reference formulation, standardized dosing and meal conditions, and intensive prespecified sampling reduced variability arising from formulation differences, disease, and complex concomitant medication use. Whereas conventional BE analysis primarily addresses whether overall exposure is comparable between formulations, PopPK analysis can use the same data to characterize absorption kinetics, quantify between-participant variability, and identify covariate effects. Thus, high-quality BE datasets can provide additional quantitative information on oral input and pharmacogenetic variability beyond their conventional regulatory use [7]. The incremental contribution is the quantification of an exploratory C1236T–CL/F association alongside food-related input timing within a controlled single-reference-product dataset.
Several limitations should be considered. First, the analysis was based on single-dose data in healthy adults, and the applicability of the model to infected patients, individuals with organ dysfunction, or multiple-dose conditions requires further evaluation. Although the linear model permits simulation of a 600 mg twice-daily regimen, these projections would require validation because time-dependent clearance has been reported during repeated linezolid dosing [10]. In critically ill patients, altered renal function and fluid balance may further change clearance and distribution; hypoalbuminemia and concomitant medication may add variability [5,13,24]. Although genotype is time-invariant, its contribution to exposure need not remain unchanged as disease and treatment evolve. Accordingly, the C1236T association observed here should be validated in multiple-dose patient cohorts alongside clinical covariates and therapeutic drug monitoring before considering genotype-guided dosing. Second, only three participants carried the ABCB1 C1236T C/C genotype; although the model showed a clear genotype gradient, the magnitude of this effect should be confirmed in a larger genotyped population. Third, because only oral data were available, the observed genotype effect is expressed as CL/F, and the present data cannot distinguish an effect on systemic clearance from an effect on oral bioavailability or a combination of both. Finally, several absorption-related parameters showed substantial interindividual variability and relatively broad bootstrap distributions; independent datasets would be useful to further evaluate the sequential absorption structure and the stability of these parameters.
Overall, the sequential zero- to first-order PopPK model provided a robust description of single-dose oral linezolid pharmacokinetics in healthy Chinese adults, quantified the food-related absorption delay, and identified significant effects of sex on V/F and ABCB1 C1236T on CL/F. Compared with conventional NCA, the model extracted additional quantitative information on absorption kinetics and between-participant variability from the same controlled clinical dataset.
5. Conclusions
In healthy Chinese adults, a one-compartment PopPK model with linear elimination and sequential zero- to first-order absorption provided a robust description of linezolid concentration–time profiles and early oral input. Food significantly prolonged Tlag, quantitatively extending the food-related delay previously observed by NCA; sex was associated with V/F; and an exploratory association was observed between ABCB1 C1236T and CL/F, with a progressive increase from T/T to C/T to C/C. GOF, NPDE, pcVPC, and bootstrap results supported the fit, predictive performance, and overall stability of the final model. These findings demonstrate that controlled BE data can be used beyond conventional bioequivalence assessment to characterize oral absorption kinetics and participant-level pharmacokinetic variability, providing a quantitative basis for future evaluation in broader clinical populations.
Author Contributions
Conceptualization, X.L. and H.C.; methodology, M.Y. and H.C.; software, H.C.; validation, F.Y. and H.X.; formal analysis, M.Y., F.Y. and H.C.; investigation, F.Y., H.X., L.S. and C.L.; resources, X.L.; data curation, H.X. and H.C.; writing—original draft preparation, M.Y.; writing—review and editing, M.Y., X.L. and H.C.; visualization, H.C.; supervision, X.L. and H.C.; project administration, X.L. and H.C.; funding acquisition, X.L. and H.C. All authors have read and agreed to the published version of the manuscript.
Funding
This research was funded by the Shanghai Municipal Health Commission Clinical Research Special Program (grant number 20234Y0145).
Data Availability Statement
The de-identified pharmacokinetic data supporting the findings of this study and the PopPK model code are available from the corresponding author upon reasonable request.
Conflicts of Interest
The authors declare no conflict of interest.
References
- Ager, S.; Gould, K. Clinical update on linezolid in the treatment of Gram-positive bacterial infections. Infect. Drug Resist. 2012, 5, 87–102. [Google Scholar] [CrossRef] [Scilit] [PubMed]
- Welshman, I.R.; Sisson, T.A.; Jungbluth, G.L.; Stalker, D.J.; Hopkins, N.K. Linezolid absolute bioavailability and the effect of food on oral bioavailability. Biopharm. Drug Dispos. 2001, 22, 91–97. [Google Scholar] [CrossRef] [Scilit] [PubMed]
- Stalker, D.J.; Jungbluth, G.L.; Hopkins, N.K.; Batts, D.H. Pharmacokinetics and tolerance of single- and multiple-dose oral or intravenous linezolid, an oxazolidinone antibiotic, in healthy volunteers. J. Antimicrob. Chemother. 2003, 51, 1239–1246. [Google Scholar] [CrossRef] [Scilit] [PubMed]
- Beringer, P.; Nguyen, M.; Hoem, N.; Louie, S.; Gill, M.; Gurevitch, M.; Wong-Beringer, A. Absolute bioavailability and pharmacokinetics of linezolid in hospitalized patients given enteral feedings. Antimicrob. Agents Chemother. 2005, 49, 3676–3681. [Google Scholar] [CrossRef] [Scilit] [PubMed]
- Bandín-Vilar, E.; García-Quintanilla, L.; Castro-Balado, A.; Zarra-Ferro, I.; González-Barcia, M.; Campos-Toimil, M.; Mangas-Sanjuan, V.; Mondelo-García, C.; Fernández-Ferreiro, A. A review of population pharmacokinetic analyses of linezolid. Clin. Pharmacokinet. 2022, 61, 789–817. [Google Scholar] [CrossRef] [Scilit] [PubMed]
- Heidari, S.; Khalili, H. Linezolid pharmacokinetics: A systematic review for the best clinical practice. Eur. J. Clin. Pharmacol. 2023, 79, 195–206. [Google Scholar] [CrossRef] [Scilit] [PubMed]
- Chen, H.; Xu, H.; Yuan, F.; Li, H.; Sheng, L.; Liu, C.; Chen, W.; Li, X. Pharmacokinetics and safety of linezolid tablets of 2 different manufacturers in healthy Chinese subjects in fasting and fed states. Clin. Pharmacol. Drug Dev. 2024, 13, 1239–1244. [Google Scholar] [CrossRef] [Scilit] [PubMed]
- Wang, S.; Guo, S.; Han, Y.; Ni, S.; Wu, F.; Dai, Y.; Xia, Q.; Yang, Y.; Zhao, X. Bioequivalence of two linezolid tablets under fed and fasting conditions in healthy Chinese individuals. Clin. Pharmacol. Drug Dev. 2022, 11, 1481–1488. [Google Scholar] [CrossRef] [Scilit] [PubMed]
- Meagher, A.K.; Forrest, A.; Rayner, C.R.; Birmingham, M.C.; Schentag, J.J. Population pharmacokinetics of linezolid in patients treated in a compassionate-use program. Antimicrob. Agents Chemother. 2003, 47, 548–553. [Google Scholar] [CrossRef] [Scilit] [PubMed]
- Plock, N.; Buerger, C.; Joukhadar, C.; Kljucar, S.; Kloft, C. Does linezolid inhibit its own metabolism? Population pharmacokinetics as a tool to explain the observed nonlinearity in both healthy volunteers and septic patients. Drug Metab. Dispos. 2007, 35, 1816–1823. [Google Scholar] [CrossRef] [Scilit] [PubMed]
- Abe, S.; Chiba, K.; Cirincione, B.; Grasela, T.H.; Ito, K.; Suwa, T. Population pharmacokinetic analysis of linezolid in patients with infectious disease: Application to lower body weight and elderly patients. J. Clin. Pharmacol. 2009, 49, 1071–1078. [Google Scholar] [CrossRef] [Scilit] [PubMed]
- Bock, M.; Van Hasselt, J.G.C.; Schwartz, F.; Wang, H.; Høiby, N.; Fuursted, K.; Ihlemann, N.; Gill, S.; Christiansen, U.; Bruun, N.E.; et al. Rifampicin reduces plasma concentration of linezolid in patients with infective endocarditis. J. Antimicrob. Chemother. 2023, 78, 2840–2848. [Google Scholar] [CrossRef] [Scilit] [PubMed]
- Qin, Y.; Zhang, L.L.; Ye, Y.R.; Chen, Y.T.; Jiao, Z. Parametric population pharmacokinetics of linezolid: A systematic review. Br. J. Clin. Pharmacol. 2022, 88, 4043–4066. [Google Scholar] [CrossRef] [Scilit] [PubMed]
- Slatter, J.G.; Stalker, D.J.; Feenstra, K.L.; Welshman, I.R.; Bruss, J.B.; Sams, J.P.; Johnson, M.G.; Sanders, P.E.; Hauer, M.J.; Fagerness, P.E.; et al. Pharmacokinetics, metabolism, and excretion of linezolid following an oral dose of [14C]linezolid to healthy human subjects. Drug Metab. Dispos. 2001, 29, 1136–1145. [Google Scholar] [CrossRef]
- Obach, R.S. Linezolid metabolism is catalyzed by cytochrome P450 2J2, 4F2, and 1B1. Drug Metab. Dispos. 2022, 50, 413–421. [Google Scholar] [CrossRef] [Scilit] [PubMed]
- Hodges, L.M.; Markova, S.M.; Chinn, L.W.; Gow, J.M.; Kroetz, D.L.; Klein, T.E.; Altman, R.B. Very important pharmacogene summary: ABCB1 (MDR1, P-glycoprotein). Pharmacogenet. Genom. 2011, 21, 152–161. [Google Scholar] [CrossRef] [Scilit] [PubMed]
- Xu, Q.; Sang, Y.; Gao, A.; Li, L. The effects of drug-drug interaction on linezolid pharmacokinetics: A systematic review. Eur. J. Clin. Pharmacol. 2024, 80, 785–795. [Google Scholar] [CrossRef] [Scilit] [PubMed]
- Nguyen, H.D.; Pham, V.H.; Hoglund, R.M.; Tarning, J.; Ding, J. Assessing transporter-mediated rifampin–linezolid interaction using physiologically based pharmacokinetic modelling. Br. J. Clin. Pharmacol. 2026, 92, 1845–1856. [Google Scholar] [CrossRef] [Scilit] [PubMed]
- Allegra, S.; Di Paolo, A.; Cusato, J.; Fatiguso, G.; Arrigoni, E.; Danesi, R.; Corcione, S.; D’Avolio, A. A common MDR1 gene polymorphism is associated with changes in linezolid clearance. Ther. Drug Monit. 2018, 40, 602–609. [Google Scholar] [CrossRef] [Scilit] [PubMed]
- Cheli, S.; Fusi, M.; De Silvestri, A.; Bonini, I.; Clementi, E.; Cattaneo, D.; Montrasio, C.; Baldelli, S. In linezolid underexposure, pharmacogenetics matters: The role of CYP3A5. Biomed. Pharmacother. 2021, 139, 111631. [Google Scholar] [CrossRef] [Scilit] [PubMed]
- Tang, K.; Ngoi, S.-M.; Gwee, P.-C.; Chua, J.M.Z.; Lee, E.J.D.; Chong, S.S.; Lee, C.G.L. Distinct haplotype profiles and strong linkage disequilibrium at the MDR1 multidrug transporter gene locus in three ethnic Asian populations. Pharmacogenetics 2002, 12, 437–450. [Google Scholar] [CrossRef] [Scilit] [PubMed]
- Kroetz, D.L.; Pauli-Magnus, C.; Hodges, L.M.; Huang, C.C.; Kawamoto, M.; Johns, S.J.; Stryke, D.; Ferrin, T.E.; DeYoung, J.; Taylor, T.; et al. Sequence diversity and haplotype structure in the human ABCB1 (MDR1, multidrug resistance transporter) gene. Pharmacogenetics 2003, 13, 481–494. [Google Scholar] [CrossRef] [Scilit] [PubMed]
- Abdelgawad, N.; Wasserman, S.; Abdelwahab, M.T.; Davis, A.; Stek, C.; Wiesner, L.; Black, J.; Meintjes, G.; Wilkinson, R.J.; Denti, P. Linezolid population pharmacokinetic model in plasma and cerebrospinal fluid among patients with tuberculosis meningitis. J. Infect. Dis. 2024, 229, 1200–1208. [Google Scholar] [CrossRef] [Scilit] [PubMed]
- Taubert, M.; Zoller, M.; Maier, B.; Frechen, S.; Scharf, C.; Holdt, L.-M.; Frey, L.; Vogeser, M.; Fuhr, U.; Zander, J. Predictors of inadequate linezolid concentrations after standard dosing in critically ill patients. Antimicrob. Agents Chemother. 2016, 60, 5254–5261. [Google Scholar] [CrossRef] [Scilit] [PubMed]
- Chen, H.; Xu, H.; Liu, C.; Lin, P.; Yuan, F.; Sheng, L.; Chen, W.; Li, X. Determination of linezolid in human plasma by LC-MS/MS. Chin. J. Clin. Pharm. 2017, 26, 383–387. (In Chinese) [Google Scholar]
- Chen, H.; Liu, C.; Li, H.; Xu, H.; Li, X. Study on the relationship between polymorphism of ABCB1 and ABCG2 gene and electrocardiogram characteristics. Chin. J. Clin. Med. 2017, 24, 27–29. (In Chinese) [Google Scholar]
- Wigginton, J.E.; Cutler, D.J.; Abecasis, G.R. A note on exact tests of Hardy–Weinberg equilibrium. Am. J. Hum. Genet. 2005, 76, 887–893. [Google Scholar] [CrossRef] [Scilit] [PubMed]
- Guo, S.W.; Thompson, E.A. Performing the exact test of Hardy–Weinberg proportion for multiple alleles. Biometrics 1992, 48, 361–372. [Google Scholar] [CrossRef] [Scilit] [PubMed]
- Kuhn, E.; Lavielle, M. Maximum likelihood estimation in nonlinear mixed effects models. Comput. Stat. Data Anal. 2005, 49, 1020–1038. [Google Scholar] [CrossRef] [Scilit]
- Comets, E.; Brendel, K.; Mentré, F. Computing normalised prediction distribution errors to evaluate nonlinear mixed-effect models: The npde add-on package for R. Comput. Methods Programs Biomed. 2008, 90, 154–166. [Google Scholar] [CrossRef] [Scilit] [PubMed]
- Bergstrand, M.; Hooker, A.C.; Wallin, J.E.; Karlsson, M.O. Prediction-corrected visual predictive checks for diagnosing nonlinear mixed-effects models. AAPS J. 2011, 13, 143–151. [Google Scholar] [CrossRef] [Scilit] [PubMed]
- Savic, R.M.; Karlsson, M.O. Importance of shrinkage in empirical Bayes estimates for diagnostics: Problems and solutions. AAPS J. 2009, 11, 558–569. [Google Scholar] [CrossRef] [Scilit] [PubMed]
- Sisson, T.L.; Jungbluth, G.L.; Hopkins, N.K. Age and sex effects on the pharmacokinetics of linezolid. Eur. J. Clin. Pharmacol. 2002, 57, 793–797. [Google Scholar] [CrossRef] [Scilit] [PubMed]
- Litjens, C.H.C.; Verscheijden, L.F.M.; Svensson, E.M.; van den Broek, P.H.H.; van Hove, H.; Koenderink, J.B.; Russel, F.G.M.; Aarnoutse, R.E.; Te Brake, L.H.M. Physiologically-based pharmacokinetic modelling to predict the pharmacokinetics and pharmacodynamics of linezolid in adults and children with tuberculous meningitis. Antibiotics 2023, 12, 702. [Google Scholar] [CrossRef] [Scilit] [PubMed]
- Liu, J.; Pang, Y.; Li, W.; Sun, J.; He, Y.; Guo, Y.; Dong, J. Impact of hepatic impairment and renal failure on the pharmacokinetics of linezolid and its metabolites: Contribution of hepatic metabolism and renal excretion. Antimicrob. Agents Chemother. 2025, 69, e01892-24. [Google Scholar] [CrossRef] [Scilit] [PubMed]

Disclaimer/Publisher’s Note: The statements, opinions and data contained in all publications are solely those of the individual author(s) and contributor(s) and not of MDPI and/or the editor(s). MDPI and/or the editor(s) disclaim responsibility for any injury to people or property resulting from any ideas, methods, instructions or products referred to in the content. |
© 2026 by the authors. Licensee MDPI, Basel, Switzerland. This article is an open access article distributed under the terms and conditions of the Creative Commons Attribution (CC BY) license.