


Abstract
Background/Objectives: Machine learning models are increasingly used to prioritize lipid nanoparticle (LNP) formulations, but apparent accuracy may depend strongly on dataset heterogeneity and validation design. This study audited two public LNP resources to determine how database consistency, source study signatures, chemical similarity, and experimental-domain shift affect predictive transportability. Methods: LNPDB and LNP Atlas were harmonized using a provenance-preserving canonical schema, standardized molecular structures, and conservative cross-database formulation matching. Source publication identity was predicted after direct bibliographic identifiers were removed. Biological-performance modeling used 17,420 study-normalized gene expression/luminescence records from 37 LNPDB studies and fixed LightGBM models evaluated under random-row, formulation-held-out, ionizable-lipid-connectivity-held-out, structural-similarity-cluster-held-out, study-held-out, and temporal validation. Results: Only 29 of 217 Atlas formulation clusters from shared publications were confirmed as complete-formulation matches. Source publication was identified with 99.94% accuracy in LNPDB, while experimental context alone achieved 99.05% accuracy in LNP Atlas. Random-row validation yielded R2 = 0.317 and ROC-AUC = 0.815. Performance decreased under connectivity holdout (R2 = 0.239; ROC-AUC = 0.761) and structural-similarity holdout (R2 = 0.035; ROC-AUC = 0.654) and was poor for unseen studies (R2 = 22120.070; ROC-AUC = 0.531) and later studies (R2 = −0.217; ROC-AUC = 0.528). Test-independent binary endpoint sensitivity reproduced the same hierarchy. Conclusions: Public LNP datasets contain strong source study signatures and substantial chemical and experimental heterogeneity. In the evaluated LightGBM and Ridge baseline models, predictive performance was strongly dependent on validation design, with limited zero-shot generalization to unseen publications and later experimental domains. These findings do not establish that the same degree of performance deterioration would occur with pretrained, graph-based, or domain-adapted LNP models. Structure-aware, publication-grouped, and temporal validation should therefore accompany claims of predictive generalization beyond the training domain.
1. Introduction
Lipid nanoparticles (LNPs) are widely used to deliver mRNA, siRNA, and other nucleic acid therapeutics. Their performance depends on interactions among ionizable and auxiliary lipids, component ratios, cargo, manufacturing conditions, and biological targets. Because this multidimensional formulation space is difficult to optimize experimentally, high-throughput screening and machine learning approaches are increasingly used to prioritize candidate formulations.
Recent approaches have combined molecular descriptors, graph representations, and multimodal learning to predict LNP delivery performance [1,2,3,4,5,6,7,8]. AGILE incorporated molecular pretraining and experimental fine-tuning [1]; machine-learning-guided synthesis and LiON supported the discovery of active ionizable lipids [2,3]; and COMET extended modeling to multicomponent formulations with experimental validation [4]. These developments demonstrate the potential of predictive design, but their evaluation settings vary substantially across studies. Other LNP studies have investigated apparent pKa, language model representations, transformer architectures, and activity classification [5,6,7,8]. Consequently, reported accuracy must be interpreted in relation to the chemical and experimental domains used for training and testing.
Public resources now make cross-study analyses possible. LNPDB contains 19,528 experimental formulations from 42 publications, while LNP Atlas compiles 1092 formulations from 63 publications [9,10]. However, records collected across laboratories differ in chemistry, formulation composition, biological model, cargo, preparation methods, dose, and assay readout. Differences in data annotation and formulation identity further complicate harmonization and meaningful comparisons between resources. In particular, a shared publication or ionizable-lipid name does not necessarily identify the same complete formulation.
These differences also challenge predictive validation. Random train–test splitting can place related molecules, formulation families, and observations from the same publication in both partitions, yielding optimistic estimates of performance in unfamiliar experimental domains. Exact-formulation or chemical-scaffold holdout provides stronger separation but may still preserve shared study-specific protocols and biological contexts [11]. A publication may represent a tightly coupled combination of chemical-library and experimental conditions; therefore, apparent predictive relationships learned within that domain may not transfer to another. Previous LNPDB and scaffold-aware benchmarking studies have examined selected aspects of external validation [9,11], but the combined influence of cross-database inconsistencies, source study signatures, and validation design requires further investigation. Importantly, source study signatures may remain encoded in features even after bibliographic identifiers have been excluded; this should not be confused with direct leakage of the outcome.
Here, we audited LNPDB and LNP Atlas using provenance-preserving harmonization and conservative complete-formulation matching. We tested whether publication identity could be inferred from chemistry and experimental context after removing direct bibliographic identifiers. For study-normalized LNPDB biological outcomes, we then compared random-row, formulation-held-out, ionizable-lipid-connectivity-held-out, structural-similarity-cluster-held-out, publication-held-out, and temporal validation. We hypothesized that excluding exact formulations alone would have limited impact when source studies remained shared, whereas structural separation, publication holdout, and temporal testing would reduce performance more strongly. Because LNPDB outcomes were standardized within publication and delivery context, study-held-out evaluation concerns zero-shot prediction of relative performance in an unseen domain, not transfer of absolute potency. Our objective was to assess the robustness of baseline-model predictions without assuming that the observed limitations apply to all predictive architectures.
2. Materials and Methods
2.1. Study Design and Analytical Objectives
This study was designed as a computational audit of data harmonization, source study signatures, and predictive transportability in publicly available lipid nanoparticle (LNP) datasets. The analysis was organized into four sequential stages: (i) technical audit and canonicalization of LNPDB and LNP Atlas; (ii) conservative cross-database reconciliation of publications, molecular structures, and complete formulations; (iii) diagnostic prediction of source publication identity from chemistry, formulation, and experimental context; and (iv) comparison of performance prediction models under progressively stricter validation designs. The primary objective was not to maximize internal predictive accuracy but to determine whether apparent formulation–performance relationships persisted when chemical libraries, source publications, or later experimental domains were excluded from model training.
2.2. Data Sources and File Acquisition
LNPDB was obtained from the official public repository and associated web resource on 5 August 2026. The downloaded file contained 19,797 rows and 66 columns. In accordance with the source publication, 19,528 rows represented experimental LNP formulations derived from 42 publications, while 269 rows represented commercially available ionizable lipids without complete formulation and performance metadata [9]. LNP Atlas was obtained from its official downloadable dataset on the same date. It contained 1092 formulations from 63 publications. Although the accompanying publication describes 28 standardized fields, the downloaded file contained 32 columns because four additional numeric helper columns were included for particle size, polydispersity index, zeta potential, and encapsulation efficiency [10]. Raw files were retained unchanged, and cryptographic checksums, file names, encodings, and software versions were recorded in machine-readable manifests.
2.3. Canonical Schema, Provenance, and Quality Control
A shared canonical schema was constructed without pooling non-equivalent biological outcomes. Each record retained the source dataset, source file, source row number, original identifiers, raw values, and a generated canonical record identifier. Missing markers were standardized to null values while preserving the source text. Publications were assigned a canonical study identifier using normalized DOI as the primary key, followed by PubMed identifier, normalized title, publication URL, and source experiment identifier when DOI information was unavailable.
Chemical structures were parsed with RDKit (Release_2026.09.1) [12]. Valid structures were converted to canonical isomeric SMILES and InChIKey representations; invalid and missing structures were explicitly flagged. Raw lipid names were preserved, while minimally normalized labels were created to remove superficial differences in capitalization and punctuation without collapsing uncertain aliases. In LNPDB, component ratios were normalized to 100% when the component order was explicit, and the positive total differed from 100. In LNP Atlas, the first four numeric ratio tokens were retained, but component-specific percentages were assigned only when the component order was explicit or independently supported by confirmed cross-database matches. The signed zeta-potential value was reparsed from the original text because the supplied numeric helper column showed sign-loss errors. Free-text synthesis and bioactivity fields were conservatively parsed into structured variables while preserving the complete raw text. Biological and physicochemical endpoints were assigned to separate outcome families and were not combined across measurement types.
2.4. Cross-Database Publication and Formulation Reconciliation
Publication overlap was established using normalized DOI, followed by manual review of unresolved publication identifiers. Formulation matching was performed only within publications represented in both databases. Repeated experimental rows were collapsed to formulation clusters when study identity, ionizable-lipid structure, auxiliary component labels, and order-invariant component ratios agreed. A confirmed full-formulation match required: (i) ionizable-lipid identity based on InChIKey or an unambiguous specific name; (ii) agreement of at least two of the helper lipid, sterol, and PEG-lipid identities; and (iii) a minimum mean absolute difference of no more than 0.25 percentage points between normalized component ratios after testing permissible ratio-token orders. Similarity-only candidates were retained separately and were never promoted to confirmed matches. Same-name component structures were additionally audited using full and connectivity-level InChIKey comparisons.
2.5. Source Study Signature Audit
The study signature analysis tested whether source publication identity could be inferred from the data after direct publication identifiers had been excluded. The LNPDB cohort comprised 19,528 experimental formulations from 42 studies. The LNP Atlas cohort comprised 1053 records from 52 studies after requiring at least five records per study. Five predictor sets were evaluated: ionizable-lipid chemistry; complete formulation; minimal experimental context; complete experimental context; and the combination of all available features. The ionizable-chemistry representation included a 512-bit Morgan fingerprint with radius 2 [13] and nine molecular descriptors. The complete formulation representation additionally included auxiliary lipid identities and available ratio variables. Experimental-context representations included structured preparation, biological model, cargo, route, dose, assay, endpoint, and missingness information. DOI, title, author, journal, publication URL, source experiment identifier, and all other direct study identifiers were excluded.
A class-balanced linear support vector classifier was implemented using stochastic gradient descent with hinge loss, L2 regularization, alpha = 0.0001, a maximum of 300 iterations, and a fixed random seed. Performance was estimated by five-fold stratified cross-validation. Balanced accuracy was the primary metric because of marked differences in study size; ordinary accuracy, macro-averaged F1, top-three accuracy, and Cohen kappa were secondary metrics. A label permutation analysis was used to confirm the expected chance-level performance after publication labels were randomized.
2.6. Performance Prediction Cohort and Outcomes
The primary performance analysis was restricted to the gene expression/luminescence outcome family in LNPDB. These values had been standardized by the database creators within each publication and delivery context to a mean of zero and a standard deviation of one, after log transformation when raw luminescence values spanned several orders of magnitude [9]. The final cohort contained 17,420 records from 37 studies. The continuous standardized outcome was the primary target. The primary binary endpoint defined high-performing formulations as those with a standardized outcome of at least 0.674, corresponding approximately to the upper quartile of a standard normal distribution and remaining independent of the test-set outcome distribution. This definition produced an overall positive prevalence of 23.4%. Two secondary binary definitions were evaluated: a training-fold 75th-percentile threshold estimated exclusively from the corresponding training outcomes and applied unchanged to the test fold, and a retrospective study-relative endpoint defined at or above the complete source study 75th percentile, with ties retained.
2.7. Predictor Representations
Ionizable-lipid chemistry was represented by a 512-bit Morgan fingerprint with radius 2, molecular weight, calculated logP, topological polar surface area, hydrogen bond donor count, hydrogen bond acceptor count, rotatable-bond count, formal charge, fraction sp3 carbon, and a missing-structure indicator. Formulation features comprised helper lipid, sterol, PEG lipid, fifth component, ratio-order status, component molar percentages, and available ionizable-lipid-to-cargo mass and charge ratios. Experimental-context variables comprised aqueous and dialysis buffers, mixing method, model level, model type, biological target, administration route, cargo, cargo type, dose, and dose unit. Categorical vocabularies and numeric transformations were fitted using the training data within each fold and then applied to the corresponding test data. For the structural-separation analyses, a separate 2048-bit Morgan fingerprint with radius 2 [13] was generated for each unique ionizable-lipid connectivity. This higher-dimensional fingerprint was used exclusively for similarity graph construction and test-to-training similarity diagnostics. The original 512-bit fingerprint and molecular-descriptor representation used by the prediction models remained unchanged, ensuring that differences in performance reflected validation design rather than a change in predictive representation.
2.8. Validation Strategies
Six validation strategies were compared using identical endpoint definitions, predictor construction procedures, and fixed model settings:
- Random row validation: shuffled five-fold row-level cross-validation, allowing source studies, exact ionizable-lipid connectivities, related chemical series, and complete formulations to occur in both training and test partitions.
- Formulation-held-out validation: records were grouped according to the canonical complete-formulation signature, preventing the same complete formulation signature from crossing between training and test folds.
- Ionizable-lipid-connectivity-held-out validation: records were grouped according to the first block of the standardized InChIKey, preventing the same ionizable-lipid molecular connectivity from occurring in both training and test partitions. This design excluded exact connectivity reuse but did not necessarily exclude close structural analogs.
- Structural-similarity-cluster-held-out validation: the 11,265 unique ionizable-lipid connectivities were represented using 2048-bit Morgan fingerprints with radius 2. An undirected molecular-similarity graph was constructed by connecting every pair of ionizable lipids with a Tanimoto similarity of at least 0.80. Connected components of this graph were used as grouping units in shuffled five-fold grouped cross-validation. Consequently, no pair of molecular connectivities directly linked at or above the selected similarity threshold could be separated between training and test folds. Because connected-component construction permits transitive chaining, cluster size distributions and test-to-training nearest-neighbor similarities were recorded as additional split diagnostics.
- Study-held-out validation: records were grouped according to the canonical source publication identifier, ensuring that complete source studies were absent from model training.
- Temporal validation: models were trained on studies dated 2008–2021 and tested on studies dated 2022–2025. When publication year was absent from the explicit source metadata, it was recovered from the original source experiment identifier and retained in the temporal registry.
Grouped validation folds were constructed using a fixed random seed of 20260805. Categorical vocabularies, numeric transformations, and class weights were estimated exclusively from the corresponding training partition and subsequently applied to the test partition.
2.9. Prediction Models and Performance Metrics
The primary model was LightGBM [14] with fixed hyperparameters and no split-specific tuning: 180 boosting iterations, learning rate 0.04, 31 leaves, minimum 25 observations per leaf, subsample fraction 0.85, feature subsample fraction 0.80, and L2 regularization coefficient 1.0. Binary classification used class weighting derived from the training-set class ratio. A Ridge regression model with alpha = 10 and MaxAbs scaling of the combined feature representation was used as a linear sensitivity analysis. The modeling framework was intentionally restricted to two reproducible baseline families, rather than designed as a comprehensive comparison of LNP-specific architectures. LightGBM provided a nonlinear ensemble-based predictor, whereas Ridge regression served as a linear sensitivity model. Both approaches used the same underlying molecular fingerprint, descriptor, and formulation/context representations. No pretrained molecular encoders, graph neural networks, LNP-specific transformers, or domain adaptation procedures were evaluated. Accordingly, the analyses were intended to characterize the dependence of baseline predictive performance on validation design, not to establish architecture-independent limits on LNP performance prediction.
Continuous predictions were evaluated using coefficient of determination (R2), root-mean-square error, mean absolute error, overall Spearman rank correlation, and the mean of study-specific Spearman correlations. Binary predictions were evaluated using area under the receiver operating characteristic curve (ROC-AUC), area under the precision–recall curve (PR-AUC), balanced accuracy, macro-averaged F1, and Matthews correlation coefficient. Classification results reported in the main analysis refer to the fixed threshold of standardized outcome ≥0.674; results for the training-fold and retrospective study-relative thresholds were treated as sensitivity analyses. Test-fold predictions were concatenated to obtain one out-of-fold prediction for each eligible record, and pooled out-of-fold metrics were used as the primary performance estimates. Fold-specific metrics, class prevalence, and mean ± standard deviation across folds were retained as secondary stability diagnostics.
2.10. Sensitivity Analyses, Permutation Controls, and Reproducibility
To distinguish true within-study signal from implementation artifacts, three independent within-study permutations of the continuous outcome were generated. Each permuted target was then evaluated using shuffled three-fold row-level cross-validation with the combined LightGBM representation. Study-specific R2 and rank correlations were calculated from the row-level out-of-fold predictions after grouping predictions by source study. All analyses used random seed 20260805. The computational environment included Python 3.13.5, NumPy 2.3.5, SciPy 1.17.0, pandas 2.2.3, scikit-learn 1.8.0, LightGBM 4.6.0, RDKit 2025.09.4, and Matplotlib 3.10.8. Complete scripts, record-level predictions, fold assignments, QC logs, and file manifests were generated for reproducibility. Cross-database biological prediction from LNPDB to LNP Atlas was not performed because LNP Atlas does not provide a harmonized numeric biological endpoint directly comparable with the LNPDB standardized outcome.
Structural-separation sensitivity analyses repeated the molecular-similarity graph construction based on Morgan fingerprints [13] using Tanimoto thresholds of 0.75 and 0.85. Lower thresholds produce broader connected components and therefore a more restrictive separation between training and test chemical domains. For each threshold, the number and size of structural components, fold sizes, test-to-training maximum molecular similarity, source study overlap, and exact-connectivity overlap were recorded.
A complementary Bemis–Murcko scaffold-held-out analysis [15] was performed on the cyclic-molecule subset. Ionizable lipids with an empty Bemis–Murcko scaffold were excluded from this analysis because grouping all acyclic molecules by a common empty scaffold would create an artificial and chemically uninformative supergroup. Because the scaffold analysis used a reduced cohort, it was interpreted as a directional sensitivity analysis and was not directly compared numerically with the full-cohort validation estimates.
Binary-endpoint sensitivity analyses compared three definitions using identical prediction models and validation partitions: (i) the fixed standardized threshold of 0.674; (ii) a threshold corresponding to the 75th percentile of the training outcomes within each fold; and (iii) the retrospective 75th percentile of each complete source study. The training-derived threshold was estimated without access to test outcomes. Positive-class prevalence, ROC-AUC, PR-AUC, balanced accuracy, macro-F1, Matthews correlation coefficient, Brier score, and calibration measures were recorded for each endpoint definition.
To determine whether study-held-out performance was limited by the smaller training sets created by five-fold grouped validation, a true leave-one-study-out (LOSO) sensitivity analysis was performed. Each of the 37 source studies was held out once, while the model was trained on all remaining 36 studies using the same predictor representation, fixed LightGBM hyperparameters, and outcome definitions. Continuous-outcome performance and classification using the fixed standardized threshold of 0.674 were evaluated for each held-out study. The training-fold 75th-percentile endpoint was retained as a binary sensitivity analysis, with the threshold estimated exclusively from the 36 training studies. Pooled LOSO predictions were obtained by concatenating the predictions from all 37 held-out studies. Ninety-five percent confidence intervals were calculated using 1000 study-cluster bootstrap resamples, with source studies rather than individual records treated as the resampling units. LOSO study-specific estimates were also compared with the corresponding results from five-fold grouped study-held-out validation.
To quantify the difference between within-study predictive ranking and generalization to unseen publications, study-specific Spearman correlations obtained from random-row out-of-fold predictions were compared with those from true leave-one-study-out (LOSO) validation. All 37 studies were assigned equal weight in calculating study macro-correlations. The mean paired difference was evaluated using 20,000 bootstrap resamples at the study level.
Two additional LightGBM sensitivity analyses were performed using the original validation assignments and fixed model hyperparameters. First, a non-ionizable-chemistry control excluded ionizable-lipid identity, molecular fingerprints, SMILES, and molecular descriptors while retaining auxiliary formulation composition, component ratios, and experimental-context variables. Second, a study-aware model added a training-derived one-hot indicator of source publication identity to the original combined representation. Previously unseen publication categories were encoded as absent. Both analyses were evaluated under random-row, study-held-out, and temporal validation. Categorical transformations were fitted exclusively on training partitions. The corresponding results and record-level predictions are provided in Supplementary File S1.
A post hoc stratified analysis was performed using the original out-of-fold predictions from five-fold study-held-out LightGBM validation. Predictive performance was summarized separately by biological model and cargo, with pooled R2 and Spearman rank correlation calculated within each subgroup. For each held-out observation, we additionally determined whether the corresponding ionizable-lipid connectivity, defined by the first block of the standardized InChIKey, had been represented in the original training partition. We also identified observations for which the exact ionizable-lipid connectivity, biological model, and cargo combination was represented in training. No models were refitted, and the original publication-grouped partitions were preserved. These analyses were intended to characterize residual experimental-domain heterogeneity and the feasibility of chemically matched comparisons, rather than to provide a causal decomposition of domain shift. Detailed results and reproducibility scripts are provided in Supplementary File S1 and Table S8.
3. Results
3.1. Technical Audit and Canonicalization
The two downloadable resources differed substantially in structure and analytical emphasis. LNPDB contained 19,797 rows, of which 19,528 were experimental formulations and 269 were commercial ionizable-lipid reference entries. LNP Atlas contained 1092 rows. The canonical schema retained 20,889 records across 96 canonical source domains, comprising 95 unique publications and one commercial reference source; 10 publications were represented in both resources. A total of 4077 record-level QC issues or ambiguities were logged rather than silently overwritten.
Several source file issues were relevant to downstream modeling. The LNP Atlas numeric zeta-potential helper column disagreed with the signed source text in 152 of 326 non-missing records (46.6%), most commonly because a negative sign had been lost. These values were reparsed from the text field. Forty-six ratio strings did not contain exactly four numeric tokens, and 110 of the 1046 four-token strings did not sum to 100 ± 0.5. Only 10 records explicitly resolved the component order in the downloaded annotation before cross-database reconciliation. In addition, 13.9% of Atlas rows lacked an ionizable-lipid SMILES in the downloaded file, corresponding to lower observed coverage than described in the associated publication. Dataset-level audit and canonicalization results are summarized in Table 1.
Table 1.
Dataset audit and canonicalization summary.
3.2. Limited and Ambiguous Cross-Database Formulation Overlap
The 10 shared publications contained 217 Atlas formulation clusters and 5737 LNPDB formulation clusters. Only 29 Atlas clusters (13.4%) satisfied the strict full-formulation matching rule. Fifty-two clusters (24.0%) used the same ionizable lipid as a record in LNPDB but had discordant or incompletely resolved auxiliary components or ratios. Four clusters (1.8%) met the high-similarity candidate rule but could not be confirmed as identical formulations, and 132 clusters (60.8%) had no defensible formulation-level match. Cross-database formulation reconciliation results are summarized in Table 2 and Figure 1.
Table 2.
Cross-database reconciliation of Atlas formulations from the 10 shared publications.
Figure 1.
Cross-database formulation reconciliation. Atlas formulation clusters from the 10 publications shared with LNPDB were assigned to four prespecified matching tiers. A confirmed match required ionizable-lipid identity, agreement of at least two auxiliary lipid components, and agreement of normalized component ratios.
The confirmed matches also demonstrated that ratio-token order was study-dependent. In total, 17 of the 29 matches were consistent with the ionizable–helper–sterol–PEG order, whereas 12 required a different order. Across the complete databases, only 30 unique ionizable-lipid connectivity keys occurred in both resources. Among 22 same-name components with structures available in both databases, six names mapped to incompatible molecular structures. These findings showed that ionizable-lipid identity, literal component name, or publication overlap alone was insufficient to establish formulation identity.
3.3. Source Publications Were Strongly Encoded in Chemistry and Experimental Context
Source publication identity was highly predictable after all direct publication identifiers were removed. In LNPDB, ionizable-lipid chemistry alone identified the source study with 88.94% accuracy and 88.55% balanced accuracy. Complete formulation features increased accuracy to 93.16% and balanced accuracy to 95.19%. Experimental context alone achieved 74.88% accuracy and 67.06% balanced accuracy. Combining chemistry, formulation, and context identified 19,516 of 19,528 records correctly, corresponding to 99.94% accuracy and 99.32% balanced accuracy.
The Atlas results showed an even stronger contextual signature. Ionizable chemistry alone produced 52.99% accuracy and 44.45% balanced accuracy; complete formulation features produced 86.99% and 83.57%, respectively. Minimal context achieved 69.52% accuracy, while complete experimental context achieved 99.05% accuracy and 98.42% balanced accuracy. Combining all features did not improve on experimental context alone. After source study labels were permuted, mean balanced accuracy returned to 2.28% in LNPDB and 2.06% in Atlas, close to the multiclass chance levels. Thus, the high separability reflected genuine study-specific data structure rather than classifier behavior. Complete source study signature results are summarized in Table 3 and Figure 2.
Table 3.
Study signature prediction performance.
Figure 2.
Source publication identity is recoverable from formulation chemistry and experimental context. Bars show out-of-fold balanced accuracy from five-fold stratified cross-validation. Direct publication identifiers were excluded from all predictor sets.
3.4. Primary Performance Cohort
The performance-modeling pool contained 19,008 eligible LNPDB records. The primary analysis was restricted to the 17,420 records from 37 studies belonging to the gene expression/luminescence outcome family, comprising 11,265 unique ionizable-lipid connectivity groups and 14,889 complete-formulation signatures. The remaining performance-eligible records were not pooled with the primary target because they belonged to other outcome categories. Using the fixed binary endpoint of standardized outcome ≥ 0.674, 23.4% of the primary cohort was classified as high performing. The retrospective study-relative 75th-percentile endpoint classified 34.0% of records as positive because ties at the study-specific threshold were retained. The training-fold 75th-percentile endpoint produced an approximately 25% positive prevalence, with small fold-to-fold variation because the threshold was estimated separately within each training partition. The temporal split used 5170 records from 10 studies dated 2008–2021 for training and 12,250 records from 27 studies dated 2022–2025 for testing.
3.5. Row-Level and Exact-Formulation Validation Produced Similar Apparent Performance
Under random row validation, the combined LightGBM model achieved R2 = 0.317, RMSE = 0.825, and Spearman ρ = 0.538 for the continuous outcome (Figure 3). Using the fixed binary endpoint of standardized outcome ≥ 0.674, high-performer classification achieved ROC-AUC = 0.815, PR-AUC = 0.596, balanced accuracy = 0.734, and Matthews correlation coefficient = 0.410 (Figure 4).
Figure 3.
Regression performance across progressively stricter validation designs. R2 and Spearman rank correlation are shown for the combined LightGBM model predicting the study-normalized gene expression/luminescence outcome. Structural-similarity separation used connected components of a Morgan-fingerprint Tanimoto graph at the primary threshold of 0.80.
Figure 4.
Classification performance across progressively stricter validation designs. ROC-AUC and precision–recall AUC are shown for identifying formulations with a standardized outcome of at least 0.674. Structural-similarity separation used connected components of a Morgan-fingerprint Tanimoto graph at the primary threshold of 0.80. The dashed horizontal line indicates the conventional ROC chance level of 0.5.
However, every test record came from a source study represented in the corresponding training set; 42.7% used an ionizable-lipid connectivity already represented in training, and 18.7% shared a complete-formulation signature with training data (Figure 5). Aggregate performance across the six principal validation designs is summarized in Table 4.
Figure 5.
Training–test overlap remaining under each validation design. Bars show the proportions of concatenated test-fold records for which the source study, exact ionizable-lipid connectivity, or exact complete-formulation signature was already represented in the corresponding training partition. Structural-similarity clustering eliminated exact-connectivity and complete-formulation overlap while retaining source study overlap for 86.9% of test records.
Table 4.
Combined-model performance under progressively stricter validation designs.
Preventing exact formulation signatures from crossing folds produced almost no performance loss. Formulation-held-out validation yielded R2 = 0.313, Spearman ρ = 0.534, ROC-AUC = 0.812, and PR-AUC = 0.593. All test records still came from studies present in training, and 38.1% used ionizable-lipid connectivity groups already represented in training. Therefore, excluding exact duplicate formulations did not remove the dominant study and chemical-library overlap.
3.6. Ionizable-Lipid-Connectivity Holdout Produced a Moderate Decline
When ionizable-lipid connectivity groups were separated between training and testing, the combined model retained moderate predictive performance: R2 = 0.239, Spearman ρ = 0.457, ROC-AUC = 0.761, and PR-AUC = 0.467. The absolute declines relative to random row validation were 0.078 for R2, 0.080 for Spearman correlation, 0.054 for ROC-AUC, and 0.129 for PR-AUC. Nevertheless, 86.9% of test observations still came from source studies represented in training. This design therefore evaluated extrapolation to new ionizable chemistry primarily within familiar experimental and publication domains. However, this validation design excluded only the reuse of identical ionizable-lipid connectivity. It did not prevent structurally close analogs or members of the same chemical series from occurring in both training and test partitions. Structural-similarity clustering was therefore used to determine how much of the remaining performance depended on proximity to related training molecules.
3.7. Structural-Similarity Separation Substantially Reduced Apparent Chemical Generalization
At the primary Tanimoto threshold of 0.80, the 11,265 unique ionizable-lipid connectivities were assigned to 553 structural connected components. Detailed structural-component composition and size diagnostics are provided in Table S2. Components were retained intact across five grouped folds. No test record had an exact ionizable-lipid connectivity represented in the corresponding training partition, whereas 86.9% of test records originated from a source study that remained represented in training. Across folds, the median maximum similarity of a test chemistry to the training set ranged from 0.704 to 0.730, and the maximum observed cross-partition similarity remained below 0.80 by construction.
Structural-similarity-cluster-held-out validation produced a marked additional performance decline. The combined LightGBM model yielded R2 = 0.035, RMSE = 0.981, overall Spearman ρ = 0.229, and study macro-Spearman ρ = 0.186. Using the fixed binary endpoint, high-performer classification yielded ROC-AUC = 0.654, PR-AUC = 0.349, balanced accuracy = 0.593, and Matthews correlation coefficient = 0.173.
Relative to ionizable-lipid-connectivity-held-out validation, structural-similarity separation reduced R2 by 0.204, Spearman correlation by 0.228, ROC-AUC by 0.107, and PR-AUC by 0.118. Thus, excluding exact molecular connectivity alone retained substantial information from structurally related molecules represented in training.
Threshold sensitivity analyses supported the same regression conclusion. At a Tanimoto threshold of 0.85, the model achieved R2 = 0.104, whereas broadening the structural components by lowering the threshold to 0.75 reduced R2 further to 0.010. Regression threshold sensitivity is summarized in Table S1 and Figure S3. Exploratory classification results across the alternative molecular-similarity thresholds used the retrospective study-relative 75th-percentile endpoint and are shown in Figure S4.
Of the 11,265 unique ionizable-lipid connectivities, 5266 had a non-empty Bemis–Murcko scaffold and 5999 were acyclic. The cyclic subset contained 7363 records distributed across 357 scaffolds. Within this reduced cohort, scaffold-held-out regression yielded R2 = 0.081 and Spearman ρ = 0.260. Exploratory classification using the retrospective study-relative 75th-percentile endpoint yielded ROC-AUC = 0.732 and PR-AUC = 0.616. Because this analysis excluded acyclic structures and used a different cohort, its absolute estimates were treated as supportive rather than directly comparable with the full-cohort validation results (Table S3).
Collectively, these analyses identified an intermediate level of transportability failure. Performance declined substantially when close molecular analogs were separated, but it remained higher than under complete study-held-out validation. Structural novelty and experimental-domain novelty therefore represented distinct and cumulative challenges.
3.8. Predictive Performance Collapsed for Unseen Studies
Study-held-out validation removed all source publication overlap and produced a marked performance collapse. The combined LightGBM model yielded R2 = −0.070, RMSE = 1.033, Spearman ρ = 0.076, ROC-AUC = 0.531, PR-AUC = 0.253, balanced accuracy = 0.513, and Matthews correlation coefficient = 0.024. The PR-AUC was close to the fixed-endpoint positive prevalence of 0.234, and discrimination was only marginally above chance. Only 15.4% of test observations used ionizable-lipid connectivity groups represented in training, while complete-formulation overlap was effectively absent.
True leave-one-study-out validation confirmed that the weak study-held-out performance was not explained by the smaller training sets used in five-fold grouped validation. When each study was tested once and all remaining 36 studies were used for training, pooled regression performance remained poor, with R2 = −0.041, RMSE = 1.019, and Spearman ρ = 0.104. Study-cluster bootstrap intervals were −0.103 to 0.009 for R2 and 0.038 to 0.172 for Spearman correlation. Under the fixed binary endpoint, pooled ROC-AUC was 0.554 (95% CI, 0.523–0.600), PR-AUC was 0.271 (95% CI, 0.237–0.314), balanced accuracy was 0.539, and Matthews correlation coefficient was 0.074. The training-derived 75th-percentile endpoint produced a similar ROC-AUC of 0.561 (95% CI, 0.525–0.603) (Table S5).
Study-specific LOSO performance remained highly heterogeneous (Figure 6, Figure S7 and Table S6). The median study-specific R2 was −0.065, with an interquartile range from −0.185 to 0.053; only 12 of 37 studies had R2 greater than zero. Median study-specific Spearman correlation was 0.089, and median fixed-endpoint ROC-AUC was 0.579, with an interquartile range from 0.516 to 0.643. Compared with five-fold grouped study holdout, LOSO increased study-specific R2 by only 0.006 on average and fixed-endpoint ROC-AUC by only 0.007 on average. Thus, providing the model with the largest possible training set of remaining studies did not materially restore transportability.
Figure 6.
Study-specific regression performance under true leave-one-study-out validation. Each bar represents R2 for one source study held out while the model was trained on all remaining 36 studies. The dashed horizontal line indicates R2 = 0. Studies are ordered according to their observed LOSO performance.
A direct comparison of study-specific ranking performance further quantified the local-to-external generalization gap. Under random-row validation, the mean study-specific Spearman correlation across the 37 publications was 0.433, compared with 0.137 under true LOSO validation. The mean paired difference was 0.296 (95% study-cluster bootstrap CI, 0.209–0.389), with higher correlations under random-row validation in 32 of the 37 studies. These findings quantitatively demonstrate the deterioration in within-study ranking performance when entire source publications are excluded from model training. However, the comparison does not isolate the relative contributions of chemical, formulation, or experimental-context differences to the observed decline.
3.9. Temporal Generalization Was Poor
Temporal validation further tested whether earlier studies could predict later experimental domains. Training on studies from 2008 to 2021 and testing on studies from 2022 to 2025 yielded R2 = −0.217, RMSE = 1.101, Spearman ρ = 0.061, ROC-AUC = 0.528, PR-AUC = 0.264, balanced accuracy = 0.516, and Matthews correlation coefficient = 0.044. No test study was represented in training; 18.5% of test records used an ionizable chemistry seen in earlier studies, while complete-formulation overlap was approximately zero. These results showed that chronological separation introduced both publication-level and chemical-domain shift that was not captured by the pooled model.
3.10. The Transportability Gradient Persisted Under Test-Independent Binary Endpoints
The fixed binary endpoint classified formulations with a standardized outcome of at least 0.674 and produced an overall positive prevalence of 23.4%. Under this definition, ROC-AUC decreased progressively from 0.815 under random row validation and 0.812 under formulation-held-out validation to 0.761 under ionizable-lipid-connectivity holdout and 0.654 under structural-similarity-cluster holdout. Discrimination was only marginally above chance for completely unseen publications and later studies, with ROC-AUC values of 0.531 and 0.528, respectively.
The training-fold 75th-percentile endpoint produced a similar pattern without using test outcomes to determine the classification threshold. Positive prevalence was approximately 25.0% across the cross-validation analyses, although it varied slightly because the threshold was estimated separately within each training partition. ROC-AUC was 0.813 under random row validation, 0.813 under formulation holdout, 0.763 under connectivity holdout, and 0.653 under structural-similarity separation. It remained weak under study-held-out and temporal validation, with values of 0.550 and 0.515, respectively.
The retrospective study-relative endpoint yielded somewhat higher apparent discrimination within familiar experimental domains, including ROC-AUC values of 0.844 under random row validation and 0.708 under structural-similarity separation. However, it also failed under complete study holdout, where ROC-AUC was 0.476. Differences in PR-AUC between endpoint definitions were partly attributable to differences in positive-class prevalence: 34.0% for the retrospective study-relative endpoint, 23.4% for the fixed endpoint, and approximately 25.0% for the training-fold endpoint. Collectively, the same transportability gradient was observed under both test-independent definitions, demonstrating that the principal finding was not an artifact of defining high performance from the outcome distribution of the test study. Complete classification results for all three binary endpoint definitions are reported in Table S4 and Figures S5 and S6.
3.11. Sensitivity Analyses and Permutation Controls
The Ridge regression sensitivity analysis showed a qualitatively similar deterioration under study-held-out and temporal validation, although this agreement between two baseline model families does not establish that the magnitude of the performance decline is independent of model architecture or molecular representation. Ridge regression achieved R2 = 0.169 under random row validation but decreased to −0.147 under ionizable-lipid-connectivity-held-out validation, −1.042 under study-held-out validation, and −0.458 under temporal validation. Experimental context used alone did not predict the standardized outcome: R2 was −0.005 under random row validation, approximately zero under study-held-out validation, and approximately zero under temporal validation. These findings indicate that experimental context alone was insufficient to predict the study-normalized outcome. However, this result does not establish whether the predictive advantage of the combined model originated primarily from ionizable-lipid chemistry, auxiliary formulation characteristics, or interactions with study-specific experimental conditions.
A supplementary negative-control analysis evaluated whether non-ionizable-chemistry formulation and experimental-context variables could independently support apparent predictive performance. After excluding ionizable-lipid identity, molecular fingerprints, SMILES, and molecular descriptors, the LightGBM model retained auxiliary lipid identities, component ratios, and experimental-context variables. This restricted model achieved R2 = 0.114 under random-row validation, compared with R2 = −0.081 under study-held-out validation and R2 = −0.196 under temporal validation. Thus, ancillary formulation and experimental-context information retained measurable predictive signal within the aggregated dataset, but this signal did not translate into reliable zero-shot performance in unseen studies.
An additional study-aware sensitivity analysis incorporated source-publication identity as a training-derived categorical indicator in the original combined LightGBM model. Random-row R2 changed only slightly, from 0.317 to 0.319, while study-held-out R2 changed from −0.070 to −0.072. Temporal validation R2 changed from −0.217 to −0.176 but remained negative. These findings indicate that the inclusion of explicit study identity indicators did not materially resolve the generalization problem. Importantly, this analysis did not implement hierarchical random-effects modeling or calibration with labeled observations from an unseen study. Detailed sensitivity analysis results are presented in Table S7, while record-level predictions and reproducibility scripts are provided in Supplementary File S1.
Within-study permutation of the continuous target returned performance to chance (Figure S1). Across three permutations, mean R2 was −0.019, mean overall Spearman correlation was −0.007, and mean study macro-Spearman correlation was −0.038. Fold-level results were stable for random and formulation-held-out validation but substantially more variable for connectivity-, structural-similarity-, and study-held-out designs (Figure S2).
3.12. Stratified Study-Held-Out Performance and Chemical–Experimental Domain Overlap
A post hoc stratified analysis was conducted to assess whether the poor study-held-out performance was confined to particular biological models or cargo categories. Among biological-model strata containing at least 200 observations from two or more source publications, pooled R2 remained negative for HeLa (n = 7455; R2 = −0.062), A549 (n = 2569; R2 = −0.008), HepG2 (n = 2000; R2 = −0.093), DC2.4 (n = 1703; R2 = −0.141), IGROV1 (n = 1202; R2 = −0.160), and Mouse B6 (n = 649; R2 = −0.078). Cargo-stratified results similarly showed negative R2 for mRNA (n = 13,001; R2 = −0.075) and siRNA (n = 3339; R2 = −0.017). The pDNA subset contained 1080 records from only one publication and therefore could not establish reproducibility across independent source studies (Table S8).
To assess the feasibility of separating chemical novelty from other experimental differences, we further examined exact ionizable-lipid connectivity overlap between each held-out observation and its corresponding training partition. Only 2674 of 17,420 observations (15.4%) had an ionizable-lipid connectivity represented in training. Performance remained poor within this chemically overlapping subset (R2 = −0.132), compared with R2 = −0.060 for observations with unseen connectivity. However, the overlapping subset was highly imbalanced: 2205 observations belonged to a single molecular connectivity.
Only 316 observations from seven source studies had the same ionizable-lipid connectivity, biological model, and cargo combination represented in training. Within this selected subset, pooled R2 was −0.136, whereas Spearman correlation was 0.485, suggesting that some ranking information may persist even when numerical prediction remains poorly calibrated. The limited size and unequal composition of this subset preclude broad conclusions about chemically matched experimental-domain transfer.
Furthermore, only 62 ionizable-lipid connectivity groups occurred in both the mRNA and siRNA subsets, represented by 69 mRNA observations and 64 siRNA observations. Thus, the available literature-aggregated data provided insufficient balanced overlap for a reliable controlled evaluation in which biological or cargo domains were changed while chemical structure and other experimental conditions remained fixed. These results support the descriptive conclusion that zero-shot performance remains limited across several biological and cargo strata, but they do not identify the independent causal contributions of chemical, biological, or protocol-related shifts.
4. Discussion
4.1. Principal Findings
This study provides a cross-database and cross-validation audit of public LNP data rather than another search for the highest internal predictive score. Five findings were central. First, database overlap at the publication level did not imply agreement at the formulation level: only 29 of 217 Atlas formulation clusters from shared publications could be confirmed as complete-formulation matches. Second, source publication identity was strongly encoded in both chemistry and experimental context. Third, apparent performance remained almost unchanged when exact formulations were excluded and declined moderately when exact ionizable-lipid connectivity was held out. Fourth, separating structurally related molecular families reduced continuous predictive performance almost to zero and substantially weakened classification. Fifth, performance collapsed when complete publications were excluded and remained poor under chronological validation. The same validation gradient persisted under two binary endpoint definitions that were determined without access to test-set outcomes.
The study signature and outcome prediction analyses should be interpreted together, while recognizing that they address distinct questions. The strong predictability of source publication identity demonstrates the presence of study-specific chemical and experimental signatures but does not establish target leakage or identify the causes of limited biological-performance transfer. Importantly, the LNPDB gene expression/luminescence outcome was standardized within publication and delivery context. Consequently, study-held-out validation evaluates zero-shot prediction of relative formulation performance in an unseen experimental domain, rather than prediction of absolute biological potency across studies. The observed deterioration therefore demonstrates limited transportability for this specific normalized prediction task and should not be interpreted as evidence that molecular structure–performance relationships are universally non-transferable. Moreover, chemical libraries, formulation characteristics, and experimental conditions change simultaneously between publications, preventing causal attribution to any individual source of domain shift. Models incorporating a small number of labeled observations from a new study through calibration or domain adaptation may perform differently. Few-shot adaptation was not evaluated in the present investigation and represents an important direction for future work.
The additional study-level and predictor ablation analyses further refine this interpretation. The substantially higher study macro-Spearman correlation under random-row validation than under LOSO provides direct quantitative evidence that predictive ranking is more successful when source study domains remain represented during training. However, the non-ionizable-chemistry control demonstrates that auxiliary formulation composition and experimental context can also contribute to apparent within-dataset predictability. Consequently, the observed validation gradient should not be attributed exclusively to the learning of transferable molecular structure–activity relationships or to a single source of experimental confounding. Likewise, adding a study identity indicator did not restore zero-shot transportability, although this finding does not exclude the potential value of hierarchical models or few-shot adaptation approaches that explicitly incorporate observations from a new experimental domain.
4.2. Database Consistency and the Meaning of Formulation Identity
The technical audit showed that cross-database integration is not a simple concatenation problem. LNPDB and LNP Atlas were constructed for complementary purposes and differ in schema, outcome representation, and level of experimental detail [9,10]. More importantly, independently curated records from the same publication were frequently not direct duplicates. Ionizable-lipid identity alone was insufficient: 52 Atlas clusters used an ionizable lipid also found in LNPDB but differed in auxiliary lipids, ratios, or both. For a multicomponent delivery system, these records cannot be treated as the same formulation merely because the principal ionizable lipid is shared.
The audit also identified practical representation conflicts. The downloaded Atlas file contained additional helper columns beyond the 28 fields described in the publication, and the numeric zeta-potential helper lost or altered the negative sign in 152 of 326 non-missing records. Confirmed matches demonstrated that the order of ratio tokens varied across studies, despite the intended standardization. Same-name components occasionally mapped to incompatible molecular structures, particularly when PEG lipids were represented at different levels of polymer detail. These observations do not negate the value of either resource. They show why raw values, normalized values, provenance, and correction flags must coexist, and why molecular identity should be verified through standardized structures rather than names or literal SMILES alone.
4.3. Study Signatures Are a Property of the Data-Generating Process
The source study classifier quantified a feature that is often visible qualitatively in LNP research: each publication explores a relatively specific chemical and biological neighborhood. In LNPDB, ionizable chemistry alone identified the source publication with 88.94% accuracy, and the full formulation increased accuracy to 93.16%. In Atlas, structured experimental context identified the publication with 99.05% accuracy. These results are not surprising given the organization of high-throughput campaigns. Head groups, linkers, tails, helper lipids, mixing devices, target cells, animal models, routes, doses, and readouts are rarely sampled independently across the literature.
The permutation control and minimal-context analysis strengthen this conclusion. Shuffling publication labels returned balanced accuracy to chance. At the same time, broad contextual variables remained informative even after highly specific free-text categories were excluded. Therefore, the result was not produced solely by a few explicit identifiers or by an overparameterized classifier. Study identity is embedded in the joint distribution of chemistry, formulation, experiment, and missingness.
4.4. Exact-Formulation, Connectivity, Structural, and Study Holdout Test Different Claims
The validation hierarchy revealed four distinct levels of generalization. Random row and formulation-held-out validation produced nearly identical results. This indicates that exact duplicate formulations were not the principal source of optimistic performance. Even after complete formulation signatures were separated, every test record originated from a publication represented in training, and many used ionizable-lipid chemistry already seen by the model. Formulation holdout therefore remained primarily a test of interpolation within familiar chemical and experimental libraries [16].
Ionizable-lipid-connectivity holdout was more demanding because the same molecular connectivity could not cross folds. Nevertheless, it retained moderate performance, with R2 = 0.239 and ROC-AUC = 0.761 under the fixed binary endpoint. This result did not establish extrapolation to genuinely distinct chemical families, because close analogs could remain represented in training [17].
Structural-similarity clustering addressed this limitation. When all directly linked molecular pairs with Tanimoto similarity of at least 0.80 were retained within common grouping components, R2 decreased to 0.035 and ROC-AUC to 0.654 under the fixed binary endpoint. The threshold sensitivity analyses produced the same qualitative pattern, with broader structural grouping causing additional deterioration. The cyclic-subset Bemis–Murcko analysis was directionally consistent. These results indicate that exact-connectivity separation alone remained permissive to chemically related analogs and substantially overstated performance for structurally distinct candidate sets [18,19].
Structural separation did not, however, reproduce the complete collapse observed under study-held-out validation. Under the primary similarity cluster split, 86.9% of test records still originated from publications represented during training. The model therefore encountered structurally separated chemistry within largely familiar experimental systems. Study-held-out validation simultaneously changed the chemical library and the data-generating process, including biological model, target, cargo, formulation protocol, dose, route, and readout. Under this design, R2 became negative and classification approached chance.
The supplementary stratified analysis provides additional context for interpreting these findings. Negative pooled R2 estimates were observed across several biological-model and cargo strata, indicating that the deterioration under publication-held-out validation was not confined to a single experimental model or cargo category. Nevertheless, these subgroup comparisons remain observational because the original source publications differ in multiple correlated experimental characteristics. The restricted and highly imbalanced overlap of exact ionizable-lipid connectivity across experimental domains prevented an adequately controlled separation of chemical and assay-related effects. Notably, the selected subset sharing ionizable-lipid connectivity, biological model, and cargo with training observations retained a positive Spearman correlation despite negative R2, emphasizing the distinction between relative ranking and accurate numerical prediction. Accordingly, the observed transportability loss should be attributed to a combination of potentially interacting domain differences rather than to any individually established causal mechanism.
The results therefore support a hierarchical interpretation of model performance. Random and formulation-grouped validation measure interpolation within familiar domains; connectivity and similarity grouping assess progressively stricter chemical extrapolation; and publication and temporal holdout assess transportability across complete experimental domains [20,21]. These validation designs are complementary rather than interchangeable, and each supports a different strength of scientific claim.
The endpoint audit further showed that this hierarchy was not created by the retrospective study-relative definition of high performance. Both the fixed standardized threshold and the training-fold percentile threshold reproduced the progressive loss of discrimination from familiar formulations to structurally separated chemistry and completely unseen source studies. The higher PR-AUC values obtained with the retrospective endpoint were partly expected because that definition produced a higher positive-class prevalence. More importantly, all three definitions showed weak discrimination for unseen publications and later experimental domains. The transportability conclusion therefore remained stable despite substantial differences in how the binary target was constructed.
True leave-one-study-out validation addressed a further possible explanation for the study-held-out performance decline. In five-fold grouped study validation, each model was trained on approximately four-fifths of the available publications, raising the possibility that performance was limited simply by the reduced number of training studies. LOSO provided each held-out study with the largest possible training set of 36 remaining studies, yet pooled R2 remained negative and fixed-endpoint ROC-AUC reached only 0.554. Improvements relative to five-fold grouped validation were negligible at the study level. The failure to transport was therefore not primarily attributable to withholding too much training data; it persisted even when almost the entire database was available for model development.
4.5. Relationship to Recent LNP Machine Learning Studies
The present findings should not be interpreted as evidence that machine learning cannot guide LNP discovery. Prospective studies have demonstrated that models can identify experimentally active lipids when the prediction task is tied to a defined synthesis space and followed by wet-lab validation [1,2,3,4,5]. AGILE used a large virtual library and experimental fine-tuning to discover active candidates [1]. Machine-learning-guided combinatorial chemistry and LiON produced experimentally validated lipids for specific delivery targets [2,3]. COMET was trained on the systematically generated LANCE dataset and validated candidate formulations experimentally, including applications beyond the primary training configuration [4]. These controlled campaigns differ fundamentally from retrospective aggregation across many laboratories. Recent reviews have likewise positioned AI-assisted nanopharmaceutical development within a translational framework in which predictive formulation design must ultimately be linked to experimentally meaningful validation [22,23].
LNPDB also reported improved LiON performance on selected fully held-out datasets and emphasized variation in accuracy across libraries [9]. Our analysis addresses a complementary question. Rather than comparing one architecture with another on selected test libraries, we quantified the full gradient from row-level to study-level and temporal separation across all eligible studies in a harmonized endpoint family. The resulting collapse does not contradict the possibility that some study pairs are compatible or that a specialized model can generalize to a selected external library. It shows that a single pooled performance estimate should not be generalized across the entire heterogeneous database without reporting library-specific and study-specific behavior.
An important distinction between the present investigation and recent LNP-specific predictive frameworks concerns model architecture and representation learning. AGILE combines molecular representation pretraining with experimental fine-tuning, LiON was developed for LNP activity prediction and evaluated on selected external libraries, and COMET integrates molecular and formulation-level information through a transformer-based architecture [1,3,4,9]. These approaches may capture structural and compositional relationships that are not adequately represented by fixed molecular fingerprints and handcrafted descriptors. Moreover, pretrained representations, multitask learning, and domain-specific fine-tuning may improve adaptation to previously unseen experimental domains. Because these architectures were not evaluated on the same LNPDB outcome and validation partitions in the present study, direct performance comparisons would be inappropriate. The observed deterioration should therefore be interpreted as a property of the evaluated baseline models under the specified validation designs, rather than as an architecture-independent limitation of machine-learning-based LNP prediction. Nevertheless, the strong source study signatures, chemical heterogeneity, and limited cross-database formulation agreement documented here remain relevant considerations when designing and validating more sophisticated models.
A particularly relevant comparison is provided by the recent source-aware benchmark of Wu et al. [24], which examined predictive transportability across publication-defined LNP experimental domains. Their findings similarly demonstrated that random-row validation can produce substantially more optimistic performance estimates than source-held-out evaluation. Unlike this benchmark, the present study additionally integrates conservative complete-formulation reconciliation between LNPDB and LNP Atlas, structural-similarity-based and temporal validation, and complementary study-level sensitivity analyses. Thus, our contribution lies in the combined assessment of database consistency, molecular identity, experimental provenance, and predictive transportability, rather than in the introduction of publication-held-out validation itself.
4.6. Implications for LNP Databases and Predictive Modeling
The results suggest several practical requirements for future LNP data infrastructure. Each component should be represented by a standardized chemical identifier, while the original name and structure string remain available for provenance. Component order must be explicit, and molar ratios should be stored in named fields rather than as an unlabeled sequence. Formulation identifiers should distinguish a molecular composition from an experimental observation, because one formulation may be tested across multiple doses, targets, routes, or assays. Raw outcomes, transformations, within-study normalization, units, detection limits, and assay controls should be reported separately. Manufacturing variables and missingness should be treated as first-class data rather than optional annotations.
These recommendations arise from the observed dataset heterogeneity and limitations of external validation, rather than from causal identification of specific sources of predictive failure. Future benchmark datasets should preferentially include matched ionizable-lipid chemistries evaluated across multiple biological models, cargo types, and standardized experimental protocols. Factorially structured experiments or carefully matched cross-domain cohorts would make it possible to quantify the separate and interacting contributions of chemical and experimental shifts. Until such evidence becomes available, claims regarding the mechanisms underlying transportability loss should remain appropriately qualified.
Model evaluation should likewise be aligned with the intended claim. Random splits may be retained as an internal optimization diagnostic, but they should not be presented as evidence of broad discovery capability. At minimum, studies using aggregated literature data should report formulation-grouped, connectivity-grouped, structural-similarity-grouped, and publication-grouped validation [25,26,27]. When dates permit, temporal holdout should be added. Performance distributions across external studies are more informative than a single pooled metric, and out-of-domain uncertainty or applicability-domain indicators should accompany predictions. The strongest evidence remains prospective synthesis and testing in an experimental system not used to construct the model.
These recommendations also affect model development. A universal pooled model may not be optimal when the database contains multiple incompatible tasks. Hierarchical or multitask approaches could explicitly represent study, assay, target tissue, and route while separating shared from domain-specific effects. Domain adaptation may be useful when a new campaign provides a small calibration set. However, these methods should be assessed using study-level or temporal test sets; otherwise, increased flexibility may simply improve reconstruction of study signatures.
For formulation scientists, these findings have several direct practical implications. First, when selecting candidate LNP formulations from published datasets, the identity of the ionizable lipid alone should not be considered sufficient evidence of formulation equivalence. Auxiliary lipid identities and component ratios must also be verified, as demonstrated by the limited number of confirmed complete-formulation matches between LNPDB and LNP Atlas (29 of 217 eligible Atlas clusters). Second, predictive scores should be interpreted in relation to the chemical and experimental domains represented during model training. Models validated only through random-row splitting may support exploratory ranking within familiar formulation libraries, but their reported accuracy should not be assumed to apply to newly synthesized lipid families, different biological targets, or altered experimental protocols. Third, when extending formulation screening to previously untested chemical or biological domains, model-generated rankings should be treated as hypotheses requiring experimental confirmation rather than as reliable estimates of delivery performance. A small, appropriately designed validation panel may help establish whether the predictions are useful in the intended experimental setting, although such calibration was not evaluated in the present study. Thus, the principal practical contribution of this work is to provide evidence-based criteria for assessing formulation identity, interpreting predictive reliability, and identifying situations in which independent experimental validation is particularly important.
4.7. Limitations
This investigation has several limitations. First, it was a secondary analysis of curated databases and did not re-extract every value from all original articles. The reconciliation algorithm was deliberately conservative and may have missed true matches when names, structures, or ratios were incomplete. Conversely, a small number of confirmed matches may still conceal source-level ambiguities. Second, the primary outcome was restricted to the LNPDB gene expression/luminescence family. This improved comparability but does not establish that the same degree of transportability failure applies to editing, knockdown, uptake, viability, biodistribution, or physicochemical endpoints.
Third, the LNPDB outcome had already been normalized within publication and delivery context. This was advantageous because it reduced incompatible absolute scales, but it removed information about cross-study effect magnitude and shifted the task toward within-study ranking. Accordingly, the poor study-held-out performance should be interpreted as limited zero-shot transfer of relative performance predictions across unseen experimental domains. It does not establish the impossibility of predicting absolute potency or of improving performance through study-specific calibration, nor does it identify the individual experimental factors responsible for the observed shift.
Fourth, publication years missing from explicit metadata were recovered from source experiment identifiers for temporal validation. These inferred years were recorded, but the temporal split remains a coarse approximation of prospective use.
Fifth, LNP Atlas did not contain a harmonized numeric biological outcome directly comparable with the LNPDB target. We therefore did not manufacture a cross-database biological validation from free-text bioactivity descriptions. Cross-database analysis was limited to publication, chemistry, formulation, and physicochemical reconciliation. Sixth, the predictive analysis was restricted to fixed-hyperparameter LightGBM and Ridge regression models using Morgan fingerprints, molecular descriptors, and structured formulation/context variables. Although both baseline families exhibited substantial deterioration under study-held-out and temporal validation, they shared the same feature representation. Therefore, these results cannot establish that the observed performance decline is independent of architecture, representation learning, or model optimization. In particular, pretrained graph-based encoders, LNP-specific transformer architectures, hierarchical models, and approaches incorporating calibration observations from previously unseen experimental domains were not assessed. Such models may recover predictive information that was inaccessible to the evaluated baselines. Their performance under the same structure-aware, study-held-out, and temporal partitions remains an important question for future benchmarking. Additional modeling limitations concern feature completeness, optimization, and predictive uncertainty. The models relied on predefined molecular fingerprints, calculated descriptors, and the formulation and experimental metadata available in the source databases. Potentially relevant manufacturing, physicochemical, and assay-related factors may have been incompletely reported or inconsistently annotated across publications, limiting the information available for learning transferable relationships. Moreover, fixed hyperparameters were used to ensure comparability across validation designs; the reported results therefore should not be interpreted as the best achievable performance after architecture-specific or nested hyperparameter optimization. Finally, although molecular-similarity diagnostics were examined, the models did not provide formally calibrated predictive uncertainty estimates or an abstention mechanism for formulations outside the training domain.
Seventh, the analyses quantify transportability of the available data, not the biological potential of unmeasured LNPs. Structural clustering also introduced methodological limitations. Similarity components depend on the molecular representation, selected Tanimoto threshold, and graph-grouping rule. Connected components guarantee that directly linked pairs above the threshold do not cross folds, but transitive paths can place less-similar molecules in the same component and can generate unequal group and fold sizes. Sensitivity analyses at thresholds of 0.75 and 0.85 nevertheless produced the same qualitative conclusion. The Bemis–Murcko analysis was restricted to cyclic molecules because acyclic structures have an empty scaffold; its absolute performance estimates should therefore not be compared directly with those obtained in the complete cohort. The fixed binary threshold of 0.674 was selected as a test-independent operational definition corresponding approximately to the upper quartile of a standard normal distribution. It should not be interpreted as a biologically validated potency threshold, because the source outcome had been standardized within publication and delivery context and individual study distributions were not necessarily normal. The closely similar results obtained with training-fold percentile thresholds reduce dependence on this particular numerical cutoff, but the continuous outcome remains the primary analysis. The LOSO confidence intervals treated source studies as the independent sampling units, but only 37 eligible studies were available. These intervals quantify uncertainty across the observed study collection and should not be interpreted as describing every possible future LNP experimental domain. Prospective experiments are required to determine whether improved standardization, hierarchical modeling, or domain adaptation can recover generalizable performance.
Finally, the stratified domain-overlap analysis was descriptive and did not independently manipulate chemical and experimental factors. Biological-model and cargo strata differed substantially in sample size, number of source publications, chemical diversity, and experimental protocols. Although exact ionizable-lipid connectivity was retained across training and testing for a subset of observations, this subset was dominated by a small number of molecular identities and did not ensure matching of complete formulation, preparation conditions, dose, or assay. The results therefore cannot support causal attribution of predictive deterioration to individual components of domain shift. Larger, systematically matched experimental datasets will be needed to establish the relative contributions of chemical novelty, biological context, cargo, and assay variation.
5. Conclusions
Public LNP datasets provide valuable opportunities for predictive formulation research, but dataset size alone does not ensure independent experimental information. Our cross-database audit identified limited agreement at the complete-formulation level and strong signatures of source publication identity in both molecular chemistry and experimental contexts. Using reproducible LightGBM and Ridge baseline models, we observed a pronounced dependence of predictive performance on validation design. LightGBM achieved moderate performance under random-row and connectivity-held-out validation, whereas structural-similarity separation substantially reduced predictive accuracy. Study-held-out and temporal validation revealed limited zero-shot generalization to unseen experimental domains. These findings demonstrate that predictive performance estimated within familiar chemical and experimental libraries may not reliably represent performance in independent publications. However, the present analyses do not establish architecture-independent limits on LNP prediction, and more specialized pretrained, graph-based, multitask, or domain-adapted models may behave differently. Future LNP modeling studies should therefore combine rigorous formulation harmonization and source provenance with structure-aware, publication-grouped, temporal, and, where feasible, prospective experimental validation. Such evaluation is essential for distinguishing successful interpolation within familiar formulation libraries from reliable generalization to new experimental domains. For formulation scientists, these findings provide practical guidance for verifying formulation equivalence across data sources, critically interpreting machine learning predictions, and prioritizing experimental confirmation when candidate formulations extend beyond the chemical or biological domains represented in training data.
Supplementary Materials
The following supporting information can be downloaded at: https://www.mdpi.com/article/10.3390/pharmaceutics18111408/s1, Figure S1: Within-study target permutation control; Figure S2: Fold-level stability of the combined LightGBM model; Figure S3: Sensitivity of regression performance to structural-similarity separation; Figure S4: Sensitivity of retrospective classification performance to structural-similarity separation; Figure S5: ROC-AUC under alternative binary endpoint definitions; Figure S6: Precision–recall AUC under alternative binary endpoint definitions; Figure S7: Study-specific fixed-endpoint classification performance under true leave-one-study-out validation; Table S1: Sensitivity of continuous structural transportability and retrospective classification performance to the molecular-similarity threshold; Table S2: Structural-cluster composition and size diagnostics; Table S3: Bemis–Murcko scaffold-held-out validation in the cyclic-molecule subset; Table S4: Binary classification performance under alternative endpoint definitions; Table S5: Pooled performance and study cluster bootstrap confidence intervals under true leave-one-study-out validation; Table S6: Distribution of study-specific performance under true leave-one-study-out validation; Table S7: Study-level ranking-performance gap and negative-control and study-aware model sensitivity analyses; Table S8: Post hoc stratified performance under publication-held-out validation and exact ionizable-lipid connectivity overlap; Supplementary File S1: Reproducibility package containing analysis scripts, derived canonical data tables, validation and study assignments, record-level predictions, quality control outputs, method specifications, and machine-readable manifests supporting the analyses reported in this article.
Author Contributions
Conceptualization, R.I.I., C.G.B., F.N., and D.P.T.I.; methodology, C.G.B., F.N., V.N., and M.A.; software, C.G.B. and F.N.; validation, R.I.I., D.M., V.N., and D.B.-M.; formal analysis, C.G.B., F.N., and M.A.; investigation, R.I.I., D.M., D.B.-M., and D.P.T.I.; resources, R.I.I., V.N., D.B.-M., and D.P.T.I.; data curation, C.G.B., D.M., F.N., and D.B.-M.; writing—original draft preparation, R.I.I., C.G.B., and D.M.; writing—review and editing, C.G.B., F.N., V.N., M.A., D.B.-M., and D.P.T.I.; visualization, C.G.B., F.N., and M.A.; supervision, V.N., M.A., and D.P.T.I.; project administration, R.I.I., D.M., and D.P.T.I.; funding acquisition, R.I.I., V.N., and D.P.T.I. All authors have read and agreed to the published version of the manuscript.
Funding
This research received no external funding.
Institutional Review Board Statement
Not applicable. This study was a secondary computational analysis of publicly available LNP databases and did not involve the recruitment of human participants or experimental procedures involving animals.
Informed Consent Statement
Not applicable.
Data Availability Statement
The source datasets analyzed in this study are publicly available from LNPDB and LNP Atlas, as described and cited in References [9,10]. The original source datasets were retained unchanged. Derived canonical data tables, validation assignments, record-level predictions, quality-control outputs, and the analysis code required to reproduce the reported results are provided in Supplementary File S1. Additional intermediate files are available from the corresponding author upon reasonable request.
Conflicts of Interest
The authors declare no conflicts of interest.
References
- Xu, Y.; Ma, S.; Cui, H.; Chen, J.; Xu, S.; Gong, F.; Golubovic, A.; Zhou, M.; Wang, K.C.; Varley, A.; et al. AGILE platform: A deep learning powered approach to accelerate LNP development for mRNA delivery. Nat. Commun. 2024, 15, 6305. [Google Scholar] [CrossRef] [Scilit]
- Li, B.; Raji, I.O.; Gordon, A.G.R.; Sun, L.; Raimondo, T.M.; Oladimeji, F.A.; Jiang, A.Y.; Varley, A.; Langer, R.S.; Anderson, D.G. Accelerating ionizable lipid discovery for mRNA delivery using machine learning and combinatorial chemistry. Nat. Mater. 2024, 23, 1002–1008. [Google Scholar] [CrossRef] [Scilit]
- Witten, J.; Raji, I.; Manan, R.S.; Beyer, E.; Bartlett, S.; Tang, Y.; Ebadi, M.; Lei, J.; Nguyen, D.; Oladimeji, F.; et al. Artificial intelligence-guided design of lipid nanoparticles for pulmonary gene therapy. Nat. Biotechnol. 2025, 43, 1790–1799. [Google Scholar] [CrossRef] [Scilit]
- Chan, A.; Kirtane, A.R.; Qu, Q.R.; Huang, X.; Woo, J.; Subramanian, D.A.; Dey, R.; Semalty, R.; Bernstock, J.D.; Ahmed, T.; et al. Designing lipid nanoparticles using a transformer-based neural network. Nat. Nanotechnol. 2025, 20, 1491–1501. [Google Scholar] [CrossRef] [Scilit]
- Wang, W.; Chen, K.; Jiang, T.; Wu, Y.; Wu, Z.; Ying, H.; Yu, H.; Lu, J.; Lin, J.; Ouyang, D. Artificial intelligence-driven rational design of ionizable lipids for mRNA delivery. Nat. Commun. 2024, 15, 10804. [Google Scholar] [CrossRef] [Scilit]
- Moayedpour, S.; Broadbent, J.; Riahi, S.; Bailey, M.; Thu, H.V.; Dobchev, D.; Balsubramani, A.; Santos, R.N.; Kogler-Anele, L.; Corrochano-Navarro, A.; et al. Representations of lipid nanoparticles using large language models for transfection efficiency prediction. Bioinformatics 2024, 40, btae342. [Google Scholar] [CrossRef] [Scilit]
- Wu, K.; Yang, X.; Wang, Z.; Li, N.; Zhang, J.; Liu, L. Data-balanced transformer for accelerated ionizable lipid nanoparticles screening in mRNA delivery. Brief. Bioinform. 2024, 25, bbae186. [Google Scholar] [CrossRef] [Scilit]
- Kumar, G.; Ardekani, A.M. Machine-Learning Framework to Predict the Performance of Lipid Nanoparticles for Nucleic Acid Delivery. ACS Appl. Bio Mater. 2025, 8, 3717–3727. [Google Scholar] [CrossRef] [Scilit]
- Collins, E.; Ji, J.; Kim, S.G.; Witten, J.; Kim, S.; Zhu, R.; Park, P.; Jung, M.; Park, A.; Manan, R.S.; et al. Lipid Nanoparticle Database towards structure-function modeling and data-driven design for nucleic acid delivery. Nat. Commun. 2026, 17, 2464. [Google Scholar] [CrossRef] [Scilit]
- Song, S.; Baek, J.; Seo, S. A Comprehensive Dataset of Lipid Nanoparticle Compositions and Properties for Nucleic Acid Delivery. Sci. Data 2026, 13, 139. [Google Scholar] [CrossRef] [Scilit]
- Mehradfar, A.; Sepehri, M.S.; Hernandez-Lobato, J.M.; Kwon, G.S.; Soltanolkotabi, M.; Avestimehr, S.; Rasoulianboroujeni, M. A machine learning benchmarking framework for lipid nanoparticle transfection efficiency prediction. Commun. AI Comput. 2026, 1, 2. [Google Scholar] [CrossRef] [Scilit]
- Landrum, G. RDKit: Open-Source Cheminformatics Software. Available online: https://www.rdkit.org/ (accessed on 5 August 2026).
- Rogers, D.; Hahn, M. Extended-Connectivity Fingerprints. J. Chem. Inf. Model. 2010, 50, 742–754. [Google Scholar] [CrossRef] [Scilit]
- Ke, G.; Meng, Q.; Finley, T.; Wang, T.; Chen, W.; Ma, W.; Ye, Q.; Liu, T.-Y. LightGBM: A Highly Efficient Gradient Boosting Decision Tree. Adv. Neural Inf. Process. Syst. 2017, 30, 3146–3154. [Google Scholar]
- Bemis, G.W.; Murcko, M.A. The Properties of Known Drugs. 1. Molecular Frameworks. J. Med. Chem. 1996, 39, 2887–2893. [Google Scholar] [CrossRef] [Scilit]
- Wallach, I.; Heifets, A. Most Ligand-Based Classification Benchmarks Reward Memorization Rather than Generalization. J. Chem. Inf. Model. 2018, 58, 916–932. [Google Scholar] [CrossRef] [Scilit]
- Liu, R.; Wang, H.; Glover, K.P.; Feasel, M.G.; Wallqvist, A. Dissecting Machine-Learning Prediction of Molecular Activity: Is an Applicability Domain Needed for Quantitative Structure-Activity Relationship Models Based on Deep Neural Networks? J. Chem. Inf. Model. 2019, 59, 117–126. [Google Scholar] [CrossRef] [Scilit]
- Guo, Q.; Hernandez-Hernandez, S.; Ballester, P.J. UMAP-Based Clustering Split for Rigorous Evaluation of AI Models for Virtual Screening on Cancer Cell Lines. J. Cheminform. 2025, 17, 94. [Google Scholar] [CrossRef] [Scilit]
- Alshehade, S.A.; Al Jabal, G.; Jebril, I.H. Systematic Multi-Target QSAR Benchmarking: Machine Learning Algorithms, Molecular Descriptors, and Validation. J. Chem. Inf. Model. 2026, 66, 8923–8941. [Google Scholar] [CrossRef] [Scilit]
- Sheridan, R.P. Time-Split Cross-Validation as a Method for Estimating the Goodness of Prospective Prediction. J. Chem. Inf. Model. 2013, 53, 783–790. [Google Scholar] [CrossRef] [Scilit]
- Yang, K.; Swanson, K.; Jin, W.; Coley, C.; Eiden, P.; Gao, H.; Guzman-Perez, A.; Hopper, T.; Kelley, B.; Mathea, M.; et al. Analyzing Learned Molecular Representations for Property Prediction. J. Chem. Inf. Model. 2019, 59, 3370–3388. [Google Scholar] [CrossRef] [Scilit]
- Gonçalves, R.S. Artificial Intelligence in Nanopharmaceutical Development: From Predictive Design to Clinical Translation. Pharmaceutics 2026, 18, 764. [Google Scholar] [CrossRef] [Scilit]
- Alsaqabi, A.A.; Almoutairi, A.A.; Alnehari, F.; Alanazi, A.N.; Aldugiem, R.; Alsaeed, Y.; Alotaibi, S. Artificial Intelligence-Driven Nanomedicine: From Drug Formulation and Nanocarrier Design to Clinical Translation. Pharmaceutics 2026, 18, 845. [Google Scholar] [CrossRef] [Scilit]
- Wu, W.; Zhang, J.; Huang, Z. A source-aware chemometric benchmark reveals transportability gaps in heterogeneous lipid nanoparticle data. Comput. Biol. Chem. 2026, 126, 109360. [Google Scholar] [CrossRef] [Scilit]
- Deng, J.; Yang, Z.; Wang, H.; Ojima, I.; Samaras, D.; Wang, F. A Systematic Study of Key Elements Underlying Molecular Property Prediction. Nat. Commun. 2023, 14, 6395. [Google Scholar] [CrossRef] [Scilit]
- Ji, Y.; Zhang, L.; Wu, J.; Wu, B.; Li, L.; Huang, L.-K.; Xu, T.; Rong, Y.; Ren, J.; Xue, D.; et al. DrugOOD: Out-of-Distribution Dataset Curator and Benchmark for AI-Aided Drug Discovery—A Focus on Affinity Prediction Problems with Noise Annotations. Proc. AAAI Conf. Artif. Intell. 2023, 37, 8023–8031. [Google Scholar] [CrossRef] [Scilit]
- Joeres, R.; Blumenthal, D.B.; Kalinina, O.V. Data Splitting to Avoid Information Leakage with DataSAIL. Nat. Commun. 2025, 16, 3337. [Google Scholar] [CrossRef] [Scilit]
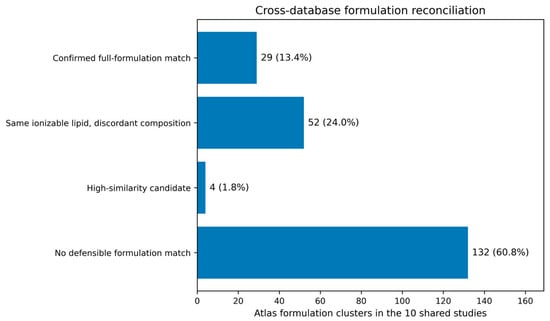
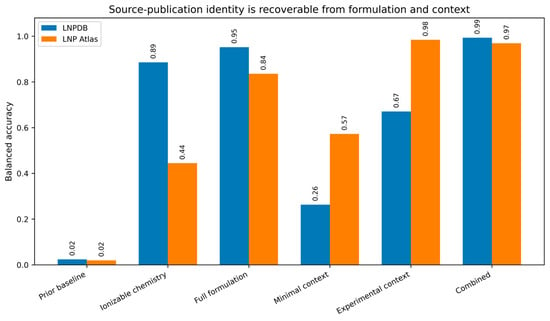
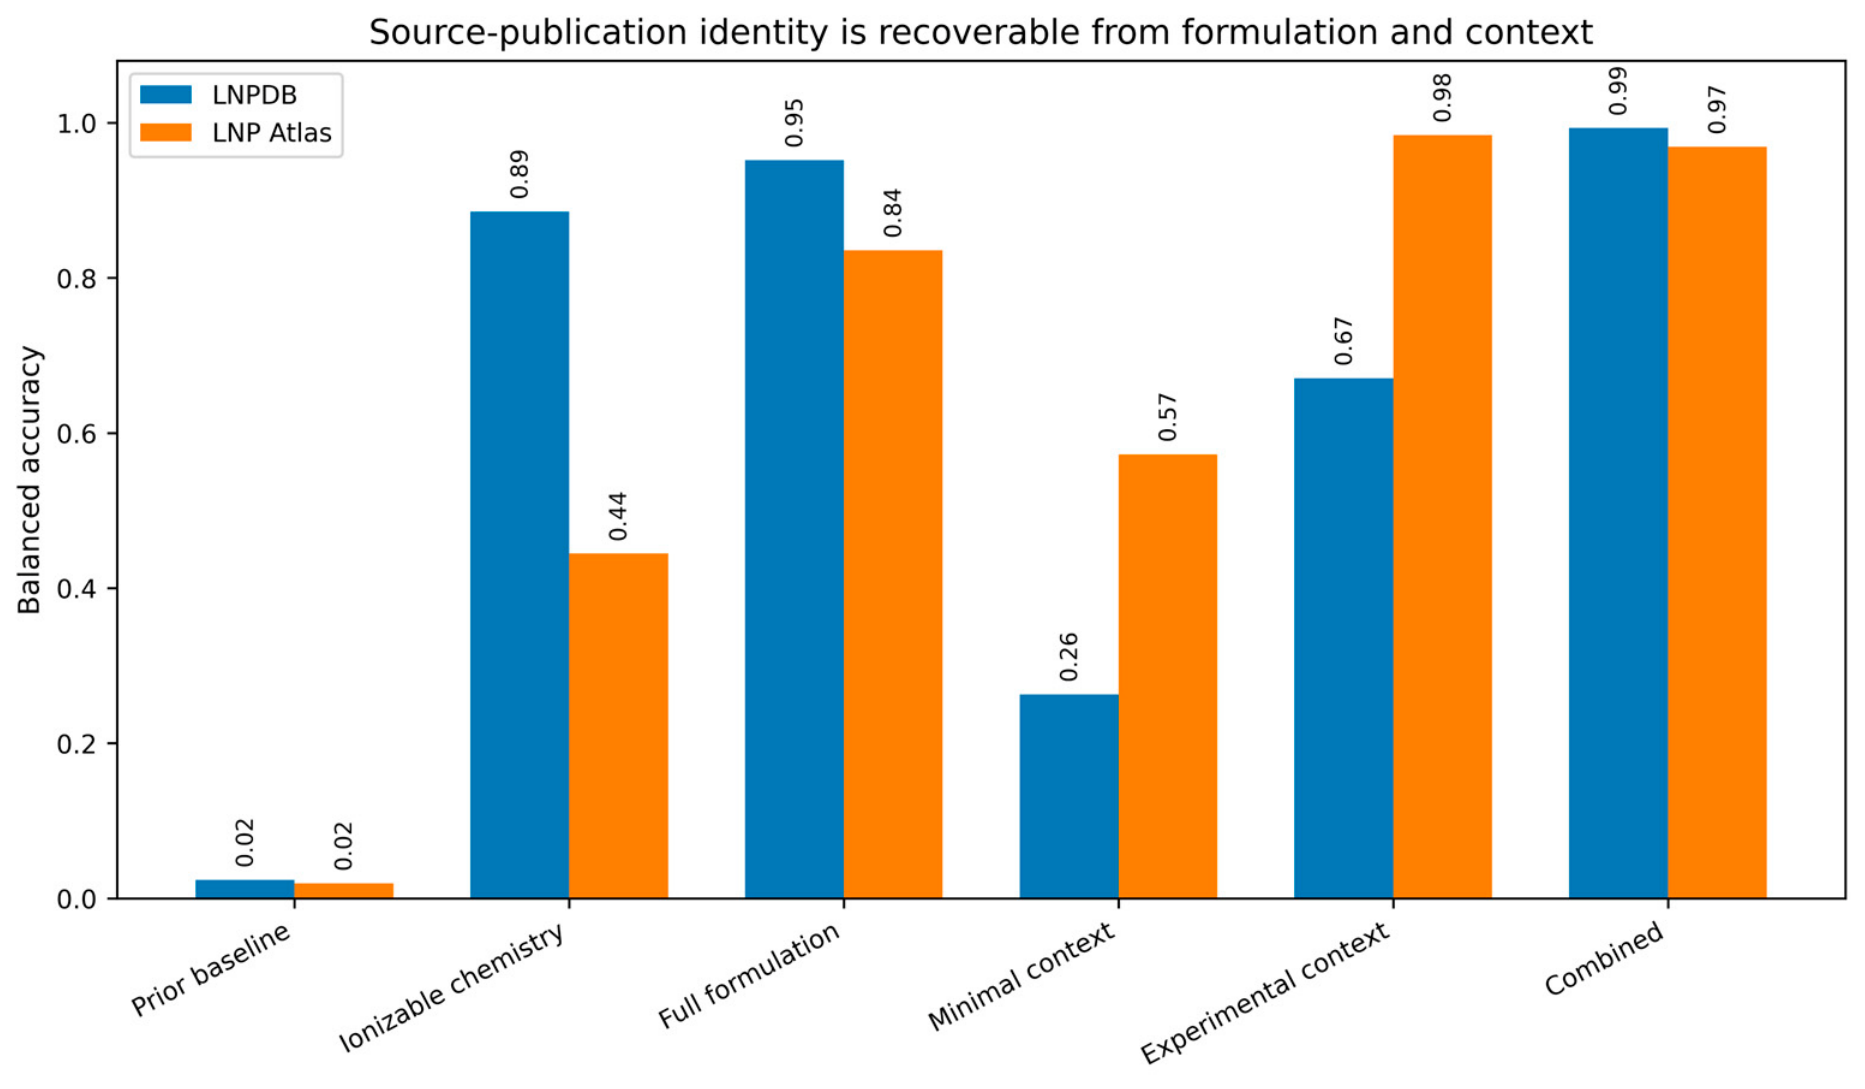
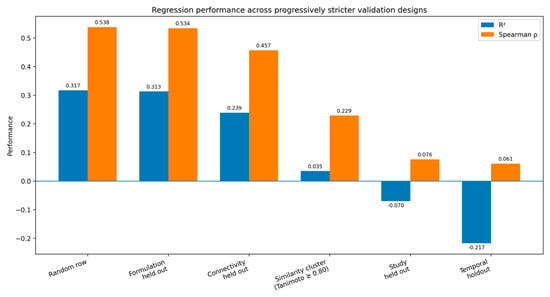
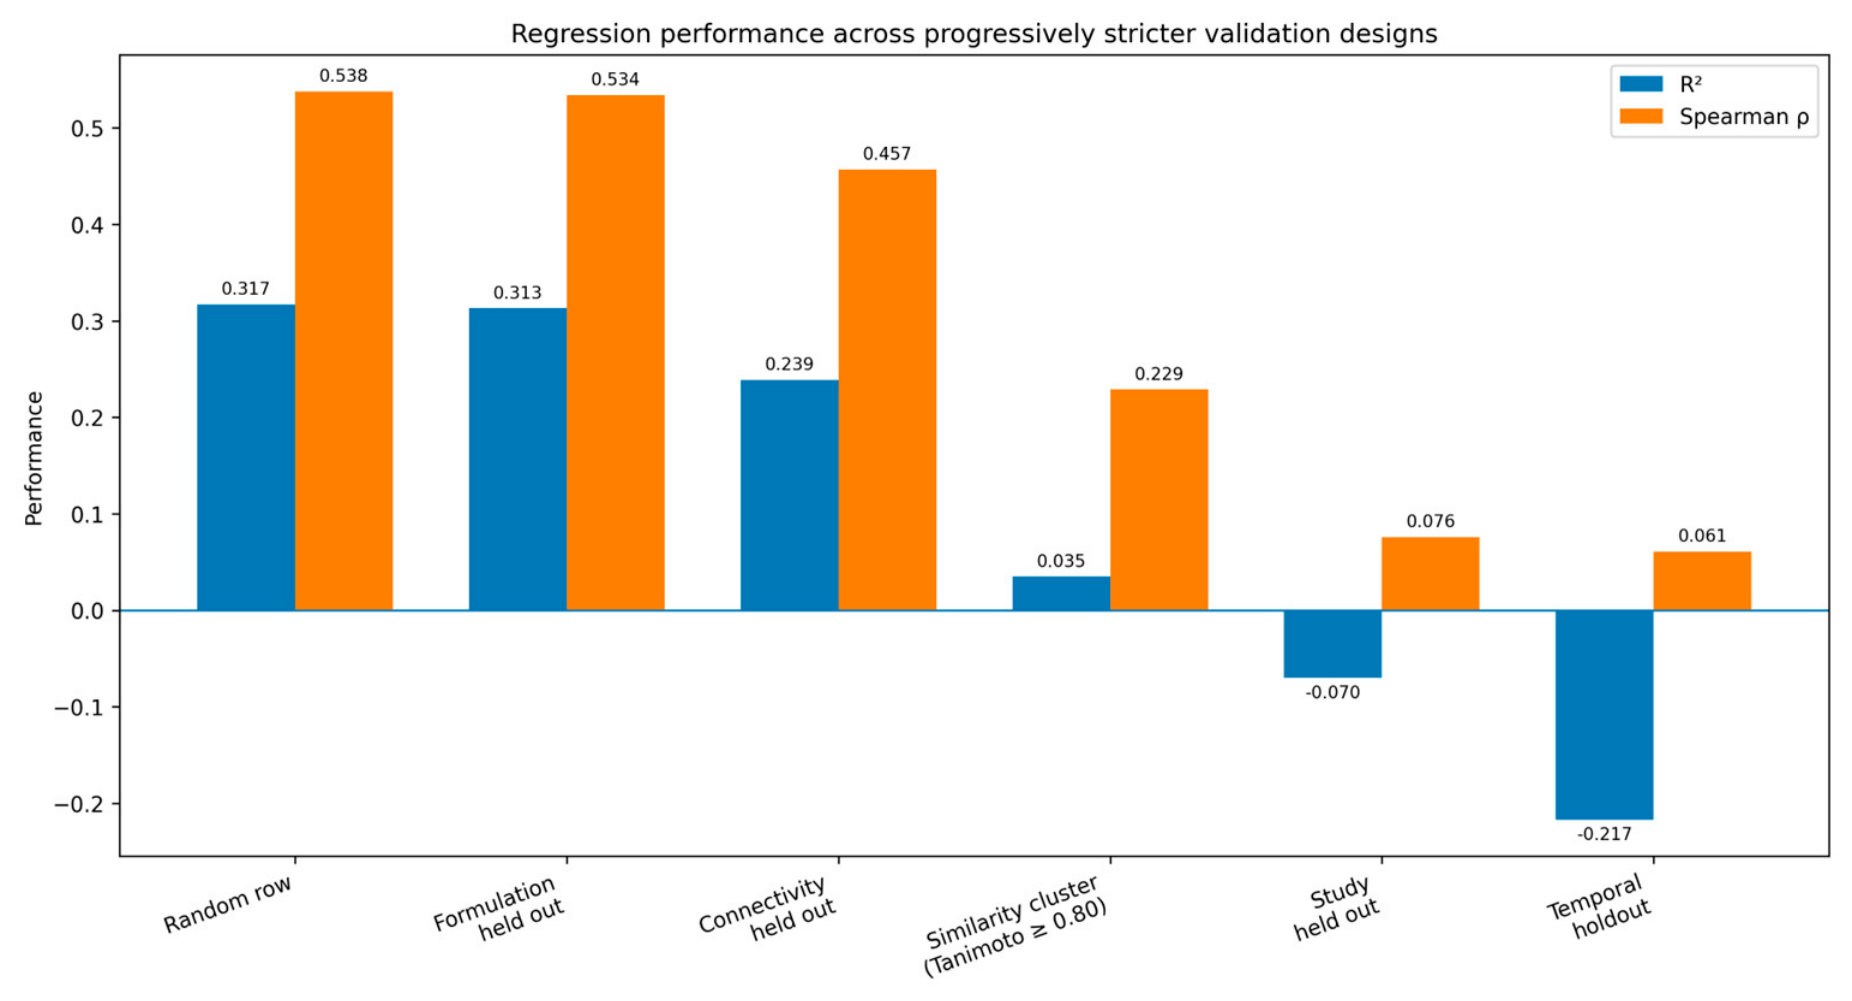
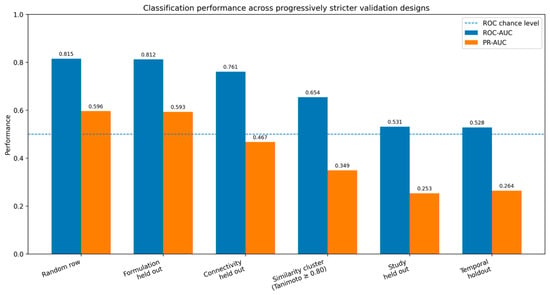
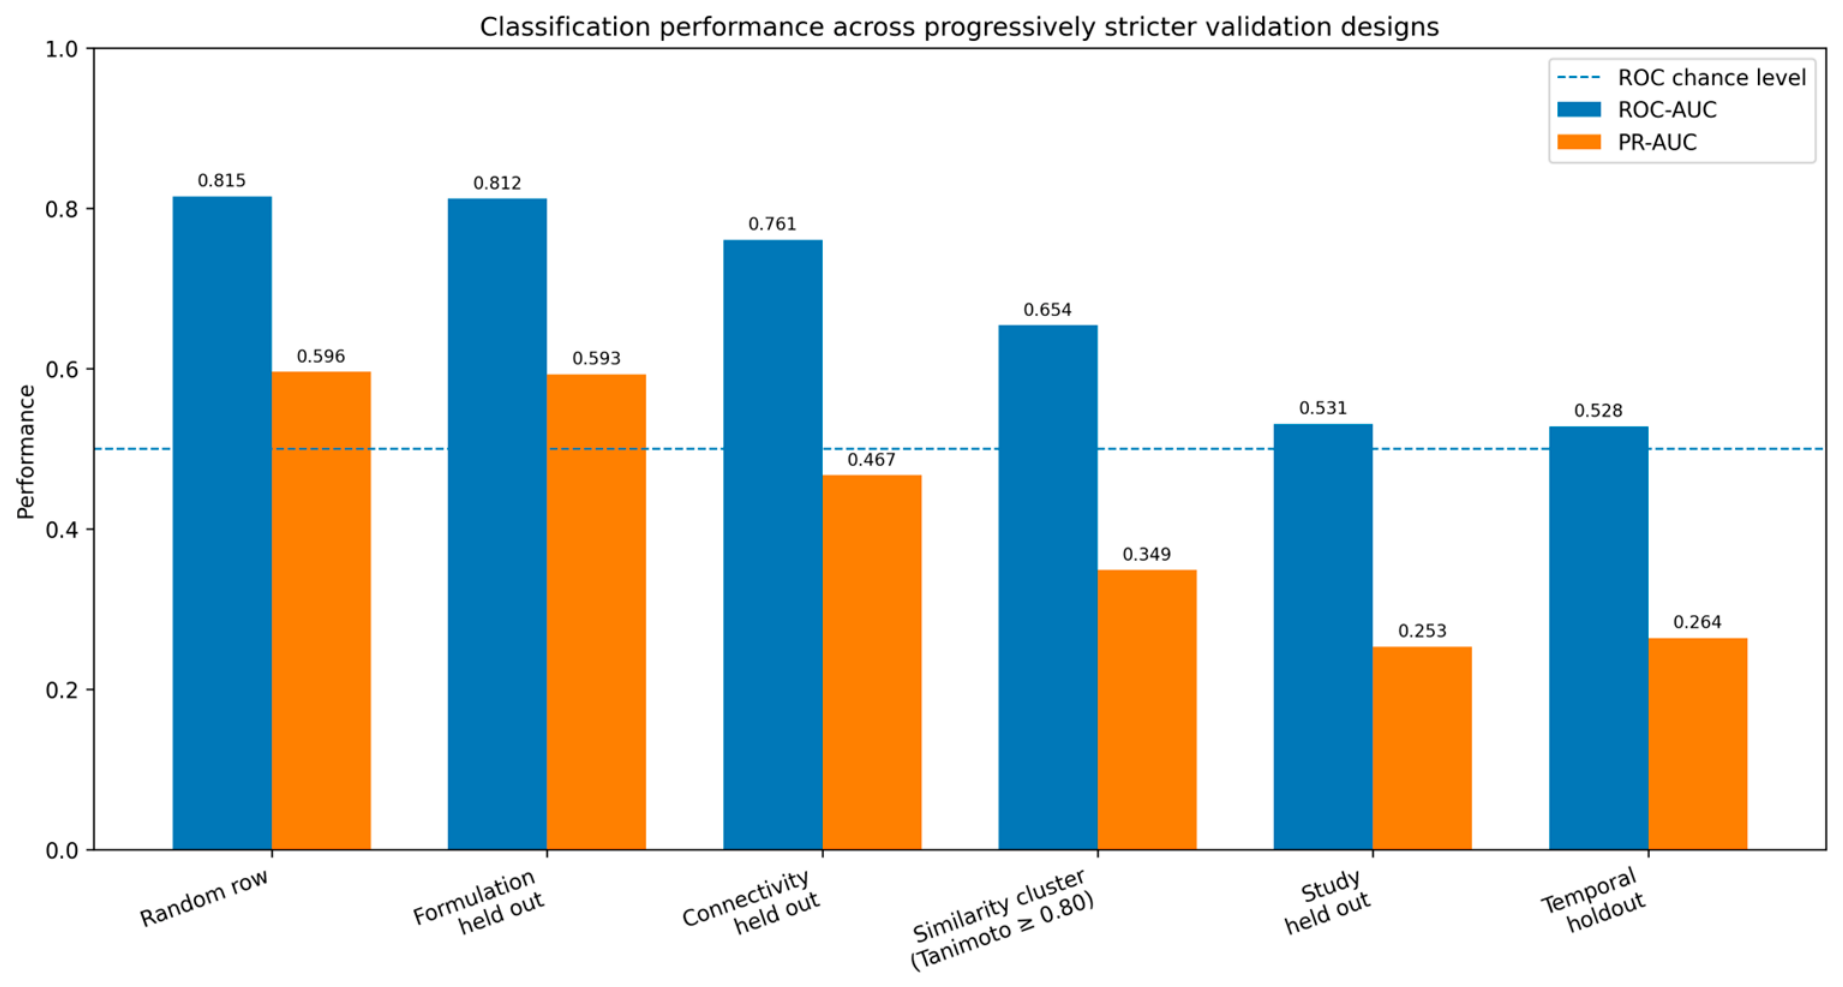
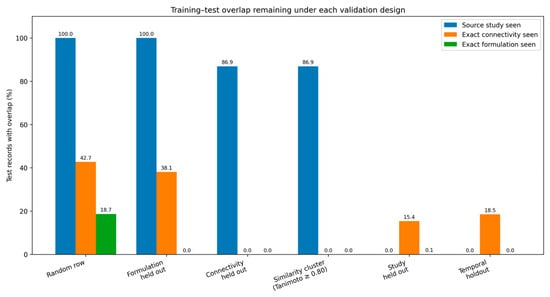
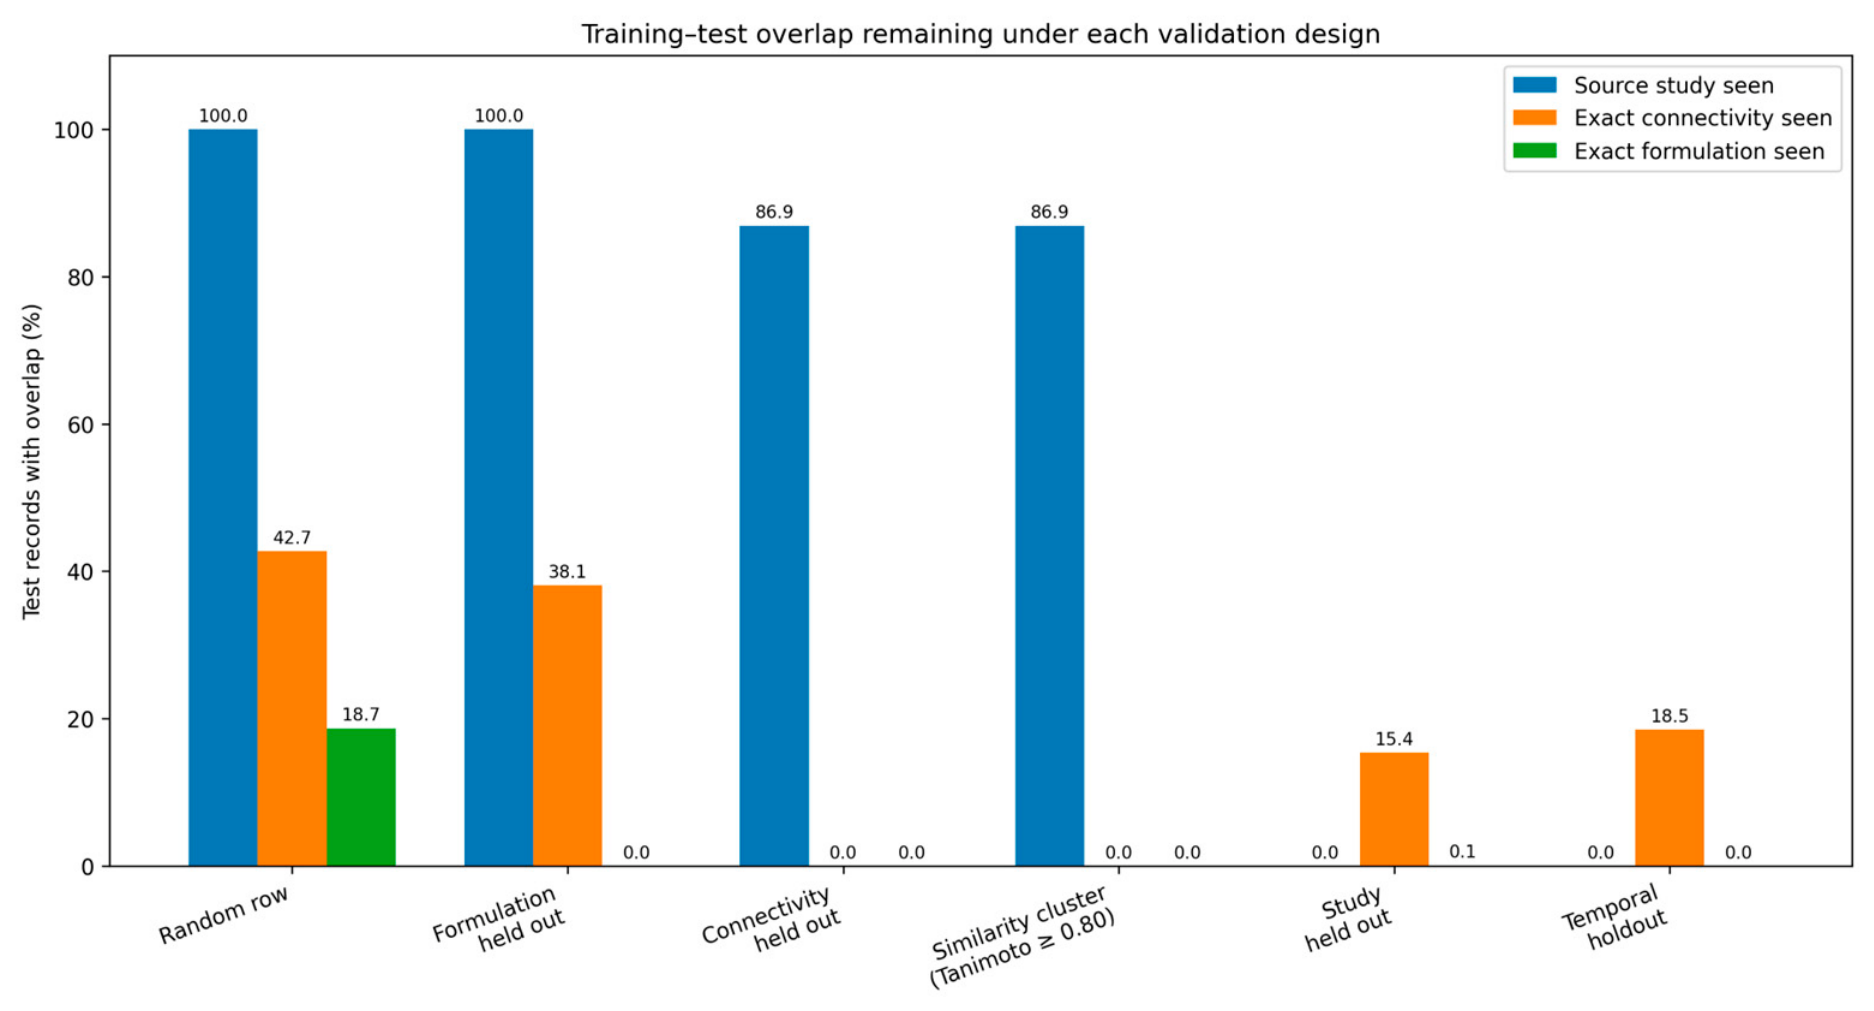
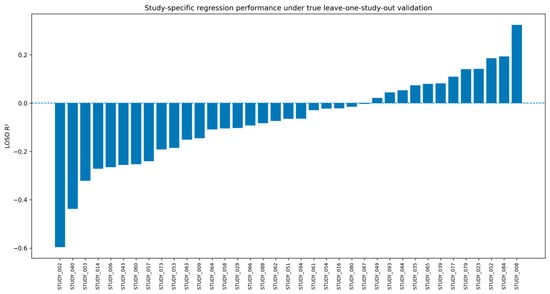
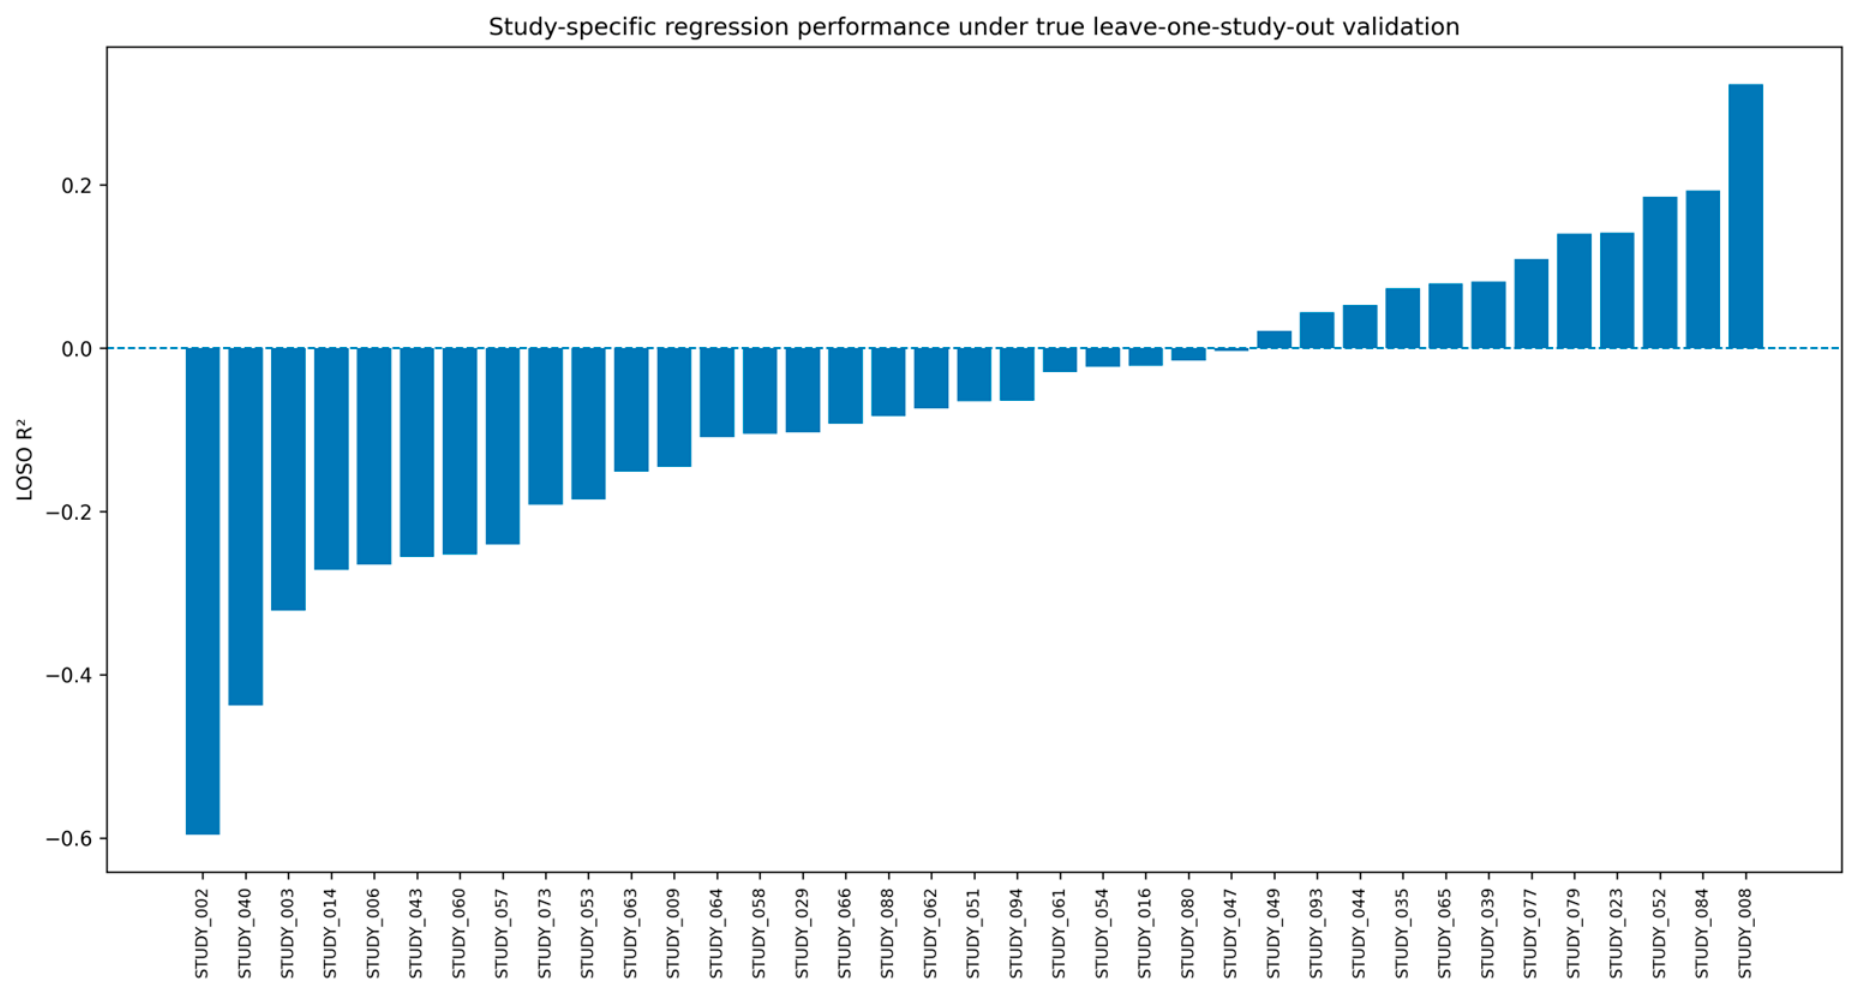

Disclaimer/Publisher’s Note: The statements, opinions and data contained in all publications are solely those of the individual author(s) and contributor(s) and not of MDPI and/or the editor(s). MDPI and/or the editor(s) disclaim responsibility for any injury to people or property resulting from any ideas, methods, instructions or products referred to in the content. |
© 2026 by the authors. Licensee MDPI, Basel, Switzerland. This article is an open access article distributed under the terms and conditions of the Creative Commons Attribution (CC BY) license.