


Abstract
Brain-derived neurotrophic factor (BDNF) has been linked to hepatitis C virus (HCV) infection and to liver function. This study evaluated associations between serum BDNF and hepatic steatosis, fibrosis, cirrhosis, viral genotype, and viral clearance after direct-acting antiviral (DAA) therapy. Serum BDNF was measured in 92 patients with chronic HCV infection and 30 healthy controls. In 58 patients, samples were obtained before therapy, at weeks 4 and 12, and at sustained virologic response 12 (SVR12); 81 patients had SVR12 samples. Before therapy, serum BDNF was lower in patients than in controls (median 4.9 vs. 7.3 ng/mL; p < 0.001) and was lowest in the 36 patients with ultrasound-diagnosed cirrhosis (median 3.4 ng/mL; p < 0.001 vs. non-cirrhotic patients). In non-cirrhotic patients, BDNF was modestly reduced (median BDNF: 6.0 ng/mL) compared with controls (p = 0.027) and was not associated with steatosis, fibrosis stage, or genotype. In cirrhosis, BDNF correlated positively with albumin and platelet count. At SVR12, BDNF levels were modestly higher in non-cirrhotic patients than at pretreatment and were no longer different from those in controls, whereas they remained low in patients with cirrhosis. In the entire cohort, platelet count significantly predicted serum BDNF levels. The lack of difference between cirrhosis and non-cirrhotic patients after adjustment for platelet count and log10 transformation to normalize BDNF distribution suggests that the altered BDNF levels observed in patients with cirrhosis may be partly attributable to changes in platelet count rather than reflecting a disease-specific alteration in hepatic BDNF synthesis.
1. Introduction
Chronic hepatitis C virus (HCV) infection is associated with central nervous system impairment that occurs independently of hepatic dysfunction [1]. Brain-derived neurotrophic factor (BDNF) is a neurotrophin with a key role in the central nervous system and has been implicated in neurocognitive disorders [2].
BDNF is also expressed in peripheral tissues, including skeletal muscle and the liver [2,3]. Hepatic stellate cells, the key drivers of hepatic inflammation and fibrosis [4], express both BDNF and its receptor, tropomyosin receptor kinase B (TrkB), whereas hepatocytes show only weak BDNF immunoreactivity in human and rat liver [5]. BDNF also regulates hepatic inflammation [2]. In models of acute liver injury and liver failure, hepatocyte BDNF expression is reduced [3]. Restoring BDNF ameliorates acute hepatitis, partly by antagonizing toll-like receptor 4 signaling in macrophages [3]. After bile duct ligation in rats, cholangiocyte BDNF expression parallels biliary epithelial proliferation and declines markedly when apoptosis exceeds proliferation [6]. Collectively, these findings suggest that reduced BDNF levels during liver inflammation may contribute to disease severity [2,3].
In hepatocytes, BDNF activates catabolic pathways such as fatty acid oxidation, inhibits gluconeogenesis, and promotes glycogen storage [7]. In obese leptin receptor-deficient (db/db) mice, BDNF treatment normalized fasting blood glucose and reduced hepatomegaly and serum liver enzyme activities [8]. These findings suggest that serum BDNF levels might be reduced in patients with metabolic dysfunction or chronic liver disease.
However, clinical data are inconsistent. Some studies reported increased serum BDNF levels in obesity and type 2 diabetes, with positive correlations with fat mass, fasting glucose, insulin resistance, and triglycerides, whereas others found no difference between normal-weight and obese individuals [9].
Importantly, platelets store BDNF in granules and release it upon activation. Platelets are indeed a major source of peripheral BDNF [10,11]. Serum and plasma BDNF levels differ greatly. During blood clotting, platelets release BDNF, and serum BDNF levels are higher than plasma levels [12]. Previous studies reported strong positive correlations between plasma and serum BDNF levels, but others could not confirm this [13,14,15].
Platelet count declines in patients with liver fibrosis and is used to calculate non-invasive fibrosis scores such as the fibrosis-4 index or the aspartate aminotransferase-to-platelet-ratio index (APRI) [16]. This might indicate that peripheral BDNF levels are also low in advanced fibrosis/cirrhosis, but findings in liver disease are heterogeneous. In a cohort of patients with cirrhosis, approximately 70% of whom had a viral etiology, serum BDNF levels were higher than in healthy controls [17]. Within this cohort, BDNF levels were higher in Child–Pugh class A than in classes B and C, suggesting a decline with disease progression [17]. Other studies reported lower serum BDNF levels in patients with cirrhosis than in controls [18,19,20]. In patients with non-alcoholic fatty liver disease, serum BDNF levels were not strongly correlated with liver stiffness or the fibrosis-4 (FIB-4) score [21].
Researchers have also studied how HCV treatment affects systemic BDNF levels. In patients treated with pegylated interferon-α-2a or -2b plus ribavirin for 24 weeks, serum BDNF levels declined by the end of therapy [22]. In contrast, treatment with direct-acting antivirals (DAAs), which achieve HCV elimination in most patients [23], has been associated with a marked increase in serum BDNF levels at sustained virologic response 12 weeks after treatment (SVR12) [24]. Notably, this increase was confined to patients with neurocognitive impairment, who had lower baseline BDNF levels, and was absent in patients without impairment [24]. These findings suggest that reduced BDNF levels in HCV infection are more closely related to neurocognitive dysfunction than to viral replication itself. Whether serum BDNF levels differ between non-cirrhotic HCV patients and healthy controls remains unclear. Moreover, these previous studies did not consider platelet count as a possible confounder [22,24]. Platelet count increased in patients reaching SVR12 [25,26], and this may also affect peripheral BDNF levels.
Chronic HCV infection is associated with systemic inflammation, hepatic steatosis, and insulin resistance and remains a major cause of liver cirrhosis [27,28]. Although BDNF exerts biological effects in peripheral tissues, including the liver, its relationship with markers of liver disease has not been systematically characterized [2]. Therefore, this study evaluated associations between serum BDNF levels and hepatic steatosis, fibrosis, cirrhosis, viral genotype, and viral clearance in patients with chronic HCV infection.
2. Materials and Methods
2.1. Patients and Controls
This is a retrospective BDNF analysis of prospectively collected serum samples. This study included 92 adults (≥18 years) with chronic HCV infection, recruited at the Department of Internal Medicine I, University Hospital Regensburg, between September 2014 and February 2017. All patients were treatment-naïve and eligible for DAA therapy. Exclusion criteria were decompensated liver cirrhosis and co-infection with hepatitis B virus or human immunodeficiency virus.
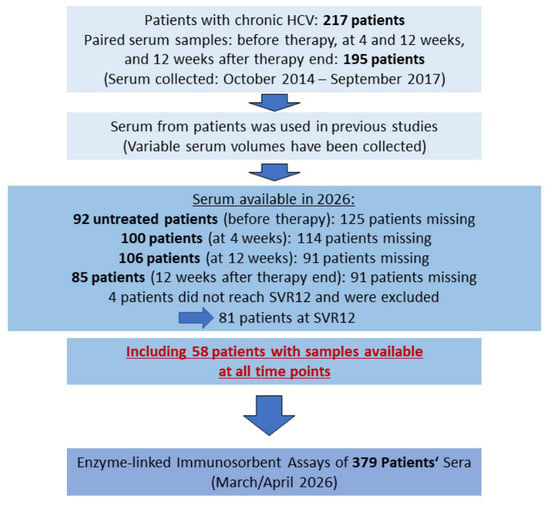
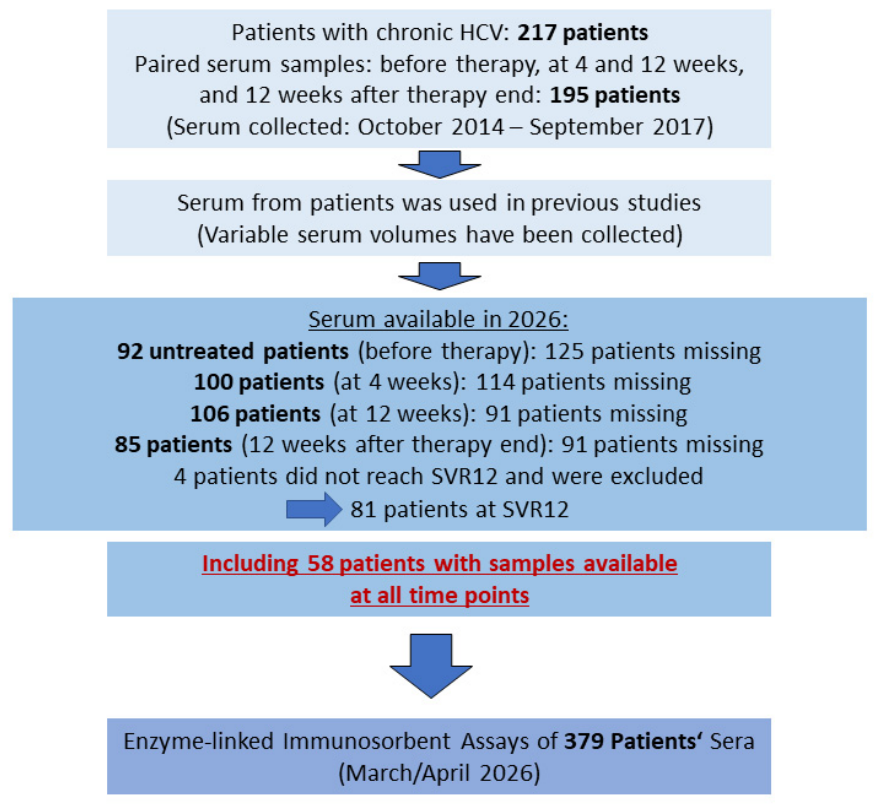
We originally enrolled 217 patients, with samples from 195 patients available at baseline, after 4 and 12 weeks of treatment, and at 12 weeks after the end of therapy (Figure 1). In earlier investigations, randomly selected serum specimens were analyzed for several circulating factors [29,30,31,32,33,34]. The amount of serum collected varied by sampling time point; not all original specimens remained sufficient to assess serum BDNF concentrations. Samples for this study came from 92 treatment-naïve patients at baseline, 100 patients after 4 weeks of therapy, 106 patients at 12 weeks, and 81 patients reaching SVR12 (Figure 1). We obtained samples between September 2014 and February 2017, as with the entire cohort. This subcohort had similar sex (p = 0.551), BMI (p = 0.081), alanine aminotransferase levels (p = 0.152), creatinine (p = 0.403), GFR (p = 0.112), CRP (p = 0.921), procalcitonin (p = 0.794), HDL (p = 0.497), LDL (p = 0.253), and viral load (p = 0.819) as the entire cohort before therapy started. Age (p < 0.001), aspartate aminotransferase (p = 0.003), bilirubin (p = 0.007), INR (p = 0.002), and MELD score (p = 0.004) in the current cohort were higher, and albumin (p < 0.001), platelet number (p < 0.001), and leukocyte number (p = 0.018) were lower. The number of patients with liver cirrhosis (p < 0.001) and diabetes (p = 0.011) was higher, whereas steatosis prevalence did not differ (p = 0.207). In the entire cohort, 97.2% of patients achieved SVR12, and 2.8% (n = 6) relapsed after DAA therapy [35]. In the current cohort, 4 patients were non-responders, and 2 had a relapse. These patients were included in the HCV cohort before therapy but not in the SVR12 cohort (Figure 1). Samples of 58 patients were available at each time point (Figure 1).
Figure 1.
Study cohort.
Patients were treated with different DAA drug combinations. At baseline, there were 22 patients with sofosbuvir/ledipasvir, 12 patients with dasabuvir/ombitasvir/paritaprevir/ritonavir, 3 patients with dasabuvir/ombitasvir/paritaprevir/ritonavir/ribavirin, 6 patients with sofosbuvir/ribavirin, 6 patients with sofobuvir/ledipasvir/ribavirin, 35 patients with sofosbuvir/daclatasvir, 3 patients with sofosbuvir/daclatasvir/ribavirin, and 5 patients with sofosbuvir/velpatasavir. Serum BDNF levels before therapy initiation were comparable between these patients (p = 0.592).
The control group comprised 30 healthy individuals (19 women, 11 men) with a median age of 56 years (range, 21–67). Age and sex distribution did not differ significantly from those of the HCV cohort (p > 0.05 for both). The control group self-reported that they were not taking any medications, had a normal body mass index, and did not have diabetes, liver disease, or any other serious illnesses.
2.2. Diagnosis of Steatosis, Fibrosis, and Cirrhosis
We used the FIB-4 score as a validated, non-invasive marker of liver fibrosis. Scores > 3.25 indicated advanced fibrosis, whereas scores < 1.30 (patients < 65 years) or < 2.0 (patients ≥ 65 years) excluded advanced fibrosis; intermediate values were classified as indeterminate [36,37]. A FIB-4 cut-off of 1.45 demonstrated a negative predictive value of 90% for excluding advanced fibrosis, defined as an Ishak fibrosis score of 4–6, encompassing early bridging fibrosis through cirrhosis. Conversely, a FIB-4 score above 3.25 showed a specificity of 97% and a positive predictive value of 65% for identifying advanced fibrosis [37]. Because biological age acts as a direct multiplier in the formula, the calculated score automatically increases over a person’s life. For individuals under the age of 65, the low-risk threshold is <1.3. To avoid age-related false alarms, the threshold is set to 2.0 for patients aged 65 years and over [36].
Liver stiffness was measured by two-dimensional shear-wave elastography (SWE) using a LOGIQ E9 system (GE Healthcare, Chicago, IL, USA; 1–6 MHz probe) or an Acuson S2000 (1–5 MHz probe) or S3000 (1–6 MHz probe) system (Siemens Healthineers, Erlangen, Germany). We obtained eight to twelve valid measurements per patient and used the median for analysis. Since diagnostic thresholds for SWE can differ among manufacturers and ultrasound platforms, we adopted the pooled cut-off values published by Colombo et al. [38]: <1.4 m/s was scored as F0, ≥1.4 and < 1.8 as F1, ≥1.8 and <2.0 as F2, ≥2.0 and <2.6 as F3, and >2.6 m/s as F4. These thresholds were available at the time of enrollment and aligned with the manufacturer’s recommendations. Subsequent research has sought to establish more standardized thresholds applicable across different ultrasound systems and SWE technologies [39].
Accurately differentiating cirrhosis from advanced hepatic fibrosis remains a diagnostic challenge. This overlap is reflected in the term “advanced chronic liver disease” introduced in the Baveno VI consensus to encompass the continuum between severe fibrosis and established cirrhosis [40]. Among the available non-invasive assessment tools, the FIB-4 score is particularly useful for excluding cirrhosis, with a reported negative predictive value of 96%; however, its positive predictive value is considerably lower, at 63% [41]. Liver stiffness assessment using ultrasound-based elastography represents another important component of non-invasive evaluation. Most pooled analyses have focused on vibration-controlled transient elastography (VCTE), for which liver stiffness values exceeding 15 kPa have been associated with high specificity (95%) for cirrhosis [42].
In the present study, we assessed liver stiffness using SWE rather than VCTE. Given the limitations of individual non-invasive tests, cirrhosis diagnosis should be based on an integrated assessment that incorporates imaging findings, biochemical parameters, underlying disease etiology, and non-invasive fibrosis measurements. Although imaging-detected morphological abnormalities generally have high specificity, their sensitivity for identifying cirrhosis remains limited, as with other diagnostic criteria [43]. Cirrhosis was diagnosed based on a combination of ultrasonographic findings and laboratory data documented in the patients’ medical records [43]. Because liver biopsy is invasive and non-invasive diagnostic approaches are available, biopsy was reserved for cases in which the diagnosis remained uncertain. Therefore, liver biopsy was not routinely performed in all patients for ethical reasons.
None of the patients with F4 fibrosis classified as non-cirrhotic had clinical signs of cirrhosis. Therefore, we were certain that these patients did not suffer from cirrhosis but were overestimated in SWE. However, no liver biopsy was performed; therefore, we cannot rule out that our estimation was incorrect. Even if a few patients had cirrhosis, this would not affect our study’s findings.
Hepatic steatosis was diagnosed by ultrasonography when liver echogenicity exceeded that of the right renal cortex. Steatosis was not graded because quantitative methods were not available in our department at the time of the study.
2.3. Measurement of Serum BDNF
Blood was collected using the S-Monovette® Neutral Z (Sarstedt Ag & Co. KG, Nümbrecht, Germany). Samples were gently inverted several times, stored at 4° C, and transported to the laboratory within 4 h; they were centrifuged at 2000× g for 10 min at room temperature, aliquoted, and frozen at −80 °C until measurement. Storage time ranged from 9 years and 2 months to 11 years and 6 months. Serum samples were thawed immediately before analysis. We used serum samples with one to three freeze/thaw cycles, and two freeze/thaw cycles did not considerably affect serum BDNF levels [12]. BDNF was stable in serum up to 6 months [12], but the effect of longer storage time has not been tested. However, the median BDNF levels of 30 samples collected in 2014 and 30 samples collected in 2017 were similar (4.2 (1.8–16.6) ng/mL and 5.2 (2.0–18.3) ng/mL, respectively).
BDNF was retrospectively determined by the human/mouse BDNF DuoSet ELISA kit (Catalog No. DY248; Bio-Techne, Wiesbaden, Germany). We ordered 15 plates, which were sufficient to measure all standards and samples in duplicate, and used the mean of the two replicate measurements for data analysis.
The inter-assay coefficient of variation (CV), determined from 10 samples analyzed across three separate plates, was 12.78%. The intra-assay CV, calculated from 40 samples measured in duplicate, was 3.30%. The BDNF calibration curve consisted of the following concentrations: 6.1, 15.4, 38.4, 96.0, 240.0, 600.0, and 1500 pg/mL. The limit of quantification (LOQ) was defined as the lowest calibrator concentration exhibiting acceptable inter-assay precision (CV below 20%), corresponding to 15.4 pg/mL. One patient serum sample, analyzed at a 1:50 dilution, yielded a BDNF concentration of 14.4 pg/mL, below the established LOQ. Nevertheless, the ELISA concentration was retained for this sample in subsequent analyses. A Supplementary Materials minimal dataset has been added as a supplement.
2.4. HCV Titer and Genotype
HCV viral load was quantified using the Alinitym HCV AMP Kit (Abbott GmbH, Wiesbaden, Germany). The assay exhibited a 95% limit of detection (LoD) of 5.11 IU/mL in serum samples. Its linear quantification range began at 12 IU/mL, with results below this threshold reported as 1. A viral titer below 12 IU/mL was defined as undetectable and is considered below the cut-off below which the analyte has no clinical significance; the substitution reflects clinically meaningful decision thresholds rather than statistical considerations. Correlations of BDNF with viral titer were only assessed before therapy, when patients had levels above this cut-off.
HCV genotyping used the VERSANT® HCV Genotype 2.0 Assay (LiPA) (Siemens Healthcare Diagnostics Inc., Erlangen, Germany), which enables the identification of HCV genotypes 1–6, including subtypes 1a and 1b, in human serum. Both assays were conducted at the Institute of Clinical Microbiology and Hygiene, University Hospital Regensburg.
2.5. Statistical Analysis
Serum BDNF concentrations were not normally distributed at any time point (Shapiro–Wilk test, all p < 0.001). Data are therefore shown as box plots and summarized as median (minimum–maximum). Two independent groups were compared using the Mann–Whitney U test and more than two groups using the Kruskal–Wallis test with Bonferroni correction. Paired data were analyzed using the Friedman test. We assessed correlations using Spearman’s rank correlation coefficient (r) without multiple-comparison correction. Categorical variables were tested with the chi-square test. Multiple linear regression was used to identify determinants of serum BDNF levels. One-way ANOVA with deviation contrasts was used to compare the subcohorts with the entire cohort before the start of the therapy. One-way ANCOVA was used to adjust for confounding factors. Binary logistic regression was used to assess whether serum BDNF predicted cirrhosis.
We used mixed-design repeated-measures ANOVA to evaluate whether changes in BDNF between therapy start and SVR12 differed between cirrhosis and non-cirrhotic patients. Variables were continuous, and observations between participants were independent. We applied a base-10 logarithmic transformation to BDNF levels to reduce the influence of extreme values. Log10-transformed BDNF levels in cirrhosis before therapy (Shapiro–Wilk test: p = 0.017) and in non-cirrhotic patients at SVR12 (p = 0.017) were not normally distributed. The quantile–quantile plots indicated that the residuals were approximately normally distributed. We tested homogeneity of variances with the Levene statistic, which was significant for log10-transformed BDNF before therapy (p = 0.006 based on the median). As group sizes are balanced, a mixed ANOVA is moderately robust to mild-to-moderate violations of variance homogeneity [44]. Sphericity has not been considered for a 2-time-point comparison.
Repeated-measures ANOVA was used to determine partial η2 for the laboratory measures of the patients. Analyses were performed with IBM SPSS Statistics, version 31.0 (IBM Corp., Armonk, NY, USA). Because this study was exploratory, we applied multiple-comparison correction only to the Kruskal–Wallis test. A p-value < 0.05 was considered significant.
3. Results
3.1. Serum BDNF in Controls and Patients with Chronic HCV Infection
Serum BDNF levels did not differ by sex among controls (19 women vs. 11 men; p = 0.268) or among patients with HCV infection (42 women vs. 50 men; p = 0.541); therefore, women and men were analyzed together.
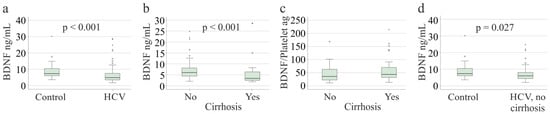
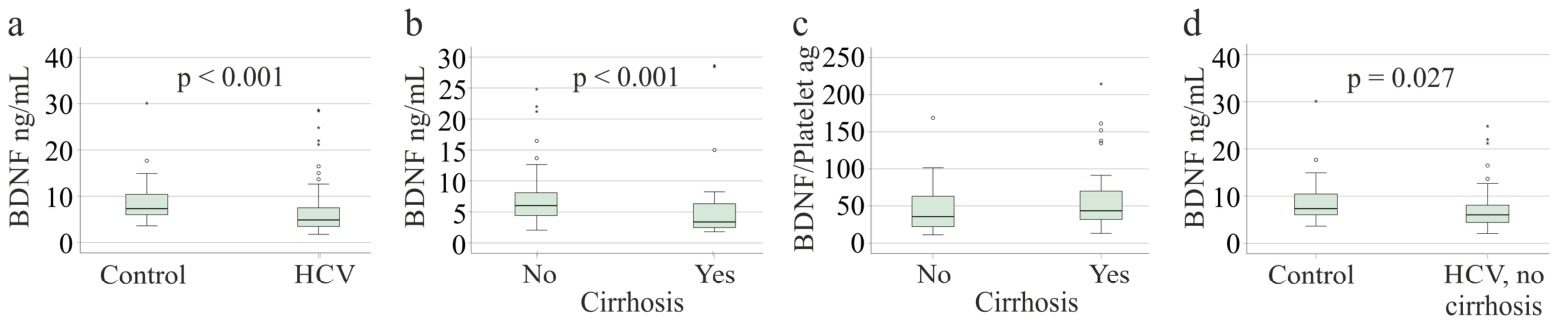
Serum BDNF levels were lower in the 92 patients with chronic HCV infection (4.9 (1.8–28.7) ng/mL; 95% CI: 5.6–7.8) than in the 30 controls (7.3 (3.6–30.1) ng/mL; 95% CI 7.0–10.7; p < 0.001; η2: 0.031; Figure 2a) and lower in the 36 patients with ultrasound-diagnosed cirrhosis (3.4 (1.8–28.7) ng/mL; 95% CI: 3.5–7.7) than in the 56 patients without cirrhosis (6.0 (2.1–24.8) ng/mL; 95% CI: 6.1–8.7; p < 0.001; η2: 0.026; Figure 2b). Platelets are a major source of serum BDNF, and the BDNF/platelet ratio did not change in cirrhosis (p = 0.058) (Figure 2c). It was 36 (11–169) ag (95% CI: 35–50) in non-cirrhosis and 44 (13–215) ag (95% CI: 44–75) in cirrhosis.
Figure 2.
Serum BDNF levels in healthy controls and patients with chronic HCV infection before therapy: (a) controls (n = 30) and all patients with HCV infection (n = 92); (b) patients without (n = 56) and with (n = 36) ultrasound-diagnosed cirrhosis; (c) BDNF/platelet ratio in patients without and with liver cirrhosis; (d) controls and patients without cirrhosis. Boxes show the median and interquartile range (IQR); whiskers extend to the most extreme values within 1.5 × IQR; circles and asterisks denote outliers (1.5–3 × IQR) and extreme values (>3 × IQR), respectively. We calculated p-values using the Mann–Whitney U test and did not correct for multiple comparisons.
Because cirrhosis was associated with lower BDNF levels, associations with diabetes and steatosis were analyzed in patients without cirrhosis. BDNF levels did not differ between patients with and without diabetes (n = 4; p = 0.135) or between patients with and without steatosis (n = 26; p = 0.718). Because only four patients had diabetes, these results require confirmation.
To determine whether the reduction in BDNF in HCV infection was attributable solely to cirrhosis, we excluded patients with cirrhosis. Patients without cirrhosis still had lower serum BDNF levels than controls (p = 0.027; η2: 0.021; Figure 2d). However, this p-value is high, and the finding needs confirmation in larger cohorts. The estimated between-group difference between controls and non-cirrhotic patients was 1.80 (−0.48–4.08, p = 0.180, η2: 0.026).
Patients with cirrhosis were older and had higher Model for End-Stage Liver Disease (MELD) scores, aspartate aminotransferase, bilirubin, and procalcitonin levels, and a higher international normalized ratio (INR) than patients without cirrhosis. Albumin, leukocyte and platelet counts, low-density lipoprotein (LDL), and viral load were lower in patients with cirrhosis (Table 1).
Table 1.
Baseline characteristics of patients with chronic HCV infection without and with cirrhosis.
In multiple linear regression including age, sex, body mass index (BMI), albumin, and platelet count, these variables did not predict log10-transformed serum BDNF levels in patients without cirrhosis (p = 0.574). In patients with cirrhosis, the model was significant (F(5,28) = 3.986, p = 0.007), but none of the individual factors were significant. In the entire cohort, albumin (p = 0.038, regression coefficient B: 0.014; variance inflation factor: 1.421), platelet count (p = 0.004, regression coefficient B: 0.001, variance inflation factor: 1.502), and sex (p = 0.047, regression coefficient B: 0.116, variance inflation factor: 1.111) predicted log10-transformed serum BDNF levels (F(5,73) = 5.549, p < 0.001).
After adjusting for sex, BMI, age, and platelet count, log10-transformed BDNF levels did not differ significantly between cirrhosis and non-cirrhosis, F(1,0.035) = 0.605, p = 0.439, partial η2 = 0.008. After adjusting for platelet count only, there was no significant difference in log10-transformed BDNF levels between cirrhosis and non-cirrhosis, F(1,0.091) = 1.493, p = 0.225, partial η2 = 0.016. Homogeneity of regression slopes was not violated for the dependent variable, as the interaction terms were not statistically significant (p > 0.05).
Binary logistic regression analysis identified platelet count, sex, and age as significant predictors of cirrhosis, whereas BDNF was not significantly associated with cirrhosis (effect estimate = 1.036, 95% CI: 0.930–1.154, p = 0.525). The overall model was statistically significant (p = 0.039; effect estimate = 0.643). Similar results were obtained when BDNF levels were log10-transformed: the overall model remained significant (p = 0.039; effect estimate = 0.643), while log10-transformed BDNF was not a significant predictor (effect estimate = 0.306, 95% CI: 0.031–3.064, p = 0.314).
Platelet count was the only significant predictor in both models. When untransformed BDNF was included, the effect estimate for platelet count was 0.981 (95% CI: 0.972–0.991, p < 0.001). Similarly, when log10-transformed BDNF was included, the effect estimate was 0.984 (95% CI: 0.976–0.993, p < 0.001).
3.2. Serum BDNF and Non-Invasive Assessment of Fibrosis
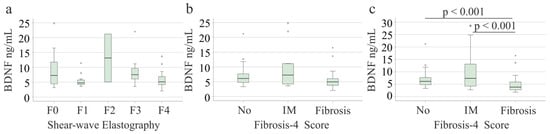
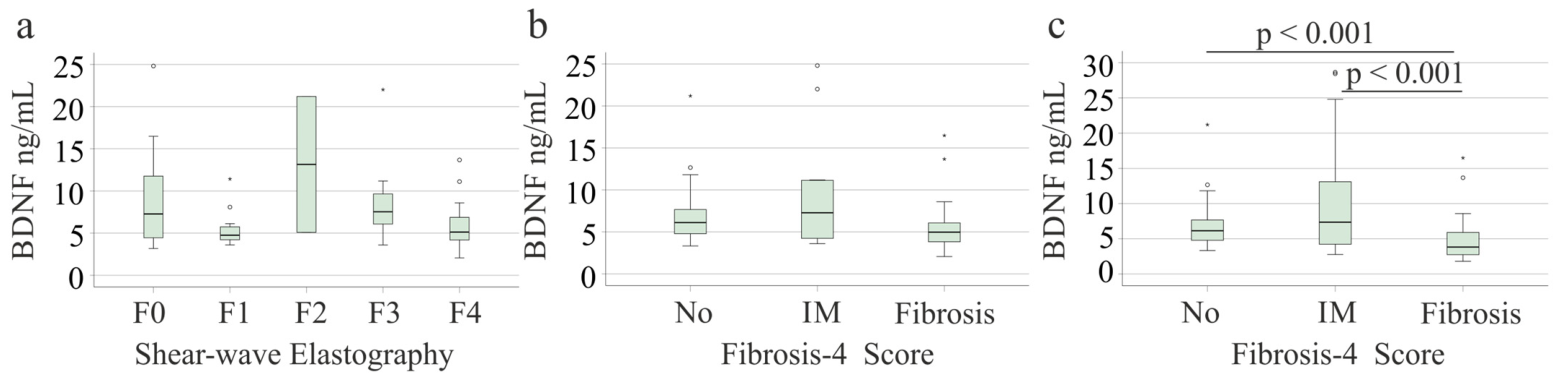
Associations between BDNF and fibrosis were analyzed in patients without ultrasound-diagnosed cirrhosis. Serum BDNF levels did not differ between SWE-defined fibrosis stages F0 (n = 16), F1 (n = 11), F2 (n = 2), F3 (n = 9), and F4 (n = 18) (p = 0.169; Figure 3a). Median BDNF levels were 7.3 (3.2–24.8) ng/mL (95% CI: 5.6–11.7) in patients with F0 and 5.1 (2.1–13.7) ng/mL (95% CI: 4.5–7.4) in those with F4, with no significant difference. Platelet counts (p = 0.172) and BDNF/platelet ratio (p = 0.096) did not differ between SWE stages. None of the patients classified as non-cirrhotic despite having F4 fibrosis showed clinical features suggestive of cirrhosis. Of these patients, 8 had a low, 1 had an indeterminate score, and 9 had a high FIB-4 score. These findings led us to consider that the SWE results may have overestimated the degree of fibrosis in chronic HCV [35]. Nevertheless, as liver biopsy was not performed, the possibility that some of these patients had underlying cirrhosis cannot be entirely excluded. Excluding patients with SWE-defined fibrosis stage 4 showed no significant difference in serum BDNF levels between patients with F0–F3 fibrosis (p = 0.368). The BDNF/platelet ratio differed significantly between patients (p = 0.007).
Figure 3.
Serum BDNF levels according to non-invasive fibrosis assessment: (a) patients without cirrhosis stratified by shear-wave elastography stage (F0, n = 16; F1, n = 11; F2, n = 2; F3, n = 9; F4, n = 18); (b) patients without cirrhosis stratified by fibrosis-4 (FIB-4) score (No, low, n = 27; IM, indeterminate, n = 12; Fibrosis, high, n = 17); (c) all patients stratified by FIB-4 score (low, n = 28; indeterminate, n = 19; high, n = 45). FIB-4 categories: low, <1.30 (<2.0 in patients ≥ 65 years); high, >3.25; indeterminate, values in between. Box plots are defined as in Figure 2. We calculated p-values with the Kruskal–Wallis test and reported Bonferroni-corrected values.
Moreover, after excluding the 18 patients with SWE-defined F4 fibrosis, the difference between the 38 patients without cirrhosis and the 36 patients with cirrhosis remained significant. BDNF was 6.3 (3.2–24.81) ng/mL (95% CI 6.3–9.8) and 3.4 (1.8–28.7) ng/mL (95% CI 3.5–7.7), respectively (p < 0.001, η2: 0.045).
Based on the FIB-4 score, 27 patients without cirrhosis had a low, 12 an indeterminate, and 17 a high probability of advanced fibrosis. Serum BDNF levels did not differ between these groups (Figure 3b). Platelet counts were lower in patients with indeterminate (p = 0.002) and high (p < 0.001) FIB-4 scores than in those with low scores, as expected because platelet count is a component of the FIB-4 formula [45]. Accordingly, the BDNF/platelet ratio was higher in those with indeterminate scores (p = 0.030) and patients with a high probability of advanced fibrosis (p = 0.001) than in patients with a low FIB-4 score.
In the entire cohort, including patients with cirrhosis, patients with a high FIB-4 score (n = 45) had lower serum BDNF levels than those with low (n = 28) or indeterminate (n = 19) scores (both p < 0.001; Figure 3c).
3.3. Serum BDNF and HCV Genotype
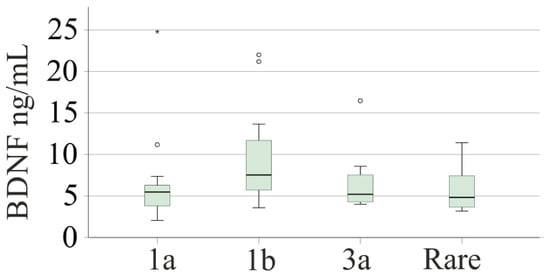
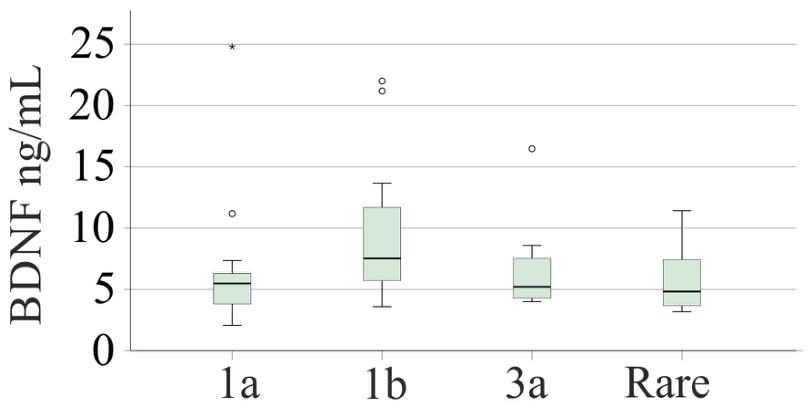
Among patients without cirrhosis, 16 had genotype 1a, 21 had genotype 1b, 10 had genotype 3a, and 9 had rare genotypes. Overall, serum BDNF levels did not differ between genotypes (p = 0.129; Figure 4). In unadjusted pairwise comparisons, BDNF levels were higher in genotype 1b than in genotype 1a infection (p = 0.037); no other pairwise difference was significant. This difference was small and requires confirmation in larger cohorts.
Figure 4.
Serum BDNF levels according to HCV genotype in patients without cirrhosis (genotype 1a, n = 16; 1b, n = 21; 3a, n = 10; rare genotypes, n = 9). Box plots are defined as in Figure 2. We calculated p-values with the Kruskal–Wallis test and reported Bonferroni-corrected values in the text.
Median serum BDNF levels were 5.5 (2.1–24.8) (95% CI: 3.7–9.4), 7.5 (3.6–22.0) (95% CI: 8.9–6.6), 5.2 (4.0–16.5) (95% CI: 3.9–9.3), and 4.8 (3.2–11.4) (95% CI: 3.9–8.4) ng/mL for genotypes 1a, 1b, 3a, and rare genotypes, respectively.
Patients with genotype 1a and 1b infection did not differ in aminotransferase, bilirubin, gamma-glutamyltransferase, creatinine, high-density lipoprotein (HDL), LDL, CRP, or procalcitonin levels, MELD score, INR, glomerular filtration rate, leukocyte or platelet counts, SWE stage, FIB-4 score, and BDNF/platelet ratio (all p > 0.05). Viral load was lower in genotype 1b than in genotype 1a infection (p = 0.006). However, serum BDNF levels did not correlate with viral load in patients without cirrhosis (r = 0.100, p = 0.462), in patients with cirrhosis (r = 0.022, p = 0.899), or in the entire cohort (r = 0.156, p = 0.138).
Among patients with cirrhosis, serum BDNF levels did not differ between genotypes (p > 0.05) or between 1a (9 patients) and 1b (19 patients) infection (p > 0.05).
3.4. Correlations of Serum BDNF with Markers of Inflammation and Liver Function
In patients without cirrhosis, serum BDNF levels did not correlate with MELD score, bilirubin, albumin, aminotransferases, INR, creatinine, glomerular filtration rate, leukocyte or platelet count, procalcitonin, LDL, or HDL but correlated positively with CRP (r = 0.281, p = 0.036). Though significant, this association is weak.
In patients with cirrhosis, serum BDNF levels did not correlate with the MELD score, bilirubin, aminotransferases, creatinine, glomerular filtration rate, leukocyte count, or lipoprotein levels. BDNF correlated negatively with procalcitonin (r = −0.368, p = 0.027), CRP (r = −0.355, p = 0.034), and INR (r = −0.355, p = 0.034), and positively with platelet count (r = 0.345, p = 0.039) and albumin (r = 0.526, p = 0.001). Except for the association with albumin, all other correlations were weak.
Age and BMI were not associated with serum BDNF levels in either group (p > 0.05).
3.5. Serum BDNF During and After DAA Therapy
Serum samples obtained before therapy, at weeks 4 and 12 of DAA therapy, and at SVR12 were available from 38 patients without cirrhosis and 20 patients with cirrhosis. This subcohort had similar sex (p = 0.677), BMI (p = 0.343), age (p = 0.734), MELD score (p = 0.134), alanine aminotransferase (p = 0.542), aspartate aminotransferase (p = 0.098), albumin (p = 0.447), INR (p = 0.139), creatinine (p = 0.357), GFR (p = 0.638), CRP (p = 0.889), procalcitonin (p = 0.477), platelet number (p = 0.362), leukocyte number (p = 0.197), HDL (p = 0.094), LDL (p = 0.791), and viral load (p = 0.173) as the entire cohort before therapy started. Bilirubin was higher in the entire cohort (p = 0.041). Diabetes (p = 0.056), steatosis (p = 0.912), and cirrhosis (p = 0.316) prevalence were similar.
In both groups, aminotransferase and procalcitonin levels and viral load decreased, whereas albumin and LDL increased from baseline to SVR12 (Table 2).
Table 2.
Characteristics of patients without and with cirrhosis in the longitudinal cohort before therapy and at SVR12. The PCR assay for viral load had a 95% limit of detection of 5.11 IU/mL in serum. The linear and quantifiable range starts at 12 IU/mL, and measurements below 12 IU/mL were classified as 1.
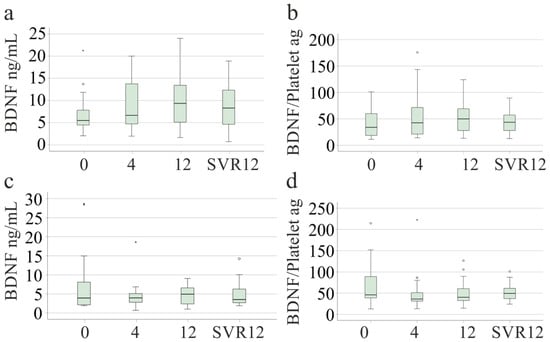
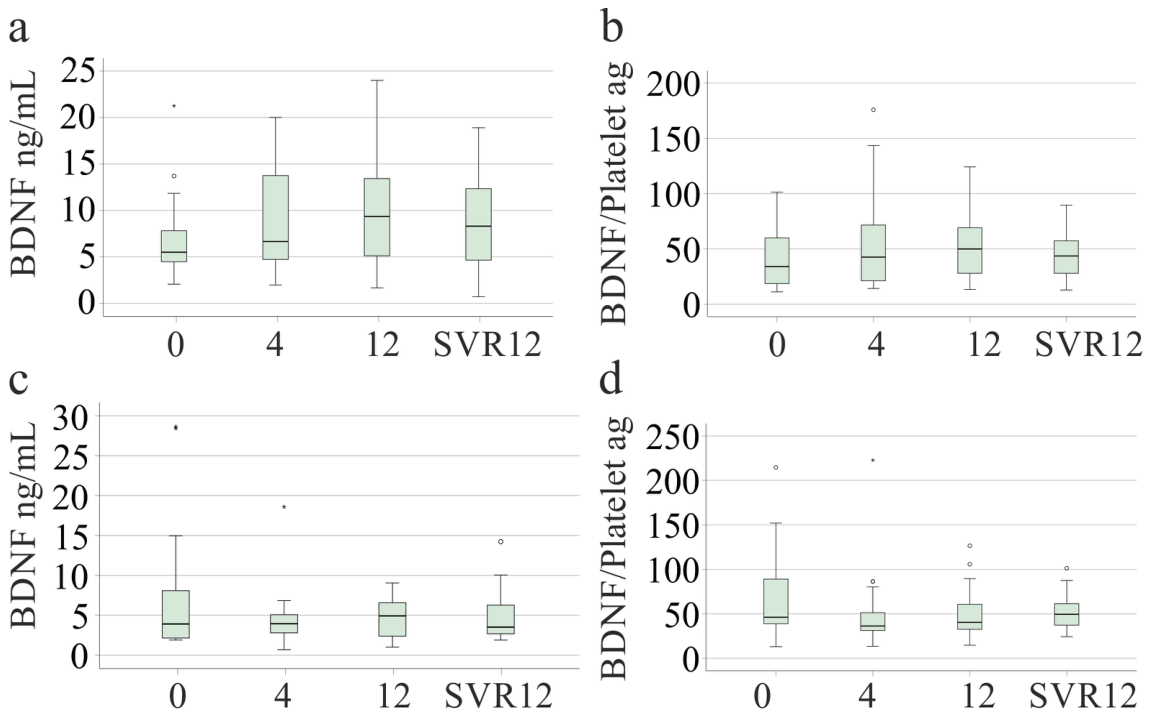
In patients without cirrhosis, serum BDNF levels at weeks 4 and 12 of therapy and at SVR12 were similar to levels before therapy (p = 0.271) (Figure 5a). However, BDNF levels were higher at SVR12 than before therapy in pairwise comparisons (p = 0.022). The BDNF/platelet ratio did not change (p = 0.258) (Figure 5b). In patients with cirrhosis, serum BDNF levels (p = 0.257) and the BDNF/platelet ratio (p = 0.286) were similar at all time points (Figure 5c,d). BDNF levels before therapy were similar to levels at SVR12 in pairwise comparisons (p = 0.351).
Figure 5.
Serum BDNF levels and BDNF/platelet ratio before (0) and at weeks 4 and 12 of direct-acting antiviral therapy and at sustained virologic response 12 weeks after the end of therapy (SVR12): (a) serum BDNF levels of patients without cirrhosis (n = 38); (b) serum BDNF/platelet ratio of patients without cirrhosis; (c) serum BDNF levels of patients with ultrasound-diagnosed cirrhosis (n = 20); (d) serum BDNF/platelet ratio of patients with ultrasound-diagnosed cirrhosis. Box plots are defined as in Figure 2. The Friedman test was used as the statistical test.
We used repeated-measures ANOVA to test whether changes in BDNF between therapy start and SVR12 differed between cirrhosis and non-cirrhotic patients. A mixed-design repeated-measures ANOVA revealed no significant main effect of time on BDNF levels (F(1, 56) = 0.000, p = 0.994, partial η2 = 0.000). BDNF levels showed a significant time × group interaction (F(1, 56) = 5.464, p = 0.023, partial η2 = 0.089).
A mixed-design repeated-measures ANOVA revealed no significant main effect of time on log10-transformed BDNF levels (F(1, 56) = 0.213, p = 0.646, partial η2 = 0.004). No significant time × group interaction was observed (F(1, 56) = 1.842, p = 0.180, partial η2 = 0.032), indicating that changes in BDNF levels over time did not differ significantly between patients with and without liver cirrhosis.
Untransformed BDNF levels were right-skewed and significantly deviated from a normal distribution (p < 0.001). In contrast, the log10-transformed BDNF levels did not significantly deviate from normality at either therapy initiation (p = 0.086) or SVR12 (p = 0.158). Furthermore, the time × group interaction was more pronounced with untransformed BDNF levels, whereas no statistically significant interaction was observed with log10-transformed values. This suggests that there was no, or at most a relatively small, time × group interaction for BDNF levels.
Log10-transformed BDNF levels differed significantly between patients without and with liver cirrhosis (F(1, 56) = 7.443, p = 0.008, partial η2 = 0.117), averaged across both measurement time points.
3.6. Serum BDNF at SVR12
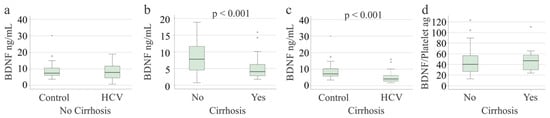
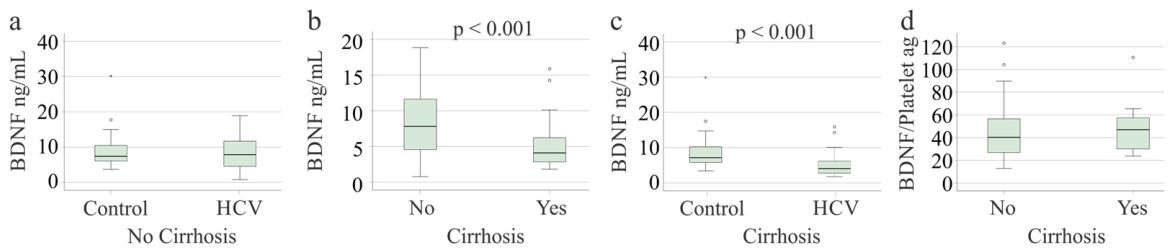
Serum samples obtained at SVR12 were available from 81 patients, 29 of whom had cirrhosis. At SVR12, serum BDNF levels in patients without cirrhosis were similar to those of the controls (Figure 6a). The estimated between-group difference between controls and non-cirrhotic patients was 0.42 (95% CI: −1.83–2.66, p = 0.706; η2 = 0.002). Elimination of the BDNF measure below the LOQ did not change this result; the estimated between-group difference between controls and non-cirrhotic patients was 0.42 (95% CI: −1.83–2.66, p = 0.706; η2 = 0.002).
Figure 6.
Serum BDNF levels and BDNF/platelet ratio at SVR12: (a) serum BDNF levels of controls (n = 30) and patients without cirrhosis (n = 52); (b) serum BDNF levels of patients without (n = 52) and with (n = 29) ultrasound-diagnosed cirrhosis; (c) serum BDNF levels of controls and patients with cirrhosis; (d) BDNF/platelet ratio of patients with and without cirrhosis. Box plots are defined as in Figure 2; we calculated p-values using the Mann–Whitney U test and did not correct for multiple comparisons.
Patients with cirrhosis had lower serum BDNF levels than patients without cirrhosis (p < 0.001; Figure 6b) and controls (p < 0.001; Figure 6c). The BDNF/platelet ratio of patients with and without cirrhosis was similar (p = 0.359) (Figure 6d).
In patients with cirrhosis, serum BDNF levels at SVR12 correlated positively with albumin (r = 0.429, p = 0.020), LDL (r = 0.620, p < 0.001), platelet count (r = 0.715, p < 0.001), leukocyte count (r = 0.674, p < 0.001), and CRP (r = 0.526, p = 0.003) and negatively with INR (r = −0.498, p = 0.006), bilirubin (r = −0.506, p = 0.006), and MELD score (r = −0.432, p = 0.022).
In patients without cirrhosis, serum BDNF levels at SVR12 correlated negatively with procalcitonin (r = −0.570, p < 0.001), aspartate aminotransferase (AST; r = −0.390, p = 0.004), alanine aminotransferase (ALT; r = −0.394, p = 0.004), INR (r = −0.330, p = 0.017), and MELD score (r = −0.291, p = 0.036) and positively with platelet count (r = 0.505, p < 0.001) and LDL (r = 0.323, p = 0.029).
In patients without cirrhosis, BMI, sex, age, albumin, and platelet count predicted log10-transformed BDNF (F(5,36) = 3.969, p = 0.006), and platelet count (p < 0.001; regression coefficient B: 0.002; variance inflation factor: 1.214) was significant.
In patients with cirrhosis, BMI, sex, age, albumin, and platelet count predicted log10-transformed BDNF (F(5,23) = 11.812, p < 0.001), and albumin (p = 0.016, regression coefficient B: 0.014; variance inflation factor: 1.421), BMI (p = 0.002, regression coefficient B: 0.027, variance inflation factor: 1.215), and platelet count (p < 0.001, regression coefficient B: 0.003, variance inflation factor: 1.345) were significant.
In the entire cohort, BMI, sex, age, albumin, and platelet count predicted log10-transformed BDNF (F(5,66) = 13.168, p < 0.001), and albumin (p = 0.011, regression coefficient B: 0.010; variance inflation factor: 1.040) and platelet count (p < 0.001, regression coefficient B: 0.002, variance inflation factor: 1.205) were significant.
4. Discussion
This study shows that HCV-related cirrhosis is associated with reduced serum BDNF levels before viral cure and at SVR12. The lack of a significant difference after adjustment for platelet count and log10 transformation (to account for the skewed data distribution) suggests that altered BDNF levels in patients with cirrhosis may be at least partly secondary to changes in platelet count and do not reflect a direct, disease-specific alteration in BDNF synthesis. BDNF concentrations in patients with HCV infection without cirrhosis differ only slightly from those in healthy controls and remain largely unchanged after successful viral eradication.
Serum BDNF levels were markedly lower in patients with cirrhosis than in controls and patients without cirrhosis, and they correlated with markers of liver dysfunction both before and after viral eradication. Reduced serum BDNF levels have been reported in HCV-related cirrhosis [20], hepatitis B virus-related cirrhosis [18], and cirrhosis of unspecified etiology compared with healthy liver donors [19]. Together with the present data, these findings suggest that cirrhosis itself, rather than HCV infection, is the main determinant of low serum BDNF levels. In contrast, in critically ill patients, concomitant cirrhosis was not associated with lower plasma BDNF levels [46], suggesting that severe systemic inflammation may override the cirrhosis-related reduction in circulating BDNF.
In patients without cirrhosis, serum BDNF levels were not associated with fibrosis stage assessed by SWE or FIB-4, both of which may overestimate fibrosis in the presence of active hepatic inflammation due to HCV infection [35,45,47]. This is consistent with findings in non-alcoholic fatty liver disease, in which serum BDNF was not strongly correlated with liver stiffness or FIB-4 [21]. Thus, serum BDNF does not appear to be closely linked to fibrosis progression, and its reduction in cirrhosis may be driven by other factors. Platelets are a major reservoir of BDNF [10], and thrombocytopenia in advanced fibrosis and cirrhosis [48,49] may contribute to lower circulating BDNF levels. In patients without cirrhosis, platelet counts were lower in those with indeterminate or high FIB-4 scores than in those with low scores, whereas serum BDNF levels did not differ significantly. However, because platelet count is a component of the FIB-4 score, this comparison does not rule out thrombocytopenia contributing to low BDNF levels in cirrhosis, where platelet count significantly predicted serum BDNF levels.
Patients with cirrhosis often exhibit thrombocytopenia and altered platelet function [50]. Given that platelets store substantial amounts of BDNF [10], the positive correlation between serum BDNF levels and platelet count in cirrhosis was expected. Conversely, platelets in cirrhosis are frequently activated [50], which may promote BDNF release [10].
Platelet counts did not change between baseline and SVR12, and in non-cirrhotic patients, serum BDNF levels did not significantly increase during viral clearance. In patients without cirrhosis, platelet count predicted serum BDNF levels at SVR12 but not before therapy, suggesting that active HCV infection attenuates the association between platelet count and BDNF. In patients with cirrhosis, platelet count predicted serum BDNF levels at pretreatment and SVR12. Thus, in patients in whom DAA therapy is associated with higher platelet counts, BDNF will most likely also increase, a suggestion that needs experimental proof.
DAA therapy has previously been associated with a marked increase in serum BDNF levels at SVR12 in patients without advanced fibrosis [24]. In that study, BDNF increased approximately 1.8- to 2.5-fold, but only in patients with neurocognitive impairment, not in those without such deficits [24]. In our patients without cirrhosis, in whom we did not assess neurocognitive function, the increase was approximately 1.5-fold. However, this recent study did not include a control cohort [24]. Wang et al. compared peginterferon-alpha-2a and peginterferon-alpha-2b, including 22 and 12 patients, respectively. This study showed a decline in BDNF in both groups at week 24 [22]. Avila et al. included patients with chronic genotype 1 HCV without cirrhosis (N = 40) and observed a decline in BDNF in 19 patients who reported improved outcomes after viral eradication. BDNF did not change in the 18 patients who did not have better physical health at the end of the study [51]. A healthy control cohort was not included [51]. Our study compared patients with and without cirrhosis and also included a healthy control group. Compared to these previous studies, our cohort was larger. Moreover, unlike previous studies, we also included platelet count as a major determinant of serum BDNF levels [10,22,24,51]. Our findings suggest that DAA treatment is associated with only minor changes in serum BDNF levels. Furthermore, reduced platelet counts in patients with underlying liver cirrhosis may contribute to serum BDNF levels in HCV infection, both before and after viral cure.
Serum BDNF correlated positively with LDL at SVR12 but not before therapy. LDL levels increased during DAA therapy [52,53]. BDNF has been both positively and negatively correlated with cholesterol in different patient cohorts [54,55], suggesting a context-dependent relationship between BDNF and cholesterol metabolism.
BDNF levels appeared lower in non-cirrhotic patients infected with genotypes 1a and 3a and with rare genotypes than in those with genotype 1b; however, the overall comparison between genotypes was not significant, and only the difference between genotypes 1a and 1b reached nominal significance. Genotype 1 is often treated as a uniform category, although its subtypes differ substantially in nucleotide sequence. In our cohort, viral load was lower in genotype 1b than in genotype 1a infection. Other studies found no differences in viral load between genotypes [56], suggesting that this finding may be cohort-specific; moreover, serum BDNF did not correlate with viral load, making viral load an unlikely explanation for the higher BDNF levels in genotype 1b. Because other clinical and laboratory parameters did not differ between genotypes 1a and 1b, consistent with previous reports [57], the underlying mechanism remains unclear. Moreover, because the difference was small and only marginally significant, this finding requires confirmation in larger cohorts.
In patients with and without cirrhosis, serum BDNF levels at SVR12 correlated negatively with MELD score, likely reflecting the inverse association between MELD score and platelet count. In addition, BDNF correlated negatively with aminotransferase levels in patients without cirrhosis and with bilirubin in patients with cirrhosis, suggesting an association with the severity of liver disease and liver dysfunction. Correlations with albumin were observed only in patients with cirrhosis, both before therapy and at SVR12. Because albumin reflects hepatic synthetic function [58] and increased after viral clearance in both groups, a corresponding increase in BDNF might have been expected. The absence of such an increase in patients with cirrhosis indicates that hepatic synthetic capacity is not the primary determinant of circulating BDNF levels. The relationship between serum BDNF and systemic inflammation was inconsistent, with negative and positive correlations at SVR12. Thus, the association between serum BDNF and systemic inflammation remains uncertain. Given that systemic and hepatic inflammation improve during virus eradication, whereas BDNF does not change much, inflammation does not seem to affect serum BDNF levels [59]. Indeed, platelet count emerged as the strongest predictor of serum BDNF levels in the present study.
Higher serum BDNF levels have been reported in obesity and type 2 diabetes [60,61], although others have not confirmed this [62]. In our patients, serum BDNF did not correlate with BMI and did not differ according to diabetes or steatosis status; however, only four patients without cirrhosis had diabetes. Serum BDNF was also unrelated to age and sex, suggesting that these variables did not confound the observed associations. However, BMI predicted serum BDNF in cirrhosis at SVR12, so BMI should be considered.
This study has several limitations. Cognitive function, depressive symptoms, and physical activity, which have been linked to serum BDNF levels [21,61,63,64], were not assessed. Alcohol and smoking may cause lower BDNF levels in blood [65,66], but smoking status and alcohol intake were not documented for our patients. Cirrhosis was diagnosed by ultrasonography and laboratory findings rather than histology, and subgroups, particularly in the genotype, diabetes, and fibrosis analyses, were small. Non-invasive tests for liver fibrosis and cirrhosis can misclassify the severity of liver disease, resulting in both false-positive and false-negative diagnoses. Numerous correlations were tested without correcting for multiple comparisons, so isolated findings should be interpreted with caution. Serum BDNF depends on platelet count and pre-analytical handling, and the study did not measure plasma BDNF. Moreover, the serum samples were stored for up to 12 years. Xu et al. described BDNF levels of samples collected 4 to 5 years earlier [17], and Yang et al. stored samples for about 5 to 11 years [19]. Bedewy et al. and Marino et al. stored blood for much shorter periods, 1 to 2 years [20,24]. No studies have determined BDNF stability after such long storage, and this limitation cannot be resolved. The study was conducted at a single German center, which may limit generalizability to other populations. Finally, BDNF was measured only until SVR12, so its long-term trajectory after viral eradication remains unknown.
5. Conclusions
Serum BDNF levels are reduced in patients with HCV-related cirrhosis and remain low at SVR12. Overall, the findings suggest an association between serum BDNF levels, platelet count, and liver disease severity. However, they do not show that cirrhosis independently influences BDNF concentrations or that viral eradication directly restores BDNF homeostasis.
Supplementary Materials
The following supporting information can be downloaded at: https://www.mdpi.com/article/10.3390/v18111256/s1, Minimal dataset.
Author Contributions
Conceptualization, G.P., K.W. and C.B.; formal analysis, C.B.; resources, G.P., K.W. and M.M.; writing—original draft preparation, C.B.; writing—review and editing, G.P., K.W., M.M. and C.B. All authors have read and agreed to the published version of the manuscript.
Funding
This research received no external funding.
Institutional Review Board Statement
The study was conducted in accordance with the Declaration of Helsinki and the guidelines for good clinical practice, and approved by the Ethics Committee of the University Hospital of Regensburg (protocol code 14-101-0049; date of approval 22 May 2014).
Informed Consent Statement
Informed consent was obtained from all subjects involved in the study.
Data Availability Statement
A minimal data set is attached. Further raw data supporting the conclusions of this article will be made available by the authors upon request.
Acknowledgments
We greatly appreciate Elena Underberg’s technical assistance. We thank Jonathan Grimm for collecting the clinical data.
Conflicts of Interest
The authors declare no conflicts of interest.
Abbreviations
The following abbreviations are used in this manuscript:
| ALT | alanine aminotransferase |
| AST | aspartate aminotransferase |
| BDNF | brain-derived neurotrophic factor |
| BMI | body mass index |
| CRP | C-reactive protein |
| DAA | direct-acting antiviral |
| ELISA | enzyme-linked immunosorbent assay |
| FIB-4 | fibrosis-4 |
| GFR | glomerular filtration rate |
| HCV | hepatitis C virus |
| HDL | high-density lipoprotein |
| INR | international normalized ratio |
| LDL | low-density lipoprotein |
| MELD | Model for End-Stage Liver Disease |
| PCT | procalcitonin |
| SVR12 | sustained virologic response 12 weeks after the end of therapy |
| SWE | shear-wave elastography |
| TrkB | tropomyosin receptor kinase B |
References
- Moretti, R.; Giuffre, M.; Merli, N.; Caruso, P.; Di Bella, S.; Tiribelli, C.; Croce, L.S. Hepatitis C Virus-Related Central and Peripheral Nervous System Disorders. Brain Sci. 2021, 11, 1569. [Google Scholar] [CrossRef] [Scilit]
- Ichimura-Shimizu, M.; Kurrey, K.; Miyata, M.; Dezawa, T.; Tsuneyama, K.; Kojima, M. Emerging Insights into the Role of Bdnf on Health and Disease in Periphery. Biomolecules 2024, 14, 444. [Google Scholar] [CrossRef] [Scilit]
- Zhu, W.; Cui, Y.; Zhou, Y.; Zheng, Y.; Huang, L.; Jin, L.; Zhang, Q.; Chen, P.; Lin, M.; Ye, J.; et al. Hepatocyte Bdnf Acts as a Novel Immune Checkpoint to Restrain Tlr4-Mediated Acute Hepatitis. Adv. Sci. 2026, 13, e21164. [Google Scholar] [CrossRef] [Scilit]
- Kamm, D.R.; McCommis, K.S. Hepatic Stellate Cells in Physiology and Pathology. J. Physiol. 2022, 600, 1825–1837. [Google Scholar] [CrossRef] [Scilit]
- Cassiman, D.; Denef, C.; Desmet, V.J.; Roskams, T. Human and Rat Hepatic Stellate Cells Express Neurotrophins and Neurotrophin Receptors. Hepatology 2001, 33, 148–158. [Google Scholar] [CrossRef] [Scilit]
- Vivacqua, G.; Renzi, A.; Carpino, G.; Franchitto, A.; Gaudio, E. Expression of Brain Derivated Neurotrophic Factor and of Its Receptors: Trkb and P75nt in Normal and Bile Duct Ligated Rat Liver. Ital. J. Anat. Embryol. 2014, 119, 111–129. [Google Scholar] [CrossRef] [Scilit]
- Genzer, Y.; Chapnik, N.; Froy, O. Effect of Brain-Derived Neurotrophic Factor (Bdnf) on Hepatocyte Metabolism. Int. J. Biochem. Cell Biol. 2017, 88, 69–74. [Google Scholar] [CrossRef] [Scilit]
- Tonra, J.R.; Ono, M.; Liu, X.; Garcia, K.; Jackson, C.; Yancopoulos, G.D.; Wiegand, S.J.; Wong, V. Brain-Derived Neurotrophic Factor Improves Blood Glucose Control and Alleviates Fasting Hyperglycemia in C57blks-Lepr(Db)/Lepr(Db) Mice. Diabetes 1999, 48, 588–594. [Google Scholar] [CrossRef] [Scilit]
- Ashtary-Larky, D.; Rezaeyeh, A.P.; Hajizadeh, L.; Salarpour, A.; Shouhani, Z.; Alipour, M. Effects of Dietary Weight Loss on Brain-Derived Neurotrophic Factor in Individuals with Overweight and Obesity: A Systematic Review. Nutr. Rev. 2026. Online ahead of print. [Google Scholar]
- Boukhatem, I.; Fleury, S.; Jourdi, G.; Lordkipanidze, M. The Intriguing Role of Platelets as Custodians of Brain-Derived Neurotrophic Factor. Res. Pract. Thromb. Haemost. 2024, 8, 102398. [Google Scholar] [CrossRef] [Scilit]
- Serra-Millas, M. Are the Changes in the Peripheral Brain-Derived Neurotrophic Factor Levels Due to Platelet Activation? World J. Psychiatry 2016, 6, 84–101. [Google Scholar] [CrossRef] [Scilit]
- Polyakova, M.; Schlogl, H.; Sacher, J.; Schmidt-Kassow, M.; Kaiser, J.; Stumvoll, M.; Kratzsch, J.; Schroeter, M.L. Stability of Bdnf in Human Samples Stored up to 6 Months and Correlations of Serum and Edta-Plasma Concentrations. Int. J. Mol. Sci. 2017, 18, 1189. [Google Scholar] [CrossRef] [Scilit]
- Bocchio-Chiavetto, L.; Bagnardi, V.; Zanardini, R.; Molteni, R.; Nielsen, M.G.; Placentino, A.; Giovannini, C.; Rillosi, L.; Ventriglia, M.; Riva, M.A.; et al. Serum and Plasma Bdnf Levels in Major Depression: A Replication Study and Meta-Analyses. World J. Biol. Psychiatry 2010, 11, 763–773. [Google Scholar] [CrossRef] [Scilit]
- Yoshimura, R.; Sugita-Ikenouchi, A.; Hori, H.; Umene-Nakano, W.; Hayashi, K.; Katsuki, A.; Ueda, N.; Nakamura, J. A Close Correlation between Plasma and Serum Levels of Brain-Derived Neurotrophic Factor (Bdnf) in Healthy Volunteers. Int. J. Psychiatry Clin. Pract. 2010, 14, 220–222. [Google Scholar] [CrossRef] [Scilit]
- Tsuchimine, S.; Sugawara, N.; Ishioka, M.; Yasui-Furukori, N. Preanalysis Storage Conditions Influence the Measurement of Brain-Derived Neurotrophic Factor Levels in Peripheral Blood. Neuropsychobiology 2014, 69, 83–88. [Google Scholar] [CrossRef] [Scilit]
- Leustean, A.; Popescu, C.; Nichita, L.; Tiliscan, C.; Arama, V. Dynamics of Apri and Fib-4 in Hcv Cirrhotic Patients Who Achieved Svr after Daa Therapy. Exp. Ther. Med. 2021, 21, 99. [Google Scholar] [CrossRef] [Scilit]
- Xu, H.; Zhou, Y.; Ko, F.; Ping, J.; Zhang, J.; Zhao, C.; Xu, L. Female Gender and Gastrointestinal Symptoms, Not Brain-Derived Neurotrophic Factor, Are Associated with Depression and Anxiety in Cirrhosis. Hepatol. Res. 2017, 47, E64–E73. [Google Scholar] [CrossRef] [Scilit]
- Shu, H.C.; Hu, J.; Jiang, X.B.; Deng, H.Q.; Zhang, K.H. Bdnf Gene Polymorphism and Serum Level Correlate with Liver Function in Patients with Hepatitis B-Induced Cirrhosis. Int. J. Clin. Exp. Pathol. 2019, 12, 2368–2380. [Google Scholar]
- Yang, Z.F.; Ho, D.W.; Lau, C.K.; Tam, K.H.; Lam, C.T.; Yu, W.C.; Poon, R.T.; Fan, S.T. Significance of the Serum Brain-Derived Neurotrophic Factor and Platelets in Hepatocellular Carcinoma. Oncol. Rep. 2006, 16, 1237–1243. [Google Scholar] [CrossRef] [Scilit]
- Bedewy, E.S.; Elhadidi, A.; Abd El-Latif, N.A.; El Zawawy, Y.T.; Abbasy, A.N. Diagnostic Role of Serum Brain-Derived Neurotrophic Factor in Hcv Cirrhotic Patients with Minimal Hepatic Encephalopathy with and without Schistosomiasis. Egypt. Liver J. 2024, 14, 1–9. [Google Scholar] [CrossRef] [Scilit]
- Hashida, R.; Nakano, D.; Yamamura, S.; Kawaguchi, T.; Tsutsumi, T.; Matsuse, H.; Takahashi, H.; Gerber, L.; Younossi, Z.M.; Torimura, T. Association between Activity and Brain-Derived Neurotrophic Factor in Patients with Non-Alcoholic Fatty Liver Disease: A Data-Mining Analysis. Life 2021, 11, 799. [Google Scholar] [CrossRef] [Scilit]
- Wang, L.J.; Chen, S.W.; Chien, R.N.; Yen, C.L.; Chang, J.J.; Lee, T.S.; Liu, C.J.; Chen, L.W.; Chen, C.K. Mental Health, Pro-Inflammatory Cytokines, and Brainderived Neurotrophic Factor in Patients Undergoing Treatment for Hepatitis C: Comparison between Peginterferon-Alpha-2a and Peginterferon-Alpha-2b. Neuropsychiatry 2017, 7, 105–115. [Google Scholar]
- Zeng, H.; Li, L.; Hou, Z.; Zhang, Y.; Tang, Z.; Liu, S. Direct-Acting Antiviral in the Treatment of Chronic Hepatitis C: Bonuses and Challenges. Int. J. Med. Sci. 2020, 17, 892–902. [Google Scholar] [CrossRef] [Scilit]
- Marino, A.; Scuderi, D.; Locatelli, M.E.; Gentile, A.; Pampaloni, A.; Cosentino, F.; Ceccarelli, M.; Celesia, B.M.; Benanti, F.; Nunnari, G.; et al. Modification of Serum Brain-Derived Neurotrophic Factor Levels Following Anti-Hcv Therapy with Direct Antiviral Agents: A New Marker of Neurocognitive Disorders. Hepat. Mon. 2020, 20, e95101. [Google Scholar] [CrossRef] [Scilit]
- Badawi, R.; Soliman, S.; Aboali, L.; Elkadeem, M.; Elfert, A.; Elguindy, A.M.A.; Ullah, M.S.; Abd-Elsalam, S. Platelet Count Improvement after Chronic Hepatitis C Treatment among Cirrhotic Patients Who Achieved Sustained Virological Response: Realworld Results from 2186 Patients in Egypt. Endocr. Metab. Immune Disord. Drug Targets 2021, 21, 1300–1305. [Google Scholar] [CrossRef] [Scilit]
- Sayyar, M.; Saidi, M.; Zapatka, S.; Deng, Y.; Ciarleglio, M.; Garcia-Tsao, G. Platelet Count Increases after Viral Elimination in Chronic Hcv, Independent of the Presence or Absence of Cirrhosis. Liver Int. 2019, 39, 2061–2065. [Google Scholar] [CrossRef] [Scilit]
- Siphepho, P.Y.; Liu, Y.T.; Shabangu, C.S.; Huang, J.F.; Huang, C.F.; Yeh, M.L.; Yu, M.L.; Wang, S.C. The Impact of Steatosis on Chronic Hepatitis C Progression and Response to Antiviral Treatments. Biomedicines 2021, 9, 1491. [Google Scholar] [CrossRef] [Scilit]
- Chaudhari, R.; Fouda, S.; Sainu, A.; Pappachan, J.M. Metabolic Complications of Hepatitis C Virus Infection. World J. Gastroenterol. 2021, 27, 1267–1282. [Google Scholar] [CrossRef] [Scilit]
- Grimm, J.; Peschel, G.; Müller, M.; Schacherer, D.; Wiest, R.; Weigand, K.; Buechler, C. Rapid Decline of Serum Proprotein Convertase Subtilisin/Kexin 9 (Pcsk9) in Non-Cirrhotic Patients with Chronic Hepatitis C Infection Receiving Direct-Acting Antiviral Therapy. J. Clin. Med. 2021, 10, 1621. [Google Scholar] [CrossRef] [Scilit]
- Peschel, G.; Grimm, J.; Gulow, K.; Muller, M.; Buechler, C.; Weigand, K. Chemerin Is a Valuable Biomarker in Patients with HCV Infection and Correlates with Liver Injury. Diagnostics 2020, 10, 974. [Google Scholar] [CrossRef] [Scilit]
- Peschel, G.; Krautbauer, S.; Weigand, K.; Grimm, J.; Höring, M.; Liebisch, G.; Müller, M.; Buechler, C. Rising Lysophosphatidylcholine Levels Post-Hepatitis C Clearance. Int. J. Mol. Sci. 2024, 25, 1198. [Google Scholar] [CrossRef] [Scilit]
- Weigand, K.; Peschel, G.; Grimm, J.; Luu, K.; Schacherer, D.; Wiest, R.; Muller, M.; Schwarz, H.; Buechler, C. Soluble Cd137 Is a Novel Serum Marker of Liver Cirrhosis in Patients with Hepatitis C and Alcohol-Associated Disease Etiology. Eur. J. Immunol. 2022, 52, 633–645. [Google Scholar] [CrossRef] [Scilit]
- Weigand, K.; Peschel, G.; Grimm, J.; Müller, M.; Buechler, C. Serum Galectin-3 in Hepatitis C Virus Infection Declines after Successful Virus Eradication by Direct-Acting Antiviral Therapy. J. Gastrointest. Liver Dis. 2022, 31, 444–452. [Google Scholar] [CrossRef] [Scilit]
- Peschel, G.; Weigand, K.; Grimm, J.; Muller, M.; Buechler, C. Serum Omentin-1 Is Correlated with the Severity of Liver Disease in Patients with Chronic Hepatitis C. World J. Hepatol. 2023, 15, 1315–1324. [Google Scholar] [CrossRef] [Scilit]
- Peschel, G.; Grimm, J.; Buechler, C.; Gunckel, M.; Pollinger, K.; Aschenbrenner, E.; Kammerer, S.; Jung, E.M.; Haimerl, M.; Werner, J.; et al. Liver Stiffness Assessed by Shear-Wave Elastography Declines in Parallel with Immunoregulatory Proteins in Patients with Chronic Hcv Infection during Daa Therapy. Clin. Hemorheol. Microcirc. 2021, 79, 541–555. [Google Scholar] [CrossRef] [Scilit]
- McPherson, S.; Hardy, T.; Dufour, J.F.; Petta, S.; Romero-Gomez, M.; Allison, M.; Oliveira, C.P.; Francque, S.; Van Gaal, L.; Schattenberg, J.M.; et al. Age as a Confounding Factor for the Accurate Non-Invasive Diagnosis of Advanced Nafld Fibrosis. Am. J. Gastroenterol. 2017, 112, 740–751. [Google Scholar] [CrossRef] [Scilit]
- Sterling, R.K.; Lissen, E.; Clumeck, N.; Sola, R.; Correa, M.C.; Montaner, J.; Sulkowski, M.S.; Torriani, F.J.; Dieterich, D.T.; Thomas, D.L.; et al. Development of a Simple Noninvasive Index to Predict Significant Fibrosis in Patients with Hiv/Hcv Coinfection. Hepatology 2006, 43, 1317–1325. [Google Scholar] [CrossRef] [Scilit]
- Colombo, S.; Buonocore, M.; Del Poggio, A.; Jamoletti, C.; Elia, S.; Mattiello, M.; Zabbialini, D.; Del Poggio, P. Head-to-Head Comparison of Transient Elastography (Te), Real-Time Tissue Elastography (Rte), and Acoustic Radiation Force Impulse (Arfi) Imaging in the Diagnosis of Liver Fibrosis. J. Gastroenterol. 2012, 47, 461–469. [Google Scholar] [CrossRef] [Scilit]
- Indre, M.G.; Leucuta, D.C.; Lupsor-Platon, M.; Turco, L.; Ferri, S.; Hashim, A.; Orasan, O.H.; Procopet, B.; Stefanescu, H.; Morelli, M.C.; et al. Diagnostic Accuracy of 2d-Swe Ultrasound for Liver Fibrosis Assessment in Masld: A Multilevel Random Effects Model Meta-Analysis. Hepatology 2025, 82, 454–469. [Google Scholar] [CrossRef] [Scilit]
- Szakacs, Z.; Eross, B.; Soos, A.; Matrai, P.; Szabo, I.; Petervari, E.; Bajor, J.; Farkas, N.; Hegyi, P.; Illes, A.; et al. Baveno Criteria Safely Identify Patients with Compensated Advanced Chronic Liver Disease Who Can Avoid Variceal Screening Endoscopy: A Diagnostic Test Accuracy Meta-Analysis. Front. Physiol. 2019, 10, 1028. [Google Scholar] [CrossRef] [Scilit]
- Parikh, N.D.; Mehta, M.; Tapper, E.B. Fib-4 and Apri for Cirrhosis Detection in a Privately Insured National Cohort. JHEP Rep. 2024, 6, 100925. [Google Scholar] [CrossRef] [Scilit]
- Tapper, E.B.; Parikh, N.D. Diagnosis and Management of Cirrhosis and Its Complications: A Review. JAMA 2023, 329, 1589–1602. [Google Scholar] [CrossRef] [Scilit]
- Moini, M.; Onofrio, F.; Hansen, B.E.; Adeyi, O.; Khalili, K.; Patel, K. Combination of Fib-4 with Ultrasound Surface Nodularity or Elastography as Predictors of Histologic Advanced Liver Fibrosis in Chronic Liver Disease. Sci. Rep. 2021, 11, 19275. [Google Scholar] [CrossRef] [Scilit]
- Kruschke, J.K. Chapter 19—Metric Predicted Variable with One Nominal Predictor, Doing Bayesian Data Analysis, 2nd ed.; Academic Press: Cambridge, MA, USA, 2015; pp. 553–581. [Google Scholar]
- Huttman, M.; Parigi, T.L.; Zoncape, M.; Liguori, A.; Kalafateli, M.; Noel-Storr, A.H.; Casazza, G.; Tsochatzis, E. Liver Fibrosis Stage Based on the Four Factors (Fib-4) Score or Forns Index in Adults with Chronic Hepatitis C. Cochrane Database Syst. Rev. 2024, 8, CD011929. [Google Scholar] [CrossRef] [Scilit]
- Fromm, C.; Fröhlich, L.; Gepperth, V.; Läber, L.; Schmid, S.; Müller, M.; Pavel, V.; Mester, M.; Buechler, C. Lower Plasma Brain-Derived Neurotrophic Factor Levels during Critical Illness Are Associated with Subsequent Dialysis Requirement. Medicinia 2026, 62, 1842. [Google Scholar] [CrossRef] [Scilit]
- Knop, V.; Mauss, S.; Goeser, T.; Geier, A.; Zimmermann, T.; Herzer, K.; Postel, N.; Friedrich-Rust, M.; Hofmann, W.P.; German Hepatitis C-Registry. Dynamics of Liver Stiffness by Transient Elastography in Patients with Chronic Hepatitis C Virus Infection Receiving Direct-Acting Antiviral Therapy-Results from the German Hepatitis C-Registry. J. Viral Hepat. 2020, 27, 690–698. [Google Scholar] [CrossRef] [Scilit]
- Adinolfi, L.E.; Giordano, M.G.; Andreana, A.; Tripodi, M.F.; Utili, R.; Cesaro, G.; Ragone, E.; Mangoni, E.D.; Ruggiero, G. Hepatic Fibrosis Plays a Central Role in the Pathogenesis of Thrombocytopenia in Patients with Chronic Viral Hepatitis. Br. J. Haematol. 2001, 113, 590–595. [Google Scholar] [CrossRef] [Scilit]
- Weksler, B.B. Review Article: The Pathophysiology of Thrombocytopenia in Hepatitis C Virus Infection and Chronic Liver Disease. Aliment. Pharmacol. Ther. 2007, 26, 13–19. [Google Scholar] [CrossRef] [Scilit]
- Violi, F.; Pignatelli, P.; Cammisotto, V. Platelet Defects in Cirrhosis: Fact or Fiction. J. Hepatol. 2023, 79, e197–e198. [Google Scholar] [CrossRef] [Scilit]
- de Avila, L.; Weinstein, A.A.; Estep, J.M.; Curry, M.P.; Golabi, P.; Escheik, C.; Birerdinc, A.; Stepanova, M.; Gerber, L.; Younossi, Z.M. Cytokine Balance Is Restored as Patient-Reported Outcomes Improve in Patients Recovering from Chronic Hepatitis C. Liver Int. 2019, 39, 1631–1640. [Google Scholar] [CrossRef] [Scilit]
- Doyle, M.A.; Galanakis, C.; Mulvihill, E.; Crawley, A.; Cooper, C.L. Hepatitis C Direct Acting Antivirals and Ribavirin Modify Lipid but Not Glucose Parameters. Cells 2019, 8, 252. [Google Scholar] [CrossRef] [Scilit]
- Ozdogan, O.; Yaras, S.; Ates, F.; Ucbilek, E.; Sezgin, O.; Altintas, E. The Impact of Direct-Acting Antiviral Treatment on Lipid Metabolism and Insulin Resistance in Chronic Hepatitis C Patients: Temporary? Permanent? Turk. J. Gastroenterol. 2020, 31, 384–392. [Google Scholar] [CrossRef] [Scilit]
- Xia, F.; Zeng, Q.; Chen, J. Circulating Brain-Derived Neurotrophic Factor Dysregulation and Its Linkage with Lipid Level, Stenosis Degree, and Inflammatory Cytokines in Coronary Heart Disease. J. Clin. Lab. Anal. 2022, 36, e24546. [Google Scholar] [CrossRef] [Scilit]
- Liu, L.; Hao, M.; Yu, H.; Tian, Y.; Yang, C.; Fan, H.; Zhao, X.; Geng, F.; Mo, D.; Xia, L.; et al. The Associations of Brain-Derived Neurotrophic Factor (Bdnf) Levels with Psychopathology and Lipid Metabolism Parameters in Adolescents with Major Depressive Disorder. Eur. Arch. Psychiatry Clin. Neurosci. 2026, 276, 771–782. [Google Scholar] [CrossRef] [Scilit]
- Schijman, A.; Colina, R.; Mukomolov, S.; Kalinina, O.; Garcia, L.; Broor, S.; Bhupatiraju, A.V.; Karayiannis, P.; Khan, B.; Mogdasy, C.; et al. Comparison of Hepatitis C Viral Loads in Patients with or without Coinfection with Different Genotypes. Clin. Diagn. Lab. Immunol. 2004, 11, 433–435. [Google Scholar] [CrossRef] [Scilit]
- Pawlotsky, J.M.; Roudot-Thoraval, F.; Bastie, A.; Pellet, C.; Duval, J.; Dhumeaux, D. Are Hepatitis C Virus Genotypes 1a and 1b So Different? Hepatology 1996, 23, 1289–1291. [Google Scholar] [CrossRef]
- Levitt, D.G.; Levitt, M.D. Human Serum Albumin Homeostasis: A New Look at the Roles of Synthesis, Catabolism, Renal and Gastrointestinal Excretion, and the Clinical Value of Serum Albumin Measurements. Int. J. Gen. Med. 2016, 9, 229–255. [Google Scholar] [CrossRef] [Scilit]
- Li, H.; Huang, M.H.; Jiang, J.D.; Peng, Z.G. Hepatitis C: From Inflammatory Pathogenesis to Anti-Inflammatory/Hepatoprotective Therapy. World J. Gastroenterol. 2018, 24, 5297–5311. [Google Scholar] [CrossRef] [Scilit]
- Suwa, M.; Kishimoto, H.; Nofuji, Y.; Nakano, H.; Sasaki, H.; Radak, Z.; Kumagai, S. Serum Brain-Derived Neurotrophic Factor Level Is Increased and Associated with Obesity in Newly Diagnosed Female Patients with Type 2 Diabetes Mellitus. Metabolism 2006, 55, 852–857. [Google Scholar] [CrossRef] [Scilit]
- Levinger, I.; Goodman, C.; Matthews, V.; Hare, D.L.; Jerums, G.; Garnham, A.; Selig, S. Bdnf, Metabolic Risk Factors, and Resistance Training in Middle-Aged Individuals. Med. Sci. Sports Exerc. 2008, 40, 535–541. [Google Scholar] [CrossRef] [Scilit]
- Gajewska, E.; Sobieska, M.; Lojko, D.; Wieczorowska-Tobis, K.; Suwalska, A. Obesity Itself Does Not Influence Bdnf Serum Levels in Adults. Eur. Rev. Med. Pharmacol. Sci. 2014, 18, 3246–3250. [Google Scholar]
- Sen, S.; Duman, R.; Sanacora, G. Serum Brain-Derived Neurotrophic Factor, Depression, and Antidepressant Medications: Meta-Analyses and Implications. Biol. Psychiatry 2008, 64, 527–532. [Google Scholar] [CrossRef] [Scilit]
- Komulainen, P.; Pedersen, M.; Hanninen, T.; Bruunsgaard, H.; Lakka, T.A.; Kivipelto, M.; Hassinen, M.; Rauramaa, T.H.; Pedersen, B.K.; Rauramaa, R. Bdnf Is a Novel Marker of Cognitive Function in Ageing Women: The Dr’s Extra Study. Neurobiol. Learn. Mem. 2008, 90, 596–603. [Google Scholar] [CrossRef] [Scilit]
- Shafiee, A.; Jafarabady, K.; Rafiei, M.A.; Beiky, M.; Seighali, N.; Golpayegani, G.; Jalali, M.; Abhari, F.S.; Bahri, R.A.; Safari, O.; et al. Effect of Alcohol on Brain-Derived Neurotrophic Factor (Bdnf) Blood Levels: A Systematic Review and Meta-Analysis. Sci. Rep. 2023, 13, 17554. [Google Scholar] [CrossRef] [Scilit]
- Zhang, X.Y.; Tan, Y.L.; Chen, D.C.; Tan, S.P.; Yang, F.D.; Zunta-Soares, G.B.; Soares, J.C. Effects of Cigarette Smoking and Alcohol Use on Neurocognition and Bdnf Levels in a Chinese Population. Psychopharmacology 2016, 233, 435–445. [Google Scholar] [CrossRef] [Scilit]

Disclaimer/Publisher’s Note: The statements, opinions and data contained in all publications are solely those of the individual author(s) and contributor(s) and not of MDPI and/or the editor(s). MDPI and/or the editor(s) disclaim responsibility for any injury to people or property resulting from any ideas, methods, instructions or products referred to in the content. |
© 2026 by the authors. Licensee MDPI, Basel, Switzerland. This article is an open access article distributed under the terms and conditions of the Creative Commons Attribution (CC BY) license.