


Abstract
The study aims to analyze comprehensive effects of site quality class (SQC), stand density index (SDI), and species composition (SC) on biomass growth. Based on 5872 observations from 2040 permanent sample plots of Chinese fir (Cunninghamia lanceolata (Lamb.) Hook.) plantations from successive national forest resource inventories, five classical growth equations were employed and nonlinear regression and dummy variables were used for modeling. A dominant height (DH) growth model was first developed to determine SQC, followed by a series of stand biomass (SB) growth models incorporating SQC, SDI, and SC (pure vs. mixed stands). Growth differences among different classes or categories were analyzed using inflection age and optimal rotation age. The results show that Korf equation performed best for both DH and SB growth models; SDI contributed the most to SB growth, followed by SQC, with their interaction accounting for over half of the total contribution. Mixed stands grew faster than pure stands; higher SQC was associated with faster growth and earlier attainment of inflection age and optimal rotation age. The productivity increased with rising SDI, but the rate of increase gradually diminished. Different optimal rotation ages should be determined for pure and mixed stands across different SQCs. Reasonable adjustment of harvesting age and control of stand density represent the greatest potential for improving forest productivity.
1. Introduction
Forest biomass is a core indicator in forest resource monitoring at various levels [1] and an important parameter in global forest resource assessments [2]. In the context of global efforts to address climate change, accurately estimating the dynamics of forest biomass and carbon storage is of paramount importance [3,4].
Methods for estimating forest biomass and carbon storage can be broadly categorized into statistical modeling and process-based modeling approaches [5], with statistical modeling being the most widely applied [6,7,8,9]. In recent years, with the implementation of carbon peak and carbon neutrality strategy, the potential of forest carbon sequestration has gradually become a focus of attention. Assessing forest carbon sequestration potential requires an understanding of the growth processes of different forest types, particularly plantations [8,9]. Since accurately simulating the growth process of forests requires data based on long-term historical observations, the research on forest growth processes, except for a few based on stem analysis data [10,11], is mostly conducted based on the permanent plot data from continuous national forest inventories (NFIs) [6,7,8,9,12,13,14].
The NFIs data were mainly used to study the population average growth processes of different forest types [8,9] for estimating forest productivity and carbon sequestration potential at provincial and national levels. However, they are insufficient to provide a basis for scientific forest management. Forest managers need to understand the growth processes of different forest types and be aware of the factors that affect forest growth. A large number of studies have shown that forest growth is influenced by factors such as site conditions [6,7,15,16,17], stand density [7,15,16,17,18], and tree species composition [19,20,21,22]. Therefore, investigating the comprehensive effects of these factors on forest biomass growth, quantifying their respective contributions, and revealing the growth patterns of different forest types under various site conditions have significant practical implications.
Chinese fir (Cunninghamia lanceolata (Lamb.) Hook.) is a high-quality timber species endemic to China, distributed in 16 provinces, and its plantations rank first in both area and growing stock among planted forests in the country. According to the ninth National Forest Inventory (NFI) [23], the area of Chinese fir plantations is 9.90 million hectares, with a growing stock of 755 million cubic meters, accounting for 17% and 22% of the national total for planted arboreal forests, respectively. There are numerous research achievements related to the growth of Chinese fir forests, which primarily focus on the effects of site conditions and stand density [15,16,17,18,24,25,26,27], species mixing [19,20,21,22], density management [28], and the effects of successive planting [29]. Studies on the entire growth process of Chinese fir plantations are scarce [30,31], and their territorial scope is also limited. For example, the study by Li et al. [30] was confined to Huitong County in Hunan Province, and the study by Huo et al. [31] was also restricted to Hunan Province, not covering various site quality classes. That is to say, there currently exists a research gap concerning the biomass growth process of Chinese fir plantations and the comprehensive effects of site quality, stand density, and species composition—specifically for Chinese fir plantations situated across varying site quality and stand density classes throughout the species’ national distribution range.
The main objectives of this study are as follows: taking Chinese fir plantations in the whole country as the research object, based on successive permanent plot data sets since the sixth NFI, selecting five classic growth equations [32], and employing methods such as nonlinear weighted regression [33] and dummy variable modeling [34], this study first constructs a dominant height growth model using the guide curve method to determine the site quality class for each plot. Subsequently, a series of biomass growth models incorporating factors such as site quality, stand density, and tree species composition are developed. Through the coefficient of determination (fit index) of the models and growth model characteristics including the inflection age and optimal rotation age, the contribution of each factor and its comprehensive effect on the growth process are quantitatively analyzed. The results are expected to provide a reference for guiding scientific forest management and assessing forest productivity potential.
2. Materials and Methods
2.1. Data Collection
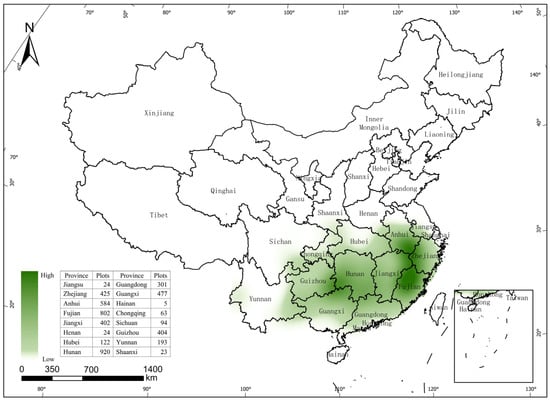
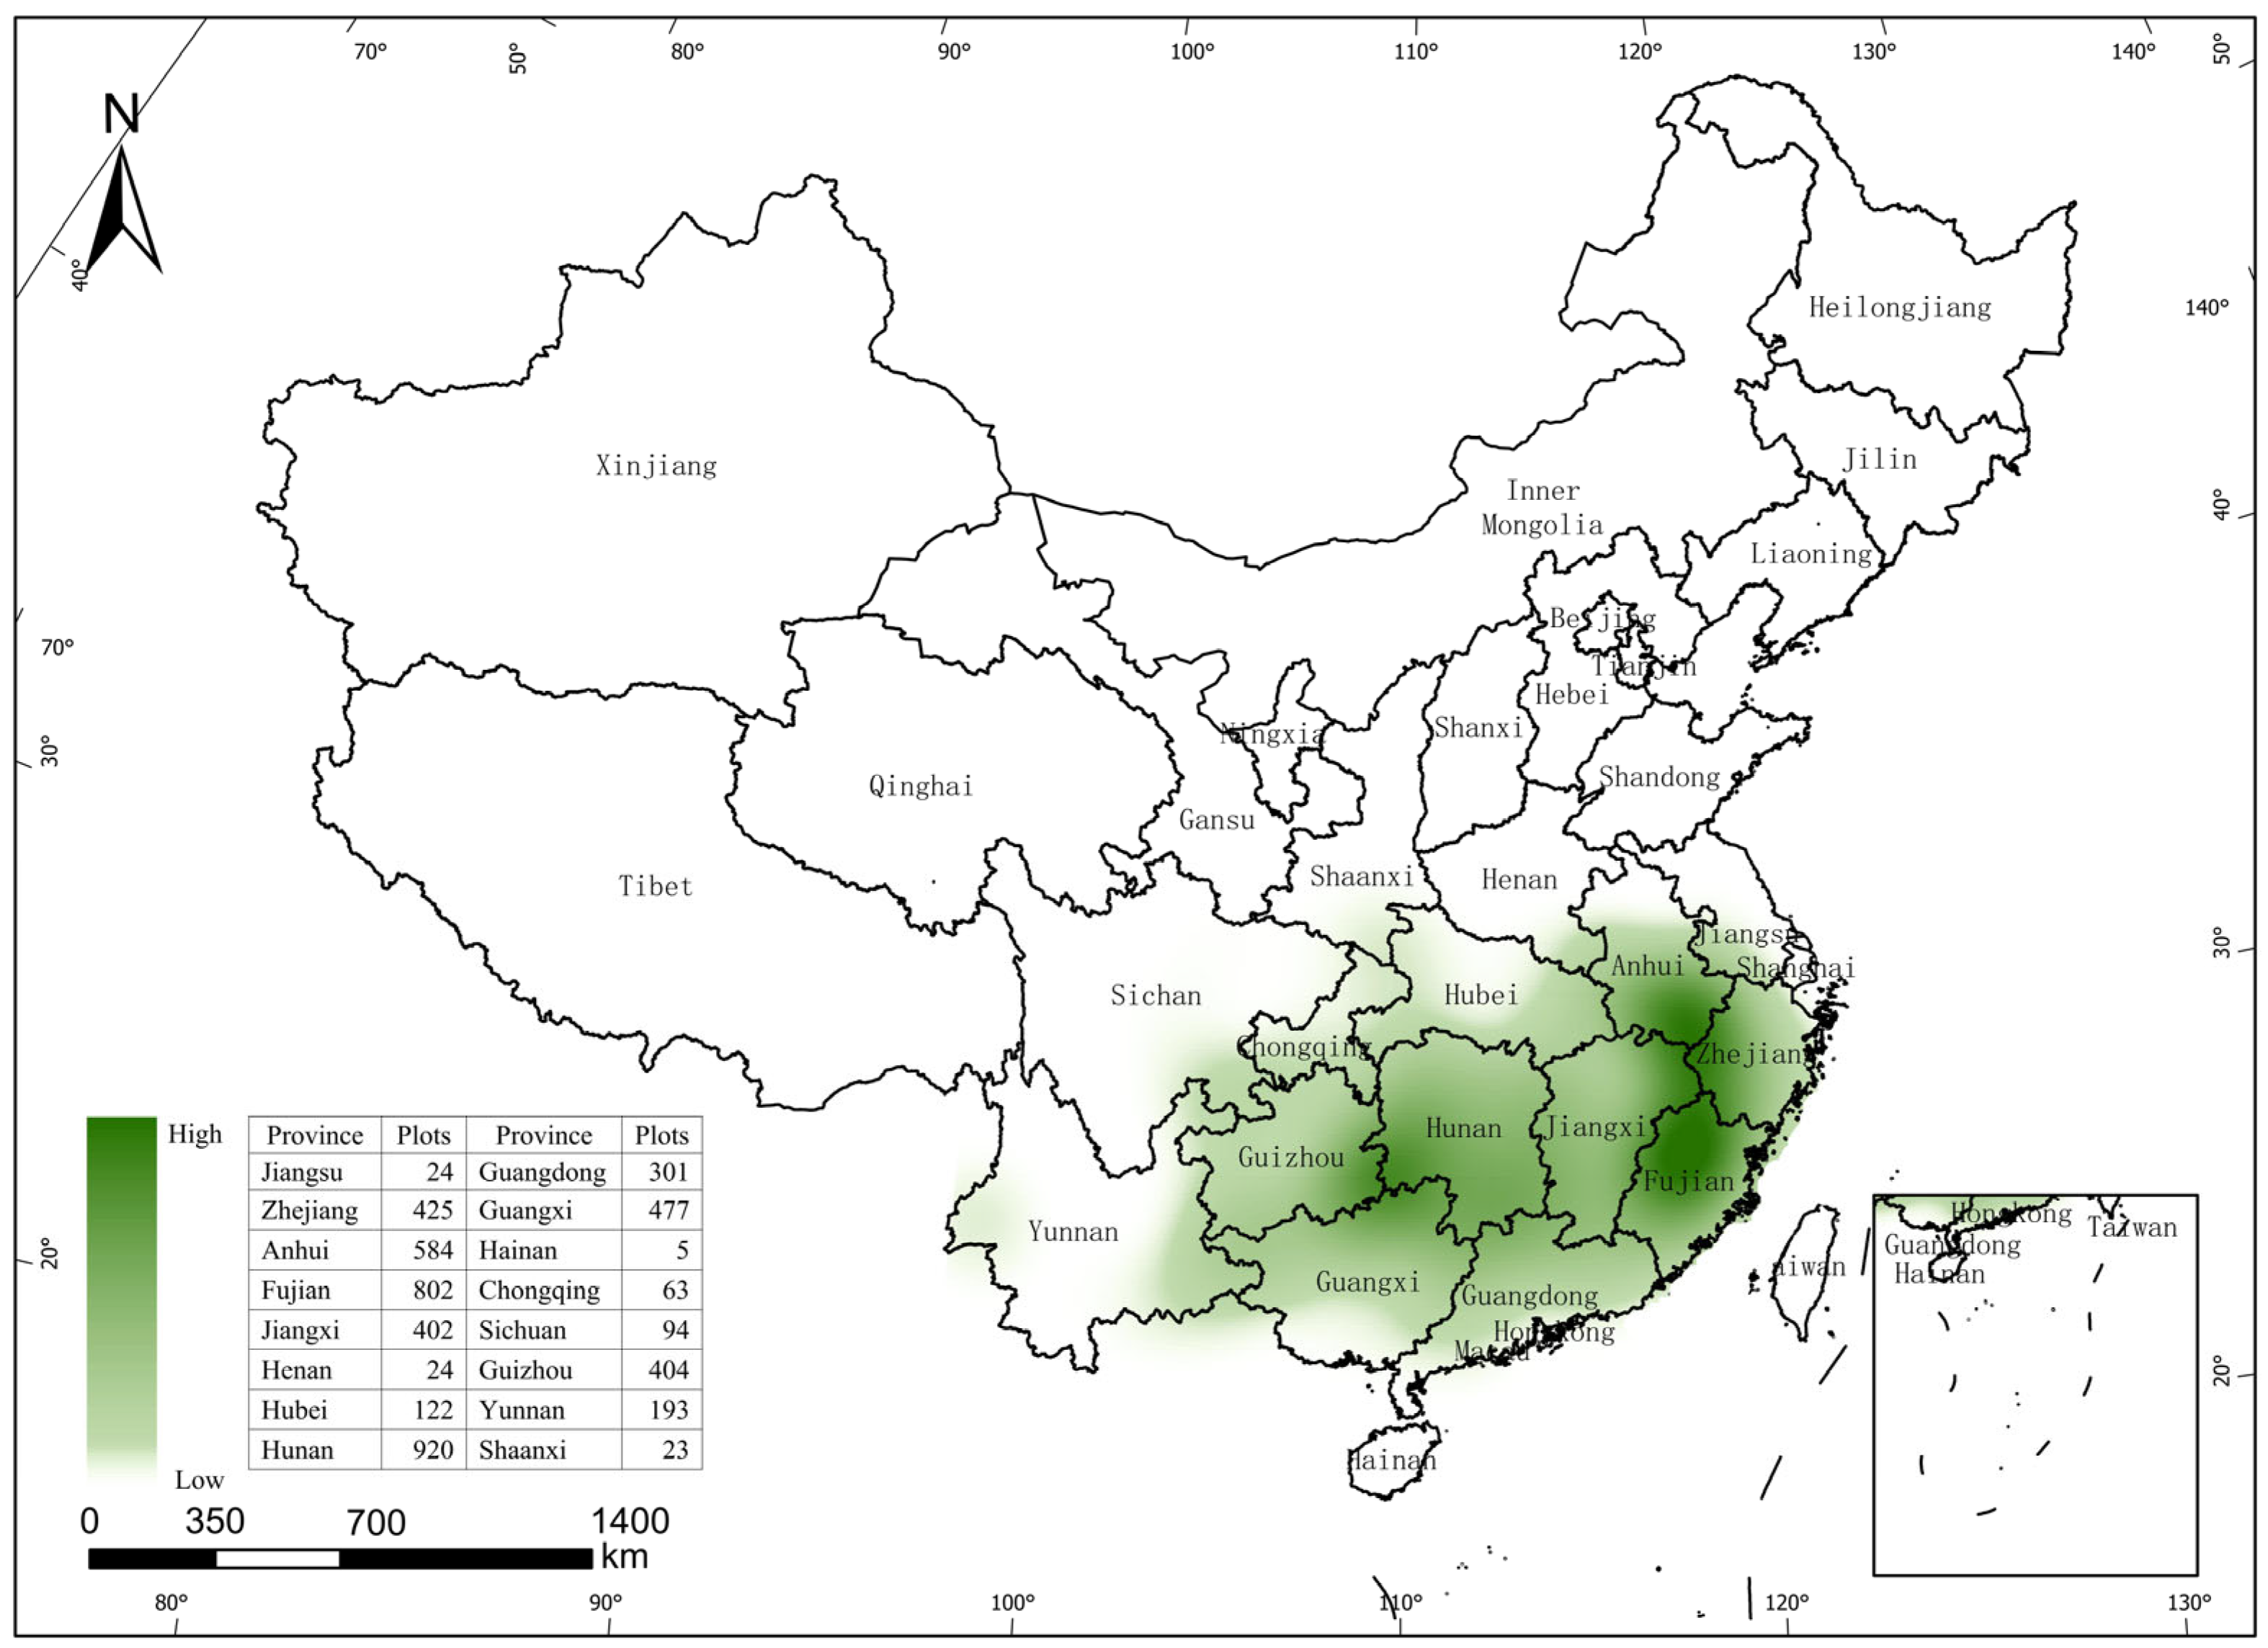
The data sets used in this study were obtained from the sixth to ninth NFIs (1999–2018 NFI) and the 2021–2022 Integrated Forest and Grassland Ecological Monitoring Program (2021–2022 IFGEM). A total of 4864 permanent plots were collected (see Figure 1), all of which were from Chinese fir plantations, encompassing both pure stands (Chinese fir accounting for ≥65% of stand volume) and mixed stands with broadleaved species (both Chinese fir and broadleaved species accounting for 35%–65%). The area of plots is 667 m2 or 800 m2. For each plot, diameter at breast height (DBH) was measured for all living trees at each inventory, the heights of 3 to 5 average trees were measured to obtain mean height, and factors such as stand age were investigated and recorded. The 2021–2022 IFGEM data included 2060 permanent plots. In addition to measuring DBH for all trees and mean height, tree heights of three dominant trees and three small-diameter trees were measured in each plot, enabling the calculation of stand dominant height. Based on these measurements, dominant height–mean height models, individual tree height–DBH models, and relative tree height curve models could be further developed.
Figure 1.
Distribution of sample plots from Chinese fir plantations in China.
2.2. Data Processing
To meet the needs for biomass growth modeling in this study, the data sets were preprocessed according to the following steps and requirements.
(1) 2021–2022 IFGEM data processing. Using paired height and DBH values from small-diameter trees, average trees, and dominant trees within each plot, individual tree height–DBH regression models were developed. Based on these models, tree height was estimated for each sample tree within the plot. Volume and biomass were then calculated using the corresponding two-variable volume models [35] and biomass models [36] for the tree species (Table 1). Plot-level biomass per hectare and the species composition of growing stock (specifically, the percentage of Chinese fir volume in the total volume) were derived. Stand density index (SDI) was calculated using the number of trees per hectare (N) and the quadratic average DBH (D) according to the formula SDI = N × (D/25)1.6 [37].
Table 1.
Tree volume and biomass models of Chinese fir used in this study.
In addition, dominant height–mean height regression models were developed using paired mean height and dominant height data from these plots [38]. Based on the individual tree height–DBH regression models, relative tree height curve models were further constructed [39] to support subsequent data processing.
(2) 1998–2018 NFI data processing. According to the research of Luo et al. [39], by using the DBH of sample trees and the mean DBH and mean height of a plot, the tree heights of sample trees could be estimated based on a relative tree height curve model; and using the DBH and estimated tree heights of sample trees, the plot’s volume could be calculated with total relative error less than 1%, compared with the volume calculated from all measured tree heights. Therefore, using the relative tree height curve models developed based on 2021–2022 IFGEM data, tree heights were estimated for all sample trees within each plot based on the plot’s mean DBH, mean height and DBH of sample trees. Plot-level biomass per hectare and the species composition of growing stock were then derived using the same methods described above. Dominant height was estimated from mean height for each plot using the established dominant height–mean height regression models in the first step. Stand density index was calculated following the same procedure.
(3) Data selection for growth modeling. Through the aforementioned data processing, multi-period panel data at the plot level were obtained, including stand age (A), mean dominant height (DH), stand biomass (SB), and stand density index (SDI). Unlike experimental sample plots used for scientific research, NFI plots may be subject to anthropogenic disturbances (e.g., thinning, harvesting) and natural disturbances (e.g., fire, other calamities). To eliminate these confounding factors and to reflect the true biomass growth process of Chinese fir plantations as objectively as possible, plots with only one period of NFI data were entirely excluded. Plots with two or more successive measurements but showing obvious disturbance were also removed. Ultimately, 2040 plots with a total of 5782 observations were selected for subsequent growth modeling. Statistical characteristics of the main factors for the modeling sample are presented in Table 2.
Table 2.
Statistics of main factors of modeling sample.
2.3. Dominant Height Modeling
A common indicator reflecting the site quality in plantations is site index, expressed as dominant height at a given reference age, named as base age [40,41]. To determine the site index (SI) or site quality class (SQC) for each plot, dominant height growth models were developed. Based on existing research findings [15,16,32,41], five classical growth equations—Chapman–Richards, Logistic, Gompertz, Schumacher, and Korf—were initially selected as follows:
where y represents dominant height (m), x represents stand age (year), and a, b, c are parameters to be estimated. The growth equation providing the best fit, as determined by the R2 and growth characteristics of the models, was selected as the population average model of dominant height growth, i.e., the SI or SQC guide curve [41].
The commonly used SI is classified into several classes at intervals of 2 m based on the dominant height at base age. If the base age for Chinese fir plantations is set at 30 years, the dominant height at that age ranges from 5 to 25 m, resulting in 10 classes at 2 m intervals. To appropriately reduce the number of site quality classes, this study adopts a classification based on relative dominant height at any given age, dividing it into the following seven classes at 20% intervals: 0.3–0.5 DH (Lowest), 0.5–0.7 DH (Low), 0.7–0.9 DH (Lower), 0.9–1.1 DH (Medium), 1.1–1.3 DH (Higher), 1.3–1.5 DH (High), and 1.5–1.7 DH (Highest). Plots with relative dominant heights below 0.3 DH or above 1.7 DH account for less than 1% of the total and can be excluded as outliers.
2.4. Stand Biomass Modeling
Forest productivity is indicated by the average annual biomass increment; thus, biomass growth modeling is the basis for productivity assessment [42,43]. To analyze the effects of site quality, stand density, and species composition on forest growth, this study developed a series of biomass growth models by progressively incorporating SQC, SDI, and tree species composition (SC), building upon the construction of a population average biomass growth model.
Step 1: Development of a population average biomass growth model. The five classical growth equations were evaluated based on the R2 and growth characteristics of the models, and the equation providing the best fit was selected as the base model.
Step 2: Development of a multi-factor biomass growth model. Three main influencing factors are involved in this study: SDI, SQC, and SC, where SC is divided into two categories—pure stands (Chinese fir > 65%) and mixed stands (Chinese fir 35%–65%). While SDI is a quantitative variable, SQC and SC are indicative or categorical variables. Among the total 5872 observations, 5063 are from pure stands and 809 from mixed stands. The distribution by SQCs is approximately normal, with the largest number of observations in the medium SQC; toward both lower and higher SQCs, the number of observations gradually decreases.
To balance the modeling sample sizes across different categories and classes, and to more accurately reflect the effects of SQC and SC on biomass growth, the 5872 observations were grouped separately by SC and SQC. For each group, the average values of SB and SDI were calculated by stand age. Using these average data, two types of biomass growth models were developed following the above two steps, with indicative variables expressed as dummy variables. The detailed procedures of dummy variable modeling can be found in references [14,34].
Besides the commonly used R2, the model evaluation statistics also include root mean square error (RMSE), relative root mean square error (RMSE%), mean prediction error (MPE), and total relative error (TRE). The specific formulas can be found in references [34,43]. For the final biomass growth model incorporating SQC, SDI, and SC, a 5-fold cross-validation was conducted for model evaluation [9]. To intuitively illustrate the model fitting performance, scatterplots of observed values versus estimated values can be drawn [44].
2.5. Influencing Factor and Growth Characteristics Analysis
The R2 of a regression model can comprehensively reflect the explanatory capacity of the independent variables on the dependent variable; thus it is also named as a fitting index. In this study, building upon the development of a series of biomass growth models, the contribution of different factors to modeling biomass growth was analyzed by comparing the R2 values and their changes across models. The relative influence of each factor was quantified based on its contribution to the increment of R2 values. Additionally, based on the parameter estimates of the biomass growth model and two key characteristic values—inflection age and the age at which the average annual increment reaches its maximum (named as optimal rotation age [32])—differences in biomass or productivity among different classes or categories of the same factor were analyzed. Table 3 presents the inflection ages and the optimal rotation ages for five classical growth equations.
Table 3.
Calculation of inflection age and optimal rotation age of five classical growth equations.
3. Results and Analysis
3.1. Dominant Height Modeling Results
From the dominant height modeling results (Table A1) of the classical growth equations (Equations (1)–(5)), the differences among the five equations were very small; therefore, the Korf equation (Equation (5)) was selected to fit the dominant height growth model.
Step 1: The population average growth model was fitted as the guide curve, with the following results:
where DH is dominant height (m), A is age (year); the R2 of the model was 0.304.
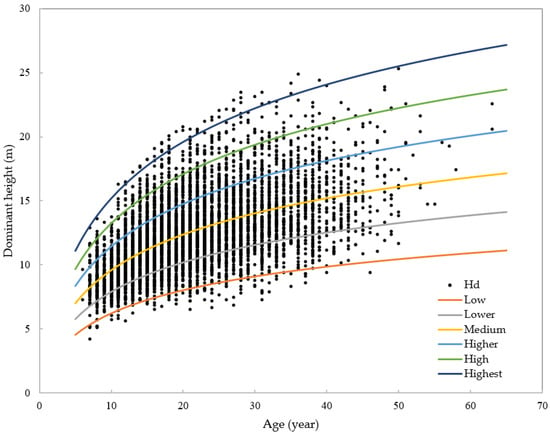
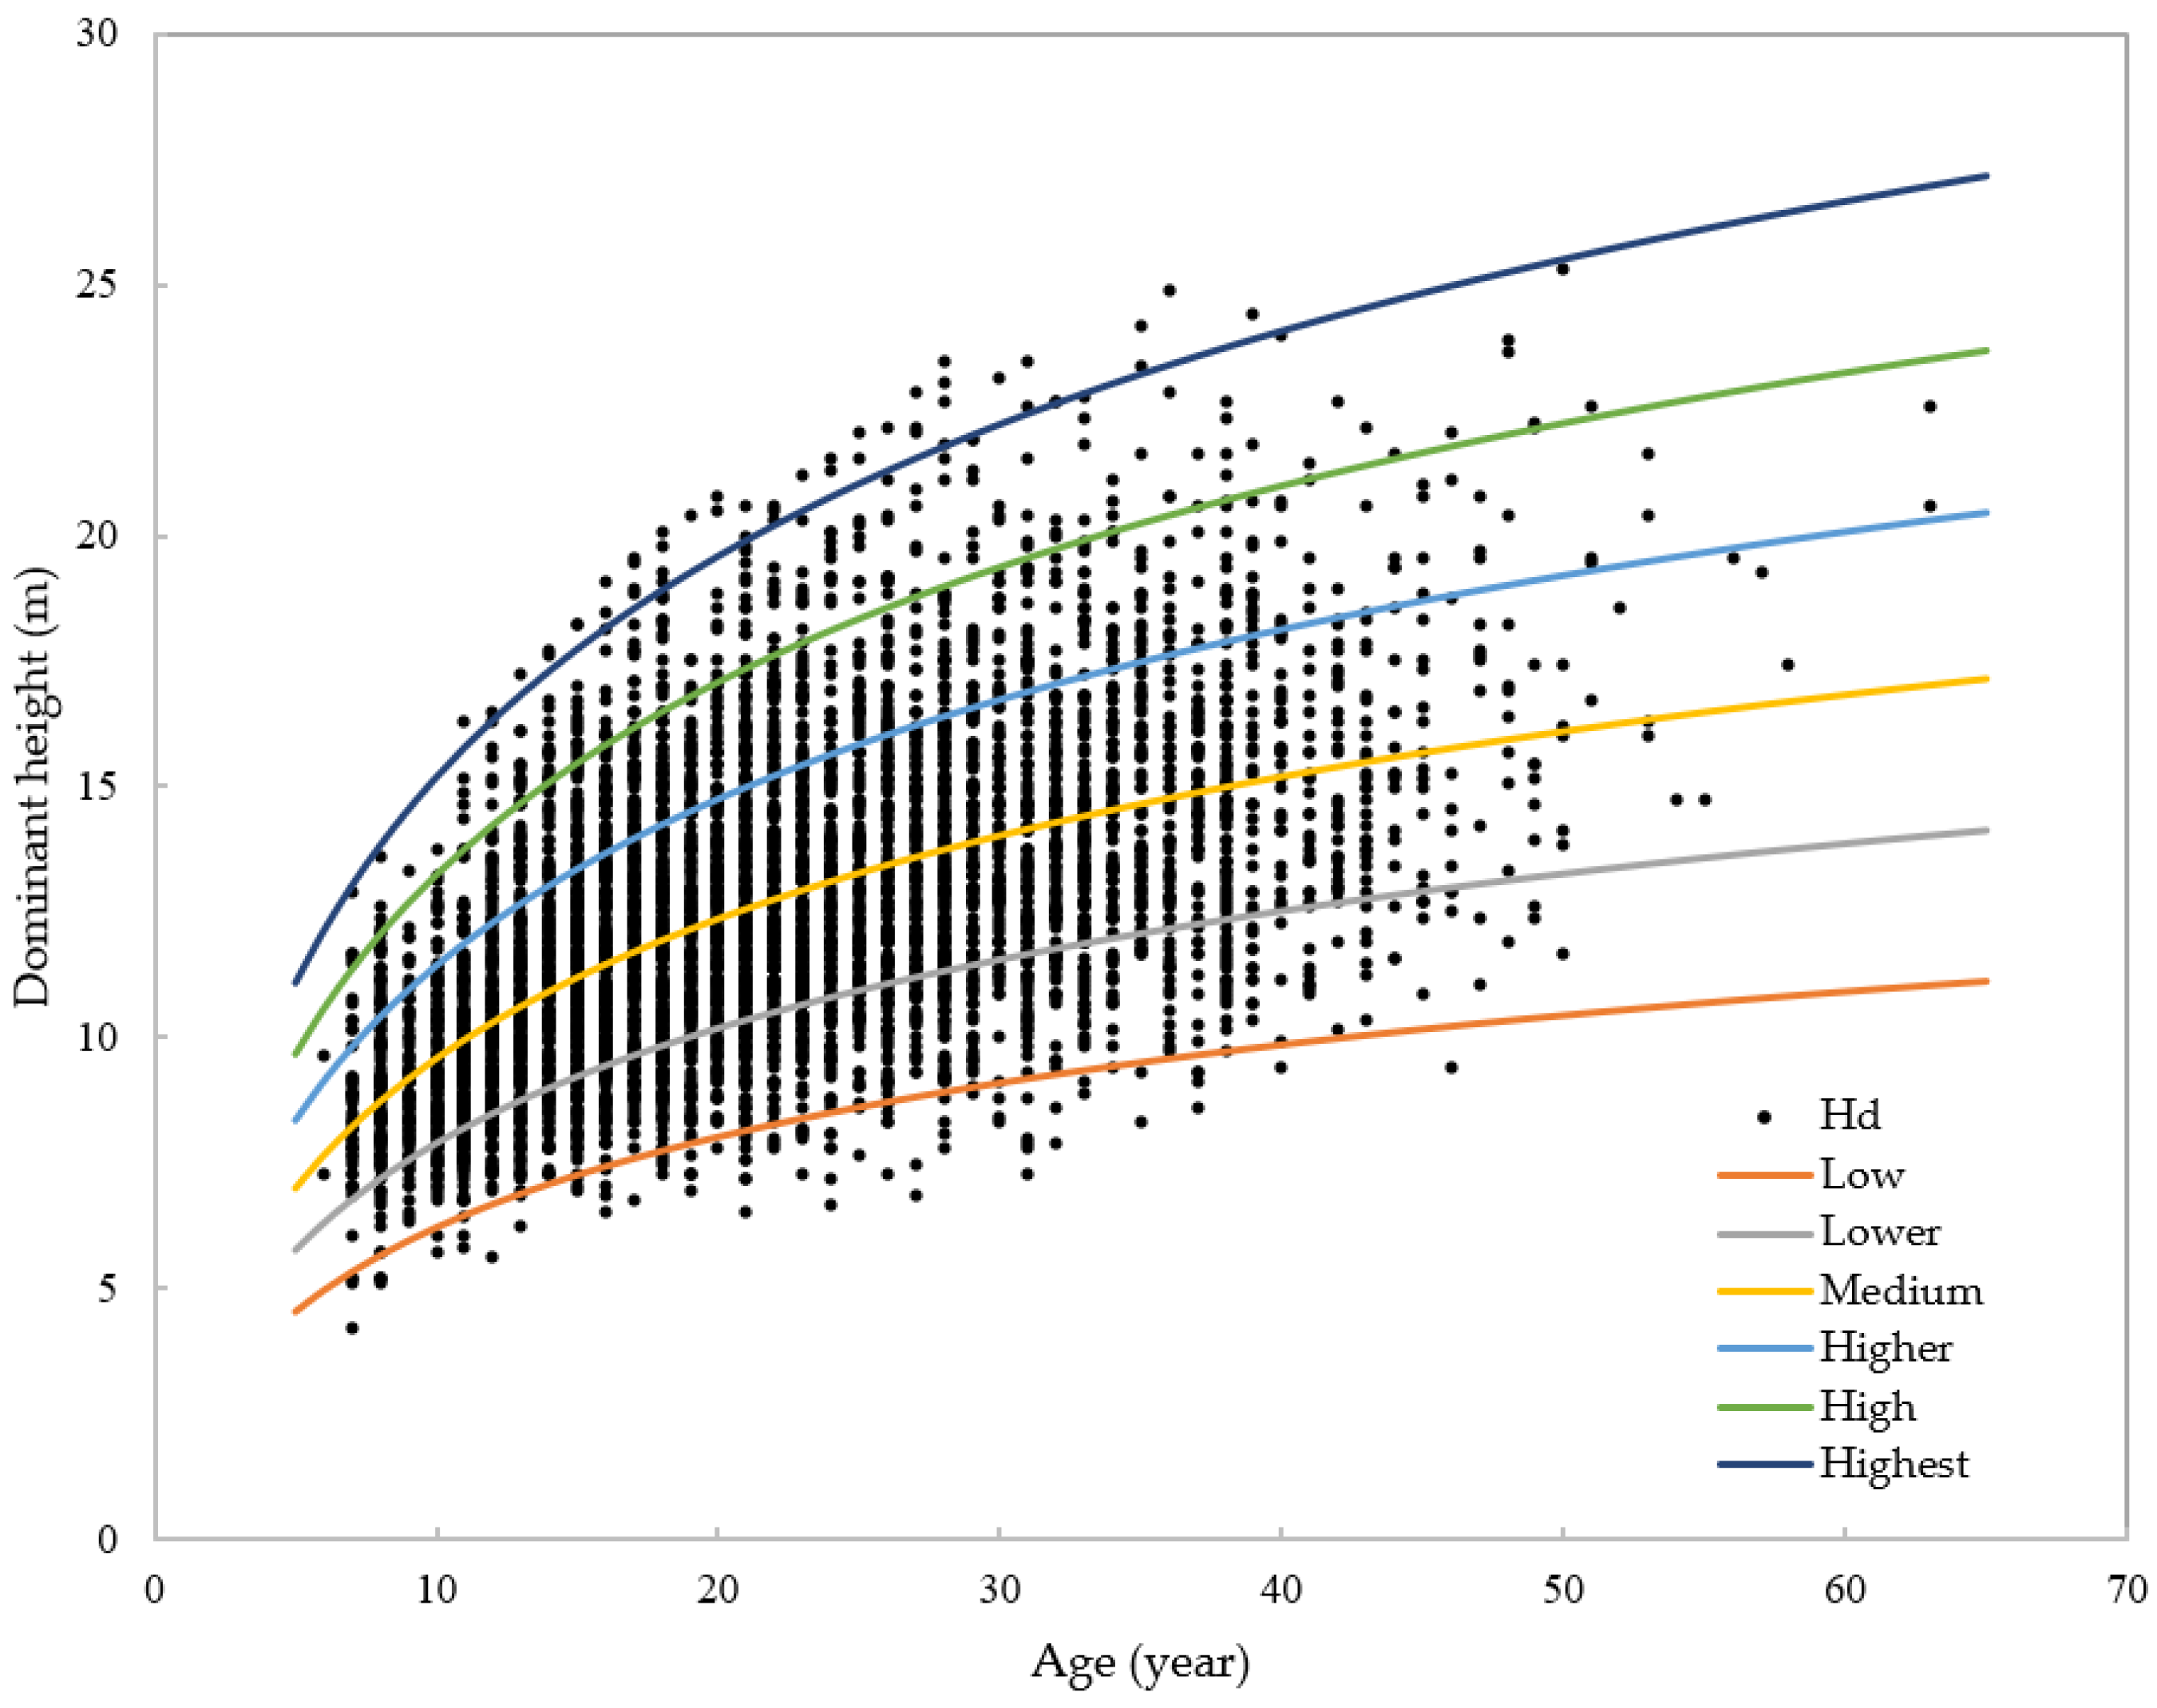
Step 2: Based on the relative magnitudes of the estimated dominant height values, seven SQCs were delineated, with sample sizes of 11, 234, 1798, 2186, 1141, 383, and 103, respectively. There were 16 observations with relative dominant heights greater than 1.7 DH, and none with relative dominant heights less than 0.3 DH. Because the number of observations in the lowest SQC (Lowest) was too small, these observations, together with the 16 observations 1.7 DH and the additional nine observations from the relevant plots, were removed, leaving a remaining sample size of 5836 observations. Taking SQCs as dummy variables (denoted as x1 to x6), and using a dummy variable modeling approach, the dominant height growth model relating parameter a to SQC were fitted (Figure 2), which is as follows:
where xi (i = 1, 2, 3, 4, 5, 6) are dummy variables, representing the SQCs as Low, Lower, Medium, Higher, High, and Highest, respectively. The dummy variable model (7) achieved an R2 of 0.949, RMSE = 0.69 m, RMSE% = 5.52%, MPE = 0.14%, and TRE = −0.00%.
Figure 2.
The growing process of dominant height for Chinese fir plantations on different SQCs. The six colored curves result from model (7).
3.2. Stand Biomass Modeling Results
The 5836 observations were averaged by SC, SQC, and A for SB and SDI, yielding a total of 423 data sets. Through analyzing scatter plots and the initial fitting results, 14 outliers were removed, leaving 407 data sets with the following distribution:
- By SC: the numbers of data sets for pure stands and mixed stands are 247 and 160, respectively;
- By SQC: there are 53, 81, 86, 85, 67, and 35 sets, from Low to Highest, respectively;
- By SDI: if data sets are divided by SDI into five classes: <200, 200–400, 400–600, 600–800, and >800, the numbers of sets are 33, 97, 142, 93, and 42, respectively.
Based on these 407 data sets, the stand biomass growth models were fitted using growth Equations (1)–(5), and the differences among the five equations were also very small (Table A2). After comprehensively considering the R2 and other evaluation statistics (Table A2), as well as the growth characteristics of the equations (Table A3 and Figure A1), the Korf equation (Equation (5)) was again selected as the base model for stand biomass growth. The population average biomass growth model was fitted as follows:
In Equation (8), SB is the stand biomass (Mg ha−1), and A is the stand age (years). Then, the three factors—SC, SQC, and SDI—were sequentially incorporated to construct a series of biomass models. The results are as follows:
In the models (9)–(15), yi (i = 1, 2) are dummy variables representing SC categories of pure stands and mixed stands, respectively, and other symbols are the same as previously defined. All parameter estimates in the equations are statistically significant, with p-values less than 0.05 or t-values greater than 2. Table 4 presents the evaluation statistics for the above eight stand biomass growth models.
Table 4.
The evaluation statistics of eight biomass growth models for Chinese fir plantations.
One point that requires special emphasis is that in Model (15), SC affects both parameters a and c, whereas in Model (9), it affects only parameter c. In fact, attempt was made to set parameter a in Model (9) as a variable parameter using dummy variables yi (i = 1, 2). Although this increased R2 to 0.481, the estimates of parameter a and c for pure stands and mixed stands differed by several times and were unstable; thus, the model was not used. In contrast, although Model (15) has goodness-of-fit indices nearly identical to those of Model (14), the first parameter reflecting the difference between pure and mixed stands differs by 14%, which falls within a normal and expected range and should not be ignored. Consequently, Model (15) should be regarded as the final model incorporating the three influencing factors: SQC, SDI, and SC.
Model (15) was also validated using 5-fold cross-validation, yielding an R2 of 0.845, RMSE = 26.0 Mg ha−1, RMSE% = 25.1%, MPE = 2.47%, and TRE = −0.74%; these values are not significantly different from those reported in Table 4, indicating that the model exhibits good fitting performance.
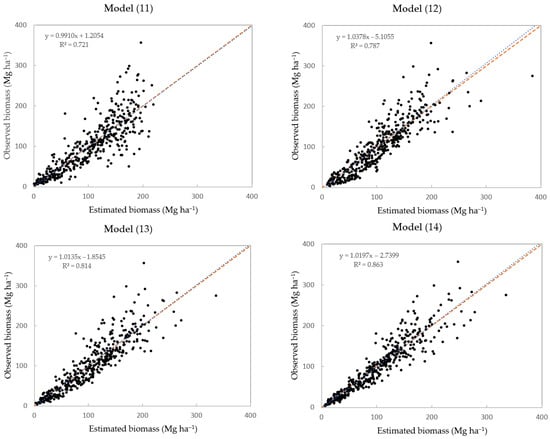
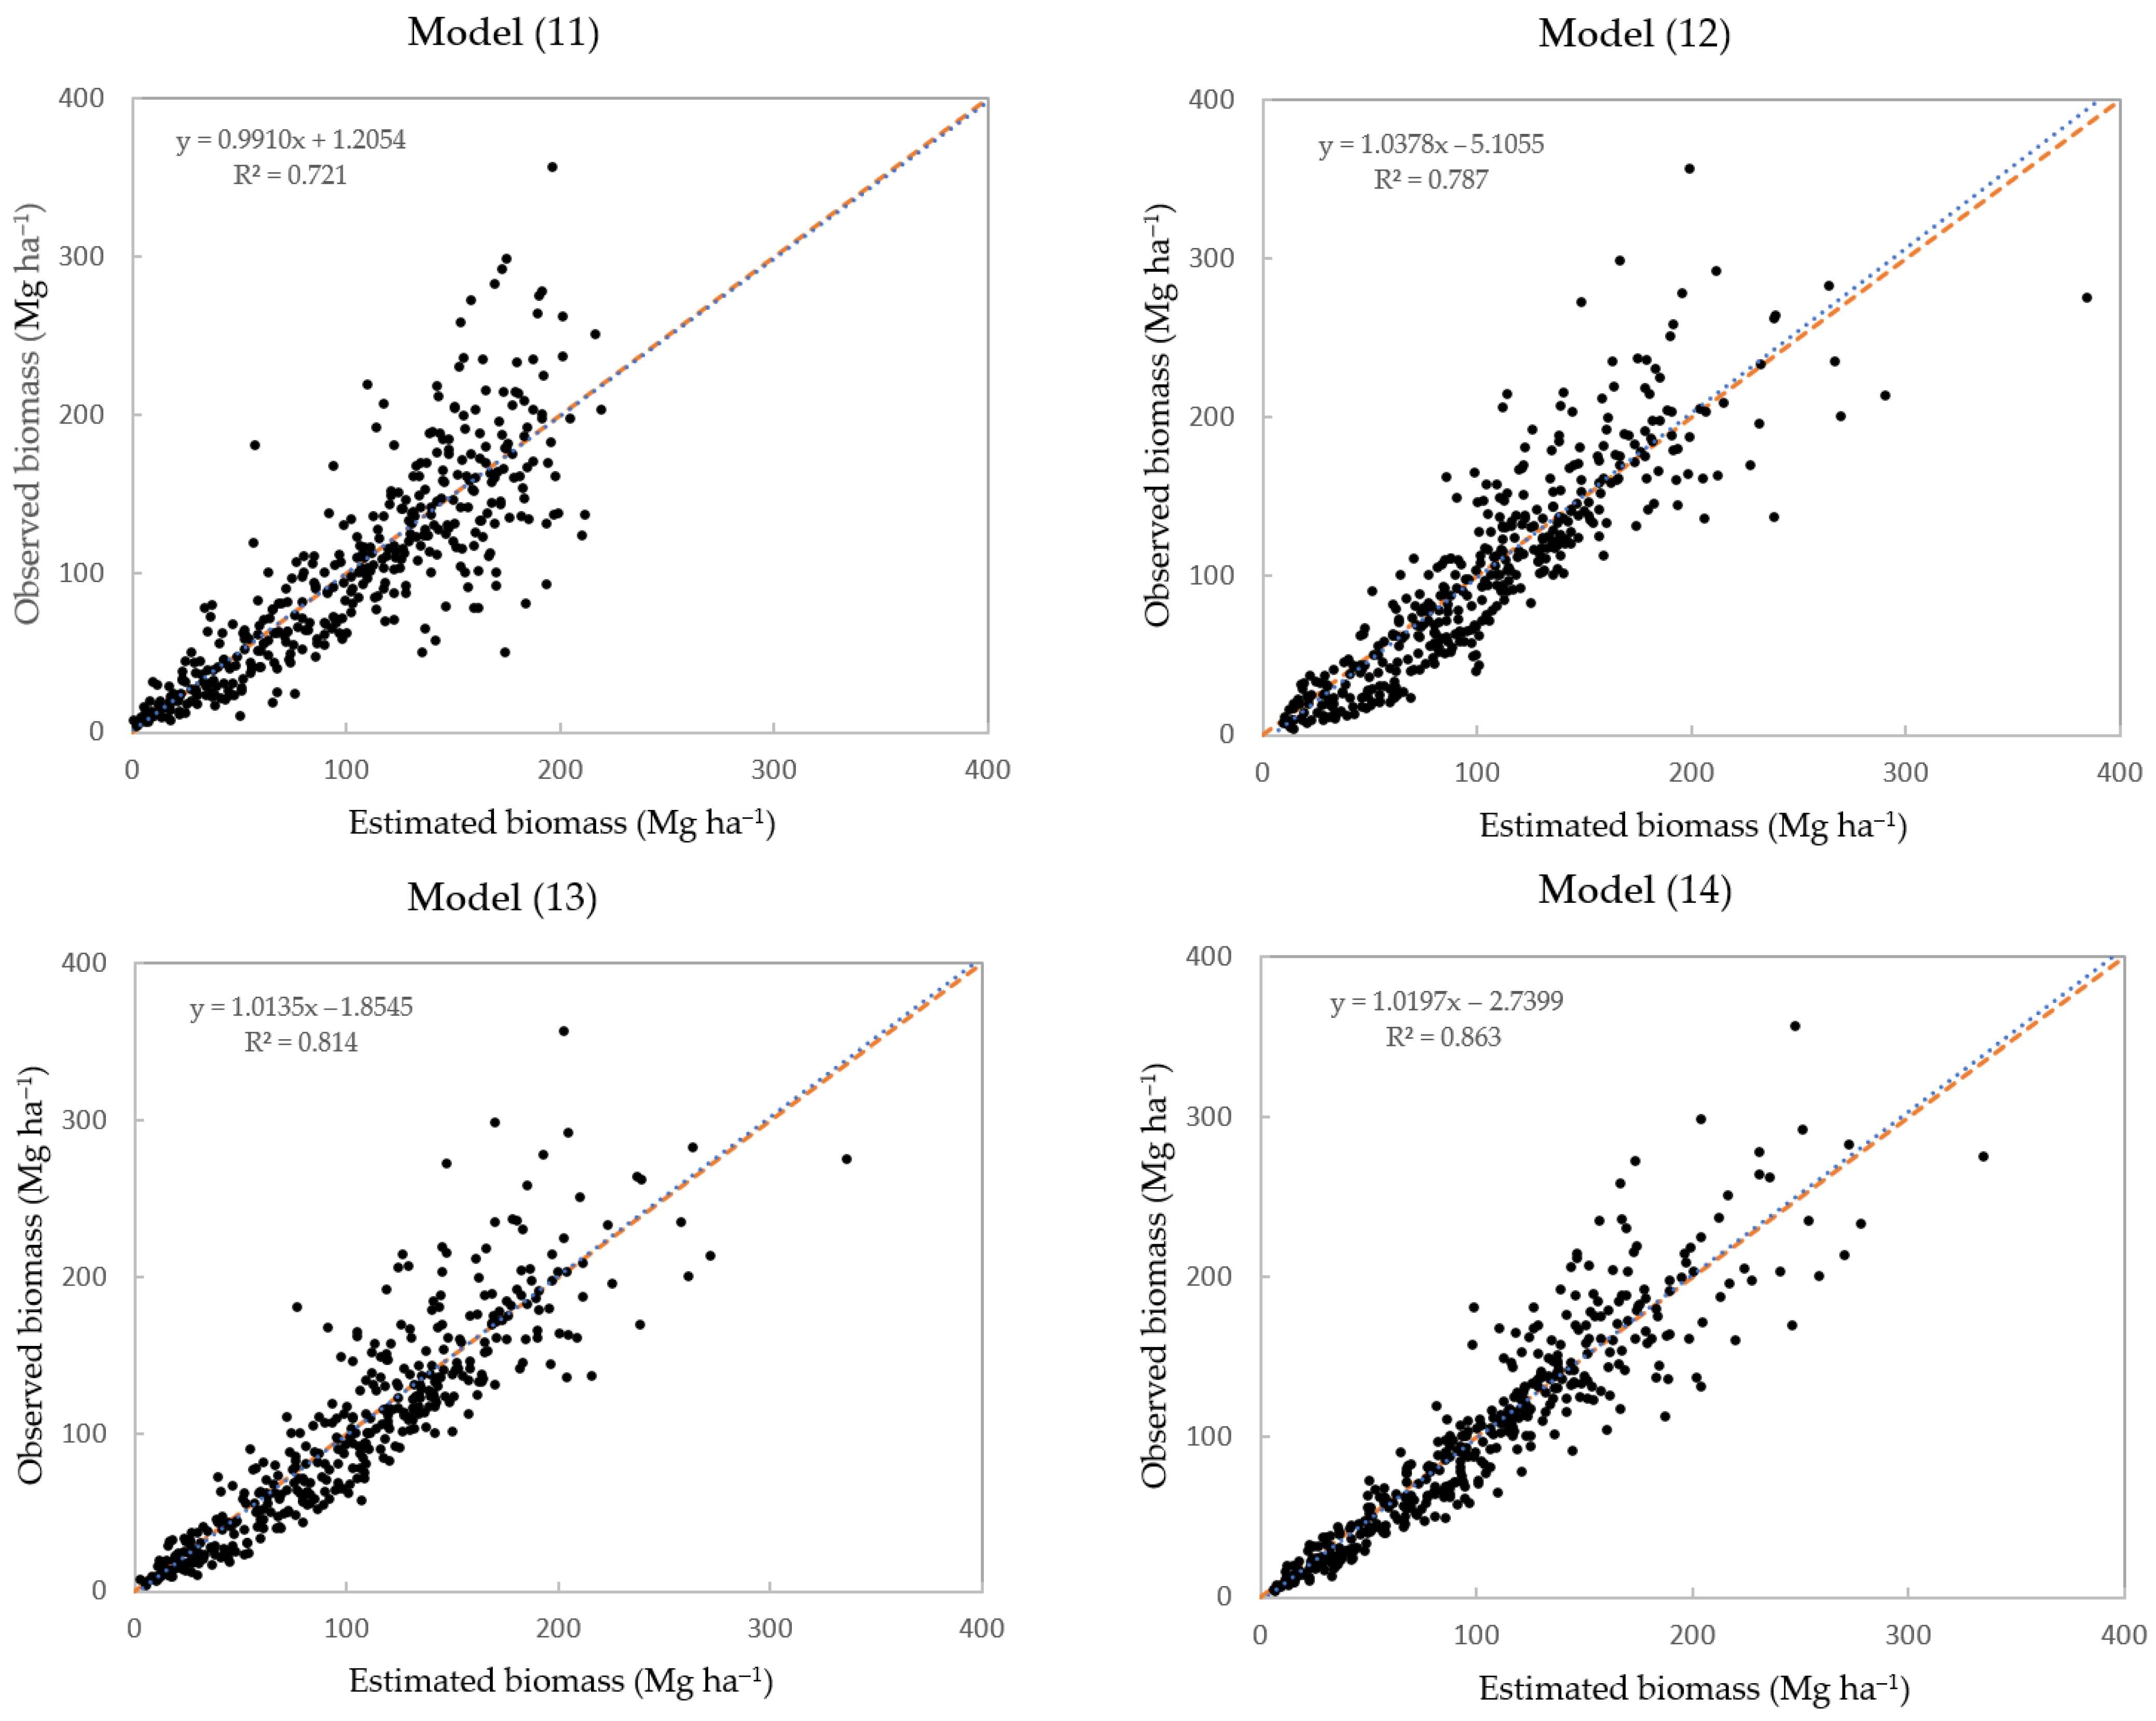
For intuitive comparison, Figure 3 presents the fitting performance of Models (11)–(14), where the closer the red and blue dashed lines are to each other, the better the model performs. If the models are unbiased, then the intercept and slope should not be statistically different from 0 and 1, respectively, according to the F-test criterion. From the test results, the F-values for Models (11)–(14) are 0.01, 1.33, 0.14, and 0.51, respectively, all of which are lower than the critical Fα = 4.60 at the α = 0.01 significance level. This indicates that there are no significant differences between intercept and 0, and between slope and 1 for any of the models. The performance of Model (15) is almost identical to that of Model (14).
Figure 3.
The scatterplots between observed and estimated biomass of four growth models. The dashed red line is y = x, and the dashed blue line is y = ax + b. The closer the two lines are to each other, the better the model performs.
3.3. Contribution of Different Factors to Biomass Growth
The relative contribution of each influencing factor to biomass growth can be evaluated using the R2 of the series of biomass growth models for Chinese fir plantations presented in Table 4. From the R2 values of Models (9), (10), and (12), it can be seen that among the three factors affecting biomass growth, SDI has the greatest effect, followed by SQC, while SC also has a certain degree of influence. Comparing the R2 values of Model (13) with those of Models (10) and (12) further indicates that the interaction between SQC and SDI contributes even more.
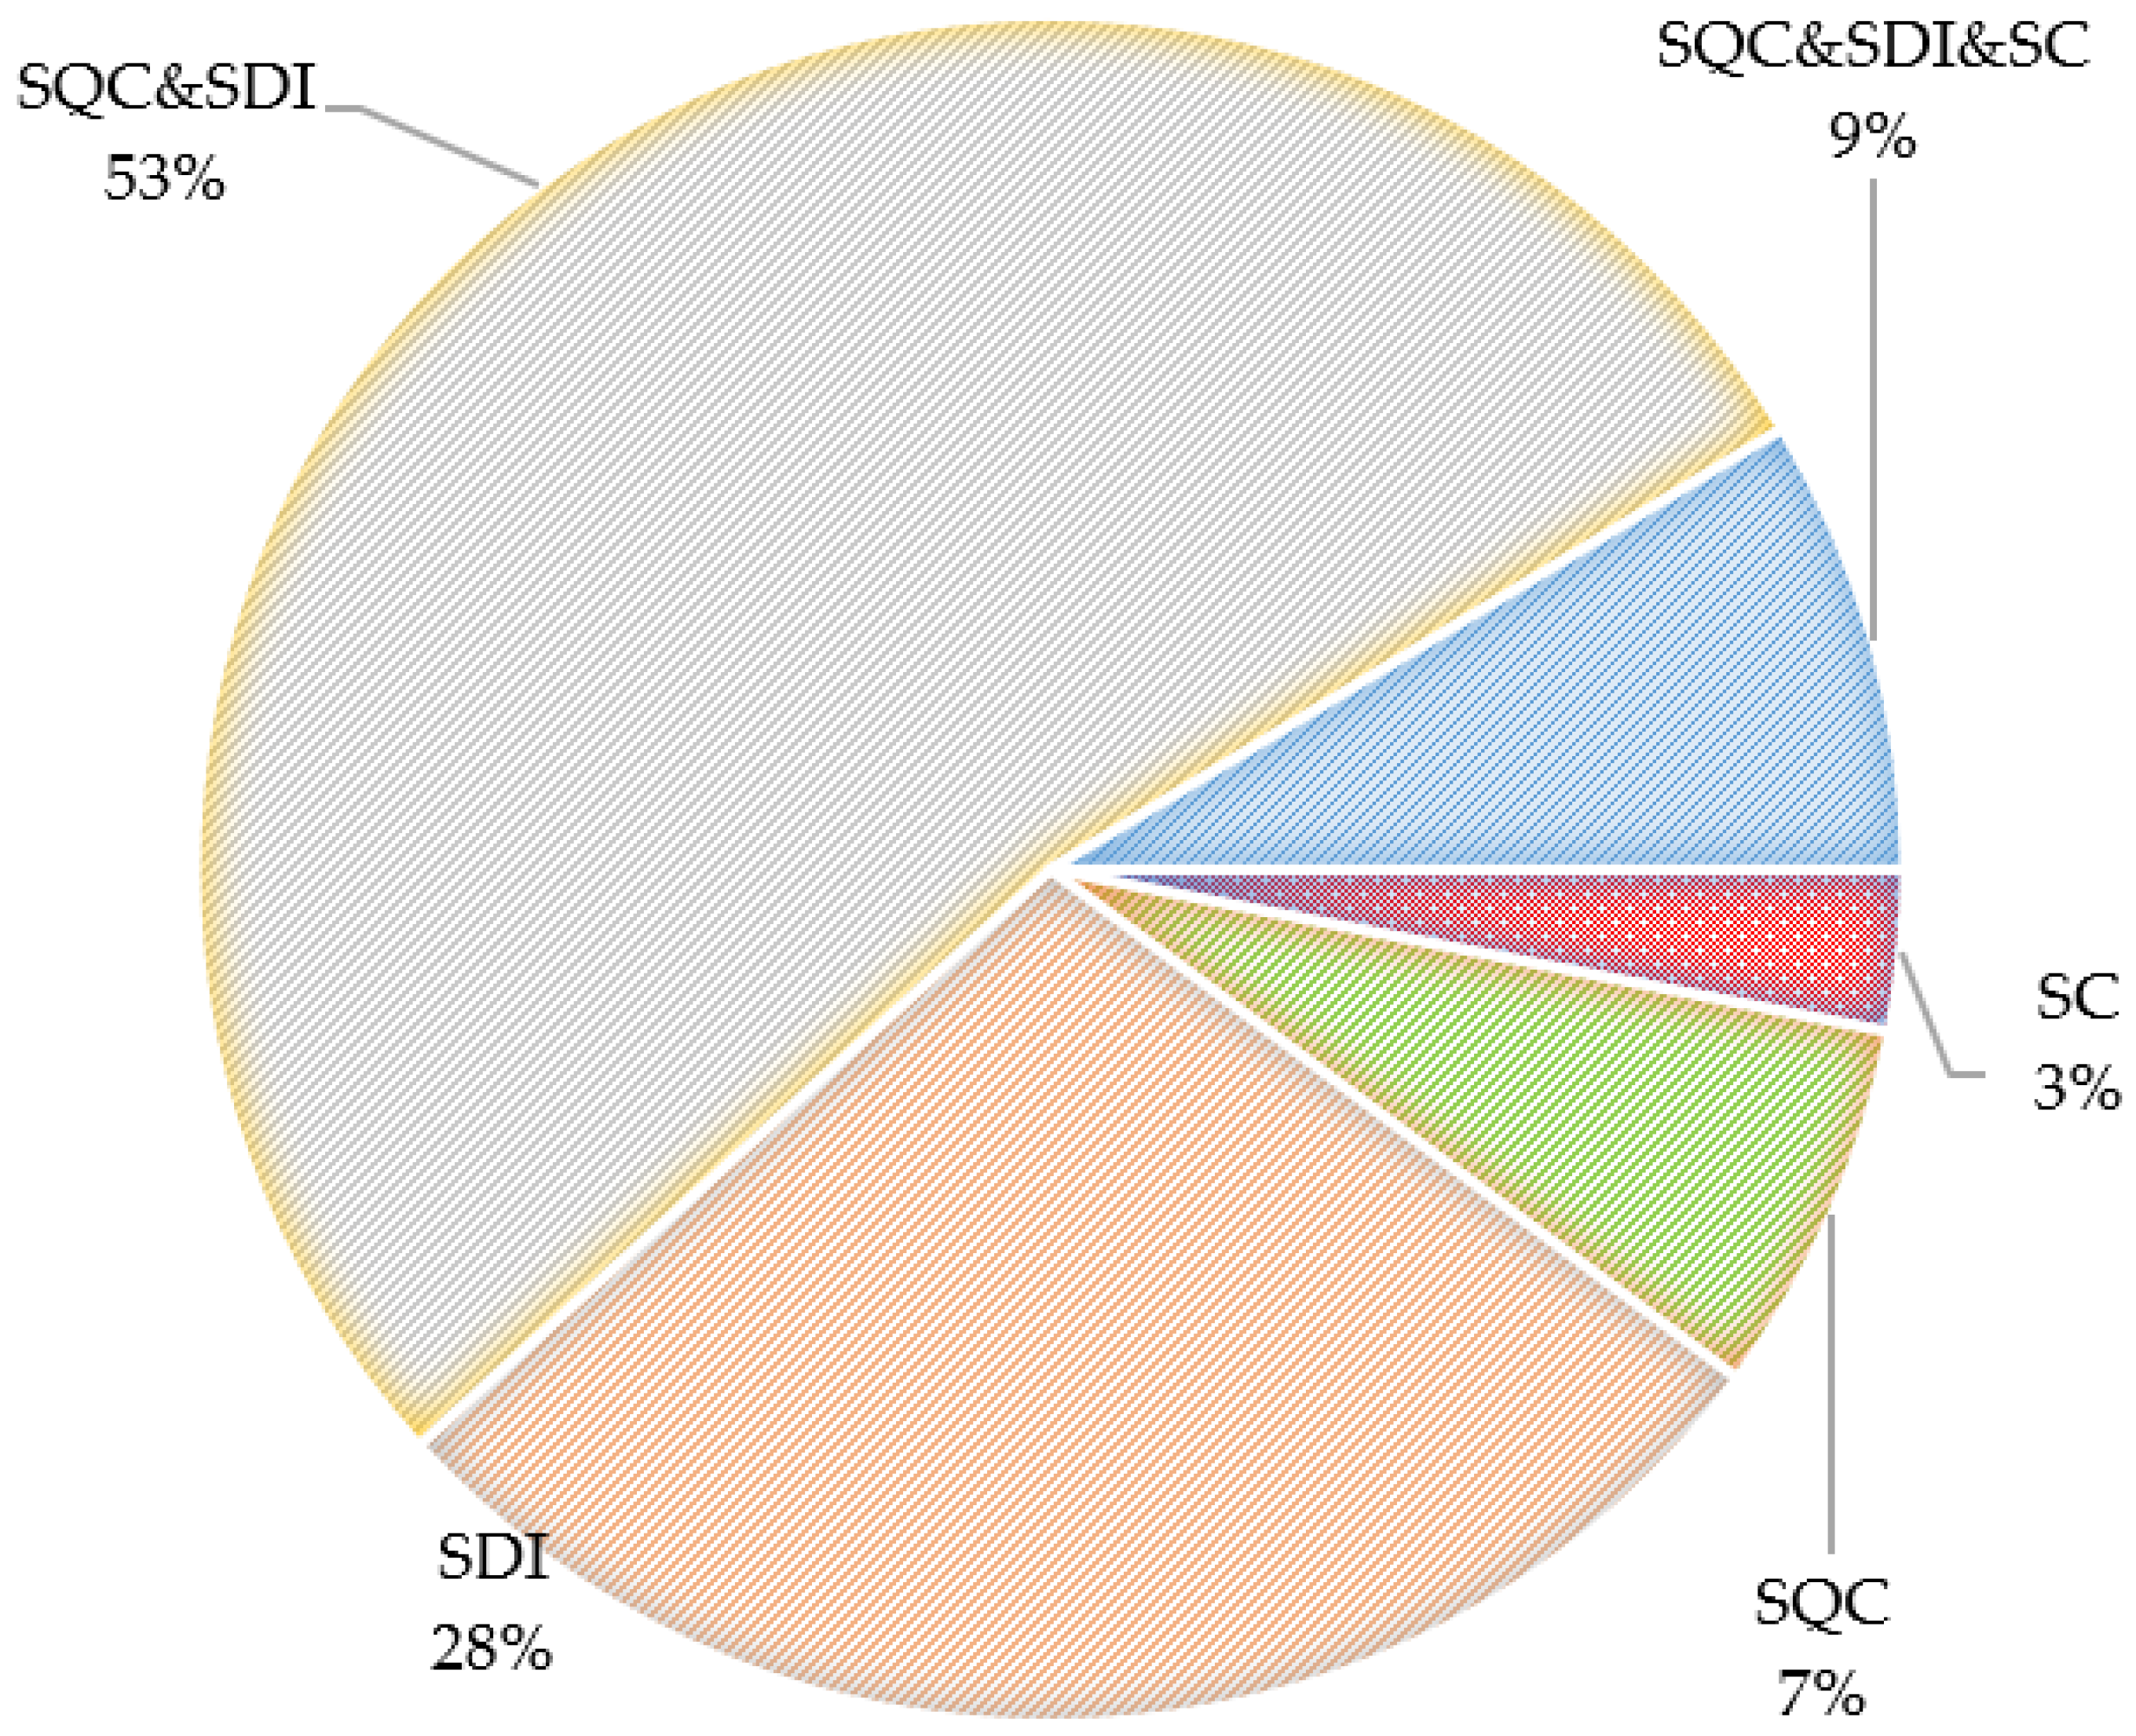
Similarly, by examining the changes in R2 between Model (15) or (14) and Model (13), it can be found that interactions also exist between SC and SQC as well as between SC and SDI. If the increase in R2 values of each model relative to the population average Model (8) is taken to represent the relative contribution of each factor and its interactions, then the independent contribution rates of SDI, SQC, and SC are 28%, 7%, and 3%, respectively; the interaction between SQC and SDI contributes the most, reaching 53%; and the remaining 9% is attributed to the interactions of SC with SQC and SDI (Figure A2).
Since SDI integrates both the number of trees per hectare (N) and the quadratic average DBH (D), it is somewhat similar to stand basal area BA = πN(D/100)2/4. Consequently, SDI is also highly correlated with SQC, SC, and A. If the target variable SB in Models (10) and (11) is replaced by SDI, the fitting R2 values are 0.606 and 0.620, respectively. Precisely because of the high correlation between SDI and SQC, their interaction contributes more than half of the total contribution to biomass growth (Figure A2).
3.4. Analysis of Differences in Growth Processes
Differences in growth processes are analyzed primarily based on the inflection age and the optimal rotation age of the growth model, and it can be seen from Table 3 that the model parameters determining the inflection age and the optimal rotation age are b and c. The series of model fitting results in Table 4 show that parameters b and c are influenced only by SC and SQC. From the analysis in the section above, SDI varies with A, SC, and SQC; therefore, Model (15) is mainly used to analyze the contributions of SDI, SQC, and SC to biomass growth, whereas the analysis of growth differences between different SC categories and SQCs should be based on Model (11). Table 5 presents the inflection ages and optimal rotation ages of Model (11) for pure and mixed Chinese fir plantations under different SQC conditions.
Table 5.
The inflection age and optimal rotation age of biomass growth models for pure and mixed Chinese fir plantations in different site quality classes.
From Table 5, two characteristics of the growth process of Chinese fir plantations can be found.
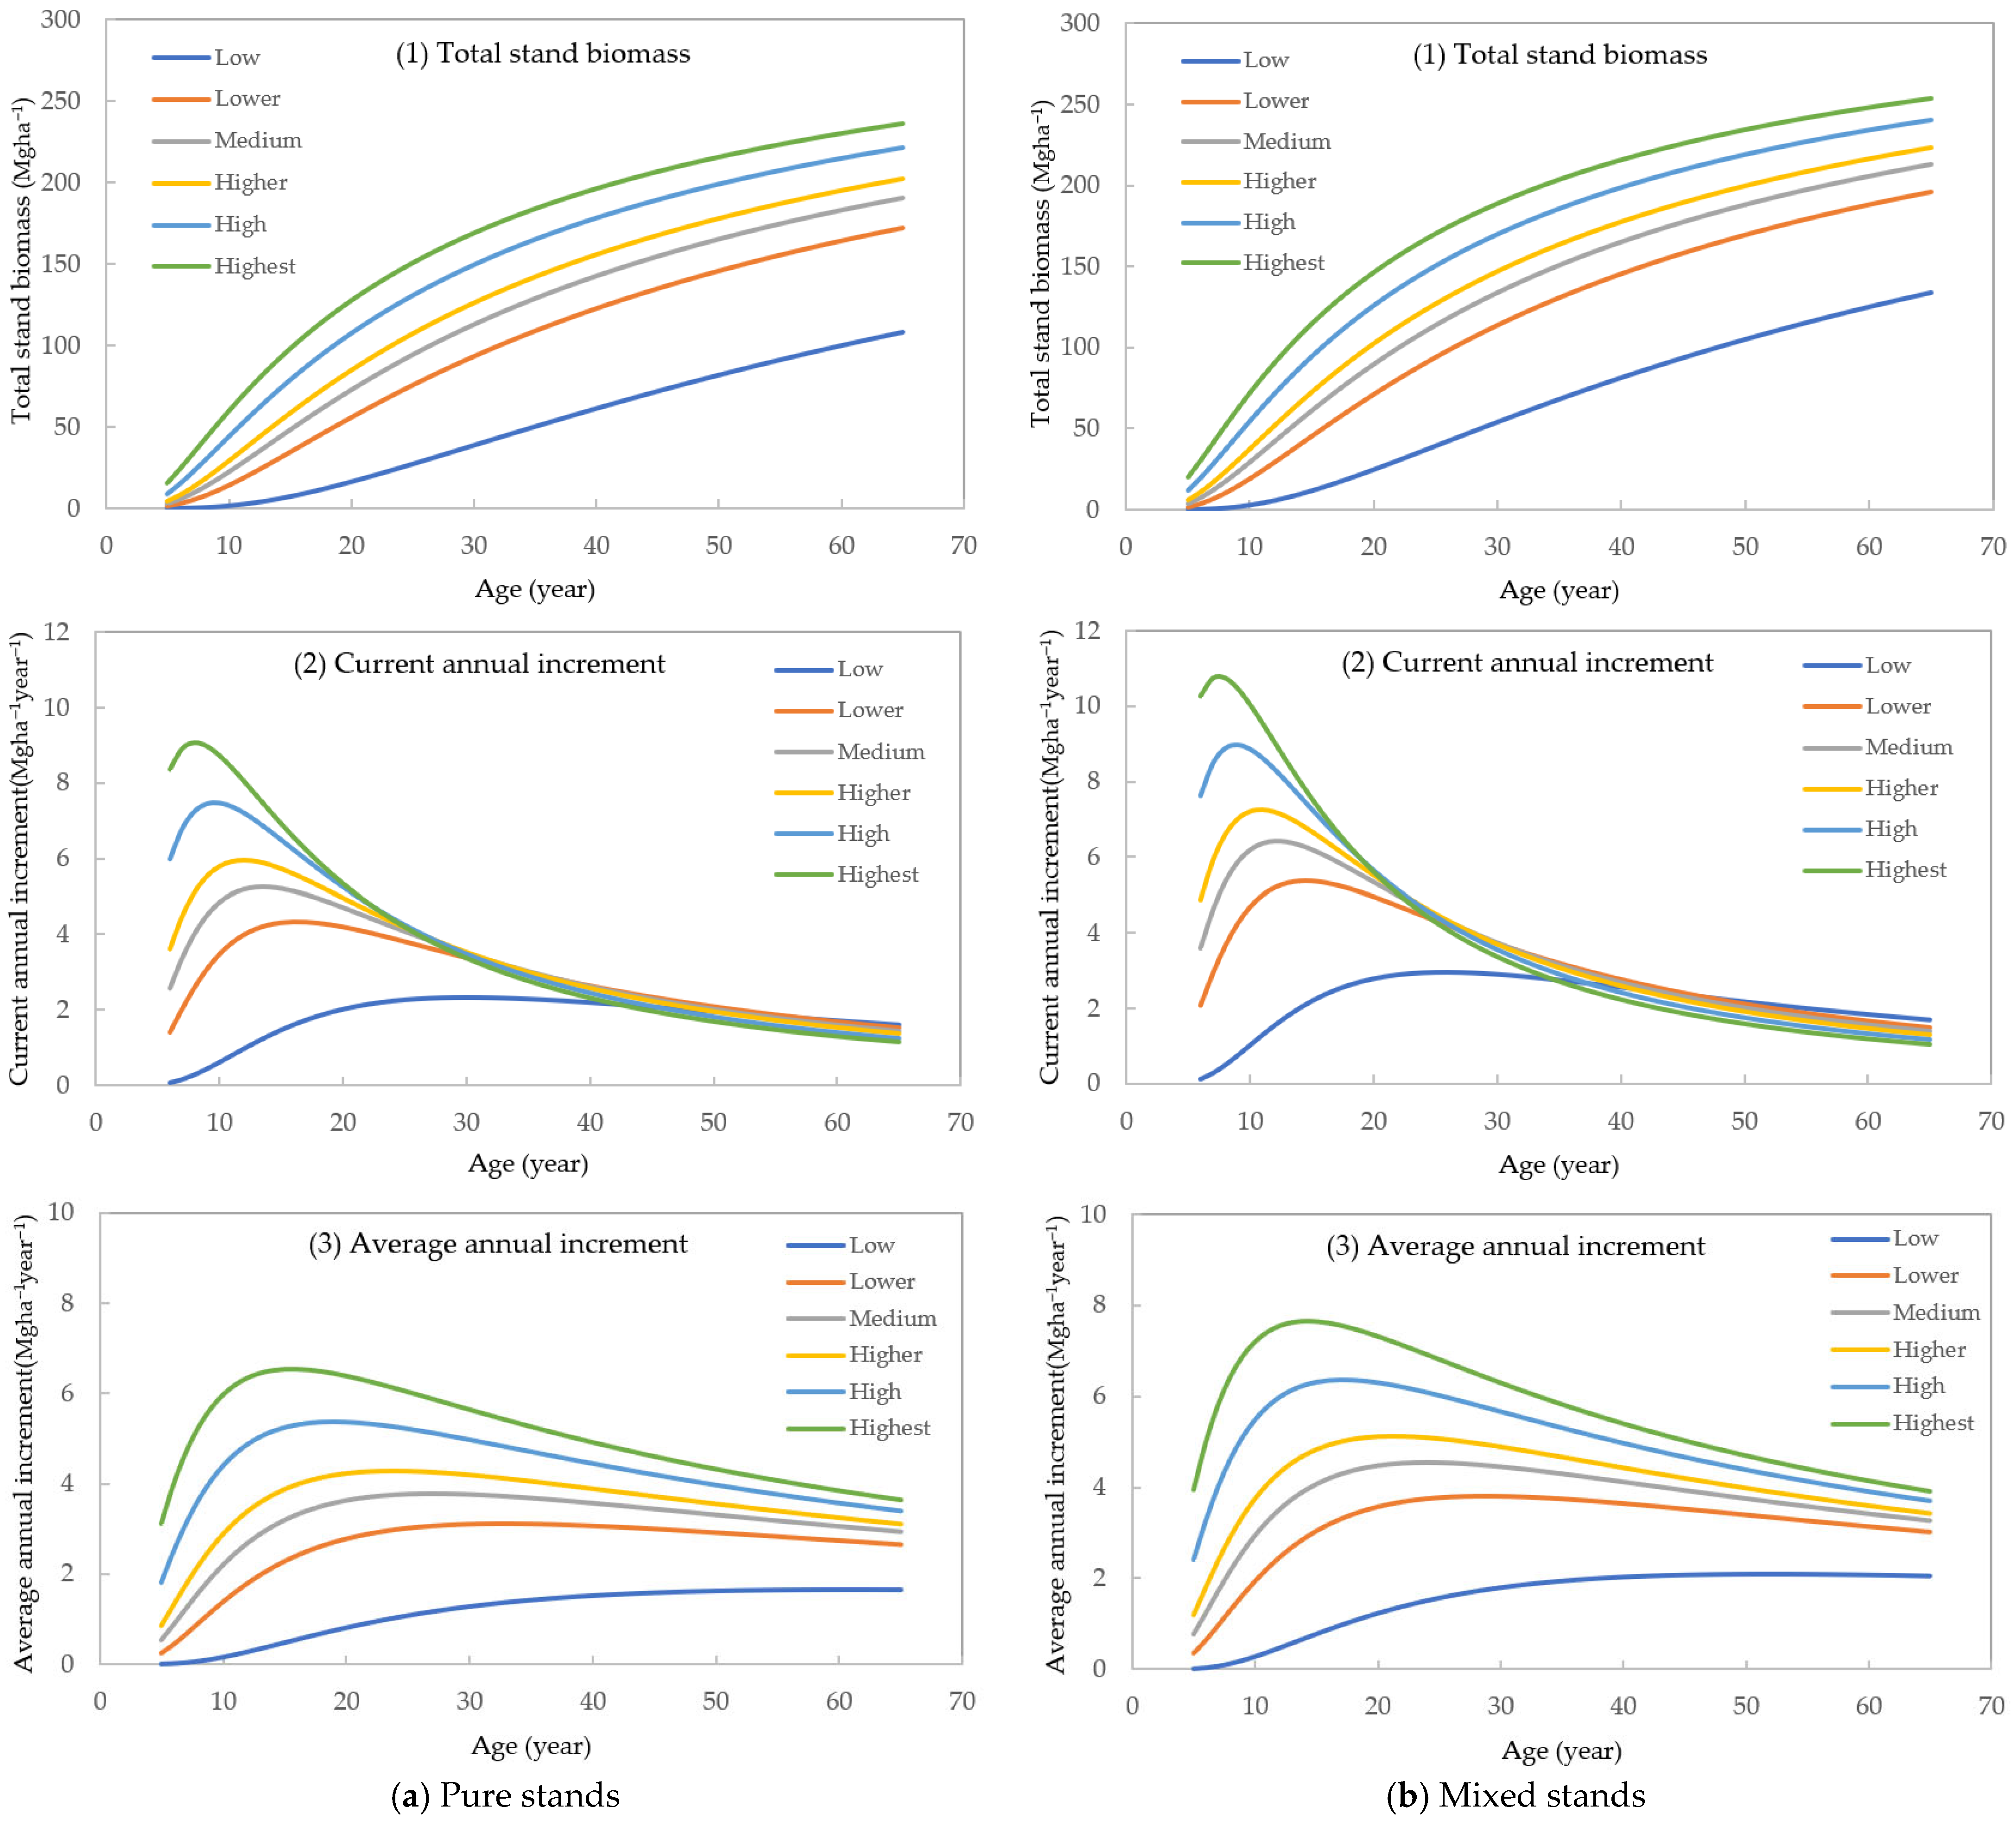
First, the growth rate of mixed stands is faster than that of pure stands. Under the same SQC, both the inflection age and the optimal rotation age of mixed stands are smaller than those of pure stands. For example, at Medium SQC, pure Chinese fir stands reach their fastest growth period at approximately 13 years and achieve quantitative maturity at about 27 years, whereas mixed Chinese fir stands reach their fastest growth period at about 12 years and achieve quantitative maturity at about 24 years.
Second, the higher the SQCs, the faster the growth rate. For both pure and mixed stands with higher SQC have smaller inflection ages and optimal rotation ages than those with a lower SQC. For instance, for pure Chinese fir stands, when SQC is High, the fastest growth period is reached at about 9 years and quantitative maturity at about 19 years; when SQC is Low, the fastest growth period is not reached until about 30 years and quantitative maturity is not achieved until about 61 years.
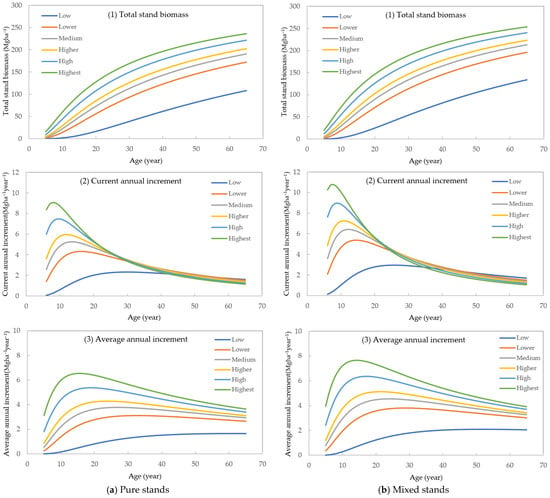
Figure 4a,b illustrate the growth processes of total stand biomass, current annual increment, and average annual increment for pure and mixed stands, respectively. The inflection age and optimal rotation age in Table 4 correspond to the ages at which the current annual increment and average annual increment in Figure 4 reach their maxima. Except for the curve for Low SQC, which is slightly lower than the others, the growth patterns of the remaining five SQCs are generally normal. The curves for different SQCs in Figure 4 are not as evenly distributed as those in Figure 2, which is primarily attributable to the uncertainty inherent in the classification of SQCs. Since the dominant height data from the 1999–2018 NFI data sets were derived through a series of models, error propagation among these models has a potential impact on the accuracy of the results.
Figure 4.
The growth process curves of (1) total stand biomass, (2) current annual increment, and (3) average annual increment for pure and mixed Chinese fir stands in different SQCs.
3.5. Analysis of Differences in Productivity
In this study, forest productivity is measured by the average annual biomass increment. Model (15) shows that SDI is positively correlated with forest productivity. If Chinese fir plantations are divided into five classes (1 to 5) based on SDI values of 200, 400, 600, 800, and 1000, and the productivity of Class 1 is used as the baseline for comparison, then the productivities of Classes 2, 3, 4, and 5 are 1.73, 2.38, 2.98, and 3.55 times that of Class 1, respectively. In other words, as SDI increases, the productivity of Chinese fir plantations also increases accordingly, but the rate of increase gradually diminishes.
The two lower panels in Figure 4 illustrate the changes in average annual increment over age for pure and mixed Chinese fir stands. Based on these growth curves, comparisons of productivity at base age t* (30 years) and at optimal rotation age t2 can be made between different SC categories and SQC classes of Chinese fir plantations (Table 6).
Table 6.
The productivity at base age and optimal rotation age of biomass growth models for pure and mixed Chinese fir plantations in different SQCs.
Based on the data in Table 6, the analysis can be conducted from the following two dimensions.
First, differences among different SQC classes. Using the productivity of the Low class as the baseline for comparison, for pure stands, the productivities of the Lower, Medium, Higher, High, and Highest classes are 2.4, 2.9, 3.3, 3.9, and 4.4 times that of the Low class at base age t*, and 1.9, 2.3, 2.6, 3.2, and 3.9 times that of the Low class at optimal rotation age t2, respectively. For mixed stands, the productivities at base age t* are 2.1, 2.5, 2.7, 3.1, and 3.5 times that of the Low class, and at optimal rotation age t2 are 1.8, 2.2, 2.4, 3.0, and 3.6 times that of the Low class, respectively. Overall, the differences among SQCs are smaller when calculated at optimal rotation age and larger when calculated at base age. Moreover, the differences among SQCs are smaller for mixed stands and larger for pure stands.
Second, differences between different SC categories. Using the productivity of pure stands as the baseline for comparison, at base age t*, the productivity of mixed stands is higher than that of pure stands by 10%, 14%, 17%, 19%, 23%, and 40% for the Low, Lower, Medium, Higher, High, and Highest SQCs, respectively. At optimal rotation age t2, the productivity of mixed stands is higher than that of pure stands by 17%, 18%, 20%, 21%, 22%, and 27% for the same SQCs, respectively.
In summary, the magnitude of productivity increase in mixed stands over pure stands varies across SQCs, with smaller differences observed when calculated at optimal rotation age and larger differences when calculated at base age. Therefore, determining optimal rotation age is an important way for enhancing forest productivity.
4. Discussion
4.1. Factors Influencing Tree Growth
It is well known that tree growth is influenced by various environmental factors—including climate, elevation, topography, landform, and soil—as well as the stand structure itself. For plantations, site index is a widely accepted evaluation indicator that integrates the effects of multiple environmental factors [41,45,46]. Wang et al. [47] explored the relationship between stand growth and influencing factors based on structural equation model, and concluded that the most influential factor was site condition, followed by stand structure. Numerous researchers [15,16,17,24,25] have recognized site quality and stand density as the primary factors affecting tree growth, and have investigated the growth responses to these two factors, but they did not quantify their respective contributions. The biomass growth models for Chinese fir plantations developed in this study quantified the contributions of SQC, SDI, and SC to biomass growth. The contribution of the interaction between SQC and SDI reached 53%, while the independent contribution rates of SDI, SQC, and SC were 28%, 7%, and 3%, respectively, and the remaining 9% was attributed to the interaction among all three factors. These results are generally consistent with the conclusions of the previous studies [15,16,17,24,25,47]. Yin et al. [20] demonstrated that mixed Chinese fir stands, particularly those mixed with broadleaved species, promote tree growth. Based on a meta-analysis, Mo et al. [21] concluded that mixed Chinese fir plantations enhanced productivity, especially when associated with broadleaved species. It is because mixed plantations could significantly change soil properties by improving soil structure, increasing pH value, water content, and total and available N and P in soil [21]. These findings are consistent with the conclusion of this study that the productivity of mixed Chinese fir-broadleaf stands is significantly higher than that of pure Chinese fir stands.
4.2. Growth Process of Chinese Fir Plantations
The stand growth process can be described by growth equations [32]. The five classical growth equations selected in this study showed very small differences in fitting the two population average growth models. Because the Logistic equation tends to overestimate early growth, the Chapman–Richards equation exhibits poor stability in parameter b, the Gompertz equation can only reflect a sigmoid growth curve when parameter b is greater than e, and the Schumacher equation must meet the need b > 4c to calculate optimal rotation age, the Korf equation was ultimately selected after comprehensive comparisons to fit the biomass growth models incorporating multiple factors. From the fitting results, SDI does not affect the biomass growth process, whereas differences in growth processes exist between different SC categories and SQC classes. Mixed forests grow faster than pure forests, and as SQC increases, the growth rate accelerates, and both inflection age and optimal rotation age are attained earlier (Figure 4). Tong [24] conducted a comparative study on the productivity of Chinese fir plantations with different SI classes and densities and reported that the trends in biomass variation with age were generally similar across different SI classes, and the biomass of stands in higher SI classes was consistently higher than that of stands in lower SI classes. This pattern is entirely consistent with the scenario shown in Figure 4 of this study. Huo et al. [31] studied Chinese fir plantations in Hunan Province and found that the quantitative maturity age for carbon decreased with increasing SI classes, which is also entirely consistent with the growth pattern identified in this study. Additionally, based on this study, the optimal rotation ages for pure and mixed Chinese fir plantations under Medium SQC are 27 and 24 years, respectively, which are generally consistent with the age group classification criteria in the national standard [48], where Chinese fir plantations older than 25 years are classified as mature forests.
4.3. Limitations and Prospects of This Study
First, there are certain limitations to the modeling data. The permanent plot data used in this study were obtained from China’s NFIs. Although the data used for growth modeling cover at least two successive inventory periods, they still cannot fully represent the entire growth process. To some extent, this amounts to a space-for-time substitution approach [8,9]. Furthermore, the 1999–2018 NFI data—whether for dominant height or stand biomass—were all estimated through a series of models. The propagation of errors among these models inevitably increases the uncertainty in the modeling data. Consequently, even using averaged data for modeling, the maximum R2 is only 0.863. Despite the shortcoming of a relatively low R2 for the model, the data are representative at the national scale, and should therefore be able to objectively reflect the overall growth patterns. If long-term observation data from permanent sample plots were available for stands on different SQCs, growth models with higher R2 could likely be developed.
Second, there are limitations in model construction. This study primarily focused on biomass, a core indicator reflecting forest productivity, and did not simultaneously develop a growth model system incorporating multiple stand factors or integrated stand growth models [43,49]. For data processing, no special measures were taken to address issues such as autocorrelation of time series data; and biomass modeling was conducted based on average values of different SC categories and SQC classes. Although the research findings can quantify the relative contributions of three factors to biomass growth and reveal growth differences among different SQC classes and SC categories, thereby providing a decision-making basis for forest management, they are still difficult to directly apply to guiding the implementation of specific forest management measures.
Future work can further advance biomass growth modeling in terms of both breadth and depth. First, following the technical approach proposed in this study, biomass growth models for other forest types can be developed based on successive NFI data, providing references for guiding forest management decisions and assessing forest productivity potential. Second, for specific forest types, research can be conducted to develop integrated stand growth models incorporating multiple stand factors and to compile stand density management diagrams [28] for guiding specific forest management activities such as stand density control.
5. Conclusions
The primary factor affecting the growth of Chinese fir plantations is SDI, followed by SQC, with SC also having a certain influence. There are interactions among these three factors, and the interaction between SDI and SQC contributes to more than half of biomass growth.
Mixed forests grow faster than pure forests, and better SQC leads to faster growth rates and earlier attainment of inflection age and optimal harvest age. For different SQCs in pure and mixed forest stands, different optimal rotation ages should be determined.
The productivity of Chinese fir plantations increases with SDI, but the rate of increase gradually diminishes. The productivity of mixed forests is higher than that of pure forests, although certain differences exist among different SQCs. Productivity calculated based on optimal rotation age is higher than that calculated based on base age. Rationally adjusting the harvest age and controlling stand density represent the greatest potential for enhancing forest productivity.
Author Contributions
Conceptualization, methodology, software, and writing, W.Z.; data preparation, and formal analysis, X.W. and X.Y.; visualization, X.S.; project administration, Y.P. and L.Z. All authors have read and agreed to the published version of the manuscript.
Funding
This research was funded by National Key Research and Development Program, grant number 2022YFD2200501.
Data Availability Statement
The data for this study are available from the corresponding author upon reasonable request.
Conflicts of Interest
The authors declare no conflicts of interest.
Appendix A
Table A1.
Comparison of evaluation statistics of five growth equations for dominant height modeling.
Table A2.
Comparison of evaluation statistics of five growth equations for stand biomass modeling.
Table A3.
Comparison of total stand biomass (TSB) and average annual increment (AAI) of five growth equations for stand biomass modeling.
Figure A1.
Comparison of five growth equations for population average modeling.
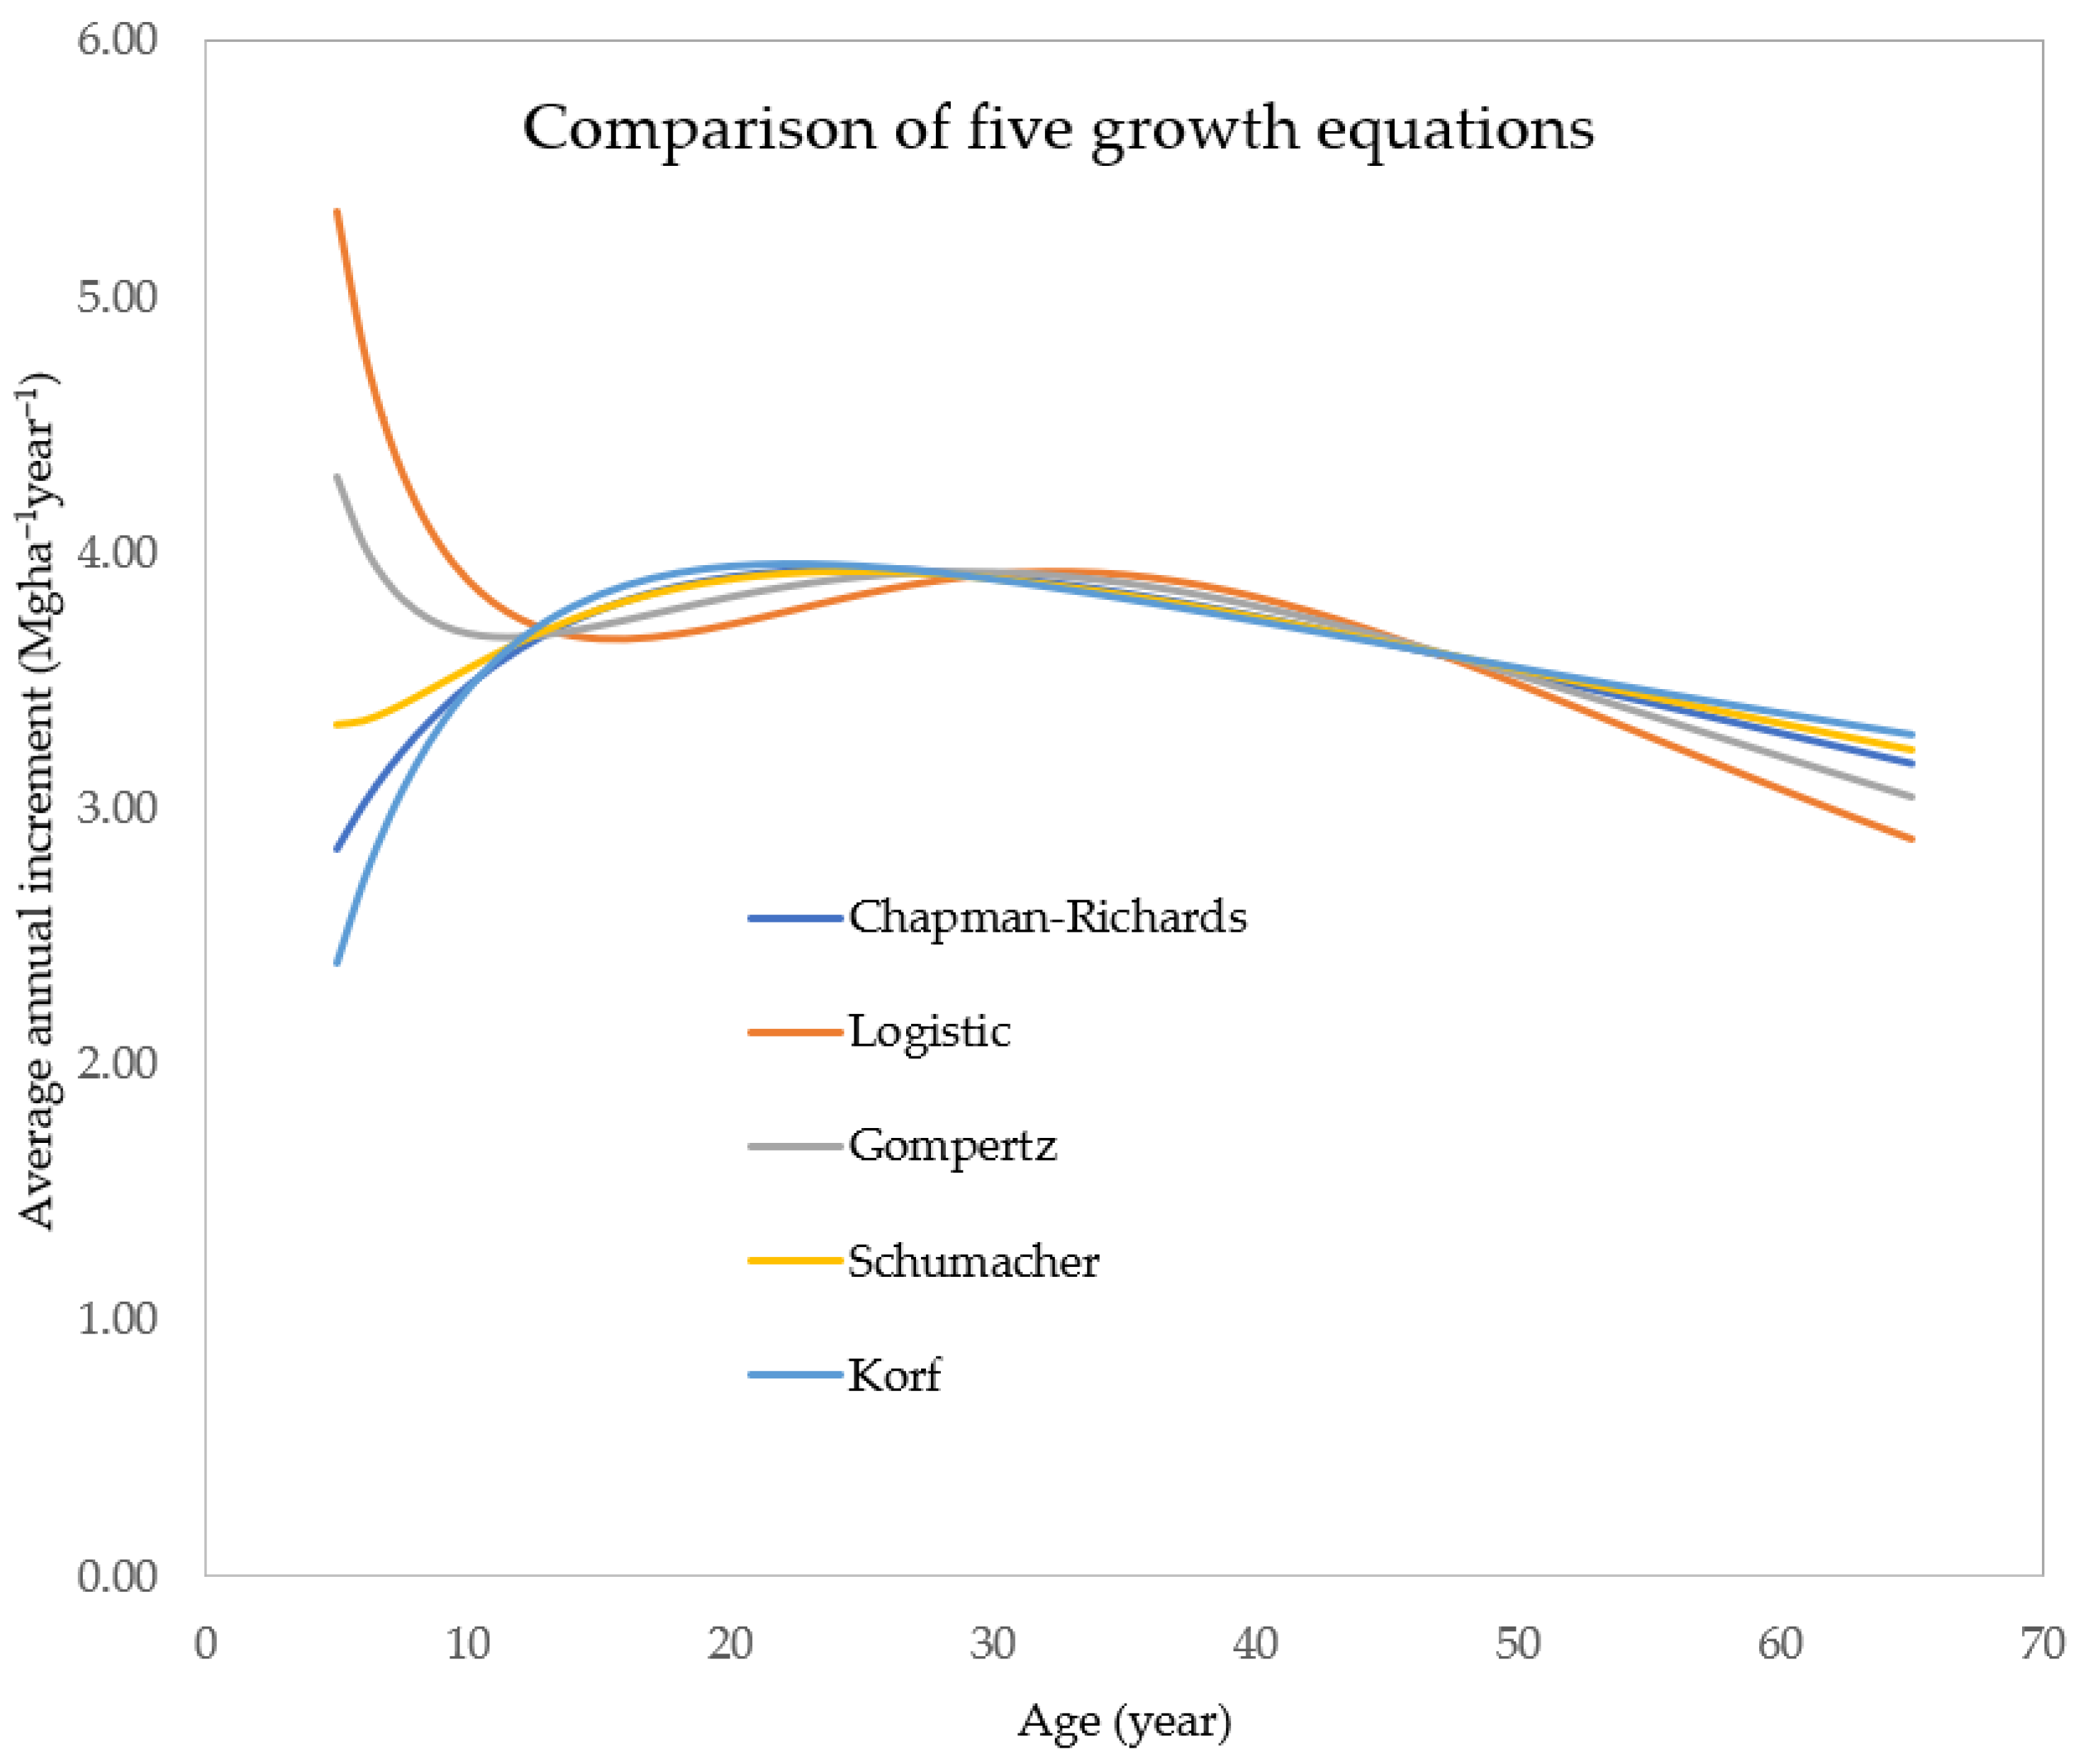
Figure A2.
The relative contribution of SQC, SDI, SC and their interaction.
References
- IUFRO. International Guidelines for Forest Monitoring; IUFRO World Series: Vienna, Austria, 1994; Volume 5. [Google Scholar]
- FAO. Global Forest Resources Assessment 2025: Guidelines and Specifications; FRA working paper 193; FAO: Rome, Italy, 2023. [Google Scholar]
- Walker, W.S.; Gorelik, S.R.; Cook-Patton, S.C.; Baccini, A.; Farina, M.K.; Solvik, K.K.; Ellis, P.W.; Sanderman, J.; Houghton, R.A.; Leavitt, S.M.; et al. The global potential for increased storage of carbon on land. Proc. Natl. Acad. Sci. USA 2022, 119, e2111312119. [Google Scholar] [CrossRef] [Scilit] [PubMed]
- Sun, W.L.; Liu, X.H. Review on carbon storage estimation of forest ecosystem and application in China. For. Ecosyst. 2020, 7, 4. [Google Scholar] [CrossRef] [Scilit]
- Zou, W.T.; Zeng, W.S. Research advances in estimation of forest biomass and carbon storage. World For. Res. 2025, 38, 32–38. [Google Scholar] [CrossRef]
- Zhao, H.; Lei, Y.C.; Fu, L.Y. Biomass and uncertainty estimates of Pinus massoniana forest for different site classes in Jiangxi province. Sci. Silvae Sin. 2017, 53, 81–93. [Google Scholar]
- Cao, L.; Liu, X.T.; Li, H.K.; Lei, Y.C. Biomass growth models for evergreen broad-leaved forests in Guangdong. For. Res. 2020, 33, 61–67. [Google Scholar] [CrossRef]
- Zhang, L.J.; Lai, G.H.; Zeng, W.S.; Zou, W.; Yi, S. Effect of climate on carbon storage growth models for three major coniferous plantations in China based on national forest inventory data. Forests 2022, 13, 882. [Google Scholar] [CrossRef] [Scilit]
- Zeng, W.S.; Pu, Y.; Yang, X.Y.; Yi, S.J. Growth models and its climate-driven analysis of carbon storage in tree layers of five major plantation types in China. Sci. Silvae Sin. 2023, 59, 21–30. [Google Scholar]
- Wang, W.; Ma, L.Y.; Jia, Z.K. A study on growing process of Pinus tabulaeformis plantation in Pingquan, Hebei. J. Cent. South Univ. For. Technol. 2012, 32, 13–17. [Google Scholar]
- Niu, Y.; Zhou, A.L.; Guo, X.L.; Zheng, Z.L.; Li, H.P. Analysis on growth process of Pinus tabuliformis plantation in Xiaolongshan forest area. For. Sci. Technol. 2012, 540, 3–6. [Google Scholar] [CrossRef]
- Kang, X.G.; Cui, X.H.; Wang, H. Compilation of growth process tables for three tree species stands in the secondary forests of north Hebei. J. Beijing For. Univ. 2001, 23, 39–42. [Google Scholar]
- Wei, Z.C. Application of the Larix olgensis plantation models. J. Northeast For. Univ. 2006, 34, 31–33. [Google Scholar]
- Gao, D.Q.; Deng, H.F.; Wang, H.B.; Cheng, Z.C. Dummy variables models in Quercus mongolica growth. J. Northeast For. Univ. 2014, 42, 61–64. [Google Scholar] [CrossRef]
- Guo, G.Z.; Li, X.Y.; Jiang, L.; Duan, A.G.; Zhang, J.G. Long-term effects of planting density and site on stand basal area growth of Chinese fir plantation in Daqingshan Mountains, Guangxi. J. Northeast For. Univ. 2021, 49, 34–39. [Google Scholar] [CrossRef]
- Pan, X.; Sun, S.C.; Hua, W.P.; Li, J.; Zhuang, C.; Jiang, X. Predicting the stand growth and yield of mixed Chinese fir forests based on their site quality, stand density, and species composition. Forests 2023, 14, 2315. [Google Scholar] [CrossRef] [Scilit]
- Li, X.Y.; Duan, A.G.; Zhang, J.G. Influence of stand density, site, age, and competition on the timber assortment structure of Chinese fir plantations. Sci. Rep. 2024, 14, 29056. [Google Scholar] [CrossRef] [Scilit]
- Sun, K.; Sun, H.G.; Lu, G.B.; Fang, L.; Wan, Z.; Tan, Z. Study on the effects of stand density management of Chinese fir plantation in Northern China. Front. Plant Sci. 2023, 14, 1130299. [Google Scholar] [CrossRef] [Scilit] [PubMed]
- Guo, Y.; Ouyang, X.Z.; Pan, P.; Li, J.; Liu, J. Stand structure and type drive productivity in Chinese fir forests: Comparison of pure and mixed stands. Ecol. Evol. 2026, 16, e72750. [Google Scholar] [CrossRef] [Scilit] [PubMed]
- Yin, Z.F.; Jiao, J.J.; Sun, H.G.; Chen, J. Species mixing improves tree growth and timber quality of Chinese fir in mixtures with broad-leaved species in central China. Forests 2024, 15, 1970. [Google Scholar] [CrossRef] [Scilit]
- Mo, X.F.; Lu, J.Y.; Lin, J.J.; Huo, C.; Zhang, W. The effect of mixed plantations on Chinese fir productivity: A meta-analysis. Forests 2025, 16, 105. [Google Scholar] [CrossRef] [Scilit]
- Song, L.Y.; Zhao, D.; Li, M.; Wei, D.; Ouyang, Y.; Deng, C. Tree species configuration for improving quality and increasing efficiency of Chinese fir plantations in southern Hunan province. J. Cent. South Univ. For. Technol. 2025, 45, 20–28. [Google Scholar] [CrossRef]
- National Forestry and Grassland Administration. Report on Forest Resources in China (2014–2018); China Forestry Publishing House: Beijing, China, 2019. [Google Scholar]
- Tong, J.Q. Study on the biomass productivity and growth of Chinese fir plantations of different site and density. J. Fujian Agric. For. Univ. (Nat. Sci. Ed.) 2008, 37, 369–373. [Google Scholar]
- Guo, G.Z.; Duan, A.G.; Zhang, J.G. The site and planting density effects on the wood volume growth of Chinese fir plantations in south subtropical area. For. Res. 2019, 32, 19–25. [Google Scholar] [CrossRef]
- Ji, L.B.; Shu, D.W. Influence of stand density of Cunninghamia lanceolate on stand growth. For. Inventory Plan. 2017, 42, 135–137. [Google Scholar]
- Jiang, L.; Zhang, X.Q.; Duan, A.G.; Zhang, J.G. Develop annual stand volume growth model of Chinese fir including different stand density indices. For. Res. 2022, 35, 97–102. [Google Scholar]
- Guo, Y.; Ouyang, X.Z.; Pan, P.; Liu, J.; Liu, C. Construction of stand density management diagrams and silvicultural simulation for different stand types of Chinese fir in the mid-subtropics. Forests 2025, 16, 1543. [Google Scholar] [CrossRef] [Scilit]
- Ma, X.Q.; Fan, S.H.; Chen, S.S.; Lin, S.J. Study on biomass productivity of Chinese fir plantations after successive planting. Sci. Silvae Sin. 2003, 39, 78–83. [Google Scholar]
- Li, J.P.; Lu, Y. Natural growth and artificially controlled density growth models for Cunninghamia lanceolata stand in Huitong county, Hunan province. J. Cent. South For. Coll. 2002, 22, 69–72. [Google Scholar] [CrossRef]
- Huo, C.F.; Wang, P.; Chen, L.C.; Wang, S.L. Quantitative maturity age for stand volume and ecosystem carbon storage of Cunninghamia lanceolata plantation. J. Cent. South Univ. For. Technol. 2018, 38, 94–99. [Google Scholar] [CrossRef]
- Zeide, B. Analysis of growth equations. For. Sci. 1993, 39, 594–616. [Google Scholar] [CrossRef] [Scilit]
- Zeng, W.S.; Tang, S.Z. Bias correction in logarithmic regression and comparison with weighted regression for non-linear models. For. Res. 2011, 24, 137–143. [Google Scholar] [CrossRef]
- Zeng, W.S. Using nonlinear mixed model and dummy variable model approaches to construct origin-based single tree biomass equations. Trees-Struct. Funct. 2015, 29, 275–283. [Google Scholar]
- LY/T 1353; State Forestry Administration. Tree Volume Tables. China Standards Press: Beijing, China, 1999.
- GB/T 43648; National Standardization Technical Committee. Tree Biomass Models and Related Parameters to Carbon Accounting for Major Tree Species. China Standards Press: Beijing, China, 2024.
- Woodall, C.W.; Miles, P.D.; Vissage, J.S. Determining maximum stand density index on mixed species stands for strategic-scale stocking assessments. For. Ecol. Manag. 2005, 216, 367–377. [Google Scholar] [CrossRef] [Scilit]
- He, X.; Zeng, W.S.; Chen, X.Y.; Huang, H.C.; Lei, X.D. Conversion models of stand dominant height and mean height of the four larch plantations across China. Sci. Silvae Sin. 2026, 62, 223–230. [Google Scholar]
- Luo, Q.B.; Zeng, W.S.; Peng, C.Q. Variable relative tree height curve model and its application in tree volume estimation. Sci. Silvae Sin. 1997, 33, 202–211. [Google Scholar]
- Socha, J.; Tyminska-Czabanska, L.; Grabska, E.; Orzeł, S. Site index models for main forest-forming tree species in Poland. Forests 2020, 11, 301. [Google Scholar] [CrossRef] [Scilit]
- Gao, W.F.; Dong, C.; Gong, Y.H.; Ma, S.; Shen, J.; Lin, S. Site quality evaluation model of Chinese fir plantations for machine learning and site factors. Sustainability 2023, 15, 15587. [Google Scholar] [CrossRef] [Scilit]
- Guo, Z.X.; Hu, Z.Y.; Cao, C.; Liu, P. Stand-level models of biomass and carbon stock for major forest types in Guangdong. Sci. Silvae Sin. 2023, 59, 37–50. [Google Scholar]
- Lei, X.D.; Yu, L.; Hong, L.X. Climate-sensitive integrated stand growth model (CS-ISGM) of Changbai larch (Larix olgensis) plantations. For. Ecol. Manag. 2016, 376, 265–275. [Google Scholar] [CrossRef] [Scilit]
- Piñeiro, G.; Perelman, S.; Guerschman, J.P.; Paruelo, J.M. How to evaluate models: Observed vs. predicted or predicted vs. observed? Ecol. Model. 2008, 216, 316–322. [Google Scholar] [CrossRef] [Scilit]
- Tang, C.; Wang, C.S.; Zeng, J.; Lei, Y. Advances in forest site productivity evaluation with relationship model of site index and environmental factors. World For. Res. 2018, 31, 48–53. [Google Scholar]
- Li, X.Y.; Duan, A.G.; Zhang, J.G. Site index for Chinese fir plantations varies with climatic and soil factors in southern China. J. For. Res. 2022, 33, 1765–1780. [Google Scholar] [CrossRef] [Scilit]
- Wang, S.L.; Zhou, J.P. Coupling relationship between stand growth and impacting factors based on structural equation model. J. Beijing For. Univ. 2014, 36, 7–12. [Google Scholar]
- GB/T 38590; National Standardization Technical Committee. Technical Regulations for Continuous Forest Inventory. China Standards Press: Beijing, China, 2020.
- Hong, L.X.; Lei, X.D.; Li, Y.C. Integrated stand growth model of Mongolian oak and its application. For. Res. 2012, 25, 201–206. [Google Scholar]

Disclaimer/Publisher’s Note: The statements, opinions and data contained in all publications are solely those of the individual author(s) and contributor(s) and not of MDPI and/or the editor(s). MDPI and/or the editor(s) disclaim responsibility for any injury to people or property resulting from any ideas, methods, instructions or products referred to in the content. |
© 2026 by the authors. Licensee MDPI, Basel, Switzerland. This article is an open access article distributed under the terms and conditions of the Creative Commons Attribution (CC BY) license.