


Abstract
As the global climate change mitigation efforts urge the transition towards a green economy, comprehending the carbon footprint of forest industry supply chain is crucial to ensure sustainable management and utilization of renewable resources. This research quantified the carbon footprint of four different forest product industries: chip mill, hardwood sawmill, softwood sawmill, and in-woods chipping in the Northeastern U.S. Additionally, the impact of transportation (road and rail) on carbon footprint was analyzed. Life cycle assessment (LCA) was performed using SimaPro 9.3.0.3 software and allied databases (USLCI and US-EI). The functional unit was 1 tonne for chip mill (wood chips) and 1 m3 for sawmill (planks). The highest-contributing inputs for the chip mill and softwood sawmill were transportation. However, in-woods chipping and the hardwood sawmill had raw materials, residual wood, and round wood as the highest-contributing input. The study also enumerated the substances that contributed most to environmental impacts. The carbon footprint of chip mill, in-woods chipping, hardwood, and softwood sawmill were 49.5, 21.7, 72.9, and 73.7 kg CO2 eq per respective functional units, respectively. The results could assist the forest industry in promoting wood feedstock with a minimal carbon footprint and have educated engagement in an ever-evolving carbon market.
1. Introduction
Forests are a strategic tool to mitigate climate change [1,2,3]; however, uncertainty and economic pressure from fluctuating product markets urges forest management, products, and the logging industry to reduce carbon footprint and increase the social acceptability of timber harvesting operations [4,5]. Wood products and energy generated from sustainably managed forests can be considered carbon-neutral provided that the forest sequesters at least the same quantity of CO2 released during their production [5,6,7]. Generating forest products causes greenhouse gas (GHG) emissions through the utilization of fossil fuels in various phases of the manufacturing processes [1,5,6]. Along with the manufacturing process, timber harvesting and roundwood transportation can significantly increase GHG emissions [1,8,9], thereby further increasing global warming potential (GWP). Pokhrel et al. [10], comparing the GWP of wood flour and pellets, reported transportation as the highest contributor among various environmental impact categories. Hence, there is a need to understand fossil fuel consumption of various wood products throughout the supply chain to determine the climate change mitigation potential of sustainably managed forests and wood products [6,10].
There is a need to use underutilized co-products or conventional residues of forest products as feedstock for other manufacturing processes (or the co-generation of energy utilizing the co-product at the primary production facility) to ensure a minimal carbon footprint and sustainability. In the context of climate change, carbon footprint is a measure used to quantify GWP or/and GHG emissions associated with the life cycle of a product, events, and activities expressed in kg of CO2 equivalent (eq) from energy consumption [11].
Life cycle assessment (LCA) is an internationally accepted and widely used tool to identify, quantify, and analyze all inputs and outputs involved in the production, utilization, and disposal of a product of interest [12]. LCA has become a key procedure in the forest industry to understand the environmental impacts associated with wood extraction, i.e., felling, processing, and transportation of wood products [9,10,13,14,15]. There are four phases in an LCA study: (i) definition of goal and scope (system boundary), (ii) inventory analysis (input and output), (iii) impact assessment (carbon emission in kg CO2 eq), and (iv) interpretation [16,17]. Mainly, emission studies using LCA are of several types—cradle-to-gate, stump-to-gate, cradle-to-grave, or cradle-to-cradle [12,14,16]—where the impact of a product or process is analyzed from raw material acquisition, processing, consumption, re-utilization, and final disposal [18]. A functional unit is applied to normalize all the system inputs and compare various impact categories between different forest products; volume (m3) or mass (kg or tonne) are the frequently used functional units [13,19,20].
Understanding the carbon footprint using LCA will help to identify forest products with minimum emission and production phases in which improvements can be made to reduce the GWP of the forest industry. Information from LCA studies can be used in forest certification processes and eco-inventory platforms that report industry performance in climate change mitigation [1]. Reducing the GWP and carbon footprint labeling of the supply chain could help gain social acceptance for the forest industry and wood products. Studies have shown increased purchase probability and willingness to pay a premium price for carbon footprint-labeled products [21,22]. Li et al. [23] quantified the current wood product pool for the state of Maine, USA as 52 Tg C based on harvesting data during the period from 1901 to 2019. Quantifying annual or periodic carbon emission rates from different forest products are needed in carbon budgeting for the state (Forest Carbon Program of Maine) to be a carbon-neutral state by 2045 [23,24]. This will help manufacturers identify critical negative points of GWP in their production system and adopt better technology with fewer emissions. LCA studies are also used to estimate the net effects of product substitutions with respect to climate change, air and water quality, and other impact categories [8,11,14].
Transportation of forest products from the stand to the mills and subsequently to the market is a critical element of the supply chain, which is directly related the cost of delivered products and has the most impact on the environment [25]. Among the different secondary transportation modes available, trucking is the most used in the US. Factors that impact the cost of hauling forest products are the road types and conditions, cost of operating the vehicle, fuel price, weight limitations, and hauling distance [26,27]. Koirala et al. [25] reported that the average distance traveled from in-wood to the forest product industry was around 98 km (one-way) in the Northeastern US.
Maine’s forest products industry plays a vital role in the state’s economy, contributing an estimated $8.3 billion in economic output and supporting nearly 29,000 jobs across all 16 counties Crawley and Hunt, 2024 [28]. This sector represents approximately 4% of the state’s GDP. The industry encompasses a diverse mix of activities, from logging and primary wood processing to the manufacturing of finished wood products, reflecting the unique structure and scale of Maine’s forest economy. Understanding these characteristics is essential for contextualizing this study and assessing how findings from Maine might, or might not, be generalized to other regions with different forest resources, production volumes, and industrial structures.
Along with bridging the knowledge gap on carbon footprint of wood products, this study will supplement the carbon budgeting of the forest industry in the Northeastern U.S. as we proceed towards a circular bioeconomy. Circular bioeconomy emphasizes the use of renewable resources in a way that prevents wastage of resources [29]. Co-products from the facilities analyzed in the current study could be a raw material for subsidiary forest products, echoing the critical role of forests in climate change mitigation and the importance of forest-based industries in GHG reduction; the objective of this study was to estimate and compare the carbon footprint of products from a chip mill, an in-woods chipping operation, a hardwood sawmill, and a softwood sawmill. Very few life cycle studies have investigated these products in the region. These values would be critical for carbon budgeting of the forest industry. Additionally, the effects of transportation on carbon footprint was also analyzed. This study also addresses the increasing demands of carbon budgeting, emission cap, and carbon certification for the forest products industry. The results from the study could be applied to other facilities of similar production capacities in the Northeastern US.
2. Materials and Methods
LCA was performed to quantify carbon footprint and other environmental impact assessment categories (EIACs), including ozone depletion (kg CFC−11 eq), global warming potentials (kg CO2 eq), smog (kg O3 eq), acidification (kg SO2 eq), eutrophication (kg N eq), carcinogenic (CTuh), non-carcinogenic (CTuh), respiratory effects (kg PM2.5 eq), ecotoxicity (CTUe), and fossil fuel depletion (MJ “surplus”) (a similar order is followed throughout the manuscript while mentioning EIAC and substance contribution). The environmental impacts were normalized to find the EIAC of maximum concern [10,30]. A case study approach was taken to perform LCA using protocols prescribed by ISO 14040 [16] and ISO 14044 [17] standards. The study was conducted in Maine, U.S. and data was collected in February 2022.
LCA was done using SimaPro 9.3.0.3 software. The databases of USLCI and US-EI 2.2 (DATASMART package) were used since they are based on the U.S. manufacturing and electricity data [10]. The mass and energy flow within the system boundary were calculated using the collected input–output data and databases, representing variation in production facilities. Carbon footprint and other impact assessments used the North American Tool for Reduction and Assessment of Chemicals and Other Environmental Impacts (TRACI) 2.1, a built-in tool for SimaPro. Even though there are other softwares for conducting LCA, SimaPro is the most widely used in research [9,10].
2.1. System Boundary and Unit Processes
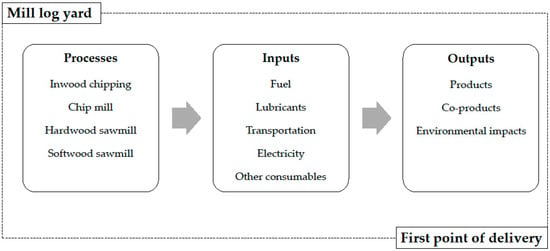
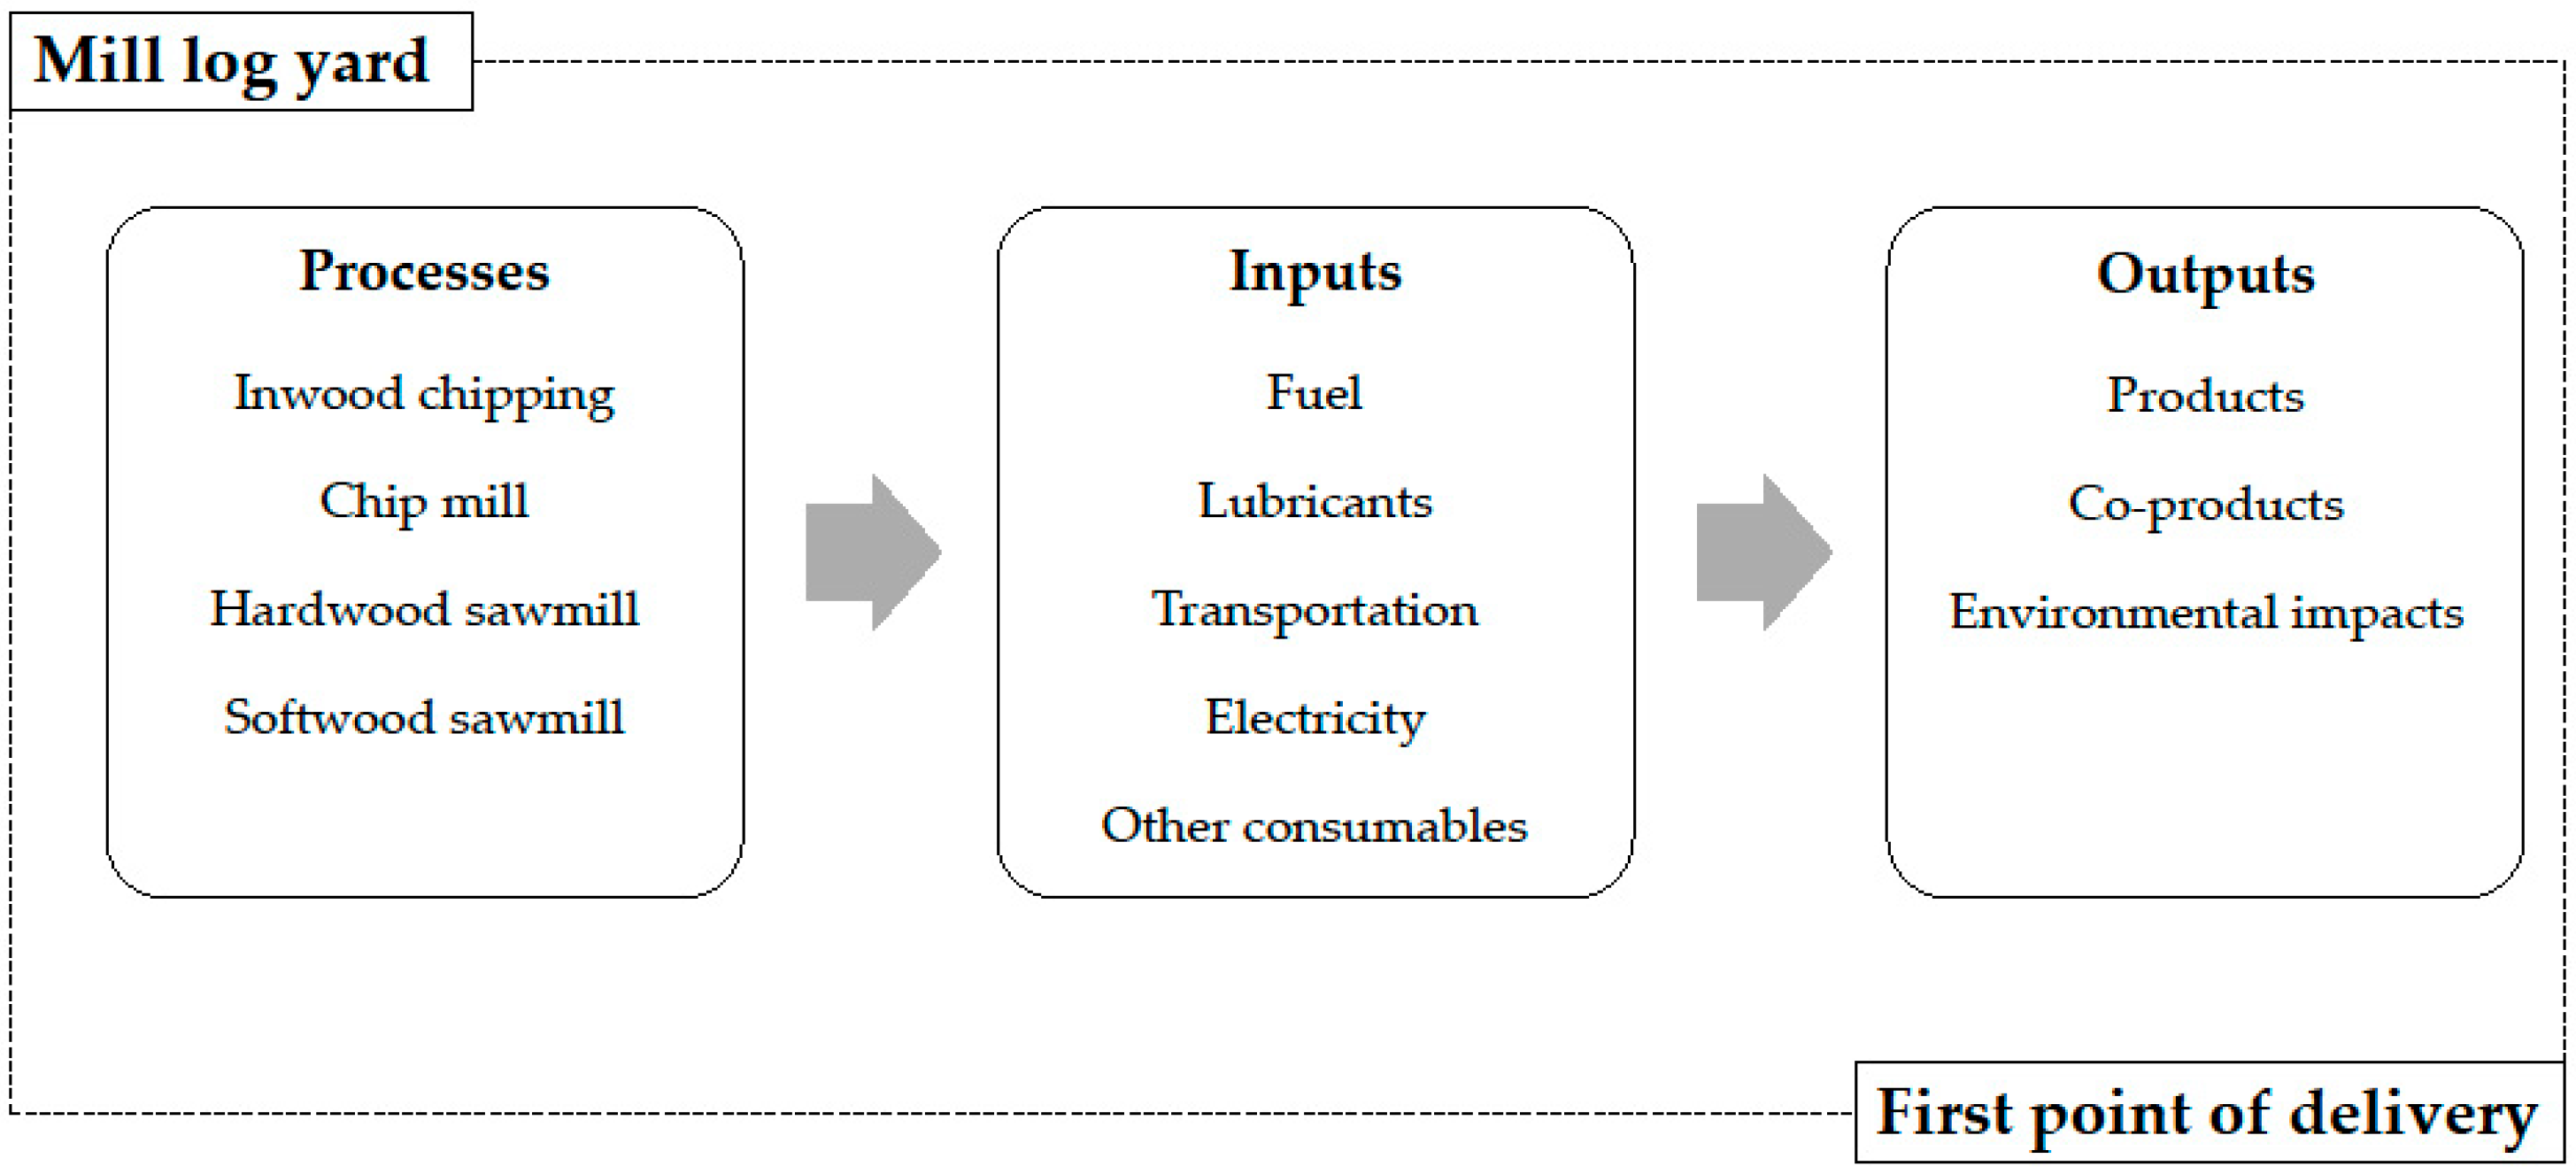
System boundary and unit processes of this study included all the activities from the production facilities’ log yard to the first retailer/wholesaler/exporter/consumer (gate-to-gate; Figure 1). Budgeted carbon does not include any previous silvicultural and management activity emissions. A gate-to-gate approach was utilized for this study. LCA of a chip mill, in-woods chipping (landing), a hardwood sawmill, and a softwood sawmill were performed.
Figure 1.
System boundary for the gate-to-gate life cycle assessment (LCA) of various wood product processes.
2.1.1. Chip Mill
The wood chip mill received mixed wood (i.e., hardwood and softwood) logs of inferior quality (in tree length and cut-to-length forms) from the log yard. The logs were brought to the feeding system using front-end loaders and forklifts. The facility could consume logs with a minimum of 10 cm and a maximum of 66 cm in diameter. The logs for chipping were loaded to the conveyer belt of the facility using electrically operated cranes which were debarked initially using a drum debarker and then using a ring debarker. Removed bark was taken out to the bark pit via vibration conveyor belts. The debarked log was then fed to the chipper powered by two 800 hp motors using another electric crane. The wood chips were moved to a surge bin, then moved to screens (8 cm) and were segregated into three sizes. Larger chips were re-chipped and screened again. The chips of acceptable size were moved to storage bins through a conveyor. The permissible bark content in the final product was <1%. The entire production process used electric motors, which consumed hydroelectricity from the grid. The wood chips were transported via chip trucks to consumption points, where they were used for electricity and pulp production (majority). The co-product, bark, was given to nearby farmers for use in land amelioration. The facility had 84.4% green wood chips and 15.6% bark production.
2.1.2. In-Woods Chipping
In the in-woods chipping system, wood chips of inferior quality were produced and were primarily used for biomass energy production. Logging residue (slash and low-quality wood after processing logs) was fed into a chipper (750 hp) using a loader (175–200 hp), and green wood chips were blown into a chip truck by the chipper itself. The unmerchantable trees were brought to the landing as a part of the timber extraction process and were not included in the system boundary for the LCA [15]. Such operations are regarded as cold-loading operations where in-wood chipping initiates after the roundwood harvesting is completed. The wood chips were transported via chip trucks to consumption points for electricity production and heat. This process had no co-product.
2.1.3. Hardwood Sawmill
Hardwoods, primarily sugar maple (Acer saccharum Marshall) and yellow birch (Betula alleghaniensis Britt.), were processed into sawn lumber. Logs were loaded into the facility using an electric crane and were debarked using a drum debarker. The size of logs fed into the system ranged from 25 to 60 cm. Debarked logs were sawed and re-sawed using a double-cut saw, a head saw, a resaw, and a combination saw. Then the sawn boards were trimmed and squared using edgers to obtain maximum merchantable lumber. Squared boards were graded mechanically and were transferred to a kiln for drying with a 12-day seasoning schedule. Logs and lumber were transferred between each point via conveyor belts. A biomass boiler (600 hp) was used to power the kiln using sawdust produced from the facility and was also used for facility heating. During wood seasoning, the moisture content was brought from 80% to 120% down to 6%. Seasoned lumber was graded, packed, and shipped to the point of consumption. Around 35% of the sawn lumber was sold as green, without seasoning. The facility did not plane the lumber. The lumber was packed using wood dunnage and plastic strappings. The co-products from the facility were bark, wood chips, and sawdust. The facility consumes hydroelectricity from the grid.
2.1.4. Softwood Sawmill
The facility processed eastern white pine (Pinus strobus L.) into 2.54 cm (1 inch) thick planks. Logs were fed into the facility’s ring debarker using a diesel-powered crane. Debarked logs were converted into planks with the help of a head rig, resaw, trimmer, edger, etc. The planks were sorted and were transferred to a kiln for a 6-day seasoning schedule. The moisture content of the planks was brought down to 11%. Kilns were powered using a 600 hp boiler and cogenerated electricity. Along with co-products (except wood shavings) from the facility, mixed whole-tree wood chips from outside were also used to feed the boiler. Seasoned planks were planed and graded before packing for final shipment. Compared to the hardwood sawmill, the softwood mill sprinkled the logs (to maintain a wet deck) before any processing. This led to a difference in three magnitudes of water usage among the two mills. The co-products from the facility were bark, wood chips, wood shavings, and sawdust. The product was transported using trucks to the point of consumption. The co-products were trucked in bulk, without packaging.
2.2. Life Cycle Inventory Analysis
For inventory analysis, information on input and output for the above-mentioned production facilities was collected by visiting the facilities. The input parameters were selected based on the collected information from the life cycle inventory (LCI) database, DATASMART, in SimaPro 9.3.0.3 (Table 1). The functional unit was 1 tonne of wood chips for chip mill and in-woods chipping (wood chips are traded in unit mass), and 1 m3 planks for sawmills (planks are traded in unit volume). Functional units reflect the goal and scope, which is the reference connecting the inputs and outputs normalized for LCA [10,14].
Table 1.
Inputs of life cycle analysis (LCA) modeling for different forest products along with their life cycle inventory (LCI) dataset chosen from DATASMART in SimaPro.
2.3. Sensitivity and What-If Analysis
A local sensitivity analysis was performed to understand the effect of transportation distance toward environmental impacts. The analysis explored the variation in GWP of the products when there is a 50% or 100% increase and decrease in transportation distance, keeping all other inputs constant [30]. Also, it investigated the change in carbon emission if rail was used for transportation of products instead of trucks.
3. Results and Discussion
3.1. Life Cycle Impact Assessment
A cradle-to-gate approach was not adopted for this study due to the various timber harvesting methods and variable secondary transportation distance for the roundwood from stand to the mills. Therefore, to avoid double counting, a gate-to-gate approach was used. The uncertainties related to DATASMART/USLCI databases are predominantly due to multiple sources, variability in measurement methods, regional differences in material production processes, temporal changes in technology, and gaps in reported data [31]. Additionally, some inputs might be based on industry averages or estimates rather than direct measurements. Furthermore, assumptions used to fill missing values or to harmonize data across regions and time periods can contribute to further uncertainty. Sometimes, usage of proxies like ecoinvent may not be the actual representations of the US LCI values.
The life cycle impact assessment of primary products of all the four production facilities is described below. The results were validated (input–output inventory data and their allocations) by professionals in Forest Products Laboratory, Madison, WI, USA.
3.1.1. Chip Mill
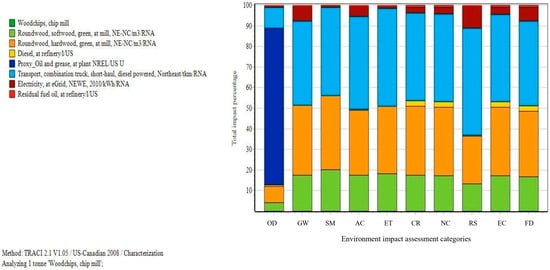
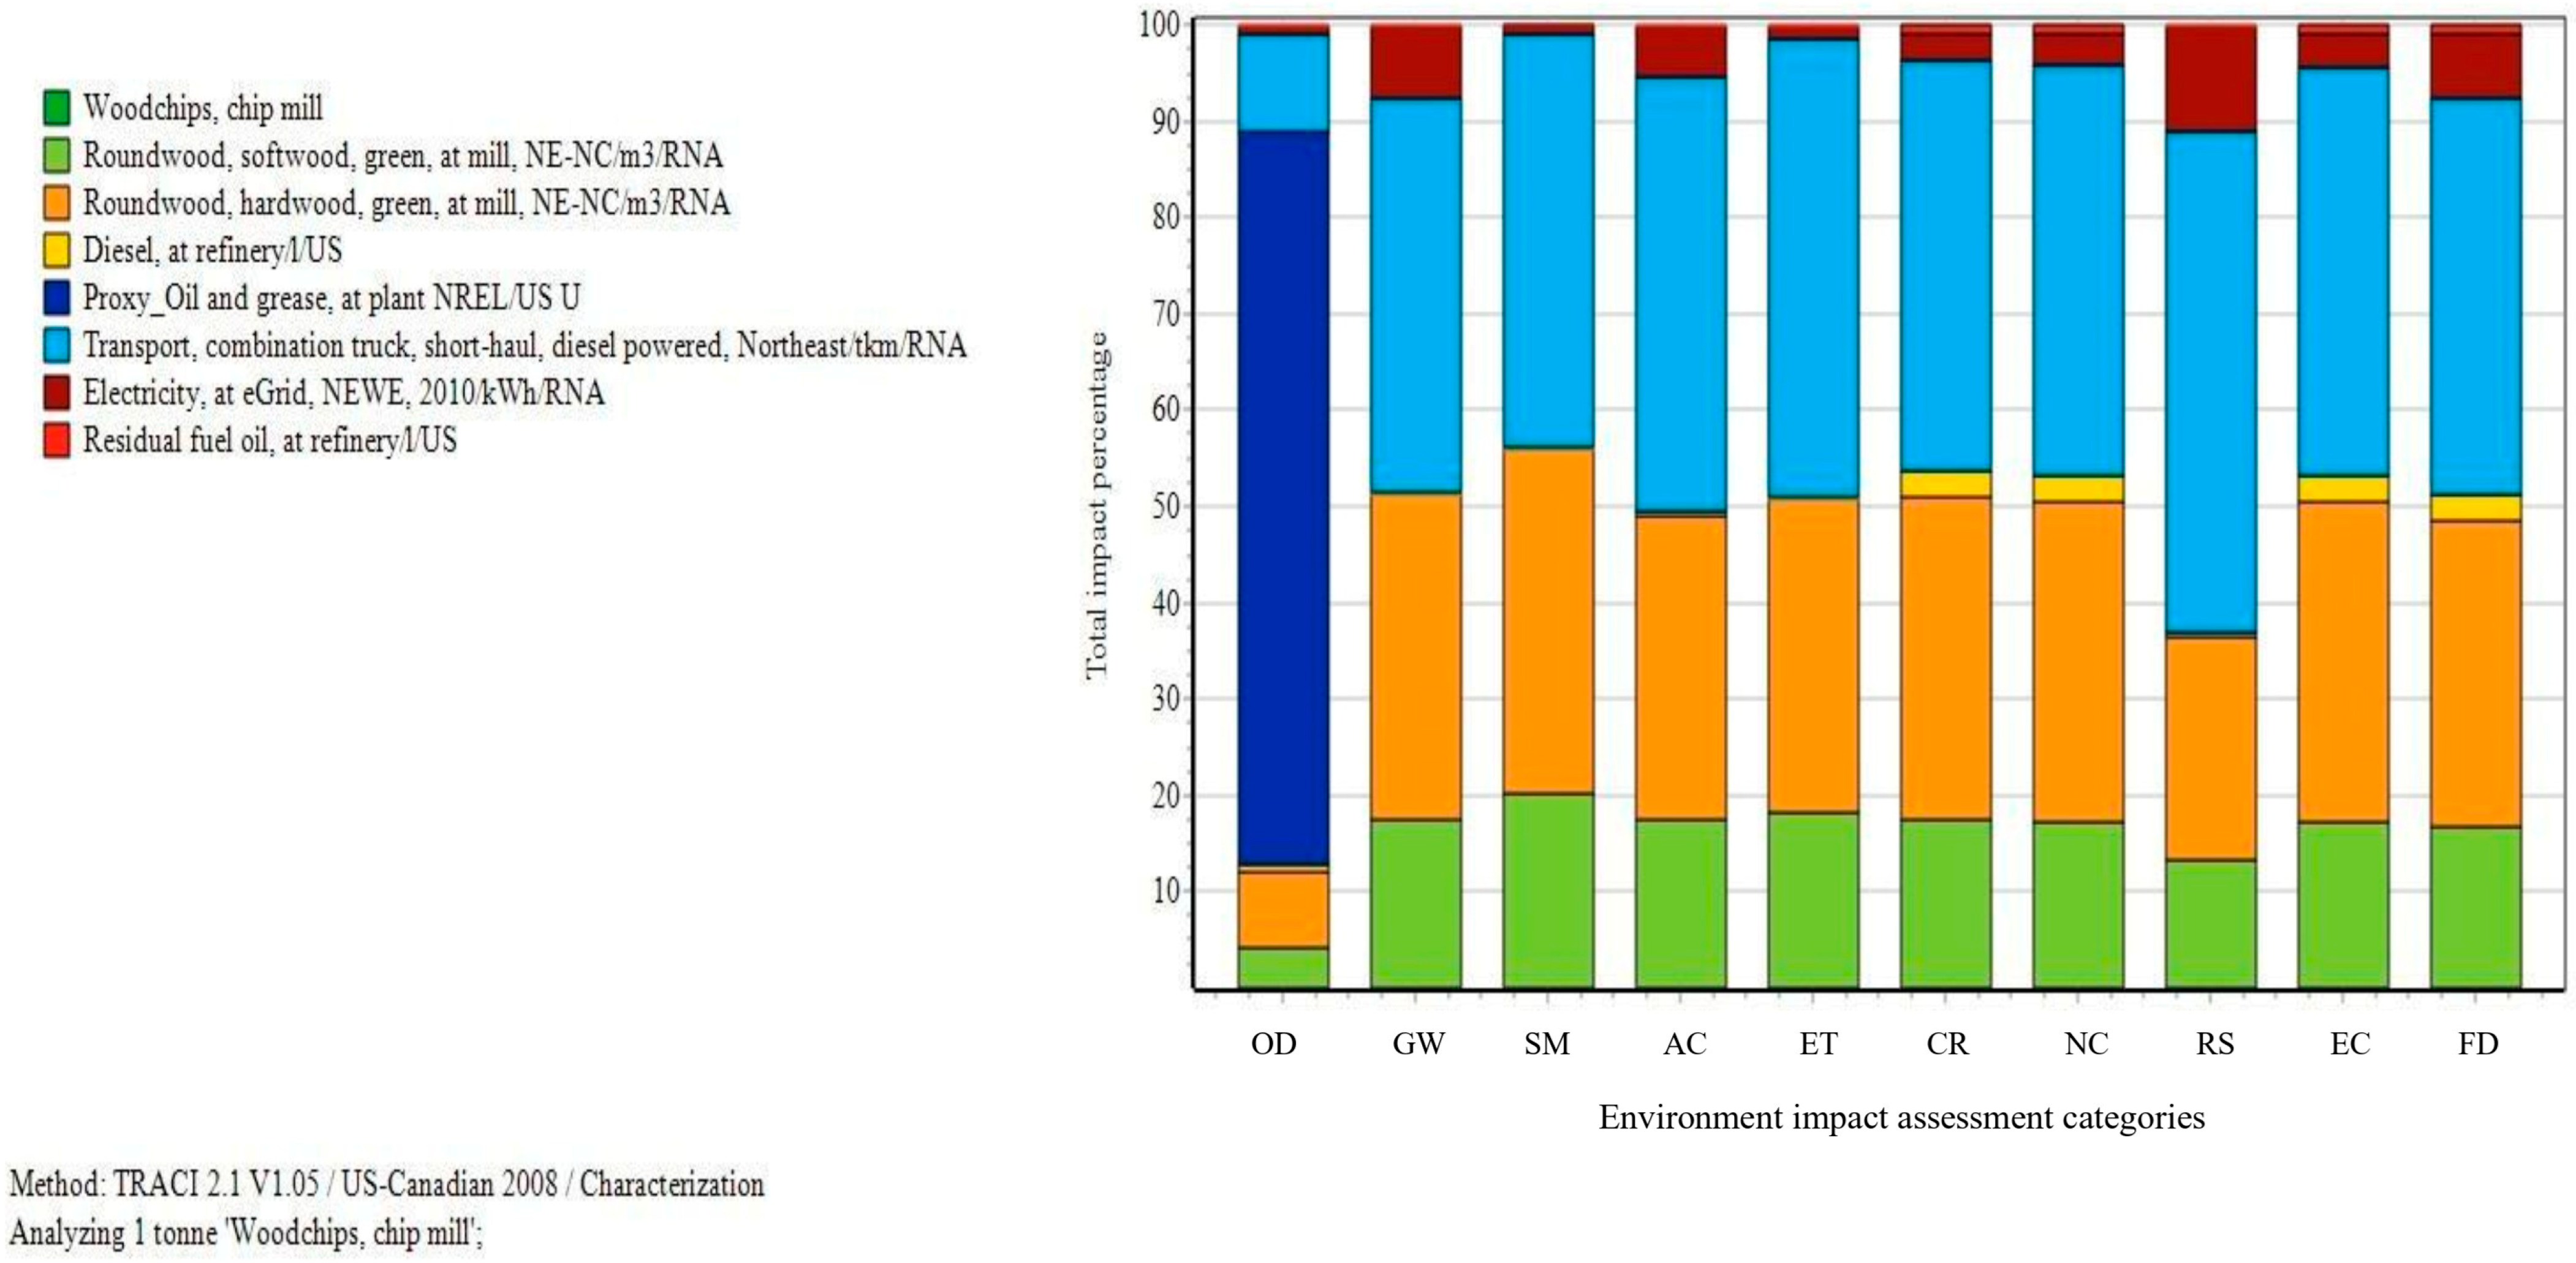
The impacts from material and energy flows (wood, lubricants, electricity, diesel, heating, and transportation) in the production and shipping of 1 tonne of green wood chip from a chip mill consuming mixed roundwood is shown in Figure 2. Transportation contributed heavily (41%) to all EIACs except ozone depletion, followed by raw material (round wood, hardwood, 30%). Similar trends were observed by other LCA studies [13,18,31,32]. About 76% of ozone depletion was contributed by lubricants, followed by transportation. Ozone-depleting compounds like methyl alcohol, toluene, and other volatile organic compounds are found in lubricants [33,34].
Figure 2.
Normalized impact assessment graph showing relative contribution of inputs for 1 tonne of wood chips at chip mill (OD—ozone depletion; GW—global warming potential; SM—smog; AC—acidification; ET—eutrophication; CR—carcinogenic; NC—non-carcinogenic; RS—respiratory effects; EC—ecotoxicity; FD—fossil fuel depletion).
The average contribution of hardwood (30%) across all EIACs was almost twice that of softwood (16%). The input with the least effect on all impact assessment categories was the residual fuel oil used to heat the facility [13]. The substances contributing to the different EIACs were HCFC 140, carbon dioxide (CO2), nitrogen oxides (NOx), ammonia (NH3), arsenic (As), antimony (Sb), and coal (C) [10,30]. Normalization of the EIACs showed that carcinogenic substances was the impact category of maximum concern. This finding indicates that the facility could focus first on mitigating the release of carcinogenic substances to make their products more environmentally friendly. The carbon footprint of the facility was 49.5 kg CO2 eq tonne−1 (kg of CO2 equivalent per tonne) of wood chips produced. This result compares favorably with data from Murphy et al. [35], who reported a carbon footprint of wood chips from Europe ranging from 51.2 to 86.7 kg CO2 eq oven dry tonne−1.
3.1.2. In-Woods Chipping
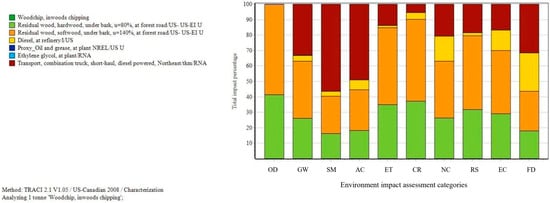
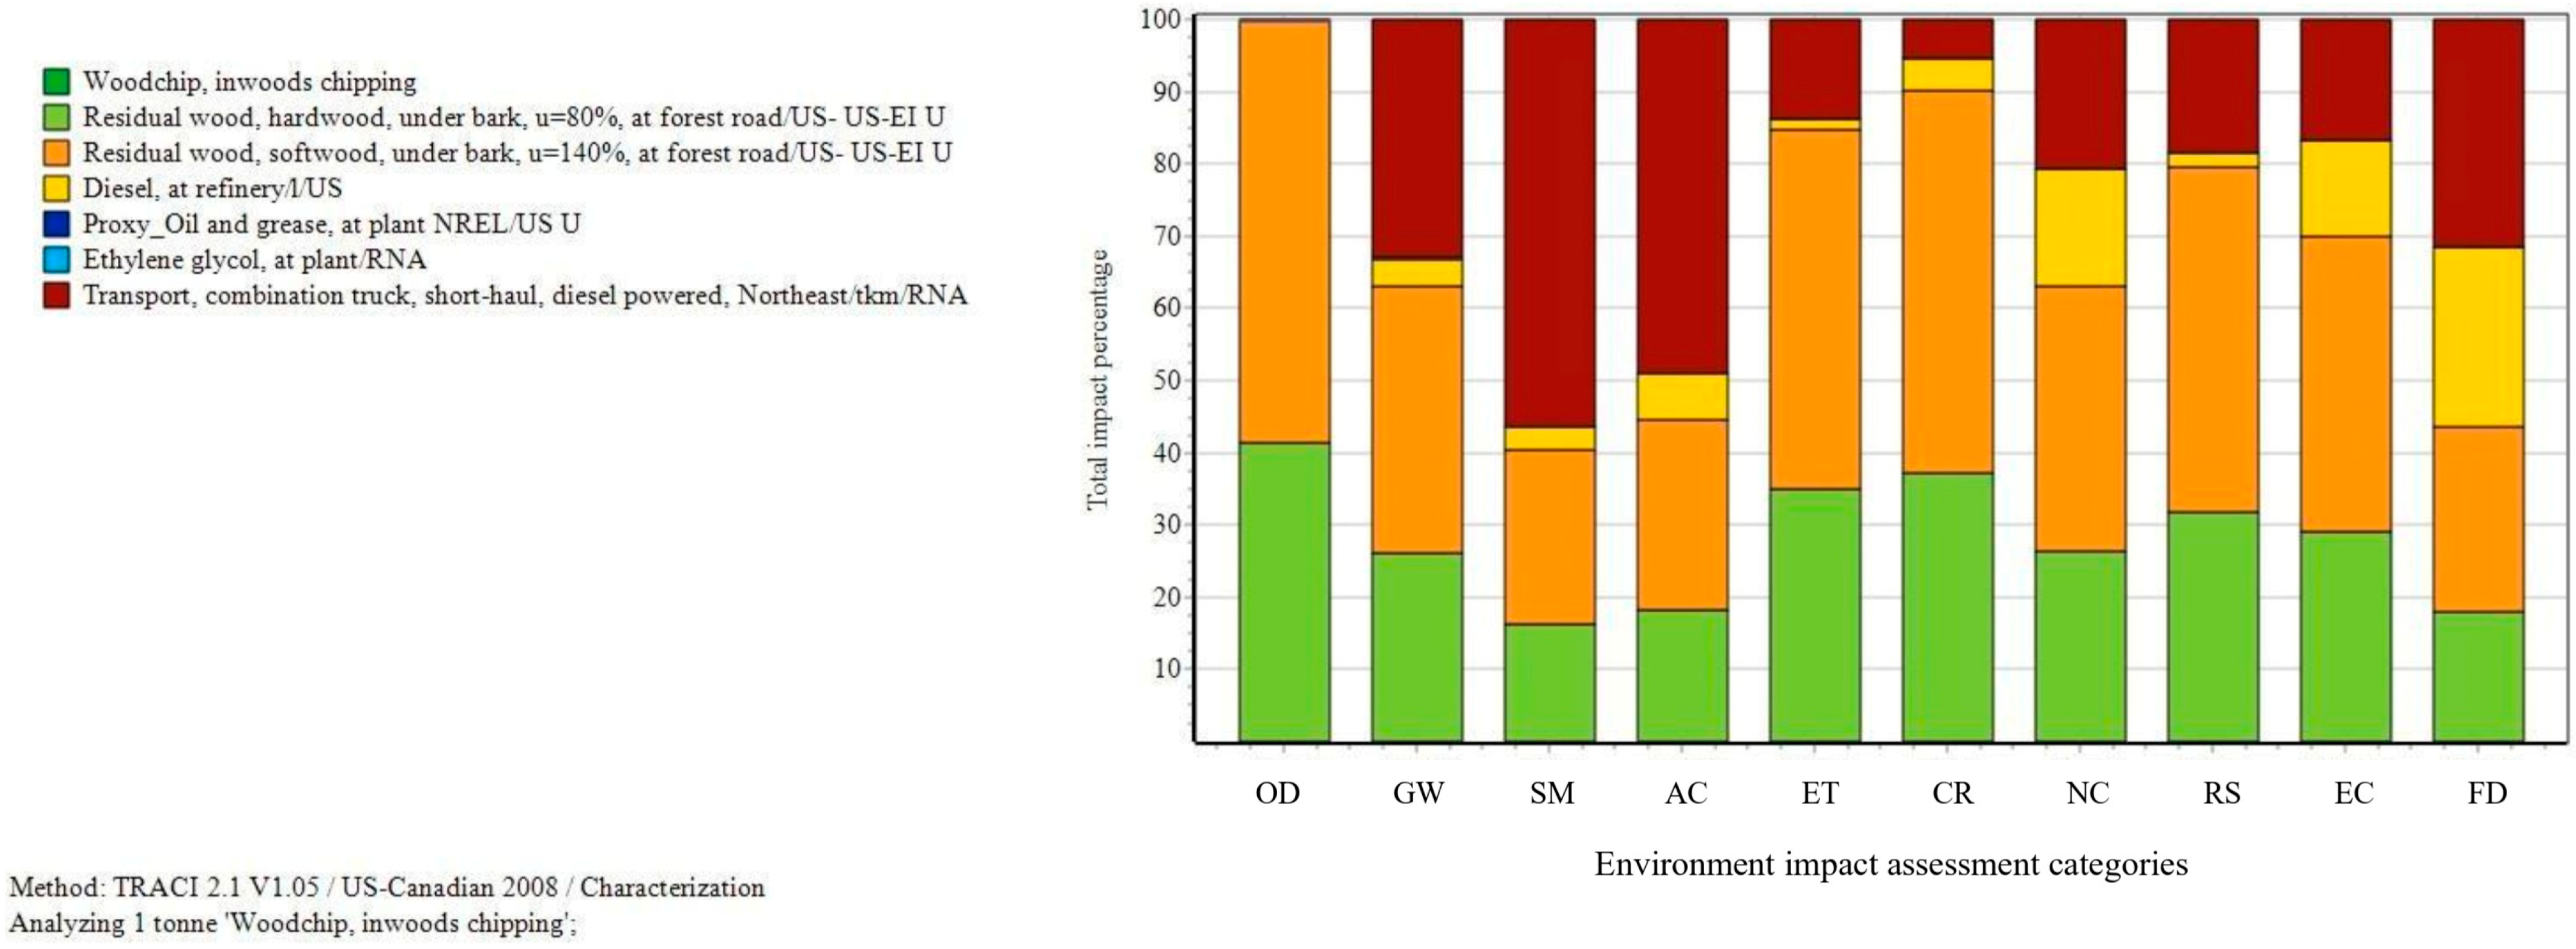
The LCA of 1 tonne of green wood chips produced at the forest operation landing and its transportation to the first point of consumption is shown in Figure 3. The carbon footprint of in-woods chipping was 21.7 kg CO2 eq tonne−1 of wood chips produced. The reported carbon footprint of in-woods chipping varied highly between different studies, ranging from 16.2 to 23.3 kg CO2 eq tonne−1 by Abbas & Handler [13] and 35.5 kg CO2 eq tonne−1 by Johnson et al. [36]. Antifreeze (ethylene glycol) used by the equipment and lubricants had the least impact on EIAC because of the small amount used. On average, for all EIAC, the contribution of raw material (residual softwood = 40%; hardwood = 28%) was the highest, followed by transportation (25%) [20]. This might be due to the energy spent and emission on harvesting and processing small-diameter trees [13,36]. More research is needed to understand the contribution of forest operations to EIAC in the region. Studies have shown that the productivity of logging equipment decreases as the size of wood handled decreases [15]. The substances that contributed the maximum to EIAC were the same as the chip mill, except for ozone depletion. Freon 114 (CFC 114) contributed the maximum to ozone depletion. Carcinogenic substances were the EIAC of concern for in-woods chipping also.
Figure 3.
Normalized impact assessment graph showing the relative contribution of the inputs for 1 tonne of wood chips at in-woods (OD—ozone depletion; GW—global warming potential; SM—smog; AC—acidification; ET—eutrophication; CR—carcinogenic; NC—non-carcinogenic; RS—respiratory effects; EC—ecotoxicity; FD—fossil fuel depletion).
3.1.3. Hardwood Sawmill
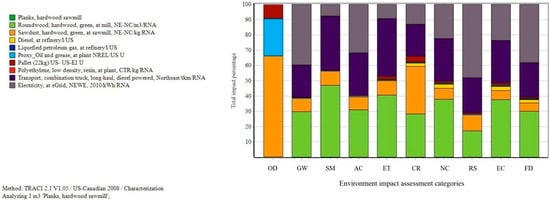
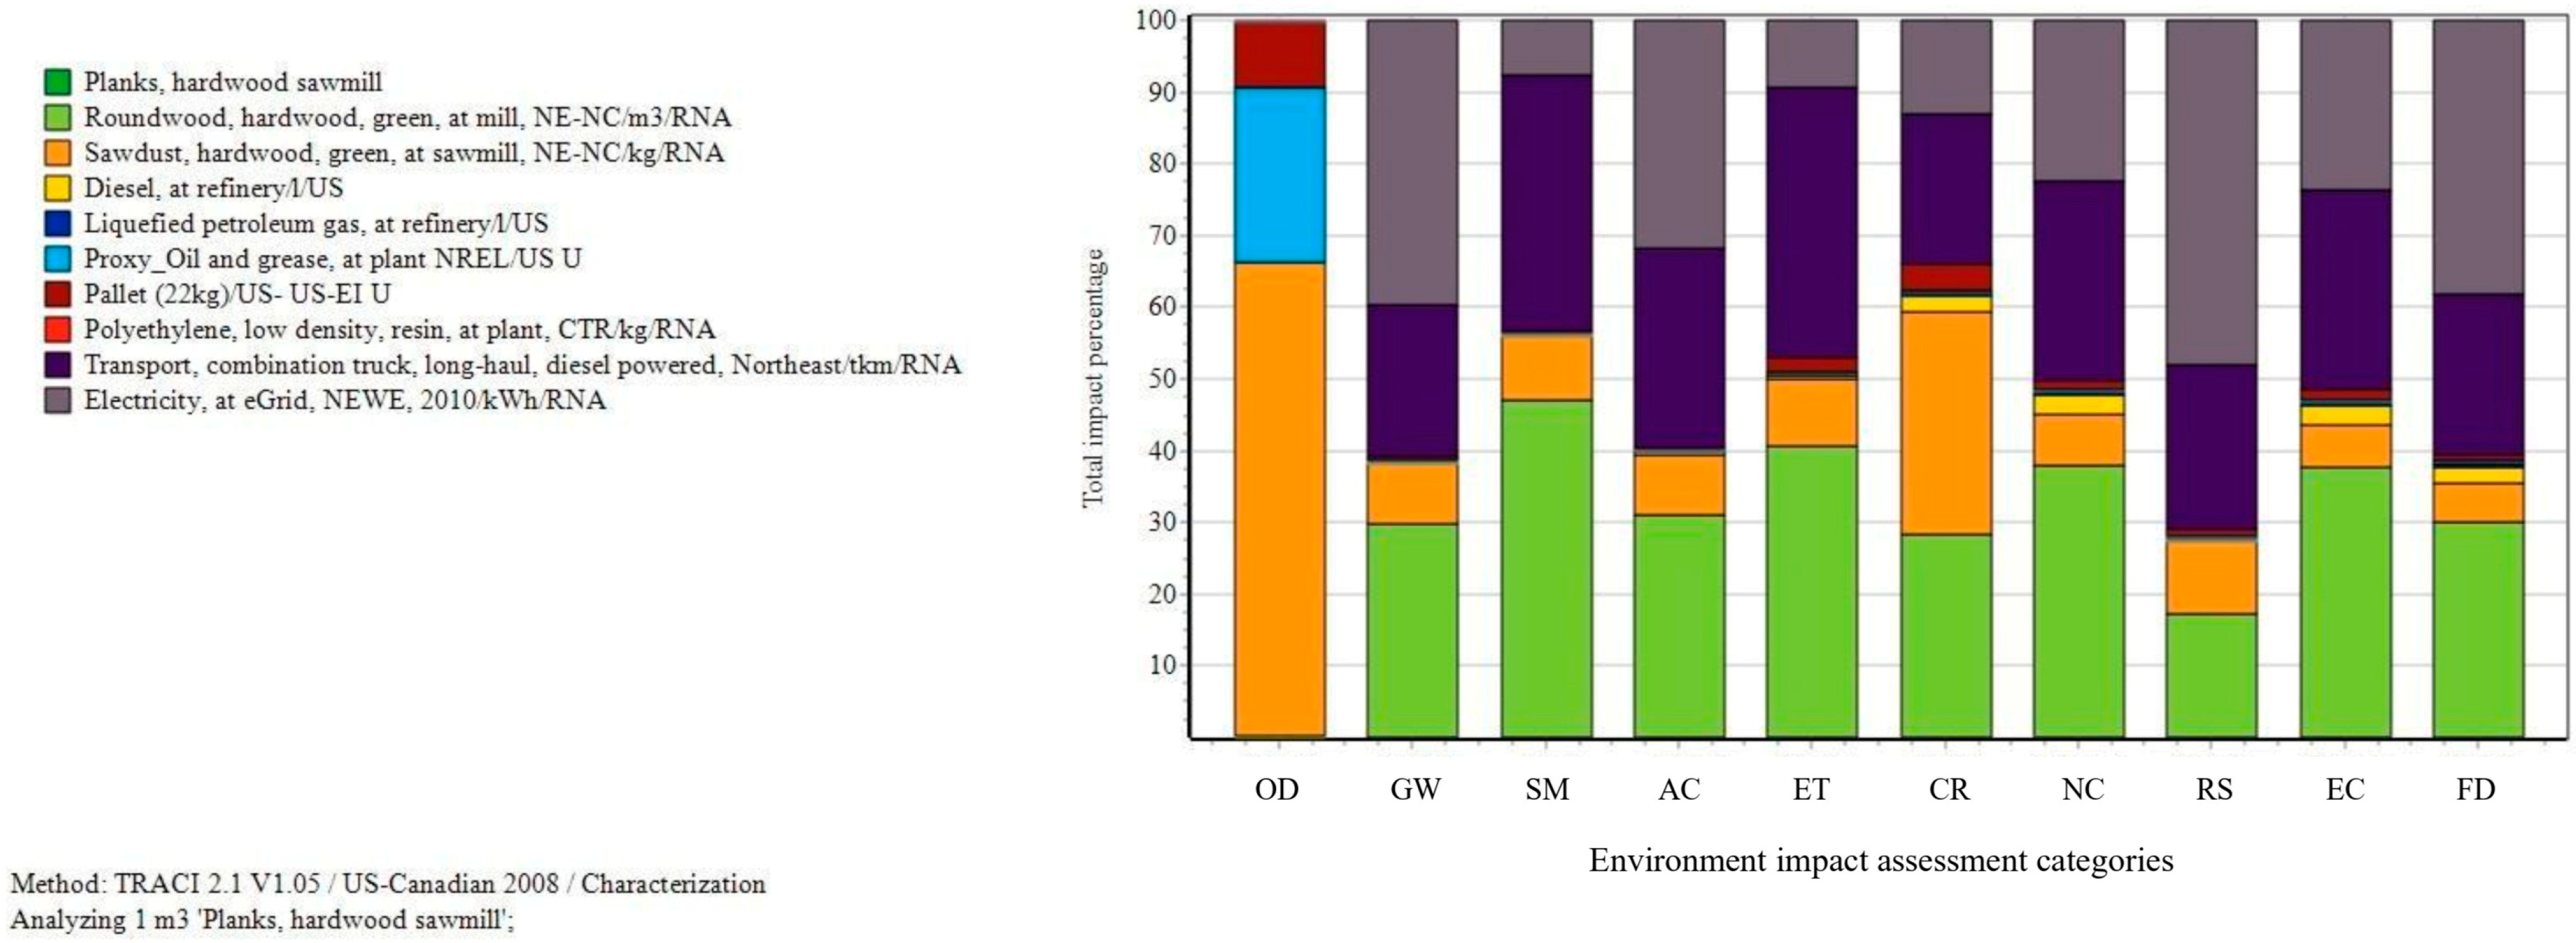
During the production of 1 m3 of hardwood plank, similar to in-woods chipping, the contribution of raw material (round wood, hardwood = 30%) was highest, followed by transportation (24%) (Figure 4) [31,35]. Low-density polyethylene for packing contributed the least to the EIAC, which was directly related to the small quantity consumed [10,37]. The EIAC of maximum concern and the substances which contributed the maximum to the EIAC were similar to in-woods chipping except for smog (isoprene) and non-carcinogenic (acrolein).
Figure 4.
Normalized impact assessment graph showing the relative contribution of inputs for 1 m3 of hardwood plank at sawmill (OD—ozone depletion; GW—global warming potential; SM—smog; AC—acidification; ET—eutrophication; CR—carcinogenic; NC—non-carcinogenic; RS—respiratory effects; EC—ecotoxicity; FD—fossil fuel depletion).
The carbon footprint of the facility for the primary product was 72.9 kg CO2 eq m−3 of lumber produced. Reported GWP for hardwood lumber ranged from 131 to 250 kg CO2 eq m−3 [31,38]. This might be because the facility assessed in this study was not planing the lumber produced. The electricity used by the facility was 141 kWh m−3 of rough-sawn plank produced, which was high than Hubbard et al. [38] (97 kWh m−3, excluding planing). The facility was comparatively old, and the manager informed us that they would be updating the facility. Since both facilities used electricity from the grid (not differentiated based on the generation method), the lesser efficiency of old production systems could explain this difference.
3.1.4. Softwood Sawmill
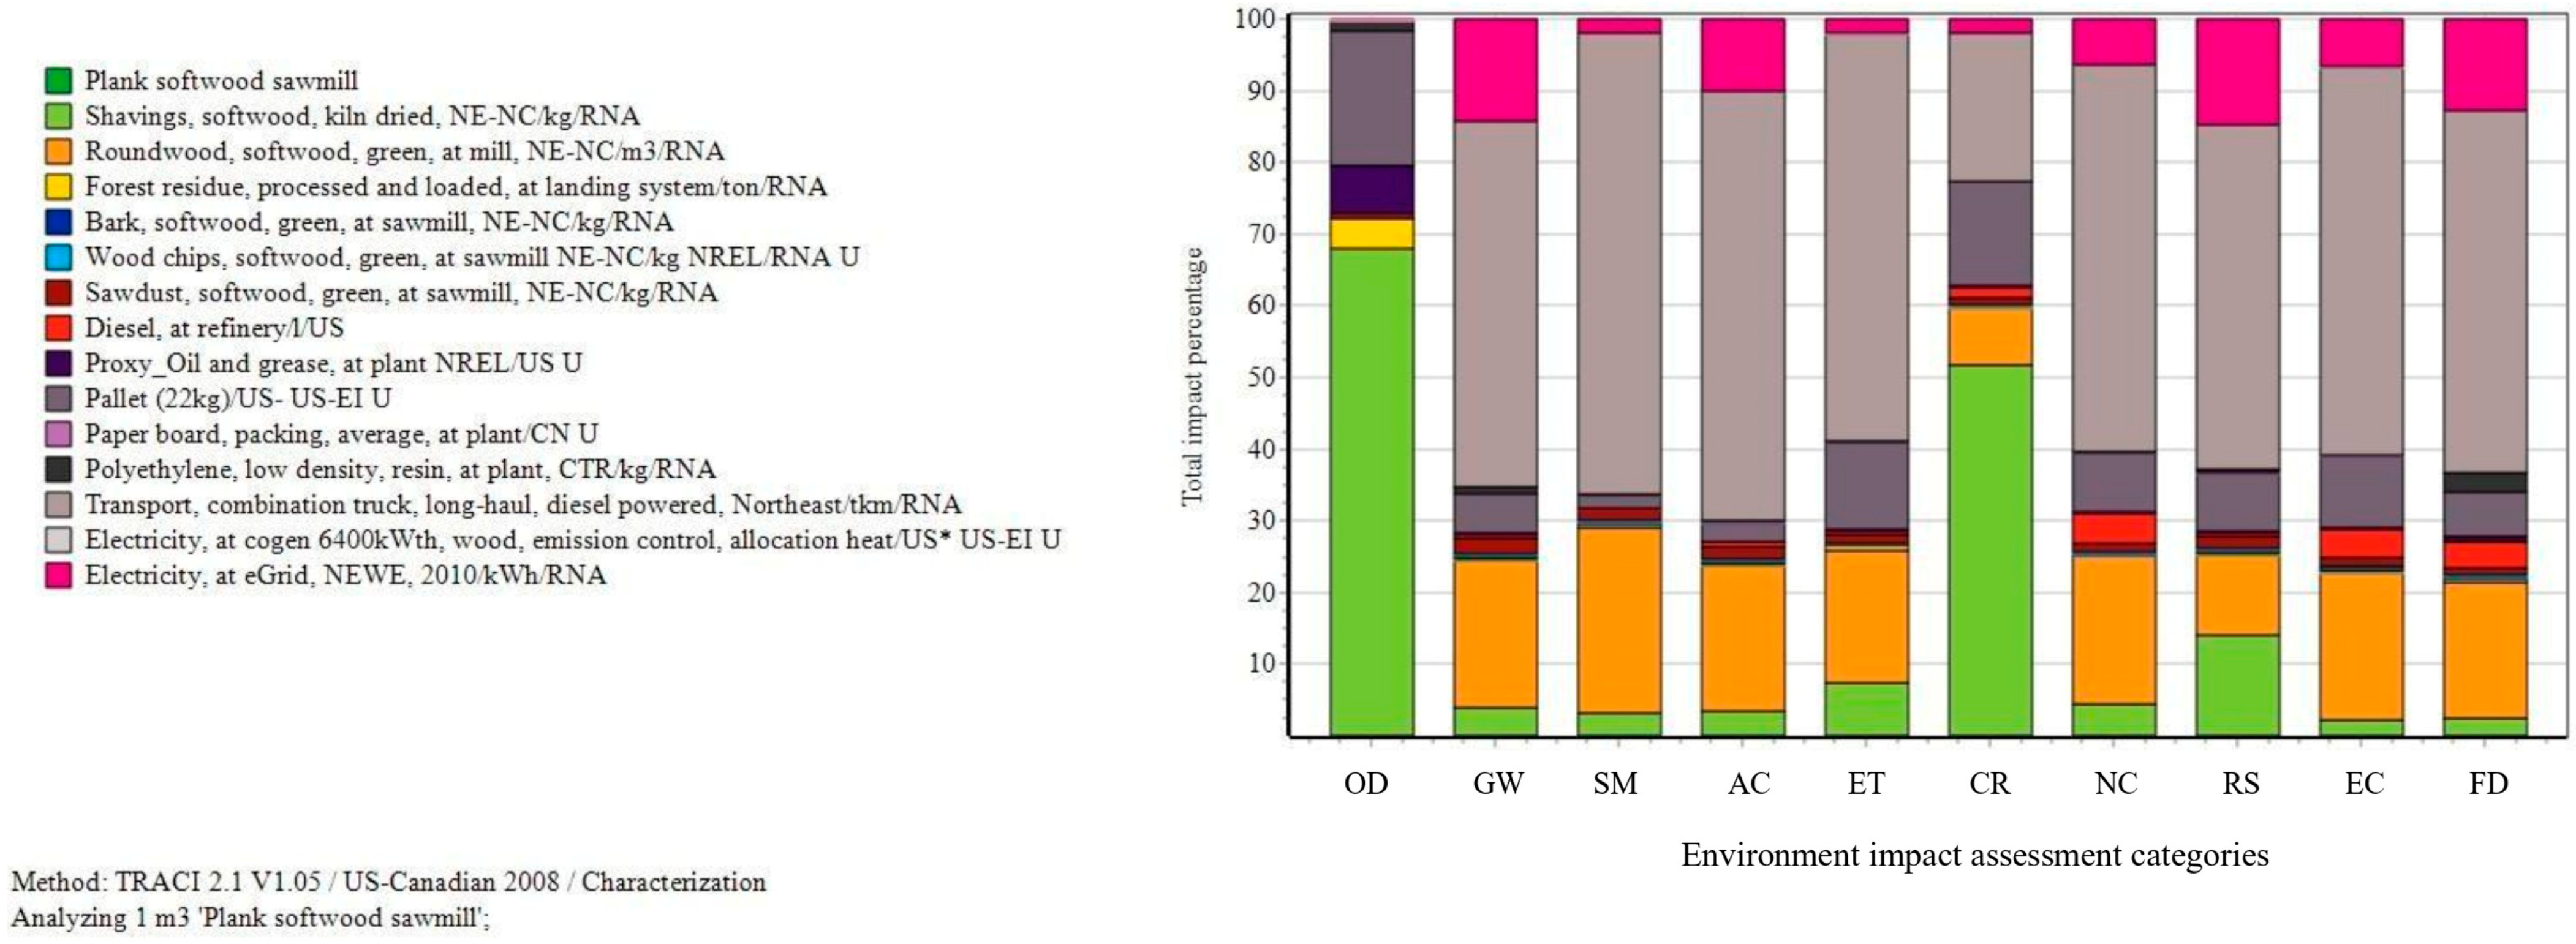
For the hardwood sawmill, during the production of 1 m3 of softwood plank, the highest environmental impact was by transportation (46%), followed by raw material (round wood, softwood = 16%) (Figure 5; [18,31]). The impact of electricity co-generation with heat was meager. The EIAC of maximum concern and the substances which contributed the maximum to the EIAC were similar to the hardwood sawmill. The carbon footprint estimated for softwood lumber in the Northeast U.S. was 78.38 kg CO2 eq m−3 [18], which was comparable to the findings of this study, 73.7 kg CO2 eq m−3. The facility studied was comparatively new; hence, even with an additional production stage (planing), there was not much difference in carbon footprint when compared to the hardwood sawmill (72.9 kg CO2 eq m−3).
Figure 5.
Normalized impact assessment graph showing the relative contribution of the inputs for 1 m3 of softwood plank at sawmill (OD—ozone depletion; GW—global warming potential; SM—Smog; AC—acidification; ET—eutrophication; CR—carcinogenic; NC—non-carcinogenic; RS—respiratory effects; EC—ecotoxicity; FD—fossil fuel depletion).
3.2. Product Comparison
3.2.1. Wood Chips from All Four Processes
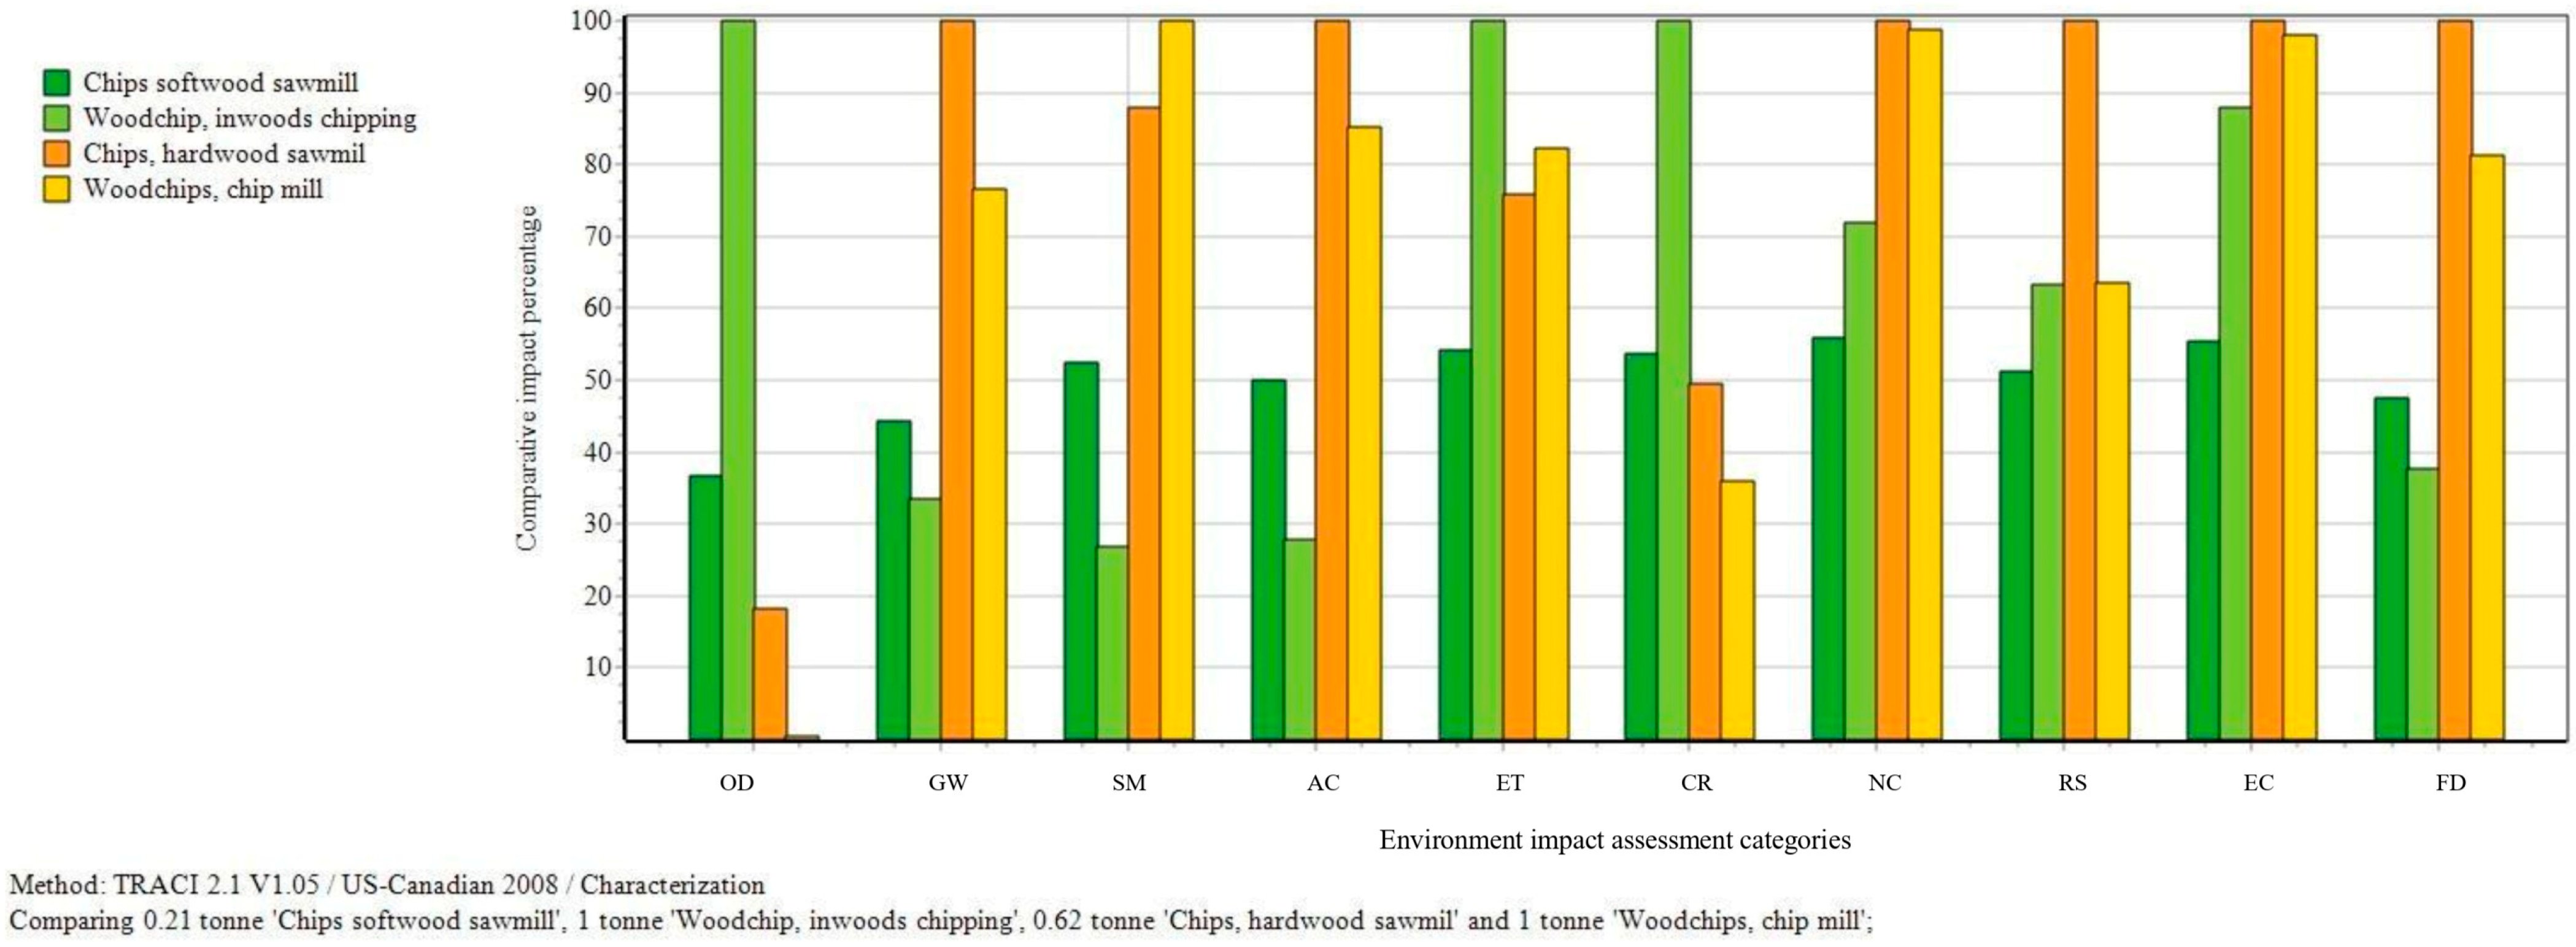
In all the four forest product processes studied, wood chips were common as primary product or co-product. Wood chips were the primary product in chip mill and in-woods chipping, whereas it was a co-product in sawmills (Figure 6). Among EIACs, chips from the hardwood sawmill had the highest impact. The carbon footprint of wood chips from the chip mill, in-woods chipping, hardwood sawmill, and softwood sawmill were 49.5, 21.7, 64.6, and 28.6 kg CO2 eq tonne−1, respectively (Table 2). This shows that it is environmentally feasible and less damaging to produce chips in-woods. However, Paulson et al. [39] claims that the cost of chipping operation between chipping in-woods or at a facility is a variable of the scale of operations. Using in-woods chips as feedstock will reduce the impact of products down the supply chain compared to chips from other production facilities. The softwood assessed sawmill used whole tree chips to co-generate heat and electricity (Table 1). The facility manager said it is more economically feasible for them to use whole-tree chips from outside than chips (co-product) from their facility.
Figure 6.
Comparative impact assessment graph showing the relative contribution of inputs for wood chips from all the selected four processes with relation to functional unit (OD—ozone depletion; GW—global warming potential; SM—smog; AC—acidification; ET—eutrophication; CR—carcinogenic; NC—non-carcinogenic; RS—respiratory effects; EC—ecotoxicity; FD—fossil fuel depletion).
Table 2.
Carbon footprint/global warming potential (GWP) of all products for one functional unit of primary product.
Chips from sawmills were well dried and devoid of bark. They can be used as feedstock for other wood products and can become part of a circular bioeconomy [23]. When co-products are used as feedstock for another production facility, the environmental impact of the new product will be less because the environmental impacts have already been accounted for in the original production process. Figure 6 depicts the same; even though more resources were used to produce 1 m3 of softwood plank, the impact of the co-product was lesser or on par with chip mill and in-woods chipping. EIACs for hardwood chips may be higher due to higher allocation for chips (35%) compared to the softwood mill (19%). The allocation percentage for different products and co-products from softwood and hardwood mills was planks (49 and 40), bark (8 and 17), sawdust (13 and 7), and chips (19 and 35), respectively. The softwood mill had an additional 11% co-product in the form of shaving. These values were obtained from the sawmills based on their actual product and co-product output estimation.
3.2.2. Chip Mill vs. In-Woods Chipping
For wood chips (1 tonne) from the chip mill and in-woods chipping, there was a difference of 55% in GWP (Figure 6); GWP was lowest for in-woods chipping. Even though both produced green chips, there was a great quality difference in the product, raw material used, and production facilities. This difference may also be attributed to the fact that the residue used for in-woods chipping was a co-product of timber harvesting [31]. But, as mentioned earlier, there may be chances for consuming more energy and resources while processing smaller trees.
From another perspective, in-wood chipping utilizes more non-merchantable wood material (often harvest residues) from the forest stand, which could not have been transported to the chip mill [39]. In-wood chipping is also used as a tool for reducing fuel from the forest floor or/and for facilitating tree planting activities after the final harvest. In this regard, in-wood chipping is often a part of the forest management prescriptions [15]. However, the cost of transporting the chipped material to the final destination is most commonly the bottle neck in terms of feasibility for any in-wood chipping process [25]. These woodchips were usually transported on forest roads compared to woodchips generated from mills, which further increases the secondary transportation costs.
3.2.3. Hardwood vs. Softwood Sawmill
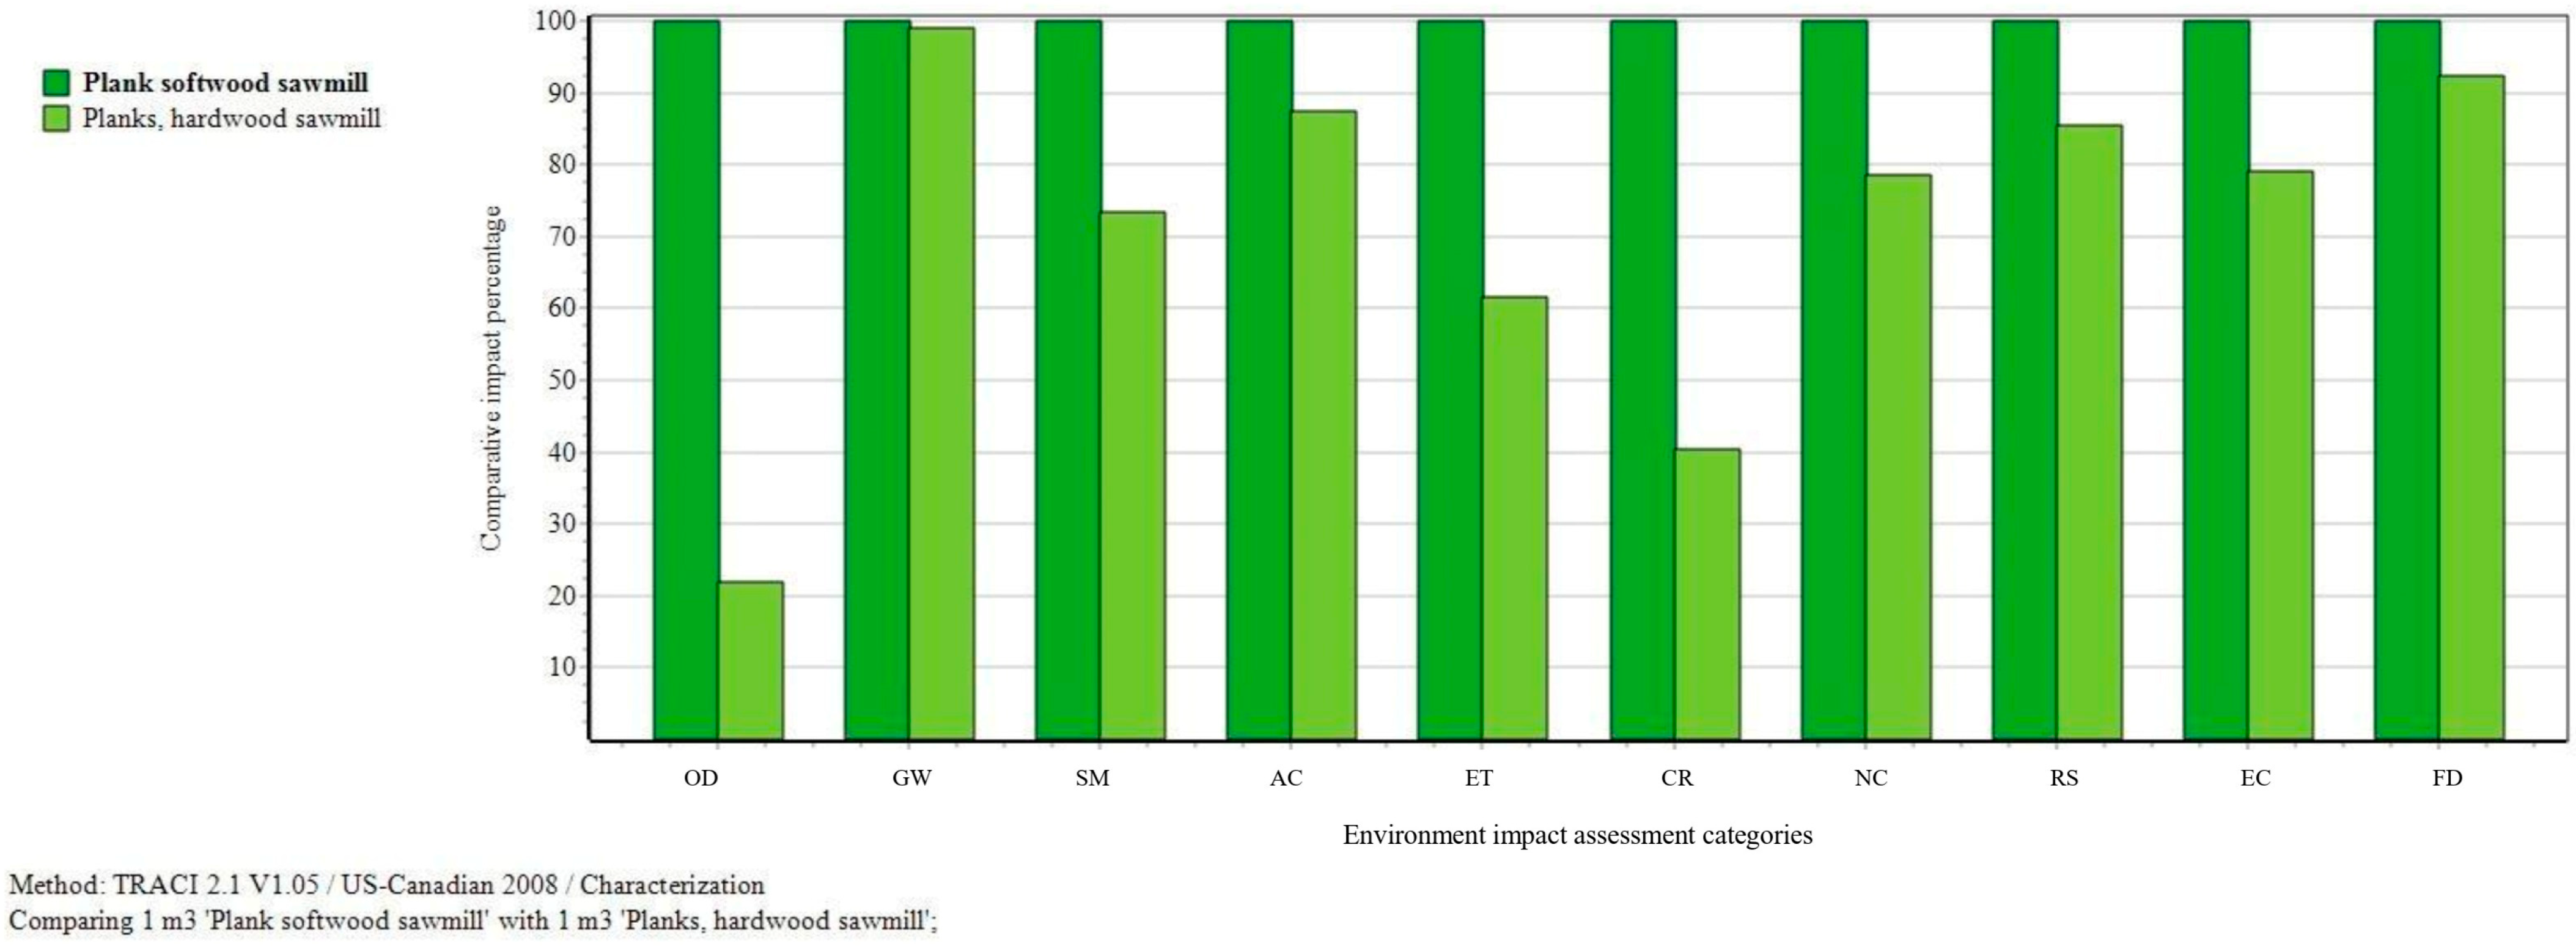
The softwood sawmill had the highest impact on all EIACs to produce 1 m3 of plank (Figure 7). The carbon footprint was 72.9 and 73.7 kg CO2 eq m−3 for hardwood and softwood mills, respectively. This difference can be attributed to the varied production process mentioned in the methodology section. Even though the softwood mill was relatively new and consumed less electricity per cubic meter of plank (61.38 kWh), the hardwood mill studied (140.58 kWh m−3) had a lower overall impact. Advanced technology is expected to have better efficiency and lower emissions [40,41]. Factors contributing to higher impact for categories other than global warming would be due to the transportation of products to farther distances (804.8 km) than for the hardwood sawmill (402.3 km) (Figure 5; Table 1).
Figure 7.
Impact assessment graph showing relative contribution of inputs for 1 m3 of hardwood and softwood plank at sawmill (OD—ozone depletion; GW—global warming potential; SM—smog; AC—acidification; ET—eutrophication; CR—carcinogenic; NC—non-carcinogenic; RS—respiratory effects; EC—ecotoxicity; FD—fossil fuel depletion).
3.2.4. Comparing the Production Facilities
The study compares discrete forest products used for different end-uses. For example, softwood and hardwood sawn lumber are generally used in the construction or furniture manufacturing whereas wood chips are primarily used for energy generation. These products serve different purposes and value chains, which makes their environmental impact profiles different. Therefore, a direct comparison of their carbon footprints on a per-unit basis (e.g., per m3 of lumber vs. per tonne of wood chips) should not be done. LCA results should not be compared when the functional unit and system boundaries are different. Additionally, these results cannot be generalized for the industry at large. However, the study evaluates the carbon emissions which can be utilized by policy makers and the industry stakeholders to carbon budget at a regional level.
3.3. Global Warming Potential
Among the EIACs described in the manuscript, there is a major focus on GWP, as it determines the basis of carbon trading and future climatic conditions. Softwood planks had the highest GWP among primary products, and in-woods chips had the least. Hardwood chips got the highest GWP among co-products, and the lowest was for chip mill bark (Table 2). GWP or other EIACs of co-products depend on percentage allocation during the life cycle inventory. For chip mill bark, the percentage allocation was 16%, and for hardwood sawmill chips, the percentage allocation was 34%. As mentioned earlier, using co-products as feedstock (or co-generation energy) for a production process will reduce the impact of products down the supply chain.
3.4. Effect of Transportation on Global Warming Potential
For all the production processes assessed, transportation distance was the input contributing the maximum or the second maximum (Figure 2, Figure 3, Figure 4 and Figure 5). The role of transportation towards GWP is acknowledged by researchers [10,18], and it contributes the largest portion (30%) to U.S. GHG. The input to LCA considered the average distance (in tonne km (tkm)) for multiple destinations from each facility. Sensitivity analysis showed that a 50% increase or decrease in transportation distance could change the GWP of a product by 17% in either a positive or negative direction. Similarly, for 100%, there could be a 35% change in GWP (Table 3).
Table 3.
Carbon footprint of production facilities with 50% (1.5) or 100% (2.0) increase or decrease in transportation distance. The value in parentheses is the percent change.
In recent years, rail transportation for wood products has started to gain more traction in the Northeastern US. This can not only reduce the cost of transportation but can also favor the environment in terms of GWP. Substituting rail transportation for the combination truck gave an average GWP reduction of 30% (Table 4). Rail has a smaller carbon footprint because it transports a greater quantity per trip, and is more fuel-efficient [42]. As a rule of thumb, the cost of rail transportation is one third of the cost of trucking. A “what-if analysis” for in-woods chipping was not performed because it may not be practical to build rail to connect forest parcels. The percentage change in carbon footprint in response to change in transportation mode was least for the hardwood sawmill (16%) because transportation was not the most contributing input (Figure 4). The softwood mill had the highest at 39%, with transportation being the most influential factor impacting GWP. Sawn lumber and woodchips are currently transported using rail roads in the region.
Table 4.
Change in carbon footprint of production facilities when rail was used for transportation of products instead of combination truck.
4. Conclusions
The study performed LCA case studies of four wood production facilities from the mill log yard to the first point of delivery. Impact assessment showed that transportation was the highest-contributing input parameter to EIACs for the chip mill and softwood sawmill. Raw materials (wood) contributed the maximum (average of all EIACs) for in-woods chipping and the hardwood sawmill. Major substances contributing to each EIAC were chlorofluorocarbon (CFC), carbon dioxide (CO2), ammonia (NH3), arsenic (As), antimony (Sb), nitrogen dioxide (NO2), isoprene (2-methyl-1,3-butadiene), acrolein, and coal (C). Comparing different products showed the importance of percentage allocation during life cycle inventory, especially for co-products. Softwood planks had the highest GWP, and chip mill bark had the lowest GWP among all the products and co-products assessed. The results of this study could assist policy makers and the forest industry to budget carbon at a regional level. On average, there was a 17% and 35% change in GWP when transportation distance increased or decreased by 50% or 100%, respectively. A GWP decrease of 30% was observed if rail was used instead of combination trucks, implying the importance of rail transportation in the forest product industry to reduce operational cost and environmental impact. One of the limitations of the study was that there was only one sample for each production facility, which limits the generalization and applicability of the results. However, this research sheds light on carbon emission from the general practices followed by these production centers. Since LCA follows ISO standards, it will be possible to compare these results with similar production facilities. Other limitations include the uncertainty in database values obtained from the LCI database. The human resources used for the production processes were not considered. Future research should incorporate data from more facilities and expand the study boundary.
Author Contributions
Conceptualization, A.K.G. and A.R.K.; methodology, A.K.G. and A.R.K.; software, A.K.G. and A.A.; validation, A.K.G., A.R.K., A.A., L.T.L. and H.S.; writing—original draft preparation, A.K.G.; writing—review and editing, A.K.G., A.R.K., A.A., L.T.L. and H.S.; funding acquisition, A.R.K. All authors have read and agreed to the published version of the manuscript.
Funding
This work was supported by the funding from McIntire-Stennis project number #ME042415 through the Maine Agricultural and Forest Experiment Station.
Data Availability Statement
The research data is available upon request to the authors.
Acknowledgments
The authors would like to express our gratitude to Stephen Shaler, Adam Daigneault, Ling Li, Shane O’ Neil, Douglas Gardner, Laura Kenefic (U.S. Forest Service), Pascal Berrill (Cal Poly Humboldt, Ca), and Homei Gu (Forest Products Lab, WI) for supporting this project. We would like to express our sincere appreciation to the production facilities who opened their gates for data collection.
Conflicts of Interest
The authors declare no conflicts of interest. The funders had no role in the design of the study; in the collection, analyses, or interpretation of data; in the writing of the manuscript; or in the decision to publish the results.
References
- Alzamora, R.M.; Oviedo, W.; Rubilar, R. Life cycle analysis to estimate CO2 e emissions from forest harvesting systems in intensively managed Pinus radiata plantations. Scand. J. For. Res. 2022, 37, 144–152. [Google Scholar] [CrossRef] [Scilit]
- Haya, B.K.; Evans, S.; Brown, L.; Bukoski, J.; Butsic, V.; Cabiyo, B.; Jacobson, R.; Kerr, A.; Potts, M.; Sanchez, D.L. Comprehensive review of carbon quantification by improved forest management offset protocols. Front. For. Glob. Change 2023, 6, 958879. [Google Scholar] [CrossRef] [Scilit]
- Austin, K.G.; Baker, J.S.; Sohngen, B.L.; Wade, C.M.; Daigneault, A.; Ohrel, S.B.; Ragnauth, S.; Bean, A. The economic costs of planting, preserving, and managing the world’s forests to mitigate climate change. Nat. Commun. 2020, 11, 5946. [Google Scholar] [CrossRef] [Scilit]
- FPInnovations Sustainability. FPInnovations. 2021. Available online: https://web.fpinnovations.ca/forest-operations-solutions-to-help-the-canadian-forest-industry/sustainability/ (accessed on 11 April 2022).
- Marchi, E.; Chung, W.; Visser, R.; Abbas, D.; Nordfjell, T.; Mederski, P.S.; McEwan, A.; Brink, M.; Laschi, A. Sustainable Forest Operations (SFO): A new paradigm in a changing world and climate. Sci. Total Environ. 2018, 634, 1385–1397. [Google Scholar] [CrossRef] [Scilit]
- Schulze, E.D.; Bouriaud, O.; Irslinger, R.; Valentini, R. The role of wood harvest from sustainably managed forests in the carbon cycle. Ann. For. Sci. 2022, 79, 17. [Google Scholar] [CrossRef] [Scilit]
- Alizadeh, P.; Mupondwa, E.; Tabil, L.G.; Li, X.; Cree, D. Life cycle assessment of bioenergy production from wood sawdust. J. Clean. Prod. 2023, 427, 138936. [Google Scholar] [CrossRef] [Scilit]
- González-García, S.; Bonnesoeur, V.; Pizzi, A.; Feijoo, G.; Moreira, M.T. Comparing environmental impacts of different forest management scenarios for maritime pine biomass production in France. J. Clean. Prod. 2014, 64, 356–367. [Google Scholar] [CrossRef] [Scilit]
- Alex, A.; Kizha, A.R.; George, A.K.; Bick, S.; Wang, J.; Klein, S.; Louis, L.T.; Li, L.; Perera, P.; Manohar, K.A. Carbon footprint of the predominant mechanized timber harvesting methods in the Northeastern US. Clean. Circ. Bioeconomy 2024, 9, 100097. [Google Scholar] [CrossRef] [Scilit]
- Pokhrel, G.; Gu, H.; Gardner, D.J.; O’Neill, S. Life Cycle Assessment (LCA) of Wood Flour and Pellets for Manufacturing Wood-Plastic Composites (WPCs). Recent Prog. Mater. 2022, 4, 1. [Google Scholar] [CrossRef] [Scilit]
- Galvín, R.M. Carbon footprint associated to urban water cycle of Córdoba (Spain). Brill. Eng. 2020, 1, 21–25. [Google Scholar] [CrossRef] [Scilit]
- Baumann, H.; Tillman, A.-M. The Hitch Hiker’s Guide to LCA: An Orientation in Life Cycle Assessment Methodology and Application; Studentlitteratur: Lund, Sweden, 2004; ISBN 978-91-44-02364-9. [Google Scholar]
- Abbas, D.; Handler, R.M. Life-cycle assessment of forest harvesting and transportation operations in Tennessee. J. Clean. Prod. 2018, 176, 512–520. [Google Scholar] [CrossRef] [Scilit]
- Rydin, L.; Svensson, V. Production of Biomethanol from Renewable Resources a Life Cycle Assessment with Incorporation of Biodiversity. Master’s Thesis, Chalmers University of Technology, Gothenburg, Sweden, 2022. [Google Scholar]
- Alex, A.; Kizha, A.R.; Louis, L.T.; George, A.K. Production economics and carbon footprint of an integrated timber harvesting operation in the Northeastern US. Energy Nexus 2024, 16, 100336. [Google Scholar] [CrossRef] [Scilit]
- ISO 14040:2006; Environmental Management—Life Cycle Assessment—Principles and Framework. International Standard Organization: Geneva, Switzerland, 2006.
- ISO-14044; Environmental Management-Life Cycle Assessment-Requirements and Guidelines. International Standard Organization: Geneva, Switzerland, 2006.
- Puettmann, M.; Oneil, E.; Bergman, R. Cradle to Gate Life Cycle Assessment of Softwood Lumber Production from the Northeast-North Central; University of Washington: Seattle, WA, USA, 2013; p. 33. [Google Scholar]
- Proto, A.R.; Bacenetti, J.; Macrì, G.; Zimbalatti, G. Roundwood and bioenergy production from forestry: Environmental impact assessment considering different logging systems. J. Clean. Prod. 2017, 165, 1485–1498. [Google Scholar] [CrossRef] [Scilit]
- Zhang, F.; Johnson, D.M.; Wang, J.; Yu, C. Cost, energy use and GHG emissions for forest biomass harvesting operations. Energy 2016, 114, 1053–1062. [Google Scholar] [CrossRef] [Scilit]
- Feucht, Y.; Zander, K. Consumers’ Attitudes on Carbon Footprint Labelling—Results of the SUSDIET Project; Johann Heinrich von Thünen-Institut: Braunschweig, Germany, 2017; p. 62. [Google Scholar]
- Thøgersen, J. Consumer behavior and climate change: Consumers need considerable assistance. Curr. Opin. Behav. Sci. 2021, 42, 9–14. [Google Scholar] [CrossRef] [Scilit]
- Li, L.; Wei, X.; Zhao, J.; Hayes, D.; Daigneault, A.; Weiskittel, A.; Kizha, A.R.; O’Neill, S.R. Technological advancement expands carbon storage in harvested wood products in Maine, USA. Biomass Bioenergy 2022, 161, 106457. [Google Scholar] [CrossRef] [Scilit]
- Mills, J.T. An Order Establishing the Governor’s Task Force on Creation of a Forest Carbon Program. 2021. Available online: https://www.maine.gov/governor/mills/sites/maine.gov.governor.mills/files/inline-files/EO%2081%2024.pdf (accessed on 29 March 2026).
- Koirala, A.; Kizha, A.R.; Roth, B.E. Perceiving major problems in forest products transportation by trucks and trailers: A cross-sectional survey. Eur. J. For. Eng. 2017, 3, 23–34. [Google Scholar]
- Palander, T.; Haavikko, H.; Kortelainen, E.; Kärhä, K.; Borz, S.A. Improving environmental and energy efficiency in wood transportation for a carbon-neutral forest industry. Forests 2020, 11, 1194. [Google Scholar] [CrossRef] [Scilit]
- Howitt, C.; Ghaffariyan, M.R. Truck configurations for efficient transportation of forest biomass: A short literature review. Silva Balc. 2025, 26, 19–27. [Google Scholar] [CrossRef] [Scilit]
- Crawley, A.; Hunt, E. Statewide Economic Contribution of Maine’s Forest Products Sector. Maine Forest Products Council. 2024; 36p. Available online: https://maineforest.org/wp-content/uploads/2025/10/2024-Economic-Report-FINAL-for-printing-AK.pdf (accessed on 29 March 2026).
- Tan, E.C.D.; Lamers, P. Circular Bioeconomy Concepts—A Perspective. Front. Sustain. 2021, 2, 701509. [Google Scholar] [CrossRef] [Scilit]
- Unnasch, S.; Buchan, L. Life Cycle Analysis of Renewable Fuel Standard Implementation for Thermal Pathways for Wood Pellets and Chips; Biomass Thermal Energy Council: Washington, DC, USA, 2021; p. 68. [Google Scholar]
- Sahoo, K.; Bergman, R.; Alanya-Rosenbaum, S.; Gu, H.; Liang, S. Life Cycle Assessment of Forest-Based Products: A Review. Sustainability 2019, 11, 4722. [Google Scholar] [CrossRef] [Scilit]
- Oneil, E.; Puettmann, M.E. A Life-Cycle Assessment of Forest Resources of the Pacific Northwest, USA. For. Prod. J. 2017, 67, 316–330. [Google Scholar] [CrossRef] [Scilit]
- Marbach, T.; Wright, B.R.; Palacios, C.F. Low Volatile and Ozone-Depleting Compound Free Solid Film Lubricant; Defense Technical Information Center: Fort Belvoir, VA, USA, 2000. [Google Scholar]
- U.S. Environmental Protection Agency. Ban for Nonessential Products Containing Ozone-Depleting Substances. Available online: https://www.epa.gov/ozone-layer-protection/ban-nonessential-products-containing-ozone-depleting-substances (accessed on 15 July 2022).
- Murphy, F.; Devlin, G.; McDonnell, K. Greenhouse gas and energy based life cycle analysis of products from the Irish wood processing industry. J. Clean. Prod. 2015, 92, 134–141. [Google Scholar] [CrossRef] [Scilit]
- Johnson, L.; Lippke, B.; Oneil, E. Modeling Biomass Collection and Woods Processing Life-Cycle Analysis. For. Prod. J. 2012, 62, 258–272. [Google Scholar] [CrossRef] [Scilit]
- Silvenius, F.; Katajajuuri, J.-M.; Grönman, K.; Soukka, R.; Koivupuro, H.-K.; Virtanen, Y. Role of Packaging in LCA of Food Products. In Proceedings of the Towards Life Cycle Sustainability Management; Finkbeiner, M., Ed.; Springer: Dordrecht, The Netherlands, 2011; pp. 359–370. [Google Scholar]
- Hubbard, S.S.; Bergman, R.; Sahoo, K.; Bowe, S. A Life Cycle Assessment of Hardwood Lumber Production in the Northeast and North Central United States; CORRIM: Oshkosh, WI, USA, 2020; p. 45. [Google Scholar]
- Paulson, J.S.; Kizha, A.R.; Han, H.-S. Integrating Biomass Conversion Technologies with Recovery Operations In-Woods: Modeling Supply Chain. Logistics 2019, 3, 16. [Google Scholar] [CrossRef] [Scilit]
- Shi, T.; Si, S.; Chan, J.; Zhou, L. The Carbon Emission Reduction Effect of Technological Innovation on the Transportation Industry and Its Spatial Heterogeneity: Evidence from China. Atmosphere 2021, 12, 1169. [Google Scholar] [CrossRef] [Scilit]
- Cervantes, M.; Copeland, H.; Žarnic, Ž. Accelerating the Development and Diffusion of Low-Emissions Innovations; OECD: Paris, France, 2018; p. 38. [Google Scholar]
- Kalluri, S. Comparative Life Cycle Assessment of Road and Multimodal Transportation Options—A Case Study of Copperwood Project. Master’s Thesis, Michigan Technological University, Houghton, MI, USA, 2016. [Google Scholar]

Disclaimer/Publisher’s Note: The statements, opinions and data contained in all publications are solely those of the individual author(s) and contributor(s) and not of MDPI and/or the editor(s). MDPI and/or the editor(s) disclaim responsibility for any injury to people or property resulting from any ideas, methods, instructions or products referred to in the content. |
© 2026 by the authors. Licensee MDPI, Basel, Switzerland. This article is an open access article distributed under the terms and conditions of the Creative Commons Attribution (CC BY) license.