


Abstract
Wetlands are among the most efficient terrestrial ecosystems for long-term carbon sequestration; however, information on carbon stocks in karst-derived tropical freshwater wetlands remains scarce. We estimated carbon stocks in above-ground and below-ground components of vegetation types associated with the Bacalar lagoon system in southeastern Mexico. We compared different carbon estimation methodologies to assess how methodological choices affect carbon stock estimates at the sample’s sites. Five vegetation types were studied; above-ground biomass was estimated using multiple allometric equations, which were compared in terms of relative variability using coefficients of variation. Below-ground carbon was quantified from root biomass and soil organic carbon using the loss-on-ignition (LOI) and Dumas methods. Gallery forest had the highest above-ground carbon stocks due to larger tree sizes, while mangroves (included petenes) stored greater amounts of below-ground carbon, reflecting the influence of hydrology, clay-rich substrates, and the accumulation of organic matter. The LOI based estimates were higher than Dumas, although both approaches showed similar patterns and high agreement following cross-validation. Our results show that vegetation type, substrate characteristics, and methodological choices significantly influence estimates of carbon stocks. Karst wetlands are important carbon reservoirs, and their conservation contributes to the mitigation of regional climate change.
1. Introduction
Bacalar Lagoon is the second-largest freshwater body on the Yucatán Peninsula and is part of a system of lagoons and wetlands near the coast but is primarily influenced by surface and groundwater. The system supports several vegetation types, including fringe mangroves, petenes, and tropical forests. These vegetation types occur along the lagoon margins, on slightly elevated areas, and across low-lying plains, where their distribution is associated with differences in soil characteristics and flooding conditions. Petenes are tree islands that may contain mangrove species alongside other tropical woody plants, whereas fringe mangroves are characterized by mangrove-dominated vegetation along the shoreline. The lagoon system receives runoff and groundwater inputs and is surrounded by wetlands that provide important ecosystem services to the region.
Worldwide wetlands have been recognized for their importance as carbon reservoirs, a recognition that has grown for several reasons: they have a high capacity to store and sequester carbon due to their high primary productivity and low rate of organic matter decomposition. They are also reservoirs of methane (CH4), a greenhouse gas (GHG) with a global warming potential 27 to 30 times greater than that of CO2. However, their distribution is limited, which has direct implications for their conservation. Compared to other ecosystems, wetlands are estimated to cover only about 4%–6% of the planet’s total land area; this limited distribution makes them highly vulnerable ecosystems [1,2,3]. Wetlands are in transition zones between terrestrial and aquatic environments, both inland and along coastlines; they are temporarily or permanently flooded and take the form of swamps, marshes, and peatlands, whether natural or artificial [4]. These ecosystems provide various environmental services, such as coastal protection, groundwater recharge, filtration of runoff water, flood and drought control, habitats for a diverse range of plants and animals, as well as leisure and recreation for people [5].
Some authors [6], effectively summarize the measures needed to ensure that wetlands continue to serve as important carbon (C) sinks and reservoirs, such as the importance of their conservation and expanding their distribution, whether through protected natural areas or by leveraging local initiatives such as community conservation areas. Furthermore, they mention the importance of implementing management actions such as biotechnology, restoration, and fertilization, measures that, in our region, could be considered in areas affected by tourism. Research on carbon stores in coastal wetlands of the Yucatán Peninsula has increased over the past decade [7]; however, there is still insufficient data on their role as carbon reservoirs and on the specific characteristics that can be identified based on their distribution along the coast, the geomorphology, and the geological history of the substrates where they are found. Furthermore, there is little information and few comparisons of the methods used to estimate or quantify carbon (C) reservoirs or stores. There is debate over which methods provide the most accurate estimates, particularly for cases such as karst areas, which operate through different processes [7]. Wetland soils exhibit marked seasonality that affects the accumulation of organic matter; anaerobic conditions promote the accumulation of layers of organic matter and sediments that represent significant carbon reservoirs and can store carbon for hundreds and thousands of years. These processes slow the decomposition of organic matter and allow for continuous accumulation.
Anoxic conditions, primary productivity, and microbial activity influence the amount of organic matter that accumulates and decomposes. The presence and type of clays promote carbon retention; the long-term stability of these deposits therefore depends on the amount and decomposition (oxidation-reduction) of organic matter, along with pH and nutrient availability [8,9,10]. This process contributes significantly to the reduction of atmospheric CO2 levels, but external factors such as climate and sediment input, along with anthropogenic influences such as land-use change and pollution, play a crucial role in the ability of wetlands to store or release carbon [11,12].
Bacalar Lagoon has been the subject of various studies, including the geochemical characterization of its waters, its microbiome, and modern microbialites [13,14,15,16]. Various bioindicators have been analysed [17,18], along with morphometry and hydrometeorology [19]. Some data on sediment geochemistry are available [20], and part of the lagoon’s environmental history is known [21]. However, carbon reservoirs in the lagoon have not yet been studied. Spanning approximately 60 km, Bacalar Lagoon is home to various wetlands, which play a crucial role in its water dynamics and in the region’s carbon cycle. However, the available information on the role of these wetlands in carbon sequestration and storage has not been explored. In general, freshwater and inland wetlands remain understudied in terms of carbon sequestration at the landscape scale [22].
Despite growing interest in blue carbon ecosystems, very little is known about carbon stocks in tropical freshwater karst wetlands, and even less is known about how methodological decisions, such as the selection of equations, influence estimates of these stocks. Several authors have highlighted the importance of selecting equations with the lowest statistical uncertainty to improve estimates of carbon reservoirs [23]. More accurate estimates make it possible to develop better frameworks for the conservation and sustainable management of coastal wetlands. The objective of this study was to estimate carbon stocks in the different types of vegetation that form part of the Bacalar lagoon system, identify which ones store the largest amount, determining which components (above-ground or underground) have the greatest storage capacity, evaluating the equations results in the lowest uncertainty, as well as determining which method for measuring total soil carbon (LOI or Dumas) is most suitable for freshwater karst wetlands.
2. Materials and Methods
Bacalar Lagoon is the second largest freshwater body on the Yucatán Peninsula; it is in the southeastern region of the state of Quintana Roo, very close to the border with Belize. The Lagoon is an oligotrophic water body formed along a geological fault. It has an average depth of approximately 9 m, reaching depths of up to 26 m in the northern sector and ranging from 38 to 60 m in the southern sector, where sub-lacustrine dolines occur. The lagoon extends approximately 60 km in length and reaches a maximum width of 2 km. Bacalar Lagoon is part of a system of interconnected lagoons fed by groundwater [19,24]. The lagoon boasts a highly diverse microbiome and is considered one of the largest microbial reefs in the world [13,14]. The nearest towns are Bacalar, in the central part, with approximately 12,000 population, and in the northern part, with approximately 2000 population (Figure 1).
The vegetation surrounding the lagoon consists of species tolerant of temporary and permanent flooding. The classification of wetlands has been widely debated worldwide due to the diversity of criteria used for their identification and differentiation. In Mexico, ref. [25] proposed a classification scheme based on a review of the systems developed by [26], the Ramsar Convention, and [27]. This proposal adopts a landscape-based approach grounded in geomorphological and hydrological characteristics, complemented by ecological descriptors. Under this framework, Bacalar Lagoon could be classified within the continental domain, lacustrine system, permanent subsystem, and lake, marsh, and cenote class (C/b/h1).
In contrast, ref. [28] proposed a hierarchical hydro-ecological classification that distinguishes among coastal, inland, and artificial wetlands. Within the coastal wetland system, this classification recognizes both wetlands separated from the sea with relatively stable water levels and those with fluctuating water levels. The former subsystem includes freshwater lagoons, whereas the latter encompasses periodically flooded forests, among other wetland environments. This classification provides a complementary framework for characterizing the Bacalar Lagoon system and its surrounding forested wetlands. However, a more specific classification of these wetlands requires information on the hydrological regime of each ecological unit.
Within the lagoon system, various types of vegetation can be identified, including hydrophilic grasslands, fringe and scrub mangroves, petenes, and tropical forest vegetation along the lagoon margins, hereafter referred to as gallery forest. Petenes are tree islands that may include mangrove species and other tropical woody vegetation. The most common species in the hydrophilic grassland areas are Carex, Eleocharis, Cyperus, Cladium jamaicense (navajuela), Typha domingensis (cattail), and Nymphaea ampla (water lily).
On the shores of the lagoon tropical forest vegetation is found, due to changes in its composition and its resemblance to gallery forests, and based on [29] proposal, we decided to retain the name “gallery forest.” There is a high prevalence of species tolerant of flooding and high humidity, such as ferns (Acrostichum aureum) and araceae (Philodendron jacquinii, Philodendron radiatum, Philodendron smithii) are found. Epiphytes are abundant, including bromeliads (Tillandsia bulbosa, Tillandsia streptophylla, Tillandsia sp.), orchids (Oncidium sp., Myrmercophila sp.), and some cacti (Selenicereus grandiflorus ssp. donkelaarii, Strophocactus testudo, known as the “turtle pitaya”). Tree layer includes species such as Bucida buceras (pucté), Ficus sp. (fig), Coccoloba uvifera (sea grape), Metopium brownei (chechen), Chrysobalanus icaco (icaco), Thrinax radiata (chit palm), Acoelorraphe wrightii (tasiste palm), Bravaisia berlanderiana (julub), Cordia dodecandra (siricote), Manilkara zapota (sapote), and Lysiloma latisiliquum (tzalam).
Petenes are tree islands that generally include mangrove species and other tropical woody vegetation, often exhibiting a concentric spatial arrangement [30,31]. In karst wetland landscapes, these formations are commonly associated with freshwater springs or groundwater discharge [32,33]. Depending on their proximity to the coast, they may also experience tidal influence. Petenes typically occur within a matrix of flooded herbaceous vegetation, often dominated by species of Cyperaceae, and their floristic composition may vary according to local hydrological and environmental conditions. Similar tree island formations, commonly referred to as hammocks, have been described in other tropical and subtropical wetland systems, particularly in the Florida Everglades [34].
Typical species found at various stages of succession include such as the Rhizophora mangle (red mangrove), Laguncularia racemosa (white mangrove), Conocarpus erectus (button mangrove or associated mangrove), M. brownei, C. icaco, T. radiata, A. wrightii, Morella cerifera (wax tree), B. berlanderiana, Bonellia macrocarpa ssp. (lemongrass.), and M. zapota. Mangroves can be found in their various classic distributions: fringe, peten, and basin, primarily consisting of R. mangle, L. racemosa, and C. erectus. In some areas, parasitic plants of the genus Phoradendron are found invading tree canopies, and their presence has increased in recent years.
According to the Chetumal E16–4–7 Series III Soil Map published by the National Institute of Statistics and Geography [35], Bacalar Lagoon is surrounded by four main soil types. On the western shore, north of the town of Bacalar, endoleptic humic Luvisols predominate in association with Cambisols and Histosols (LVhulen + CMrolep + HSlep/3R). These soils are characterized by their accumulation of clay and have shallow to moderate depths (50–100 cm); they are intermixed with young soils with limited pedogenic development and a high proportion of organic matter due to water-saturated conditions. To the south of the town are pelic mafic Vertisols associated with Leptosols (VRmzpe + LPhurz + LPhuli/3). These soils have a high content of expansive clays, which causes drainage problems, cracking during the dry season, and high plasticity when wet. They are also associated with shallow soils developed directly on limestone, with limited depth and low water-holding capacity. On the east coast, most of the area bordering the lagoon consists of stagnic vertic Gleysols (GLstvr/3). These soils develop on materials rich in calcium carbonate, contain abundant surface organic matter, and are very shallow, generally between 10 and 50 cm.
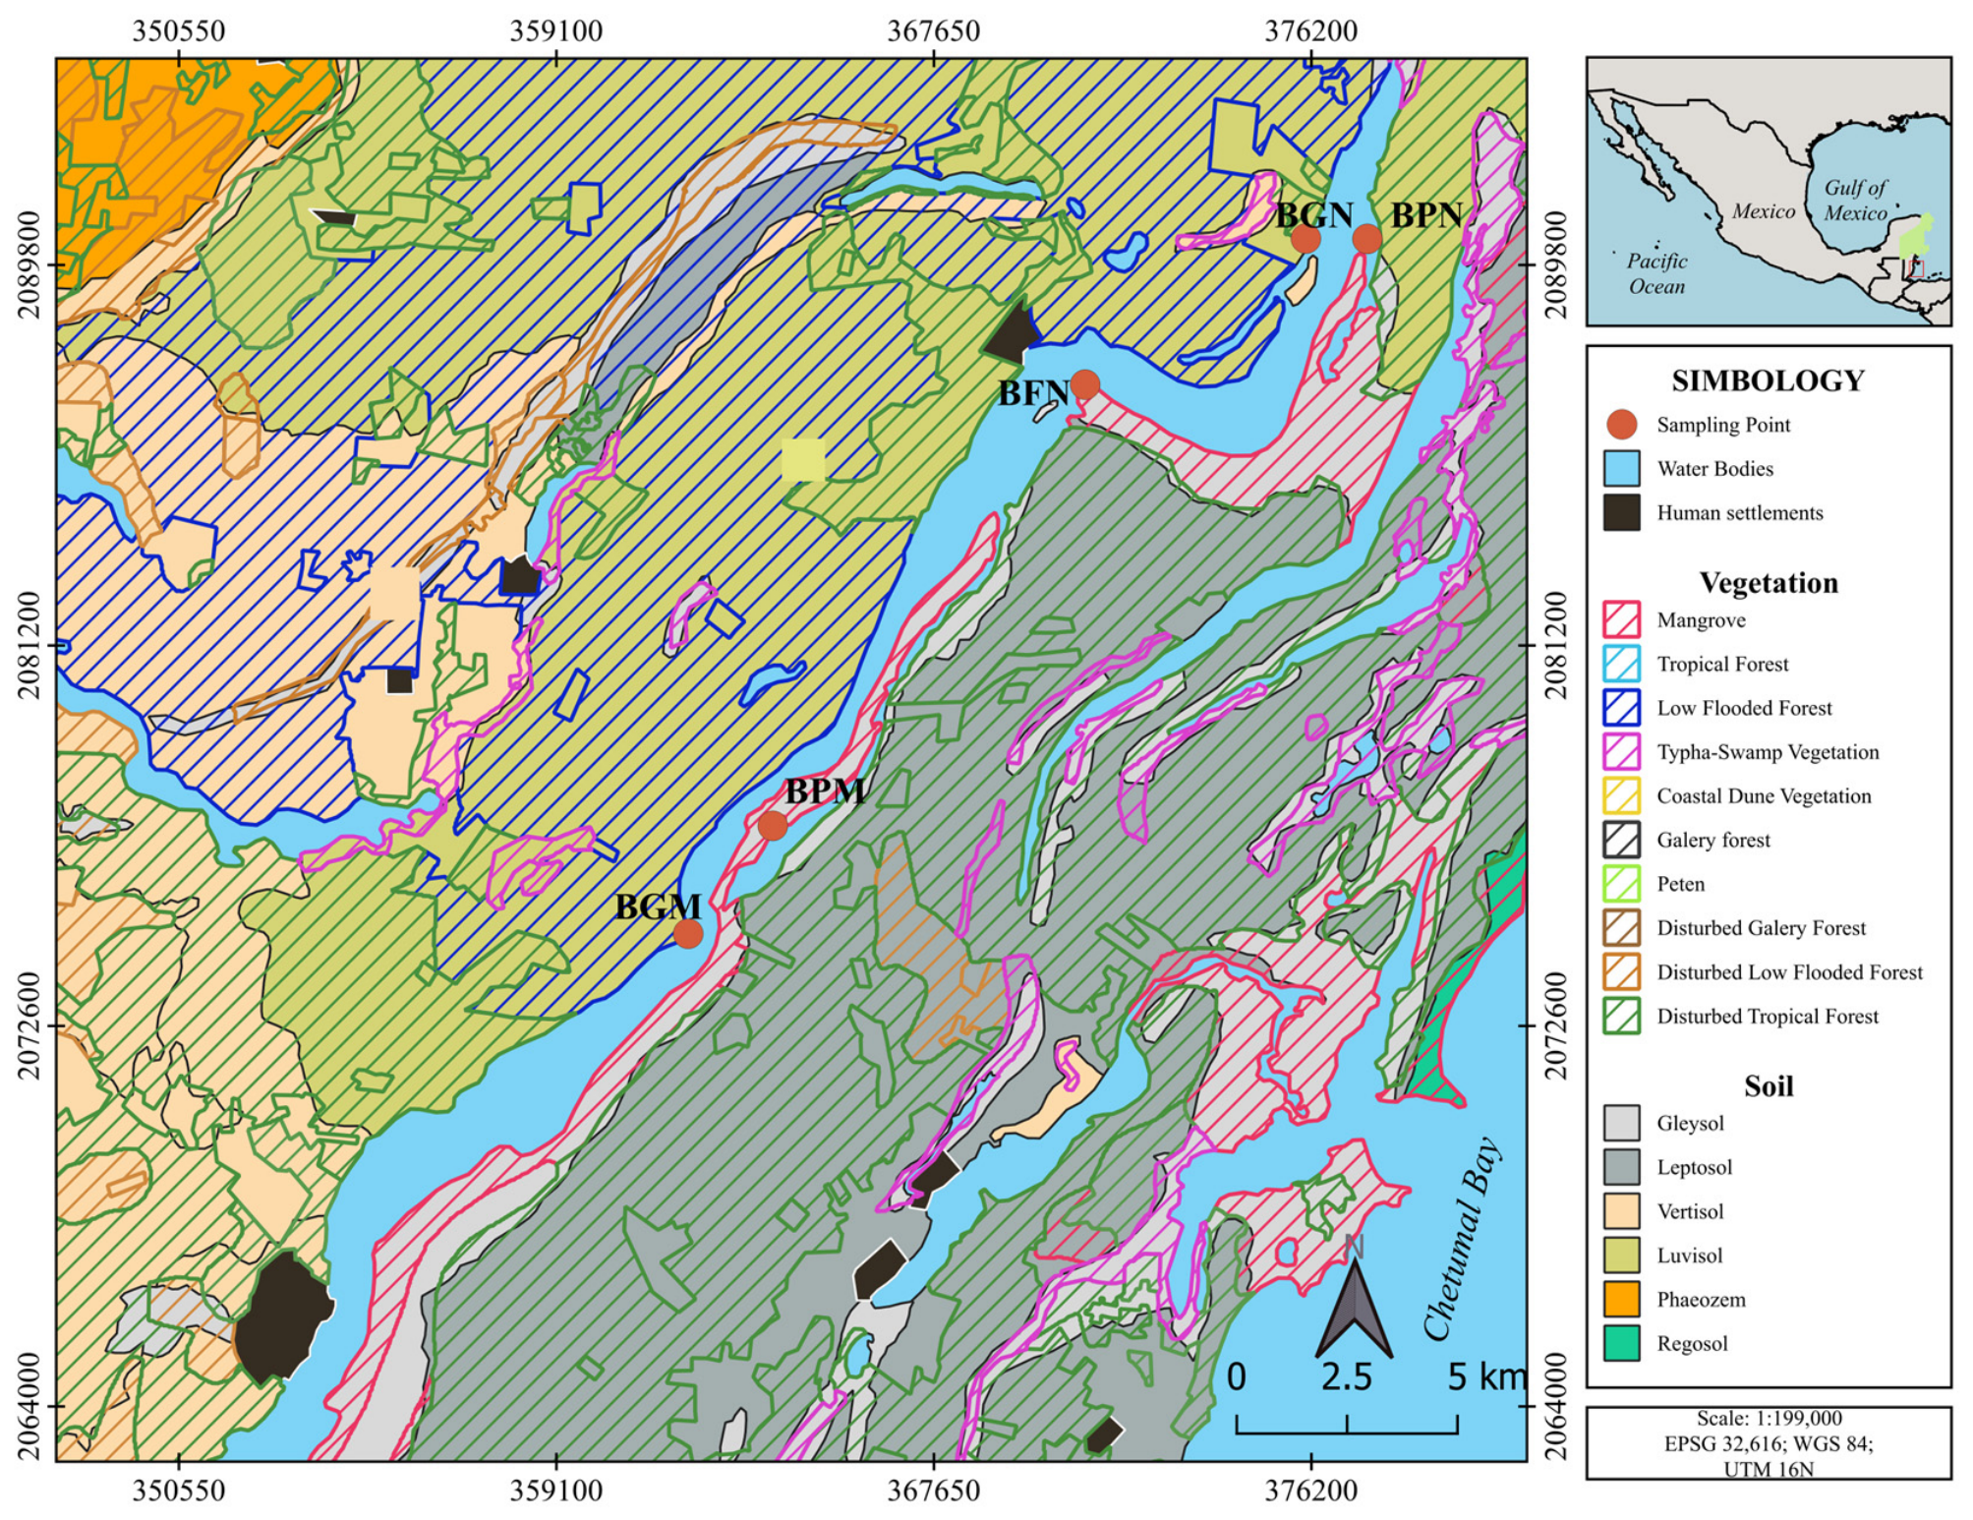
We used the map prepared by [29] and applied their vegetation classification to better identify the types of wetlands. Three wetland types were selected at various locations along the lagoon (Figure 1), in the northern part, gallery forest, petenes, and mangrove fringes were selected; in the central part, petenes and gallery forest. The fieldwork was conducted between September 2023 and January 2024 (rainy season), the project was carried out during this period for financial and logistical reasons; during these seasons, there is less tourist activity, making it possible to access the sites. Using minimum-area methods 20 × 20 m plots were established to measure area biomass [36]. Five sampling plots were established along Bacalar Lagoon, representing three vegetation types: gallery forest (BGN and BGM), peten vegetation (BPN and BPM), and fringe mangrove (BFN) (Figure 1). The methodology of [5] was employed; in each plot, data were recorded according to the criteria of [37,38]: structural data (species, diameter, diameter at breast height), condition (living or dead), and specific measurements for individuals with shallow roots and scrub forms (Rhizophora mangle).
Figure 1.
Location of the wetlands studied and soil types according to Chetumal E16–4–7 Series III Soil Map [35], in Bacalar Lagoon.
2.1. Above-Ground Biomass
Above-ground biomass was estimated by quantifying living vegetation, fallen dead wood and litter. These components were assessed using different methodological approaches: living tree biomass was estimated through non-destructive methods based on allometric equations, fallen dead wood biomass was calculated using the line-intersect method, and litter biomass was determined directly from the dry weight of collected samples [5].
Fallen dead wood was quantified during a single sampling event using four 10-m transects established around each main plot, representing four replicates per site. Following the methodology of [37], wood fragments intersecting the transect line were recorded, and their diameters were measured. Dead wood volume per unit area (m3 ha−1) was estimated using the line-intersect method. For fine, small, and medium-sized wood fragments, volume was calculated using the number of fragments and the quadratic mean diameter of each size class. For large fragments (diameter > 7.6 cm), volume was estimated from the sum of squared individual diameters. Dead wood biomass (kg ha−1) was calculated by multiplying the estimated volume by wood density values selected according to fragment size class and decomposition stage, using the reference table published by [37]. Finally, dead wood carbon stocks (kg C ha−1) were estimated by applying a carbon conversion factor of 0.50 to the calculated biomass [38].
Soil litter biomass was quantified during a single sampling event by collecting material accumulated on the soil surface within 50 × 50 cm quadrats, with three replicates per site [12,38]. The collected samples were oven-dried at 70 °C for 36 h to determine dry biomass. Litter carbon stocks were subsequently estimated by multiplying dry biomass by a carbon conversion factor of 0.50 [38].
Living tree biomass was estimated using different allometric equations selected according to geographic region, vegetation type, and site ecological conditions, as these factors influence the accuracy of biomass and carbon estimates [39]. To estimate aboveground tree biomass, we used the Calcbosk database developed by the Climate Action Reserve and certified by the Forest Protocol for Mexico Version 3.0 (FPM) [40] which incorporates species-specific equations (Table 1). The equation proposed by [41] was used for dry tropical forests with annual precipitation below 1500 mm (Tropical Forest; Dry Tropics), whereas the equation proposed by [42] was applied to trees with a diameter at breast height (DBH) greater than 5 cm. The regional equation proposed by [43] was used for trees with a DBH below 5 cm, considering the wood density of each species. For mangrove species, the general mangrove equation was applied to Conocarpus erectus, whereas the species-specific equation proposed by [37] was applied to Rhizophora mangle. Species-specific wood density values used in equation [44] were obtained from the World Agroforestry Centre database [45].
Table 1.
Equations used to estimate above-ground biomass.
To evaluate the influence of allometric equation selection on biomass estimation, four analytical categories were established, each representing a different set of equations: Category 1, Calcbosk; Category 2, [41]; Category 3, [42]; and Category 4, [37,41,43]. Biomass estimation considered the diameter, height, and wood density measurements recorded in the field, as required by the corresponding equations. Biomass estimates were subsequently scaled to the site level, and descriptive statistics, including the mean, median, standard deviation, and coefficient of variation (CV), were calculated for each category and site. Because no destructive reference measurements of tree biomass were available, the equations were compared in terms of the variability of their estimates, following approaches for assessing uncertainty in allometric biomass estimates using the coefficient of variation [46,47]. Accordingly, the CV was interpreted as a measure of relative variability rather than a direct indicator of predictive accuracy.
2.2. Below-Ground Carbon
Below-ground biomass consists of primarily of roots and associated root system. In mangroves and other vegetation types, the ratio of above-ground to below-ground biomass typically ranges between 2.0 and 3.0, meaning that the above-ground compartment contributes a considerable fraction of the biomass in these ecosystems [48]. Root biomass was estimated using two complementary methodological approaches, each focusing on different components of the root system. The first method was based on the approach proposed by [22], in which root biomass was obtained by extracting sediment core at each site using PVC tubes (50 cm long and 70 mm in diameter).
The second method involved a non-destructive estimate of below-ground biomass for large roots, using the allometric equation proposed by [48] for mangroves and the allometric equation proposed by [49] used in studies of tropical wetlands (Table 2). Using these equations, it was possible to estimate the structural below-ground biomass associated with the root-to-trunk ratio of the trees, thereby incorporating the woody fraction of the root system. Allometric equations for below-ground biomass [48,49]:
where: BAS and BGB are below-ground tree biomass (kg), AGB = above-ground biomass,
BAS = 0.199 × (ρ0.899 × DAP)2.22 with Factor 0.96
BGB = exp (−1.0587 + 0.8836 ln (AGB)) with Factor 0.84
ρ = wood density (g/cm3), DAP = diameter at breast height (cm)
Table 2.
Location, vegetation type, and soil type (according to [35]) of the vegetation types studied.
2.3. Soil Carbon Using the Loss on Ignition (LOI)
The LOI method described by [50] was used to determine soil organic carbon; soil samples were incinerated at a temperature of 550 °C for 4 h. Soil organic carbon (%org C) was estimated from %LOI using three equations, these were selected based on the environmental similarity between the study sites and the ecosystems for which the equations were developed. For site BFN, characterized by mangrove vegetation, the equation specifically developed for mangrove ecosystems was used [5,33]. For sites BPN and BPM, characterized by peten vegetation and associated with carbonate estuarine environments we used Equation proposed for this type of environment [51]. Finally for sites BGN and BGM, corresponding to environments with gallery forest we used Equation developed for terrigenous lagoon environments [51]. Thus, the conversion of LOI values to %C was performed considering the specific environmental characteristics of each site. This approach produced carbon estimates more consistent with local environmental conditions, as reflected by in situ statistical models.
Equation for mangrove ecosystems:
% Corg = 0.415 + LOI + 2.89
Equation ref. [51] for terrigenous lagoon environments
% Corg = 0.472 + LOI − 1.7
Equation for carbonate estuarine environments [51]
% Corg = 0.506 + SOM
2.4. Soil Carbon Using the Dumas Method
The carbon content of the soil was additionally determined using the dry combustion method known as the Dumas method, employing a PerkinElmer 2400 Series II elemental autoanalyzer (PerkinElmer Inc., MA, USA). The soil samples were first dried in an oven at 70 °C for 12 h to remove moisture; subsequently, the samples were placed in the combustion chamber of the autoanalyzer at a temperature of 1300 °C [52]. Soil carbon was estimated based on samples collected at different depths [39,53].
2.5. Estimation of Above-Ground Carbon
The carbon content of above-ground biomass was calculated using a conversion factor of 0.5, since it is estimated that 50% of the biomass consists of carbon [38,53]. For below-ground biomass, a conversion factor of 0.39 was used, corresponding to an intermediate value within the range reported for roots in tropical ecosystems [37]. Subsequently, the values obtained were scaled to the area of each plot and converted to megagrams of carbon per hectare (Mg C ha−1).
2.6. Estimation of Below-Ground Carbon
For each depth of the core the bulk density of the soil was calculated based on the dry weight of the sample (g) and its known volume (cm3). Subsequently, the carbon percentage for soil (%) was determined for each depth with the LOI and Dumas methods. The total carbon values were converted to megagrams of carbon per hectare (MgC ha−1) [37]. For samples analysed using LOI, the carbon percentage was estimated using the equations proposed by [51] as described above. For the Dumas method, the carbon percentage determined by the elemental analizer was used directly. The values for bulk density, carbon percentage, and thickness at each depth within the core, were integrated to estimate the carbon content stored in each depth interval. This carbon content was calculated using the equation proposed by [54] and expressed in megagrams of carbon per hectare (Mg C ha−1). Finally, the values obtained for each depth interval were summed to determine the cumulative organic carbon content of the soil, allowing us to estimate the carbon stored in the surface soil profile for each study site
where: ρa = bulk density; m = dry mass (g); and V = sample volume (cm3).
where: Mg C/ha = megagrams of carbon per hectare; C (%) = carbon percentage.
Mg C/ha = Bulk density (g/cm3) × C (%) × depth (cm)
2.7. Data Analysis
A descriptive statistical analysis of the tree biomass and carbon estimates was conducted, calculating measures of central tendency such as the mean and median, measures of dispersion, and the minimum and maximum values. To assess the variability associated with the different categories of allometric equations and estimates of subsurface organic carbon, the coefficient of variation (CV) was estimated for each site and category, calculated using the standard deviation and the mean. The CV was assessed using a bootstrap resampling procedure with 2000 iterations, which allowed us to characterize the distribution of the CV and estimate 95% confidence intervals. This analysis was used to compare variability among the categories of allometric equations and to select the equation with the lowest variability for estimating tree biomass. Multiple pairwise comparisons were performed within each site, and the raw p-values were adjusted using the Benjamini–Hochberg false discovery rate (FDR) procedure. Both raw and FDR-adjusted p-values are presented, and an adjusted p-value < 0.05 (α = 0.05) was used as the threshold for statistical significance (ns = not significant, * p < 0.05, *** p < 0.001). All bootstrap analyses were performed in R (version 4.4.3).
Carbon stock at the study sites was estimated by considering both above-ground and below-ground components. Above-ground carbon included three compartments: (i) tree carbon, estimated from the biomass of living trees using allometric equations; (ii) dead wood, quantified from logs and branches within the plots; and (iii) leaf litter, estimated through direct collection of surface material. The values for each compartment were expressed in Mg C ha−1, and the total above-ground carbon per site was calculated as the sum of these components.
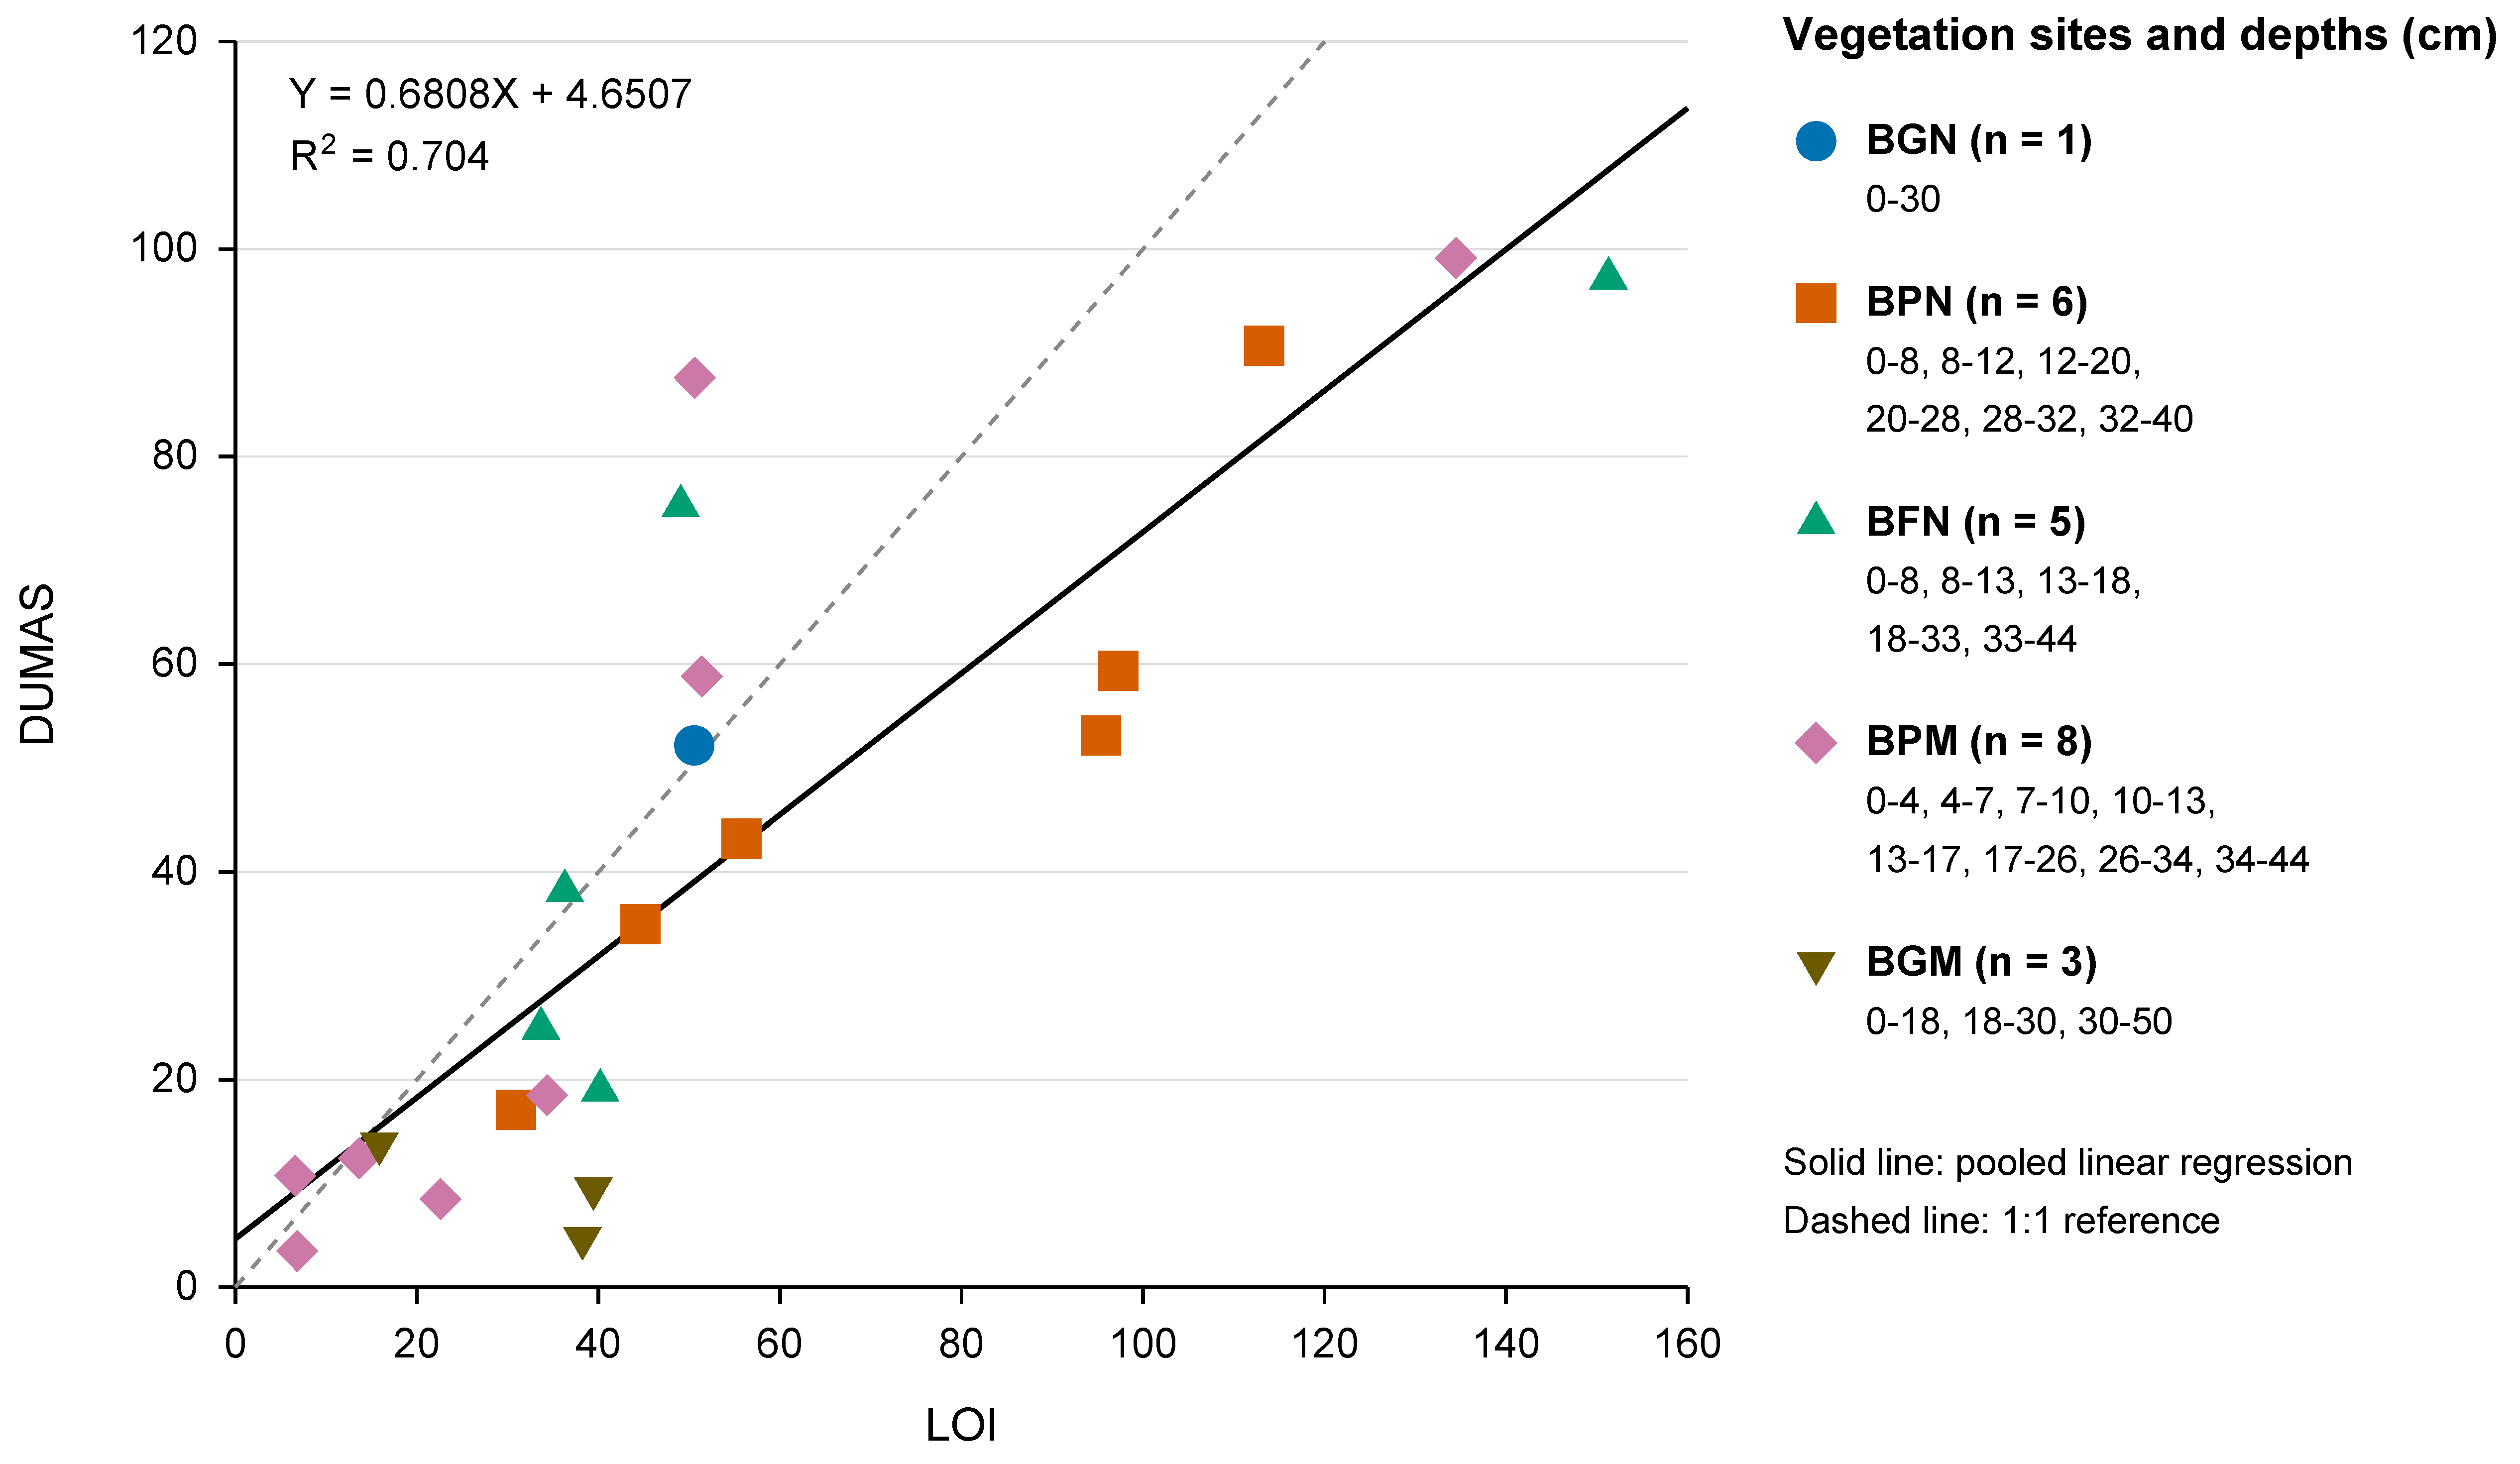
Below-ground carbon was estimated based on root biomass and soil organic carbon (SOC). The SOC was estimated using LOI and Dumas methods. To examine the relationship between the estimates obtained using these methods, a simple linear regression was fitted and evaluated using leave-one-out cross-validation (LOOCV). The mean bias obtained across the LOOCV iterations was tested against zero using a paired test (p = 0.948). Model assumptions including linearity, normality of residuals, and homoscedasticity, were assessed graphically.
In addition to identifying soil types according to the classification provided by [35], soil pH and electrical conductivity (EC) were determined using a portable soil analyzer (Soil Tester, Hisense, Shenzhen, China.). One sediment core was collected from each sampling site for these analyses. Sampling intervals were selected based on visually identifiable changes in sediment color and texture rather than fixed depth increments. Consequently, the number of sampled intervals and maximum sampling depth varied among sites. Soil samples were analyzed at three depth intervales in BGN, six in BPN, five in BFN, three in BPM, and eight in BGM. Soil suspensions were prepared with distilled water at a 1:3 soil-to-water ratio (w/v, g/mL), mixed, and stirred for 60 s before measurement. Both pH and EC were measured in triplicate at each depth interval, resulting in 75 instrumental readings per parameter across the five sites. For EC, the mean, sample standard deviation (SD), and coefficient of variation (CV) were calculated for each depth interval. Electrical conductivity values were expressed in mS cm−1.
3. Results
The five sampling sites exhibited differences in vegetation composition, forest structure, and the distribution of organic material. Gallery forest was characterized by taller trees, larger stem diameters, and abundant surface organic matter and fallen dead wood. In contrast, fringe mangrove and peten exhibited smaller tree dimensions and relatively limited amounts of fallen dead wood. These differences in vegetation structure and site characteristics provided the basis for comparing aboveground and belowground carbon stocks among the three vegetation types.
Gallery forest: The soil was rich in organic matter and fallen dead wood; the main species found were Sideroxylon capiri (tempisque), Thouinia paucidentata (k’an chuunup), Metopium brownei (chechen, poisonwood), Bucida buceras (puk’te), Coccoloba spicata (boob), Bursera simaruba (chacá), Thrinax radiata (chit palm), Buchonsia swartziana (sip che’), and Bravaisia berlandieriana (julub). Tree heights averaged approximately 4.2–9 m, with diameters ranging from 1 to 39 cm.
Fringe mangrove: During sampling, which was conducted in the rainy season, the water level above the soil surface was 40 cm. This measurement represents the water depth observed at the time of sampling and should not be interpreted as a constant water level through the year. Very little fallen dead wood was observed, whereas a substantial litter layer, consisting predominantly of accumulated leaves and other plant material in the early stages of decomposition, reached approximately 20 cm thickness. The following species were recorded: C. jamaicense, Bromeliaceae (gallito), B. macrocarpa, Chrysobalanus icaco (icaco), R. mangle, C. erectus and M. brownie. Recorded plant heights ranged from 40 cm to 4 m and in diameter from 0.6 to 8 cm.
Peten: During sampling in the rainy season, the water depth above the soil surface was approximately 20 cm. Little fallen dead wood was observed, and the material present showed signs of decomposition. Similarly, there was little mulch present. The species observed included Cyperaceae sp. (freshwater grasslands), R. mangle, C. icaco, C. erectus, Manilkara zapota (chicozapote), and M. brownei, with diameters ranging from 1 to 11 cm and heights ranging from 0.7 to 4 m.
3.1. Above-Ground Carbon
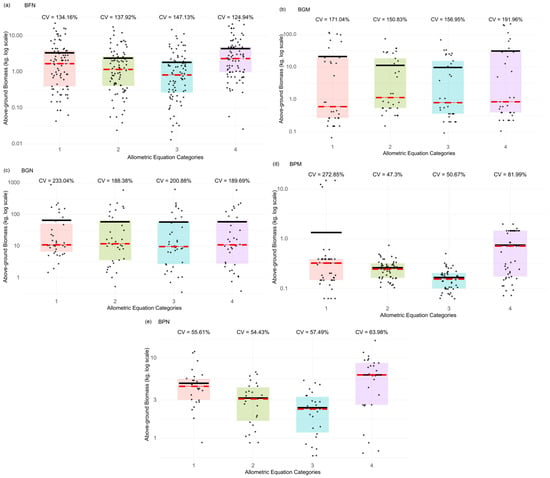
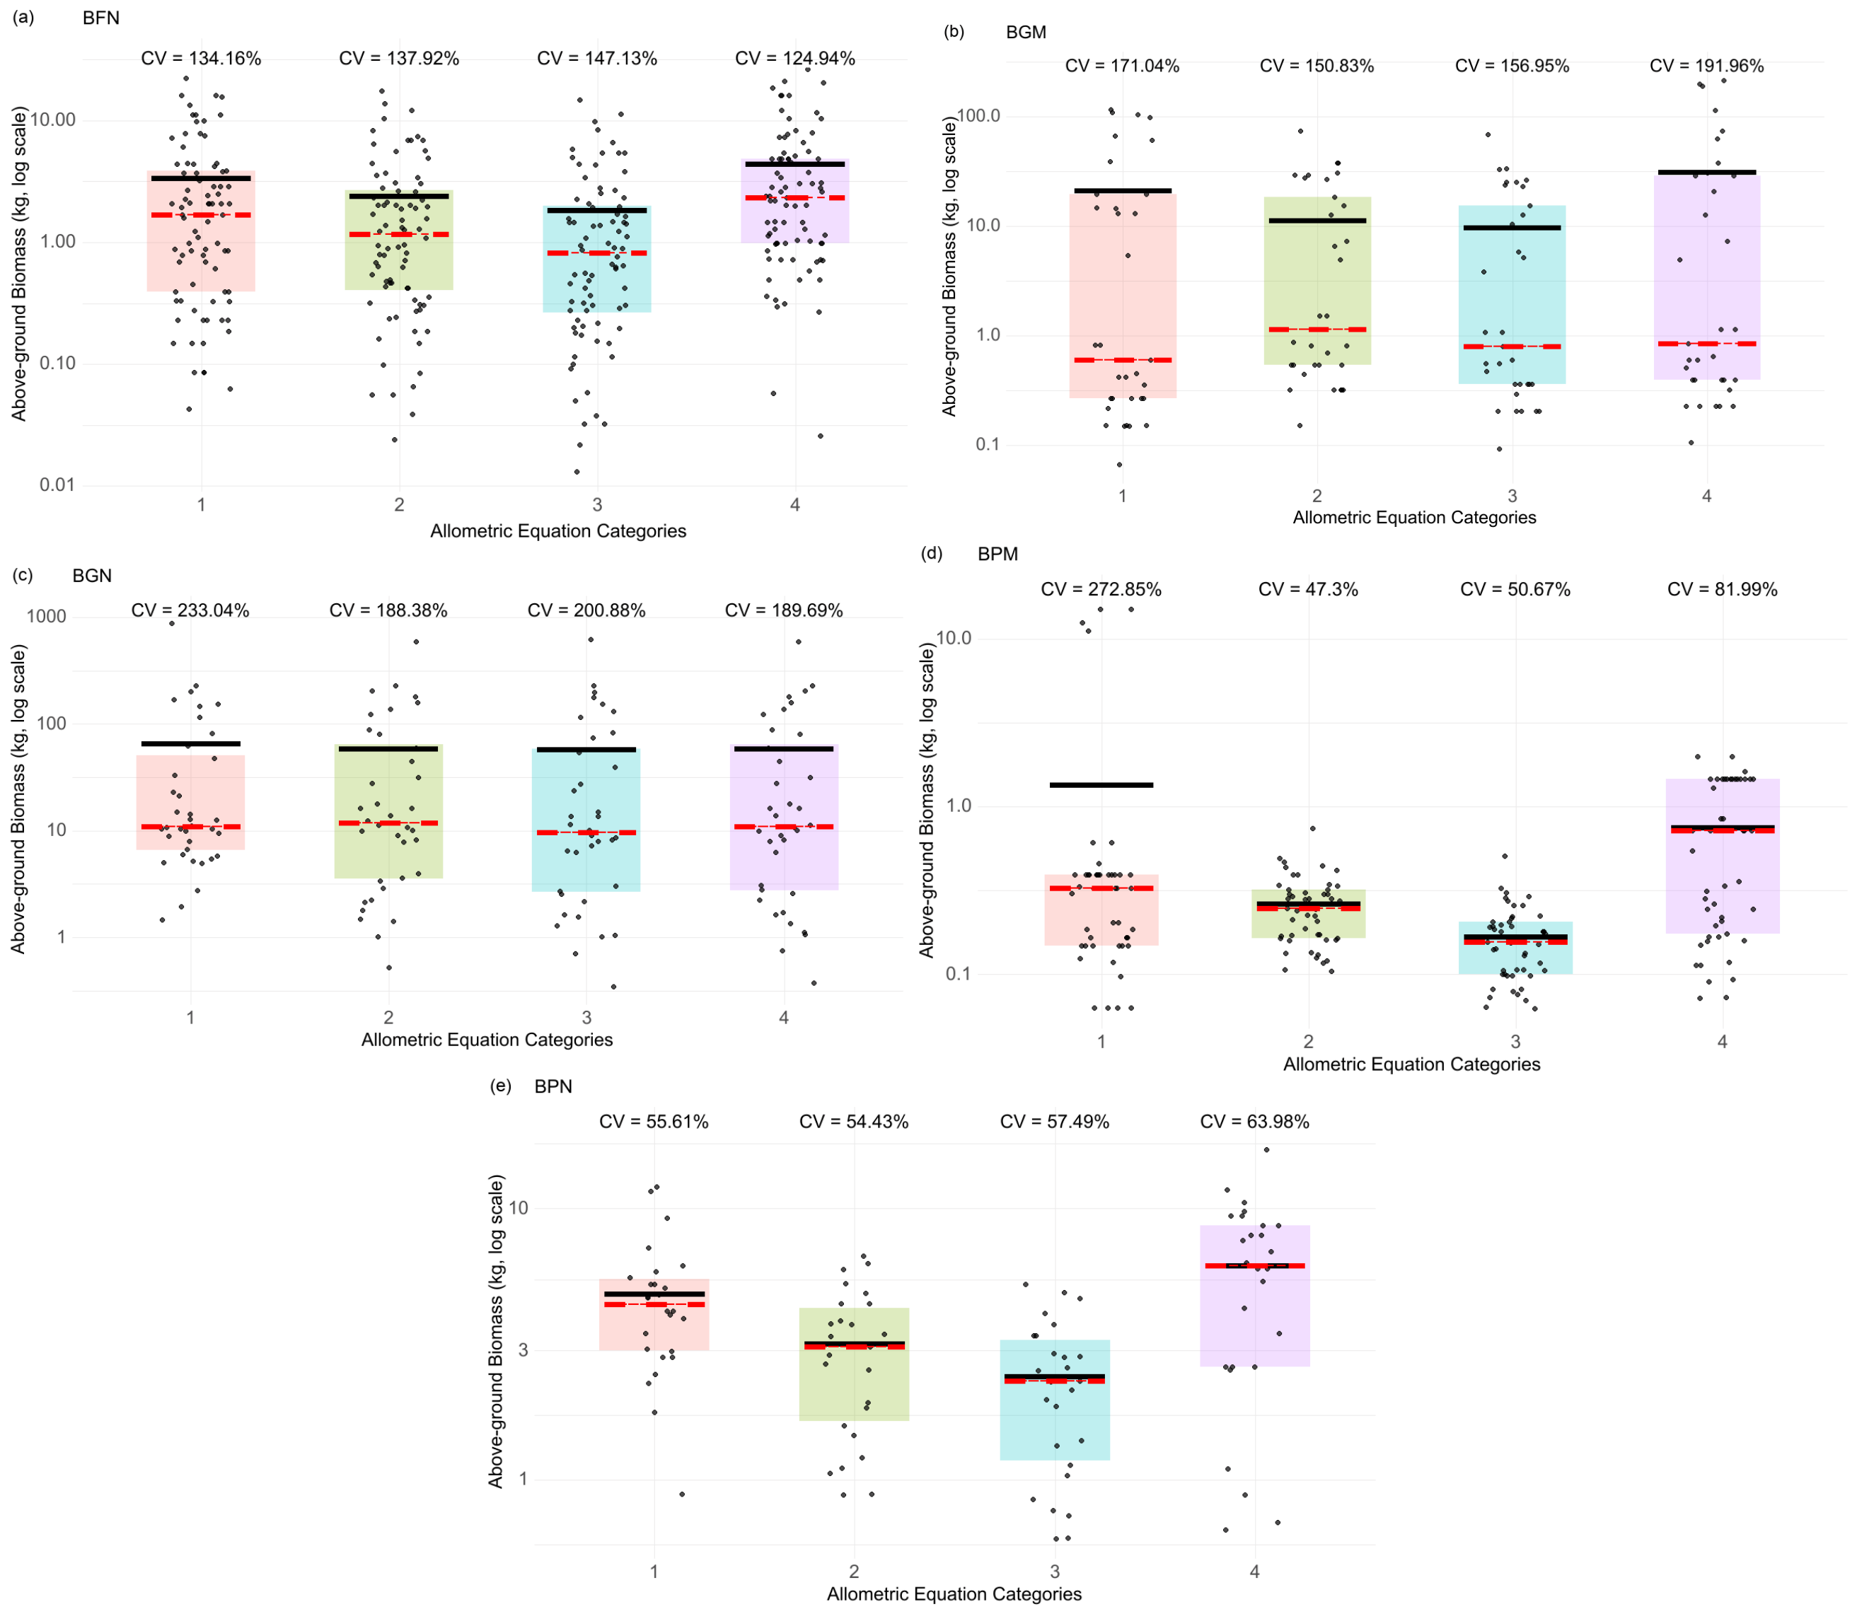
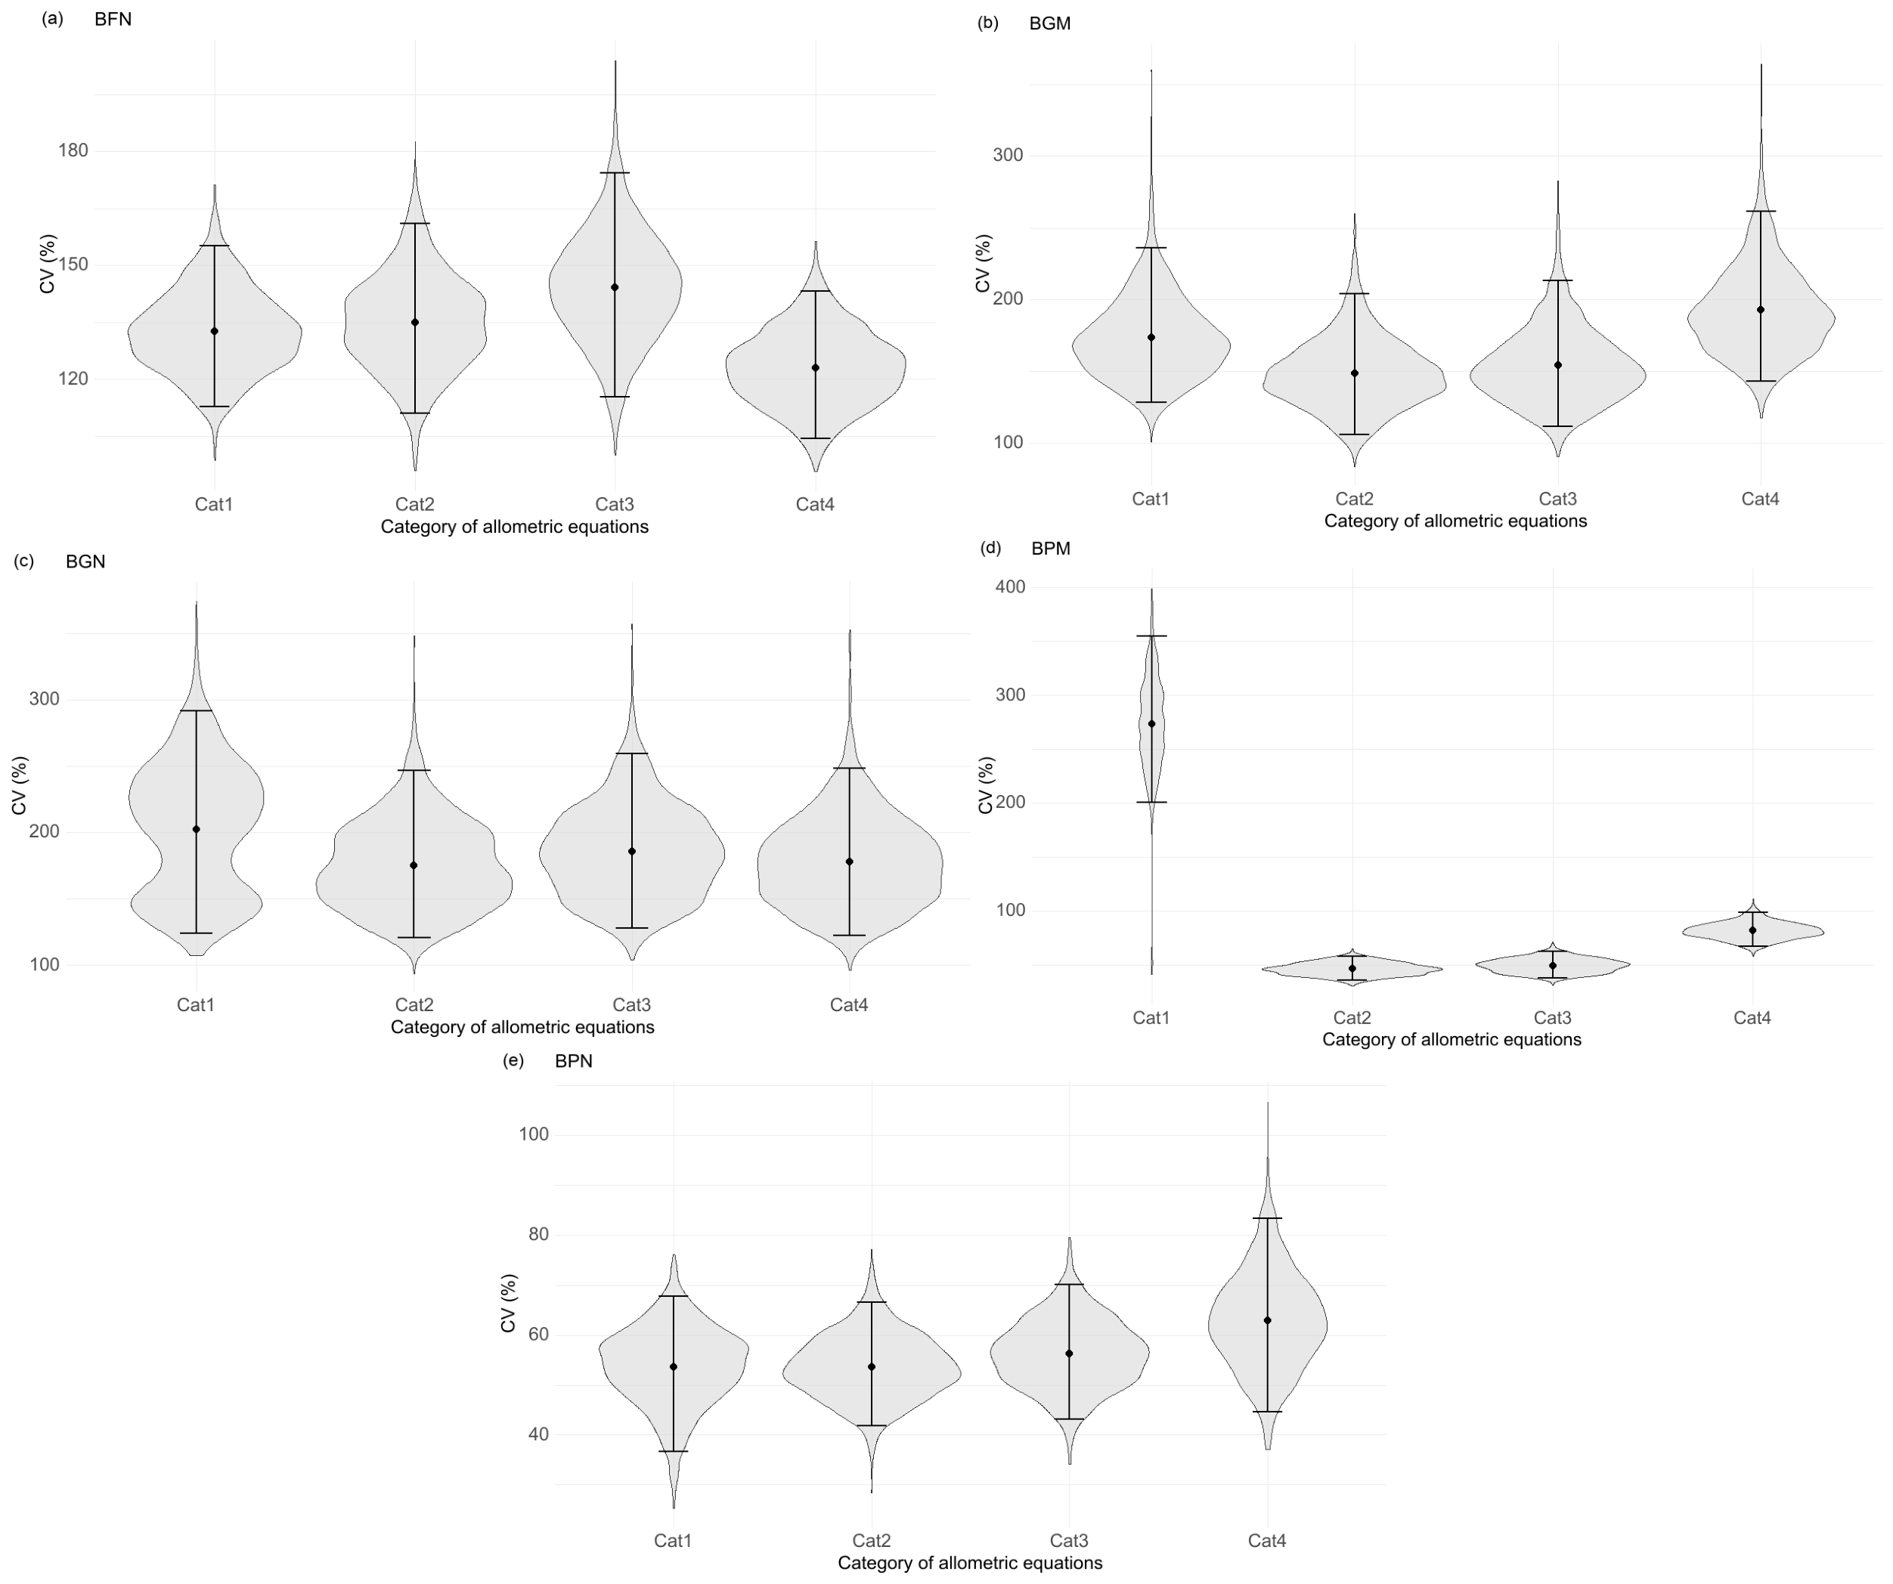
The results obtained using the four types of allometric equations based on Calcbosk [33,40,41,42], were used to calculate the coefficient of variation (CV) and characterize the relative variability of above-ground biomass estimates across sites and equation categories (Figure 2). The scatter plots showed differences in the magnitude of variability among sites, as well as contrasts in biomass estimates across categories. At the BGN site, CV values were high across all categories, ranging from 188.4% to 233%. Similarly, BFN exhibited high CV values (124.9%–147.1%). In contrast, BPN showed lower and relatively consistent CV values across categories (54.4%–64%). BPM showed the greatest contrast among categories, with Category 1 exhibiting the highest CV (272.8%), whereas the remaining categories ranged from 47.3% to 82%. Finally, BGM showed high CV values across categories (150.8%–192%).
Figure 2.
Coefficient of variation (CV) in above-ground biomass for (a) BFN = northern fringe mangrove, (b) BGM = central gallery forest, (c) BGN = northern gallery forest, (d) BPM = central peten, and (e) BPN = northern peten. The points represent biomass estimates for each tree on a logarithmic scale, red line median, black line mean.
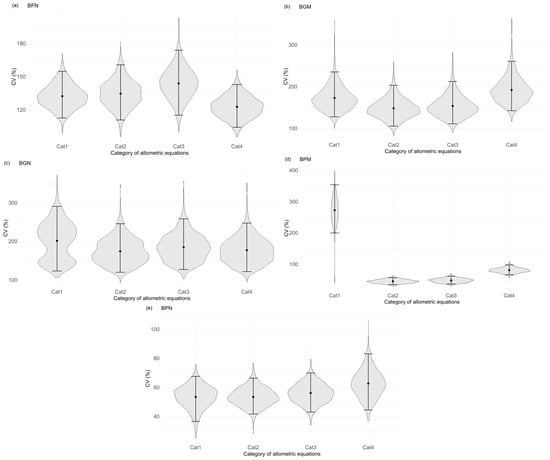
One sampling plot was established at each site to characterize the vegetation structure of the three wetland types. Because sites were not spatial replicates of each wetland type, statistical inference was restricted to the sampled trees within each site. To account for the non-independence of biomass estimates obtained by applying different allometric equations to the same trees, a paired bootstrap procedure was performed separately by species using 2000 resamples while preserving tree identity across equation categories. The coefficient of variation (CV) and its 95% confidence interval were estimated for each category and site (Figure 3). This analysis was used to assess the relative variability of biomass estimates among equation categories, rather than predictive accuracy.
Figure 3.
The bootstrap distributions of Coefficient of Variation for Coefficient of variation (CV) in above-ground biomass for (a) BFN = northern fringe mangrove, (b) BGM = central gallery forest, (c) BGN = northern gallery forest, (d) BPM = central peten, and (e) BPN = northern peten.
Category 1 showed broad and asymmetric distributions, with high CV values and strong dependence on resampling (Figure 3). At the BPM site, dispersion differed significantly from that of the other categories, consistent with the high structural heterogeneity observed at this site. Category 2 showed a more stable pattern, with relatively low CV values across all five sites, whereas Category 3 exhibited an intermediate pattern, with lower dispersion at some sites and greater dispersion at others. Category 4 did not consistently exhibit the lowest CV values; however, its CV did not differ significantly from that of Category 1 at any of the five sites. Significant differences between Category 4 and Categories 2 and 3 were observed at some sites, but no consistent pattern was detected among sites.
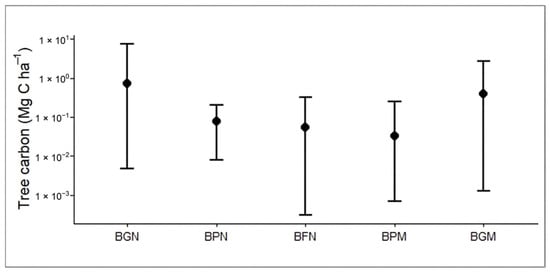
These results were considered as complementary evidence in the selection of Category 4 for above-ground carbon estimation rather than as evidence of greater predictive accuracy. Category 4 was primarily selected based on its ecological applicability because it comprises equations specific to species and diameter classes, thereby better representing the structural heterogeneity of the studied ecosystems. Thus, lower CV values were interpreted as indicating lower relative variability among biomass estimates, rather than greater accuracy. Carbon stocks were subsequently calculated using biomass estimates obtained from the Category 4 allometric equations. Total sum for aboveground carbon stocks ranged from 2.00 Mg C ha−1 at BPN to 26.38 Mg C ha−1 at BGN (Table 3), while mean values ranged from 0.033 Mg C ha−1 at BPM to 0.73 Mg C ha−1 at BGN.
Table 3.
Descriptive statistics for tree carbon stock.
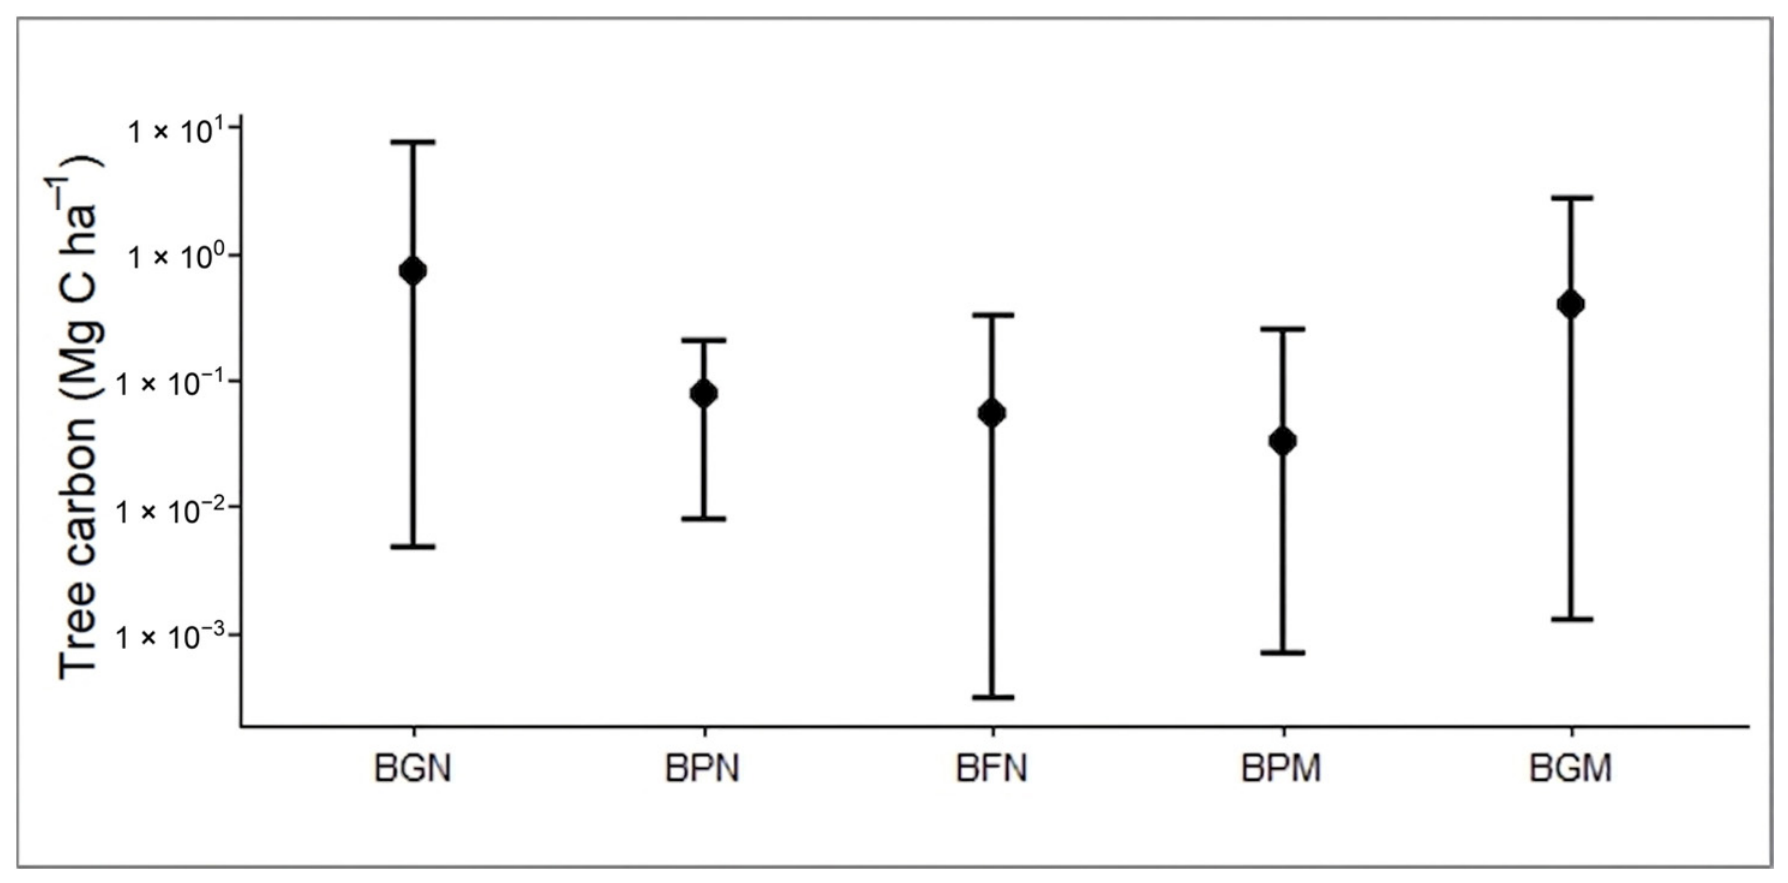
The BGN and BGM sites show variable tree carbon values, with high values that increased the mean relative to the median. In contrast, at the BPN, BFN, and BPM sites, carbon values are lower and have lower maximum values. Figure 4 shows the mean tree carbon for each wetland along with the minimum and maximum ranges, plotted on a logarithmic scale to illustrate the variation in carbon values, which exhibits high variability.
Figure 4.
Tree carbon by wetland type on a logarithmic scale. BGN = Northern gallery forest, BPN = Northern Petén, BFN = Northern strip mangrove, BPM = Central Petén, BGM = Central gallery forest.
3.2. Below-Ground Biomass
3.2.1. Characteristics of Soils
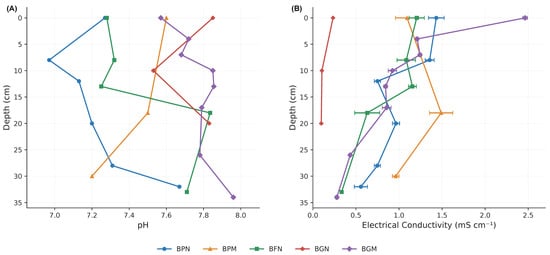
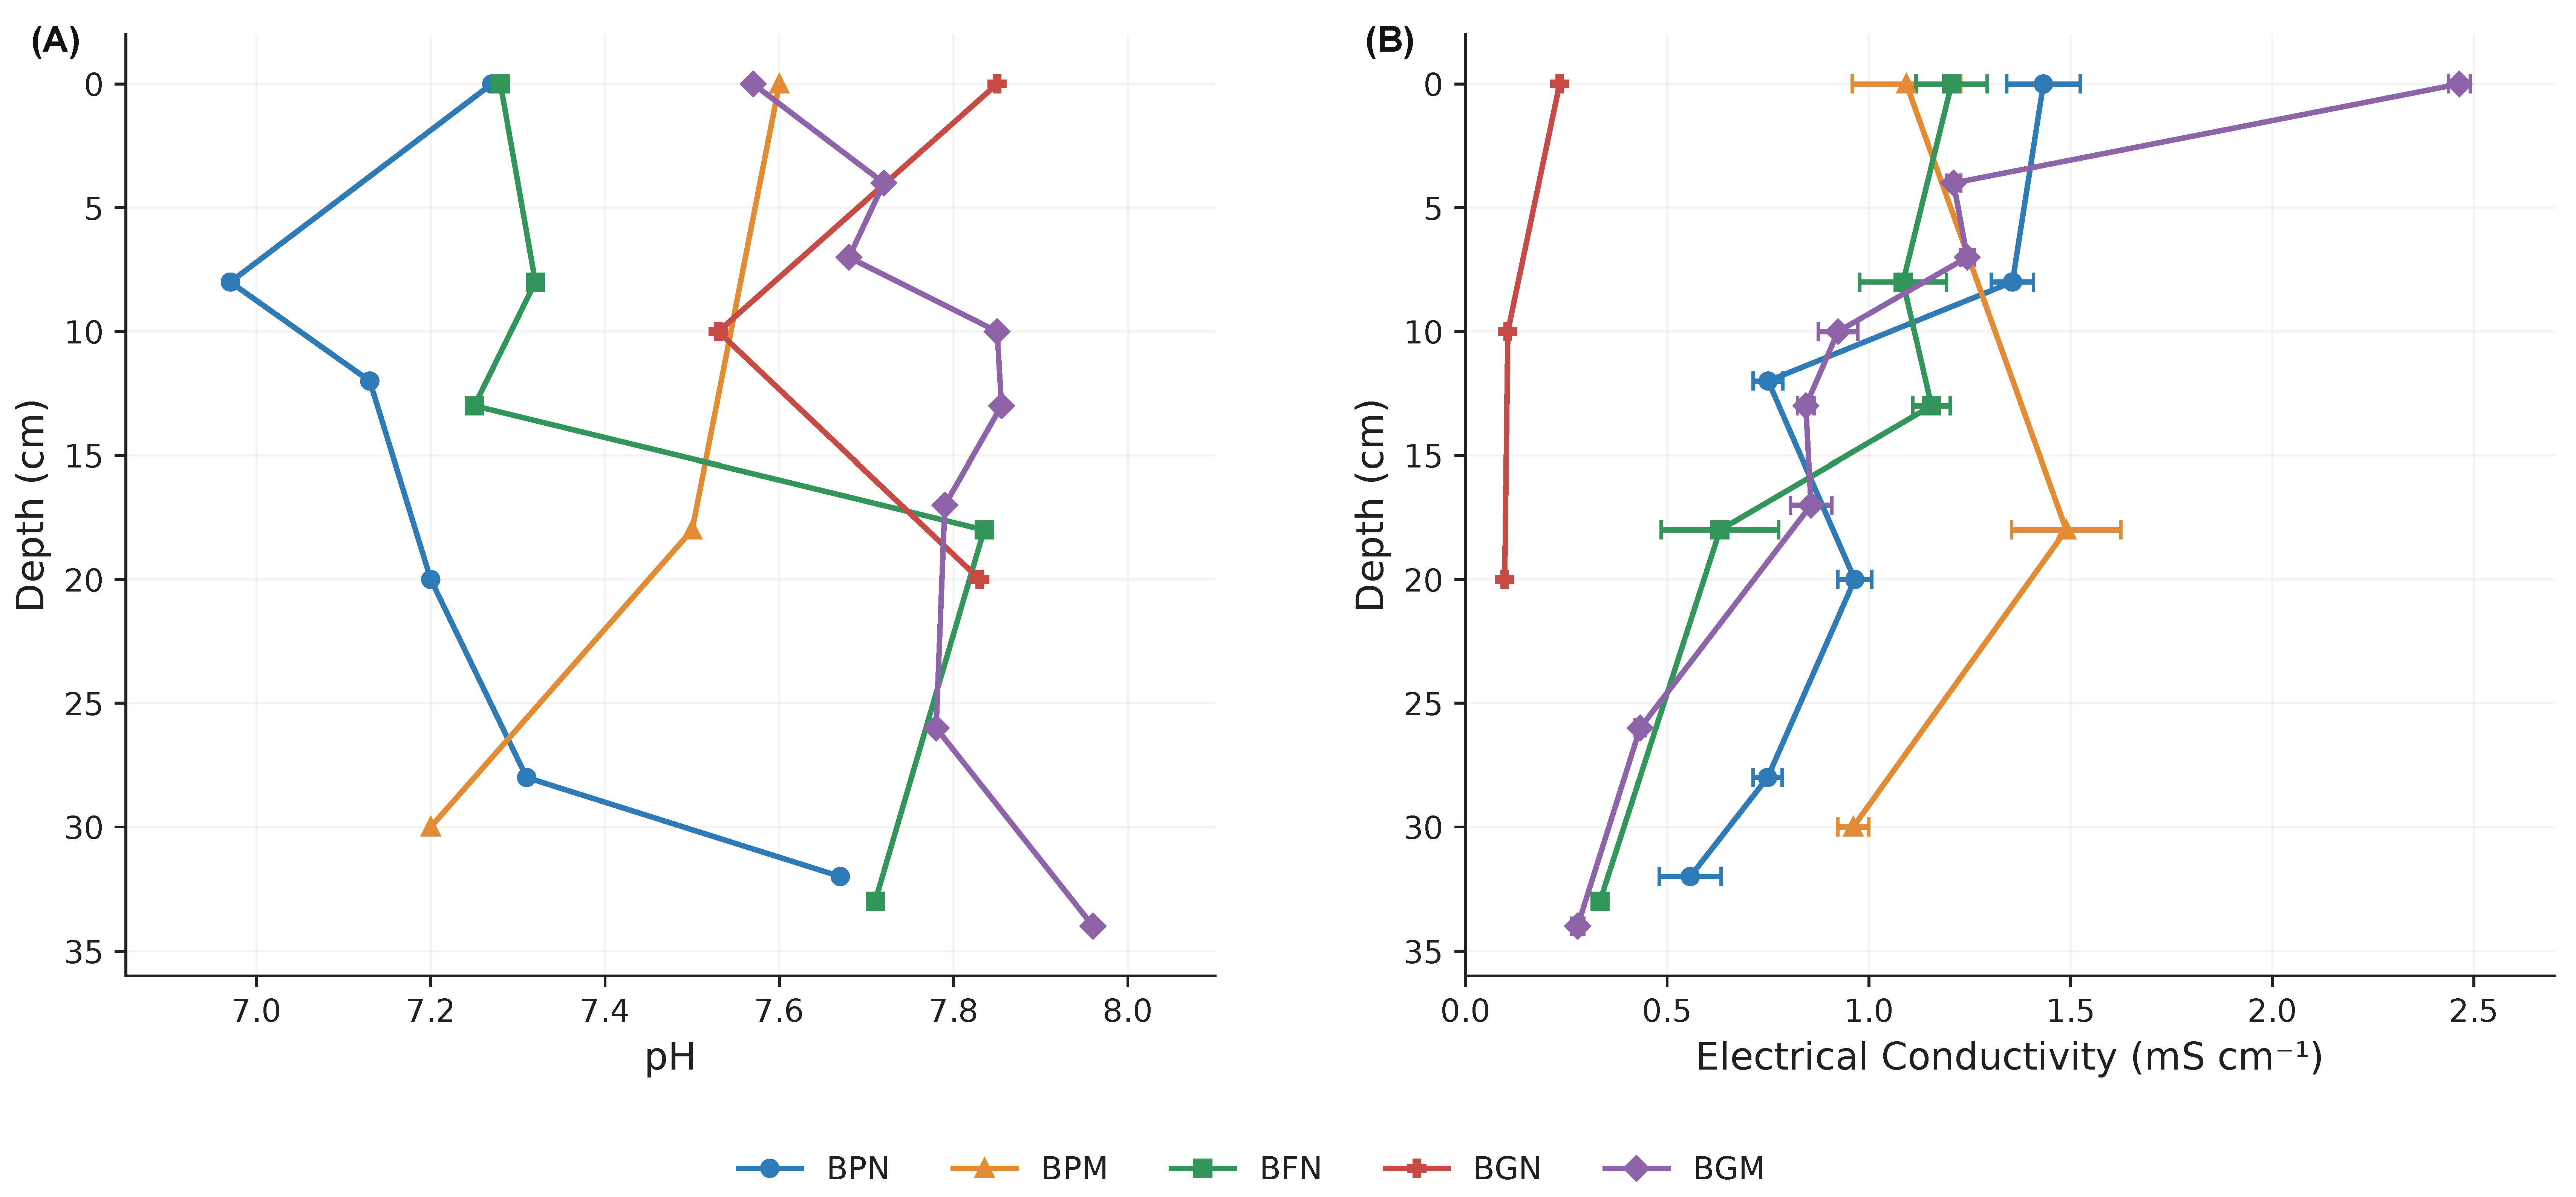
Figure 5 shows the pH and electrical conductivity (EC) profiles measured at different sediment depths across the five study sites. Soil pH ranged from 6.97 to 7.97, indicating predominantly neutral to slightly alkaline conditions. Vertical variation in pH was relatively limited compared with EC, although differences in profile patterns were observed among sites. BGM generally exhibited higher and more stable pH values, whereas BPN showed the lowest values in the upper and intermediate sediment layers. Electrical conductivity exhibited greater variation among sites and sediment depths (Figure 5B). For example, BGN showed a mean EC of 0.097 mS cm−1 at 20–30 cm depth, whereas BGM reached 2.464 mS cm−1 in the uppermost sediment layer (0–4 cm). At BPM, a mean EC of 1.489 mS cm−1 was recorded at 18–30 cm depth. These observations illustrate differences in the magnitude and vertical distribution of EC among the sampled sediment layers, without identifying the specific ions responsible. EC values are presented as mean ± standard deviation of three repeated instrumental readings per sediment sample, with the corresponding coefficients of variation reported in Supplementary Table S1.
Figure 5.
(A) pH and (B) electrical conductivity (mScm−1) values for the five sites.
3.2.2. Root Biomass
Root biomass at the sites ranged from 0.993 kg at BPM, 0.234 kg at BPN, 1.260 kg at BFN, 3.967 at BGN and 4.345 kg at BGM. According to the equation by [22] the highest average value was recorded at BGN at 34.93 and BPN at 26.9 Mg C ha−1, while the lowest values were observed at BGM at 5.94 and BFN 7.21 Mg C ha−1.
3.2.3. Soil Organic Carbon (SOC)
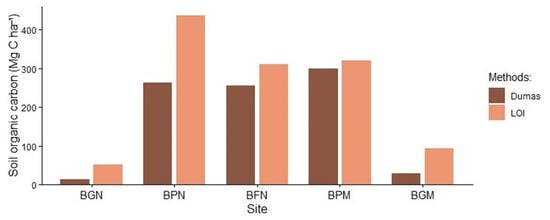
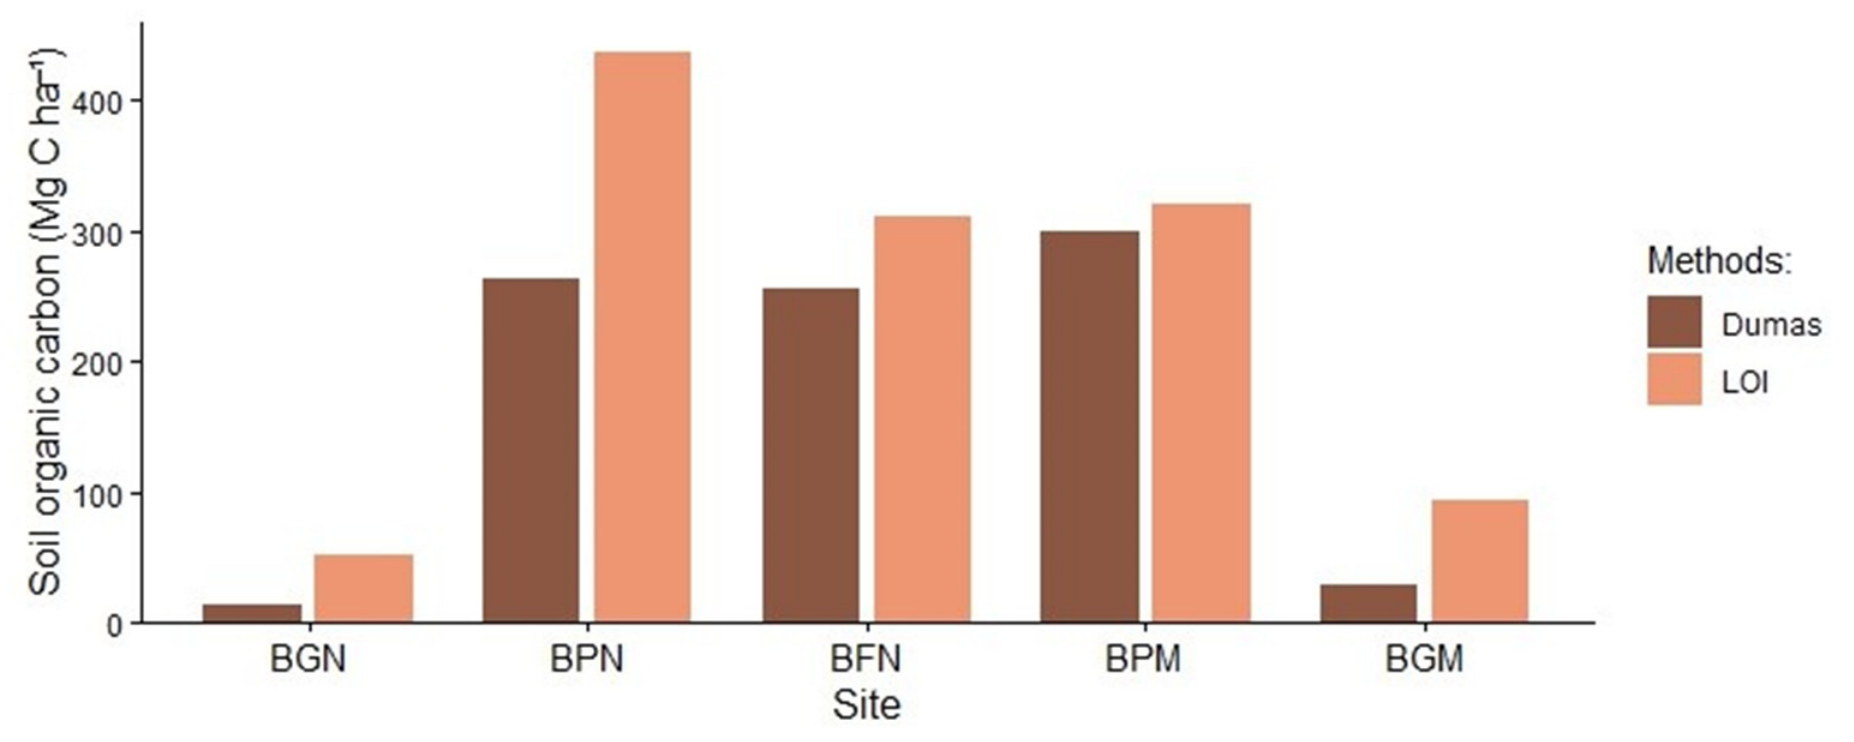
Soil organic carbon estimated using the Dumas method ranged from 26 to 299 Mg C ha−1 (Table 4, Figure 6). At the BGN site, carbon was obtained from the surface layer (0–20), the rocky terrain made it unable to obtain a sample at the same depth as the rest. In the soil profiles at the other sites, carbon exhibited a heterogeneous vertical distribution, with higher values in the subsurface and deep layers. Carbon content determined using the LOI method was highest at the BPN site (472.38 Mg C ha−1), followed by BPM and BFN. The carbon content determined by LOI was higher in the deep layers.
Table 4.
Total above-ground and below-ground carbon in the Bacalar wetlands.
Figure 6.
Total soil carbon content by site using the Dumas method and LOI.
3.3. Total Carbon Stock
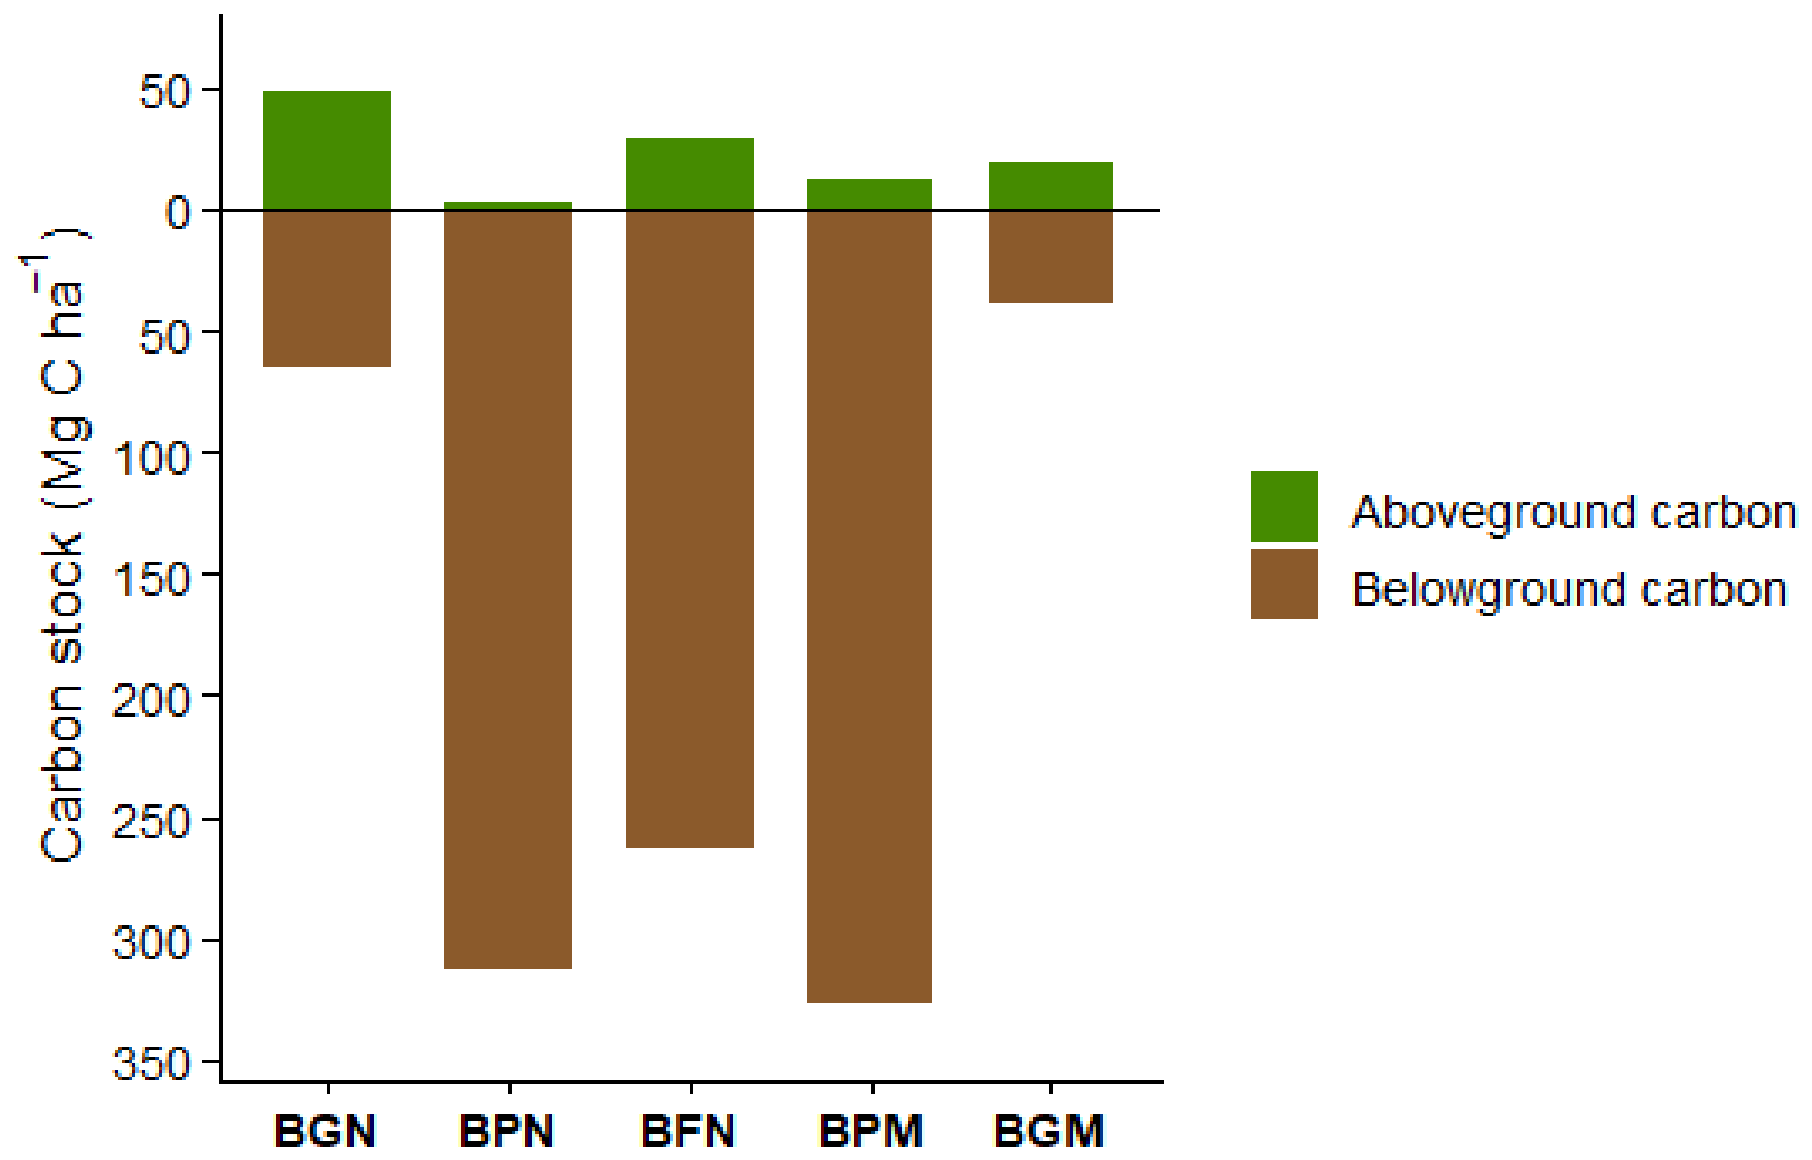
The data underlying the results presented in this section were previously deposited in Mendeley Data [56]. Total above-ground carbon varies across data from different wetland types (Table 4). The highest value was recorded in BGN at 48.86 Mg C ha−1, followed by BFN at 29.04 Mg C ha−1 and BGM at 19.75 Mg C ha−1, while BPM and BPN had the lowest values at 12.01 Mg C ha−1 and 2.00 Mg C ha−1, respectively. Within the above-ground compartment, litter increases the values principally for stocks at BGN and BFN, while fallen dead wood contributed smaller amounts to total above-ground carbon; BFN had the highest value for this component at 7.80 Mg C ha−1. In the case of BPN, due to flooding conditions, abundant suspended organic matter was recorded, which made it difficult to measure fallen dead wood and litter, as visibility was low and there was a high margin of error in the measurements. Total below-ground carbon, comprising roots and rhizomes, as well as soil carbon determined using the LOI method, was higher than above-ground carbon at several sites. These values were also higher than those obtained using the Dumas method.
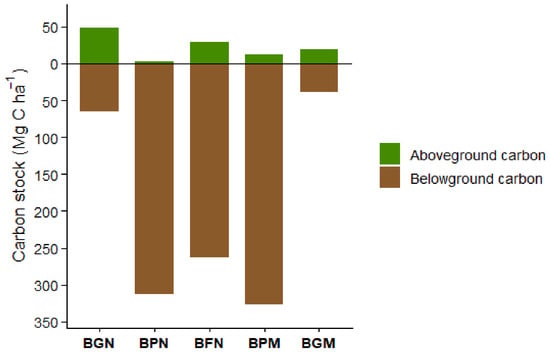
Figure 7 shows the distribution of above-ground and below-ground carbon stocks at the five sampled wetland sites. Based on the Dumas-derived soil carbon estimates, belowground carbon stocks exceeded aboveground stocks at all sites. This contrast was particularly pronounced at BPN, BFN, and BPM, where belowground stocks ranged from 262.96 to 327.04 Mg C ha−1, whereas aboveground stocks ranged from 2.00 to 29.04 Mg C ha−1 (Table 4). BGN had the highest aboveground carbon stock (48.86 Mg C ha−1), followed by BFN (29.04 Mg C ha−1). At BGN and BGM, belowground stocks were 64.98 and 38.29 Mg C ha−1, respectively, compared with aboveground stocks of 48.86 and 19.75 Mg C ha−1.
Figure 7.
Above-ground and below-ground carbon (root and soil) by site.
4. Discussion
4.1. Vegetation Structure and Above-Ground Carbon Estimates
Wetlands surrounding Bacalar Lagoon showed marked differences in vegetation structure, reflecting the heterogeneity of the landscape in terms of topography, flooding conditions, and soil characteristics. Gallery forest presented the tallest trees and the largest stem diameters, with heights ranging from 4 to 12 m and diameters from 1 to 39 cm. In contrast, vegetation in the other wetlands, including mangrove-dominated sites, was generally shorter, with heights between 1.5 and 3 m and diameters ranging from 0.5 to 17 cm. These structural differences were reflected in above-ground carbon stocks, which were generally higher in gallery forest than in the other wetland types.
The selection of allometric equations was an important source of variation in above-ground carbon estimates. Equations developed for broad groups of species or vegetation types produced greater uncertainty, particularly when applied across the wide range of stem diameters recorded in the study area. Previous studies [23,43,55] have shown that variability in tree diameter, architecture, wood density, and the range of observations used to develop an equation can substantially affect biomass estimates. Therefore, the use of a single general equation may increase uncertainty when vegetation structure is heterogeneous.
The Category 4 equations [37,41,43] showed relatively stable variability across sites. Although this category did not consistently exhibit the lowest coefficients of variation (CV), its values did not differ significantly from those obtained with Category 1 at any of the five sites, whereas differences relative to Categories 2 and 3 varied among sites. In this regard, the bootstrap analysis was considered complementary evidence regarding the variability of the estimates, rather than a sole criterion for determining the accuracy or reliability of the allometric equations.
Based on these results, the carbon estimates presented in Table 3 were calculated using the Category 4 equations. The selection of these equations was primarily based on their ecological and structural relevance, as this category includes equations specific to species, vegetation type, and tree structure [37,41,43]. These characteristics are particularly relevant to the wetlands studied because of their pronounced structural heterogeneity. Therefore, equation selection jointly considered the variability observed through the bootstrap analysis and the ecological and structural correspondence of the equations with the characteristics of the vegetation evaluated.
BG vegetation contained the largest above-ground carbon stocks, which is consistent with its greater tree height and diameter. In contrast, mangrove wetlands were characterized by shorter vegetation, isolated trees in some areas, and, particularly for Rhizophora mangle, a frequently stunted growth form. These structural characteristics explain their comparatively low above-ground biomass but should not be interpreted as indicating low ecosystem carbon storage. In wetlands, a substantial fraction of carbon can occur below-ground, particularly in soils and roots. Consequently, above-ground biomass alone does not adequately represent differences in total carbon storage among the wetland types studied here. The contribution of litter, dead wood, and below-ground biomass also varied among vegetation types. Their quantification was particularly difficult in permanently or seasonally flooded sites, where organic material can be submerged, redistributed, or incorporated into the soil. Roots constitute part of the below-ground rather than the above-ground component and should therefore be considered separately when interpreting ecosystem carbon stocks. These differences among carbon pools emphasize the importance of evaluating the components independently before estimating total ecosystem carbon.
4.2. Below-Ground Carbon
Below-ground carbon represented an important component of the carbon stocks in the wetlands surrounding Bacalar Lagoon. Soil carbon was estimated using both loss-on-ignition (LOI) and Dumas combustion. The comparison between these methods is particularly relevant in the Yucatán Peninsula because its karstic substrate contains large amounts of carbonates, which can complicate the estimation of organic carbon [57]. LOI generally produced higher estimates than Dumas, although the magnitude of the difference varied among sites. The largest differences occurred at BGM, BPM, and BPN, whereas estimates from the two methods were more similar at other sites. Therefore, LOI and Dumas should not be considered interchangeable without local calibration. Nevertheless, both methods produced a similar general spatial pattern in carbon stocks, suggesting that the major differences among wetland types were maintained independently of the analytical method.
The relationship between LOI and Dumas estimates was positive (R2 = 0.704). The leave-one-out cross-validation (LOOCV) produced an R2 of 0.665, close to the R2 of 0.704 obtained from the calibration model (Figure 8). Across the 23 iterations, the estimated meand cross-validated bias was 0.25 Mg C ha−1, the specified test did not detect a departure from zero (p = 0.948). These result does not stablish equivalence between methods, indicate that the regression was relatively stable and that a locally calibrated relationship can be useful for estimating organic carbon from LOI when Dumas measurements are not available. However, the differences observed at individual sites indicate that method-specific estimates should be retained when comparing absolute carbon stocks.
Figure 8.
Relationship between LOI and DUMAS carbon stocks.
This distinction is especially important in carbonate-rich wetlands. In the karstic wetlands of Sian Ka’an, for example, organic and inorganic carbon contributions vary with soil depth, and carbonate carbon can become proportionally more important in deeper horizons. Thus, analytical procedures capable of distinguishing organic from inorganic carbon are particularly relevant in these environments [22].
4.3. Spatial Distribution of Carbon Stocks in Bacalar
Differences in carbon storage among the Bacalar wetlands appear to result from the interaction between vegetation structure, topography, soil properties, and flooding conditions, which has been identified in other studies [58]. BG vegetation had comparatively high above-ground carbon because of its taller and larger trees, whereas petenes and fringe mangroves accumulated a greater proportion of carbon below-ground. This contrast indicates that the structural development of the vegetation and soil carbon accumulation do not necessarily follow the same spatial pattern.
The northern peten showed one of the clearest examples of this pattern, with below-ground carbon estimates of 488.37 Mg C ha−1 using LOI and 315.34 Mg C ha−1 using Dumas. The central peten also contained relatively high below-ground stocks (358.14 and 339.05 Mg C ha−1, respectively), while the northern fringe mangrove reached 348.00 Mg C ha−1 with LOI and 292 Mg C ha−1 with Dumas. Although the absolute values differed according to the analytical method, both approaches identified peten and fringe vegetation types among the sites with greater below-ground carbon storage.
These patterns may be related to environmental conditions commonly associated with wetland vegetation types. Previous studies have shown that fine-textured soils, restricted drainage, and soil water saturation can favor organic matter preservation by reducing oxygen availability and slowing decomposition under anaerobic conditions [8,9,10]. Differences in soil characteristics and environmental conditions may contribute to variations in carbon storage among wetland vegetation types. Ref. [59] reported differences in carbon stocks among mangrove ecological types in the karstic environments of the Yucatan Peninsula, associated with variations in flooding conditions, interstitial salinity, and redox potential. Similarly, ref. [58] highlighted the importance of soil type in water retention and soil organic carbon storage in tropical karst wetlands of Quintana Roo. In the present study, soil types were identified according to INEGI, while soil pH and electrical conductivity were measured to characterize local edaphic conditions. Although hydrological variables were not directly assessed, these soil characteristics provide complementary information for interpreting differences in carbon stocks among the wetland vegetation types surrounding Bacalar Lagoon. Similarly, differences in vegetation composition and geomorphological setting have been associated with variations in carbon stocks and soil carbon sequestration in tropical wetlands [60]. Therefore, the spatial heterogeneity observed around Bacalar Lagoon probably reflects the combined influence of geomorphology, hydroperiod, vegetation structure, and soil characteristics rather than the effect of a single environmental variable.
4.4. Carbon Stocks of Karstic Wetlands of Yucatán Peninsula
The carbon stocks measured around Bacalar Lagoon are within the broad range reported for wetlands of the Yucatán Peninsula (Table 5), although direct comparisons require caution because published studies differ in vegetation type, soil depth, analytical methods, and the carbon pools included in ecosystem estimates. This methodological variation is particularly relevant when comparing below-ground stocks, which frequently represent the largest carbon pool in tropical wetlands.
Table 5.
Carbon stocks in Mexico’s karst wetlands.
The wetlands of the Sian Ka’an Biosphere Reserve provide an important regional reference because they occur within the same karstic setting of the Mexican Caribbean. Ref. [22], reported total ecosystem carbon stocks of 987 ± 338 Mg C ha−1 in tall mangroves (<5 m), 623 ± 41 Mg C ha−1 in medium stature mangroves (3–5 m), 381 ± 52 Mg C ha−1 in scrub mangroves (<1.5 m), and 177 ± 73 Mg C ha−1 in marshes. Importantly, soil accounted for 78%–99% of total ecosystem carbon at these sites. These results demonstrate that vegetation stature alone is not sufficient to predict ecosystem carbon storage in karstic wetlands.
A similar pattern has been reported from the northern Yucatán Peninsula. In Ría Celestún, total ecosystem carbon stocks differed substantially among vegetation types, with peten reaching 683.7 Mg C ha−1, compared with 429 Mg C ha−1 in fringe mangroves, 385 Mg C ha−1 in basin mangroves, and 214 Mg C ha−1 in scrub mangroves. Below-ground carbon represented 84.1% of total ecosystem carbon, and the differences among mangrove types were associated with hydrological variables, including flooding level, interstitial salinity, and redox potential [59].
Petenes may include mangrove dominated vegetation and therefore share floristic characteristics with coastal mangrove communities. However, because hydroperiod (i.e., the duration, frequency, and depth of inundation) was not measured in this study, differences in hydrological regimes between the Bacalar wetlands and coastal mangroves cannot be established. Consequently, comparisons with other wetlands of the Yucatán Peninsula should be interpreted within a regional context of carbon storage, considering differences in study location, vegetation structure, and carbon estimation methods.
Studies from other regions of Mexico further illustrate the wide range of carbon storage found among tropical wetlands. In La Encrucijada Biosphere Reserve on the Pacific coast of Mexico, mean ecosystem carbon stocks were 784.5 Mg C ha−1 in mangroves, 722.2 Mg C ha−1 in peat swamp forests, and 336.5 Mg C ha−1 in marshes [59]. These values emphasize the influence of vegetation composition and geomorphological setting on carbon storage and demonstrate that substantial differences can occur even within the same wetland complex.
Taken together, these comparisons place Bacalar within the broad range of carbon stocks reported for Mexican tropical wetlands but, more importantly, show that its spatial pattern resembles that observed in other karstic systems of the Yucatán Peninsula. The relatively high contribution of below-ground carbon in peten and fringe wetlands reinforces the need to include soils when evaluating carbon storage in these ecosystems. The results also indicate that wetlands with relatively low above-ground biomass may nevertheless represent important carbon reservoirs because much of their carbon is stored below-ground.
From this perspective, the wetlands surrounding Bacalar Lagoon represent a heterogeneous carbon-storage system in which different vegetation types contribute through different carbon pools. BG vegetation contributes strongly through above-ground biomass, whereas petenes and fringe wetlands contribute primarily through below-ground storage. Maintaining this heterogeneity is important because the carbon-storage function of the landscape depends not only on vegetation cover but also on the hydrological and soil conditions that allow organic carbon to accumulate and persist.
5. Conclusions
The use of ecologically and structurally appropriate allometric equations can reduce uncertainty in aboveground biomass and carbon stock estimates. Each carbon pool should be estimated separately, as reporting carbon stocks by component allows for the identification of their relative contributions to total carbon storage and facilitates comparisons among wetland vegetation types. The selection of allometric equations should consider the structural characteristics of the vegetation, while carbon estimates should also account for the environmental heterogeneity associated with karstic landscapes. Factors such as substrate characteristics, flooding conditions, and topographic gradients may influence carbon accumulation and storage, particularly in belowground reservoirs. In the wetlands studied, petén and mangrove vegetation exhibited substantial belowground carbon stocks, highlighting the importance of soil characteristics and organic matter accumulation in these ecosystems.
The present study represents a contribution toward a better understanding of the factors influencing carbon stocks in tropical karst wetlands. The comparative evaluation of allometric equations and the separate estimation of carbon stocks in living vegetation, dead wood, litter, and soils provide a methodological basis for identifying the variables and ecological characteristics that should be considered when estimating carbon storage in these vegetation types. These findings emphasize the importance of selecting appropriate estimation methods and accounting for the structural and environmental heterogeneity of karst wetland ecosystems.
The conservation of wetlands associated with the Bacalar Lagoon system is essential for maintaining its ecological integrity, as these ecosystems contribute to nutrient processing, sediment retention, and carbon storage, among other ecosystem services. Although Bacalar Lagoon is generally recognized as a predominantly freshwater lake [24], it is part of a dynamic karstic hydrological system indirectly connected to Chetumal Bay, with water levels influenced by precipitation and groundwater inputs [19]. Previous studies have also documented hydrochemical variability within the lagoon system [13,14,20]. However, this regional hydrological connectivity does not necessarily imply marine intrusion or permanently brackish conditions in the studied wetlands. The occurrence of mangrove species within petenes reflects their ecological complexity but cannot, by itself, establish the salinity regime of these environments. Furthermore, the electrical conductivity values obtained from soil suspensions in the present study cannot be directly compared with thresholds established for freshwater or brackish surface water. Because seasonal porewater salinity and hydroperiod were not monitored, potential changes in these conditions between rainy and dry seasons remain undetermined. Changes in precipitation and groundwater availability could influence vegetation composition, mangrove distribution, and carbon dynamics, although the direction and magnitude of these responses cannot be predicted from the present dataset. This study provides information on carbon stocks in wetlands associated with the Bacalar Lagoon system in the Yucatan Peninsula, Mexico, and contributes to the understanding of carbon storage in tropical karst and Caribbean wetland systems.
Supplementary Materials
The following supporting information can be downloaded at: https://www.mdpi.com/article/10.3390/f17111341/s1, Table S1. Electrical conductivity (EC) of sediment samples from five wetland sites surrounding Bacalar Lagoon, Mexico.
Author Contributions
R.C.-P. Conceptualization, supervision, data curation. N.T.-V. investigation, data curation, project administration, advisor, supervision, writing final version; C.C.-G. Data analysis, formal analysis, supervision; F.C.-L., formal analysis, supervision; D.A.-Z., supervision, data curation; P.J.R.-B., supervision. All authors have read and agreed to the published version of the manuscript.
Funding
This research was funded by the Consejo Nacional de Humanidades, Ciencias y Tecnología of Mexico (CONAHCYT) through the project Modelación Paleoclimática en la Península de Yucatán A1-S-28196.
Data Availability Statement
The data has been submitted to the Mendeley Data repository. Torrescano-Valle, Nuria; Chi-Pech, Ramiro; Carrillo-García, Citlali; Casanova-Lugo, Fernando; Aceves Zayas, Dafne Gabriela; Ramírez-Barajas, Pablo Jesús (2026), “Carbon stocks in the wetlands of a tropical near-costal lake: Bacalar, Mexico.”, Mendeley Data, V1 [56], https://doi.org/10.17632/7hpz3gj2kx.1.
Acknowledgments
During the preparation of this manuscript, the authors used chaGPT version 26.727.51351 for English language revision. The authors have reviewed and edited the output and take full responsibility for the content of this publication.
Conflicts of Interest
The authors declare no conflict of interest.
References
- Collins, M.E.; Kuehl, R.J. Organic matter accumulation and organic soils. In Wetland Soils: Genesis, Hydrology, Landscapes, and Classification; Richardson, J.L., Vepraskas, M.J., Eds.; CRC Press: Boca Raton, FL, USA, 2000; pp. 137–162. [Google Scholar] [CrossRef] [Scilit]
- Mitsch, W.J.; Gosselink, J.G. Wetlands, 3rd ed.; John Wiley & Sons: Hoboken, NJ, USA, 2000. [Google Scholar]
- Intergovernmental Panel on Climate Change. Climate Change 2021: The Physical Science Basis. Contribution of Working Group I to the Sixth Assessment Report of the Intergovernmental Panel on Climate Change; Masson-Delmotte, V., Zhai, P., Pirani, A., Connors, S.L., Péan, C., Berger, S., Caud, N., Chen, Y., Goldfarb, L., Gomis, M.I., et al., Eds.; Cambridge University Press: Cambridge, UK, 2021. [Google Scholar] [CrossRef] [Scilit]
- Barducci, A.; Marcoionni, P.; Pippi, I.; Poggesi, M.; Guzzi, D.; Raddi, S.; Ramat, G. Aerospace wetland monitoring by hyperspectral imaging sensors: A case study in the coastal zone of San Rossore Natural Park. J. Environ. Manag. 2009, 90, 2278–2286. [Google Scholar] [CrossRef] [Scilit] [PubMed]
- Kauffman, J.B.; Donato, D.C. Protocols for the Measurement, Monitoring and Reporting of Structure, Biomass and Carbon Stocks in Mangrove Forests; Working Paper 86; Center for International Forestry Research (CIFOR): Bogor, Indonesia, 2012. [Google Scholar] [CrossRef] [Scilit]
- Were, D.; Kansiime, F.; Fetahi, T.; Cooper, A.; Jjuuko, C. Carbon sequestration by wetlands: A critical review of enhancement measures for climate change mitigation. Earth Syst. Environ. 2019, 3, 327–340. [Google Scholar] [CrossRef] [Scilit]
- Vázquez-Benavides, J.; Alvarado-Barrientos, M.S.; Pineda-López, M.R. Revisión cienciométrica (1990–2022) del ciclo del carbono y los flujos de CO2 y CH4 de manglares. Madera Bosques 2024, 30, e3042628. [Google Scholar] [CrossRef] [Scilit]
- Marín-Muñiz, J.L. Balance Neto de Carbono en Suelos de Humedales Costeros de Agua Dulce: Implicaciones Ecológicas y Sociales. Ph.D. Thesis, Universidad Veracruzana, Xalapa, Mexico, 2013. [Google Scholar]
- Sanderman, J.; Maddern, T.; Baldock, J. Similar composition but differential stability of mineral retained organic matter across four classes of clay minerals. Biogeochemistry 2014, 121, 409–424. [Google Scholar] [CrossRef] [Scilit]
- Bai, Y.; Cotrufo, M.F. Grassland soil carbon sequestration: Current understanding, challenges, and solutions. Science 2022, 377, 603–608. [Google Scholar] [CrossRef] [Scilit] [PubMed]
- Hernández, M.E. El papel de los suelos de humedales como sumideros de carbono y fuentes de metano. Terra Latinoam. 2010, 28, 139–147. [Google Scholar]
- Paredes-García, S.S.; Moreno-Casasola, P.; de la Barrera, E.; García-Oliva, F.; Lindig-Cisneros, R. Biomasa y carbono almacenado en un humedal continental en Cuitzeo, Michoacán, México. Tecnol. Cienc. Agua 2021, 12, 416–441. [Google Scholar] [CrossRef] [Scilit]
- Yáñez-Montalvo, A.; Gómez-Acata, S.; Águila, B.; Hernández-Arana, H.; Falcón, L.I. The microbiome of modern microbialites in Bacalar Lagoon, Mexico. PLoS ONE 2020, 15, e0230071. [Google Scholar] [CrossRef] [Scilit] [PubMed]
- Yáñez-Montalvo, A.; Águila, B.; de León-Lorenzana, A.S.; Bayona, A.; Torrescano-Valle, N.; Popoca, P.; Falcón, L.I. Karst-environments of the southeastern Yucatan Peninsula: Hotspots for modern freshwater microbialites. PLoS ONE 2025, 20, e0322625. [Google Scholar] [CrossRef] [Scilit] [PubMed]
- Johnson, D.B.; Beddows, P.A.; Flynn, T.M.; Osburn, M.R. Microbial diversity and biomarker analysis of modern freshwater microbialites from Laguna Bacalar, Mexico. Geobiology 2018, 16, 319–337. [Google Scholar] [CrossRef] [Scilit] [PubMed]
- Centeno, C.M.; Legendre, P.; Beltrán, Y.; Alcántara-Hernández, R.J.; Lidström, U.E.; Ashby, M.N.; Falcón, L.I. Microbialite genetic diversity and composition relate to environmental variables. FEMS Microbiol. Ecol. 2012, 82, 724–735. [Google Scholar] [CrossRef] [Scilit] [PubMed]
- Siqueiros-Beltrones, D.A.; Argumedo-Hernández, U.; Hernández-Almeida, O.U. Diagnosis prospectiva sobre la diversidad de diatomeas epilíticas en la laguna Bacalar, Quintana Roo, México. Rev. Mex. Biodivers. 2013, 84, 865–875. [Google Scholar] [CrossRef] [Scilit]
- de Jesús-Navarrete, A.; Álvarez-Legorreta, T. Biological traits analysis of free-living nematodes as indicators of environmental quality at Lake Bacalar, Mexico. Limnology 2022, 23, 355–364. [Google Scholar] [CrossRef] [Scilit]
- Carrillo, L.; Yescas, M.; Nieto-Oropeza, M.O.; Elías-Gutiérrez, M.; Alcérreca-Huerta, J.C.; Palacios-Hernández, E. Investigating the morphometry and hydrometeorological variability of a fragile tropical karstic lake of the Yucatán Peninsula: Bacalar Lagoon. Hydrology 2024, 11, 68. [Google Scholar] [CrossRef] [Scilit]
- Tobón Velázquez, N. Hidroquímica y Caracterización del Sedimento Carbonatado del Sur de la Laguna de Bacalar. Master’s Thesis, Centro de Investigación Científica de Yucatán, Mérida, Mexico, 2018. [Google Scholar]
- Aragón-Moreno, A.A.; Islebe, G.A.; Torrescano-Valle, N.; Hernández-Arana, H.A.; Carrillo-Bastos, A.; Friedel, R. Mangrove dynamics driven by Late Holocene drought at Laguna Bacalar, Mexico. Quat. Environ. Hum. 2024, 2, 100023. [Google Scholar] [CrossRef] [Scilit]
- Adame, M.F.; Kauffman, J.B.; Medina, I.; Gamboa, J.N.; Torres, O.; Caamal, J.P.; Reza, M.; Herrera-Silveira, J.A. Carbon stocks of tropical coastal wetlands within the karstic landscape of the Mexican Caribbean. PLoS ONE 2013, 8, e56569. [Google Scholar] [CrossRef] [Scilit] [PubMed]
- Ávila-Acosta, C.R.; Domínguez-Domínguez, M.; Vázquez-Navarrete, C.; Acosta-Pech, R.; Martínez-Zurimendi, P. Above-ground biomass and carbon storage in mangrove forests in southeastern Mexico. Resources 2024, 13, 41. [Google Scholar] [CrossRef] [Scilit]
- Gischler, E.; Golubic, S.; Gibson, M.A.; Oschmann, W.; Hudson, J.H. Microbial mats and microbialites in the freshwater Laguna Bacalar, Yucatan Peninsula, Mexico. In Advances in Stromatolite Geobiology; Lecture Notes in Earth Sciences; Reitner, J., Quéric, N.-V., Arp, G., Eds.; Springer: Berlin/Heidelberg, Germany, 2011; Volume 131, pp. 187–205. [Google Scholar] [CrossRef] [Scilit]
- Berlanga-Robles, C.A.; Ruiz-Luna, A.; Lanza Espino, G.D.L. Esquema de clasificación de los humedales de México. Investig. Geogr. 2008, n.66, 25–46. [Google Scholar]
- Cowardin, L.M. Classification of Wetlands and Deepwater Habitats of the United States; Fish and Wildlife Service, US Department of the Interior: Washington, DC, USA, 1979.
- Semeniuk, C.A.; Semeniuk, V. A geomorphic approach to global wetland classification. Vegetatio 1995, 118, 103–124. [Google Scholar] [CrossRef] [Scilit]
- Junk, W.J. World wetlands classification: A new hierarchic hydro-ecological approach. Wetl. Ecol. Manag. 2024, 32, 975–1001. [Google Scholar] [CrossRef] [Scilit]
- Palafox-Juárez, E.B.; Callejas-Jiménez, M.E.; Herrera-Silveira, J.A.; Teutli-Hernández, C.; Camacho-Valdez, V.; López-Martínez, J.O. Effects of land use change on ecosystem services in freshwater wetlands in Bacalar, Mexico. PeerJ 2025, 13, e18954. [Google Scholar] [CrossRef] [Scilit] [PubMed]
- Durán, R. Descripción y análisis de la estructura y composición de la vegetación de los petenes del noroeste de Campeche, México. Biótica 1987, 12, 181–198. [Google Scholar]
- López-Portillo, J.; Ezcurra, E.; Maass, J.M. Los petenes de Sian Ka’an, Quintana Roo y su relación con gradientes de presión hídrica. Acta Botán. Mex. 1989, 5, 19–29. [Google Scholar] [CrossRef] [Scilit]
- Ross, M.S.; Stoffella, S.L.; Vidales, R.; Meeder, J.F.; Kadko, D.C.; Scinto, L.J.; Subedi, S.C.; Redwine, J.R. Sea-level rise and the persistence of tree islands in coastal landscapes. Ecosystems 2022, 25, 586–602. [Google Scholar] [CrossRef] [Scilit]
- Espinosa-Mendoza, D.A.; Arceo-Carranza, D.; Chiappa-Carrara, X. The Effect of the Seasonal Variations on the Structure of the Fish Community in Karstic Wetlands. Wetlands 2025, 45, 24. [Google Scholar] [CrossRef] [Scilit]
- Wetzel, P.R.; Sah, J.P.; Ross, M.S. Tree islands: The bellwether of Everglades ecosystem function and restoration success. Restor. Ecol. 2017, 25, S71–S85. [Google Scholar] [CrossRef] [Scilit]
- Instituto Nacional de Estadística y Geografía. Carta Edafológica Chetumal E16-4-7, Serie III; INEGI: Aguascalientes, Mexico, 2013.
- Mostacedo, B.; Fredericksen, T. Manual de Métodos Básicos de Muestreo y Análisis en Ecología Vegetal; Proyecto de Manejo Froestal Sostenible (BOLFOR): Santa Cruz, Bolivia, 2000; Volume 87, pp. 1–92. [Google Scholar]
- Howard, J.; Hoyt, S.; Isensee, K.; Pidgeon, E.; Telszewski, M. (Eds.) Coastal Blue Carbon: Methods for Assessing Carbon Stocks and Emissions Factors in Mangroves, Tidal Salt Marshes, and Seagrass Meadows; Conservation International: Arlington, VA, USA; Intergovernmental Oceanographic Commission of UNESCO: Paris, France; International Union for Conservation of Nature: Gland, Switzerland, 2018. [Google Scholar]
- Kauffman, J.B.; Heider, C.; Cole, T.G.; Dwire, K.A.; Donato, D.C. Ecosystem carbon stocks of Micronesian mangrove forests. Wetlands 2011, 31, 343–352. [Google Scholar] [CrossRef] [Scilit]
- Bansal, S.; Creed, I.F.; Tangen, B.A.; Bridgham, S.D.; Desai, A.R.; Krauss, K.W.; Neubauer, S.C.; Noe, G.B.; Rosenberry, D.O.; Trettin, C.; et al. Practical guide to measuring wetland carbon pools and fluxes. Wetlands 2023, 43, 105. [Google Scholar] [CrossRef] [Scilit] [PubMed]
- Climate Action Reserve (CAR). Protocolo Forestal para México. Borrador para el Grupo de Trabajo, Versión 3.0. 2022, p. 195. Available online: https://www.climateactionreserve.org/wp-content/uploads/2023/12/Protocolo-Forestal-para-Mexico-V3.0_ESP_Erratas-y-Clarificaciones.pdf (accessed on 1 May 2026).
- Chave, J.; Andalo, C.; Brown, S.; Cairns, M.A.; Chambers, J.Q.; Eamus, D.; Fölster, H.; Fromard, F.; Higuchi, N.; Kira, T.; et al. Tree allometry and improved estimation of carbon stocks and balance in tropical forests. Oecologia 2005, 145, 87–99. [Google Scholar] [CrossRef] [Scilit] [PubMed]
- Chave, J.; Réjou-Méchain, M.; Búrquez, A.; Chidumayo, E.; Colgan, M.S.; Delitti, W.B.C.; Duque, A.; Eid, T.; Fearnside, P.M.; Goodman, R.C.; et al. Improved allometric models to estimate the above-ground biomass of tropical trees. Glob. Change Biol. 2014, 20, 3177–3190. [Google Scholar] [CrossRef] [Scilit] [PubMed]
- Puc-Kauil, R.; Ángeles-Pérez, G.; Valdéz-Lazalde, J.R.; Reyes-Hernández, V.J.; Dupuy-Rada, J.M.; Schneider, L. Allometric equations to estimate above-ground biomass of small-diameter mixed tree species in secondary tropical forests. iForest–Biogeosci. For. 2020, 13, 165–174. [Google Scholar] [CrossRef] [Scilit]
- Reyes, G.; Brown, S.; Chapman, J.; Lugo, A.E. Wood Densities of Tropical Tree Species; General Technical Report SO-88; U.S. Department of Agriculture, Forest Service, Southern Forest Experiment Station: Asheville, NC, USA, 1992. [Google Scholar] [CrossRef]
- World Agroforestry Centre. Agroforestree Database 4.0. Available online: https://apps.worldagroforestry.org/treedb2/ (accessed on 1 May 2026).
- Lin, J.; Gamarra, J.G.; Drake, J.E.; Cuchietti, A.; Yanai, R.D. Scaling up uncertainties in allometric models: How to see the forest, not the trees. For. Ecol. Manag. 2023, 537, 120943. [Google Scholar] [CrossRef] [Scilit]
- Picard, N.; Fonton, N.; Boyemba Bosela, F.; Fayolle, A.; Loumeto, J.; Ngua Ayecaba, G.; Sonké, B.; Yongo Bombo, O.D.; Maïdou, H.M.; Ngomanda, A. Selecting allometric equations to estimate forest biomass from plot- rather than individual-level predictive performance. Biogeosciences 2025, 22, 1413–1426. [Google Scholar] [CrossRef] [Scilit]
- Komiyama, A.; Ong, J.E.; Poungparn, S. Allometry, biomass, and productivity of mangrove forests: A review. Aquat. Bot. 2008, 89, 128–137. [Google Scholar] [CrossRef] [Scilit]
- Cairns, M.A.; Brown, S.; Helmer, E.H.; Baumgardner, G.A. Root biomass allocation in the world’s upland forests. Oecologia 1997, 111, 1–11. [Google Scholar] [CrossRef] [Scilit] [PubMed]
- Heiri, O.; Lotter, A.F.; Lemcke, G. Loss on ignition as a method for estimating organic and carbonate content in sediments: Reproducibility and comparability of results. J. Paleolimnol. 2001, 25, 101–110. [Google Scholar] [CrossRef] [Scilit]
- Breithaupt, J.L.; Steinmuller, H.E.; Rovai, A.S.; Engelbert, K.M.; Smoak, J.M.; Chambers, L.G.; Radabaugh, K.R.; Moyer, R.P.; Chappel, A.; Vaughn, D.R.; et al. An improved framework for estimating organic carbon content of mangrove soils using loss-on-ignition and coastal environmental setting. Wetlands 2023, 43, 57. [Google Scholar] [CrossRef] [Scilit] [PubMed]
- Etheridge, R.D.; Pesti, G.M.; Foster, E.H. A comparison of nitrogen values obtained utilizing the Kjeldahl nitrogen and Dumas combustion methodologies (Leco CNS 2000) on samples typical of an animal nutrition analytical laboratory. Anim. Feed. Sci. Technol. 1998, 73, 21–28. [Google Scholar] [CrossRef] [Scilit]
- Mukul, S.A.; Halim, M.A.; Herbohn, J. Forest carbon stock and fluxes: Distribution, biogeochemical cycles, and measurement techniques. In Life on Land; Encyclopedia of the UN Sustainable Development Goals; Filho, W.L., Azul, A.M., Brandli, L., Özuyar, P.G., Wall, T., Eds.; Springer: Berlin/Heidelberg, Germany, 2020; pp. 1–16. [Google Scholar] [CrossRef] [Scilit]
- Chan-Keb, C.A.; Agraz-Hernández, C.M.; Pérez-Balan, R.A.; Mas-Qui, O.O.; Osti-Sáenz, J.; Reyes-Castellanos, J.E. Relationship between carbon sequestration and soil physicochemical parameters in northern Campeche, Mexico. Land 2024, 13, 139. [Google Scholar] [CrossRef] [Scilit]
- Rahman, M.S.; Donoghue, D.N.; Bracken, L.J.; Mahmood, H. Biomass estimation in mangrove forests: A comparison of allometric models incorporating species and structural information. Environ. Res. Lett. 2021, 16, 124002. [Google Scholar] [CrossRef] [Scilit]
- Torrescano-Valle, N.; Chi-Pech, R.; Carrillo-García, C.; Casanova-Lugo, F.; Zayas, D.G.A.; Ramírez-Barajas, P.J. Carbon Stocks in the Wetlands of a Tropical Near-Costal Lake: Bacalar, Mexico; Mendeley Data V1. 2026. Available online: https://data.mendeley.com/datasets/7hpz3gj2kx/1 (accessed on 1 May 2026).
- Wright, A.L.; Wang, Y.; Reddy, K.R. Loss-on-ignition method to assess soil organic carbon in calcareous Everglades wetlands. Commun. Soil Sci. Plant Anal. 2008, 39, 3074–3083. [Google Scholar] [CrossRef] [Scilit]
- Cejudo, E.; Bravo-Mendoza, M.; Gómez-Ramírez, J.J.; Acosta-González, G. Water retention and soil organic carbon storage in tropical karst wetlands in Quintana Roo, Mexico. Wetl. Ecol. Manag. 2024, 32, 539–552. [Google Scholar] [CrossRef] [Scilit]
- Cinco-Castro, S.; Herrera-Silveira, J.; Montero Muñoz, J.L.; Hernández-Nuñez, H.; Teutli Hernández, C. Carbon stock in different ecological types of mangroves in a karstic region (Yucatan, México): An opportunity to avoid site scale emissions. Front. For. Glob. Change 2023, 6, 1181542. [Google Scholar] [CrossRef] [Scilit]
- Adame, M.F.; Santini, N.S.; Tovilla, C.; Vázquez-Lule, A.; Castro, L.; Guevara, M. Carbon stocks and soil sequestration rates of tropical riverine wetlands. Biogeosciences 2015, 12, 3805–3818. [Google Scholar] [CrossRef] [Scilit]
- Morales-Ojeda, S.M.; Herrera-Silveira, J.A.; Orellana, R. Carbon stocks in a karst wetlandscape along a transverse coastal corridor in the Yucatan Peninsula. Madera Bosques 2021, 27, e2742425. [Google Scholar]
- Sjögersten, S.; de la Barreda-Bautista, B.; Brown, C.; Boyd, D.; Lopez-Rosas, H.; Hernández, E.; Monroy, R.; Rincón, M.; Vane, C.; Moss-Hayes, V.; et al. Coastal wetland ecosystems deliver large carbon stocks in tropical Mexico. Geoderma 2021, 403, 115173. [Google Scholar] [CrossRef] [Scilit]

Disclaimer/Publisher’s Note: The statements, opinions and data contained in all publications are solely those of the individual author(s) and contributor(s) and not of MDPI and/or the editor(s). MDPI and/or the editor(s) disclaim responsibility for any injury to people or property resulting from any ideas, methods, instructions or products referred to in the content. |
© 2026 by the authors. Licensee MDPI, Basel, Switzerland. This article is an open access article distributed under the terms and conditions of the Creative Commons Attribution (CC BY) license.