


Abstract
This study evaluates whether handheld mobile laser scanning (HMLS) can support the design of canopy consolidation systems for urban Pinus pinea L. trees without climbing into the crown. Fifty stone pines in a historic park in Pistoia (Italy) were surveyed with a SLAM-based handheld laser scanner and assessed with Visual Tree Assessment; five trees were then selected for consolidation design. Tree height, diameter at breast height (DBH), and crown metrics were derived from the point cloud and compared with field measurements, and the scaffold branches were reconstructed as sequences of truncated cones. For each branch, the bending stress generated by self-weight was computed with cantilever-beam theory and compared with the compressive strength of green P. pinea wood; a wind load case and a sensitivity analysis to diameter errors were added. Under self-weight, the safety factor of the vulnerable branches ranged from 1.44 to 37; one branch was below the usual minimum of 1.5 and a second fell to 1.69 under the 27 m/s wind. Anchor positions, rope trajectories, and system classes (4 t or 8 t) were drawn directly on the point cloud. The study is proof of concept: the systems have not been installed, and the mechanical results have not been verified by load tests, but the workflow shows that the data needed for consolidation design can be obtained remotely and non-invasively.
1. Introduction
The integration of trees and green spaces into urban environments is a critical component of sustainable urban development and a reflection of high-quality urban design. Urban green components contribute to social, economic, and environmental sustainability: trees improve air quality by sequestering carbon dioxide and absorbing pollutants, releasing oxygen, mitigating the urban heat island effect by providing shade and regulating surface temperatures, and contributing to more stable and livable microclimates [1]. These functions are particularly vital in densely populated urban areas, where pollution and heat stress pose significant risks to public health [2]. Beyond their environmental benefits, green infrastructure contributes to human health and social well-being and supports psychological well-being, with documented reductions in stress and improved mental health among people with access to natural environments [3]. However, increasing urbanization and climate change place growing pressure on the preservation of these green spaces, heightening the need for strategic planning and risk-based management [4,5]. Urban trees, while providing substantial ecological, social, and economic benefits, also pose potential risks that must be managed to ensure public safety. Their large size and the constraints of urban growing conditions—limited root space, compacted soil, and pollution—often lead to internal defects such as hollow trunks, weak branch unions, and decayed roots, increasing the likelihood of structural failure. Extreme weather events further exacerbate these vulnerabilities [6]. Tree failures are not only ecological concerns but also safety and legal issues, as accidents resulting from branch or trunk failure can cause injury or property damage and expose tree owners to liability [7,8]. Recent records illustrate the scale of the problem: 450 weather-related tree falls were documented in Venice between 2019 and 2022, most frequently during summer wind gusts exceeding 15 m/s [9], while earlier data from Turin reported an increase in documented failures from 43 in 2014 to over 100 in 2017 [10]. These trends underscore the need for advanced tree risk assessment methodologies and innovative technologies to manage urban forests effectively.
Assessing the structural stability of urban trees is inherently complex, as it depends on genetic, morpho-structural, environmental, and site-specific factors [11]. Arboricultural practices have evolved to include methods such as Visual Tree Assessment (VTA), Statics Integrated Methods (SIM), and consolidation techniques. Consolidation, for instance, involves the use of cabling and bracing systems to stabilize vulnerable branches or trunks. These interventions require precise biometric data—such as trunk and branch diameters, insertion angle—to design supports with appropriate holding capacities [12]. Traditionally, these data are collected empirically at ground level or through direct climbing assessment, which limits accuracy, exposes operators to risk, and can only be performed by a small subset of skilled climbers [13].
Urban tree management also benefits from geomatics-based approaches (GIS, surveying and spatial modelling), which are already established in precision agriculture and forestry but remain underutilized in arboriculture, where structural parameters are still largely assessed empirically based on operator experience. This reliance on visual estimation can lead to installation errors and future structural failures and exposes operators to significant safety risks when direct climbing assessment of the upper canopy is required, an activity only a small share of operators is trained and equipped to perform [13]. The urgency of these issues is amplified by the growing frequency of weather-related tree failures under climate change [4,14,15], and by the heightened public perception of risk this generates, even though the statistical probability of injury from tree failure remains low [16].
Urban greenery has become an increasingly research-active sector over the past decade, with technologies evolving from simple dendrodensitometers to advanced tomographs and physiological sensors [17]. However, few studies have applied these technologies to support the design of consolidation interventions verified against the specific biometric characteristics of individual trees [18,19].
The integration of geomatics and remote-sensing technologies, LiDAR, drone-based photogrammetry, and RPAS-based imaging has transformed urban tree monitoring, enabling accurate three-dimensional assessment of height, crown geometry, and biomass, and supporting large-scale identification of structurally hazardous trees [10,20,21]. One such approach uses RPAS-based photogrammetry to calculate a quantitative Stability Factor for identifying risk zones and prioritizing interventions such as pruning or removal, enhancing the cost-effectiveness of urban forestry management and contributing to the emerging paradigm of “Precision Arboriculture” [10]. Biomechanical models combined with these remote-sensing techniques have proven effective in evaluating structural vulnerabilities and guiding targeted interventions. Despite these advances, current applications of LiDAR to urban trees remain largely limited to inventory, health assessment, and hazard screening; its use to directly inform the design of consolidation interventions—translating branch-level biometric data into anchor positions, rope trajectories, and load-appropriate hardware—has so far received little attention: a recent review of branch characterisation from point clouds reports applications in phenotyping, timber quality, carbon and ecological modelling, and pruning, but not in the design of cabling or bracing systems [19]. Consolidation design therefore continues to rely largely on visual estimation and operator experience, with limited verification against the actual structural load acting on individual branches.
Handheld mobile laser scanning (HMLS), in which a SLAM-based scanner is carried by an operator walking through the stand, has been tested mainly for forest inventory, with DBH errors of a few centimeters [22,23,24,25], for the comparison of tree structures in urban parks [20], and for the three-dimensional assessment of urban trees [21]. Branch-level reconstruction from point clouds has been developed mostly with terrestrial laser scanning and quantitative structure models (QSM), with good results for large branches and known limitations for small and occluded ones [26,27,28,29,30]. To our knowledge, HMLS data have not yet been used to dimension and draw a cabling or bracing system. The novelty of this study lies in the chain that links the branch geometry measured on the HMLS point cloud, a mechanical index (bending stress and safety factor) computed for each scaffold branch, and the anchor positions, rope trajectories, and system class drawn directly on the three-dimensional point cloud.
This study aims to address this gap by evaluating the applicability of handheld mobile laser scanning (HMLS) and of a branch model based on the QSM concept to the design of canopy consolidation interventions for urban Pinus pinea L. trees without requiring direct access to the upper canopy. The specific objectives are to (i) derive branch-level biometric and static-load data from HMLS point clouds, (ii) identify structurally vulnerable branches using quantitative selection criteria and verify them against the strength of green wood, and (iii) translate this information into spatially accurate consolidation drawings and hardware specifications. The study is conceived as a proof of concept on five trees.
The proposed workflow represents an innovative opportunity to make tree management interventions more sustainable.
2. Materials and Methods
2.1. Study Area
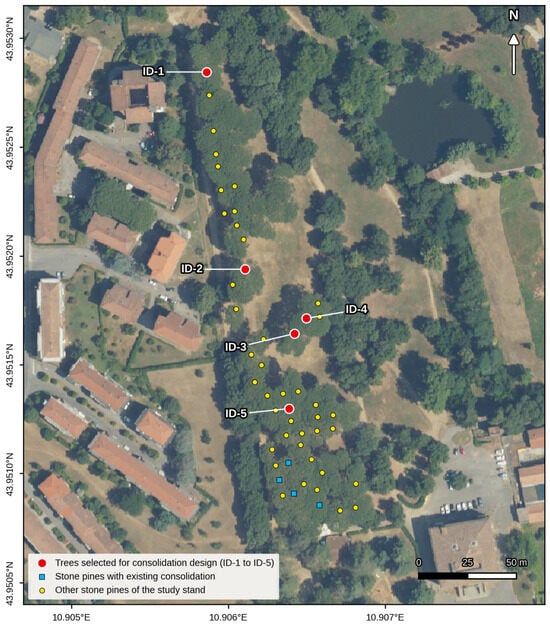
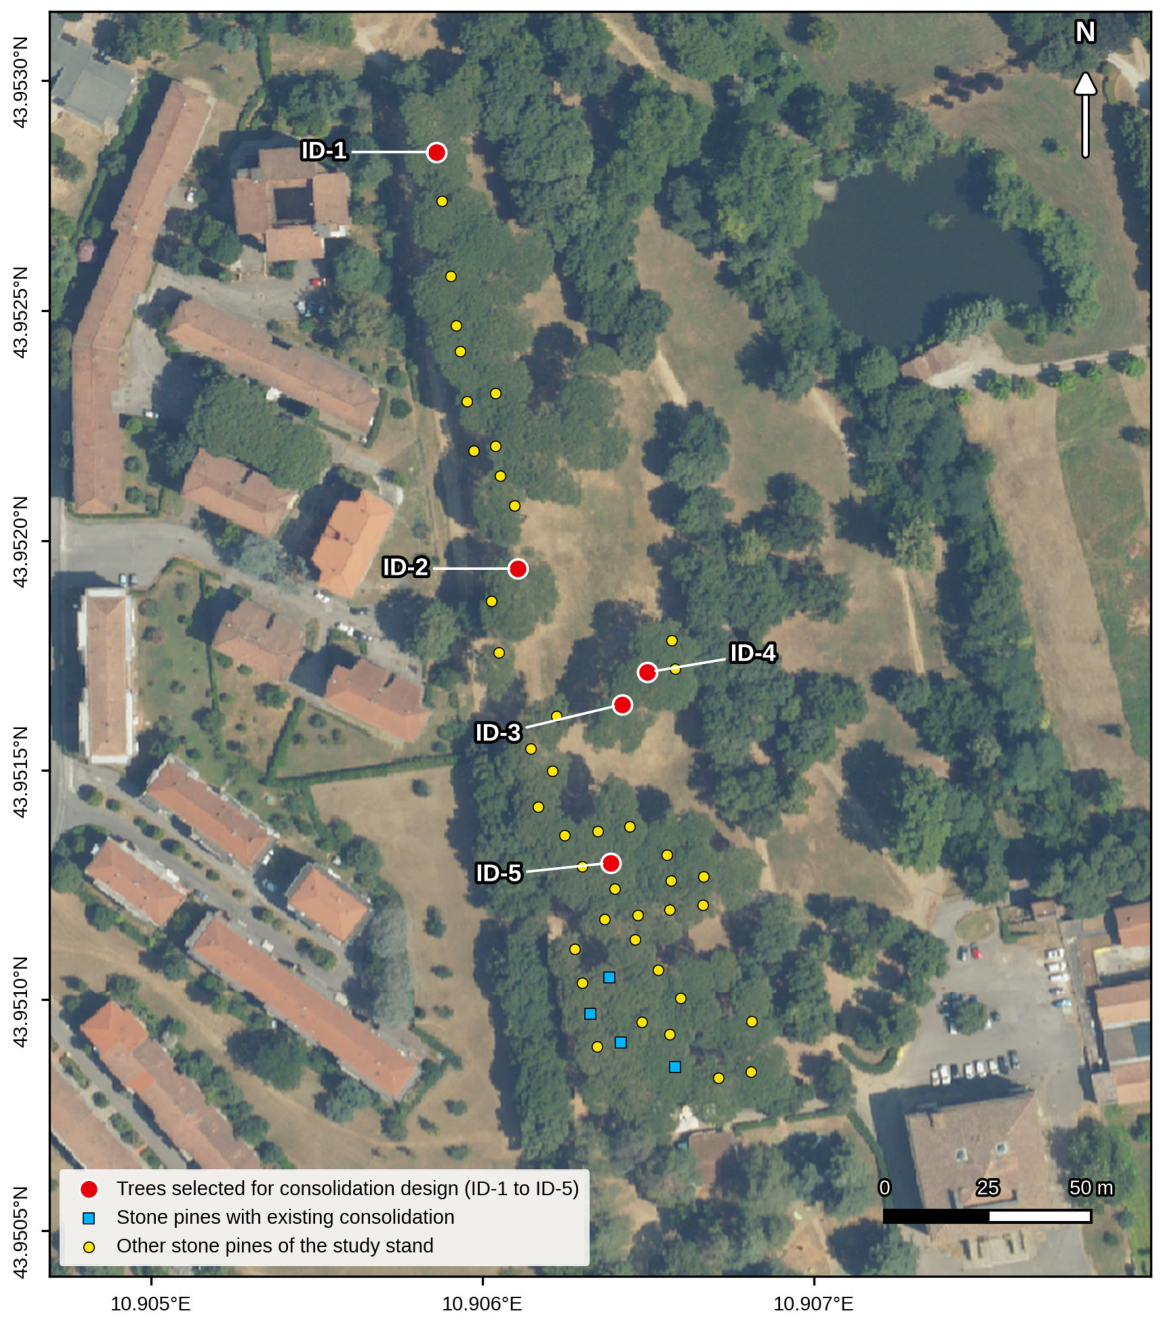
The study focused on “Parco Villone Puccini”, a key urban green space in Pistoia (Tuscany, Italy; centre 43.952° N, 10.906° E). The park was chosen because it hosts a homogeneous, even-aged group of 50 mature stone pines in a public area with high visitor use, where branch failure is relevant for public safety; because the trees grow on compacted soils typical of urban sites; because the flat and accessible site allowed a complete HMLS survey of the stand in a single closed-loop walk; and because it was part of the urban green management activity carried out for the Municipality of Pistoia so that VTA data were available. The park preserves remains of the ancient Puccini garden, whose design began in 1782 under Maddalena Brunozzi’s direction and was completed in 1852 by Niccolò Puccini, in the style of English landscape garden. The park hosts botanical diversity, including prominent specimens of Pinus pinea well adapted to local environmental conditions, and several Quercus species (Q. ilex, Q. robur, and Q. pubescens) contribute to creating a favorable habitat for local fauna. Additionally, specimens of Cedrus libani have been introduced as exotic elements further enriching the park’s landscape [31,32]. The site is characterized by dense vegetative cover composed of approximately 50 coetaneous individuals of stone pine at advanced phenological age (50 years), five of which were selected as study subjects (Section 2.4; Figure 1).
Figure 1.
Parco Villone Puccini (Pistoia, Italy): orthophoto of the study area showing the five Pinus pinea trees selected for consolidation design (ID-1 to ID-5, red circles), the stone pines with existing consolidation systems (blue squares), and the other stone pines of the 50-tree study stand (yellow circles). Coordinate reference system WGS 84/Pseudo-Mercator (EPSG:3857); graticule in WGS 84 degrees (Orthophoto 2025 © AGEA/Regione Toscana).
The area has a mean annual temperature of 15.3 °C and a mean annual precipitation of approximately 1200 mm. Winters are typically mild (mean January temperature around 6 °C) but can include occasional sharp cold spells, with an absolute minimum temperature of −13.0 °C; summers are hot and humid, with rainfall concentrated in thunderstorm events and an absolute maximum temperature of +42.4 °C [33].
The study area covers over 0.7 hectares featuring completely flat morphology and accessible with dirt paths facilitating user interaction with surrounding environments promoting observation and study of existing vegetation.
P. pinea is a predominant species in urban green landscapes of Central Italy’s hilly areas, known for its rapid growth and umbrella-shaped, expanded canopy [34]. Its current prevalence in urban tree populations reflects historical planting choices made in the early decades of the 20th century, when specimens were often introduced into suboptimal environments. These conditions have caused persistent rooting issues due to compacted soils and limited space for root development [35]. Inadequate management practices over the years—including the cutting of taproots during nursery production for easier transport, the removal of lateral roots interfering with road surfaces, and aggressive pruning that removes both live and dead material while opening up the canopy—have further compromised plant stability, contributing to total or partial structural failures. Canopy consolidation interventions aim to reduce the probability and consequences of such failures [36]. It should be noted that canopy consolidation reduces the consequences of branch or co-dominant stem failure; it does not mitigate root-plate or trunk failure, which require separate assessment (e.g., pulling tests) and different measures.
2.2. Field Survey Using HMLS
LiDAR data were collected in May 2022 with the support of the D.R.E.Am. Italia cooperative, using the handheld mobile laser scanning (HMLS) approach. The instrument was a SLAM-based handheld laser scanner, the GeoSLAM ZEB Horizon (GeoSLAM Ltd., Nottingham, UK) [37], which weighs 3.5 kg and acquires up to 300,000 points per second with a maximum range of 100 m. Before each acquisition, the scanner was kept still for 10 s to initialise the inertial measurement unit (IMU); the operator then walked through the stand while the rotating head acquired the point cloud, and the trajectory was reconstructed with simultaneous localisation and mapping (SLAM) [22]. The survey followed a closed-loop serpentine path with start and end points coinciding on the central axis of the study area. Three ground control points, placed in open positions within the study area and identifiable in the point cloud, were surveyed with a Trimble R12i multi-constellation GNSS receiver (GPS, GLONASS, Galileo, BeiDou) [38] and used to georeference the point cloud; the stem positions of all trees were then derived from the georeferenced cloud. The positioning mode, observation time, and precision of the control points were not recorded; the nominal accuracy of the receiver is 8 mm + 1 ppm (horizontal) and 15 mm + 1 ppm (vertical) RMS in RTK mode [38]. Since all biometric and branch variables were measured as distances within the point cloud of each tree, they do not depend on the absolute georeferencing. Coordinates are referred to WGS 84/Pseudo-Mercator (EPSG:3857).
2.3. Extrapolation of Biometric Data
Point cloud processing followed a structured workflow in LiDAR360 software (version 5.6) to extract dendrometric parameters [23]. Specifically, tools such as “remove outliers” (for statistical noise removal), “Filter Ground Points” (for extracting ground points from the HMLS point cloud data), and “Normalize by Ground Points” (for removing topographic relief effects on elevation values in the point cloud data) yield a noise-free LiDAR point cloud suitable for dendrometric data extraction [24,39]. Individual trees were then segmented with the comparative shortest-path (CSP) algorithm of Tao et al. [40], as implemented in LiDAR360 v3.6, using the default parameters of the software (input classes: all; clustering threshold: 0.2 m; minimum cluster size: 500 points; height above ground points: 0.3 m; minimum tree height: 2 m; trunk height: 1.6 m); the segmented trees were checked visually and no manual correction was needed. From the segmented point clouds, tree height (H), diameter at breast height (DBH), crown base height (CBH), crown diameter, crown projection area, and crown volume were derived for each tree. DBH and total height of the five selected trees were also measured in the field on 18 April 2022, with a caliper and a Vertex hypsometer to assess the accuracy of the HMLS-derived values (Section 3.3).
2.4. Selection Criteria for Vulnerable Specimens
The selection was carried out in two steps. In the first step (50 → 20), all 50 stone pines of the study stand were assessed in the field with Visual Tree Assessment (VTA) [41,42] following the stability-assessment protocol of the Italian Society of Arboriculture (S.I.A.), which assigns each tree to a failure-propensity class (A, B, C, C/D, D) [43]. The 20 trees retained were those assigned to class C or C/D because of mechanical symptoms in the crown: included bark at scaffold unions, crown asymmetry, high slenderness, and cracks; no sharp bends, decay, or cavities were recorded. These symptoms are among those listed for the crown in the European tree assessment standard [44], which was published after the survey and is cited here only for comparison. In the second step (20 → 5), trees with existing consolidation systems were excluded, and the five trees were chosen among the remaining ones as those that combined the most marked crown defects in the VTA with the best visibility of scaffold limbs, unions, and candidate anchor points in the HMLS point cloud so that branch geometry could be measured reliably and the consolidation system drawn accurately. The second step is therefore a selection of cases suitable for demonstrating the design workflow rather than a further ranking of failure risk.
2.5. Analysis of Canopy Stability and Consolidation Project Development
For each of the five trees, the scaffold (first order) branches were isolated manually in LiDAR360 with the interactive selection tools, selecting the points of each branch piece by piece. Each branch was then reconstructed following the concept of quantitative structure models (QSM), which describe the woody structure of a tree as a hierarchical collection of geometric primitives [26,27,28,29]: the operator identified nodes along the branch axis (insertion, forks and changes of direction), measured the branch diameter at each node on a thin cross-section of the point cloud and the axis length between consecutive nodes, and modelled each interval as a truncated cone (37 segments for 16 branch elements, 1–7 segments per element). All branches were divided into successive segments, except branch 1 of ID-5, along which no intermediate node could be identified and which was modelled as a single continuous frustum (15.69 m); since its diameter barely decreases (0.470 to 0.458 m), this probably overestimates its volume and stress. Second-order branches were measured when the consolidation systems are anchored on them. The segment table is provided as Supplementary Material (Table S1).
Vulnerable branches were identified using three geometric criteria: (1) branch length ≥ 3.5 m, adopted as an operational threshold since no species-specific critical branch length is reported in the literature; (2) structural inclination θ ≥ 30° from the vertical axis; and (3) branch volume greater than 0.38 m3. Since no inclination threshold for self-weight loading is established in the arboricultural literature, and the branch attachment angle has been shown to be a poor predictor of attachment strength compared with the branch-to-stem diameter ratio [45,46], the inclination threshold was defined mechanically: for θ ≥ 30°, sinθ ≥ 0.5, i.e., at least half of the branch self-weight acts as a bending load rather than as axial compression (see Equation (1)). The simultaneous occurrence of high inclination and large volume was considered indicative of elevated mechanical stress, consistent with biomechanical principles governing branch architecture in P. pinea [47,48]. The computed bending stress was not used as a selection threshold but as a ranking and verification index. For each branch, the bending stress σj at section j was computed with classical cantilever-beam theory [49], as applied to tapered woody axes [48,50,51], as the bending moment generated by the self-weight of all distal segments divided by the section modulus of the solid circular cross-section:
where ρ is the density of fresh P. pinea wood (750 kg/m3), g is gravitational acceleration (9.81 m/s2), θ is the structural inclination of the branch measured from the vertical (Table 1), Vi is the volume of segment i (m3), ci is the position of its centroid along the branch axis (taken at mid-length), sj is the position of section j along the axis, rj is the radius at section j (m), and the sum extends to all segments distal to section j (i ≥ j). Distances are measured along the branch axis so that (ci − sj)·sin θ is the horizontal lever arm of segment i: the inclination is applied only once, and a branch closer to the vertical carries part of its weight as axial compression rather than as bending. The term (π/4)·rj3 is the section modulus of a solid circular cross-section [49]. When a second-order branch inserts on its parent at a distance sins from the base, its weight multiplied by its lever arm (sins + L/2 − sj)·sin θ is added to the moment of the parent sections proximal to the insertion. Because of taper, the maximum stress is not always at the basal section, so σmax was taken as the maximum of σj along the branch. A single structural inclination was assigned to each branch; for branch 2 of ID-1 (θ = 88°), this angle reflects the orientation of the distal, heavily loaded portion of the branch, and applying it to the whole branch is a safe-side simplification that overestimates the basal bending moment.
Table 1.
Geometry, self-weight and mechanical verification of the modelled branches: branch length (L), volume (V), basal diameter (D), structural inclination from the vertical (θ), self-weight (P), maximum bending stress under self-weight (σmax; segment of occurrence in brackets) and safety factor (SF = fc,green/σmax, with fc,green = 20.1 MPa) under self-weight and under self-weight plus a 27 m/s wind.
To assess whether the computed stresses are mechanically relevant, σmax was compared with the compressive strength of green P. pinea wood: in tree statics, the outer-fibre bending stress is compared with the compressive strength of green wood because failure of a bent green-wood member starts on the compression side [48,52]. The strength of P. pinea wood at 12% moisture content is 41 MPa in compression and 83 MPa in bending [53]; applying the green-to-dry ratios of pines (0.49 and 0.57, respectively), Ref. [54] gives fc,green ≈ 20.1 MPa and MORgreen ≈ 47.3 MPa. For each branch, the safety factor SF = fc,green/σmax was computed, and SF < 1.5 was taken as critical [49].
Consolidation drawings were produced from the LIDAR point cloud using Vector Edit plugin in LiDAR360, overlaying anchor point position and rope trajectories on the three-dimensional model of each tree. This approach grounds the consolidation design in measured spatial data rather than visual estimation alone.
2.6. Wind Load Case, Sensitivity Analysis, and Accuracy Assessment
A quasi-static wind load case was added to the self-weight case. The wind force on each branch was F = ½·ρair·v2·cw·A, with ρair = 1.25 kg/m3 and cw = 0.25, within the range of 0.2–1 reported for tree crowns, where the drag coefficient decreases with increasing wind speed because of crown streamlining [55,56]; A is the share of the frontal crown area (π/4 × crown diameter × crown depth) attributed to the branch in proportion to its wood volume. F was applied at 2/3 of the branch length, the usual load centre of a scaffold branch [57], perpendicular to the vertical plane of the branch (most unfavourable direction), so that wind and self-weight moments act in orthogonal planes; they were combined vectorially at the basal section. Three wind speeds were tested: 15 m/s, associated with urban tree failures [9]; 20 m/s; and 27 m/s, the basic reference wind speed of the Italian building code for Tuscany (zone 3) [58]. Snow loading was not considered, since snowfalls are rare at the site (mean January temperature about 6 °C) [33]. Because σ is proportional to r−3, the sensitivity of the results to diameter errors was assessed by recomputing σmax with diameters decreased and increased by 2.32 cm, the DBH RMSE reported for the same scanner [25]. Finally, HMLS-derived DBH and total height of the five trees were compared with the field measurements (Section 2.3) by computing bias and root mean square error (RMSE). All calculations are provided as Supplementary Material (Tables S1–S4).
3. Results
3.1. Biometric Data and Analysis of Vulnerable Branches
The five trees show a relatively uniform height, ranging from 18.34 m (ID-5) to 19.17 m (ID-4), consistent with a coetaneous stand of mature P. pinea approximately 50 years old. DBH ranges from 0.48 m (ID-1) to 0.62 m (ID-5), suggesting generally vigorous trunk development; ID-1 presents the smallest basal section relative to its height, a condition associated with a higher slenderness ratio (expressed as the height-to-DBH ratio, H/DBH) and potentially reduced mechanical resistance. CBH varies between 10.88 m (ID-2) and 13.06 m (ID-5), indicating that in all specimens, the canopy is inserted in the upper portion of the trunk, a typical architectural trait of mature P. pinea with elevated and expanded crowns. Crown diameter varies considerably among individuals, from 9.74 m (ID-1) to 15.01 m (ID-3), directly influencing crown projection area, which ranges from 74.49 m2 (ID-1) to 177.03 m2 (ID-3). Crown volume shows the greatest relative variability, spanning from 379.23 m3 (ID-1) to 1179.32 m3 (ID-3), a ratio of approximately 3:1 among specimens of comparable height. This variability in crown dimensions reflects differences in lateral branch development and canopy asymmetry, which directly determines the static loads acting on primary branches, as detailed in Table 1. Notably, ID-1, despite having the smallest crown, presents the narrowest DBH, making it the specimen with the least favorable balance between canopy load and basal structural capacity.
Each tree has two or three scaffold (first-order) branches, 13 in total (Table 2); 12 of them met all three geometric criteria, while the 13th (ID-4/3) did not meet the volume criterion but was included in the system as an anchor point. Three second-order branches (ID-2/2.1, ID-3/2.1 and ID-5/2.1) were also modelled because the systems are anchored on them.
Table 2.
HMLS-derived biometric data of the five Pinus pinea trees selected for consolidation design: total height (H), diameter at breast height (DBH), crown base height (CBH), crown diameter, crown projection area, crown volume and number of first-order (scaffold) branches.
Among the 12 vulnerable first-order branches, length ranges from 3.89 m (ID-2/1 and ID-3/3) to 15.69 m (ID-5/1), and three branches exceed 9 m (ID-1/1, ID-4/2 and ID-5/1) (Table 2). Volume ranges from 0.43 m3 (ID-2/2 and ID-3/3) to 2.65 m3 (ID-5/1), by far the most massive element, followed by ID-4/1, ID-1/2, and ID-1/1 (0.90, 0.89 and 0.86 m3). Structural inclination ranges from 38° (ID-2/1) to 88° (ID-1/2), and all branches exceed the 30° threshold.
Under self-weight, σmax ranges from 0.54 MPa (ID-2/1) to 13.94 MPa (ID-5/1) (Table 1 and Table S2). ID-5/1 is the most stressed branch because of its length (15.69 m), volume (2.65 m3), and inclination (68°); it uses about 70% of the green-wood compressive strength, and its safety factor (1.44) is below the usual minimum of 1.5. ID-4/2 (6.63 MPa, SF = 3.03) and ID-3/2 (5.50 MPa, SF = 3.65) follow; the high stress of ID-4/2 is due to its small basal diameter (0.265 m) rather than to its volume. All other first-order branches have SF > 4. Under the 27 m/s wind case, the safety factor at the basal section falls to 1.40 for ID-5/1 and to 1.69 for ID-4/2, while all other first-order branches keep SF ≥ 2.9 (Table S2). Because of taper, the maximum stress of ID-1/1, ID-1/2, and ID-5/2 occurs in an intermediate segment rather than at the base.
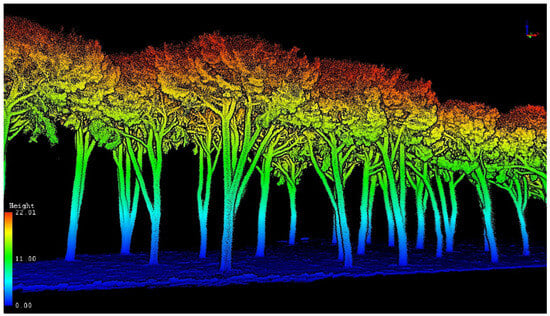
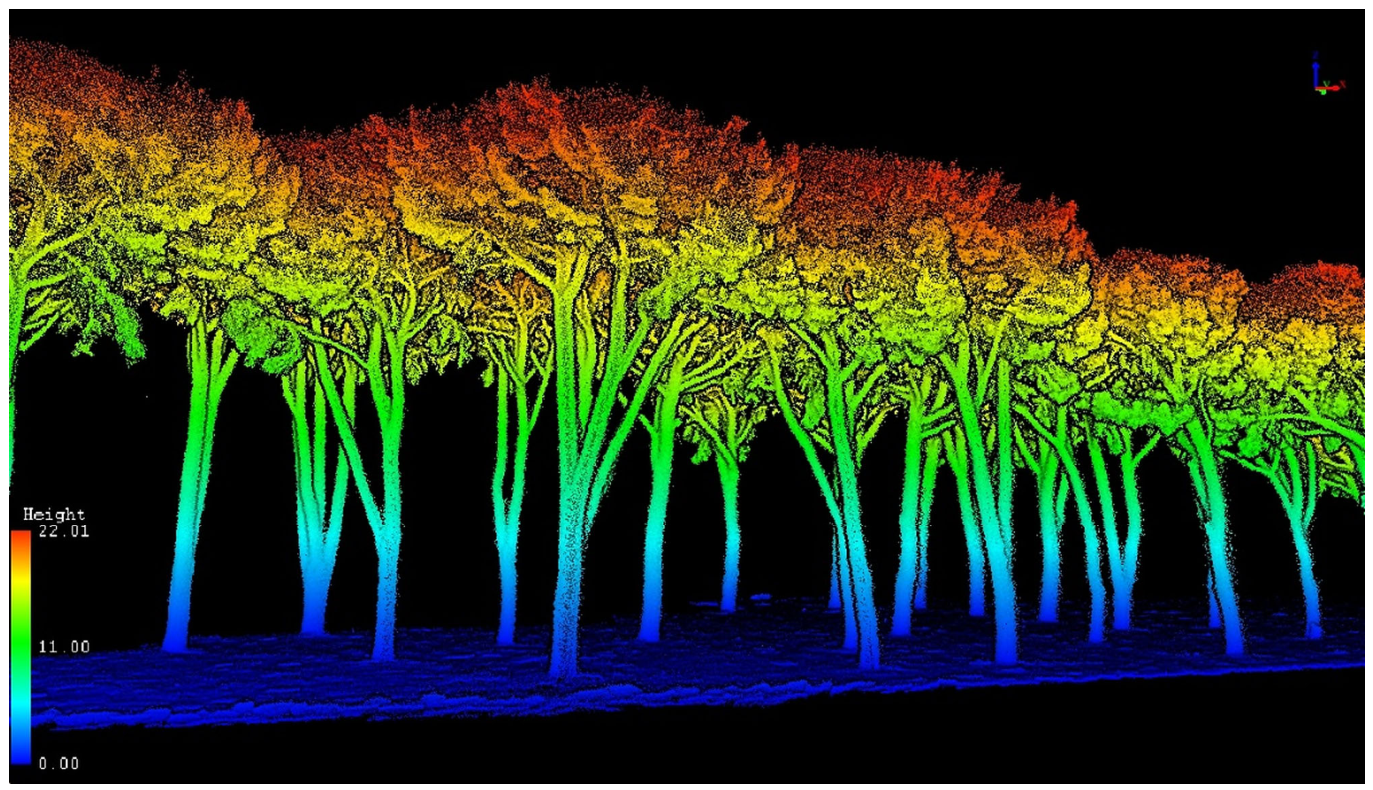
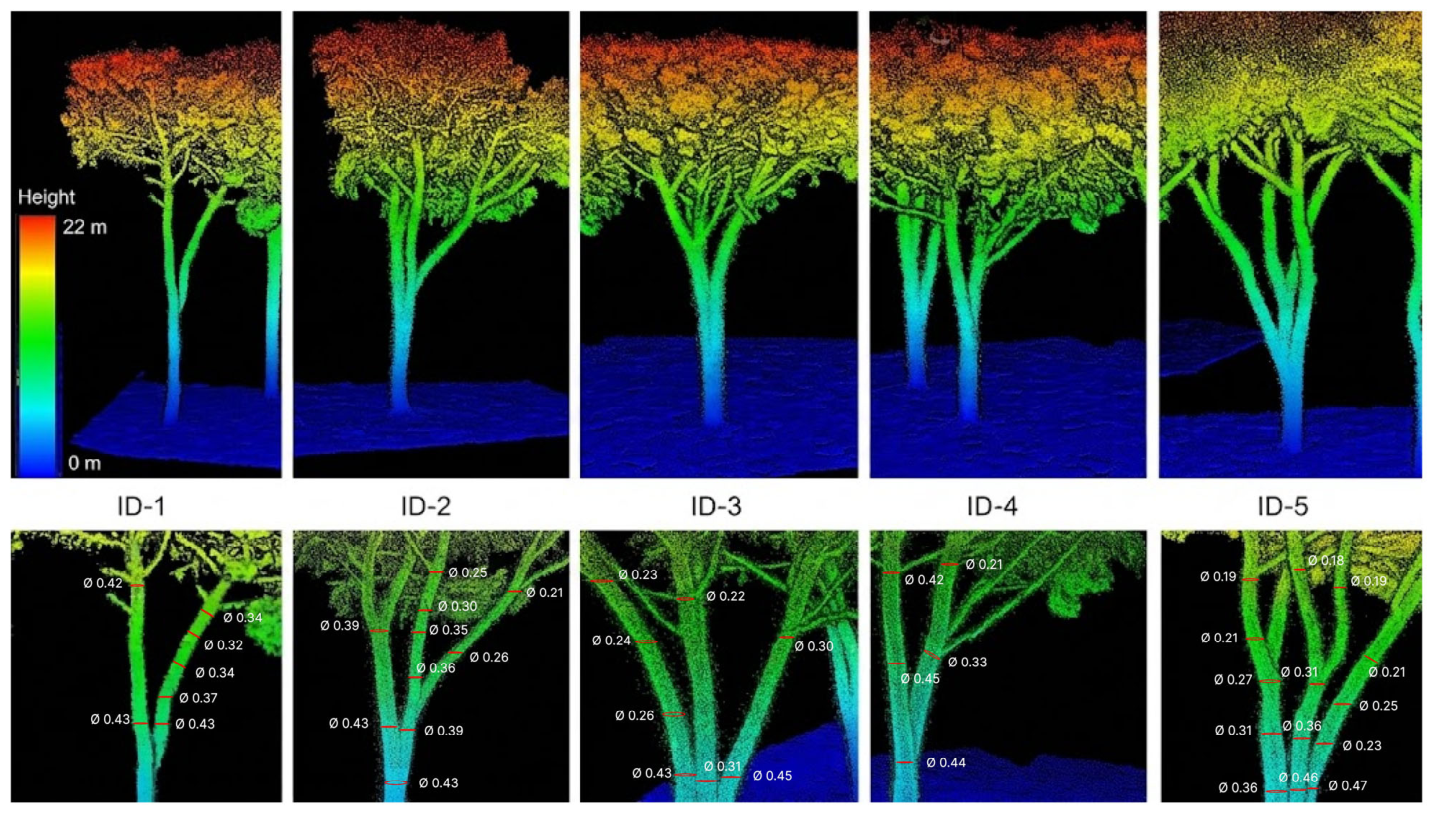
The distribution of branches within the canopy strongly influences the distribution of static load, regardless of the external forces acting on the tree; a balanced branch arrangement distributes mechanical stresses and helps the tree maintain its structural integrity [48]. Figure 2 shows a LiDAR rendering of the study area, and Figure 3 shows the five trees with detailed views of the measured branches.
Figure 2.
LiDAR mapping of the study area.
Figure 3.
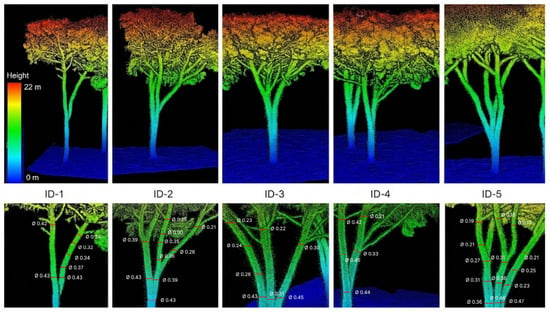
HMLS point clouds of the five trees (top; colour by height, 0–22 m) and detail views of the measured branches (bottom). Labels in the detail views give the node number and the diameter (m) measured at each node; node numbers correspond to the segment table in the Supplementary Material (Table S1), where each node is assigned to its branch (e.g., ID-4/2 runs through nodes 7–8–9).
3.2. Structural Consolidation Project
The aim of the consolidation interventions is to improve the structural integrity of the five P. pinea specimens, reduce the risk of branch failure, and prolong their functional lifespan while preserving their health, ecological role, and aesthetic value within the urban landscape. The choice of consolidation method followed a hierarchical decision-making process consistent with current arboricultural best practice (European Tree Cabling/Bracing Standard EAS 02:2022 [12]): pruning or crown reduction was excluded where it would compromise the structural integrity or visual form of the canopy, and consolidation was adopted as the preferred preventive intervention.
Dynamic consolidation was selected for all specimens in preference to static (rigid) systems, in accordance with the biomechanical principle that trees under wind loading undergo oscillatory movements that must not be completely suppressed, as doing so would prevent adaptive growth responses and increase stress concentration at fixed anchor points [47,48]. Dynamic systems allow controlled elastic deformation while absorbing kinetic energy during sudden load events such as branch failure or wind gusts, thereby limiting peak forces transmitted to the anchor points and the stem. The minimum class of each system was derived from the rule based on the basal diameter of the secured branches (ZTV-Baumpflege; dynamic break-protection systems: 40–60 cm → 4 t) [57]: since all secured branches have basal diameters between 26 and 49 cm, and diameters at the anchor points between 0.22 and 0.54 m, 4 t is the minimum class for all five trees, and a 4 t system was adopted for ID-1 to ID-3. An 8 t system was adopted for ID-4 and ID-5 for three reasons: (i) they carry the branches with the lowest safety factors (ID-5/1 and ID-4/2); (ii) in the arrest check of the heaviest secured element, the design force 2·P of ID-5/1 (39.0 kN) equals the breaking load of a 4 t system (39.2 kN, utilisation 99%), whereas with 8 t, the utilisation is 50% (≤33% for the 4 t systems of ID-1 to ID-3); and (iii) the ring of ID-5 is installed at 7.72 m above ground, well below 2/3 of the length of its longest branch, and a higher class is required when a system is installed below 2/3 of the secured length [57]. The dynamic load factor of 2 is the classical amplification for a load applied suddenly to an elastic system [49]; here, it is the sudden arrest of a failed branch by the rope. For ID-5, a central-ring configuration was adopted to distribute loads among the four secured branches, the recommended approach when several co-dominant branches in close proximity require consolidation [36,59].
Table 3 summarises the anchoring systems; the underlying calculations are given in Table S4. Rope lengths correspond to the three-dimensional anchor-to-anchor trajectories measured on the vector drawings produced on the point cloud (Figure 4, Figure 5, Figure 6 and Figure 7), plus a standard operational margin for splicing, loops, and terminal anchoring (4 m for the single link of ID-1, 6 m for the other systems); they range from 6.12 m (ID-1) to 14.21 m (ID-2). For ID-3, the double-triangle configuration connecting the three main branches requires 8.13 m of rope between anchors; for ID-5, the central-ring configuration requires 2.99 m along the four radial arms. In all cases, the anchor was set on the branch closest to the vulnerable element, as this minimises the lever arm and the resulting bending moment at the insertion on the stem [59]. The systems use a hollow-braided, UV-stabilised polypropylene rope (cobra, pbs Baumsicherungsprodukte GmbH, Stuttgart, Germany) [60]; according to the manufacturer, the working elongation at 10%–60% of the breaking load is 2%–9% for the 4 t and 3%–10% for the 8 t system (17% at break), the declared service life is 12 years (4 t) and 8 years (8 t), and the ageing-related strength loss is 2%–3% per year. The systems must be inspected every 1–3 years and replaced at the end of their service life [57]. Canopy consolidation reduces the consequences of branch or co-dominant stem failure; it does not mitigate root-plate or trunk failure.
Table 3.
Anchoring systems designed for the five trees: anchored branches, configuration, system class (minimum class according to the basal-diameter rule of ZTV-Baumpflege in brackets), arrest check of the heaviest secured element (self-weight P, design force 2·P and utilisation of the breaking load), anchor height and diameter of the branches at the anchor points, and rope length.
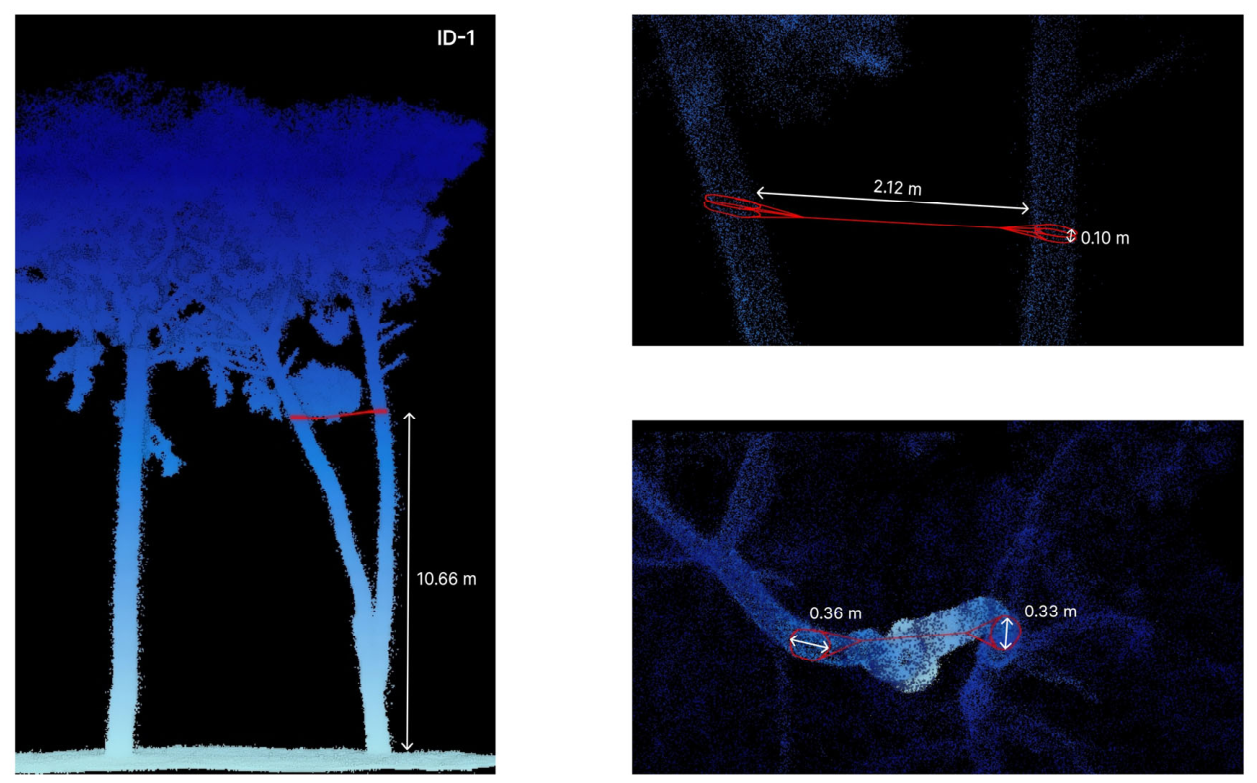
Figure 4.
Consolidation design for tree ID-1: anchor positions and rope trajectories drawn on the HMLS point cloud. Red lines indicate the rope trajectories and red loops the anchor slings around the branches at the anchor points; white arrows indicate the dimensions measured on the point cloud (m): anchor height above ground, anchor-to-anchor distance, and branch diameter at the anchor points.
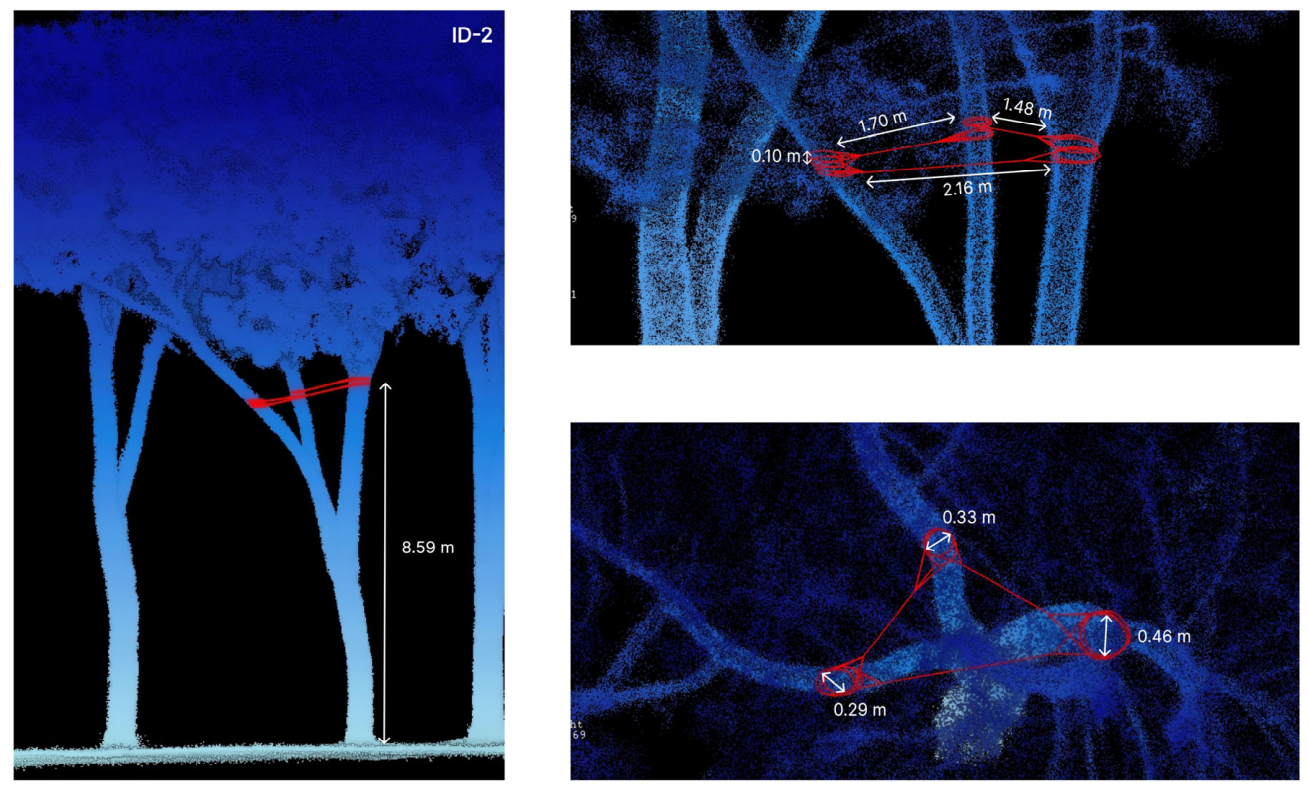
Figure 5.
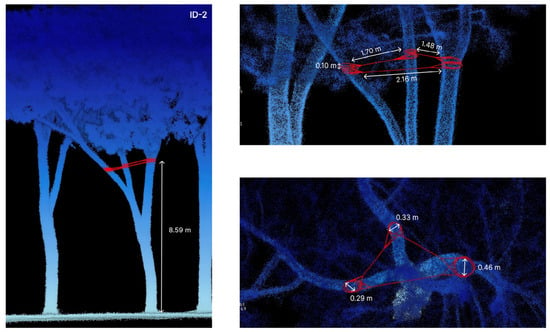
Consolidation design for tree ID-2: anchor positions and rope trajectories drawn on the HMLS point cloud. Red lines indicate the rope trajectories and red loops the anchor slings around the branches at the anchor points; white arrows indicate the dimensions measured on the point cloud (m): anchor height above ground, anchor-to-anchor distance, and branch diameter at the anchor points.
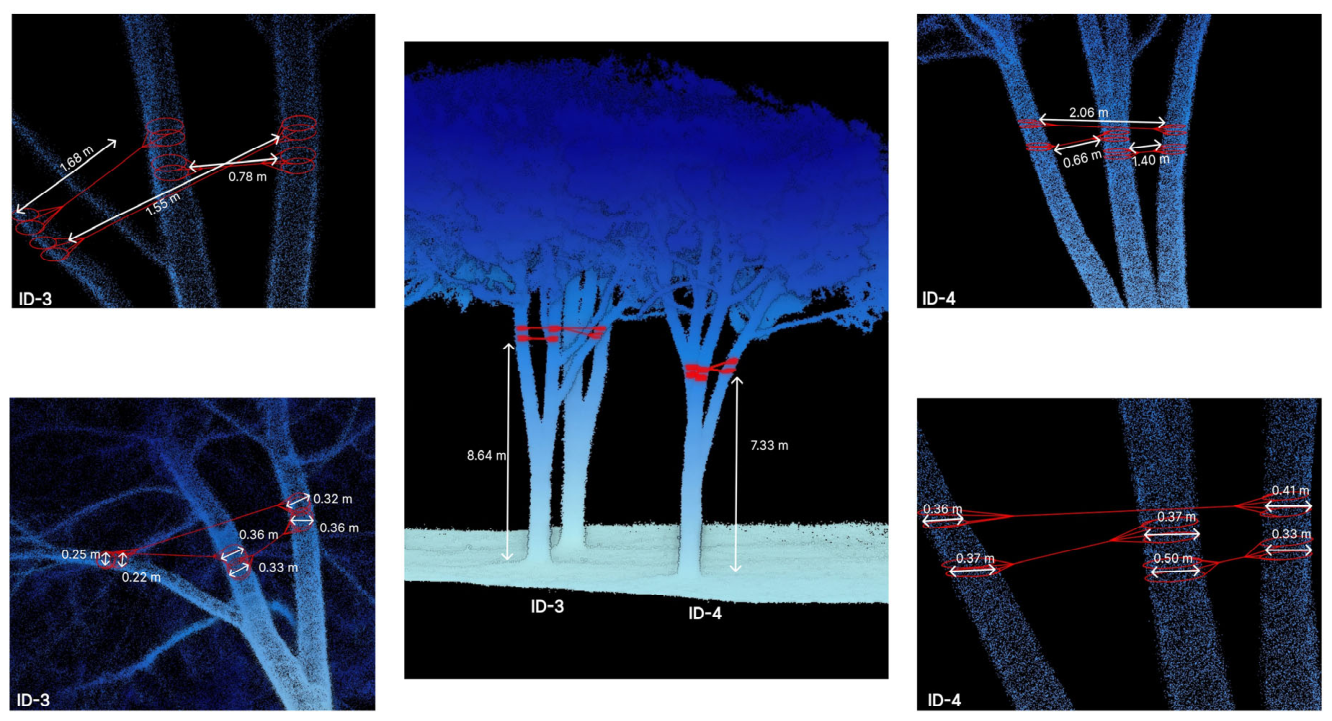
Figure 6.
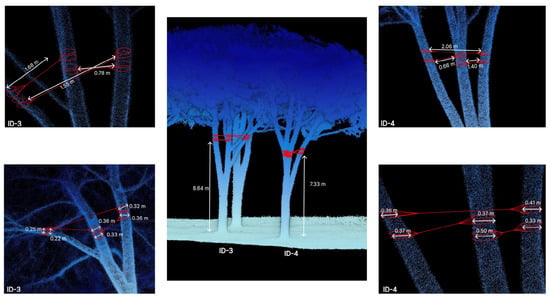
Consolidation design for trees ID-3 and ID-4: anchor positions and rope trajectories drawn on the HMLS point cloud. Red lines indicate the rope trajectories and red loops the anchor slings around the branches at the anchor points; white arrows indicate the dimensions measured on the point cloud (m): anchor height above ground, anchor-to-anchor distance, and branch diameter at the anchor points.
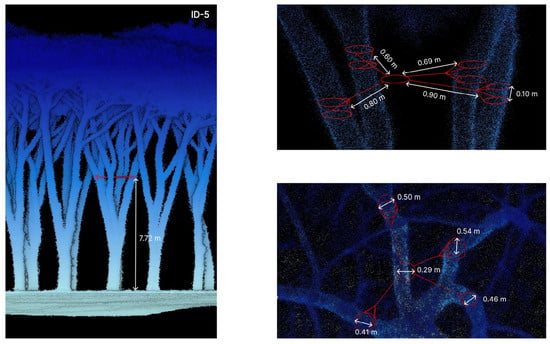
Figure 7.
Consolidation design for tree ID-5: anchor positions and rope trajectories drawn on the HMLS point cloud. Red lines indicate the rope trajectories and red loops the anchor slings around the branches at the anchor points; white arrows indicate the dimensions measured on the point cloud (m): anchor height above ground, anchor-to-anchor distance, and branch diameter at the anchor points.
The consolidation drawings presented in Figure 4, Figure 5, Figure 6 and Figure 7 were produced directly from the LiDAR point cloud using the Vector Edit plugin of LiDAR360, which allowed anchor point positions and rope trajectories to be overlaid on the three-dimensional model of each tree. This approach represents a methodological advance over traditional hand-drawn consolidation plans, as it grounds the design in measured spatial data rather than visual estimation. The drawings allow tree care professionals to identify exact anchor positions, verify spatial clearances between rope paths and surrounding branches, and estimate installation geometry before any climbing operation is undertaken, thereby reducing operational uncertainty and improving safety for arborists working at height.
3.3. Accuracy of HMLS-Derived Variables and Sensitivity of the Mechanical Results
HMLS-derived total height agreed well with the field measurements (n = 5; bias +0.09 m, RMSE 0.55 m, i.e., 3.0%; Table 4); field heights were recorded to the nearest metre. DBH showed a larger discrepancy (bias −0.7 cm, RMSE 10.0 cm, i.e., 17%), dominated by ID-3 (difference 18 cm), whose trunk forks into three scaffold limbs just above breast height, so that the field calliper reading included the swelling of the fork union, whereas the HMLS estimate was fitted on the stem cross-section; without ID-3, the DBH RMSE was 6.5 cm (12%). These errors are larger than those published for the same scanner (RMSE 2.32 cm) [25], partly because of the field reference itself (a single calliper reading on non-circular stems, recorded to the nearest centimetre). In the sensitivity analysis, a diameter error of ±2.32 cm changed σmax by +16% to +32% (underestimated diameter) or −13% to −23% (overestimated diameter), with the largest changes in the thinnest branches; in the unfavourable case, the safety factor of ID-5/1 fell from 1.44 to 1.24, and that of ID-4/2 from 3.03 to 2.30, while the ranking of the most critical branches did not change if all diameters were affected by an error of the same sign (Table S3).
Table 4.
Comparison between HMLS-derived and field-measured DBH (calliper) and total height (Vertex hypsometer) of the five trees; field survey of 18 April, 2022.
4. Discussion
The biometric data of P. pinea trees, as summarized in the study, provide critical insights into the structural characteristics and potential vulnerabilities of these trees. The height (H), diameter at breast height (DBH), crown projection area, and crown volume were derived from the HMLS point cloud, and their accuracy was checked against field measurements (Section 3.3). These measurements align with previous studies on P. pinea, which emphasize the importance of biometric parameters for understanding tree growth and biomass distribution. However, branch inclination angles (up to 88°) and static loads suggest potential mechanical stress points that could lead to failures under external forces such as wind. This supports biomechanical studies highlighting the role of branch architecture in tree stability. The transience of tree form can be expressed in terms of dimensional growth and structural development. Both respond to the principle of modularity in response to environmental contingencies, adhering to common requirements underlying tree organization such as self-similarity, redundancy, substitutability, and resilience [61]. This aligns with biomechanical approaches that advocate for balanced branch structures to maintain tree integrity [62,63].
Among the biometric parameters derived from the HMLS survey, the slenderness ratio (H/DBH) reveals an apparent paradox: ID-1 presents the highest value (39.6), which would traditionally suggest the greatest susceptibility to wind loading, yet its maximum branch stress (4.25 MPa, ID-1/2) is well below that of ID-5/1 (13.94 MPa), ID-4/2 (6.63 MPa) and ID-3/2 (5.50 MPa), although ID-3, ID-4, and ID-5 have lower slenderness ratios. This seeming contradiction is resolved by the branch analysis, which shows that ID-1’s vulnerable branches are comparatively short (maximum 9.60 m), limiting static load accumulation despite the elevated trunk slenderness. This finding illustrates a key advantage of the HMLS-based approach: slenderness alone, as assessable by ground-level VTA, is insufficient to characterize structural risk at the branch level; canopy geometry data are essential for a complete mechanical evaluation.
The distribution of branches within the canopy significantly influences static load distribution (e.g., ID-3 with 177.03 m2 of crown area and 1179.32 m3 of crown volume), as uneven branch arrangements can exacerbate mechanical stress. Some branches (e.g., ID-5, branch 1, with a length of 15.69 m and a volume of 2.65 m3) carry significant static loads, increasing their risk of failure. Branches with high static stresses (e.g., ID-5-1 with 13.94 MPa) underline the importance of redistributing weight effectively to prevent failure. Although the heights of trees vary between 18.34 m and 19.17 m, the volumes of the crowns vary considerably, suggesting uneven weight distributions that affect static stresses.
A particularly notable structural anomaly emerges from the comparison of branch geometry with canopy dimensions. In ID-5, the longest vulnerable branch (15.69 m) exceeds the mean crown radius (5.98 m) by a factor of 2.62 (“L_branch/R_crown”), indicating extreme canopy asymmetry in which a single branch projects well beyond the envelope of the crown. By contrast, ID-3, the specimen with the largest crown volume (1179.32 m3), has a maximum branch length to crown radius ratio of only 0.88 (6.59 m vs. 7.51 m), reflecting a well-balanced radial distribution of branch mass. This distinction is reflected in the bending moments acting on the branch bases: the largest moment in ID-5 (141.7 kN·m, ID-5/1) is almost nine times the largest in ID-3 (16.0 kN·m, ID-3/2), although ID-3 has the largest crown volume. These data provide the quantitative rationale for the differentiated consolidation approach: for ID-3, where load is distributed across a balanced canopy structure, a medium-strength system (4 t) is sufficient; for ID-5, the concentration of load on a single, very long branch requires a high-strength central-ring configuration (8 t).
This type of analysis suggests that understanding branch distribution within the canopy is important for designing consolidation interventions. Biometric data provide an essential foundation for targeted intervention designs, helping prevent structural failure while preserving tree health [64].
Tree size and architecture significantly affect tree mechanical stability under dynamic loading. While tree growth is primarily influenced by physiological factors like photosynthesis and water transport, biomechanical constraints also limit tree size and shape [65,66]. Simplified tree models often fail to account for the dynamic interactions of branches and are only approximate for species with multiple main stems and large branches. In particular, branches should be considered as dynamic, coupled cantilevers rather than lumped masses [67]. The detailed drawings (Figure 4, Figure 5, Figure 6 and Figure 7) facilitate the understanding and implementation of the consolidation measures by tree care professionals.
An additional structural parameter that informs the risk profile of each specimen is the ratio of CBH to total tree height (CBH/H), which expresses the proportion of the trunk exposed to direct wind action below the canopy. In the five specimens, this ratio ranges from 57.4% (ID-2) to 71.2% (ID-5). ID-5 presents both the highest CBH/H ratio and the most asymmetric canopy, combining maximal trunk exposure with maximal branch eccentricity, a configuration that amplifies bending moment at the stem under wind loading. This dual condition further justifies the selection of the highest-strength consolidation system for this individual. Anchoring vulnerable branches at strategic points reduce the risk of breakage, even under sudden load increases [68].
As trees grow, increased biomass leads to greater self-loading, and higher wind speeds at the top cause larger bending moments at the base. The dynamic consolidation systems selected appear suitable for the analyzed trees but may require periodic monitoring to assess rope wear and tree growth [69].
The results illustrate how LiDAR-based analytic techniques could support the design of consolidation interventions. This study exemplifies the integration of scientific research and sustainable resource management, highlighting its potential to protect and enhance urban forest ecosystems. The use of advanced technologies like LiDAR ensures accurate data collection and analysis, which is a key point for developing predictive models for tree growth and stability [70]. The study reinforces the importance of understanding tree biomechanics for designing effective management strategies, as highlighted in prior research on stone pine resilience and productivity [71]. The methodologies used can be applied to other urban forestry contexts, where maintaining tree health while minimizing risks is fundamental [72]. This research contributes valuable knowledge to the field of arboriculture by combining detailed biometric analysis with practical consolidation strategies. Additionally, further studies could investigate the long-term effects of consolidation measures on tree health and ecosystem services, providing deeper insights into their sustainability.
It should be noted that the present study is subject to several methodological limitations. The dataset comprises five coetaneous individuals of the same species growing under homogeneous pedoclimatic conditions within a single urban park. While this controlled setting facilitates methodological demonstration, it limits the direct generalizability of the quantitative results (absolute σ values, branch geometry thresholds, consolidation specifications) to other species, age classes, or site types. Nevertheless, the analytical workflow, from HMLS acquisition through branch modelling and selection to LiDAR-derived consolidation drawings, is potentially transferable to be tested on other species and sites and represents the primary contribution of this study to the field of precision arboriculture.
Further limitations concern the validation of the results. The designed systems have not yet been installed, so neither branch loads nor anchor forces have been measured, and the effectiveness of the systems has not been demonstrated. Only DBH and total height could be compared with field measurements; branch length and diameter could not be measured without climbing into the crown, which the method is designed to avoid, and the DBH discrepancy observed (Section 3.3) indicates that diameter, the most influential variable of the stress model, is also the most uncertain. A single structural inclination was assigned to each branch, branch 1 of ID-5 was modelled as a single frustum, the density of the processed point cloud was not computed, and the precision of the GNSS control points was not recorded. The wind case is a quasi-static screening and does not replace a dynamic analysis. For these reasons, the study should be regarded as a proof of concept: it demonstrates the feasibility of producing consolidation designs from HMLS data, but not the accuracy of the derived mechanical parameters. Before installation, the basal diameter of the critical branches should be verified (e.g., by the climber); future work will include the installation of the systems, the measurement of anchor distances, and, where possible, the monitoring of rope forces, as well as automatic branch reconstruction for larger numbers of trees.
5. Conclusions
This article presents a new workflow for the design of canopy consolidation systems, applied to five P. pinea trees in “Parco Villone Puccini”. LiDAR scanner technology plays a significant role in tree consolidation interventions, particularly in analyzing tree structure, health, and assessing the need for consolidation measures. In this study, HMLS was used to derive tree and branch geometry for consolidation design.
The primary objective of this study was to evaluate the applicability of HMLS for designing canopy consolidation interventions without direct access to the upper canopy. The workflow, from the HMLS survey of the stand and the VTA-based selection (50 trees assessed, 20 retained, 5 selected) to the branch models, the computation of bending stress and safety factor and the consolidation drawings on the point cloud, shows that the parameters required for consolidation design (branch length and diameter, anchor positions and rope trajectories) can be obtained remotely and non-invasively. The study demonstrates the feasibility of the approach, but not yet the accuracy of the derived mechanical parameters or the effectiveness of the systems, which have not been installed. The maximum bending stress under self-weight spans a 26-fold range (0.54 to 13.94 MPa) among the 12 vulnerable branches, showing that trees of similar height can differ markedly in their branch-level mechanical condition depending on canopy asymmetry and branch geometry. Crown volume is not a reliable proxy for branch load. In these five trees, crown volume did not predict branch load: ID-3, with the largest crown (1179.32 m3), has a much lower maximum branch moment than ID-5 (675.78 m3), whose asymmetric canopy concentrates load on a single branch with a length-to-crown-radius ratio of 2.62.
Detailed canopy data supports the design of detailed canopy consolidation strategies, allowing proactive management to mitigate such risks while optimizing time and costs in green management. The integration of HMLS into urban forest planning is a step toward more effective and sustainable management of P. pinea, facilitating efficient resource allocation for canopy interventions. The approach could be scaled to larger areas once branch segmentation and reconstruction are automated (here they were manual), making it a valuable resource for future urban forestry programmers. Future research should explore the application of HMLS to different tree species and contexts, such as street trees or residential and courtyard gardens.
Supplementary Materials
The following supporting information can be downloaded at: https://www.mdpi.com/article/10.3390/f17111319/s1, Table S1: Segment geometry of the modelled branches (37 truncated-cone segments) and bending stress at each section; Table S2: Geometry, self-weight, maximum bending stress and safety factors of the modelled branches under self-weight and under self-weight plus wind (15, 20 and 27 m/s); Table S3: Sensitivity of the maximum bending stress to a diameter error of ±2.32 cm; Table S4: Anchoring systems, minimum system class, arrest check and rope lengths.
Author Contributions
Conceptualization, A.S. and S.S.; methodology, S.S. and A.S.; software, S.S.; validation, G.S. and S.S.; formal analysis, S.S.; investigation, A.S. and S.S.; resources, A.S., G.S., and S.S.; data curation, S.S.; writing—original draft preparation, S.S. and A.S.; writing—review and editing, G.S. and S.S.; visualization, A.S. and S.S.; supervision, G.S. and S.S.; project administration, A.S. and S.S. All authors have read and agreed to the published version of the manuscript.
Funding
This work was funded by specific University funds (FFR—Fondo Finalizzato alla Ricerca) PJ_GEST_FFR_2026.
Institutional Review Board Statement
Not applicable.
Informed Consent Statement
Not applicable.
Data Availability Statement
The data supporting the findings of this study are available from the corresponding author upon reasonable request. The LiDAR point cloud data and derived branch models are archived at D.R.E.Am. Italia and may be shared upon request, subject to institutional data sharing agreements. The segment geometry and all calculation sheets are provided as Supplementary Material (Tables S1–S4).
Acknowledgments
The authors wish to thank the Municipality of Pistoia for granting access to “Parco Villone Puccini” and for their support during field operations. The authors also acknowledge D.R.E.Am. Italia S.C. for providing the HMLS equipment and logistical support for the survey campaign.
Conflicts of Interest
A.S. and S.S. are employed by D.R.E.Am. Italia Soc. Coop. Co., Ltd., their employer’s company was not involved in this study, and there is no relevance between this research and their company. The remaining authors declare that the research was conducted in the absence of any commercial or financial relationships that could be construed as a potential conflict of interest. The funders had no role in the design of the study; in the collection, analyses, or interpretation of data; in the writing of the manuscript; or in the decision to publish the results.
References
- Manoli, G.; Fatichi, S.; Schläpfer, M.; Yu, K.; Crowther, T.W.; Meili, N.; Burlando, P.; Katul, G.G.; Bou-Zeid, E. Magnitude of urban heat islands largely explained by climate and population. Nature 2019, 573, 55–60. [Google Scholar] [CrossRef] [Scilit] [PubMed]
- Norton, B.A.; Coutts, A.M.; Livesley, S.J.; Harris, R.J.; Hunter, A.M.; Williams, N.S.G. Planning for cooler cities: A framework to prioritise green infrastructure to mitigate high temperatures in urban landscapes. Landsc. Urban Plan. 2015, 134, 127–138. [Google Scholar] [CrossRef] [Scilit]
- Revi, A.; Satterthwaite, D.E.; Aragón-Durand, F.; Corfee-Morlot, J.; Kiunsi, R.B.R.; Pelling, M.; Roberts, D.C.; Solecki, W. Urban areas. In Climate Change 2014: Impacts, Adaptation, and Vulnerability. Part A: Global and Sectoral Aspects. Contribution of Working Group II to the Fifth Assessment Report of the Intergovernmental Panel on Climate Change; Field, C.B., Barros, V.R., Dokken, D.J., Mach, K.J., Mastrandrea, M.D., Bilir, T.E., Chatterjee, M., Ebi, K.L., Estrada, Y.O., Genova, R.C., et al., Eds.; Cambridge University Press: Cambridge, UK; New York, NY, USA, 2014; pp. 535–612. [Google Scholar] [CrossRef] [Scilit]
- Gill, S.E.; Handley, J.F.; Ennos, A.R.; Pauleit, S. Adapting cities for climate change: The role of the green infrastructure. Built Environ. 2007, 33, 115–133. [Google Scholar] [CrossRef] [Scilit]
- Klein, R.W.; Koeser, A.K.; Hauer, R.J.; Hansen, G.; Escobedo, F.J. Risk assessment and risk perception of trees: A review of literature relating to arboriculture and urban forestry. Arboric. Urban For. 2019, 45, 26–38. [Google Scholar] [CrossRef] [Scilit]
- Pearlmutter, D.; Calfapietra, C.; Samson, R.; O’Brien, L.; Krajter Ostoić, S.; Sanesi, G.; Alonso del Amo, R. (Eds.) The Urban Forest: Cultivating Green Infrastructure for People and the Environment; Future City; Springer: Cham, Switzerland, 2017; Volume 7. [Google Scholar] [CrossRef] [Scilit]
- Bennett, L. Trees and public liability—Who really decides what is reasonably safe? Arboric. J. 2010, 33, 141–164. [Google Scholar] [CrossRef] [Scilit]
- Forbes-Laird, J. Liability for death or injury caused by falling trees or branches: A review of the present position under English law in relation to tree safety inspection. Arboric. J. 2009, 32, 233–241. [Google Scholar] [CrossRef] [Scilit]
- Buson, M.; Bortolini, L. Analysis of tree falls caused by weather events in urban areas: The case study of the city of Venice. Land 2025, 14, 1131. [Google Scholar] [CrossRef] [Scilit]
- De Petris, S.; Sarvia, F.; Borgogno-Mondino, E. RPAS-based photogrammetry to support tree stability assessment: Longing for precision arboriculture. Urban For. Urban Green. 2020, 55, 126862. [Google Scholar] [CrossRef] [Scilit]
- Sani, L. Statica Delle Strutture Arboree per la Valutazione di Stabilità; Gifor: Firenze, Italy, 2017. [Google Scholar]
- EAS 02:2022; European Tree Cabling/Bracing Standard. European Arboricultural Standards. European Arboricultural Standards Working Group (TeST): Braunschweig, Germany, 2022.
- MATTM. Linee Guida per il Governo Sostenibile del Verde Urbano; Comitato per lo Sviluppo del Verde Pubblico: Rome, Italy, 2017. [Google Scholar]
- Dale, V.H.; Joyce, L.A.; McNulty, S.; Neilson, R.P.; Ayres, M.P.; Flannigan, M.D.; Hanson, P.J.; Irland, L.C.; Lugo, A.E.; Peterson, C.J.; et al. Climate change and forest disturbances. BioScience 2001, 51, 723–734. [Google Scholar] [CrossRef] [Scilit]
- Holdenrieder, O.; Pautasso, M.; Weisberg, P.J.; Lonsdale, D. Tree diseases and landscape processes: The challenge of landscape pathology. Trends Ecol. Evol. 2004, 19, 446–452. [Google Scholar] [CrossRef] [Scilit] [PubMed]
- Stewart, M.G.; O’Callaghan, D.; Hartley, M. Review of QTRA and risk-based cost-benefit assessment of tree management. Arboric. Urban For. 2013, 39, 165–172. [Google Scholar] [CrossRef] [Scilit]
- Matasov, V.; Belelli Marchesini, L.; Yaroslavtsev, A.; Sala, G.; Fareeva, O.; Seregin, I.; Castaldi, S.; Vasenev, V.; Valentini, R. IoT Monitoring of Urban Tree Ecosystem Services: Possibilities and Challenges. Forests 2020, 11, 775. [Google Scholar] [CrossRef] [Scilit]
- De Petris, S.; Sarvia, F.; Borgogno-Mondino, E. Arboricoltura di precisione: Un nuovo approccio alla gestione del rischio caduta alberi basato sulla Geomatica. GEOmedia 2021, 25, 4. [Google Scholar]
- Hartley, R.J.L.; Jayathunga, S.; Morgenroth, J.; Pearse, G.D. Tree branch characterisation from point clouds: A comprehensive review. Curr. For. Rep. 2024, 10, 360–385. [Google Scholar] [CrossRef] [Scilit]
- Choi, H.; Song, Y. Comparing tree structures derived among airborne, terrestrial and mobile LiDAR systems in urban parks. GISci. Remote Sens. 2022, 59, 843–860. [Google Scholar] [CrossRef] [Scilit]
- Zhang, B.; Li, X.; Du, H.; Zhou, G.; Mao, F.; Huang, Z.; Zhou, L.; Xuan, J.; Gong, Y.; Chen, C. Estimation of urban forest characteristic parameters using UAV-LiDAR coupled with canopy volume. Remote Sens. 2022, 14, 6375. [Google Scholar] [CrossRef] [Scilit]
- Sofia, S.; Maetzke, F.G.; Crescimanno, M.; Coticchio, A.; La Mela Veca, D.S.; Galati, A. The efficiency of LiDAR HMLS scanning in monitoring forest structure parameters: Implications for sustainable forest management. EuroMed J. Bus. 2022, 17, 350–373. [Google Scholar] [CrossRef] [Scilit]
- Sofia, S.; Sferlazza, S.; Mariottini, A.; Niccolini, M.; Coppi, T.; Miozzo, M.; La Mantia, T.; Maetzke, F. A case study of the application of hand-held mobile laser scanning in the planning of an Italian forest (Alpe di Catenaia, Tuscany). Int. Arch. Photogramm. Remote Sens. Spat. Inf. Sci. 2021, XLIII-B2-2021, 763–770. [Google Scholar] [CrossRef] [Scilit]
- Chen, S.; Liu, H.; Feng, Z.; Shen, C.; Chen, P. Applicability of personal laser scanning in forestry inventory. PLoS ONE 2019, 14, e0211392. [Google Scholar] [CrossRef] [Scilit] [PubMed]
- Gollob, C.; Ritter, T.; Nothdurft, A. Forest inventory with long range and high-speed personal laser scanning (PLS) and simultaneous localization and mapping (SLAM) technology. Remote Sens. 2020, 12, 1509. [Google Scholar] [CrossRef] [Scilit]
- Raumonen, P.; Kaasalainen, M.; Åkerblom, M.; Kaasalainen, S.; Kaartinen, H.; Vastaranta, M.; Holopainen, M.; Disney, M.; Lewis, P. Fast automatic precision tree models from terrestrial laser scanner data. Remote Sens. 2013, 5, 491–520. [Google Scholar] [CrossRef] [Scilit]
- Calders, K.; Newnham, G.; Burt, A.; Murphy, S.; Raumonen, P.; Herold, M.; Culvenor, D.; Avitabile, V.; Disney, M.; Armston, J.; et al. Nondestructive estimates of above-ground biomass using terrestrial laser scanning. Methods Ecol. Evol. 2015, 6, 198–208. [Google Scholar] [CrossRef] [Scilit]
- Raumonen, P.; Casella, E.; Calders, K.; Murphy, S.; Åkerblom, M.; Kaasalainen, M. Massive-scale tree modelling from TLS data. ISPRS Ann. Photogramm. Remote Sens. Spat. Inf. Sci. 2015, II-3/W4, 189–196. [Google Scholar] [CrossRef] [Scilit]
- Ducouret, O.M.; Mofack, G.; Wang, D.; Raumonen, P.; Ploton, P.; Sonké, B.; Barbier, N.; Couteron, P.; Pélissier, R. Evaluation of automated pipelines for tree and plot metric estimation from TLS data in tropical plots. Ann. Bot. 2021, 128, 753–766. [Google Scholar] [CrossRef] [Scilit] [PubMed]
- Lau, A.; Bentley, L.P.; Martius, C.; Shenkin, A.; Bartholomeus, H.; Raumonen, P.; Malhi, Y.; Jackson, T.; Herold, M. Quantifying branch architecture of tropical trees using terrestrial LiDAR and 3D modelling. Trees 2018, 32, 1219–1231. [Google Scholar] [CrossRef] [Scilit]
- Regione Toscana. Giardini di Toscana; Edifir: Florence, Italy, 2001. [Google Scholar]
- Frediani, K. The role of curation in botanic gardens: Platforms for environmental and social transition. Living Lab 2024, 1, 22–72. [Google Scholar] [CrossRef] [Scilit]
- CFR Toscana. Centro Funzionale Regionale—Toscana. Available online: https://www.cfr.toscana.it/ (accessed on 1 January 2024).
- Mutke, S.; Calama, R.; González-Martínez, S.; Montero, G.; Gordo, J.; Bono, D.; Gil, L. Mediterranean stone pine: Botany and horticulture. Hortic. Rev. 2012, 39, 153–202. [Google Scholar] [CrossRef] [Scilit]
- Grossoni, P.; Bruschi, P.; Bussotti, F.; Pollastrini, M.; Selvi, F. Trattato di Botanica Forestale. 2. Angiosperme; Wolters Kluwer: Milan, Italy, 2020; pp. 1–670. [Google Scholar]
- Lobis, V.; Maresi, G. II consolidamento delle chiome degli alberi: Tecniche non invasive. Sherwood 2007, 137, 6–9. [Google Scholar]
- GeoSLAM Ltd. ZEB Horizon™ Handheld Mobile LiDAR Scanner; GeoSLAM Ltd.: Nottingham, UK, 2020; Available online: https://geoslam.com/solutions/zeb-horizon/ (accessed on 1 January 2024).
- Trimble Inc. Trimble R12i GNSS Receiver—Datasheet; Trimble Inc.: Westminster, CO, USA, 2024. [Google Scholar]
- LiDAR360 Development Team. LiDAR360; Green Valley International: Berkeley, CA, USA, 2020; Available online: https://greenvalleyintl.com/software/lidar360/ (accessed on 1 January 2024).
- Tao, S.L.; Wu, F.F.; Guo, Q.H.; Wang, Y.C.; Li, W.K.; Xue, B.L.; Hu, X.Y.; Li, P.; Tian, D.; Li, C.; et al. Segmenting tree crowns from terrestrial and mobile LiDAR data by exploring ecological theories. ISPRS J. Photogramm. Remote Sens. 2015, 110, 66–76. [Google Scholar] [CrossRef] [Scilit]
- Mattheck, C.; Breloer, H. Field guide for Visual Tree Assessment (VTA). Arboric. J. 1994, 18, 1–23. [Google Scholar] [CrossRef] [Scilit]
- Fink, S. Hazard tree identification by Visual Tree Assessment (VTA): Scientifically solid and practically approved. Arboric. J. 2009, 32, 139–155. [Google Scholar] [CrossRef] [Scilit]
- Società Italiana di Arboricoltura (SIA), Gruppo di Lavoro Sulla Stabilità Degli Alberi. Protocollo S.I.A. Sulla Valutazione di Stabilità degli Alberi. Available online: https://isaitalia.org/documentazione/protocollo-sia-stabilita (accessed on 21 October 2026).
- EAS 04:2025; European Tree Condition Assessment Standard. European Arboricultural Standards. ECoST Working Group and European Arboricultural Council: Bad Honnef, Germany, 2025.
- Kane, B.; Farrell, R.; Zedaker, S.M.; Loferski, J.R.; Smith, D.W. Failure mode and prediction of the strength of branch attachments. Arboric. Urban For. 2008, 34, 308–316. [Google Scholar] [CrossRef] [Scilit]
- Rust, S. Trees adjust the shape of branch unions to increase their load-bearing capacity. Forests 2023, 14, 1041. [Google Scholar] [CrossRef] [Scilit]
- Mattheck, C. Design in Nature: Learning from Trees; Springer: Berlin/Heidelberg, Germany, 1998. [Google Scholar] [CrossRef] [Scilit]
- Wessolly, L.; Erb, M. Manual of Tree Statics and Tree Inspection; Patzer Verlag: Berlin, Germany, 2016. [Google Scholar]
- Gere, J.M.; Goodno, B.J. Mechanics of Materials, 9th ed.; Cengage Learning: Boston, MA, USA, 2018. [Google Scholar]
- Niklas, K.J. Plant Biomechanics: An Engineering Approach to Plant Form and Function; University of Chicago Press: Chicago, IL, USA, 1992. [Google Scholar]
- Niklas, K.J.; Spatz, H.-C. Plant Physics; University of Chicago Press: Chicago, IL, USA, 2012. [Google Scholar]
- Spatz, H.-C.; Pfisterer, J. Mechanical properties of green wood and their relevance for tree risk assessment. Arboric. Urban For. 2013, 39, 218–225. [Google Scholar] [CrossRef] [Scilit]
- De Angelis, M.; Humar, M.; Kržišnik, D.; Tamantini, S.; Romagnoli, M. Influence of thermal modification and impregnation with biocides on physical properties of Italian stone pine wood (Pinus pinea L.). Appl. Sci. 2022, 12, 3801. [Google Scholar] [CrossRef] [Scilit]
- Kretschmann, D.E. Mechanical properties of wood. In Wood Handbook—Wood as an Engineering Material; General Technical Report FPL-GTR-190; USDA Forest Service, Forest Products Laboratory: Madison, WI, USA, 2010; Chapter 5. [Google Scholar]
- Mayhead, G.J. Some drag coefficients for British forest trees derived from wind tunnel studies. Agric. Meteorol. 1973, 12, 123–130. [Google Scholar] [CrossRef] [Scilit]
- Rudnicki, M.; Mitchell, S.J.; Novak, M.D. Wind tunnel measurements of crown streamlining and drag relationships for three conifer species. Can. J. For. Res. 2004, 34, 666–676. [Google Scholar] [CrossRef] [Scilit]
- FLL. ZTV-Baumpflege: Zusätzliche Technische Vertragsbedingungen und Richtlinien für Baumpflege, 6th ed.; Forschungsgesellschaft Landschaftsentwicklung Landschaftsbau: Bonn, Germany, 2017. [Google Scholar]
- Ministero Delle Infrastrutture e dei Trasporti. Aggiornamento Delle Norme Tecniche per le Costruzioni (NTC 2018); D.M. 17 gennaio 2018; Gazzetta Ufficiale n. 42; Ministero delle Infrastrutture e dei Trasporti: Roma, Italy, 2018. [Google Scholar]
- Schröder, K. Securing of break-endangered tree crowns. In Proceedings of the International Congress “The Trees of History: Protection and Exploitation of Veteran Trees”, Turin, Italy, 1–2 April 2004; Nicolotti, G., Gonthier, P., Eds.; University of Turin/Regione Piemonte: Turin, Italy, 2004; pp. 76–83. [Google Scholar]
- PBS Baumsicherungsprodukte GmbH. Cobra Crown Securing System—Technical Information; pbs Baumsicherungsprodukte GmbH: Stuttgart, Germany; Available online: https://www.cobranet.de (accessed on 21 October 2026).
- Morelli, G.; Gasperini, S.; Roatti, B. Quando il fusto parla. ACER 2019, 5, 29–34. [Google Scholar]
- Raimbault, P.; Tanguy, M. La gestion des arbres d’ornement. 1ère partie: Une méthode d’analyse et de diagnostic de la partie aérienne. Rev. For. Fr. 1993, 45, 97–117. [Google Scholar] [CrossRef] [Scilit]
- Gordo, J.; Calama, R.; Rojo, L.; Madrigal, G.; Álvarez, D.; Mutke, S.; Montero, G.; Finat, L. Experiencias de clareos en masas de Pinus pinea L. en la meseta Norte. In Proceedings of the V Congreso Forestal Español, Ávila, Spain, 21–25 September 2009; Sociedad Española de Ciencias Forestales: Ávila, Spain, 2009. [Google Scholar]
- Gasperini, S.; Roatti, B.; Morelli, G. Analysis of anatomic structures of trees in relation to uprooting behaviour: The case study of Pinus pinea. In Proceedings of the AFPP–4e Conférence sur l’Entretien des Jardins, Espaces Végétalisés et Infrastructures, Toulouse, France, 19–20 October 2016; pp. 142–149. [Google Scholar]
- Spatz, H.-C.; Bruechert, F. Basic biomechanics of self-supporting plants: Wind loads and gravitational loads on a Norway spruce tree. For. Ecol. Manag. 2000, 135, 33–44. [Google Scholar] [CrossRef] [Scilit]
- James, K.R.; Haritos, N.; Ades, P.K. Mechanical stability of trees under dynamic loads. Am. J. Bot. 2006, 93, 1522–1530. [Google Scholar] [CrossRef] [Scilit] [PubMed]
- Kerzenmacher, T.; Gardiner, B.A. A mathematical model to describe the dynamic response of a spruce tree to the wind. Trees 1998, 12, 385–394. [Google Scholar] [CrossRef] [Scilit]
- Costello, L.R.; Tso, J.; Jones, K.S. Structural failure profile: Italian stone pine (Pinus pinea). West. Arboric. 2015, 4, 44–47. [Google Scholar]
- Piraino, S. Assessing Pinus pinea L. resilience to three consecutive droughts in central-western Italian Peninsula. iForest-Biogeosciences For. 2020, 13, 246–254. [Google Scholar] [CrossRef] [Scilit]
- Garfì, V.; Garfì, G. Differential tree growth response to management history and climate in multi-aged stands of Pinus pinea L. Plants 2023, 13, 61. [Google Scholar] [CrossRef] [Scilit] [PubMed]
- Schneider, R.; Calama, R.; Martin-Ducup, O. Understanding tree-to-tree variations in stone pine (Pinus pinea L.) cone production using terrestrial laser scanner. Remote Sens. 2020, 12, 173. [Google Scholar] [CrossRef] [Scilit]
- Muñoz, V.L.; Balzarini, M.; Rodríguez, C.D.; Contreras, A.Á.; Navarro-Cerrillo, R.M. Growth of stone pine (Pinus pinea L.) European provenances in central Chile. iForest-Biogeosciences For. 2017, 10, 64–69. [Google Scholar] [CrossRef] [Scilit]

Disclaimer/Publisher’s Note: The statements, opinions and data contained in all publications are solely those of the individual author(s) and contributor(s) and not of MDPI and/or the editor(s). MDPI and/or the editor(s) disclaim responsibility for any injury to people or property resulting from any ideas, methods, instructions or products referred to in the content. |
© 2026 by the authors. Licensee MDPI, Basel, Switzerland. This article is an open access article distributed under the terms and conditions of the Creative Commons Attribution (CC BY) license.