


Abstract
Litter fuel moisture governs the ignition and early spread of forest fires, yet its meteorological controls in Korean conifer and broadleaf stands, and the correspondence of existing fire-weather index classes to locally observed moisture, remain poorly characterised. We directly measured litter fuel moisture in paired conifer and broadleaf stands at four regions in Korea during one spring fire season and classified moisture class (Dry/Intermediate/Moist) from 26 meteorological and soil predictors under time-blocked, nested cross-validation. Five classifiers performed moderately and indistinguishably (macro-F1 0.39–0.51; quadratic weighted kappa 0.20–0.47), all above naive baselines, and performance declined under leave-one-region-out transfer. A multiple-testing-corrected interaction test detected a forest-type-dependent response only for soil water content, and neither a forest-type indicator nor separate per-type models improved prediction over a single pooled model. The Fine Fuel Moisture Code (FFMC) was significantly correlated with measured litter moisture (r = −0.57 conifer, −0.48 broadleaf) and was more sensitive to Dry conditions than any classifier, but its ignition-probability-derived class boundary corresponded weakly to the observed classes, and a moisture-equivalent boundary produced a complementary rather than superior error pattern. Meteorological data provide site-calibrated discrimination of litter-moisture class; forest-type differences are present but narrow, and FFMC class boundaries require local calibration before operational use.
1. Introduction
The ignition and initial spread of forest fires are strongly governed by the condition of the litter layer that covers the forest floor. The litter layer, composed of dead leaves and fine twigs, is the surface stratum where most ignitions begin, and its moisture content is one of the most important factors determining ignitability and flame spread [1,2]. In Korea in particular, forest fires are concentrated in spring, when low precipitation, dry air, and hot dry local winds descending across the Taebaek Mountains combine to dry the litter layer rapidly and create conditions conducive to large fires [3]. Accurately estimating litter fuel moisture and translating it into fire danger is therefore the starting point of spring fire prevention and response.
The conventional approach to converting litter fuel moisture into danger information is represented by empirical indices such as the Fine Fuel Moisture Code (FFMC) of the Canadian Forest Fire Weather Index System, which estimates dead-fuel moisture from temperature, humidity, wind, and precipitation [4]. However, such indices rely on a single formulation, are developed for a standard pine forest, and do not adequately reflect differences among forest types. Stand-specific calibration studies have directly confirmed this concern: forest type, season, and stand density each significantly affect the relationship between FFMC and measured litter moisture, with the moisture of the underlying duff layer an additional factor that the standard code does not capture [5]; more recent work has correspondingly argued for fuel- and site-adaptable moisture models rather than a single daily formulation applied uniformly across fuel types [6]. Laboratory and field studies have reported that the ignition-threshold fuel moisture of litter varies substantially with species and forest type [7,8,9], and that physical leaf and litter-bed traits—leaf shape, size, and bulk density—govern the pathway from moisture retention and drying rate to flammability [2,10]. It has also been noted that the standard FFMC danger thresholds developed in Canada may be inappropriate in other climatic regions [11]. In response, Canada recently proposed class boundaries linking each index to a physical process, replacing the earlier frequency-based boundaries; for FFMC, the boundary was defined from the probability of sustained flaming ignition in pine needle litter [12].
Litter fuel moisture is not a simple function of any single meteorological variable; it responds to the combined and time-lagged influence of temperature, humidity, radiation, wind, precipitation history, and soil moisture, and these factors interact in complex, nonlinear ways [7,13]. This complexity, and the relative scarcity of long-term field validation against meteorological drivers, has been highlighted by a review of two decades of dead-fuel-moisture research [14] and by an early study linking directly measured fine-fuel moisture to fire-occurrence statistics in a Mediterranean climate [15]—an approach methodologically close to the fire-occurrence-based class thresholds adopted in this study (Section 2.3). Empirical regression equations and equilibrium-moisture-content formulations, although widely used [16], have limited capacity to represent such nonlinear interactions and the memory effects of antecedent weather. Recently, machine learning has been actively applied to estimating dead-fuel moisture from meteorological data, precisely because tree-based models such as random forests can capture the nonlinear relationships and variable interactions between meteorological factors and fuel moisture without pre-specifying a functional form, and often report higher predictive accuracy than conventional regressions [13,17]. In Korea, random-forest models have been used to estimate 10 h dead-fuel moisture, including a recent regional model in Gangwon Province confirming that low fuel moisture concentrates in spring and coincides with the fire season [18], and earlier work at the Hongneung Forest that improved accuracy over linear regression [19]. These studies also emphasize that the time-lagged effects of antecedent meteorology, such as relative humidity and rainfall over preceding days, are important predictors of dead-fuel moisture [20]. A parallel, multi-decade field programme in central Portugal has similarly related directly measured fine-fuel moisture to meteorology and wildfire activity over a 2000–2024 record [21], illustrating the scale of field monitoring that long-term operational validation ultimately requires.
However, several gaps remain. Many such approaches do not measure the litter layer directly but rely on standardized 10 h fuel sticks, whose scale and drying behaviour differ from those of the natural litter bed. Forest-type contrasts in fuel moisture have been examined before—for example, equilibrium-moisture-content differences between central European conifer and broadleaf litters [22] and multi-site calibration of fuel-moisture-stick estimates across conifer, broadleaf, and evergreen forests worldwide [23]—so the gap addressed here is not a general absence of forest-type comparisons. Rather, studies that directly measure litter fuel moisture in paired conifer and broadleaf stands, under a validation design that controls for temporal autocorrelation and spatial transfer, and that also evaluate whether the class boundaries of an internationally established fire-weather index correspond to locally observed moisture classes, remain limited. No single element of this combination is new in isolation; the contribution of the present study lies in combining directly measured, paired-site litter moisture; meteorological and soil predictors evaluated under temporally blocked and spatially cross-validated designs; an explicit statistical test of forest-type-related response differences; and a quantitative evaluation of FFMC class-boundary correspondence to locally observed litter-moisture classes within one Korean spring fire season.
To address these gaps, this study has three objectives. First, to classify litter fuel-moisture classes from meteorological and soil predictors using machine learning under a time-blocked, leakage-controlled validation scheme, and to evaluate whether forest-type information measurably improves this classification. Second, to formally test—rather than assume—whether conifer and broadleaf litter show statistically distinguishable meteorological responses, using SHapley Additive exPlanations (SHAP) attribution [24] together with an interaction test corrected for multiple comparisons. Third, to quantitatively evaluate the correspondence between a physically based, ignition-probability-derived FFMC class boundary [12] and locally observed litter-moisture classes for both forest types.
2. Materials and Methods
2.1. Study Sites and Data Collection
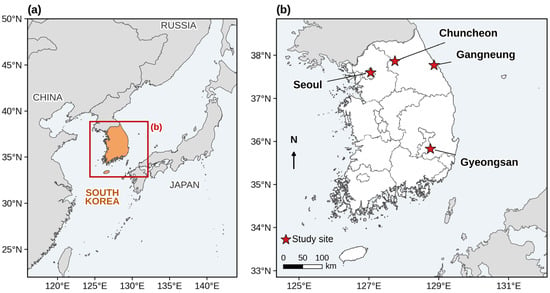
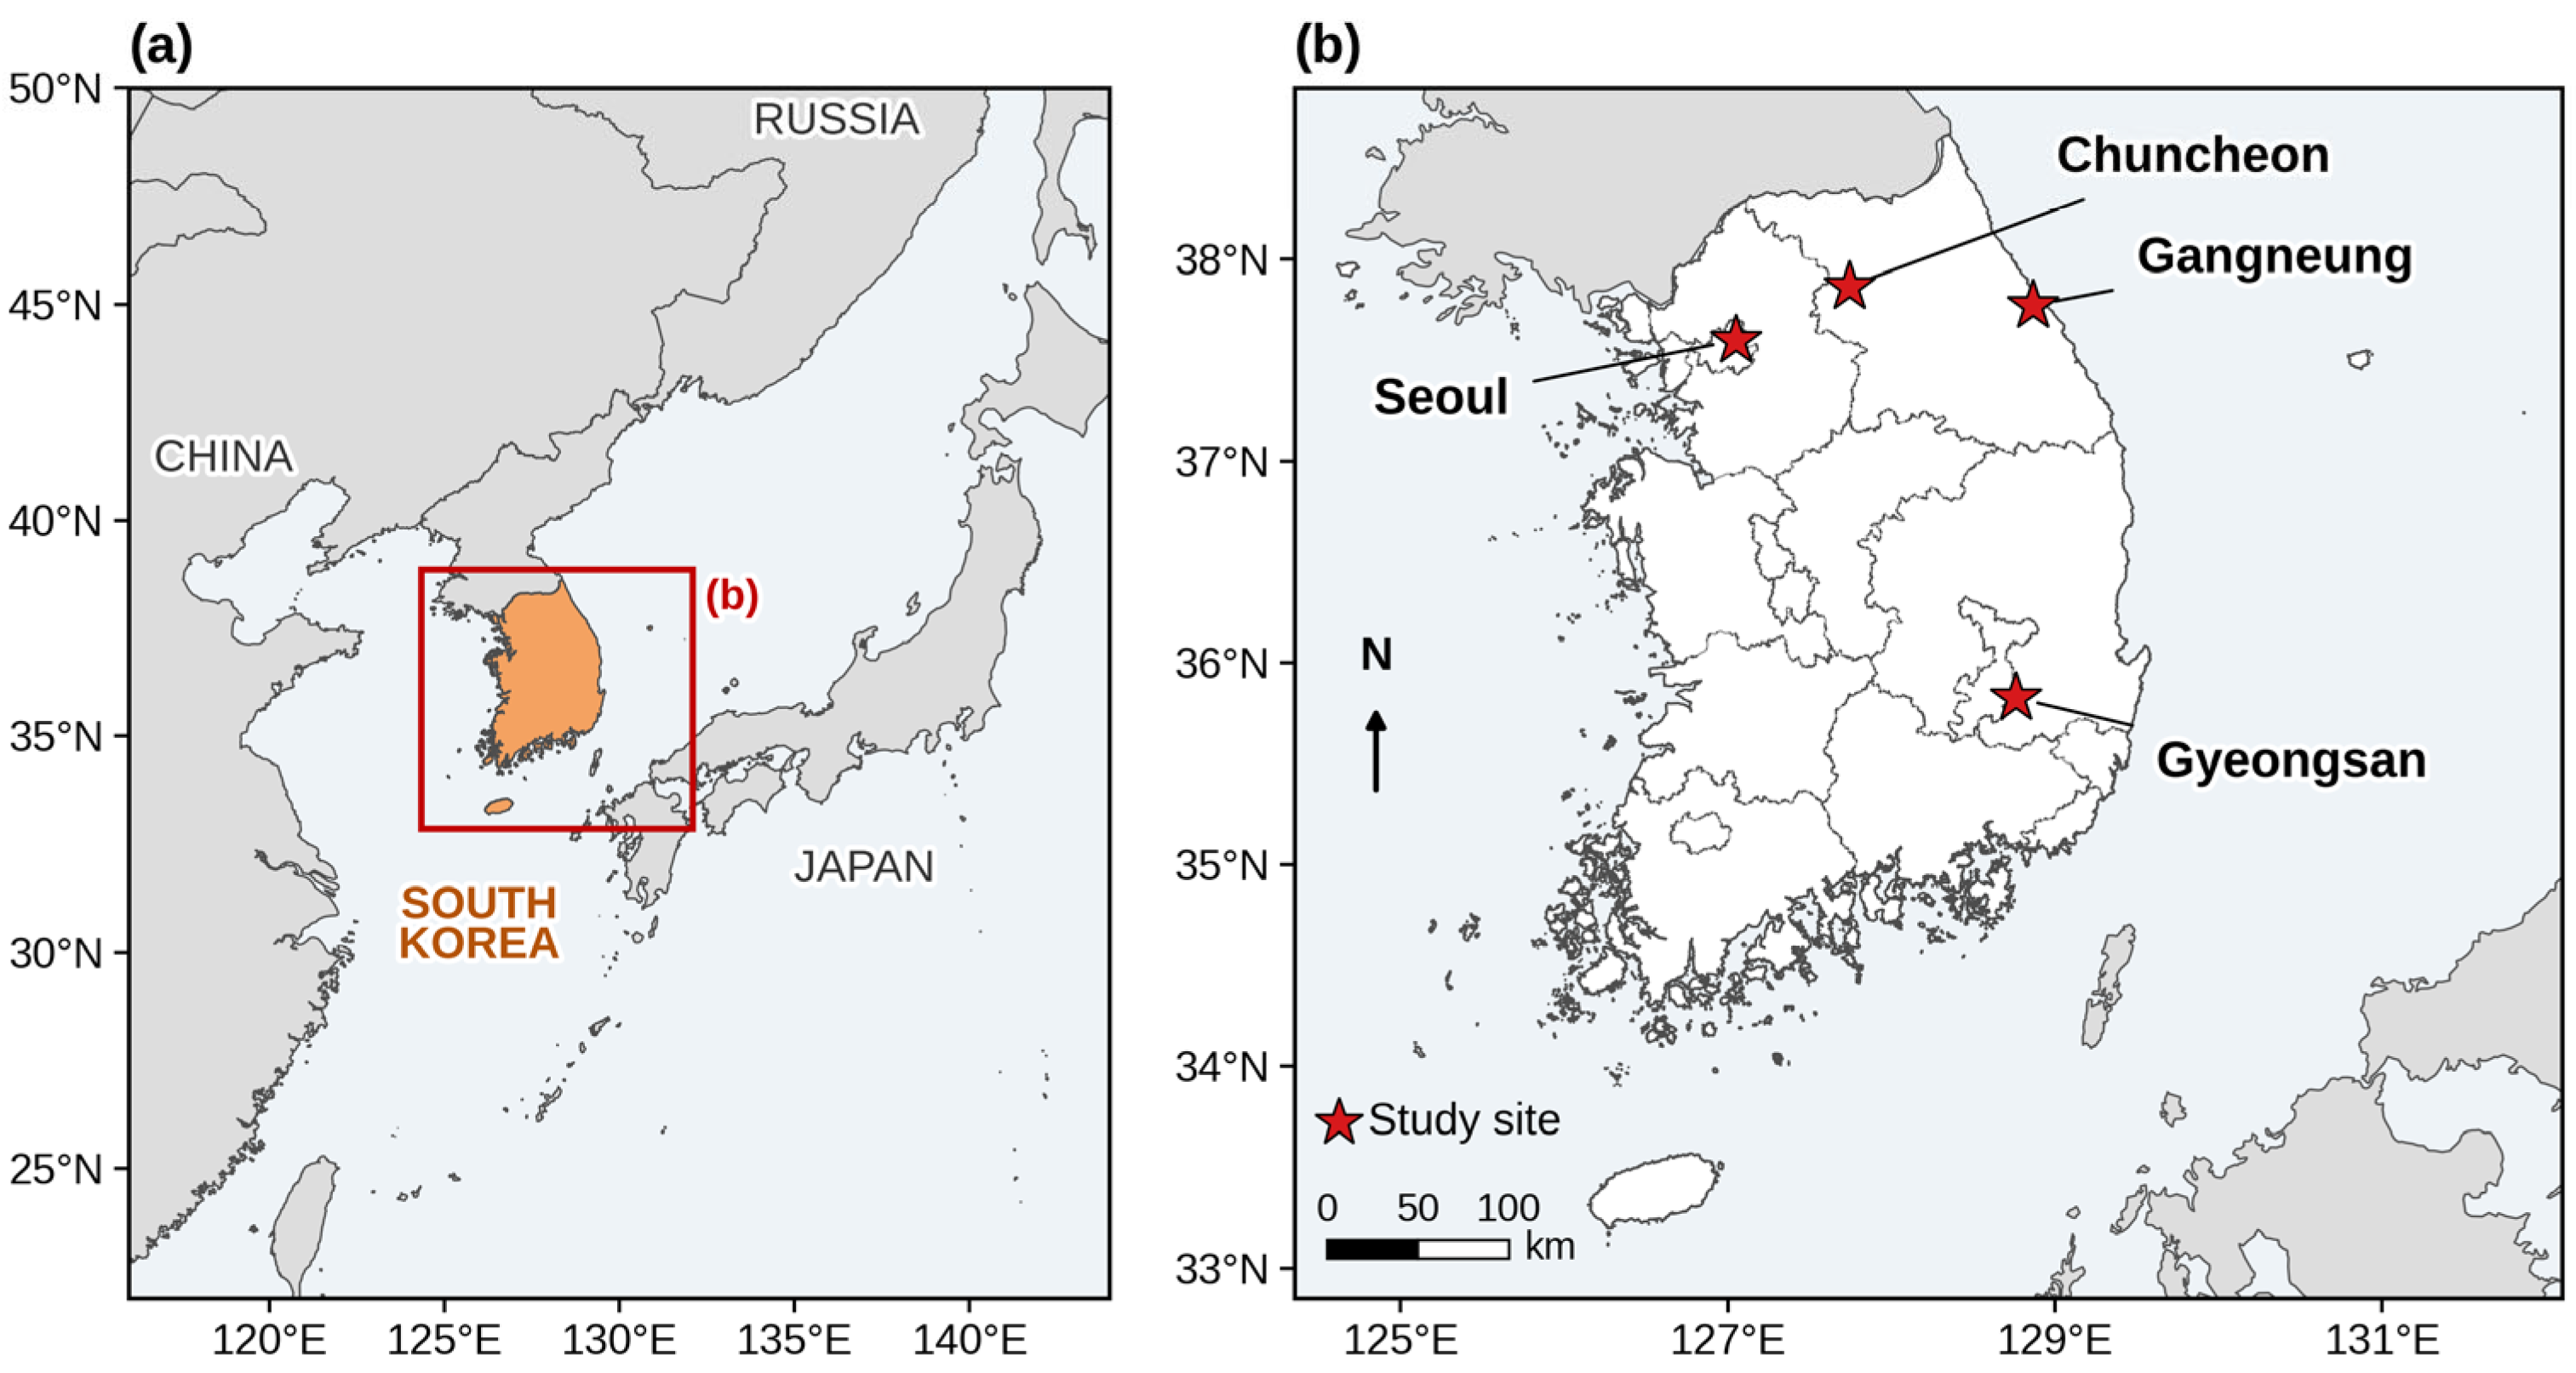
The study targeted paired conifer and broadleaf stands at four regions in Korea—Gangneung, Chuncheon, Gyeongsan, and Seoul—during the 2026 spring fire season (1 February–31 May) (Figure 1). Litter fuel moisture content (FMC) was measured at approximately 15:00 local time, primarily on non-rainy weekdays, although sampling was also conducted on some weekends and public holidays at selected sites. Litter was not sampled on rainy days (≥1.0 mm), and dates without field sampling have no corresponding field measurements rather than being excluded at the analysis stage. At each sampling event, three replicate litter samples were collected, oven-dried at 105 °C for 24 h, and their gravimetric moisture contents were averaged to obtain a daily value.
Figure 1.
Location of the four study sites in Korea.
Meteorological and soil data were observed at 15 min intervals at each plot using a co-located METER integrated weather sensor (ATMOS 41; METER Group, Inc., Pullman, WA, USA; air temperature, relative humidity, wind speed and gust, solar radiation, precipitation, and atmospheric pressure) and soil sensor (TEROS 12; METER Group, Inc., Pullman, WA, USA; soil water content and soil temperature); observations were available from July 2025 onward, giving each site more than six months of record before spring sampling and enabling long-term spin-up of the FFMC.
At each region, paired conifer and broadleaf plots were established in close proximity so that the two forest types experienced comparable regional weather while differing in litter type. The geographic coordinates and elevation of each plot are summarized in Table 1. The four regions span a latitudinal range from about 35.8° N (Gyeongsan, southeast) to 37.9° N (Chuncheon, north-central), encompassing both inland (Chuncheon, Gyeongsan, Seoul) and east-coastal (Gangneung) climatic settings, which provides a range of spring fire-weather conditions relevant to the Korean Peninsula.
Table 1.
Geographic characteristics of the study plots.
2.2. Data Preprocessing and Input Variables
The 15 min meteorological observations were aggregated to daily values over a trailing window from 15:00 on the previous day to 15:00 on the current day, ending at the approximate litter-sampling time so that no predictor includes information recorded after the litter was collected. For each 24 h window, 16 daily-aggregated variables were derived: air temperature (mean, minimum, and maximum); relative humidity (mean and minimum); vapour-pressure deficit (VPD; mean and maximum); solar radiation (mean and total); wind (mean speed and maximum gust); atmospheric pressure (mean); precipitation (total and maximum rate); and soil water content and soil temperature (mean of each). Of 480 possible region-days per forest type (4 regions × 120 days), litter was sampled on 370 region-days. The remaining 110 region-days were rainy days (≥1.0 mm) and were spread across all four months (February 33, March 26, April 23, May 28), so the absence of rainy-day samples was not confined to any single part of the season. Litter fuel-moisture values below 0% or above 200% were treated as measurement errors and removed as outliers (none for conifer and two for broadleaf), yielding a verified dataset of 370 conifer and 368 broadleaf observations (Table 2). This verified dataset is the base used throughout; analysis-specific subsets (Section 2.4 and Section 2.5) are smaller where an analysis additionally requires a matched meteorological record.
Table 2.
Number of valid samples by region and forest type.
To represent the memory effect of antecedent weather on litter moisture, ten history-derived predictors were constructed in addition to the 16 daily-aggregated meteorological variables, giving 26 predictors in total. The history-derived variables comprised antecedent precipitation (previous day, and 72 h and 7-day accumulations), moving averages of VPD, relative humidity, and temperature over 3-day and 7-day windows, and the number of consecutive days since the last day with ≥1.0 mm rainfall (dry days). These lagged and cumulative variables were included because litter fuel moisture at a given time reflects not only the current atmospheric state but also the drying and wetting history of the preceding days [20]. The full list of predictors and their definitions is provided in Table 3. For grouped attribution and the forest-type interaction test (Section 2.6 and Section 2.7), the 26 predictors were assigned a priori to six meteorological groups: atmospheric dryness/humidity, radiation, precipitation history, soil state, wind, and pressure.
Table 3.
Input predictors used for classification (26 in total: 16 daily-aggregated meteorological variables and 10 history-derived variables).
2.3. Definition of Moisture Classes
Moisture classes were defined based on the Korean literature. Prior work reported that the forest fuel moisture at 453 spring fire-occurrence sites ranged from 7.2 to 17.2%, with about 70% occurring below 10.5% [16]. Accordingly, a three-class system with boundaries at 10.5% and 17.2% was adopted and applied identically to both forest types, so that conifer and broadleaf litter are compared on the same moisture scale (Table 4). The classes are labelled by moisture state—Dry, Intermediate, and Moist—reflecting the litter fuel-moisture level, with the Dry class representing the lowest moisture content observed at spring fire-occurrence sites. These thresholds are empirical and operational, derived from the moisture distribution at historical fire-occurrence sites; they are not physical ignition thresholds and are not claimed to correspond to a specific ignition probability. To check that the main conclusions do not hinge on the exact boundaries, a sensitivity analysis (Section 3.5) shifted each threshold by ±1 percentage point, replaced the thresholds with equal-frequency terciles, and collapsed the target to a binary Dry/non-Dry class; classification performance and grouped-SHAP rankings were recomputed for each variant using a single fixed random-forest configuration (the hyperparameter combination most frequently selected by inner cross-validation in the main analysis).
Table 4.
Litter fuel-moisture classes based on the Korean literature.
2.4. FFMC Calculation and Comparison
The FFMC was calculated following the standard equations of Van Wagner [4]. Starting from a standard initial value of 85 in July 2025, the code was updated on a daily time step using noon (12:00) temperature, relative humidity, and wind speed, with precipitation accumulated over the standard 24 h window ending at the noon observation rather than as a calendar-day sum, so that by February—when litter fuel-moisture measurement begins—roughly six months of spin-up had dissipated the influence of the initial value. The relationship between FFMC and measured litter fuel moisture was evaluated in two ways: as a continuous relationship using Pearson and Spearman correlation coefficients, and as a class-level relationship between FFMC-derived classes and the field-based moisture classes using percentage agreement, Cohen’s kappa interpreted following Landis and Koch [25], quadratic weighted kappa (QWK; Section 2.5), and Dry-class precision, recall, and F1. For the class comparison, we first adopted the physically based FFMC classes of Hanes et al. [12], which divide FFMC into four classes—Low (≤75), Moderate (>75–85), High (>85–90) and Extreme (>90)—according to the probability of sustained flaming ignition in the needle litter of a moderately closed pine stand. In that scheme, 75 is the upper limit of the Low class, 85 is the point above which the ignition probability exceeds 50%, and 90 separates a higher ignition probability and faster potential spread in the Extreme class [12]. Because the field classification has a single Dry class, the High and Extreme classes, both with an ignition probability above 50%, were merged into Dry, and the two ignition-based boundaries were retained, giving three classes: FFMC > 85 (Dry), 75 < FFMC ≤ 85 (Intermediate) and FFMC ≤ 75 (Moist) (higher FFMC indicates drier fuel). Unlike the earlier frequency-based thresholds, these boundaries therefore carry a direct physical interpretation.
Because the Dry cutpoint of this boundary corresponds to a litter-moisture content different from the field Dry threshold, an a priori moisture-equivalent boundary was also evaluated. It was obtained by inverting the FFMC moisture equation, m = 147.2(101 − F)/(59.5 + F) [4], at the 10.5% and 17.2% thresholds used for the litter classes (FFMC > 90.3, 84.2 < FFMC ≤ 90.3, and FFMC ≤ 84.2), and is therefore a direct unit conversion of the study’s own class thresholds, not a post hoc optimized or data-fitted boundary. FFMC was merged onto the litter-moisture records by date, region, and forest type, and observations with a matched noon FFMC value formed the FFMC comparison subset (357 conifer and 356 broadleaf observations; 13 and 12 lacked a matched reading, respectively). Forest-type differences in the FFMC–moisture relationship were tested directly with an ordinary least-squares model, log(FMC) ~ FFMC × forest type + region, using both model-based and date-cluster bootstrap inference, and by a paired date-cluster bootstrap comparison of the conifer and broadleaf Pearson and Spearman correlation coefficients between FFMC and measured FMC.
2.5. Machine Learning and Validation
Five classifiers were compared: logistic regression (on standardized predictors), and four tree-based ensembles—random forest, extra trees, gradient boosting, and histogram-based gradient boosting. Separate models were trained for conifer and broadleaf unless stated otherwise (Section 2.7). All models were configured with balanced class weights; gradient boosting, which has no native class-weight option in scikit-learn, was instead fitted with balanced sample weights.
Model performance was evaluated with a time-blocked, nested, leakage-controlled cross-validation scheme designed for this single-season, multi-region time series. The spring observation window was partitioned into nine contiguous 14-day blocks (the last one partial), assigned by calendar date so that same-day observations from different regions always fell in the same block, because same-day weather is shared across regions and would otherwise leak across a naive split. In each of the nine outer folds, one block was held out for testing, and a 7-day embargo was applied on both sides of the test block’s date range: any training observation within the embargo window was excluded regardless of its nominal block, because several predictors are themselves multi-day (up to 7-day) windows. Within each outer training set, hyperparameters were selected by nested inner cross-validation using paired consecutive blocks, and the selected configuration was refitted on the full embargoed outer training set to predict the held-out block, so that model selection never used outer-test observations. Hyperparameter selection maximized the mean macro-F1 across inner validation folds and was repeated independently for each of the nine outer folds. The search grids were C = {0.1, 1, 10} for logistic regression; max_depth = {None, 6} and min_samples_leaf = {1, 3} for random forest and extra trees; n_estimators = {100, 300} and max_depth = {2, 3} for gradient boosting; and max_iter = {100, 300} and max_depth = {None, 3} for histogram-based gradient boosting. The number of trees was fixed at 400 for random forest and extra trees. Two naive baselines—always predicting the training majority class, and always predicting Intermediate—were evaluated under the identical scheme. Leave-one-region-out (LORO) cross-validation, holding out each of the four regions in turn and training on the remaining three, was additionally run to assess spatial transferability independently of the temporal blocking.
Performance was summarized by overall accuracy; macro-averaged F1 (macro-F1), which weights the three classes equally; quadratic weighted kappa (QWK), which accounts for the ordinal structure of the classes (Dry, Intermediate, and Moist, in order of increasing moisture content) by penalizing disagreements in proportion to the squared class distance and equals zero for chance-level agreement; and Dry-class precision, recall, and F1. Adjacent-class accuracy (the proportion of predictions within one ordinal class of the observed class) and the extreme-misclassification rate (observed Dry predicted as Moist, or vice versa) were reported descriptively. Confidence intervals (95%) for classification metrics were obtained by block bootstrap (2000 resamples).
2.6. SHAP Attribution
Feature attribution used SHAP values computed with TreeExplainer on out-of-fold test predictions only—never on training-fold predictions—for the probability of the Dry class, using the per-forest-type random-forest models. Random forest was used as the single representative algorithm for all SHAP-based analyses because no classifier’s performance confidence interval excluded another’s (Section 3.1), so one consistent tree ensemble was preferred to switching algorithms between sub-analyses.
Grouped SHAP importance was computed so that the apparent importance of a group is not inflated in proportion to the number of its member predictors: for each observation i and group g, the signed SHAP values of the member predictors were first summed (φg,i = Σj∈g φj,i), and the absolute value of this sum was then averaged across observations (importanceg = meani |φg,i|). Summing per-predictor mean absolute SHAP values within a group would instead prevent opposing contributions of same-group predictors from cancelling and would mechanically favour groups with more predictors.
2.7. Testing Forest-Type Differences
Two distinct questions were evaluated separately, because an affirmative answer to the first does not imply the second. First, whether conifer and broadleaf litter show a statistically distinguishable meteorological response was tested with a pooled logistic regression of Dry versus non-Dry status on one representative predictor per meteorological group, each interacted with forest type, with sampling region as a fixed effect (Dry ~ Σg z(predictorg) × forest type + region; predictors z-scored for comparable coefficient scales). The six groups were defined a priori (Section 2.2), and the representative predictor of each group was selected objectively as the variable with the highest combined (conifer plus broadleaf mean) SHAP importance (Section 2.6); because this selection used the same dataset, the interaction tests are conditional on it. Inference used both the model’s parametric p-values and a date-cluster bootstrap (2000 resamples of whole calendar dates, preserving the paired same-day conifer–broadleaf structure). Because six groups were tested simultaneously, raw p-values are reported alongside Holm–Bonferroni-adjusted p-values controlling the family-wise error rate.
Second, whether using forest type improves predictive performance was tested by comparing three model structures under the identical validation scheme (Section 2.5), all using random forest: (A) one pooled model trained on both forest types without forest-type information; (B) the same pooled model with an added binary forest-type indicator; and (C) two fully separate per-forest-type models. If pooled and separate models perform indistinguishably, a detectable attribution-level difference does not by itself justify separate predictive models. In addition, to gauge the contribution of soil state to predictive performance, the per-forest-type classification was repeated without the two soil variables (soil water content and soil temperature) under the same validation scheme.
2.8. Statistical Software and Reproducibility
All analyses were performed in Python(ver. 3.12.10) using scikit-learn 1.9.0, shap 0.52.0, and statsmodels, with a fixed random seed (random_state = 42) for every stochastic procedure. All confidence intervals are 95% percentile intervals from 2000 resamples of either the block-bootstrap (whole 14-day blocks, identical to the outer cross-validation folds of Section 2.5, resampled with replacement) or the date-cluster bootstrap (individual calendar dates) procedure, as specified in the relevant section.
3. Results
3.1. Classification Performance
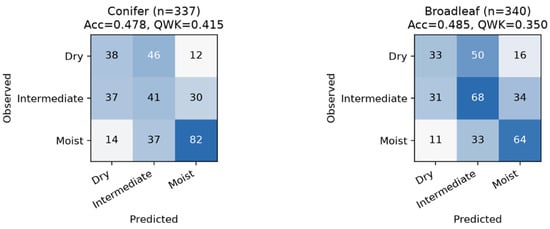
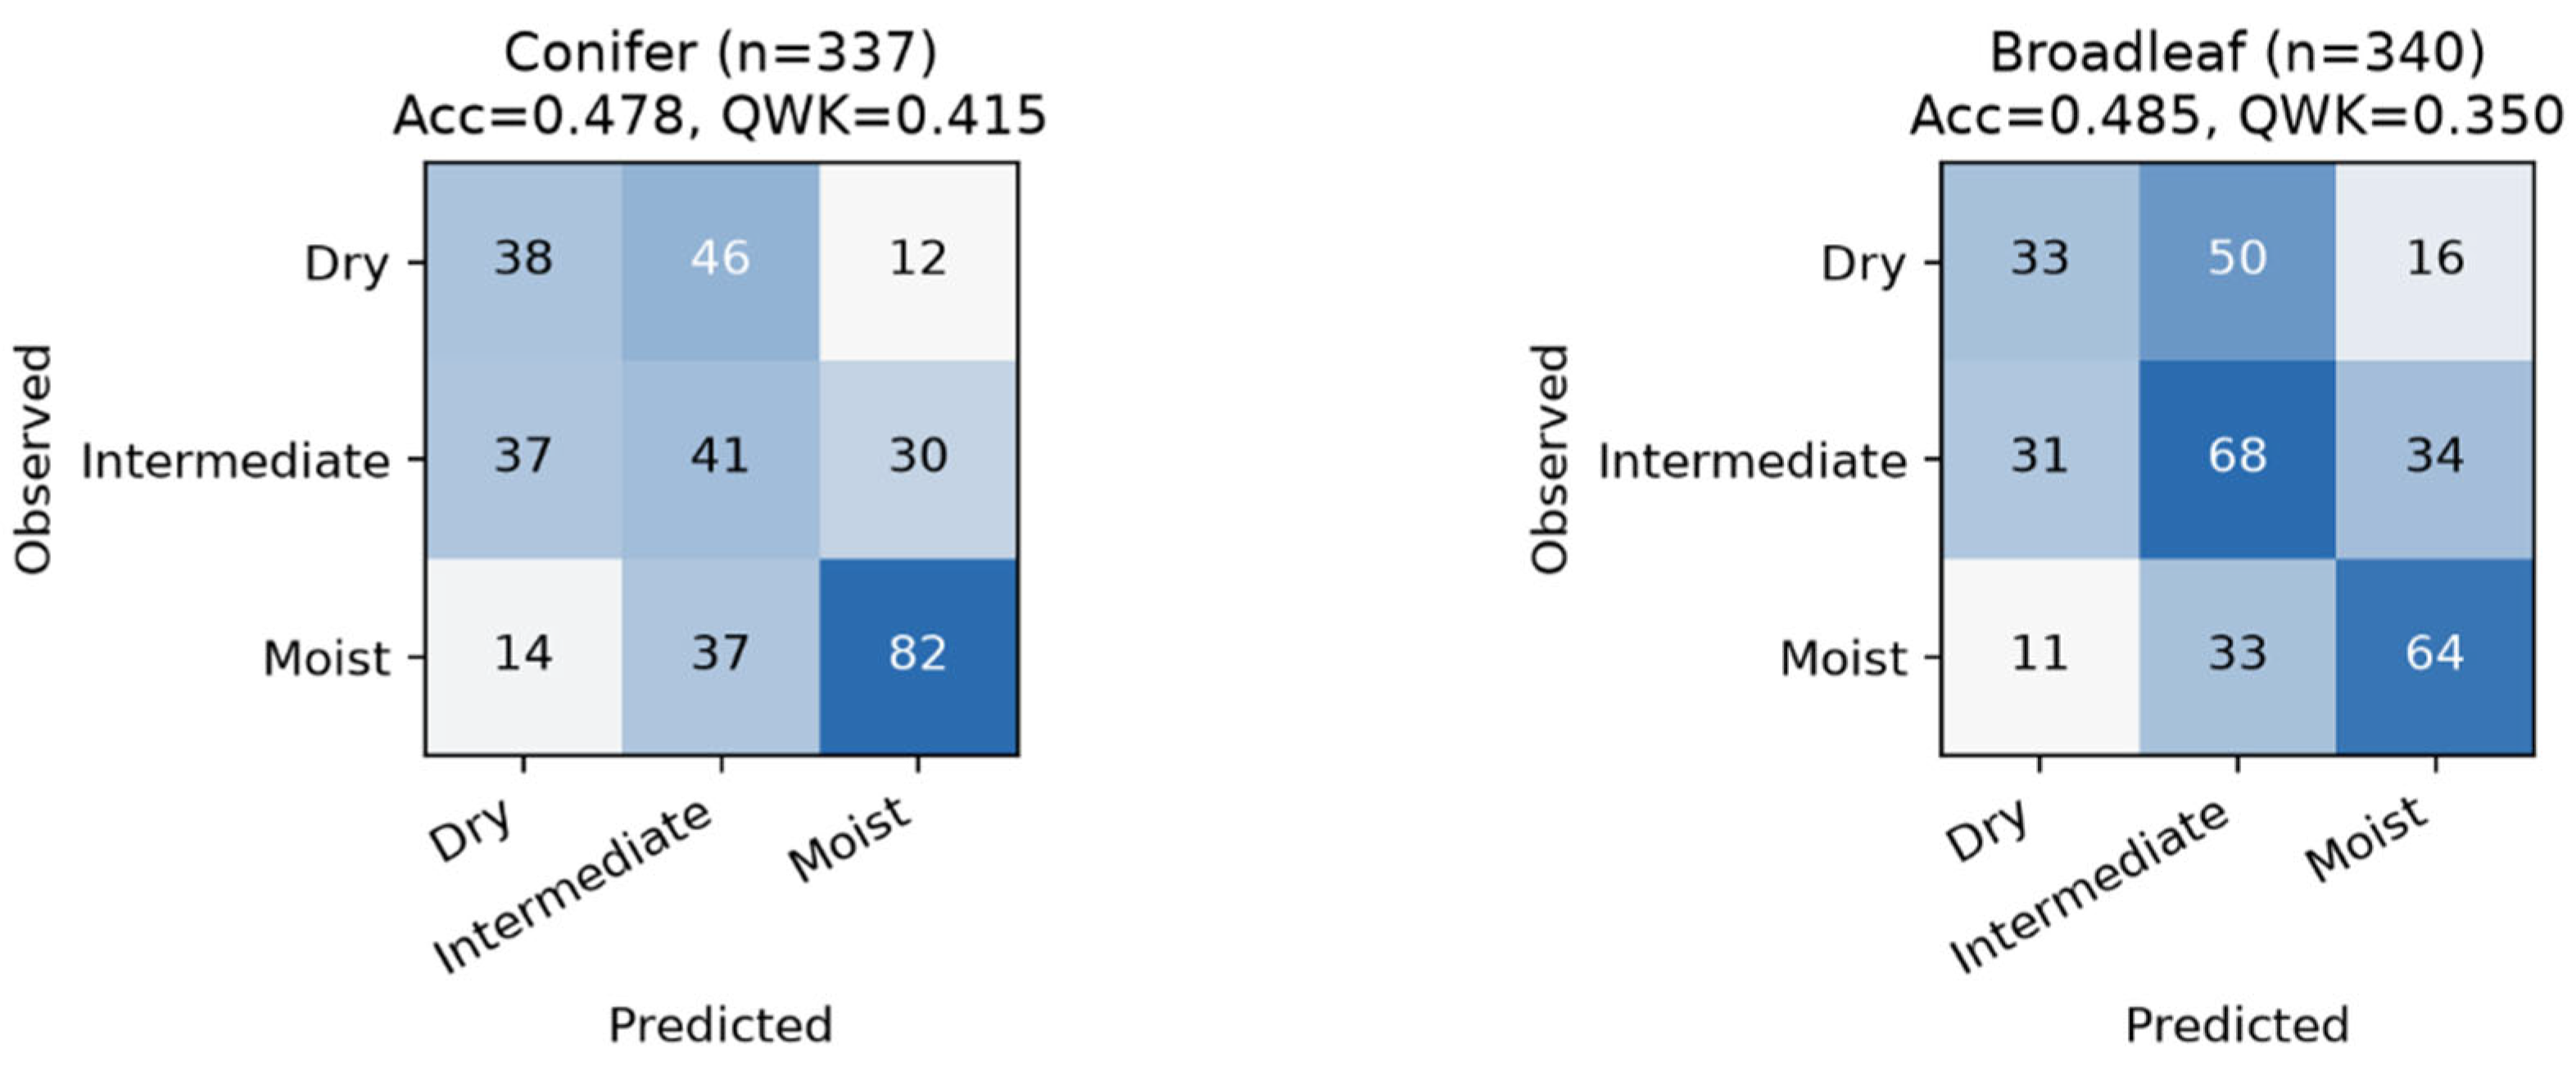
Under the time-blocked nested cross-validation (337 conifer and 340 broadleaf observations with complete predictor records), the class distribution was Dry 96 (28.5%), Intermediate 108 (32.0%), and Moist 133 (39.5%) for conifer and Dry 99 (29.1%), Intermediate 133 (39.1%), and Moist 108 (31.8%) for broadleaf. The five classifiers performed similarly for both forest types, with substantially overlapping 95% confidence intervals (Table 5; Figure 2): conifer macro-F1 ranged from 0.39 to 0.51 and QWK from 0.20 to 0.47, and broadleaf macro-F1 from 0.44 to 0.51 and QWK from 0.31 to 0.40. No classifier’s confidence interval excluded another’s for either forest type. The lower macro-F1 confidence bounds of all five classifiers (≥0.27) lay above the upper bounds of both naive baselines (≤0.23). One classifier–forest-type combination (gradient boosting, conifer) had a QWK confidence interval that included zero (−0.013 to 0.375), indicating that its ordinal agreement with the observed classes was not clearly distinguishable from chance, although its macro-F1 remained above the baselines.
Table 5.
Classification performance by model and forest type (time-blocked nested cross-validation; n = 337 conifer, 340 broadleaf).
Figure 2.
Confusion matrices under time-blocked nested cross-validation, with random forest shown as a representative classifier (no classifier’s 95% confidence interval excluded another’s; Table 5 gives the full five-classifier comparison).
Adjacent-class accuracy was high for all classifiers (0.85–0.94), but because an always-Intermediate classifier scores 1.000 on this metric, it is reported only descriptively (Supplementary Table S1). The extreme-misclassification rate was 0.077–0.151 for conifer and 0.059–0.085 for broadleaf across classifiers, against chance expectations of 0.21–0.24 and 0.14–0.18, respectively, given the same class marginals. Dry-class precision, recall, and F1 for all classifiers are given in Table 5; the highest Dry recall was 0.531 for conifer and 0.465 for broadleaf, both from logistic regression.
3.2. Spatial Transferability (Leave-One-Region-Out)
Mean LORO performance was lower than the time-blocked estimates for every classifier (mean QWK 0.18–0.28 for conifer and 0.13–0.20 for broadleaf across classifiers; per-region results in Supplementary Table S2). Performance varied strongly with the held-out region: even the accuracy of the majority-class baseline ranged from 0.000 to 0.513 across the four regions, so a single pooled LORO figure is not reported.
When the Seoul conifer data were held out, the majority-class baseline scored exactly 0.000 accuracy: in this single-season record, the Seoul conifer plot recorded no Dry-class observations, whereas the modal class of the pooled three-region training data was Dry—a consequence of the class-label distribution, independent of any predictor. The five trained classifiers did not reproduce this complete failure at Seoul/conifer (accuracy 0.29–0.36). At Seoul/broadleaf, four of the five classifiers scored 0.18–0.26 accuracy, whereas logistic regression scored 0.500, an outlier not observed for any other classifier, region, or forest type. The physically based FFMC boundary—a meteorological index with no training step and no soil inputs—likewise scored lower at Seoul than at the other three regions for both forest types (accuracy 0.20 for conifer and 0.28 for broadleaf; Supplementary Table S2).
3.3. Forest-Type Comparison
Comparing the pooled model without forest-type information (A), the pooled model with a forest-type indicator (B), and separate per-forest-type models (C) under the identical validation scheme, the 95% confidence intervals of all three structures overlapped substantially for every metric, overall and within each forest type (Table 6). Overall macro-F1 was 0.489 (0.431–0.529) for A, 0.510 (0.448–0.544) for B, and 0.476 (0.410–0.521) for C; overall QWK was 0.410 (0.297–0.495), 0.445 (0.341–0.512), and 0.384 (0.298–0.466), respectively. No structure’s Dry-class precision, recall, or F1 confidence interval excluded another’s (Supplementary Table S3). Model B was numerically highest overall and within each forest type, but this is a point-estimate observation rather than a difference supported by the confidence intervals.
Table 6.
Performance of the three model structures (time-blocked nested cross-validation; random forest).
A pooled logistic regression of Dry versus non-Dry status on the representative predictor of each group, interacted with forest type and controlling for region, found a statistically significant forest-type interaction for one of six groups—soil state, represented by mean soil water content (interaction estimate 1.430; model p = 0.000071; Holm-adjusted p = 0.0004; bootstrap 95% CI 0.899–2.161; N = 677). None of the other five groups was significant by its model-based p-value, before or after correction for multiple testing (Table 7). For pressure, the date-cluster bootstrap interval (0.076–0.950) excluded zero although neither the raw (p = 0.051) nor the Holm-adjusted p-value (0.255) was significant; we therefore regard this interaction as inconclusive rather than absent.
Table 7.
Forest-type interaction test (Dry vs. non-Dry ~ representative predictor × forest type + region; N = 677).
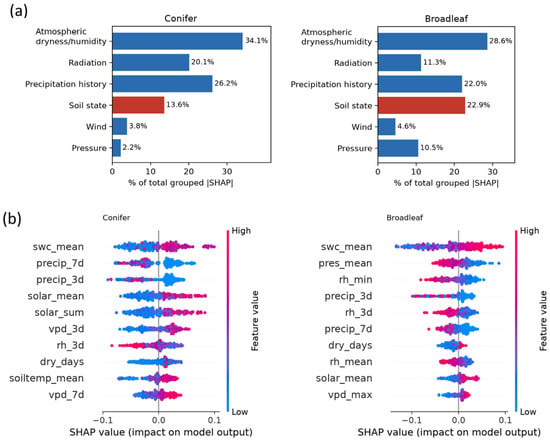
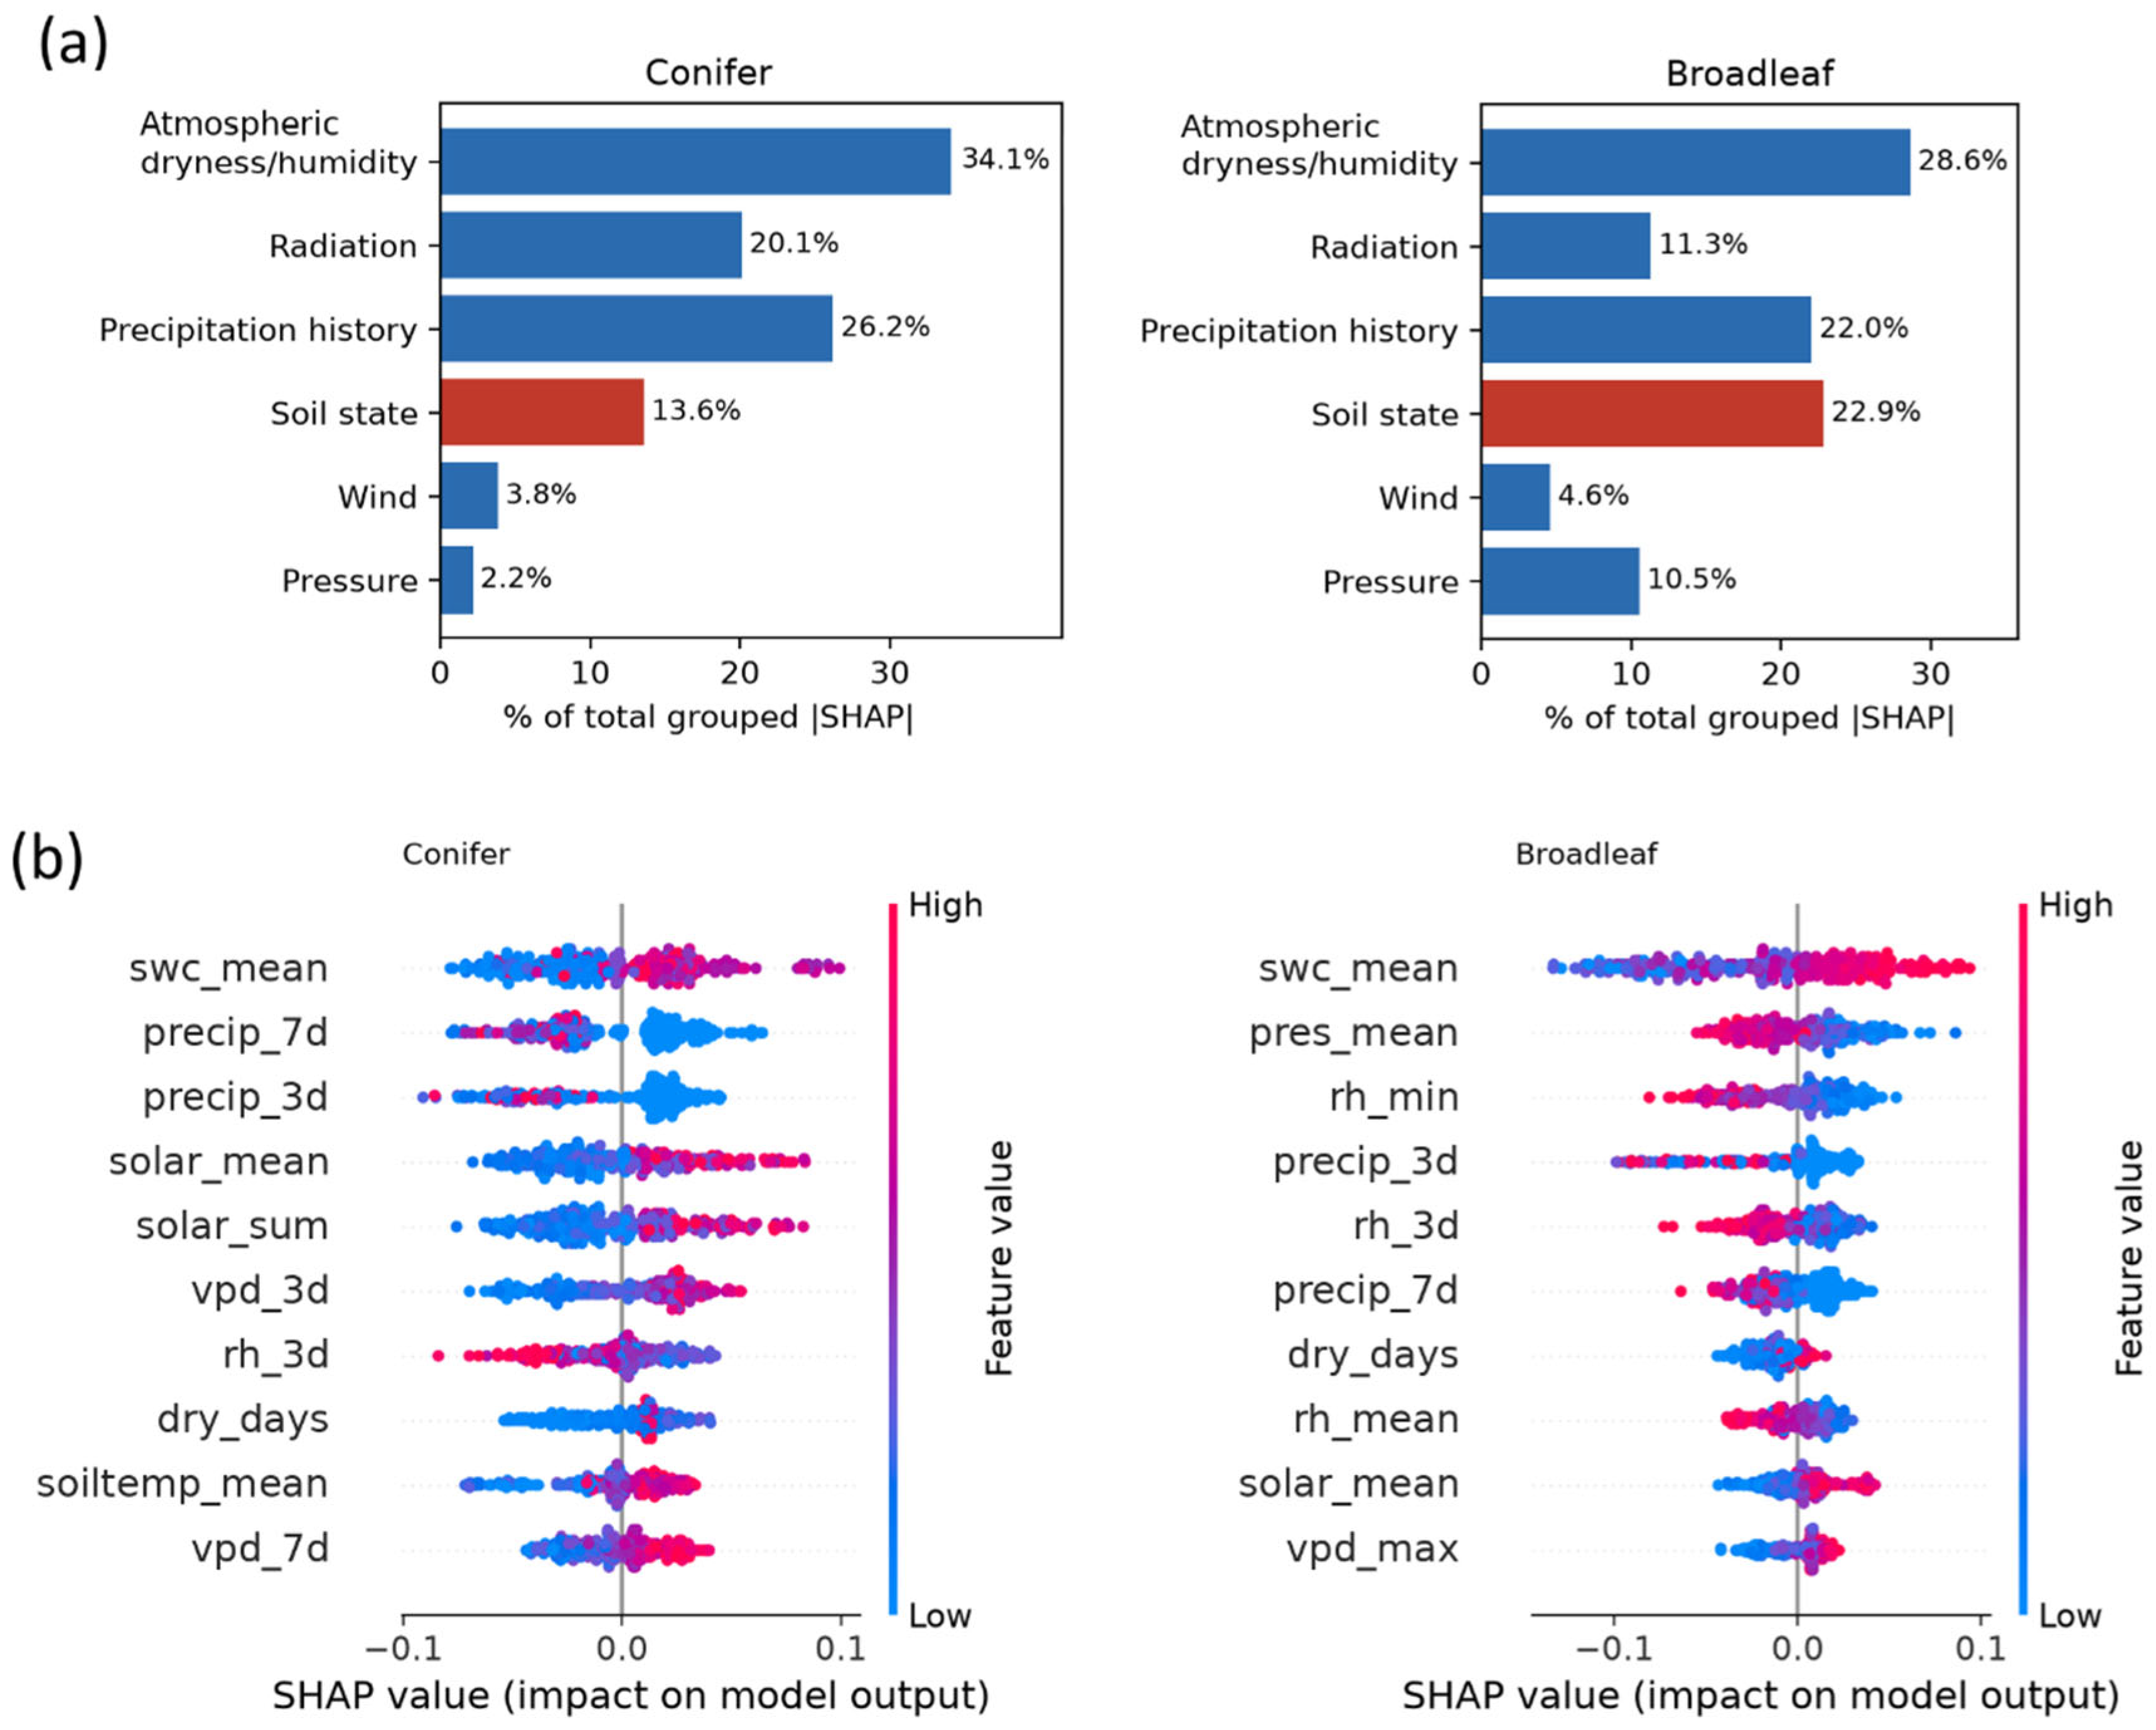
Across both forest types, atmospheric dryness/humidity was the largest grouped SHAP contributor (34.1% for conifer and 28.6% for broadleaf), followed by precipitation history for conifer (26.2%) and soil state for broadleaf (22.9%, narrowly ahead of precipitation history at 22.0%). Soil state was the fourth-largest group for conifer (13.6%), and wind and pressure were the two smallest groups for both forest types (Table 8). At the individual-predictor level, mean soil water content had the highest mean |SHAP| of the 26 predictors for both forest types, and in both cases higher soil water content was associated with a higher, not lower, predicted probability of the Dry class (Spearman r with predicted Dry probability = 0.651 for conifer and 0.899 for broadleaf; Figure 3).
Table 8.
Grouped SHAP importance (percentage of total grouped |SHAP|; per-forest-type random-forest models).
Figure 3.
SHAP-based predictor importance for conifer and broadleaf litter fuel-moisture classification. (a) Grouped SHAP importance across six predictor groups; the soil-state group, the only group with a significant forest-type interaction (Table 7), is highlighted in red. (b) SHAP beeswarm plots showing the 10 most important individual predictors among the 26 predictors for each forest type; each point represents one observation, colored by predictor value from low (blue) to high (red).
3.4. FFMC Relationship and Class-Boundary Comparison
Measured litter fuel moisture and FFMC were significantly negatively correlated for both forest types (conifer: Pearson r = −0.571, Spearman r = −0.546; broadleaf: Pearson r = −0.482, Spearman r = −0.416; n = 357 and 356; all p < 0.001). A date-cluster bootstrap comparison of the correlations of the two forest types gave a 95% CI for the Pearson difference of −0.191 to 0.026, which includes zero, and for the Spearman difference of −0.209 to −0.052, which excludes zero. A direct regression test of forest-type calibration (log(FMC) ~ FFMC × forest type + region) found no significant FFMC × forest-type interaction (estimate −0.00144; 95% CI −0.0058 to 0.0027; p = 0.546).
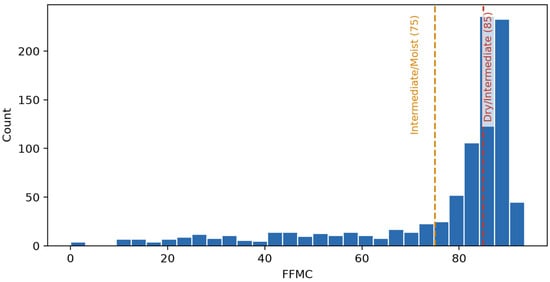
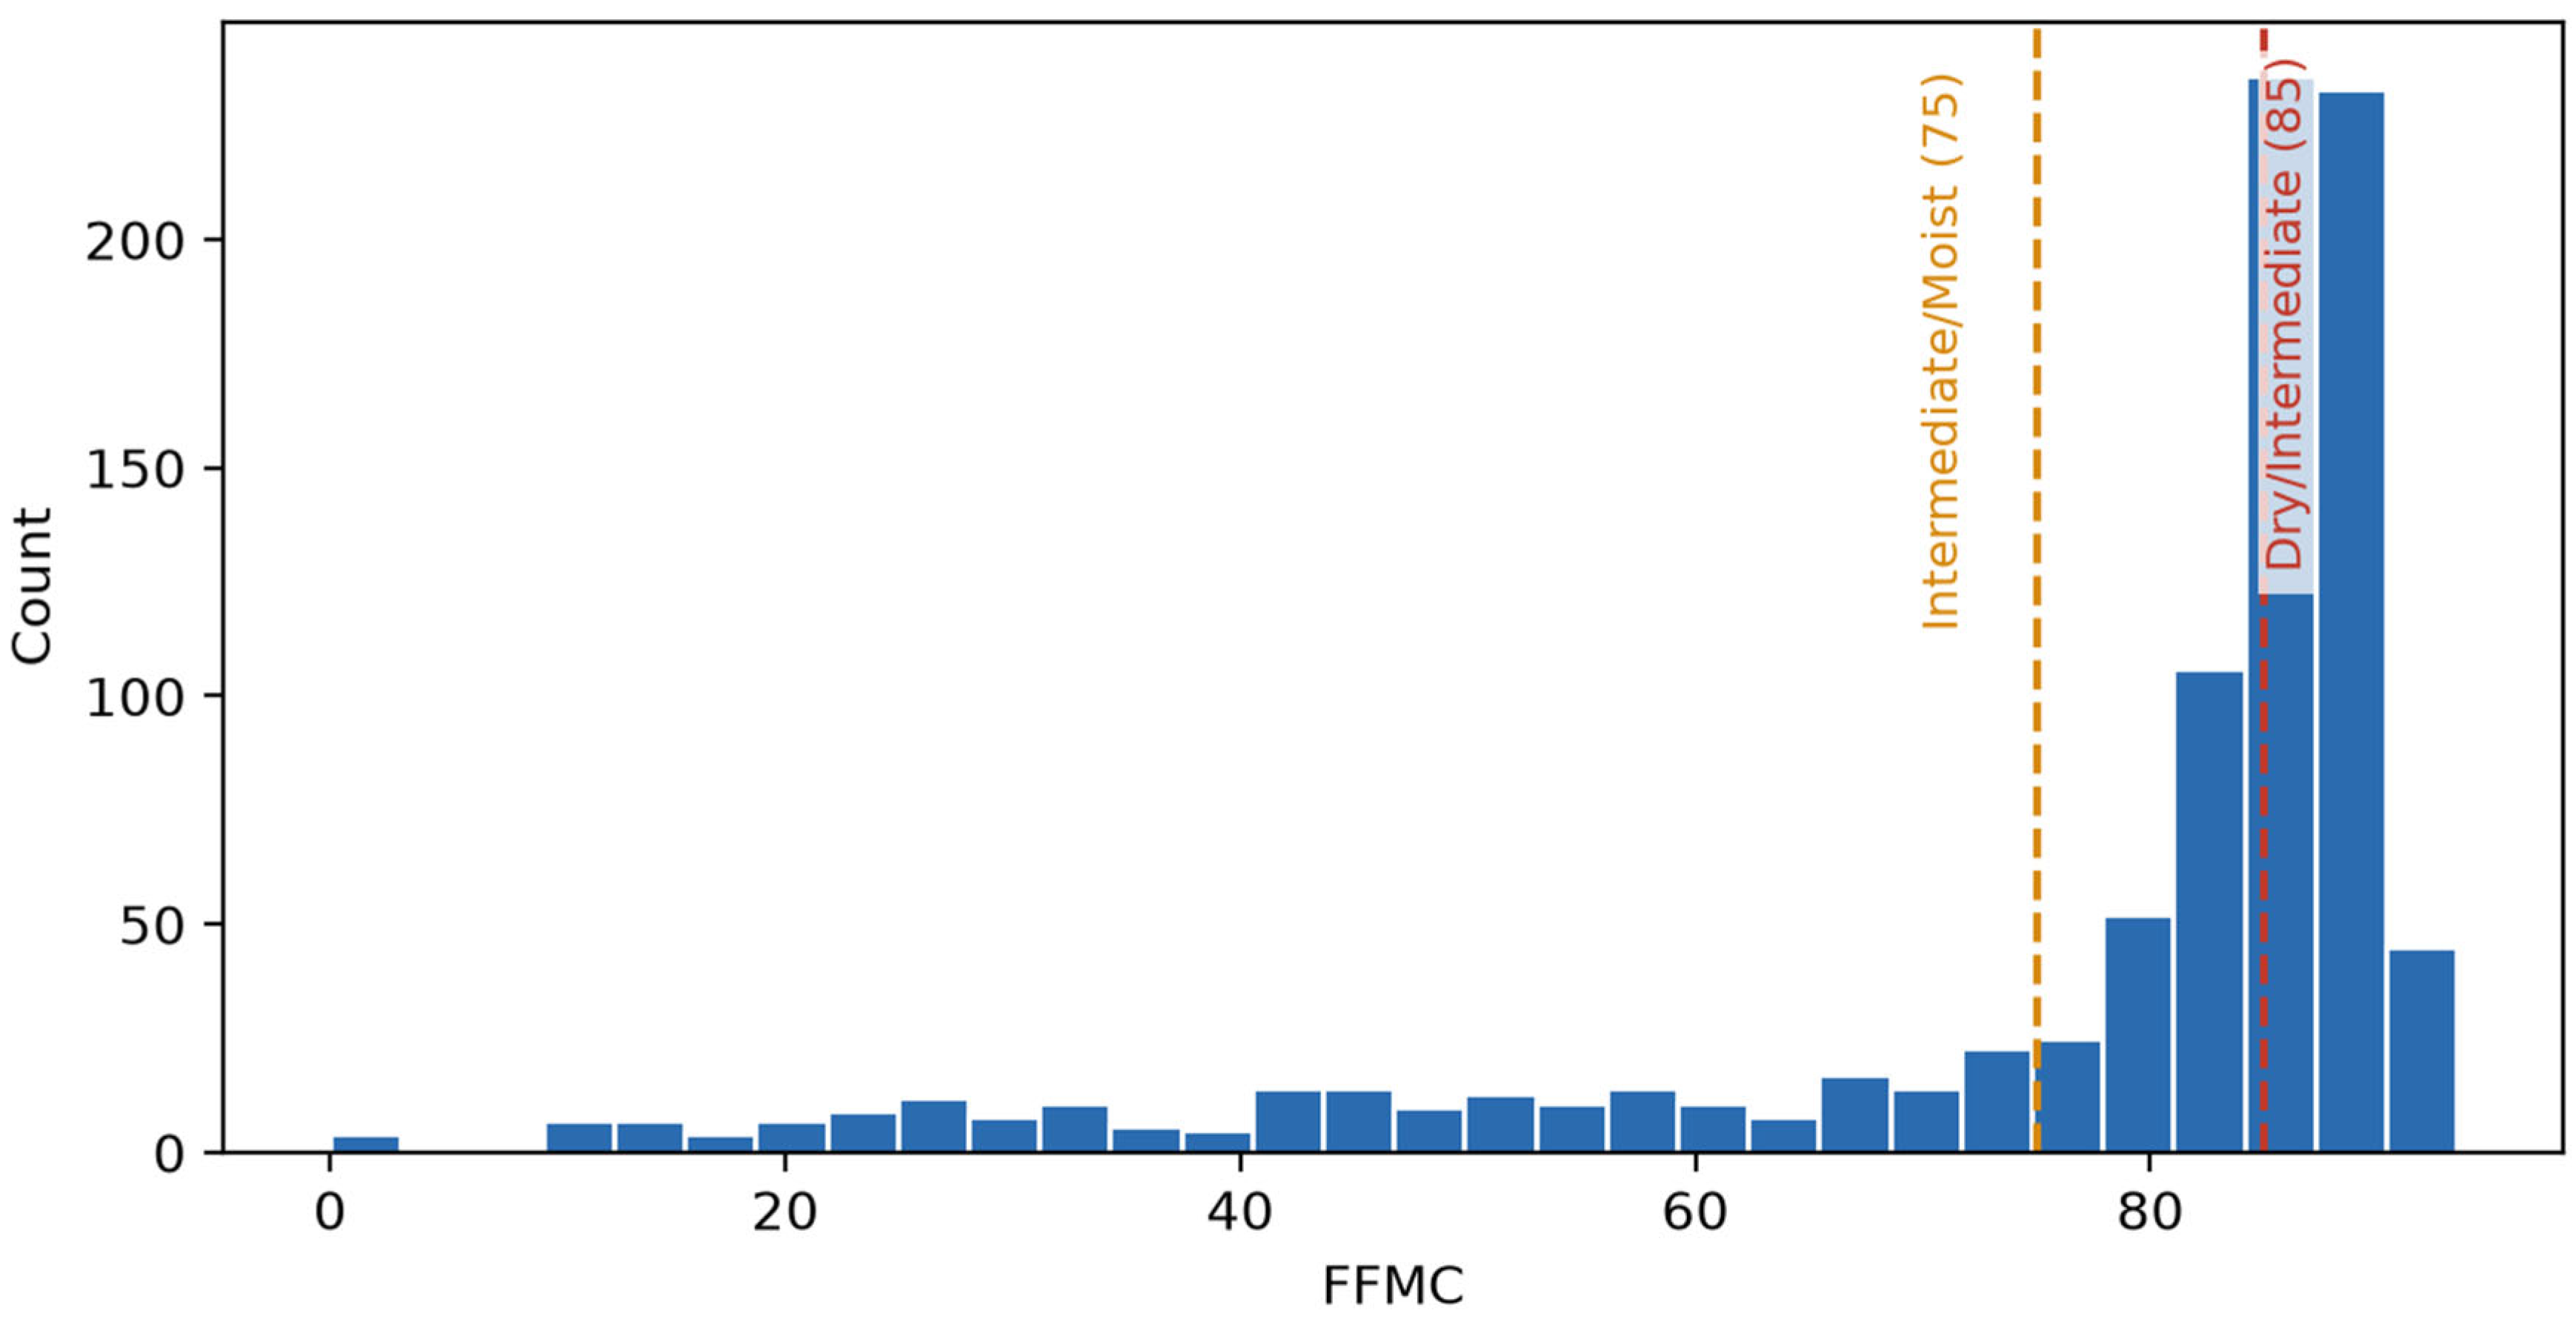
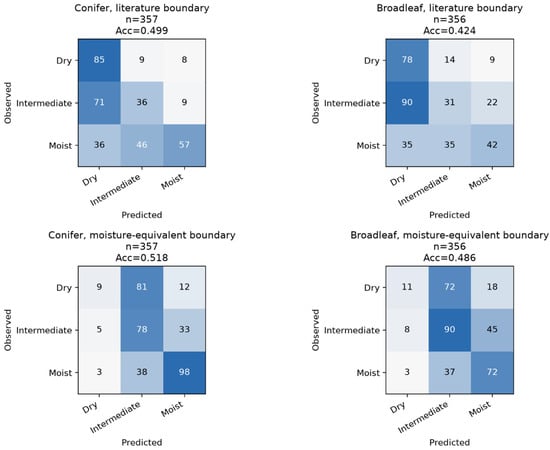
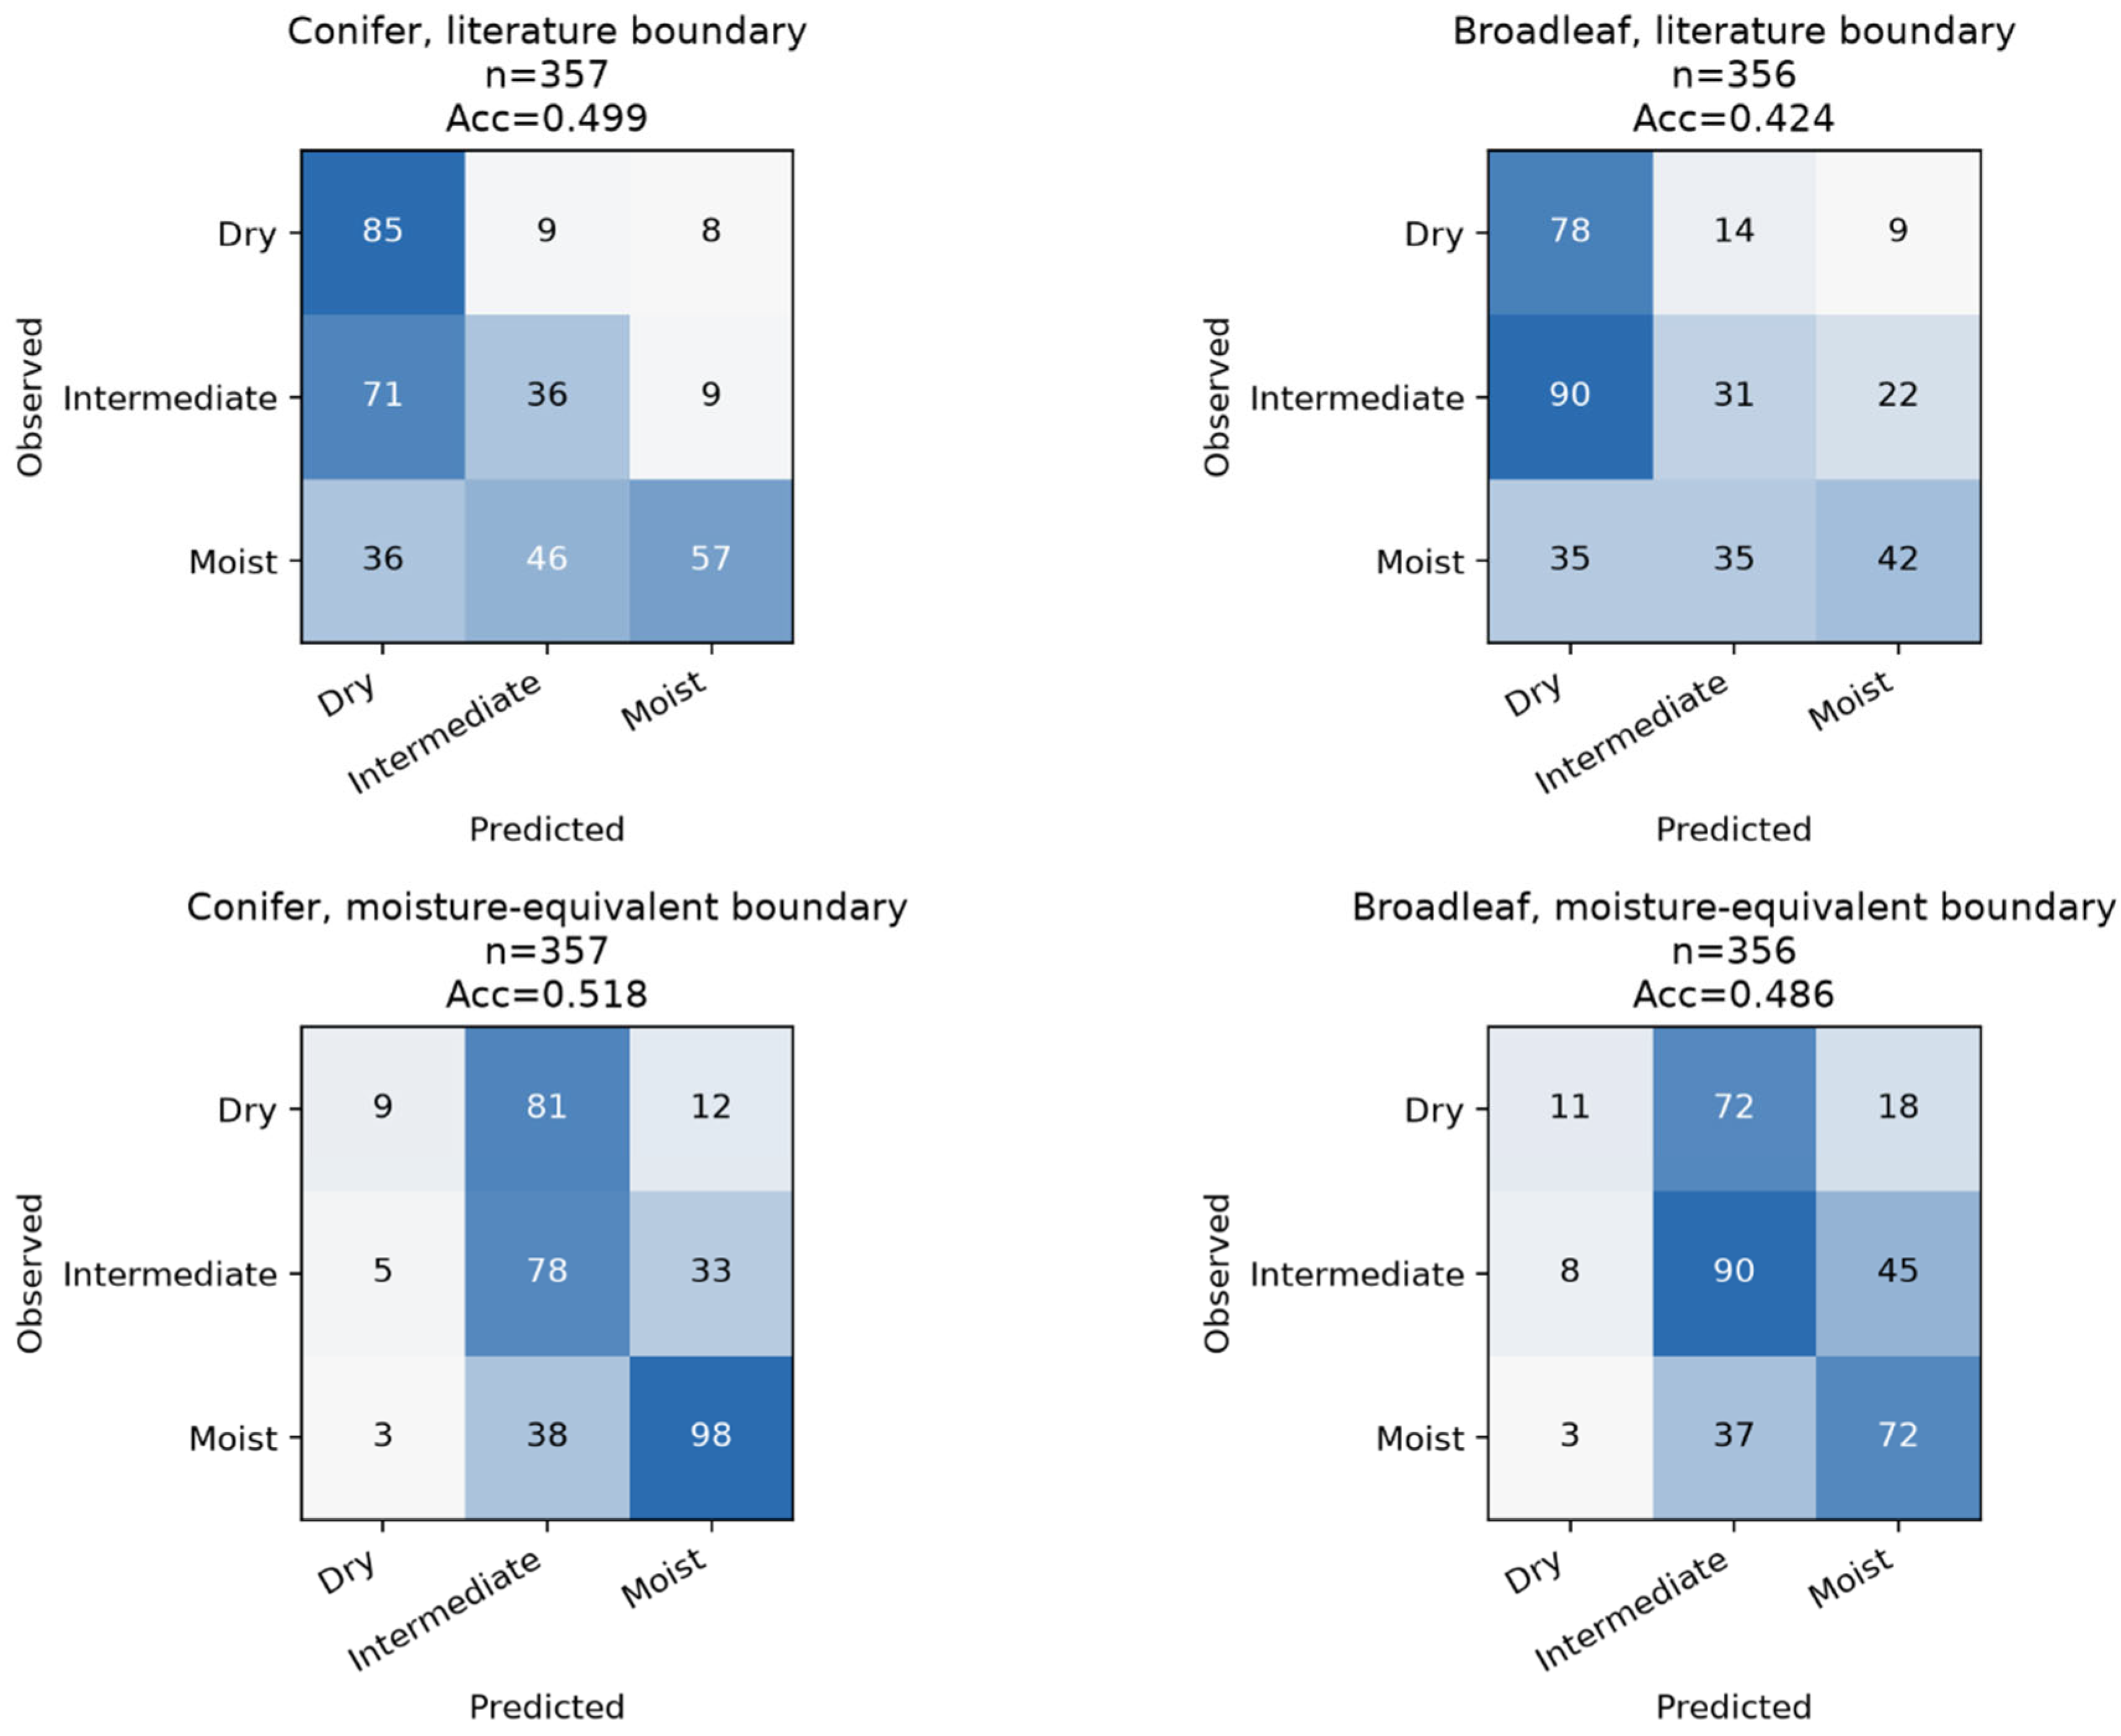
Under the physically based literature boundary (>85/75–85/≤75), agreement with the observed moisture classes was 49.9% for conifer and 42.4% for broadleaf (Cohen’s κ = 0.266 and 0.157, i.e., fair and slight agreement [25]; QWK 0.415 [0.272–0.517] and 0.322 [0.220–0.414]), with high Dry recall (0.833 and 0.772) but lower Dry precision (0.443 and 0.384) (Table 9). Because calculated FFMC was concentrated at the drier end of the scale during the study period, mostly between about 80 and 92 (Figure 4), this boundary captured 85 of 102 observed Dry cases for conifer and 78 of 101 for broadleaf, but it also assigned 107 conifer and 125 broadleaf observations from the Intermediate or Moist classes to Dry (Figure 5). Because the Dry cutpoint of this boundary (FFMC > 85) corresponds, via the FFMC moisture equation, to a moisture content of <16.3%—not the field Dry threshold of <10.5%—the a priori moisture-equivalent boundary (>90.3/84.2–90.3/≤84.2) was also evaluated. It achieved similar or slightly higher overall agreement (51.8% and 48.6%; κ = 0.260 and 0.195; QWK 0.421 [0.315–0.493] and 0.322 [0.231–0.411]), but its Dry recall fell to 0.088 and 0.109 because its stricter cutpoint rarely classified any day as Dry (Table 9).
Table 9.
Agreement of the two FFMC class boundaries with the observed moisture classes (n = 357 conifer, 356 broadleaf).
Figure 4.
Distribution of calculated FFMC (February–May 2026, all sites and forest types pooled; noon observations with a 24 h precipitation window ending at noon) relative to the literature class-boundary cutpoints (85: Dry/Intermediate; 75: Intermediate/Moist).
Figure 5.
Agreement between FFMC-derived classes and field moisture classes under the literature boundary (75/85) and the moisture-equivalent boundary (84.2/90.3). The literature boundary over-predicts Dry (high Dry recall, lower precision), whereas the moisture-equivalent boundary under-predicts Dry (Dry recall 0.09–0.11); neither boundary is uniformly superior (Section 3.4).
3.5. Moisture-Class Threshold Sensitivity
Shifting the Dry/Intermediate and Intermediate/Moist boundaries by ±1 percentage point, using equal-frequency terciles instead of the fire-occurrence-derived thresholds, or collapsing the target to a binary Dry/non-Dry class all left classification macro-F1 and QWK within a narrow band of the baseline result for both forest types (Supplementary Table S4). Grouped-SHAP rankings were also stable across these variants (Kendall’s τ = 0.87–1.0 relative to the baseline ranking, across all four alternative scenarios and both forest types).
4. Discussion
Under a time-blocked, leakage-controlled validation scheme, meteorological and soil predictors gave litter fuel-moisture classification performance that was consistently above two naive baselines but moderate in absolute terms (macro-F1 0.39–0.51 and QWK 0.20–0.47 across five classifiers and two forest types), and no classifier was statistically distinguishable from another. FFMC, a single physically based index requiring no model fitting, achieved QWK values (0.415 for conifer and 0.322 for broadleaf) within the range of the machine-learning classifiers, although it was evaluated on a slightly larger matched subset (357/356 vs. 337/340 observations), so this comparison is indicative rather than strictly like-for-like. Separate forest-type-specific predictive models showed no detectable advantage over a single pooled model, whether or not the pooled model was given forest-type information. The moderate exact-class performance is consistent with the intrinsic difficulty of predicting a field-measured, three-class target from weather alone within a single spring.
The time-blocked validation scheme is deliberately more conservative than unblocked random cross-validation: because weather is strongly autocorrelated from day to day and several predictors are explicit multi-day windows, random fold assignment risks placing near-duplicate information in both training and test folds within a single continuous season. We therefore regard the blocked estimates as the more trustworthy characterization of discriminative power, even though they are less favourable. Spatial transferability, assessed by LORO validation, was consistently weaker than the time-blocked performance and strongly region-dependent; at Seoul, even the majority-class baseline failed completely because that conifer plot was never observed in the Dry class during this season. Beyond such class-distribution effects, several factors plausibly contribute. First, the four regions differ in climatic setting—most notably the east-coastal Gangneung site, where sea breezes, sea fog, and the föhn-type Yangganjipung local wind produce moisture dynamics distinct from the inland sites [3,18]. Second, local stand structure, canopy cover, and litter composition modulate how the litter bed responds to the same regional weather, introducing site-specific offsets that a region-agnostic model cannot reproduce. Third, the per-region sample sizes are modest, so region-specific idiosyncrasies are not averaged out. These findings echo reports that dead-fuel-moisture models often lose accuracy when extrapolated to unseen sites [20,26], and they imply that operational deployment across Korea would benefit from either region-specific calibration or the inclusion of topographic and stand-structure covariates, rather than a single nationally pooled model. These results should therefore be read as a site-calibrated demonstration across four regions in one spring season, not as evidence of a nationally general operational model.
A formal, multiple-testing-corrected interaction test found that the meteorological responses of conifer and broadleaf litter were statistically distinguishable in only one of six predictor groups—soil state, specifically soil water content—while the other five, including the largest SHAP contributor (atmospheric dryness/humidity), showed no significant forest-type interaction. This finding should be read narrowly: it supports a forest-type-related difference concentrated in the soil-moisture domain, not a general claim that the two forest types follow fundamentally different meteorological pathways to the Dry class. Descriptive SHAP attribution and formal interaction inference answer different questions: a predictor group can rank prominently in attribution (as soil state does for both forest types) without that ranking establishing a forest-type-specific effect, and a narrow but genuine interaction does not imply that the predictor dominates overall prediction. Because conifer and broadleaf plots were established in close proximity within each region, the paired design reduced differences in regional weather; however, because dominant species and stand characteristics varied among sites (Table 1), the soil-state contrast cannot be attributed solely to the broad conifer–broadleaf distinction. Separately, the three-structure comparison found no measurable predictive advantage from either supplying forest type to a pooled model or training fully separate models; we therefore describe the detectable effect as a forest-type-related difference in attribution rather than a demonstrated predictive necessity.
Soil water content was the most important individual predictor by SHAP attribution for both forest types and the only variable domain with a significant forest-type interaction. A region-by-region check found the association in all four regions for broadleaf litter but in only two of four regions for conifer litter, so the broadleaf result should be treated as the more robust. The association was positive—higher soil water content accompanied a higher predicted probability of the Dry class—which runs counter to a simple wetting pathway from soil to litter. It is more consistent with seasonal covariation: for example, soils that remain wet after winter thaw can coincide with leafless-canopy, high-radiation conditions that dry the overlying litter rapidly in early spring. We therefore interpret soil-state variables cautiously: soil water content may act partly as a genuine moisture-exchange pathway between the forest floor and the litter layer, but it may also reflect site-, season-, or canopy-phenology-related covariates that correlate with litter moisture without being a direct causal driver. This caution is consistent with a prior finding that forest-type differences in litter moisture at comparable fire-danger levels are better explained by the litter layer and underlying soil than by site micrometeorology [27], and with a review identifying improved representation of soil moisture as a persistent gap in process-based dead-fuel-moisture models [14]. Distinguishing these mechanisms would require manipulative or multi-season work beyond the present single-season, four-region observational design; we present it as a hypothesis for future work rather than a demonstrated mechanism.
Removing both soil variables from the predictor set produced a small, metric- and forest-type-dependent change in performance. For conifer, accuracy, macro-F1, and QWK were essentially unchanged (all differences within 0.012) and Dry recall was identical; for broadleaf, removing soil variables slightly reduced accuracy, macro-F1, and QWK (by 0.009, 0.003, and 0.021, respectively) but improved Dry recall by 0.061. This mixed pattern indicates that the contribution of soil state to predictive accuracy, while real for broadleaf, is smaller and less one-directional than its SHAP attribution and interaction significance alone would suggest.
Measured litter fuel moisture was significantly correlated with FFMC for both forest types, and the Dry-class recall of the literature FFMC boundary exceeded that of every machine-learning classifier, at some cost to precision: FFMC tends to flag more days as Dry than are observed to be, whereas the classifiers are more conservative but miss more truly Dry days. The disagreement between the literature FFMC boundary and the observed litter-moisture classes may be partly explained by a quantified mismatch between the moisture contents represented by the two boundary systems: the Dry cutpoint of the boundary corresponds to a moisture content about 6 percentage points wetter than the field Dry threshold. An alternative boundary constructed to match the field thresholds exactly did not resolve this but produced the complementary failure (very low Dry recall), indicating that the two boundary systems make different, rather than simply better or worse, errors. We read this as evidence that direct transfer of an externally derived FFMC class boundary onto locally observed litter-moisture classes has limited validity, not as evidence against the value of FFMC as a fire-weather index: FFMC carried a clear, statistically significant relationship with measured litter moisture throughout this analysis. This distinction is consistent with a Portuguese case study in which correcting the FFMC moisture input against field measurements improved index values under dry conditions without significantly improving the prediction of fire occurrence or burned area, suggesting that the Fire Weather Index System was already reasonably robust to local fuel-moisture variation for that purpose [28]. Our finding should therefore be read as a class-boundary correspondence result, not as a claim that FFMC lacks operational value.
A forest-type difference in the FFMC–moisture relationship was only partially supported: the rank-based (Spearman) correlation difference between forest types was statistically distinguishable from zero, but a direct calibration-slope test controlling for region was not. This differs from stand-specific calibration work that found forest type, season, and stand density each significantly shape the FFMC–litter-moisture relationship [5]. The two designs differ—a pooled, region-controlled interaction test here versus stand-by-stand calibration there—in ways that could plausibly produce different sensitivity to a forest-type effect, so a forest-type-specific FFMC calibration is not established here as robustly as the rank-correlation result alone might suggest.
These results indicate that meteorological data can support discrimination of litter fuel-moisture classes under local, site-calibrated conditions, and that FFMC retains statistically meaningful value as a litter-moisture-related fire-weather indicator in this setting. Neither tool should be regarded as ready for national operational deployment without further validation: the spatial transferability of the classifiers was limited in this four-region, single-season dataset, and any operational threshold based on FFMC classes would need local calibration against field-observed moisture classes rather than direct adoption of an externally derived boundary. We suggest that meteorological classification and FFMC be treated as complementary sources of litter-moisture information—one flexible and multivariate, the other a single, physically interpretable, more Dry-sensitive index—rather than as competing alternatives.
This study has several limitations. First, observations were confined to a single spring season at four regions, which constrains both the temporal and spatial generalizability of every result, and it remains uncertain whether the patterns identified here persist across years with different spring weather conditions. Second, leave-one-region-out transferability was limited and strongly region-dependent, owing to small per-region sample sizes, differing class distributions, and differing inter-region relationships, and should not be read as evidence that these models generalize to other regions or seasons. Third, although the study was designed to compare conifer and broadleaf stands, the dominant species differed among regions within each forest type. Therefore, the observed differences cannot be attributed solely to the broad conifer–broadleaf distinction, as species-specific litter traits and stand characteristics may also have contributed; litter traits (e.g., specific surface area, bulk density, decomposition stage) and canopy phenology were not directly measured and could confound or mediate the meteorological and soil-state associations reported here. Fourth, the Korean reference values underlying the moisture classes are based on 10 h fuel sticks at fire-occurrence sites, leaving a scale difference from direct litter measurement; the classes are an empirical, operational classification rather than physical ignition thresholds and should not be conflated with ignition probability. Fifth, litter could not be sampled on rainy days, so the Moist class likely understates how wet litter becomes during the wettest, unsampled part of the season, and analysis-specific subsets differ in size from the full verified dataset because different analyses require different matched records, which concentrates some exclusions in specific regions and in the first study month. Finally, FFMC was computed with a specific input configuration (noon observations, a 24 h precipitation window, and station-level spin-up), and sensor exposure relative to the open-site conditions assumed by the standard FFMC was not independently verified.
Beyond these limitations, the approach offers several avenues for extension. Methodologically, the framework—field-measured litter moisture, meteorological and history-derived predictors, time-blocked validation, tree-based classification, and SHAP-based interpretation—is transferable to other temperate East Asian regions with comparable pine–oak forests and spring-peaked fire regimes, such as parts of China and Japan, where similar litter types and fire seasonality occur [7,29]. Future work should prioritize (i) accumulating multi-year observations across contrasting spring weather conditions to test interannual robustness; (ii) adding topographic and stand-structure covariates (elevation, aspect, canopy cover, litter load) to improve cross-region generalization; (iii) expanding the number of monitoring sites per region to stabilize region-specific estimates; (iv) coupling the classified moisture with fire-occurrence records to evaluate the classes against actual ignition and spread; and (v) multi-season soil and litter monitoring to test whether the soil-state association reflects a moisture-exchange pathway or seasonal covariation. Such extensions would move the present, single-season demonstration toward an operationally robust, site-calibrated fire-danger tool.
5. Conclusions
Meteorological and soil data provided moderate discrimination of litter fuel-moisture classes for both conifer and broadleaf stands under a time-blocked validation scheme, consistently above naive baselines, but performance declined under spatial transfer across the four study regions, indicating limited generalizability beyond the sites and season sampled. A forest-type-dependent meteorological response was detected only in the soil-moisture domain, and pooled and separate predictive models performed indistinguishably, so the present evidence does not indicate that forest-type-specific predictive modelling is necessary. FFMC remained significantly associated with measured litter moisture and was particularly sensitive to Dry conditions, but direct transfer of its externally derived class boundary onto locally observed Korean litter-moisture classes showed limited correspondence and should be locally recalibrated rather than adopted directly. Together, these findings support a site-calibrated approach to meteorological litter-moisture monitoring in which FFMC and meteorological classification are treated as complementary sources of information, while underscoring the need for multi-season and multi-region data before either tool is extended to broader operational use.
Supplementary Materials
The following supporting information can be downloaded at https://www.mdpi.com/article/10.3390/f17101253/s1, Table S1: Adjacent-class accuracy and extreme-misclassification rate by model and forest type (descriptive statistics only; not used as a headline metric—see Section 3.1). Adjacent-class accuracy is the proportion of predictions within one ordinal class of the observed class. Extreme misclassification is an observed Dry case predicted as Moist, or vice versa; “chance” gives the extreme-misclassification rate expected under random label permutation. n = 337 conifer/340 broadleaf (FFMC row: n = 337 conifer/339 broadleaf, matched FFMC readings only); Table S2: Full leave-one-region-out (LORO) performance by held-out region, model, and forest type (mean ranges summarized in Section 3.2; full detail here). “Majority baseline accuracy” is the accuracy of always predicting the training-fold majority class, evaluated on the held-out region—reported once per region/forest-type combination since it does not depend on the trained classifier; Table S3: Dry-class precision, recall, and F1 (95% CI) for the three model structures compared in Section 3.3/Table 2: A, pooled with no forest-type information; B, pooled with a forest-type indicator feature; C, separate models fitted per forest type. “Overall” pools conifer and broadleaf test predictions (n = 677); accuracy, macro-F1, and QWK for each row are given in the main text’s Table 2 and are not repeated here; Table S4: Classification performance under alternative definitions of the three-class moisture boundary, compared against this study’s baseline field thresholds (10.5%/17.2%; Section 2.2), using a single fixed random-forest configuration for all scenarios (Section 2.2; summarized in Section 3.5). Kendall’s τ gives the rank-order agreement of the six meteorological-group grouped-SHAP percentages (Section 2.6) under each alternative scenario against their baseline-scenario ranking (τ = 1 is perfect agreement); the baseline row is shown for reference and is trivially τ = 1 against itself.
Author Contributions
Conceptualization, S.A.; methodology, J.L.; validation, M.R.; formal analysis, S.H.; writing—original draft preparation, J.L.; writing—review and editing, S.A.; visualization, Y.-E.L. All authors have read and agreed to the published version of the manuscript.
Funding
This research was supported by the National Institute of Forest Science (Project No. FE0500-2025-02-2026).
Data Availability Statement
All data and code used in the analysis have been submitted through the SuSy system.
Conflicts of Interest
The authors declare no conflicts of interest.
References
- Burton, J.E.; Penman, T.D.; Filkov, A.I.; Cawson, J.G. Multi-Scale Investigation of Factors Influencing Moisture Thresholds for Litter Bed Flammability. Agric. For. Meteorol. 2023, 337, 109514. [Google Scholar] [CrossRef] [Scilit]
- Grootemaat, S.; Wright, I.J.; Van Bodegom, P.M.; Cornelissen, J.H.C.; Cornwell, W.K. Burn or Rot: Leaf Traits Explain Why Flammability and Decomposability Are Decoupled across Species. Funct. Ecol. 2015, 29, 1486–1497. [Google Scholar] [CrossRef] [Scilit]
- Kim, N.; Kwak, J.; Kim, M. Numerical Simulations of Large Forest Fires in the East Coastal Region of Korea Considering the Yangganjipung Local Wind. J. Korean Soc. Hazard Mitig. 2021, 21, 39–48. [Google Scholar] [CrossRef] [Scilit]
- van Wagner, C. Development and Structure of the Canadian Forest Fire Weather Index System; Canadian Forestry Service: Ottawa, ON, Canada, 1987. [Google Scholar]
- Wotton, B.M.; Beverly, J.L. Stand-Specific Litter Moisture Content Calibrations for the Canadian Fine Fuel Moisture Code. Int. J. Wildland Fire 2007, 16, 463–472. [Google Scholar] [CrossRef] [Scilit]
- Perello, N.; Trucchia, A.; D’Andrea, M.; Degli Esposti, S.; Fiorucci, P.; Gollini, A.; Negro, D. An Adaptable Dead Fuel Moisture Model for Various Fuel Types and Temporal Scales Tailored for Wildfire Danger Assessment. Environ. Model. Softw. 2025, 183, 106254. [Google Scholar] [CrossRef] [Scilit]
- Masinda, M.M.; Sun, L.; Wang, G.; Hu, T. Moisture Content Thresholds for Ignition and Rate of Fire Spread for Various Dead Fuels in Northeast Forest Ecosystems of China. J. For. Res. 2021, 32, 1147–1155. [Google Scholar] [CrossRef] [Scilit]
- Kreye, J.K.; Kane, J.M.; Varner, J.M. Multivariate Roles of Litter Traits on Moisture and Flammability of Temperate Northeastern North American Tree Species. Fire Ecol. 2023, 19, 21. [Google Scholar] [CrossRef] [Scilit]
- Yeom, C.H.; Lee, S.Y.; Park, H.S.; Won, M.S. A Comparative Analysis of Fuel Moisture Contents Variation by Pinus Densiflora and Quercus Variabilis Stick for Estimating Moisture Contents in Forest Fire Surface Fuel in the Spring. Crisisonomy 2016, 12, 59–67. [Google Scholar] [CrossRef] [Scilit]
- De Magalhães, R.Q.; Schwilk, D.W. Moisture Absorption and Drying Alter Nonadditive Litter Flammability in a Mixed Conifer Forest. J. Ecol. 2021, 109, 234–245. [Google Scholar] [CrossRef] [Scilit]
- Dimitrakopoulos, A.P.; Bemmerzouk, A.M.; Mitsopoulos, I.D. Evaluation of the Canadian Fire Weather Index System in an Eastern Mediterranean Environment. Meteorol. Appl. 2011, 18, 83–93. [Google Scholar] [CrossRef] [Scilit]
- Hanes, C.C.; Wotton, B.M.; McFayden, C.B.; Jurko, N. An Approach for Defining Physically Based Fire Weather Index System Classes for Ontario; Information Report GLC-X-29; Natural Resources Canada, Canadian Forest Service, Great Lakes Forestry Centre: Sault Ste. Marie, ON, Canada, 2021. [Google Scholar]
- Hou, X.; Wu, Z.; Zhu, S.; Li, Z.; Li, S. Comparative Analysis of Machine Learning-Based Predictive Models for Fine Dead Fuel Moisture of Subtropical Forest in China. Forests 2024, 15, 736. [Google Scholar] [CrossRef] [Scilit]
- Matthews, S. Dead Fuel Moisture Research: 1991–2012. Int. J. Wildland Fire 2014, 23, 78–92. [Google Scholar] [CrossRef] [Scilit]
- Viegas, D.X.; Viegas, M.; Ferreira, A.D. Moisture Content of Fine Forest Fuels and Fire Occurrence in Central Portugal. Int. J. Wildland Fire 1992, 2, 69–86. [Google Scholar] [CrossRef] [Scilit]
- Lee, H.; Won, M.S.; Yoon, S.H.; Jang, K.C. Modeling and Mapping Fuel Moisture Content Using Equilibrium Moisture Content Computed from Weather Data of the Automatic Mountain Meteorology Observation System (AMOS). J. Korean Assoc. Geogr. Inf. Stud. 2019, 22, 21–36. [Google Scholar]
- McCandless, T.C.; Kosovic, B.; Petzke, W. Enhancing Wildfire Spread Modelling by Building a Gridded Fuel Moisture Content Product with Machine Learning. Mach. Learn. Sci. Technol. 2020, 1, 035010. [Google Scholar] [CrossRef] [Scilit]
- Chae, S.; Kim, K.R.; Kang, J.H.; Jeong, H.-S.; Kim, S. Machine Learning–Based Analysis and Prediction of 10-h Dead Fuel Moisture Content Using Automated Weather Observations in Gangwon Province, South Korea. J. Appl. Meteorol. Climatol. 2025, 64, 1987–2004. [Google Scholar] [CrossRef] [Scilit]
- Lee, H.; Won, M.; Yoon, S.; Jang, K. Estimation of 10-Hour Fuel Moisture Content Using Meteorological Data: A Model Inter-Comparison Study. Forests 2020, 11, 982. [Google Scholar] [CrossRef] [Scilit]
- Shmuel, A.; Ziv, Y.; Heifetz, E. Machine-Learning-Based Evaluation of the Time-Lagged Effect of Meteorological Factors on 10-Hour Dead Fuel Moisture Content. For. Ecol. Manag. 2022, 505, 119897. [Google Scholar] [CrossRef] [Scilit]
- Alves, D.; Almeida, M.; Silva, P.; Ribeiro, L.M.; Novo, I.; Viegas, D.X. Field Measurement of Fine Fuels’ Moisture Content and Its Relation to Meteorology and Wildfire Activity in the Central Region of Portugal (2000-2024). J. Pyrogeography 2026, 2, 100008. [Google Scholar] [CrossRef] [Scilit]
- Schunk, C.; Leutner, C.; Leuchner, M.; Wastl, C.; Menzel, A. Equilibrium Moisture Content of Dead Fine Fuels of Selected Central European Tree Species. Int. J. Wildland Fire 2013, 22, 797–809. [Google Scholar] [CrossRef] [Scilit]
- Cawson, J.G.; Nyman, P.; Schunk, C.; Sheridan, G.J.; Duff, T.J.; Gibos, K.; Bovill, W.D.; Conedera, M.; Pezzatti, G.B.; Menzel, A. Estimation of Surface Dead Fine Fuel Moisture Using Automated Fuel Moisture Sticks across a Range of Forests Worldwide. Int. J. Wildland Fire 2020, 29, 548–559. [Google Scholar] [CrossRef] [Scilit]
- Lundberg, S.M.; Lee, S.-I. A Unified Approach to Interpreting Model Predictions. Adv. Neural Inf. Process. Syst. 2017, 30, 4765–4774. [Google Scholar]
- Landis, J.R.; Koch, G.G. The Measurement of Observer Agreement for Categorical Data. Biometrics 1977, 33, 159–174. [Google Scholar] [CrossRef] [Scilit]
- Crawford, A.J.; Belcher, C.M.; Morison, J.I.; Doerr, S.H.; Kettridge, N.; Clay, G.D. Fuel Moisture and Flammability of Leaf Litter in British Forest Plantations and Their Implications for Wildfire Risk. For. Int. J. For. Res. 2026, 99, cpaf029. [Google Scholar] [CrossRef] [Scilit]
- Schunk, C.; Wastl, C.; Leuchner, M.; Menzel, A. Fine Fuel Moisture for Site-and Species-Specific Fire Danger Assessment in Comparison to Fire Danger Indices. Agric. For. Meteorol. 2017, 234, 31–47. [Google Scholar] [CrossRef] [Scilit]
- Alves, D.; Almeida, M.; Reis, L.; Raposo, J.; Viegas, D.X. The Role of Field Measurements of Fine Dead Fuel Moisture Content in the Canadian Fire Weather Index System—A Study Case in the Central Region of Portugal. Forests 2024, 15, 1429. [Google Scholar] [CrossRef] [Scilit]
- Sun, C.; Touge, Y.; Shi, K.; Tanaka, K. Assessment of the Suitability of Drought Descriptions for Wildfires under Various Humid Temperate Climates in Japan. Sci. Rep. 2024, 14, 23759. [Google Scholar] [CrossRef] [Scilit] [PubMed]

Disclaimer/Publisher’s Note: The statements, opinions and data contained in all publications are solely those of the individual author(s) and contributor(s) and not of MDPI and/or the editor(s). MDPI and/or the editor(s) disclaim responsibility for any injury to people or property resulting from any ideas, methods, instructions or products referred to in the content. |
© 2026 by the authors. Licensee MDPI, Basel, Switzerland. This article is an open access article distributed under the terms and conditions of the Creative Commons Attribution (CC BY) license.