


Abstract
This study developed and validated hour-scale models for predicting surface fine dead fuel moisture content (FMC) during the first 24 h after rainfall across four land-cover types in the Qipanshan region, Northeast China. It further examined differences in moisture retention among fuelbeds, the ability of weighted least squares (WLS) to address heteroscedasticity relative to ordinary least squares (OLS), and the influence of canopy closure on the dominant controls of post-rainfall drying. Simulated rainfall of 9, 20, 40, and 70 mm was applied to 219 quadrats in Betula platyphylla Sukaczev, Larix gmelinii (Rupr.) Kuzen., and Pinus sylvestris var. Mongolica Litv. stands and on cutover land during autumn 2022 and spring 2024. FMC was monitored for 24 h together with 10-min microclimatic observations. Box–Cox transformation, all-subsets regression, OLS/WLS comparison, Breusch–Pagan tests, AIC, and relative-importance analysis were used. Drying exhibited a two-phase pattern, with rapid early moisture loss followed by marked attenuation, while moisture gain changed little above 40 mm rainfall. B. platyphylla had the highest peak and residual FMC, whereas cutover land had the lowest. WLS stabilized residual variance in all 12 models (Breusch–Pagan p = 0.40–0.99) and yielded lower AIC values than OLS. The models explained 50.3–95.8% of FMC variance. Beneath closed canopies, drying duration, initial FMC, and rainfall depth were the principal controls, whereas air temperature and wind speed were more influential on cutover land. These findings provide a quantitative basis for hour-scale assessment of post-rainfall fuel dryness and potential ignitability.
1. Introduction
Forest fire is a major disturbance with far-reaching consequences for ecosystem structure, carbon cycling, biodiversity, and human safety. Fire occurrence and subsequent spread emerge from interactions among ignition sources, combustible fuels, and environmental conditions conducive to combustion [1]. In China, many documented forest-fire ignitions are associated with human activities, whereas lightning remains an important natural ignition source in boreal forests [2]. These patterns underscore that effective fire prevention requires not only ignition-source management but also continuous assessment of fuel conditions that determine whether an ignition can develop into a sustained and spreading fire [3].
Severe fire events in Northeast China further illustrate the interplay among ignition sources, dry fuels, and meteorological forcing. Historical fires in the Great Khingan Mountains and the 2019 Qipanshan fire show that, once surface fuels become sufficiently dry, wind and other atmospheric conditions can strongly modulate fire development. These events are cited solely to provide regional context; the present experiment addresses post-rainfall fuel-moisture dynamics rather than reconstructing the causes or behavior of individual fires [4].
Combustible material within forests is vertically stratified and functionally heterogeneous. Surface fuels encompass fallen leaves, conifer needles, dead grasses, litter, fine woody debris, and small twigs lying on or immediately above the forest floor [5]. Among these components, fine fuels have high surface-area-to-volume ratios and consequently lose moisture rapidly, ignite readily when dry, and are consumed quickly after ignition [6]. Duff and partially decomposed organic matter respond more slowly to atmospheric change but can sustain smoldering combustion, whereas shrubs, tree regeneration, and low branches can act as ladder fuels that facilitate vertical fire transfer from the forest floor into the canopy [6]. Canopy fuels then become increasingly important in the development and propagation of crown fires. Within this fuel continuum, the moisture status of surface fine dead fuels is particularly relevant to the short-term likelihood of ignition and initial surface-fire spread [7]. The present study therefore focuses on this rapidly responding fuel component rather than on live fuels or coarse woody fuels. Consistent with official wildland-fire terminology, grasses, leaves, needles, and small twigs are likewise recognized as rapidly drying fine fuels that ignite readily when dry [8].
Fuel moisture content (FMC) constitutes a key mechanistic link between weather conditions and fuel flammability [9,10]. Before dead fuel can sustain combustion, retained water must absorb substantial energy and evaporate; consequently, higher FMC generally reduces ignition probability and slows fire development, whereas progressive drying increases flammability [11]. Because dead fine fuels lack physiological regulation of water status, their moisture responds directly to atmospheric exchange. Relative humidity governs the equilibrium toward which dead fuels adsorb or desorb water, air temperature modifies atmospheric evaporative demand, and wind strengthens turbulent heat and mass transfer [12]. Rainfall temporarily elevates FMC, after which continued drying progressively restores fuel availability [13]. These exchanges are strongly nonlinear, particularly when fuels are initially wetted above the fiber-saturation range [14]. Accordingly, previous studies of forest litter have described distinct or multi-phase drying behavior rather than a single constant-rate process [4,15,16].
Canopy structure further modulates these coupled processes. Forest canopies attenuate incoming shortwave radiation, reduce understory wind speed, increase atmospheric humidity, and dampen daily temperature fluctuations, thereby lowering the atmospheric demand for evaporation from surface fuels. Yet canopy cover can also intercept rainfall, reducing the amount of precipitation that reaches the forest floor as throughfall [17]. Canopy effects on fuel moisture are therefore inherently bidirectional: shelter may delay post-rainfall drying, whereas interception may reduce the initial water input to the fuelbed [18]. The balance between these effects depends on canopy structure, rainfall amount and duration, antecedent fuel moisture, fuelbed properties, and post-rainfall meteorological conditions [19]. Importantly, the simulated-rainfall design used here applies known amounts of water directly to the surface fuelbed. This design standardizes water input and allows the post-wetting sheltering effects of different stand environments to be evaluated separately from natural canopy interception [5,12].
The expected qualitative directions through which these variables influence short-term fire danger are summarized in Table 1. These relationships should not be interpreted as universal quantitative thresholds, because fire behavior also depends on ignition characteristics, fuel load and continuity, topography, vegetation type, and interactions among meteorological variables.
Table 1.
Generalized relationships between fuel/environmental factors and short-term forest-fire danger.
Operational approaches for evaluating these processes have evolved substantially. Historically, forest-fire surveillance relied primarily on ground patrols, watchtowers, visual smoke detection, and direct meteorological observations [17]. Although such approaches can identify an existing fire, they provide limited quantitative insight into how rapidly fire danger changes before ignition. Weather-based fire-danger rating systems subsequently offered a standardized framework for integrating weather and fuel conditions [23,26]. The U.S. National Fire Danger Rating System (NFDRS), first implemented in 1972 and subsequently revised, uses weather, fuel, and fire-occurrence information to support operational preparedness and fire management [32]. The Canadian Forest Fire Danger Rating System (CFFDRS), including its Fire Weather Index framework, similarly integrates temperature, relative humidity, wind, and precipitation to estimate fuel-moisture conditions and potential fire behavior [33,34]. These systems are standardized, operationally efficient, and well suited to regional preparedness and resource allocation; however, conventional implementations rely on generalized fuel representations and may not fully resolve rapid microclimatic variability within structurally heterogeneous forest stands [25]. Recent developments in the Canadian system exemplify the broader transition toward finer temporal resolution by incorporating hourly meteorological information into fire-weather calculations [17,21,29].
More recently, remote sensing, automated weather stations, numerical modeling, and machine-learning approaches have broadened the toolkit available for fire-danger prediction [35]. Satellite observations provide repeated spatial coverage and are particularly valuable for regional monitoring, but estimates of surface fuel conditions can be constrained by cloud cover, revisit interval, canopy obstruction, sensor resolution, and the indirect relationship between spectral signals and the moisture status of fuels beneath the canopy [36,37]. Machine-learning models can capture complex, nonlinear interactions among meteorological and vegetation variables and may achieve high predictive accuracy when sufficiently large training datasets are available [38,39]. Their performance, however, depends strongly on data quality and representativeness, and extrapolation to new ecosystems or weather regimes can be difficult; physical interpretability may also be limited. Process-based fuel-moisture models provide stronger mechanistic representations of energy and water exchange but require detailed meteorological and fuelbed inputs that are seldom available at operational monitoring sites [27,29,40]. Semi-empirical equilibrium moisture content and time-lag formulations require fewer inputs but may inadequately represent fuels immediately after substantial wetting, when FMC can greatly exceed conventional equilibrium ranges [15,31,41]. Empirical regression models therefore remain operationally useful because they link measurable meteorological and fuel variables directly to FMC and can be implemented readily at the stand scale [2,7,32,42,43].
Forest management introduces a further layer of complexity because interventions alter both the quantity of combustible material and the microclimate that regulates its moisture [33,44,45]. Mechanical thinning, surface-fuel removal, prescribed burning, and combinations of these treatments can reduce fuel load and continuity under many conditions [31,34]. Conversely, opening the canopy may increase solar exposure and wind penetration, while residual slash can temporarily increase the availability of fine fuels. Effective management therefore requires joint consideration of fuel quantity and treatment-associated changes in fuel moisture and understory microclimate [4,8,13].
An important limitation of some empirical FMC formulations is the pooling of observations from dry and recently wetted fuels within a single relationship, even though post-rainfall drying can involve drainage, evaporation of free surface water, and progressively slower desorption of more strongly retained water [7,13,14,31]. Modern process-based, VPD-based, and fuel-specific approaches can capture aspects of this behavior, but their data requirements and transferability differ among applications. Models calibrated primarily under rain-free conditions may therefore be less responsive to rapid changes during the first several hours after substantial wetting [12]. This interval is operationally important because surface fuels can transition rapidly from very wet toward progressively drier states [15]. Accordingly, the present study focuses on hourly post-rainfall FMC trajectories and interprets them as indicators of fuel dryness and potential ignitability, rather than as direct measures of fire danger or a universal ignition threshold [23].
These data also pose a distinct statistical challenge. FMC observations spanning very wet to relatively dry states frequently exhibit non-normal distributions and non-constant residual variance. Under such conditions, ordinary least squares (OLS) regression may yield inefficient parameter estimates and unreliable uncertainty estimates because observations with markedly different error variances receive equal weight. Transforming the response can improve distributional properties, whereas weighted least squares (WLS) can explicitly accommodate heteroscedasticity by weighting observations inversely to their error variance. Despite the operational relevance of this issue, relatively few stand-specific studies have directly compared OLS and WLS parameterization for hourly post-rainfall FMC prediction across contrasting canopy environments.
Three interrelated knowledge gaps therefore remain. First, the magnitude and temporal evolution of post-rainfall moisture retention have not been quantified consistently across broadleaved, coniferous, and canopy-cleared fuelbeds under standardized wetting conditions. Second, the degree to which heteroscedasticity affects hourly post-rainfall FMC regressions, and whether WLS provides a systematic improvement over OLS, has not been explicitly tested. Third, canopy-mediated shifts in the relative contributions of antecedent wetting conditions, elapsed drying time, temperature, relative humidity, and wind remain insufficiently resolved. In particular, immediate atmospheric forcing may exert greater influence on open cutover land than beneath forest canopies, whereas initial water loading and elapsed drying time may retain greater explanatory importance within sheltered fuelbeds.
To address these gaps, the present study examines the first 24 h of post-rainfall drying across four representative land-cover types in the Qipanshan region of Northeast China: Betula platyphylla forest, Larix gmelinii plantation, Pinus sylvestris var. mongolica plantation, and open cutover land. Simulated rainfall treatments of 9, 20, 40, and 70 mm were combined with repeated FMC measurements and high-frequency microclimatic monitoring. Specifically, the study aimed to: (1) characterize post-rainfall FMC trajectories and differences in water retention among the four fuelbeds; (2) develop hourly empirical FMC models and compare OLS and WLS parameterization with respect to residual variance and model performance; and (3) quantify how the relative contributions of rainfall depth, initial FMC, drying duration, air temperature, relative humidity, and wind speed differ between forested and open environments.
These objectives were evaluated against one overarching and two auxiliary hypotheses. The overarching hypothesis was that post-rainfall surface dead-fuel moisture dynamics reflect the interaction between the initial wetting state and stand-associated atmospheric drying conditions. The first auxiliary hypothesis predicted that closed-canopy fuelbeds would maintain higher FMC after rainfall, whereas temperature and wind would assume greater relative importance at the open cutover site. The second predicted that explicitly accounting for heteroscedasticity with WLS would improve residual stability relative to OLS and, where supported by cross-validation, retain useful out-of-sample predictive performance. These hypotheses are framed as stand/site associations because species identity, canopy structure, fuelbed properties, and site location were not independently crossed in the experimental design.
2. Materials and Methods
2.1. Overview of Physical Geography
The study area is located in Shenyang City, Liaoning Province, in southern Northeast China and central Liaoning Province. Shenyang is situated at the southern margin of the Changbai Mountain region and is geographically connected to the Liaodong Peninsula. The city extends approximately from 41°48′11.75″ N, 123°25′31.18″ E and covers a total area of 1.286 × 10⁴ km2. The specific study area is located in the Qipanshan region of Hunnan District, Shenyang City, at approximately 41°51′–41°53′ N and 123°36′–123°39′ E. The geographic coordinates of the four study sites were as follows: B. platyphylla, 41°52′42″ N, 123°38′15″ E; L. gmelinii, 41°52′11″ N, 123°37′26″ E; P. sylvestris var. mongolica, 41°53′05″ N, 123°36′48″ E; and the cutover land, 41°51′56″ N, 123°39′03″ E (Figure 1a–c). The sites ranged from 178 to 199 m elevation, were located on south-facing slopes, and differed in canopy closure (0.8, 0.8, 0.5, and open, respectively; Table 2). The regional climate is temperate and semi-humid continental monsoon, with long-term annual precipitation concentrated in summer [46,47]. Campaign-specific air temperature, relative humidity, and wind speed are reported separately so that the conditions directly relevant to post-rainfall drying can be distinguished from regional climatological averages.
Figure 1.
Geographic location of the study area and spatial distribution of the experimental plots. (a) Location of Liaoning Province in China; (b) topography derived from a Digital Elevation Model (DEM) and the location of the study area in Shenyang City, Liaoning Province; and (c) satellite imagery showing the spatial distribution of the four experimental plots in the Qipanshan area, the geographic coordinates of the experimental plots were 41°52′42″ N, 123°38′15″ E for Betula platyphylla; 41°52′11″ N, 123°37′26″ E for Larix gmelinii; 41°53′05″ N, 123°36′48″ E for Pinus sylvestris var. mongolica; and 41°51′56″ N, 123°39′03″ E for the cutover land.
Table 2.
Stand and site characteristics of the four experimental sites.
The experiments were scheduled to overlap the regional forest-fire-prevention season rather than the summer rainy season. In Liaoning Province, the official forest-fire-prevention period extends from 1 October to 31 May of the following year, and Shenyang identifies 15 March–15 May as a spring high-fire-risk period. The autumn 2022 campaign (September–October) therefore covered the transition into the official prevention period, whereas the spring 2024 campaign (April–May) occurred within the locally defined high-risk period. Because season and year are confounded in this design, the two campaigns are treated as contrasting observation campaigns rather than as replicated estimates of a general seasonal effect.
2.2. Plot Selection
Four surface-fuel conditions representative of the study area were sampled on south-facing slopes: B. platyphylla, L. gmelinii, and P. sylvestris var. mongolica stands, together with an open cutover site formerly stocked with P. sylvestris var. mongolica and B. platyphylla. Thirteen plot areas were delineated within the four contiguous sites. Representative stand conditions and the field sampling setup are shown in Figure 1. Plot dimensions differed among sites because of local accessibility and the continuity of the surface fuel layer; site and stand attributes are summarized in Table 2.
Due to local site accessibility and fuel continuity constraints, each land-cover type was represented by a single contiguous sampling site, which structurally confounded stand type with spatial location. Consequently, sampling quadrats within each site were treated as spatial pseudoreplicates at the site scale rather than independent regional stand replicates. Extrapolations of these models to broader regional forest types should therefore be interpreted with appropriate caution.
2.3. Characterization of the Surface Fine Dead Fuelbeds
The experimental material consisted of naturally occurring surface fine dead fuels located on the forest floor within each experimental site. These fuels consisted predominantly of fallen leaves, needles, and fine dead twigs. Fuelbed composition differed among the four sites according to the locally accumulated surface litter and ground-cover conditions.
Before simulated rainfall was applied, fuel load, fuelbed-layer thickness, and pre-treatment FMC were measured for each experimental quadrat. Fuel load was expressed as oven-dry mass per unit ground area. Fuelbed depth was measured in situ at multiple points within each quadrat and averaged to represent the local litter-layer depth; because the original field sheets did not retain a separate count of depth-probe positions for every quadrat, no unsupported fixed number is reported here (Table 3).
Table 3.
In situ characteristics of the surface fine dead fuelbeds used in the simulated-rainfall experiment.
To explicitly characterize the actual objects of study and ensure the generalizability of our findings to real-world forest floor conditions, comprehensive physical and hydrological properties of the surface dead fuel beds were quantified across the four land-cover types prior to and immediately following the simulated rainfall experiments (summarized in Table 4). The surface fuel layers across the study sites consisted predominantly of shed leaves, needles, and fine woody twigs, exhibiting pronounced structural divergence among stand types. Specifically, the B. platyphylla broadleaf forest formed a relatively thin (2.5 ± 0.4 cm) yet highly compacted and stratified litter bed with a high dry bulk density (85.0 ± 12.0 kg·m−3) and a lower inter-particle porosity (42.5%), yielding a substantial pre-treatment fuel load of 2.12 ± 0.35 kg·m−2. This dense structural configuration fostered an extensive capillary network capable of holding large amounts of water, resulting in the highest maximum post-wetting fuel moisture content (186.87 ± 14.25%) and maximum retained water depth (16.8 ± 2.1 mm). In contrast, the coniferous stands (L. gmelinii and P. sylvestris var. mongolica) generated looser, deeper (3.8 ± 0.6 cm and 4.5 ± 0.7 cm, respectively), and more porous (62.1% and 68.%) fuel beds composed of slender needles, accompanied by lower dry bulk densities (35.0–42.0 kg·m−3) and moderate peak moisture retention capacities (128.90–130.31%). The cutover land, characterized by a fragmented and discontinuous mixture of logging slash and dead grasses, exhibited the shallowest fuel bed (1.8 ± 0.5 cm) and the lowest fuel load (0.98 ± 0.18 kg·m−2), showing a lower peak post-wetting FMC (105.40 ± 9.20%) and reduced water retention (8.2 ± 1.3 mm) due to its direct exposure and loose structure. These in-situ structural metrics directly dictate the varying capillary retention, drainage behavior, and boundary-layer coupling observed across the study sites, thereby establishing a robust physical basis for the stand-specific post-rainfall drying models.
Table 4.
Statistical table of sampling points across different simulated rainfall gradients.
The measured fuelbed and site variables included fuel load, fuelbed depth, dry bulk density, porosity, pre-treatment FMC, maximum post-wetting FMC, maximum retained water, canopy closure, and local microclimatic conditions (air temperature, relative humidity, and wind speed). Fuel load and depth were measured at the quadrat scale, while canopy closure was characterized at the stand/site scale. Vapor pressure deficit (VPD) was derived from recorded air temperature and relative humidity for benchmark comparison. Particle orientation, litter decay stage, degree of soil contact, throughfall, and incident solar radiation were not quantified as independent predictors. Simulated rainfall was applied directly to the surface fuelbed; therefore, the experiment standardizes water input and does not quantify natural canopy interception. Canopy-related interpretations in this paper consequently refer to post-wetting shelter and the composite stand/site environment rather than to throughfall processes.
2.4. Field Sampling and Simulated Rainfall Experiment
Field sampling was conducted during two campaigns associated with the principal forest-fire-prevention periods of the region: an autumn campaign spanning the transition into the official fire-prevention period (September–October 2022) and a spring campaign conducted during the high-fire-risk period (April–May 2024). In Liaoning Province, the official forest fire-prevention period extends from 1 October to 31 May of the following year. In Shenyang, where the study area is located, the spring high-fire-risk period extends from 15 March to 15 May. Thus, the spring 2024 campaign was conducted within the locally defined high-fire-risk period, whereas the autumn 2022 campaign covered the transition into and the beginning of the official fire-prevention period. Four experimental sites representing distinct surface fuel types were established: B. platyphylla, L. gmelinii, and P. sylvestris var. mongolica stands, alongside a cutover site. Because each fuel type was represented by a single contiguous plot. Consequently, these units were treated as four distinct sites, and generalizations to the broader fuel types should be made with appropriate caution. Similarly, sampling season was confounded with sampling year; thus, the two campaigns were not evaluated as a direct seasonal contrast [46,48].
The number of sampling points per site was determined based on a preliminary survey conducted in May 2021 (n = 10 randomly located points per site). The coefficients of variation (CV) for surface dead fuel load were 38.5% for B. platyphylla, 47.2% for L. gmelinii, 38.5% for P. sylvestris var. mongolica, and 17.3% for the cutover site. The required sample size for each site was estimated using the standard normal approximation at a 95% confidence level, with the allowable relative error set at 10% of the mean. This procedure yielded minimum sample sizes of 57, 86, 57, and 12 sampling points, respectively. In the field campaign, 59, 89, 59, and 12 sampling points were ultimately established, giving a total of 219 sampling points. The achieved relative error was approximately 9.8% across all sites.
Ultimately, 59, 89, 59, and 12 points were established (n = 219 in total; Table 4). Based on the pilot CV values, the achieved relative error was approximately 9.8% across all sites. Two methodological caveats should be noted: the pilot CV was derived from a limited sample (n = 10) in a single spring season, and it reflects fuel load variability rather than fuel moisture content. Thus, it directly constrains the precision of fuel load estimates while constraining fuel moisture content estimates only indirectly [28].
Within each site, sampling points were located at least 10 m apart at positions where the surface dead fuel layer was continuous and evenly distributed. This targeted placement was adopted so that experimental units were comparable across rainfall treatments rather than dominated by gaps in the fuel bed. The four rainfall depths were assigned to points randomly within each site, stratified by slope position, yielding the spatial allocation summarized in Table 3 (219 points in total). At the cutover site, each rainfall depth was replicated three times (n = 3 per depth, totaling 12 points); accordingly, results for this site are interpreted with appropriate caution, and it is excluded from statistical analyses that require within-cell variance estimates.
At each sampling point, a 10 cm × 10 cm quadrat (100 cm2) was delineated. Surface dead fuels in the study area consisted predominantly of leaf litter, conifer needles, and fine twigs. Fine surface dead fuels primarily comprised discrete fallen leaves or leaf fragments, individual conifer needles, and fine dead twig segments; hereafter, each physically separable leaf, needle, leaf fragment, or twig segment is referred to as a “fuel particle.” However, the quadrats contained naturally aggregated mixtures of leaves/needles and fine dead twigs rather than standardized individual fuel particles. For each quadrat, the pre-treatment fuel load, fuel-bed depth, and initial fuel moisture content were measured. Although the 100 cm2 micro-quadrats remained sensitive to small-scale spatial heterogeneity in fuel-bed depth and moisture, this limitation was mitigated through spatial replication across 219 sampling points, four study sites, and three topographic slope positions, and was considered when interpreting the results [6,33]. The sampled ground area was fixed at 100 cm2, whereas the sample volume was not fixed because natural fuel-bed thickness varied among quadrats. Accordingly, the in situ sample volume was calculated as (V = A × d), where (A = 0.01) m2 and (d) represents the measured fuel-bed depth of each quadrat. To minimize disturbance to the natural fuelbed, each sample was returned immediately to its original marked quadrat after weighing. The original fuelbed footprint and measured layer thickness were maintained, with care taken to preserve the original orientation and packing of the litter. No fuel material was added to or removed from the quadrats during the 24-h observation period.
Simulated rainfall was applied using a graduated perforated container fitted with 40 perforations (0.8 mm diameter), held 30 cm above the fuel surface and moved steadily across the quadrat. A vertical rim guard was fitted around the quadrat to confine applied water and prevent splash loss. Application uniformity was pre-calibrated in the laboratory, achieving a Christiansen’s Uniformity Coefficient (CU) of 88.5%. Four rainfall depths were tested–9, 20, 40, and 70 mm corresponding to applied water volumes of 90, 200, 400, and 700 mL over the 100 cm2 area, respectively. An unwetted control (0 mm) was maintained at each site to isolate ambient wetting and drying trends during the observation period. Water was applied over a continuous 3-h duration, yielding nominal rainfall intensities of 3.0, 6.7, 13.3, and 23.3 mm·h−1, respectively.
The four simulated depths correspond to the light, moderate, heavy, and torrential rainfall categories defined by the Chinese National Standard for precipitation grades (GB/T 28592-2012; Grade of Precipitation. Standards Press of China: Beijing, China, 2012.; 24-h totals of 0.1–9.9, 10.0–24.9, 25.0–49.9, and 50.0–99.9 mm, respectively) [30]. The 9–40 mm depths encompass the range of daily rainfall recorded during local fire-prevention seasons between 2012 and 2022 (Data source: China Meteorological Data Service Centre), whereas the 70 mm depth represents an extreme, upper-bound scenario beyond the historical daily record. By extending the application duration to 3 h, the resulting application rates (3.0–23.3 mm·h−1) fell within the realistic intensity range of natural rainfall events of comparable depths, thereby providing an ecologically realistic representation of fuel wetting dynamics during prolonged rainfall [26,27].
The highest simulated precipitation rate (23.3 mm·h−1 for the 70 mm depth) was implemented intentionally as an extreme physical stress test to identify the fuelbed saturation ceiling and maximum water-holding capacity, rather than to represent typical low-intensity regional rain events. Additionally, due to high spatial heterogeneity and fuelbed fragmentation on cutover land, sampling was constrained to 12 quadrats (n = 3 per depth); this site is thus evaluated as an exploratory comparative baseline.
Following completion of the simulated rainfall treatment, the initial wet mass (WH) of each surface dead-fuel sample was measured immediately. The same samples were subsequently weighed at 2, 4, 6, 8, 10, 12, and 24 h after rainfall using an electronic balance (Model BSA224S, Sartorius, Goettingen, Germany; readability: 0.1 mg; accuracy: ± 0.2 mg). After the final measurement, samples were oven-dried at 105 ± 2 °C for 24 h using a forced-air drying oven (Model DHG-9070A, Shanghai Yiheng Scientific Instrument Co., Ltd., Shanghai, China; temperature accuracy: ±1 °C), following the standard oven-drying procedure for biomass and fuel-moisture determination (GB/T standard protocols). Drying was continued until constant mass was achieved (defined as a mass change of less than 0.001 g between two consecutive weighings 2 h apart). The oven-dry mass (WD) was then determined using an analytical balance (Model BSA224S, Sartorius, Goettingen, Germany; readability: 0.1 mg; accuracy: ±0.2 mg). Fuel moisture content (M) was expressed on an oven-dry mass basis and calculated as:
where M represents the fuel moisture content (%); WH denotes the wet weight of fuel (g); and WD stands for the dry weight of fuel (g).
2.5. Microclimatic Variables
Microclimatic variables including air temperature (t, °C), relative humidity (h, %), and wind speed (w, m·s−1) were monitored 1.0 m above the ground at the sampling sites using a portable weather station (Kestrel 4500, Nielsen-Kellerman, Boothwyn, PA, USA) logging at 10-min intervals during and after water application. Monitoring was conducted across two fire-prevention seasons: autumn 2022 (September–October) and spring 2024 (April–May). The ambient conditions (t, h, and w) recorded during each experimental run are summarized in Table 5.
Table 5.
Microclimatic conditions (t, h, w) recorded during the simulated rainfall experiments, categorized by fuel type and rainfall depth across two fire-prevention seasons.
Microclimatic conditions (t, h, w) exhibited pronounced spatial and temporal variations across seasons and fuel types. Temporally, the spring season (April–May 2024) presented a substantially higher evaporative demand than the autumn season (September–October 2022), characterized by higher mean air temperatures (t), markedly lower relative humidity (h), and stronger wind speeds (w) across all sites (p < 0.05). Spatially, microclimatic parameters were primarily structured by canopy closure and site openness. Cutover land, lacking canopy shelter, experienced the most extreme microclimate with the highest t and w alongside the lowest h. Among the forested sites, the conifer stands (P. sylvestris var. mongolica and L. gmelinii) exhibited higher temperatures and wind speeds than the broadleaf stand (B. platyphylla), with P. sylvestris var. mongolica showing slightly greater wind exposure due to its sparser canopy structure. Overall, microclimatic evaporative demand followed a clear gradient of Cutover land > P. sylvestris var. mongolica > L. gmelinii > B. platyphylla and was consistently greater in spring than in autumn, providing a key environmental driver for the seasonal and stand-level variations in post-rainfall fuel drying dynamics.
2.6. Statistical Analysis of Rainfall and Drying Effects
To statistically evaluate the observed drying transitions, repeated FMC measurements were analyzed using a linear mixed-effects model with time, rainfall treatment, and their interaction as fixed effects and sampling quadrat as a random intercept. Time was treated as a categorical variable because the drying trajectory was nonlinear. In addition, average drying rates were calculated separately for the early and late drying periods. For the forested sites, the early and late periods were defined as 0–6 h and 6–24 h, respectively; for the cutover site, they were defined as 0–12 h and 12–24 h. Differences between early- and late-period drying rates were reported with 95% confidence intervals.
To statistically evaluate the effects of drying time and rainfall treatment on fuel moisture content (FMC), repeated measurements were analyzed using a linear mixed-effects model:
where Time was treated as a categorical fixed effect, p was included as a four-level fixed factor (9, 20, 40, and 70 mm), and their interaction was used to test whether temporal drying trajectories differed among rainfall treatments. Quadrat was included as a random intercept to account for repeated FMC measurements from the same experimental unit. To remain consistent with the stand-specific modeling framework used elsewhere in this study, the mixed-effects analyses were conducted separately for each stand type and sampling campaign.
To further evaluate the apparent plateau in FMC response at the higher rainfall treatments, a planned contrast was conducted between the 40- and 70-mm rainfall levels based on the fitted mixed-effects model. The null hypothesis was that FMC did not differ between the two treatments (H0: FMC40 = FMC70). The contrast was defined as the estimated marginal mean difference between the 70- and 40-mm treatments (FMC70 − FMC40). This comparison was performed at each observation time, and, where appropriate, over the overall post-rainfall observation period. For each contrast, the estimated mean difference, 95% confidence interval, and multiplicity-adjusted p-value were reported. Because a non-significant difference does not demonstrate statistical equivalence, the response at 40–70 mm was interpreted conservatively as an apparent plateau or diminishing additional moisture gain rather than as evidence of a strict saturation threshold.
2.7. Regression Model Building and Parameter Estimation
Prior to regression modeling, the primary response variable- fuel moisture content (M) was evaluated for normality using the Shapiro–Wilk test at a significance level of α = 0.05. If the null hypothesis of normality was rejected (p < 0.05), a Box–Cox power transformation was applied to stabilize variance and normalize the distribution:
where λ is the transformation parameter estimated via the maximum likelihood method, and y denotes the transformed response variable used in subsequent modeling (with y = M if no transformation was required).
To construct the regression framework, six candidate predictors were considered: simulated rainfall depth (p), air temperature (t), relative humidity (h), wind speed (w), drying duration (tm), and initial FMC (i). All-subsets regression (best-subset selection) was used to evaluate candidate combinations [44,45,49]. Model selection was guided by Mallows’ Cp together with parsimony and diagnostic checks; the objective was to identify compact stand- and campaign-specific models rather than to claim a universally optimal variable set.
where RSSp is the residual sum of squares of a subset model containing p parameters (including the intercept), σ2 is the mean squared error (MSE) of the full model, and n is the sample size. The optimal subset was identified where Cp was minimized and close to p, indicating minimal structural bias.
Based on the selected predictor combinations, multiple linear regression models were formulated as:
where xij represents the i-th predictor variable (t, h, w, etc.) for observation j, α0 is the intercept, αi denotes the regression coefficient to be estimated, and εj is the random error term.
Model parameters were estimated using both Ordinary Least Squares (OLS) and Weighted Least Squares (WLS). While OLS assumes homoscedastic errors (Var(εj) = σ2), WLS accommodates heteroscedasticity by introducing observation-specific weights wj = 1/σ2, where σ2 was modeled as a function of key predictor variables or fitted values from the initial OLS regression. This weighting scheme ensures higher precision by assigning larger weights to observations with smaller error variance.
Because the physical responses of fuel moisture to meteorological forcing may be nonlinear, the adequacy of the linear specification was evaluated before final model interpretation. For air temperature (t), relative humidity (h), and wind speed (w), quadratic terms (t2, h2, and w2) were introduced separately into the corresponding selected models. Models with and without the quadratic term were compared using Akaike Information Criterion (AIC), and the statistical significance of each quadratic term was examined. A quadratic term was retained only when it was statistically significant (p < 0.05) and produced a lower AIC than the corresponding linear specification. Otherwise, the simpler linear form was retained for parsimony and interpretability within the observed meteorological range.
Multicollinearity among predictors was assessed using variance inflation factors (VIFs) for each selected stand- and campaign-specific model. VIF values below 5 were considered to indicate no serious multicollinearity, whereas higher values were interpreted as evidence of potentially unstable coefficient estimates. Because correlated predictors may share explanatory variance, regression coefficients and relative-importance estimates were interpreted as conditional effects rather than as independent causal effects.
To evaluate predictive accuracy on the original moisture scale, predicted Box–Cox transformed values (y) were back-transformed to fuel moisture content (M, %) using the inverse transformation equation incorporated with a smearing estimator correction to mitigate back-transformation bias. Accordingly, MAE and RMSE were calculated on the original FMC (%) scale after back-transformation.
Finally, the presence of heteroscedasticity in the OLS residuals was formally assessed using the Breusch–Pagan test. Model comparison and relative goodness-of-fit between the OLS and WLS specifications were evaluated using the Akaike Information Criterion (AIC), with lower AIC values indicating a superior balance between model fit and parameter complexity.
2.8. Robust Inference and Benchmark Models
To distinguish predictive improvement from improvement in statistical inference, selected OLS models were also evaluated with HC3 heteroscedasticity-consistent standard errors. HC3 changes uncertainty estimates but not OLS fitted values. Two predictive benchmarks were additionally considered: a persistence forecast (the previous observed FMC used for the next time step) and an established VPD-based dead-fuel-moisture formulation [11]. OLS, WLS, persistence, and VPD-based predictions were compared on the original FMC scale using mean absolute error (MAE) and root mean square error (RMSE).
where FMC′t represents the predicted fuel moisture content at time t, and FMCt−1 represents the observed fuel moisture content at the preceding time step. The persistence model assumes that the FMC observed at the previous time step provides the prediction for the subsequent time step.
where VPD is the vapor pressure deficit (kPa), RH is relative humidity (%), and es(T) is the saturation vapor pressure (kPa) at air temperature T.
where es(T) represents the saturation vapor pressure (kPa), and T is air temperature (°C). This equation was used to calculate the saturation vapor pressure required for the VPD-based benchmark model.
2.9. Out-of-Sample Model Validation
To evaluate out-of-sample predictive performance, leave-one-quadrat-out cross-validation (LOQO-CV) was conducted separately for each stand × campaign model. In each iteration, all repeated FMC observations from one quadrat were excluded from model fitting, the model was refitted using the remaining quadrats, and FMC values were predicted for the withheld quadrat. This procedure was repeated until each quadrat had served once as the validation unit. Grouping all repeated observations from the same quadrat within the same fold prevented information leakage between the training and validation datasets.
Predictive performance was evaluated on the original FMC (%) scale using MAE, RMSE, and mean prediction bias:
where Mi and M′i are the observed and cross-validated predicted FMC values, respectively. Positive bias indicates systematic overprediction, whereas negative bias indicates systematic underprediction. Model calibration was further assessed by regressing observed FMC against cross-validated predicted FMC:
where a calibration intercept (α) close to 0 and a calibration slope (β) close to 1 indicate good calibration. These out-of-sample metrics were reported separately from the in-sample (R2), AIC, and residual diagnostics used to assess goodness-of-fit and heteroscedasticity.
2.10. Model Accuracy
Model accuracy and predictive performance were evaluated using the mean absolute error (MAE), root mean square error (RMSE), coefficient of determination (R2), and adjusted R2 (R2adj):
where Mi is the observed FMC value, M′i is the predicted FMC value, and n is the number of observations. MAE represents the average absolute difference between observed and predicted FMC values.
where Mi, M′i, and n are defined as above. RMSE quantifies the overall magnitude of prediction error while assigning greater weight to larger errors.
where Mi is the observed FMC value, M′i is the predicted FMC value, and M″i is the mean observed FMC. R2 represents the proportion of variation in the observed FMC explained by the model.
where R2 is the coefficient of determination, n is the sample size, and k is the number of predictor variables. Radj2 adjusts the goodness-of-fit measure for the number of predictors included in the model.
2.11. Data Processing
All statistical analyses were implemented in R (v4.5.3, R Core Team). Specifically, the Shapiro.Test function from the stats package was employed to assess data normality, and the boxcox function from the MASS package was utilized to perform the Box–Cox transformations [50]. The regsubsets function in the leaps package was applied for full-subset regression modeling. Residual homoscedasticity was evaluated using the ncvTest function from the car package, while the relative importance of individual predictor variables was quantified using the calc.relimp function in the relaimpo package. Regression parameter estimation and predictive error calculations were programmed and cross-validated using STATISTICA 10.0 (StatSoft Inc., Tulsa, OK, USA) and Microsoft Excel 2003 (Microsoft Corp., Redmond, WA, USA). Graphical visualization and figure rendering were conducted using OriginPro v9.0 SR2 (OriginLab Corp., Northampton, MA, USA) and SciDAVis 2.7 (DHI Group Inc., NY, USA).
3. Results
3.1. Moisture Content Dynamics of Surface Fuels Across Different Forest Stands
As shown in Figure 2, across all evaluated forest stands, surface dead fuel moisture content (FMC) exhibited a characteristic two-phase temporal trajectory under simulated rainfall gradients (p = 9, 20, 40, 70 mm), characterized by an initial rapid drying phase during 0–6 h in the forested sites and approximately 0–12 h on the cutover site, followed by a slower drying phase thereafter driven by daytime solar radiation, followed by a lower average drying rate over the 12–24 h interval under nighttime atmospheric shading. Cross-stand comparisons revealed that initial post-rainfall water absorption and mean FMC followed a distinct hierarchical order of White B. platyphylla > L. gmelinii > P. sylvestris var. mongolica > cutover plots. Specifically, broadleaf fuels in white birch stands displayed exceptionally high initial moisture absorption (165.32–186.87%), but also rapid initial moisture loss owing to tight litter stratification and physical saturation thresholds, beyond which additional precipitation (p ≥ 40 mm) yielded negligible supplemental retention. Mixed-effects analysis confirmed significant temporal variation in FMC across the post-rainfall drying period. The effects of time, rainfall treatment, and the time × rainfall interaction were (p = 0.0102, p = 0.0145, and p = 0.0256, respectively). Moisture gain increased markedly from 9 to 20 mm and from 20 to 40 mm, whereas the additional increase from 40 to 70 mm was comparatively small. Planned contrasts between the 40- and 70-mm treatments showed an estimated mean difference of 0.05 percentage points (95% CI: 0.325 to 0.412; adjusted p = 0.356). These results indicate a flattening of the rainfall–FMC response at the upper rainfall treatments rather than a sharply defined saturation threshold. Conversely, coniferous fuels (larch and pine) exhibited lower peak absorption (103.26–130.31%) but significantly greater moisture retention stability due to higher fuel bed porosity and looser needle packing structure. Cutover plots experienced the fastest drying rates and lowest moisture values across all time steps due to the complete absence of canopy closure and direct atmospheric exposure. Crucially, at the final 24-h observation, FMC retained a consistent order of B. platyphylla > L. gmelinii > P. sylvestris var. mongolica > cutover land. This persistent moisture gradient demonstrates that despite faster initial desiccation in broadleaf litter, its superior initial water-holding capacity allows it to maintain a higher residual moisture baseline over extended periods compared to coniferous litter and uncanopied logged areas. Inter-seasonal comparisons indicated that initial FMC, mean moisture retention, and desiccation rates were consistently higher during the autumn fire season than in spring. This seasonal divergence is primarily driven by regional meteorological and phenological differences: spring in the study region is characterized by higher ambient temperatures, stronger winds, and lower relative humidity, which accelerate fuel drying. In contrast, lower temperatures, higher relative humidity, and fresh autumn litterfall in autumn enhance fuel moisture retention. Consequently, surface dead fuels maintain superior water-retention stability throughout autumn, conclusively establishing the spring fire season as the primary operational window of heightened wildland fire risk and management difficulty in the region.
Figure 2.
Fuel moisture content (FMC) dynamics across different forest plots under varying precipitation levels (p). Betula platyphylla plots in (a) autumn 2022 and (b) spring 2024; Larix gmelinii plots in (c) autumn 2022 and (d) spring 2024; Pinus sylvestris var. mongolica plots in (e) autumn 2022 and (f) spring 2024; cutover plots in (g) autumn 2022 and (h) spring 2024. FMC was measured at 0, 2, 4, 6, 8, 10, 12, and 24 h after rainfall. The final 24-h values represent the observed FMC at the end of the monitoring period and should not be interpreted as equilibrium moisture content. Equilibrium moisture content and ignition thresholds were not experimentally determined in this study.
3.2. Out-of-Sample Predictive Performance
Leave-one-quadrat-out cross-validation showed that the selected WLS models retained predictive ability when applied to quadrats not used for model fitting. It is evident from Table 6 that across stand × campaign combinations, cross-validated MAE ranged from 0.19 to 0.71%, RMSE ranged from 0.17 to 0.590%, and mean prediction bias ranged from −0.03 to +0.04%. Calibration intercepts ranged from −1.5 to 0.6, while calibration slopes ranged from 0.93 to 1.05. These results indicate that the models maintained good agreement between predicted and observed FMC under out-of-sample evaluation.
Table 6.
Out-of-sample predictive performance of the selected WLS models evaluated using leave-one-quadrat-out cross-validation.
Cross-validated prediction errors were generally larger than the corresponding in-sample errors, as expected when predictions were generated for withheld quadrats. Importantly, the cross-validation metrics are reported separately from in-sample R2, AIC, and residual diagnostics, which describe model fit rather than out-of-sample predictive performance.
3.3. Modeling Surface Fuel Moisture Content Across Different Forest Stands
To model the short-term dynamics of FMC across different forest stands, non-normal FMC response data were first mapped to normal distributions via Box–Cox transformations. As summarized in Table 7, optimal transformation parameters (λ = 0.22–0.41) successfully rendered the response variables normally distributed (p > 0.05, Shapiro–Wilk test), effectively stabilizing residual variance and satisfying homoscedasticity assumptions for linear regression. Full-subset regressions were then executed separately for spring and autumn fire seasons across B. platyphylla, L. gmelinii, P. sylvestris var. mongolica, and cutover plots, evaluating all candidate combinations of precipitation (p), ambient temperature (t), relative humidity (h), wind speed (w), drying duration (tm), and initial fuel moisture content (i). Models were screened based on Mallows’ Cp statistic (selecting subsets closest to Cp ≈ p, approaching zero bias) alongside rigorous F-tests for overall equations and t-tests for individual parameters (p < 0.05) (Figure 3). Across all stands, a total of 12 candidate models met these criteria. Specifically, white B. platyphylla stands yielded three optimal predictor combinations (p-tm-i, p-h-tm-i, and p-t-h-tm-i); L. gmelinii stands yielded four (p-tm-i, p-h-tm-i, p-h-w-tm-i, and p-t-h-w-tm-i); P. sylvestris var. mongolica stands yielded three (p-h-tm-i, p-h-w-tm-i, and p-t-h-w-tm-i); and cutover plots yielded two (p-t-tm-i and p-t-w-tm-i). Variable frequency analysis across these 12 models revealed that precipitation (p), drying duration (tm), and initial FMC (i) were included in 100% of the screened models (12 times each), followed by relative humidity (h, 8 times), ambient temperature (t, 5 times), and wind speed (w, 5 times). These selection patterns confirm that precipitation, drying time, and initial fuel moisture status constitute the indispensable core variables governing surface dead FMC dynamics across diverse forest stands and fire seasons in the study region (Table 7 and Figure 3).
Table 7.
Box–Cox transformation parameters and normality test results for surface fuel moisture content across different forest stands.
Figure 3.
Variable-selection results from all-subsets regression across different forest stands and fire seasons. Betula platyphylla plots in (a) autumn 2022 and (b) spring 2024; Larix gmelinii plots in (c) autumn 2022 and (d) spring 2024; Pinus sylvestris var. mongolica plots in (e) autumn 2022 and (f) spring 2024; and cutover plots in (g) autumn 2022 and (h) spring 2024. The x-axis indicates the number of predictors included in each candidate subset model, and the y-axis shows Mallows’ Cp. Each point represents one candidate subset model, with the adjacent label indicating the included predictors. Predictor symbols: p, precipitation; t, air temperature; h, relative humidity; w, wind speed; tm, drying duration; and i, initial fuel moisture content. The red line represents the reference line, indicating that Mallow’s Cp equals 0.
Additional diagnostic analyses supported retention of the linear model form. The quadratic terms for air temperature, relative humidity, and wind speed did not significantly improve model fit in the selected stand × campaign models (all p > 0.05), and their inclusion did not produce meaningful reductions in AIC. Therefore, the linear specification was retained as the more parsimonious representation of the meteorological effects within the observed environmental range.
Multicollinearity diagnostics showed that VIF values ranged from 2.13 to 3.56 across the selected models and remained below the threshold of 5. Although some correlation was present among meteorological predictors, particularly between air temperature and relative humidity, the VIF results indicated that multicollinearity was not sufficiently severe to invalidate coefficient estimation. Nevertheless, the partial regression coefficients and relative-importance estimates were interpreted conditionally because correlated predictors may share explanatory variance.
To evaluate parameter reliability and address potential heteroscedasticity inherent in environmental fuel desiccation data, candidate full-subset regression models (m1–m12) were fitted using both OLS and WLS methods for both the autumn 2022 and spring 2024 fire seasons (Table 8). Model performance was evaluated based on the AIC, which balances model complexity against goodness-of-fit and Breusch–Pagan homoscedasticity tests.
Table 8.
Comparison of OLS and WLS parameter estimation methods for full-subset regression models during the autumn 2022 and spring 2024 fire seasons.
As summarized in Table 9, parameter estimation via OLS exhibited severe variance instability. Most OLS-fitted models failed the homoscedasticity test (p < 0.05), violating the fundamental constant-variance assumption of linear regression. In contrast, applying the WLS estimation method effectively stabilized error variances, enabling all 12 models across both fire seasons to successfully pass the homoscedasticity test (p > 0.05; autumn WLS p = 0.40–0.99; spring WLS p = 0.502–0.953).
Table 9.
Benchmark comparison of post-rainfall FMC models.
WLS parameterization produced lower AIC values than the corresponding OLS fits and substantially improved residual-variance diagnostics across the examined stand × campaign models. These results support WLS as a useful way to address heteroscedasticity in this dataset. However, lower AIC and homoscedastic residuals are in-sample diagnostics and are not, by themselves, evidence of superior operational forecasting; predictive performance is therefore evaluated separately using leave-one-quadrat-out cross-validation and the persistence/VPD benchmarks (Table 6 and Table 9).
HC3 adjustment produced the same fitted values and predictive errors as conventional OLS, because the robust correction affects coefficient uncertainty rather than point prediction. In contrast, WLS altered parameter estimation by explicitly accounting for unequal residual variance. Relative to the persistence and VPD-based benchmarks, the predictive performance of WLS was assessed using MAE and RMSE on the original FMC scale. WLS produced lower MAE and RMSE than the persistence and VPD-based benchmarks.
Parameter estimation results, significance test outputs, and explanatory power (R2) for the 12 Weighted Least Squares (WLS) models (m1–m12) across both autumn 2022 and spring 2024 fire seasons are summarized in Table 10. All fitted models demonstrated robust explanatory capability, with adjusted R2 values exceeding 0.60 across the majority of combinations and all predictor variables passing significance testing (p < 0.05, except for select intercept terms). The proportion of variance explained varied markedly among forest stand types, ranging over 0.687–0.939 (autumn 2022) and 0.632–0.958 (spring 2024) in B. platyphylla stands, 0.865–0.957 (autumn) and 0.689–0.946 (spring) in L. gmelinii stands, 0.769–0.942 (autumn) and 0.685–0.922 (spring) in P. sylvestris var. mongolica stands, and 0.553–0.805 (autumn) and 0.503–0.884 (spring) in cutover land. Based on the highest R2 metrics, minimal prediction bias, and coefficient stability, the optimal prediction models for B. platyphylla, L. gmelinii, P. sylvestris var. mongolica, and cutover land were identified as m1 (p-tm-i, R2 = 0.939–0.958), m7 (p-t-h-w-tm-i, R2 = 0.946–0.957), m10 (p-t-h-w-tm-i, R2 = 0.922–0.942), and m12 (p-t-w-tm-i, R2 = 0.884), respectively. Across all WLS models, drying duration (tm) exhibited consistently negative regression coefficients (ranging from −0.016 to −0.080), reflecting continuous moisture loss over time, while initial fuel moisture (i) and relative humidity (h) exerted strong positive influences, and ambient temperature (t) and wind speed (w) modulated desiccation rates according to canopy closure and fuel bed stratification. These optimal WLS models provide accurate and reliable operational tools for forecasting surface dead fuel moisture dynamics across diverse forest stand structures and fire seasons in the study region (Table 10).
Table 10.
Weighted least squares parameter estimates, coefficient significance, and coefficient of determination (R2) for models m1–m12 during the autumn 2022 and spring 2024 fire seasons.
Validation against measured field values demonstrated tight scatter clustering along the 1:1 line (Figure 4), confirming exceptional predictive accuracy for the optimal model selected for each stand type: B. platyphylla stands (m1: y = −26.827 + 1.246x, R2 = 0.939 in autumn; y = −14.682 + 1.195x, R2 = 0.958 in spring; Figure 4a,b), L. gmelinii stands (m7: y = 6.168 + 0.933x, R2 = 0.957 in autumn; y = 7.932 + 0.917x, R2 = 0.946 in spring; Figure 4c,d), P. sylvestris var. mongolica stands (m10: y = 2.364 + 0.911x, R2 = 0.942 in autumn; y = 5.469 + 0.897x, R2 = 0.922 in spring; Figure 4e,f), and cutover land (m11/m12: y = 3.274 + 0.992x, R2 = 0.805 in autumn; y = 2.953 + 1.043x, R2 = 0.884 in spring; Figure 4g,h). Across all WLS models, drying duration (tm) exerted a strong negative influence (coefficients from −0.016 to −0.080), while initial fuel moisture (i) and relative humidity (h) acted positively, and ambient temperature (t) and wind speed (w) modulated desiccation according to canopy closure. The validation regressions showed generally strong agreement between measured and predicted FMC. However, the B. platyphylla model exhibited a larger departure from the 1:1 relationship, with intercepts of −26.827 and −14.682 and slopes of 1.246 and 1.195 in autumn and spring, respectively, indicating some residual range-dependent calibration bias despite the high R2 values. Negative partial regression coefficients for precipitation (p) in certain closed-stand models likely reflect a suppression effect arising from correlation with initial fuel moisture (i), which already captures much of the positive variation associated with the wetting treatment.
Figure 4.
In-sample comparison of measured and fitted surface fine dead fuel moisture content (FMC, %) for representative WLS models across the four stand/site conditions during the autumn 2022 and spring 2024 campaigns. Betula platyphylla plots (m1) in (a) autumn 2022 and (b) spring 2024; Larix gmelinii plots (m7) in (c) autumn 2022 and (d) spring 2024; Pinus sylvestris var. mongolica plots (m10) in (e) autumn 2022 and (f) spring 2024; Cutover land (m11, m12) in (g) autumn 2022 and (h) spring 2024. The red dashed line represents the 1:1 line of perfect agreement. R2 indicates the coefficient of determination.
3.4. Evaluation of Prediction Accuracy and Error Metrics Across Forest Stand Models
To quantify the predictive precision and residual error of the 12 Weighted Least Squares (WLS) models (m1–m12), mean absolute error (MAE) and root mean square error (RMSE) were calculated across both the autumn 2022 and spring 2024 fire seasons (Figure 5). Sharing the same percentage units (%) as FMC, lower MAE and RMSE values directly reflect higher prediction accuracy. As shown in Figure 4, error magnitudes demonstrated high inter-seasonal consistency across stands: during autumn 2022 (Figure 5a), MAE values for models m1–m12 were 0.3256, 0.3695, 0.2896, 0.1886, 0.1639, 0.1743, 0.1896, 0.1963, 0.1789, 0.1863, 0.6235, and 0.6896, with corresponding RMSE values of 0.3025, 0.3745, 0.4123, 0.2036, 0.1963, 0.1856, 0.1763, 0.2111, 0.2000, 0.1986, 0.5632, and 0.6028, respectively; during spring 2024 (Figure 5b), MAE values were 0.2563, 0.3026, 0.2632, 0.1632, 0.1563, 0.1704, 0.1853, 0.1863, 0.1635, 0.1763, 0.6032, and 0.6852, with corresponding RMSE values of 0.2658, 0.3521, 0.4032, 0.2000, 0.1632, 0.1823, 0.1632, 0.2222, 0.1863, 0.2036, 0.5432, and 0.5325, respectively. Models developed for coniferous stands, specifically L. gmelinii (m4–m7) and P. sylvestris var. mongolica (m8–m10) yielded the highest precision, maintaining MAE and RMSE values consistently below 0.22%, whereas broadleaf B. platyphylla stands (m1–m3) exhibited moderate errors (MAE = 0.2563–0.3695%), and cutover land (m11, m12) showed higher residual variance (MAE = 0.5032–0.6896%) due to direct atmospheric exposure. Comprehensive evaluation integrating R2, homoscedasticity tests, MAE, and RMSE conclusively establishes models m1 (p-tm-i), m7 (p-t-h-w-tm-i), m10 (p-t-h-w-tm-i), and m11/m12 (p-t-tm-i/p-t-w-tm-i) as the optimal forecasting tools for B. platyphylla, L. gmelinii, P. sylvestris var. mongolica, and cutover land, respectively, providing robust operational capability for regional wildland fire management.
Figure 5.
Predictive accuracy evaluation (MAE and RMSE) for candidate WLS fuel moisture models (m1–m12) across forest stands during (a) autumn 2022 and (b) spring 2024 fire seasons.
3.5. Relative Importance of Predictor Variables in Fuel Moisture Prediction Models
To quantitatively evaluate the hierarchical contributions of driving environmental factors across forest stands, the relative importance of the six predictor variables: precipitation (p), drying duration (tm), initial fuel moisture content (i), relative humidity (h), wind speed (w), and ambient temperature (t) was evaluated by calculating their proportion of explained variance across models m1–m12 (Figure 6). As illustrated in Figure 6, individual variable contributions ranged from 2.00% to 47.00% across all model combinations, exhibiting distinct variable dominance patterns between closed-canopy forest stands (m1–m10) and open cutover land (m11, m12). Across B. platyphylla (m1–m3), larch (m4–m7), and P. sylvestris var. mongolica (m8–m10) stands, drying duration (tm), precipitation (p), and initial fuel moisture (i) consistently served as the primary drivers governing fuel desiccation, each accounting for more than 20.00% of the total variance. Specifically, drying duration (tm) emerged as the single largest contributor in most closed-stand models (accounting for 28–47% in autumn 2022 and 20–47% in spring 2024), followed by initial FMC (i, 20–33% in autumn and 21–35% in spring) and precipitation (p, 9–28% in autumn and 10–35% in spring). Secondary microclimatic variables, including relative humidity (h), wind speed (w), and ambient temperature (t), exerted a comparatively minor influence in closed forest stands, with their combined explanatory power generally remaining below 40.00%. Conversely, in uncanopied cutover land models (m11, m12), ambient temperature (t) and wind speed (w) played significantly elevated roles due to direct atmospheric exposure, with temperature (t) contributing up to 25.00–26.00% in autumn and wind speed (w) explaining up to 16.00–19.00% of the variance. Seasonal comparison indicated that precipitation (p) held slightly higher relative importance during the spring 2024 fire season (up to 35% in m1) compared to autumn 2022, whereas drying duration (tm) remained the dominant stabilizing predictor across both seasons. These importance hierarchies confirm that short-term surface dead fuel moisture dynamics are predominantly controlled by a core triad of precipitation, drying time, and initial fuel wetness, while microclimatic variables like temperature and wind speed gain predictive dominance primarily in canopy-cleared, sun-exposed environments.
Figure 6.
Relative Importance of Predictor Variables in the Optimal Regression Models for the (a) autumn 2022 and (b) spring 2024 fire seasons. Predictor symbols: p, precipitation; t, ambient temperature; h, relative humidity; w, wind speed; tm, drying duration; i, initial fuel moisture content.
4. Discussion
Surface fine dead fuels, including fallen leaves, needles, small twigs, and withered grasses, are among the fuel components most responsive to short-term atmospheric forcing. Their fuel moisture content (FMC) strongly influences ignitability and early surface-fire development because retained water must be evaporated before sustained combustion can occur [8,10,12]. Lower FMC is therefore generally associated with shorter ignition delay and greater potential for surface-fire spread, although realized fire behavior also depends on fuel load and continuity, ignition characteristics, wind, and topography [1,2,8,30]. Fine-dead-fuel FMC is consequently an important input to fire-danger assessment [9,33,51,52] and is jointly controlled by antecedent wetting, meteorological conditions, fuelbed properties, and site environment [9,17,29,43,49,53,54]. The discussion below addresses the three study objectives in sequence while explicitly distinguishing observed stand/site associations from causal effects that the experimental design cannot isolate.
4.1. Post-Rainfall Drying Trajectories and Stand/Site Differences in Moisture Retention (Objective 1)
Objective 1 was addressed by resolving FMC trajectories during the first 24 h after simulated rainfall across four contrasting stand/site conditions. Across the three forested sites, FMC declined rapidly during 0–6 h and more slowly during 6–24 h; on cutover land, the corresponding transition occurred at approximately 12 h. This two-phase pattern is consistent with early drainage and evaporation of more readily removable water followed by slower desorption as the fuelbed dries [7,13,14,55,56]. Because incident solar radiation and litter-scale energy fluxes were not measured, however, the phase transition should not be attributed uniquely to daytime radiative loading or to sunset [57,58]. It is more appropriately interpreted as an empirical change in drying rate under the measured post-wetting conditions [59]. A second feature was the diminishing additional moisture gain between the 40- and 70-mm treatments. The planned contrast did not detect a significant difference, but statistical non-significance does not demonstrate equivalence; the response is therefore better described as an apparent plateau at the upper rainfall treatments than as a universal saturation threshold [60,61]. Within the experimental range, this pattern indicates that additional rainfall contributed progressively less to post-wetting FMC once the fuelbed was already very wet.
Figure 2 further illustrates these post-rainfall drying patterns across the four stand/site conditions and rainfall treatments. The separation among rainfall treatments was greatest immediately after wetting and generally narrowed as drying proceeded, while the 40- and 70-mm trajectories remained relatively close across most panels. This visual pattern is consistent with the planned contrast and supports our interpretation of diminishing additional moisture gain at the upper rainfall levels rather than a sharply defined saturation threshold. The figure also shows that B. platyphylla maintained comparatively high FMC throughout the 24-h observation period, whereas the cutover site remained at lower FMC levels, reinforcing the stand/site differences in water retention and post-wetting exposure discussed above.
Across the four investigated stand/site conditions, both peak and 24-h FMC followed the order B. platyphylla > L. gmelinii > P. sylvestris var. mongolica > cutover land. Peak FMC in B. platyphylla reached 165.32–186.87%, compared with 103.26–130.31% in the two coniferous stands, and the B. platyphylla site also retained the highest FMC at 24 h. These differences are consistent with previous reports of stand-specific variation in dead-fuel moisture [62,63,64,65,66], but the present design does not permit them to be attributed solely to species identity. The sampled fuelbeds differed simultaneously in fuel load, depth, dry bulk density, porosity, canopy closure, and site location. For example, the relatively compact B. platyphylla fuelbed had higher dry bulk density and lower porosity, whereas the coniferous needle fuelbeds were deeper and more porous; these measured structural contrasts provide a plausible basis for differences in water storage and ventilation. At the cutover site, the absence of canopy shelter coincided with the highest air temperature and wind speed and the lowest relative humidity among the four sites (Table 5). Because canopy closure, fuelbed structure, species identity, and site location were not independently crossed, these mechanisms should be regarded as plausible, interacting explanations rather than isolated causal effects.
The moisture-retention pattern was broadly consistent with the overarching hypothesis that post-rainfall FMC reflects the interaction between the initial wetting state and stand-associated atmospheric drying conditions. B. platyphylla exhibited both the highest peak FMC and the highest 24-h FMC, whereas the cutover site remained lowest across the observation period. Greater water-holding capacity, however, did not imply uniformly slower drying: the B. platyphylla fuelbed still lost moisture rapidly during the early phase. This distinction is important because peak FMC and drying rate describe different components of the post-rainfall response. The present data therefore support separating (i) the amount of water retained immediately after wetting from (ii) the subsequent rate of moisture loss, rather than treating a high initial FMC as direct evidence of a longer wet period.
Between-campaign contrasts were also evident: initial FMC, mean retention, and residual moisture were generally higher in the autumn 2022 campaign than in the spring 2024 campaign, coinciding with lower air temperature, higher relative humidity, and weaker wind during the autumn observations (Table 5). Because sampling season is confounded with sampling year in this design (Section 2.1 and Section 2.4), these differences cannot be interpreted as a replicated seasonal effect. They instead show that the fitted relationships were observed under two contrasting campaign-level evaporative regimes. The direction of the contrast is compatible with the locally designated spring high-fire-risk period, but multi-year monitoring in both autumn and spring is required before attributing the difference to season per se [67,68].
4.2. Heteroscedasticity, Model Specification, and Predictive Performance (Objective 2)
Objective 2 was addressed by developing 12 candidate predictor structures and fitting them separately by stand/site and campaign using ordinary least squares (OLS) and weighted least squares (WLS). Two aspects of the modeling framework are noteworthy. First, all-subsets regression allowed candidate predictor combinations to be evaluated under a common selection criterion rather than along a stepwise search path [44,57,69,70,71,72]. Across the selected structures, rainfall depth (p), drying duration (tm), and initial FMC (i) were repeatedly retained, whereas relative humidity, air temperature, and wind speed entered more selectively. This pattern is consistent with antecedent wetting and elapsed drying time providing core state information, with microclimatic variables adding stand/site-specific explanatory value. Second, WLS was used explicitly to address the non-constant residual variance that remained in many OLS fits.
Figure 3 provides additional support for the model-selection interpretation by showing how Mallows’ Cp changed with model complexity and predictor composition across the eight stand × campaign combinations. Low-Cp candidate subsets repeatedly included precipitation (p), drying duration (tm), and initial FMC (i), whereas relative humidity (h), air temperature (t), and wind speed (w) entered more selectively. Thus, Figure 3 indicates that the core wetting-state and elapsed-time variables supplied the principal explanatory structure, while meteorological variables provided additional stand- and campaign-specific information rather than uniformly improving every model.
The residual diagnostics indicate that heteroscedasticity was a persistent feature of the OLS fits in this dataset rather than a minor statistical nuisance. Raw FMC was non-normal in all eight stand × campaign combinations (p < 0.01), and Box–Cox transformations (λ = 0.22–0.41) improved normality. Most OLS models nevertheless retained evidence of heteroscedasticity, whereas the WLS fits passed the reported homoscedasticity tests and had lower AIC values than their OLS counterparts. These results support WLS as an appropriate variance-modeling strategy for the present data. However, improved residual variance and lower AIC are in-sample diagnostics and do not by themselves demonstrate superior forecasting performance. The leave-one-quadrat-out cross-validation (LOQO-CV) and benchmark comparisons therefore provide the more relevant evidence for prediction to withheld quadrats. Under LOQO-CV, the selected WLS models yielded MAE values of 0.18–0.71%, RMSE values of 0.17–0.60%, mean bias from −0.03 to +0.04%, and calibration slopes of 0.93–1.05, indicating relatively small out-of-sample errors within the sampled stand/site conditions.
The benchmark comparison in Table 9 further clarifies the practical significance of the modeling results. WLS produced lower prediction errors (MAE = 0.12% and RMSE = 0.54%) than conventional OLS (0.31% and 0.78%), the persistence benchmark (0.23% and 0.67%), and the VPD-based benchmark (0.28% and 0.71%), whereas OLS-HC3 retained the same prediction errors as OLS because the HC3 correction changes coefficient uncertainty rather than fitted values. Accordingly, Table 9 is not included merely as an additional set of performance values; it demonstrates that the WLS improvement observed in the residual diagnostics is accompanied by lower prediction error relative to both a simple temporal benchmark and an established meteorological benchmark within this dataset.
In-sample explanatory power remained stand/site dependent, with R2 values generally higher in the forested sites than at the cutover site. Prediction errors were lowest for the coniferous-stand models and largest for the cutover models, but this pattern should not be interpreted as an intrinsic ranking of modelability among fuel types. The L. gmelinii site had the largest sample size (n = 89), whereas the cutover site had only 12 quadrats, and these differences in replication occurred together with substantial differences in microclimate and fuelbed structure. Greater exposure to temperature and wind variability at the cutover site may also have increased short-term variability not fully represented by the selected predictors. Thus, both experimental design and environmental heterogeneity plausibly contributed to the observed differences in error magnitude. All MAE and RMSE values reported here were calculated on the original FMC (%) scale after back-transformation. Comparisons with previously published prediction errors should nevertheless be made cautiously because studies differ in wetting regime, response scale, temporal resolution, fuel type, predictor set, and validation scheme [49,58,73,74,75,76].
The measured-versus-predicted regressions shown in Figure 4 are in-sample diagnostics and should not be conflated with the LOQO-CV calibration analysis. In Figure 4, the B. platyphylla fits showed a larger departure from the 1:1 relationship than the other sites, whereas the cross-validated calibration slopes reported in Table 6 were much closer to unity (0.93–1.05 overall). These diagnostics answer different questions: the former summarizes agreement for observations used to fit the models, whereas the latter evaluates predictions for withheld quadrats. The broader implication is that high R2 alone is insufficient for judging predictive performance; calibration, prediction bias, and out-of-sample error should be considered jointly. Because Box–Cox back-transformation can introduce bias, the stated smearing correction remains important when predictions are returned to the original FMC scale [77,78].
4.3. Stand/Site-Associated Shifts in Predictor Importance (Objective 3)
Objective 3 quantified how predictor importance varied among the sampled environments. Relative-importance estimates ranged from 2% to 47% across the fitted models. In the three forested sites, drying duration, initial FMC, and rainfall depth generally accounted for the largest shares of explained variance, whereas at the open cutover site air temperature and wind speed made larger contributions. This pattern is consistent with the first auxiliary hypothesis that immediate atmospheric forcing would become more influential in the open environment [79,80]. However, relative-importance values partition explained variance within a fitted predictor set and should not be interpreted as independent causal effects.
The observed contrast is consistent with canopy-related sheltering [81,82], but the experimental design does not isolate canopy closure from species identity, fuelbed structure, or site location [83]. The three forested sites had canopy closure values of 0.5–0.8 and lower wind exposure than the cutover site, while also differing in litter composition, fuelbed depth, dry bulk density, and porosity. We therefore interpret the result as a stand/site-associated shift in predictor importance: elapsed drying time and the initial wetting state explained more variation under forest cover, whereas temperature and wind accounted for more variation in the open environment [84,85]. Independent replication across multiple sites spanning partially independent gradients of canopy closure and fuelbed structure is required before this relationship can be generalized [86,87,88,89].
The negative partial coefficients for rainfall depth in some closed-stand models should not be assigned a simple physical interpretation [87,90]. Rainfall depth and initial FMC are correlated components of the wetting state, so the sign of a partial coefficient can differ from the marginal rainfall–FMC relationship once both variables enter the same model. The negative coefficients are therefore more plausibly interpreted as conditional or suppression effects within the fitted predictor set than as evidence that greater rainfall physically lowers FMC. This distinction is important because VIF values remained below 5 (2.13–3.56), indicating shared explanatory variance without evidence of severe multicollinearity.
A similar caution applies to the coefficients of secondary meteorological predictors. Drying duration carried a negative coefficient in every model, and initial FMC was consistently positive, directions that are physically consistent with progressive moisture loss and persistence of the initial wetting state. Relative humidity, however, was positive in the B. platyphylla and P. sylvestris var. mongolica models but negative in several L. gmelinii models. Within a 24-h drying sequence, relative humidity covaries with elapsed time and air temperature, so its partial coefficient is conditional on the remaining predictors and need not have the same sign as its marginal association with FMC [90,91]. Accordingly, the signs and relative importance of secondary meteorological predictors should be interpreted as conditional associations after adjustment for the other variables, rather than as isolated causal responses [92,93,94,95]. Future designs with greater independent variation among meteorological drivers, or process-based formulations, would help separate these effects [96,97].
4.4. Operational Implications for Hourly Post-Rainfall Fuel-Moisture Assessment
The practical value of the hourly, rainfall-specific formulation is that it converts rainfall and weather observations into a predicted post-rainfall FMC trajectory. When coupled with automatic weather-station observations, the stand/site-specific models can estimate how rapidly surface fuels approach a user-specified moisture level. This output is best viewed as an hourly post-rainfall fuel-moisture component that can complement, rather than replace, broader fire-danger assessment. Its main contribution is temporal resolution during the first 24 h after wetting, when FMC can change rapidly. Because the models were developed under simulated rainfall and within four specific stand/site conditions, operational use should remain within the observed environmental domain until external validation is available.
The present study did not include ignition, combustion, or fire-spread experiments and therefore does not establish a critical FMC threshold for ignition or sustained combustion. Predicted FMC should consequently not be interpreted directly as ignition probability, spread rate, or fire-danger class. Any operational conversion requires independent calibration against fuel-specific ignition thresholds or fire-behavior observations [70,98,99,100]. In addition, the stand/site-associated driver patterns identified in Section 4.3 indicate that a single regional parameterization may inadequately represent both closed-canopy stands and open cutover areas. Operational deployment would therefore require stand/site classification, independent calibration of FMC to fire-behavior metrics, and validation under natural rainfall at previously unseen sites.
4.5. Limitations and Future Directions
Several limitations constrain the interpretation and generalizability of the findings. Spatial replication was limited to a single contiguous site per fuel type, confounding fuel type with site location. Species identity, canopy structure, and fuelbed characteristics were therefore neither fully crossed nor independently replicated, preventing their effects from being statistically separated. Accordingly, differences among B. platyphylla, L. gmelinii, P. sylvestris var. mongolica, and the cutover site should be interpreted as composite stand/site effects rather than independent species effects. Canopy closure and the measured microclimatic variables provide environmental context for these differences but do not establish the individual causal contributions of canopy structure or species identity. Replication was particularly limited at the cutover site (n = 12; three quadrats per rainfall depth), reducing statistical power and potentially contributing to the larger errors of the cutover models. Additional independent sites for each stand/site condition, together with greater within-site replication, are needed to evaluate model robustness and transferability.
Temporal inference was also constrained by the confounding of sampling season with sampling year. The autumn 2022 and spring 2024 observations represent contrasting sampling campaigns rather than a controlled comparison of seasonal effects [100,101,102]. Consequently, differences between the two campaigns cannot be attributed uniquely to season. Monitoring both autumn and spring over multiple years is needed to distinguish seasonal variation from interannual variability and to assess the temporal stability of the fitted relationships.
The simulated-rainfall protocol and predictor set introduce additional limitations. Because all rainfall depths were applied over the same 3-h duration, rainfall depth and nominal rainfall intensity varied together, so their independent effects cannot be resolved. Fuelbed depth, dry bulk density, porosity, and topographic position were characterized but were not incorporated into the final regression predictor set; particle orientation, litter decay stage, degree of soil contact, throughfall, and incident solar radiation were not quantified as independent predictors. These omissions limit mechanistic attribution of post-rainfall drying. Future experiments should vary rainfall depth and duration independently and jointly quantify structural, radiative, hydrological, and topographic controls, including their interactions with rainfall conditions [103,104,105,106].
Model calibration and functional form also warrant further evaluation. For B. platyphylla, cross-validated calibration intercepts were negative and slopes were slightly above unity, indicating residual range-dependent calibration error rather than physically meaningful negative FMC values. Because zero FMC lies outside the observed calibration range, the intercepts should not be given a direct physical interpretation. Correlation between rainfall depth (p) and initial FMC (i) can also alter the signs of partial coefficients; negative rainfall coefficients should therefore not be interpreted as evidence of an inverse physical effect of rainfall on FMC. Although quadratic terms for temperature, relative humidity, and wind did not improve model performance within the observed range, the empirical two-phase drying trajectories motivate evaluation of alternative temporal formulations, including segmented, dual-exponential, and process-based models. Such alternatives should be assessed using independent validation data rather than selected solely on in-sample fit.
5. Conclusions
This study showed that post-rainfall FMC dynamics differed among the four investigated stand/site conditions and followed a two-phase drying pattern. B. platyphylla fuelbeds retained the highest moisture and the cutover site the lowest. The 40- and 70-mm treatments produced only a small, statistically non-significant difference in FMC, indicating diminishing additional moisture gain at the upper rainfall treatments rather than demonstrating a universal saturation threshold.
The modelling results showed that heteroscedasticity is an important feature of post-rainfall fuel-moisture data and that weighted least squares provided more stable and reliable estimates than ordinary least squares. The dominant controls on drying also differed between canopy environments: beneath forest canopies, post-rainfall moisture was governed mainly by the initial wetting condition and elapsed drying time, whereas temperature and wind became more influential on open cutover land. These findings are consistent with the broader understanding that canopy structure moderates the exchange of heat, moisture, and momentum between surface fuels and the atmosphere.
Overall, the results support the use of stand-specific, hourly fuel-moisture prediction for short-term assessment of post-rainfall fuel dryness and potential ignitability. Because ignition and fire-spread experiments were not conducted, the predicted FMC values should not be interpreted directly as ignition probabilities, spread rates, or operational fire-danger classes. Further validation under natural rainfall and across multiple sites and years is required before broader operational application.
Author Contributions
Formal analysis, J.D., X.D., and P.H.; investigation, J.D., X.D. and B.R.; methodology, B.R. and W.S.; project administration, J.D. and P.H.; resources, J.D., S.X. and P.H.; software, J.D. and X.D.; supervision, J.D. and P.H.; validation, J.D. and S.X.; visualization, X.D.; writing—original draft, J.D., X.D., and P.H. All authors have read and agreed to the published version of the manuscript.
Funding
The work was supported by the National Natural Science Foundation of China “Study on hydraulic-carbon coupling process and adaptation mechanism based on stomatal regulation behavior of Pinus sylvestris var. mongholica in Horqin sandy land” (grant number 32572156) and the Joint Program of Liaoning Provincial Science and Technology Plan (General Program of Natural Science Foundation) “Study on the Water-Carbon Coupling Process of Stomatal Regulation Behavior of Pinus sylvestris var. mongholica Under Drought Conditions in Typical Aeolian Sandy Areas of Northeast China” (2025-MSLH-605).
Data Availability Statement
The data summarized in the tables and figures are contained within the article. Additional underlying records may be obtained from the corresponding author subject to reasonable request and institutional data-sharing requirements.
Acknowledgments
Many thanks to Junqi Wang, Ying Liu, Yihan Wang, Congcong Zhang, Xiaobo Liu, Yang Liu, Jiaqi Yao, Changyuan Liu, Xaio Zheng, and Miao Yu for their support in preparing the experiments, collecting data, and analyzing data.
Conflicts of Interest
Authors Peng Huang, Baiqiang Ren and Wenqiang Su were employed by the company China Urban Construction Design & Research Institute Co., Ltd. The remaining authors declare that the research was conducted in the absence of any commercial or financial relationships that could be construed as a potential conflict of interest.
References
- Bowman, D.M.J.S.; Balch, J.K.; Artaxo, P.; Bond, W.J.; Carlson, J.M.; Cochrane, M.A.; D’Antonio, C.M.; DeFries, R.S.; Doyle, J.C.; Harrison, S.P.; et al. Fire in the earth system. Science 2009, 324, 481–484. [Google Scholar] [CrossRef] [Scilit] [PubMed]
- Ning, J.; Liu, H.; Yu, W.; Deng, J.; Sun, L.; Yang, G.; Wang, M.; Yu, H. Comparison of Different Models to Simulate Forest Fire Spread: A Case Study. Forests 2024, 15, 563. [Google Scholar] [CrossRef] [Scilit]
- Szasdi-Bardales, F.; Shamsaei, K.; Juliano, T.W.; Kosovic, B.; Ebrahimian, H.; Elhami-Khorasani, N. An offline coupling of fire spread models to simulate the 2021 Marshall Fire. Int. J. Wildland Fire 2025, 34, WF24027. [Google Scholar] [CrossRef] [Scilit]
- Moran, C.J.; Seielstad, C.A.; Pietruszka, B.M. Three fuel models for predicting urban fire spread—A stopgap for emergency management in the US. Int. J. Wildland Fire 2025, 34, WF24132. [Google Scholar] [CrossRef] [Scilit]
- Simard, A.J. The Moisture Content of Forest Fuels—I: A Review of Basic Concepts; Forest Fire Research Institute: Ottawa, ON, Canada, 1968; Available online: https://ostrnrcan-dostrncan.canada.ca/handle/1845/223640 (accessed on 23 August 2026).
- Matthews, S. Dead fuel moisture research: 1991–2012. Int. J. Wildland Fire 2014, 23, 78–92. [Google Scholar] [CrossRef] [Scilit]
- Catchpole, E.A.; Catchpole, W.R.; Viney, N.R.; McCaw, W.L.; Marsden-Smedley, J.B. Estimating fuel response time and predicting fuel moisture content from field data. Int. J. Wildland Fire 2001, 10, 215–222. [Google Scholar] [CrossRef] [Scilit]
- Chuvieco, E.; Aguado, I.; Dimitrakopoulos, A.P. Conversion of fuel moisture content values to ignition potential for integrated fire danger assessment. Can. J. For. Res. 2004, 34, 2284–2293. [Google Scholar] [CrossRef] [Scilit]
- Aguado, I.; Chuvieco, E.; Borén, R.; Nieto, H. Estimation of dead fuel moisture content from meteorological data in Mediterranean areas: Applications in fire danger assessment. Int. J. Wildland Fire 2007, 16, 390–397. [Google Scholar] [CrossRef] [Scilit]
- Ellis, T.M.; Bowman, D.M.J.S.; Jain, P.; Flannigan, M.D.; Williamson, G.J. Global increase in wildfire risk due to climate-driven declines in fuel moisture. Glob. Change Biol. 2022, 28, 1544–1559. [Google Scholar] [CrossRef] [Scilit] [PubMed]
- Rodrigues, M.; Resco De Dios, V.; Sil, Â.; Cunill Camprubí, À.; Fernandes, P.M. VPD-based models of dead fine fuel moisture provide best estimates in a global dataset. Agric. For. Meteorol. 2024, 346, 109868. [Google Scholar] [CrossRef] [Scilit]
- Pellizzaro, G.; Cesaraccio, C.; Duce, P.; Ventura, A.; Zara, P. Influence of seasonal weather variations and vegetative cycle on live moisture content and ignitability in Mediterranean Maquis species. For. Ecol. Manag. 2006, 234, S111. [Google Scholar] [CrossRef] [Scilit]
- Jin, S.; Chen, P. Modelling drying processes of fuelbeds of scots pine needles with initial moisture content above the fibre saturation point by two-phase models. Int. J. Wildland Fire 2012, 21, 418–427. [Google Scholar] [CrossRef] [Scilit]
- Byram, G.M.; Nelson, R.M. An Analysis of the Drying Process in Forest Fuel Material: General Technical Report; U.S. Department of Agriculture, Forest Service, Southern Research Station: Asheville, NC, USA, 2015. [CrossRef] [Scilit]
- Anderson, H.E. Moisture diffusivity and response time in fine forest fuels. Can. J. For. Res. 1990, 20, 315–325. [Google Scholar] [CrossRef] [Scilit]
- Resco de Dios, V.; Fellows, A.W.; Nolan, R.H.; Boer, M.M.; Bradstock, R.A.; Domingo, F.; Goulden, M.L. A semi-mechanistic model for predicting the moisture content of fine litter. Agric. For. Meteorol. 2015, 203, 64–73. [Google Scholar] [CrossRef] [Scilit]
- Pickering, B.J.; Duff, T.J.; Baillie, C.; Cawson, J.G. Darker, cooler, wetter: Forest understories influence surface fuel moisture. Agric. For. Meteorol. 2021, 300, 108311. [Google Scholar] [CrossRef] [Scilit]
- Chrosciewicz, Z. Prediction of forest-floor moisture content under diverse jack pine canopy conditions. Can. J. For. Res. 1989, 19, 1483–1487. [Google Scholar] [CrossRef] [Scilit]
- Nelson, R.M., Jr. A method for describing equilibrium moisture content of forest fuels. Can. J. For. Res. 1984, 14, 597–600. [Google Scholar] [CrossRef] [Scilit]
- Lopes, S.; Viegas, D.X.; Teixeira de Lemos, L.; Viegas, M.T. Equilibrium Moisture Content and Timelag of Dead Pinus Pinaster Needles. Int. J. Wildland Fire 2014, 23, 721–732. [Google Scholar] [CrossRef] [Scilit]
- Nelson, R.M., Jr. Prediction of diurnal change in 10-h fuel stick moisture content. Can. J. For. Res. 2000, 30, 1071–1087. [Google Scholar] [CrossRef]
- Slijepcevic, A.; Anderson, W.R.; Matthews, S.; Anderson, D.H. Evaluating models to predict daily fine fuel moisture content in Eucalypt Forest. For. Ecol. Manag. 2015, 335, 261–269. [Google Scholar] [CrossRef] [Scilit]
- Bilgili, E.; Coskuner, K.A.; Usta, Y.; Saglam, B.; Kucuk, O.; Berber, T.; Goltas, M. Diurnal surface fuel moisture prediction model for Calabrian pine stands in Turkey. iForest 2019, 12, 262–271. [Google Scholar] [CrossRef] [Scilit]
- Bilgili, E.; Coskuner, K.A.; Usta, Y.; Goltas, M. Modeling surface fuels moisture content in Pinus brutia stands. J. For. Res. 2019, 30, 577–587. [Google Scholar] [CrossRef] [Scilit]
- Lyell, C.S.; Nattala, U.; Keeble, T.; Vella, E.M.; Joshi, R.C.; Joukhadar, Z.; Garber, J.; Mutch, S.J.; Gazzard, T.; Duff, T.; et al. Forecasting dead fuel moisture content below forest canopies—A seven-day forecasting system. Agric. For. Meteorol. 2024, 358, 110217. [Google Scholar] [CrossRef] [Scilit]
- Perello, N.; Trucchia, A.; D’Andrea, M.; Esposti, S.D.; Fiorucci, P.; Gollini, A.; Negro, D. An adaptable dead fuel moisture model for various fuel types and temporal scales tailored for wildfire danger assessment. Environ. Model. Softw. 2025, 183, 106254. [Google Scholar] [CrossRef] [Scilit]
- Matthews, S. A Process-based model of fine fuel moisture. Int. J. Wildland Fire 2006, 15, 155–168. [Google Scholar] [CrossRef] [Scilit]
- Viney, N.; Catchpole, E. Estimating fuel moisture response times from field observations. Int. J. Wildland Fire 1991, 1, 211–214. [Google Scholar] [CrossRef] [Scilit]
- Nelson, R.M.; Hiers, J.K. The Influence of Fuelbed Properties on Moisture Drying rates and timelags of Longleaf Pine litter. Can. J. For. Res. 2008, 38, 2394–2404. [Google Scholar] [CrossRef] [Scilit]
- Hu, T.; Xu, Z.; Yu, C.; Dou, X.; Zhang, Y.; Sun, L. Impacts of different forest fire management policies and fuel treatment models on forest fire risk in boreal forest of China. Ecol. Indic. 2024, 169, 112806. [Google Scholar] [CrossRef] [Scilit]
- Peterson, D.W.; Harrod, R.J.; Dodson, E.K.; Ohlson, P.L.; Pawlikowski, N.C.; Ireland, K.B.; Ottmar, R.D. Mechanical mastication and prescribed burning reduce forest fuels and alter stand structure in dry coniferous forests. For. Ecol. Manag. 2025, 593, 122909. [Google Scholar] [CrossRef] [Scilit]
- Carlson, J.D.; Bradshaw, L.S.; Nelson, R.M., Jr.; Bensch, R.R.; Jabrzemski, R. Application of the Nelson model to four timelag fuel classes using Oklahoma field observations: Model evaluation and comparison with National Fire Danger Rating System algorithms. Int. J. Wildland Fire 2007, 16, 204–216. [Google Scholar] [CrossRef] [Scilit]
- Kudláčková, L.; Bartošová, L.; Linda, R.; Bláhová, M.; Poděbradská, M.; Fischer, M.; Balek, J.; Žalud, Z.; Trnka, M. Assessing fire danger classes and extreme thresholds of the Canadian Fire Weather Index across global environmental zones: A review. Environ. Res. Lett. 2025, 20, 013001. [Google Scholar] [CrossRef] [Scilit]
- Schiks, T.J.; Wotton, B.M. Modifying the Canadian Fine Fuel Moisture Code for masticated surface fuels. Int. J. Wildland Fire 2015, 24, 79–91. [Google Scholar] [CrossRef] [Scilit]
- Cawson, J.G.; Nyman, P.; Schunk, C.; Sheridan, G.J.; Duff, T.J.; Gibos, K.; Bovill, W.D.; Conedera, M.; Pezzatti, G.B.; Menzel, A. Estimation of surface dead fine fuel moisture using automated fuel moisture sticks across a range of forests worldwide. Int. J. Wildland Fire 2020, 29, 548–559. [Google Scholar] [CrossRef] [Scilit]
- Li, Z.; Wu, Z.; Zhu, S.; Hou, X.; Li, S. Estimation of understory fine dead fuel moisture content in subtropical forests of southern China based on Landsat images. Forests 2024, 15, 2002. [Google Scholar] [CrossRef] [Scilit]
- Fan, C.; He, B.; Yin, J.; Chen, R.; Zhang, H. Process-based and geostationary meteorological satellite-enhanced dead fuel moisture content estimation. GIScience Remote Sens. 2024, 61, 2324556. [Google Scholar] [CrossRef] [Scilit]
- Shmuel, A.; Ziv, Y.; Heifetz, E. Machine-learning-based evaluation of the time-lagged effect of meteorological factors on 10-hour dead fuel moisture content. For. Ecol. Manag. 2022, 505, 119897. [Google Scholar] [CrossRef] [Scilit]
- Farguell, A.; Drucker, J.R.; Mirocha, J.D.; Cameron-Smith, P.; Kochanski, A.K. Dead fuel moisture content reanalysis dataset for California (2000–2020). Fire 2024, 7, 358. [Google Scholar] [CrossRef] [Scilit]
- Quan, X.; Yebra, M.; Riaño, D.; He, B.; Lai, G.; Liu, X. Global fuel moisture content mapping from MODIS. Int. J. Appl. Earth Obs. Geoinf. 2021, 101, 102354. [Google Scholar] [CrossRef] [Scilit]
- Chae, S.; Kim, K.R.; Kang, J.H.; Jeong, H.-S.; Kim, S. Machine learning-based analysis and prediction of 10-h dead fuel moisture content using automated weather observations in Gangwon Province, South Korea. J. Appl. Meteorol. Climatol. 2025, 64, 1987–2004. [Google Scholar] [CrossRef] [Scilit]
- Hou, X.; Wu, Z.; Zhu, S.; Li, Z.; Li, S. Comparative analysis of machine learning-based predictive models for fine dead fuel moisture of subtropical forest in China. Forests 2024, 15, 736. [Google Scholar] [CrossRef] [Scilit]
- Matthews, S.; McCaw, W.L.; Neal, J.E.; Smith, R.H. Testing a process-based fine fuel moisture model in two forest types. Can. J. For. Res. 2007, 37, 23–35. [Google Scholar] [CrossRef] [Scilit]
- Fan, J.; Hu, T.; Ren, J.; Liu, Q.; Sun, L. A comparison of five models in predicting surface dead fine fuel moisture content of typical forests in Northeast China. Front. For. Glob. Change 2023, 6, 1122087. [Google Scholar] [CrossRef] [Scilit]
- Yu, H.; Shu, L.; Deng, J.; Yang, G.; Liang, Q.; Li, J.; Zhu, H. Prediction models and the extrapolation effects for water content of surface dead fuels in the typical stand of the Great Xing’an Mountains of China by one-hour time step. Chin. J. Appl. Ecol. 2018, 29, 3959–3968. (In Chinese) [Google Scholar] [CrossRef] [PubMed]
- Chen, X. Modeling the Effects of Global Climatic Change at the Ecotone of Boreal Larch Forest and Temperate Forest in Northeast China. Clim. Change 2002, 55, 77–97. [Google Scholar] [CrossRef] [Scilit]
- Deng, J.; Li, Y.; Wang, Y.; Sun, C.; Bao, Y. Fractal Characteristics of Soil Particles and Soil Properties of Typical Forest Stands in Eastern Mountainous Liaoning Province of Northeast China. Forests 2026, 17, 570. [Google Scholar] [CrossRef] [Scilit]
- Bakšić, N.; Bakšić, D.; Jazbec, A. Hourly fine fuel moisture model for Pinus halepensis (Mill.) litter. Agric. For. Meteorol. 2017, 243, 93–99. [Google Scholar] [CrossRef] [Scilit]
- Sharples, J.J.; Reddy, P.J.; Resco de Dios, V.; Nolan, R.H.; Boer, M.M.; Bradstock, R.A. Evaluation and comparison of simple empirical models for dead fuel moisture content. Int. J. Wildland Fire 2024, 33, WF23120. [Google Scholar] [CrossRef] [Scilit]
- Cordeiro, D.S.; Raghavan, G.S.V.; Oliveira, W.P. Equilibrium moisture content models for Maytenus ilicifolia leaves. Biosyst. Eng. 2006, 94, 221–228. [Google Scholar] [CrossRef] [Scilit]
- Viegas, D.X.; Bovio, G.; Ferreira, A.; Nosenzo, A.; Sol, B. Comparative study of various methods of fire danger evaluation in Southern Europe. Int. J. Wildland Fire 2000, 9, 235–246. [Google Scholar] [CrossRef] [Scilit]
- Quan, X.; Xie, Q.; He, B.; Luo, K.; Liu, X. Integrating remotely sensed fuel variables into wildfire danger assessment for China. Int. J. Wildland Fire 2021, 30, 807–821. [Google Scholar] [CrossRef] [Scilit]
- Pook, E.; Gill, A. Variation of Live and Dead Fine Fuel Moisture in Pinus radiata Plantations of the Australian-Capital-Territory. Int. J. Wildland Fire 1993, 3, 155–168. [Google Scholar] [CrossRef] [Scilit]
- Lopes, S.M.G.; Viegas, D.X.; Viegas, M.T.; de Lemos, L.T. Moisture content of fine forest fuels in the central Portugal (Lousã) for the period 1996–2004. For. Ecol. Manag. 2006, 234, S71. [Google Scholar] [CrossRef] [Scilit]
- Slijepcevic, A.; Anderson, W. Hourly variation in fine fuel moisture in eucalypt forests in Tasmania. For. Ecol. Manag. 2006, 234, S36. [Google Scholar] [CrossRef] [Scilit]
- Chang, C.; Chang, Y.; Guo, M.; Hu, Y. Modelling the dead fuel moisture content in a grassland of Ergun City, China. J. Arid Land 2023, 15, 710–723. [Google Scholar] [CrossRef] [Scilit]
- Sharples, J.J.; McRae, R.H.D. Evaluation of a very simple model for predicting the moisture content of eucalypt litter. Int. J. Wildland Fire 2011, 20, 1000–1005. [Google Scholar] [CrossRef] [Scilit]
- Cruz, M.G.; Kidnie, S.; Matthews, S.; Hurley, R.J.; Slijepcevic, A.; Nichols, D.; Gould, J.S. Evaluation of the predictive capacity of dead fuel moisture models for Eastern Australia grasslands. Int. J. Wildland Fire 2016, 25, 995–1001. [Google Scholar] [CrossRef] [Scilit]
- Slijepcevic, A.; Anderson, W.R.; Matthews, S. Testing and adapting existing models for predicting hourly variation in fine fuel moisture in eucalypt forests. For. Ecol. Manag. 2013, 306, 202–215. [Google Scholar] [CrossRef] [Scilit]
- Simard, A.J.; Eenigenburg, J.E.; Blank, R.W. Predicting fuel moisture in jack pine slash: A test of two systems. Can. J. For. Res. 1984, 14, 68–76. [Google Scholar] [CrossRef] [Scilit]
- Davies, G.M.; Legg, C.J.; Smith, A.; Macdonald, A. Developing Shrub Fire Behaviour Models in an Oceanic Climate: Burning in the British Uplands. For. Ecol. Manag. 2006, 234, S107. [Google Scholar] [CrossRef] [Scilit]
- Weise, D.R.; Fujioka, F.M.; Nelson, R.M. A comparison of three models of 1-h time lag fuel moisture in Hawaii. Agric. For. Meteorol. 2005, 133, 28–39. [Google Scholar] [CrossRef] [Scilit]
- Wang, W.; Zhou, C.; Zhang, J.; Li, Y.; Chen, Z.; Luo, Y. A novel approach for inverting forest fuel moisture content utilizing multi-source remote sensing and deep learning. Forests 2025, 16, 1423. [Google Scholar] [CrossRef] [Scilit]
- Schreck, J.S.; Petzke, W.; Jimenez, P.A.; Brummet, T.; Knievel, J.C.; James, E.; Kosovic, B.; Gagne, D.J. Machine learning and VIIRS retrievals for skillful fuel moisture content monitoring in wildfire management. Remote Sens. 2023, 15, 3372. [Google Scholar] [CrossRef] [Scilit]
- Lee, H.; Won, M.; Yoon, S.; Jang, K. Estimation of 10-hour fuel moisture content using meteorological data: A model inter-comparison study. Forests 2020, 11, 982. [Google Scholar] [CrossRef] [Scilit]
- Alcañiz, M.; Outeiro, L.; Francos, M.; Úbeda, X. Effects of prescribed fires on soil properties: A review. Sci. Total Environ. 2018, 613–614, 944–957. [Google Scholar] [CrossRef] [Scilit]
- Lewis, C.H.M.; Little, K.; Graham, L.J.; Kettridge, N.; Ivison, K. Diurnal fuel moisture content variations of live and dead Calluna vegetation in a temperate peatland. Sci. Rep. 2024, 14, 4815. [Google Scholar] [CrossRef] [Scilit] [PubMed]
- Pellegrini, A.F.A.; Ahlström, A.; Hobbie, S.E.; Reich, P.B.; Nieradzik, L.P.; Staver, A.C.; Scharenbroch, B.C.; Jumpponen, A.; Anderegg, W.R.L.; Randerson, J.T.; et al. Fire frequency drives decadal changes in soil carbon and nitrogen and ecosystem productivity. Nature 2018, 553, 194–198. [Google Scholar] [CrossRef] [Scilit] [PubMed]
- Chen, D.; Pereira, J.M.C.; Masiero, A.; Pirotti, F. Mapping fire regimes in China Using MODIS active fire and burned area data. Appl. Geogr. 2017, 85, 14–26. [Google Scholar] [CrossRef] [Scilit]
- Miller, L.; Zhu, L.; Yebra, M.; Rüdiger, C.; Webb, G.I. Projecting live fuel moisture content via deep learning. Int. J. Wildland Fire 2023, 32, 709–727. [Google Scholar] [CrossRef] [Scilit]
- Brown, T.P.; Jolly, W.M.; Conrad, E.T.; Cope, Z.; Hillman, S.C. Combining ecophysiology and combustion traits: A pyro-ecophysiological approach to live fuel moisture prediction in common shrubs. Fire Ecol. 2025, 21, 53. [Google Scholar] [CrossRef] [Scilit]
- Benali, A.; Baldassarre, G.; Loureiro, C.; Briquemont, F.; Fernandes, P.M.; Rossa, C.; Figueira, R. A near-real-time operational live fuel moisture content (LFMC) product to support decision-making at the national level. Fire 2025, 8, 178. [Google Scholar] [CrossRef] [Scilit]
- Chotamonsak, C.; Lapyai, D.; Thanadolmethaphorn, P. Towards near-real-time estimation of live fuel moisture content from Sentinel-2 for fire management in Northern Thailand. Fire 2025, 8, 475. [Google Scholar] [CrossRef] [Scilit]
- Watt, M.S.; Gross, S.; Difuntorum, J.K.; McCarty, J.L.; Pearce, H.G.; Shuman, J.K.; Yebra, M. Monitoring wildfire risk with a near-real-time live fuel moisture content system: A review and roadmap for operational application in New Zealand. Remote Sens. 2025, 17, 3580. [Google Scholar] [CrossRef] [Scilit]
- Yu, H.; Shu, L.; Yang, G.; Deng, J. Comparison of vapour-exchange methods for predicting hourly twig fuel moisture contents of larch and birch stands in the Daxinganling Region, China. Int. J. Wildland Fire 2021, 30, 462–466. [Google Scholar] [CrossRef] [Scilit]
- Ferguson, S.A.; Ruthford, J.E.; McKay, S.J.; Wright, D.; Wright, C.; Ottmar, R. Measuring moisture dynamics to predict fire severity in longleaf Pine forests. Int. J. Wildland Fire 2002, 11, 267–279. [Google Scholar] [CrossRef] [Scilit]
- Ma, H.; Weiss, M.; Malik, D.; Berthelot, B.; Yebra, M.; Nolan, R.H.; Mialon, A.; Zeng, J.; Quan, X.; Tagesson, H.T.; et al. Satellite canopy water content from Sentinel-2, Landsat-8 and MODIS: Principle, algorithm and assessment. Remote Sens. Environ. 2025, 326, 114801. [Google Scholar] [CrossRef] [Scilit]
- Zhuang, H.; Liu, N.; Xie, X.; Xu, X.; Li, M.; Zhang, Y.; Wang, R. Simulating wildfire spread based on continuous time series remote sensing images and cellular automata. Int. J. Wildland Fire 2025, 34, WF24130. [Google Scholar] [CrossRef] [Scilit]
- Quiñones, T.; Stoof, C.; Newman-Thacker, F.; Jiménez, A.; Bezares, F.; Ramírez, J.; Cardil, A. Remotely sensed vegetation phenology drives large fire spread in northwestern Europe. Int. J. Wildland Fire 2025, 34, WF24079. [Google Scholar] [CrossRef] [Scilit]
- Jolly, W.M.; Hadlow, A.M. A comparison of two methods for estimating conifer live foliar moisture content. Int. J. Wildland Fire 2011, 21, 180–185. [Google Scholar] [CrossRef] [Scilit]
- Ruiz González, A.D.; Vega Hidalgo, J.A. moisture content of dead fuels in pinus radiata and Pinus pinaster stands; intrinsic factors of variation. For. Ecol. Manag. 2006, 234, S48. [Google Scholar] [CrossRef] [Scilit]
- Toomey, M.; Vierling, L.A. Multispectral remote sensing of landscape level foliar moisture: Techniques and applications for forest ecosystem monitoring. Can. J. For. Res. 2005, 35, 1087–1097. [Google Scholar] [CrossRef] [Scilit]
- Yebra, M.; Chuvieco, E.; Riaño, D. Investigation of a method to estimate live fuel moisture content from satellite measurements in fire risk assessment. For. Ecol. Manag. 2006, 234, S32. [Google Scholar] [CrossRef] [Scilit]
- Matthews, S.; McCaw, W.L. A next-generation fuel moisture model for fire behaviour prediction. For. Ecol. Manag. 2006, 234, S91. [Google Scholar] [CrossRef] [Scilit]
- Sun, P.; Yu, H.; Jin, S. Predicting Hourly Litter Moisture Content of Larch stands in Daxinganling Region, China using three vapour-exchange methods. Int. J. Wildland Fire 2015, 24, 114–119. [Google Scholar] [CrossRef] [Scilit]
- Durmaz, B. Determination of surface fuels moisture contents based on weather conditions. For. Ecol. Manag. 2006, 234, S75. [Google Scholar] [CrossRef] [Scilit]
- Tudela, A.; Castro, F.X.; Serra, I.; Llaquet, J.; Canyameres, E. Modelling and hourly predictive capacity of temperature and moisture of 10-h fuel sticks. For. Ecol. Manag. 2006, 234, S74. [Google Scholar] [CrossRef] [Scilit]
- Jin, S.; Zhou, Y. Study on moisture content prediction model of dead surface fuels in typical stands, Kunming. J. Cent. South Univ. For. Technol. 2014, 34, 7–15. (In Chinese) [Google Scholar] [CrossRef]
- Jin, S.; Li, L.; Zhao, Y.J. Analysis on robustness and extrapolation errors of modeling fuel moisture content of dead twigs of Larch by Direct estimation from observed data. Sci. Silvae Sin. 2011, 47, 114–121. Available online: https://html.rhhz.net/linyekexue/html/20110617.htm?utm_source (accessed on 6 June 2011). (In Chinese)
- Matthews, S.; Gould, J.; McCaw, L. Simple Models for Predicting dead fuel moisture in Eucalyptus forests. Int. J. Wildland Fire 2010, 19, 459–467. [Google Scholar] [CrossRef] [Scilit]
- Deng, J.; Wan, L.; Bao, Y.; Yu, M.; Jia, Q. Seasonal variations in hydraulic regulation of whole-tree transpiration in Mongolian pine plantations: Insights from semiarid deserts in Northern China. Forests 2024, 15, 1367. [Google Scholar] [CrossRef] [Scilit]
- Deng, J.; Xie, S.; Gao, G.; Gholami, H. Editorial: Ecological restoration in drylands: Toward land degradation neutrality. Front. Environ. Sci. 2024, 12, 1367580. [Google Scholar] [CrossRef] [Scilit]
- Viegas, D.; Piñol, J.; Viegas, M.; Ogaya, R. Estimating Live Fine Fuels Moisture Content Using Meteorologically-Based Indices. Int. J. Wildland Fire 2001, 10, 223–240. [Google Scholar] [CrossRef] [Scilit]
- Deng, J.; Yao, J.; Zheng, X.; Gao, G. Transpiration and canopy stomatal conductance dynamics of Mongolian pine plantations in semiarid deserts, Northern China. Agric. Water Manag. 2021, 249, 106806. [Google Scholar] [CrossRef] [Scilit]
- Deng, J.; Wang, Y.; Li, Y.; Sun, C.; Li, Y. Study on Model Construction and Extrapolation Accuracy of Surface Branch Moisture Content for Typical Stands in Qipanshan Area, Northeastern China. Forests 2026, 17, 484. [Google Scholar] [CrossRef] [Scilit]
- Deng, J.; Li, Y.; Bao, Y.; Wang, Y.; Guo, R.; Fu, Y.; Hou, R.; Yan, H. Transpiration and Stomatal Conductance Dynamics of Typical Trees in the Horqin Sandy Land, Northern China: Implications for Water Use in Semi-Arid Forests. Forests 2026, 17, 861. [Google Scholar] [CrossRef] [Scilit]
- Pham, T.N.; Shah, R.; Amjady, N.; Islam, S. Prediction of fire danger index using a new machine learning based method to enhance power system resiliency against wildfires. IET Gener. Transm. Distrib. 2024, 18, 4008–4022. [Google Scholar] [CrossRef] [Scilit]
- Deng, J.; Sun, C.; Ye, L.; Xu, S.; Qin, Y.; Xia, J.; Lin, G. Transpiration Dynamics and Stomatal Behaviors of Young and Mature Pinus sylvestris var. mongolica Plantations: Environmental Controls in a Semiarid Sandy Ecosystem of Northern China. Forests 2026, 17, 1010. [Google Scholar] [CrossRef] [Scilit]
- Miller, L.; Zhu, L.; Yebra, M.; Rüdiger, C.; Webb, G.I. Multi-modal temporal CNNs for live fuel moisture content estimation. Environ. Model. Softw. 2022, 156, 105467. [Google Scholar] [CrossRef] [Scilit]
- Fan, C.; He, B. A physics-guided deep learning model for 10-h dead fuel moisture content estimation. Forests 2021, 12, 933. [Google Scholar] [CrossRef] [Scilit]
- Miller, E.A. Moisture sorption models for fuel beds of standing dead grass in Alaska. Fire 2019, 2, 2. [Google Scholar] [CrossRef] [Scilit]
- Yebra, M.; Dennison, P.E.; Chuvieco, E.; Riaño, D.; Zylstra, P.; Hunt, E.R.; Danson, F.M.; Qi, Y.; Jurdao, S. A global review of remote sensing of live fuel moisture content for fire danger assessment: Moving towards operational products. Remote Sens. Environ. 2013, 136, 455–468. [Google Scholar] [CrossRef] [Scilit]
- Barber, N.; Alvarado, E.; Kane, V.R.; Mell, W.E.; Moskal, L.M. Estimating fuel moisture in grasslands using UAV-mounted infrared and visible light sensors. Sensors 2021, 21, 6350. [Google Scholar] [CrossRef] [Scilit] [PubMed]
- Guk, E.; Bar-Massada, A.; Yebra, M.; Scortechini, G.; Levin, N. Examining the transferability of remote-sensing-based models of live fuel moisture content for predicting wildfire characteristics. IEEE J. Sel. Top. Appl. Earth Obs. Remote Sens. 2024, 17, 14762–14776. [Google Scholar] [CrossRef] [Scilit]
- Balaguer-Romano, R.; Díaz-Sierra, R.; De Cáceres, M.; Voltas, J.; Boer, M.M.; Resco de Dios, V. Modeling fuel moisture dynamics under climate change in Spain’s forests. Fire Ecol. 2023, 19, 65. [Google Scholar] [CrossRef] [Scilit]
- Sharma, S.; Carlson, J.D.; Krueger, E.S.; Engle, D.M.; Twidwell, D.; Fuhlendorf, S.D.; Patrignani, A.; Feng, L.; Ochsner, T.E. Soil moisture as an indicator of growing-season herbaceous fuel moisture and curing rate in grasslands. Int. J. Wildland Fire 2021, 30, 57–69. [Google Scholar] [CrossRef] [Scilit]
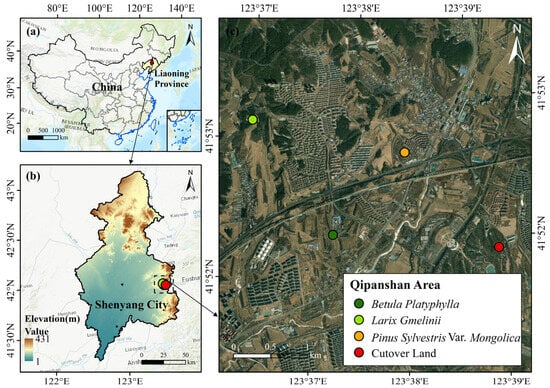
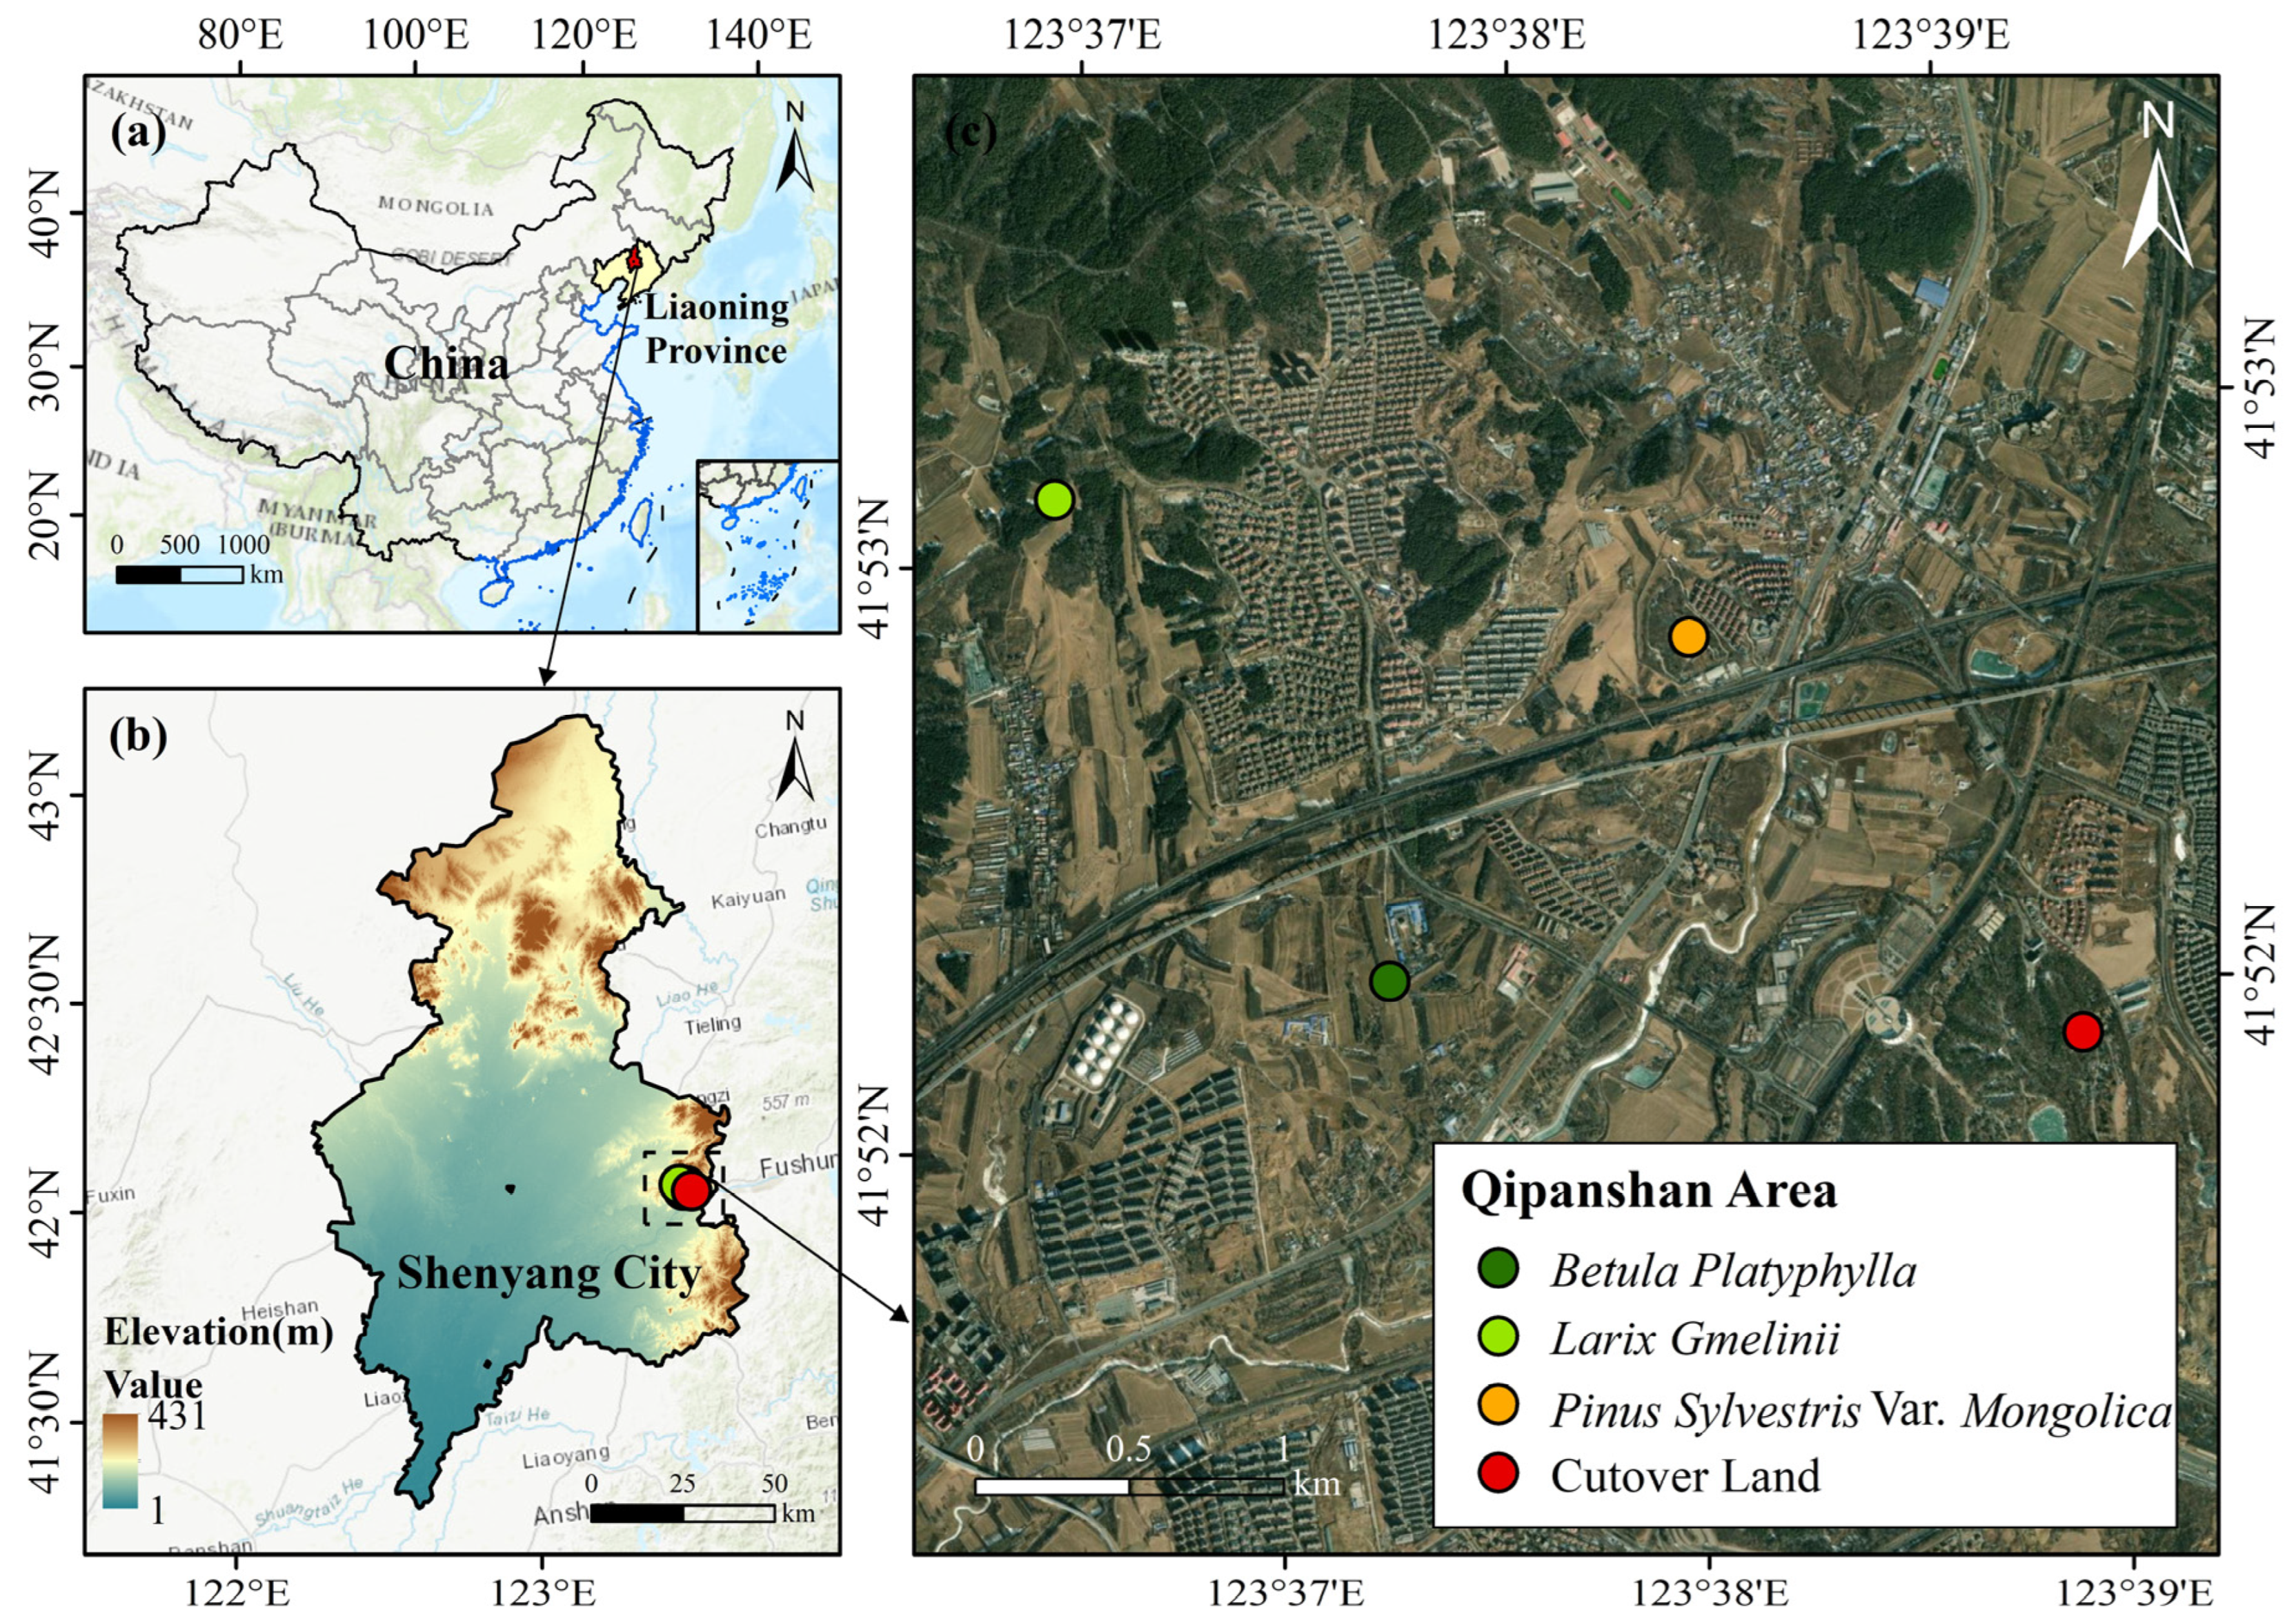
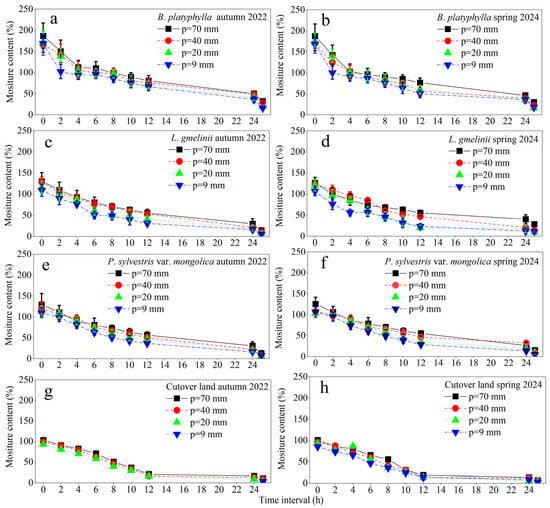
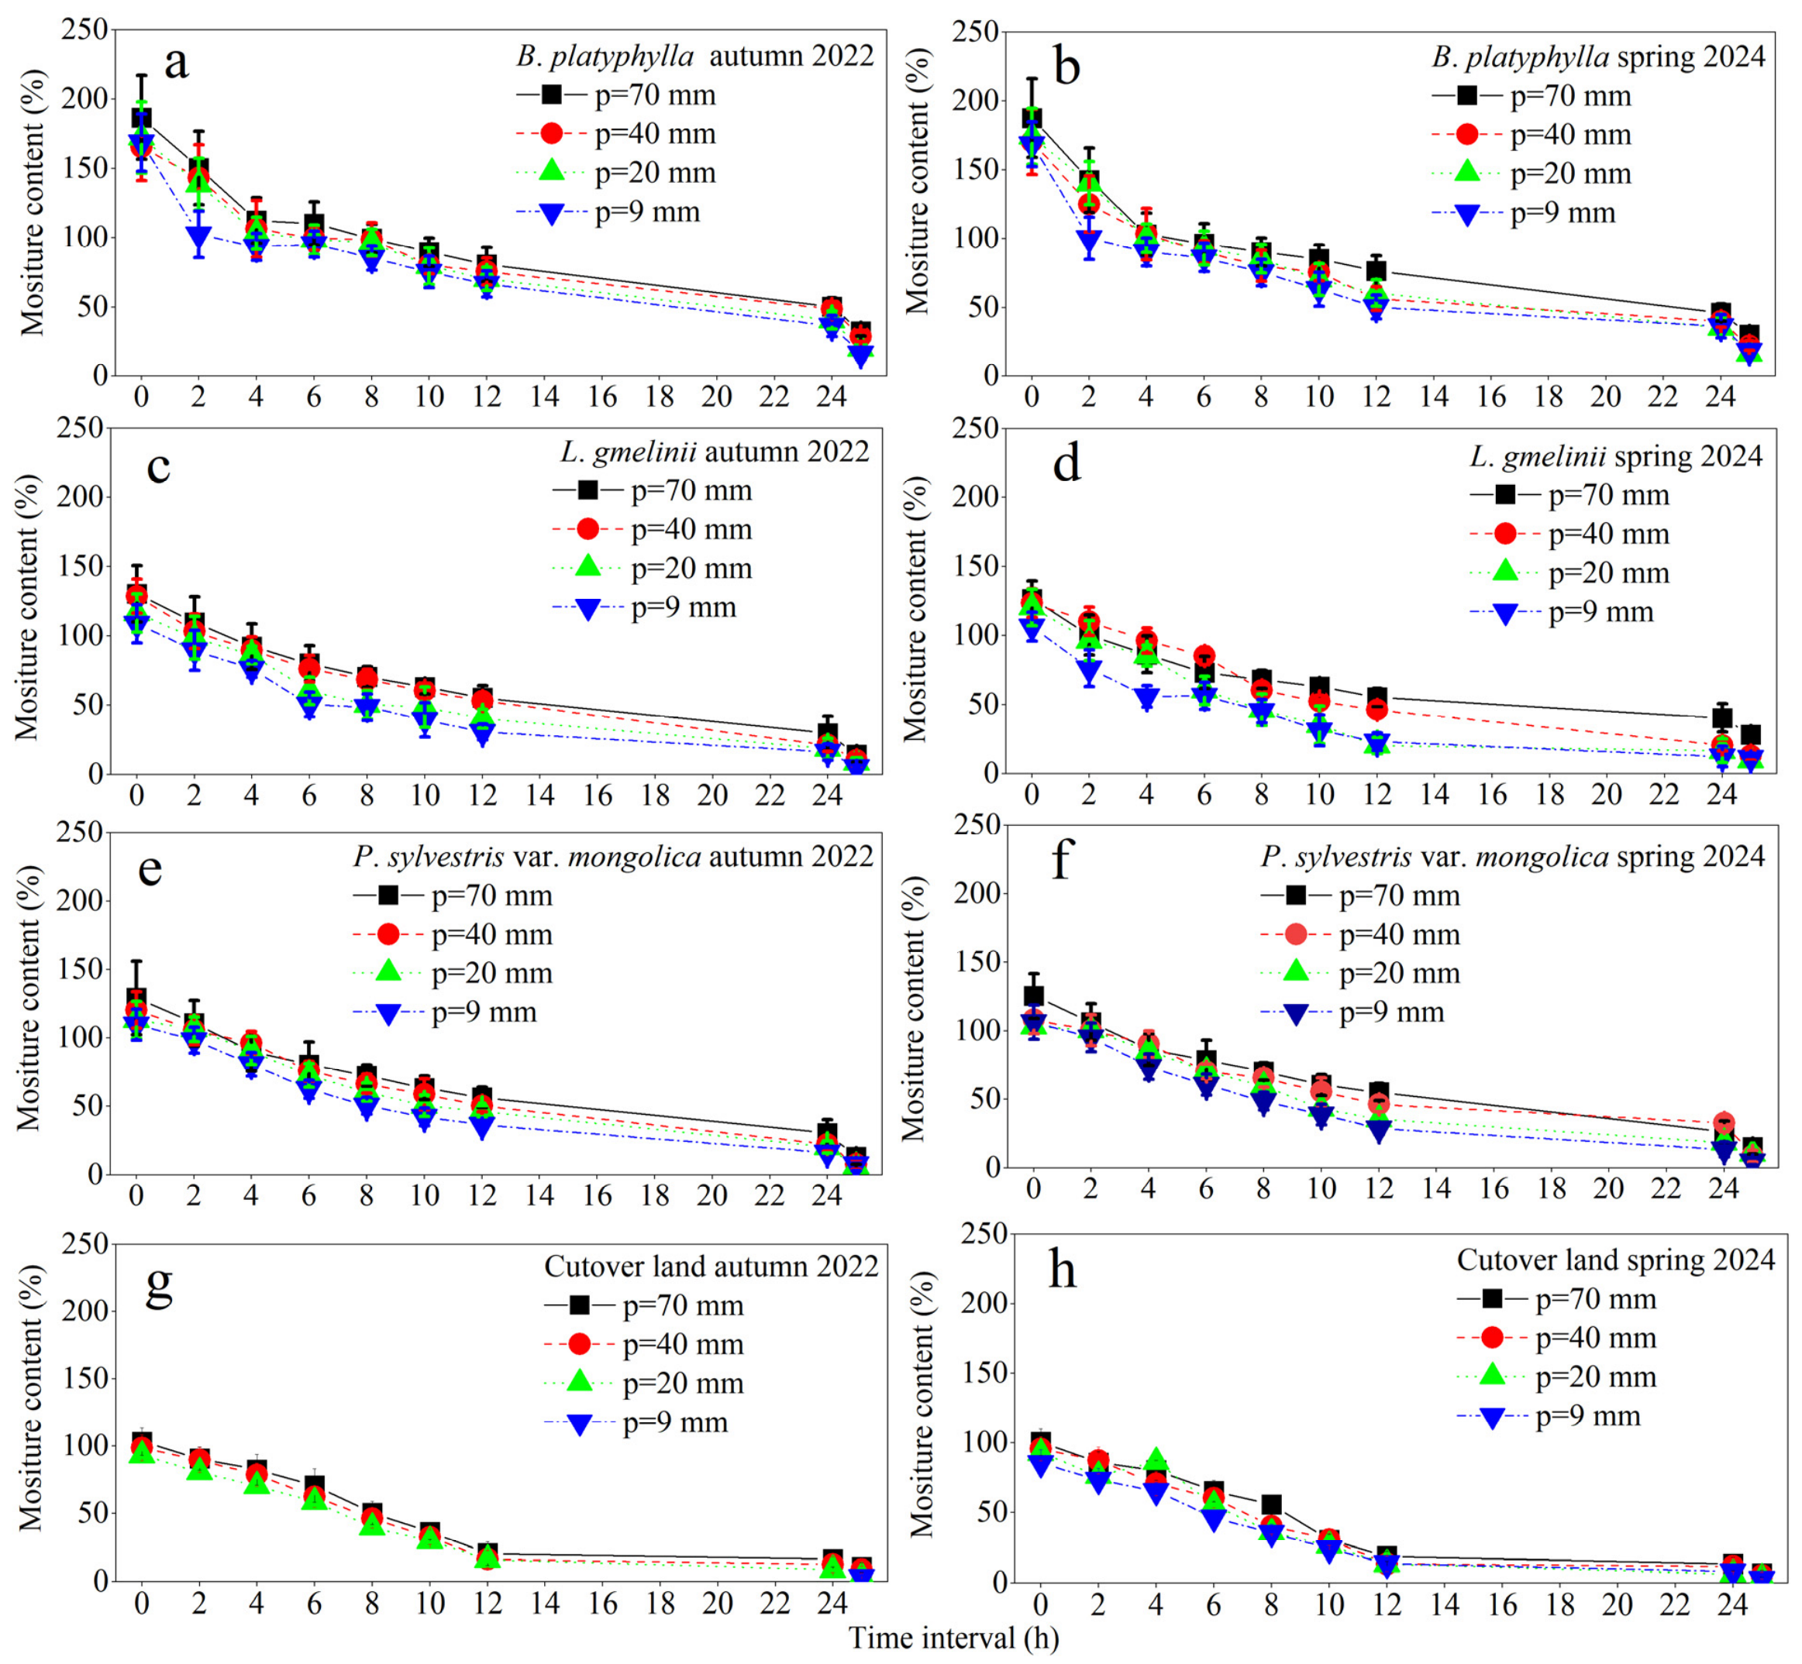
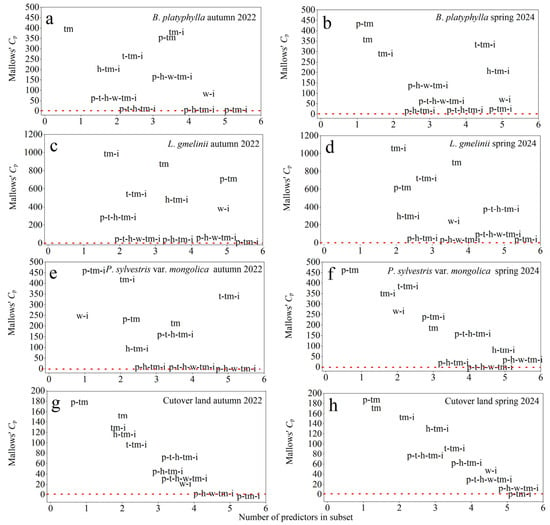
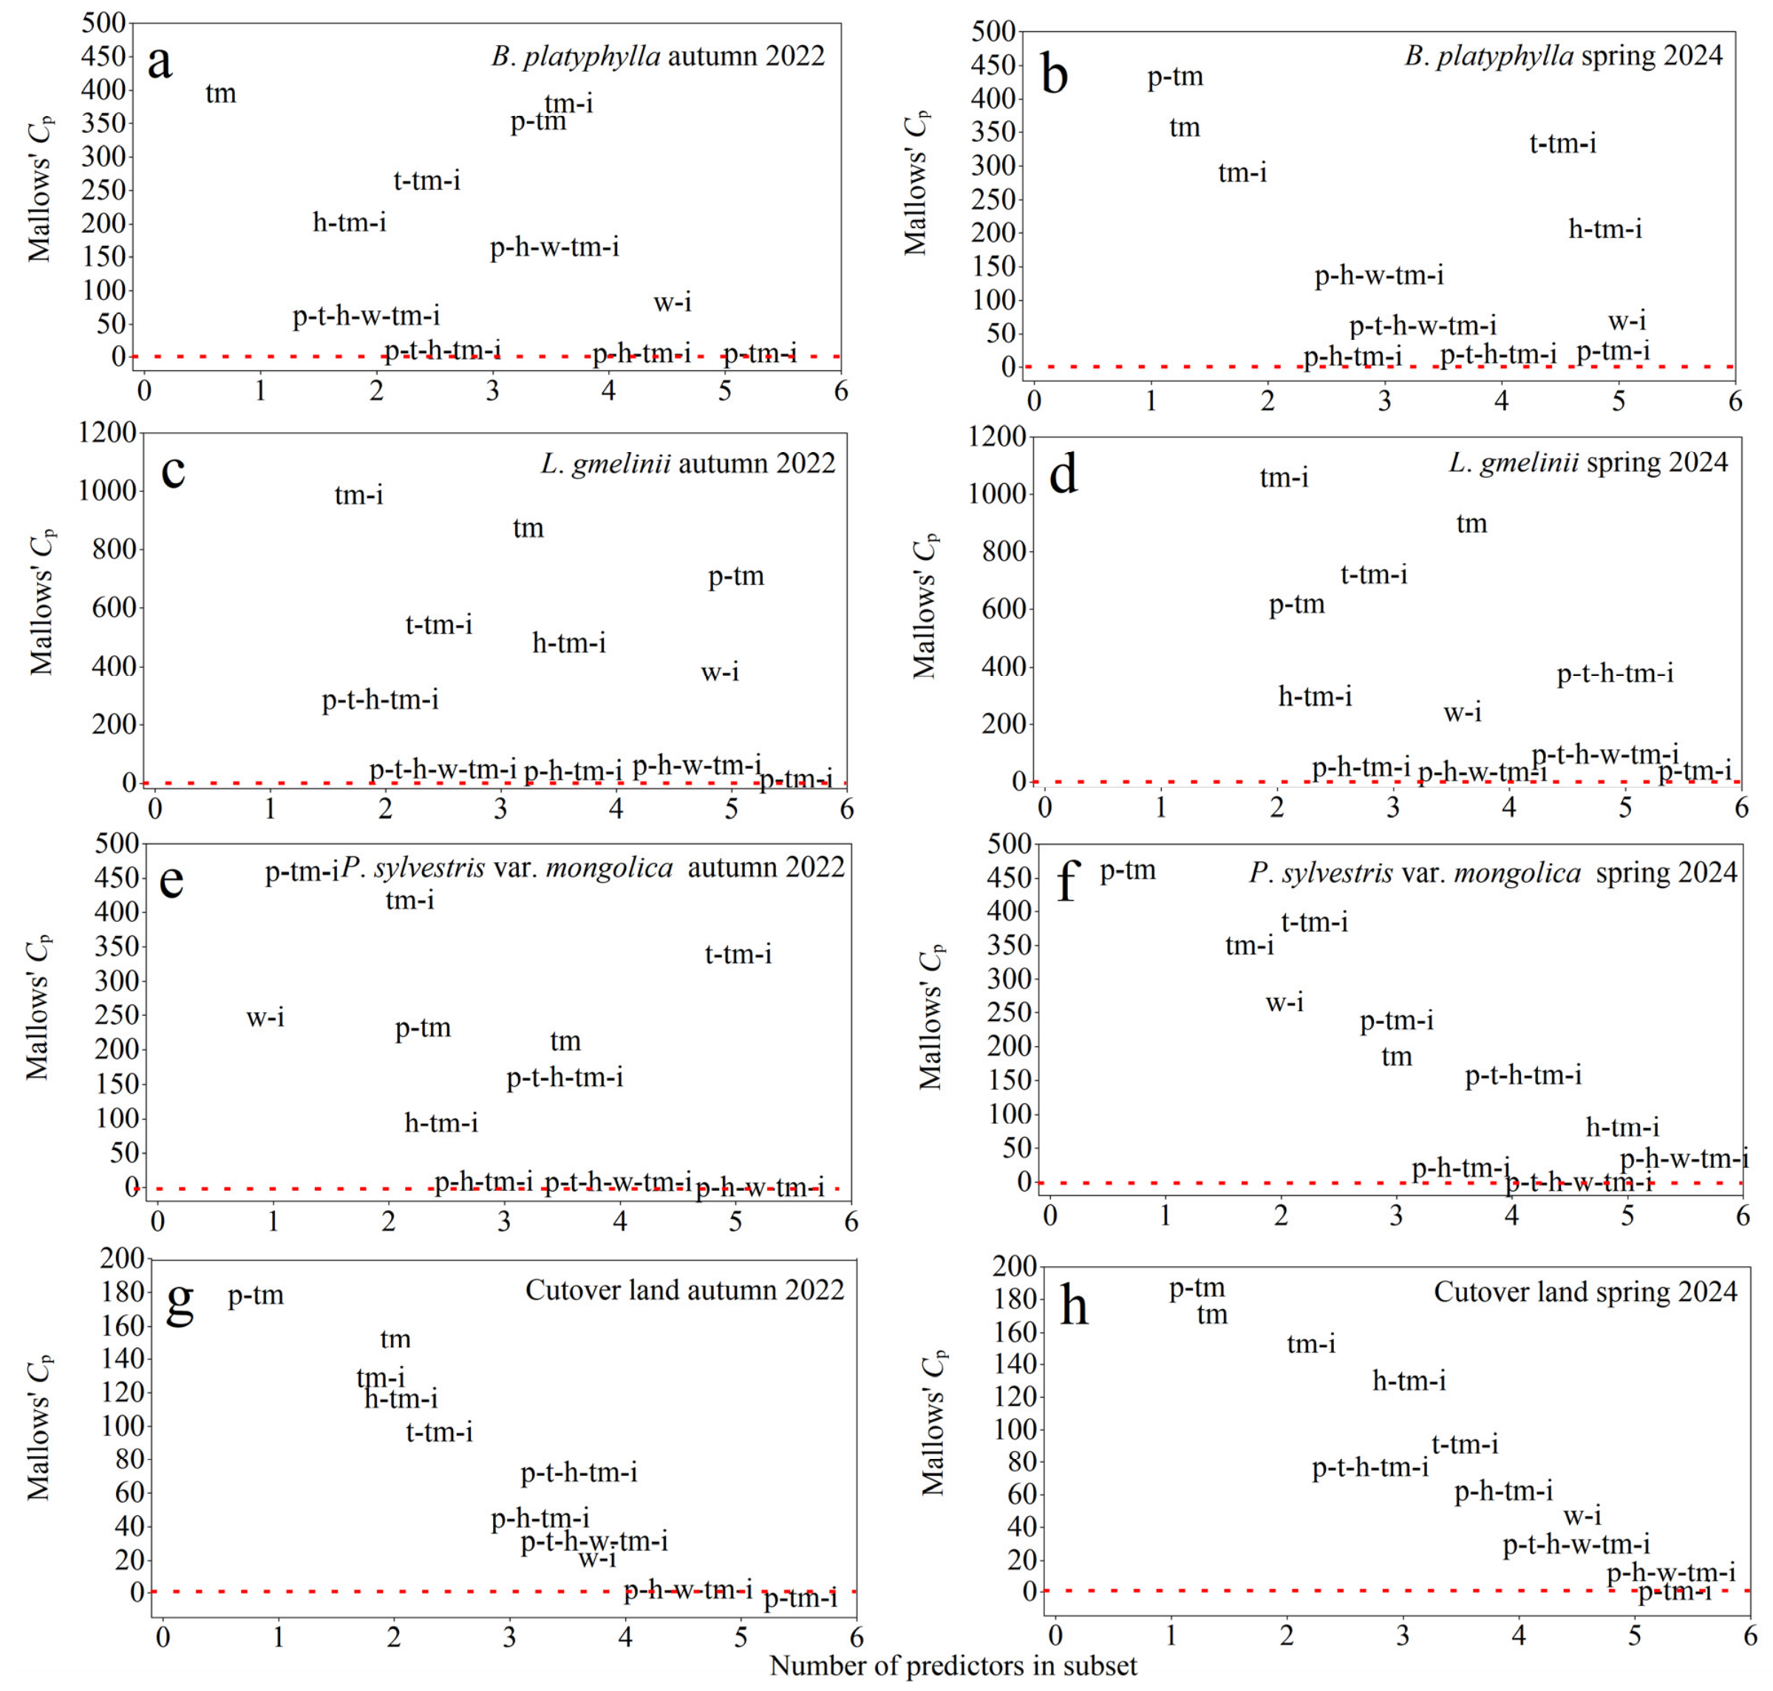
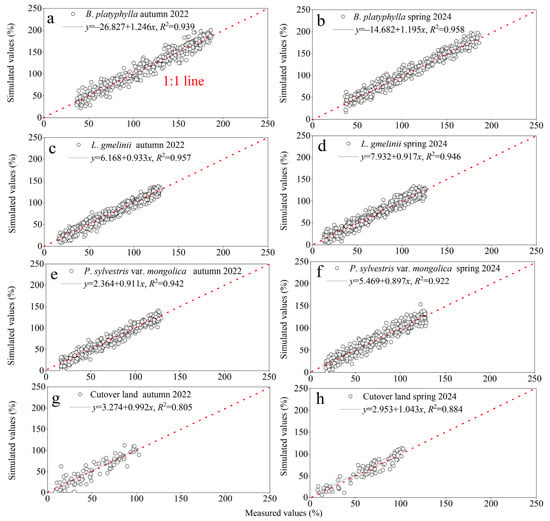
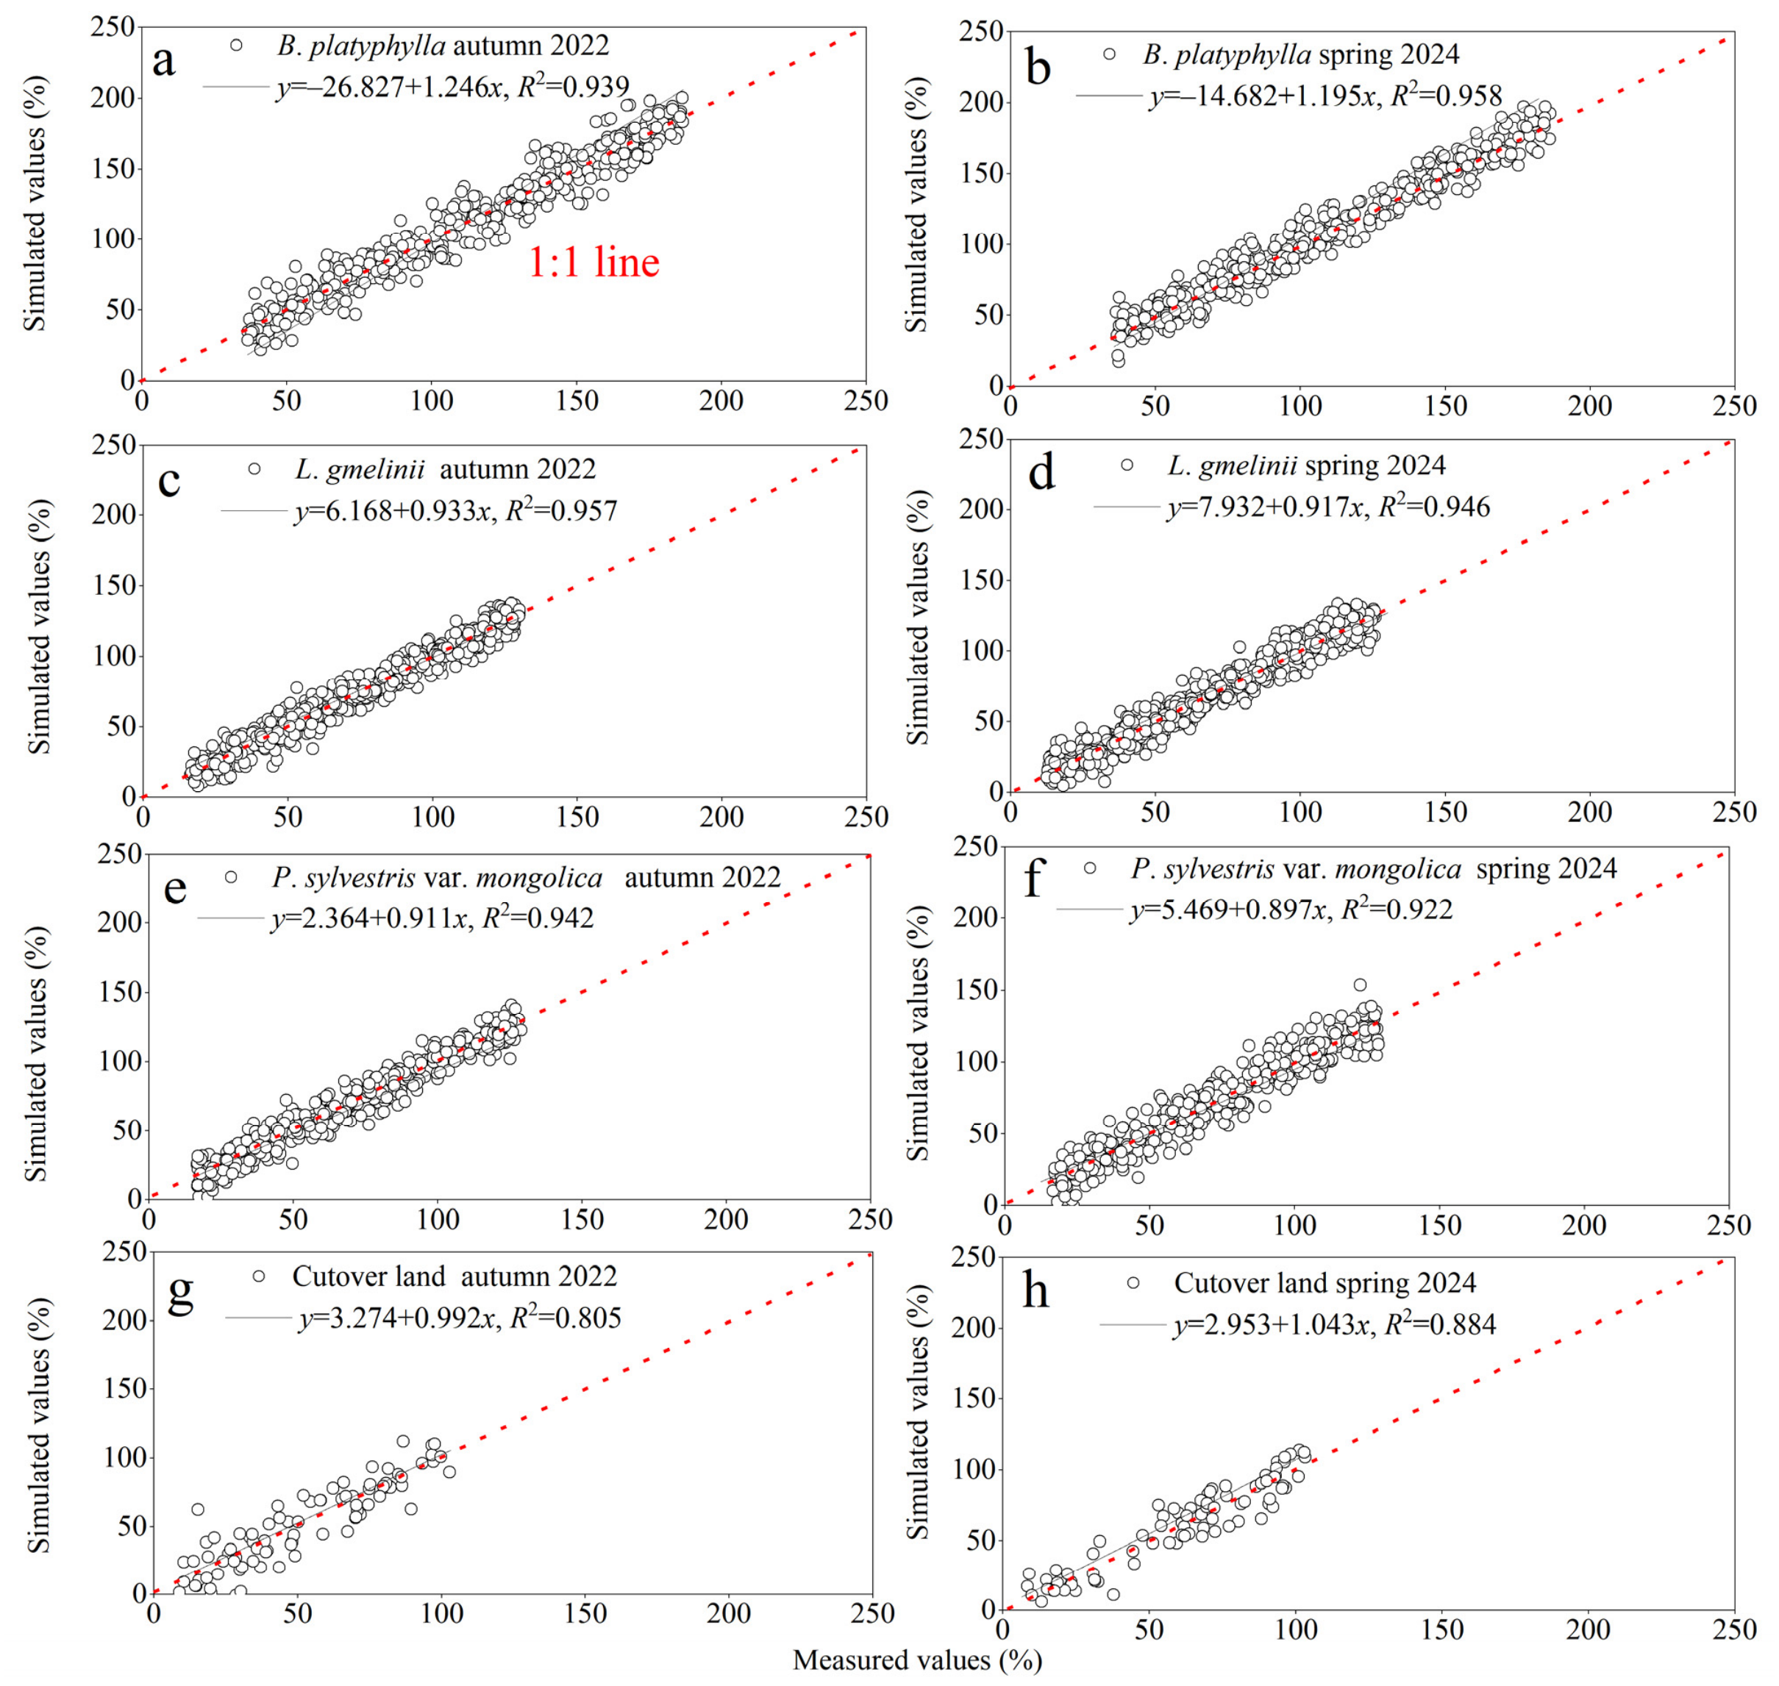
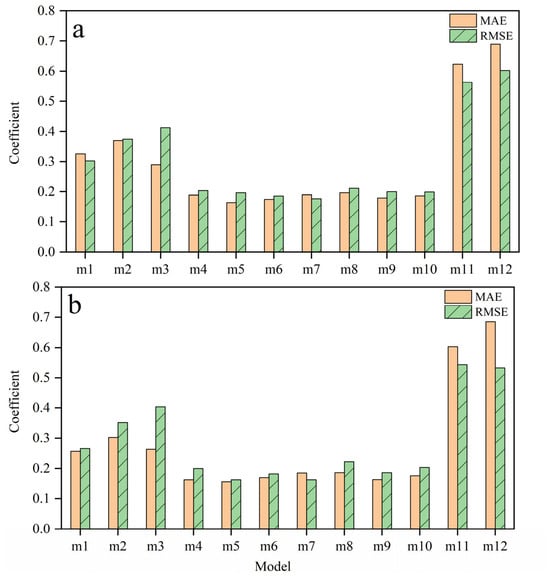
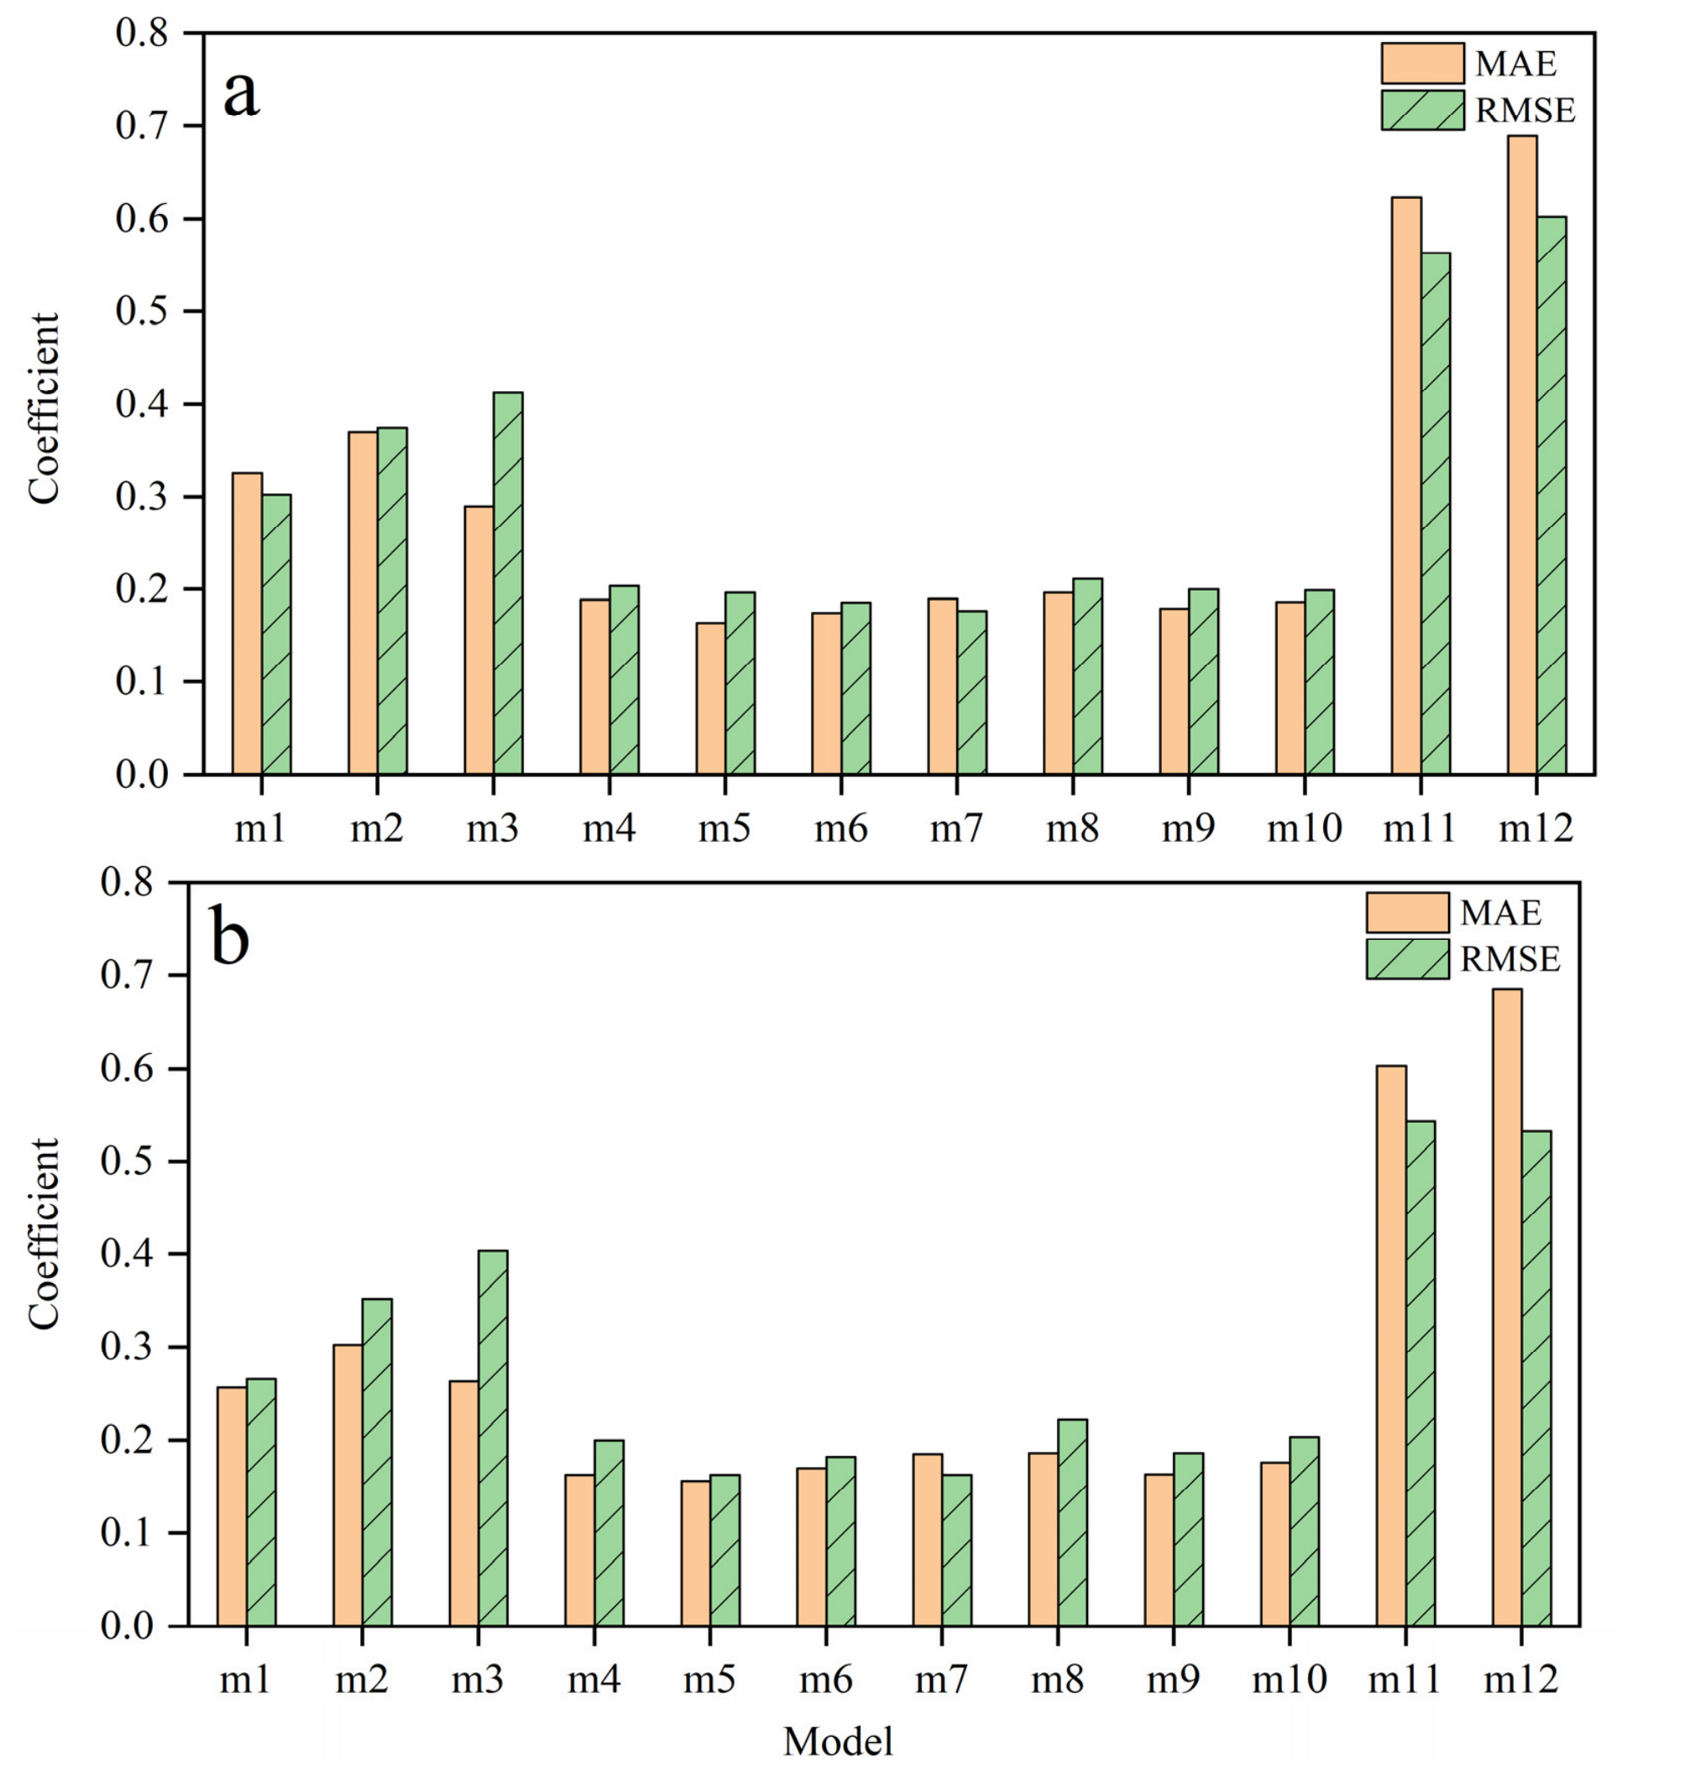
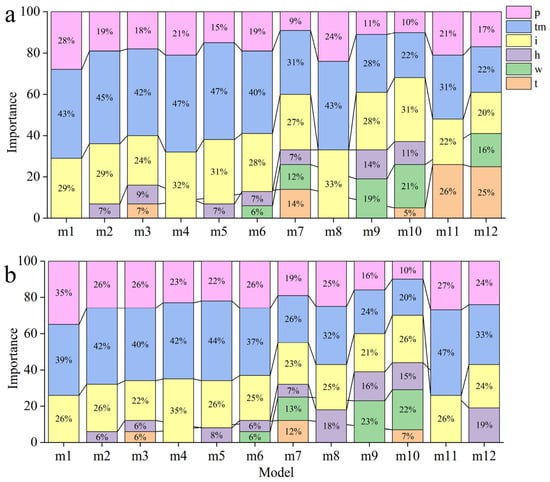
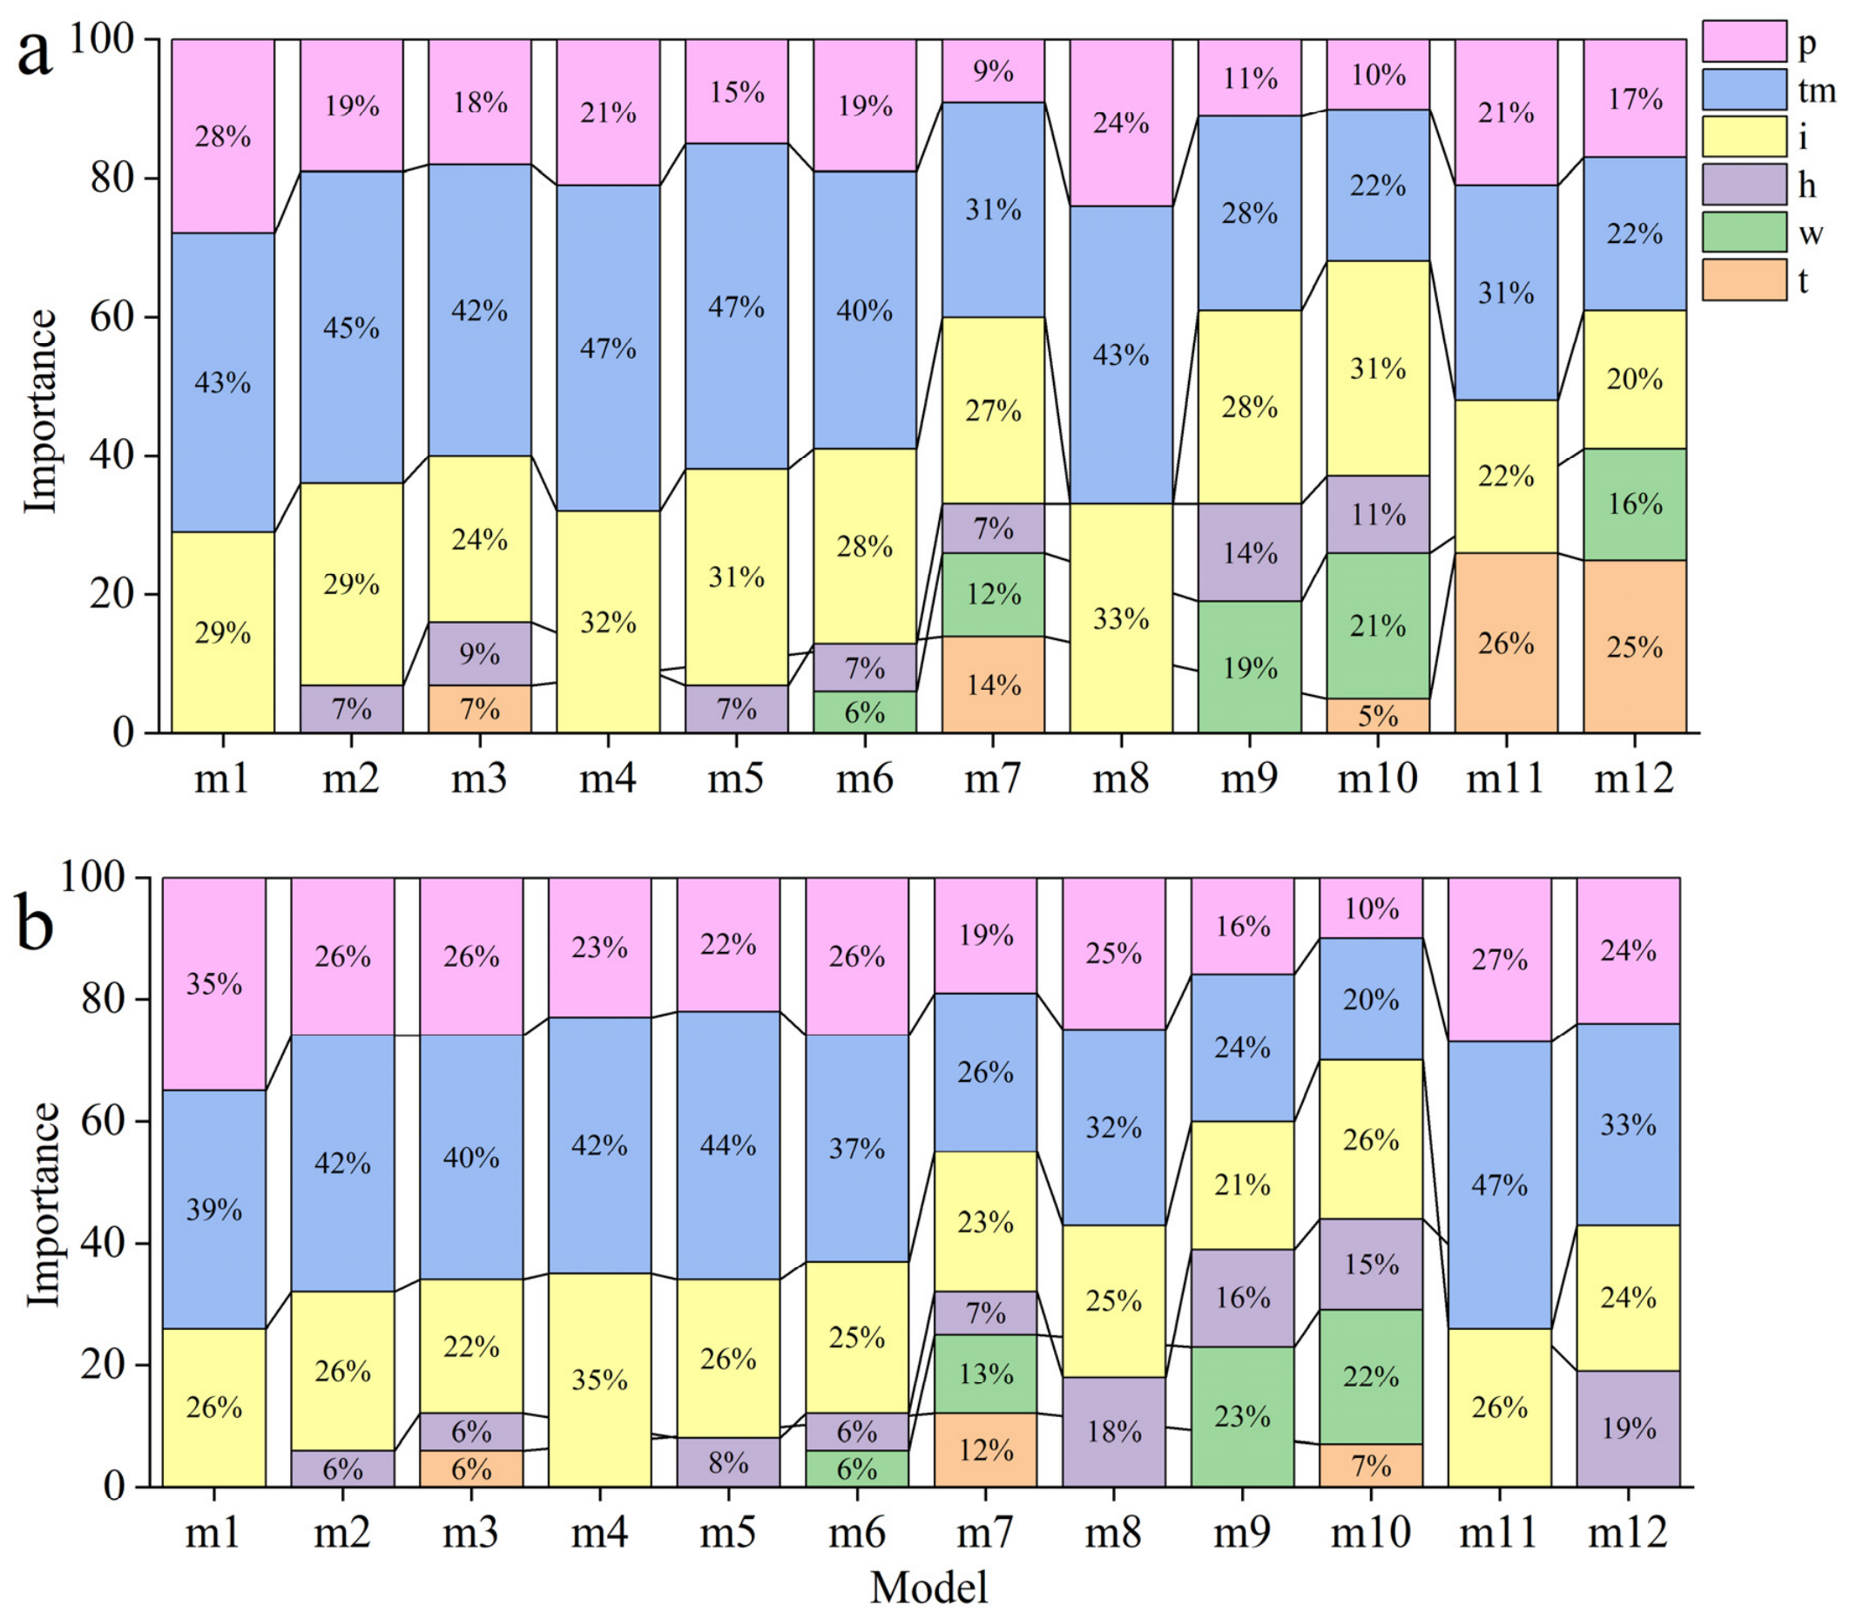

Disclaimer/Publisher’s Note: The statements, opinions and data contained in all publications are solely those of the individual author(s) and contributor(s) and not of MDPI and/or the editor(s). MDPI and/or the editor(s) disclaim responsibility for any injury to people or property resulting from any ideas, methods, instructions or products referred to in the content. |
© 2026 by the authors. Licensee MDPI, Basel, Switzerland. This article is an open access article distributed under the terms and conditions of the Creative Commons Attribution (CC BY) license.